a combined analysis of the hadronic and leptonic decays...
TRANSCRIPT
Volume 240, number 3,4 PHYSICS LETTERS B 26 April 1990
A C O M B I N E D ANALYSIS OF THE H A D R O N I C A N D LEPTONIC DECAYS OF THE Z °
OPAL Collaboration
M.Z. AKRAWY a, G. ALEXANDER t,, j. ALLISON c, p.p. ALLPORT d, K.J. ANDERSON ¢, J.C. ARMITAGE f, G.T.J. ARNISON 8 p. ASHTON ", G. AZUELOS h.~, J.T.M. BAINES c, A.H. BALLi, j. BANKS ~, G.J. BARKER a, R.J. BARLOW c J.R. BATLEY d, j. BECKER .i, T. BEHNKE k, K.W. BELL ~, G. BELLA b, S. BETHKE 9, O. BIEBEL m, U. BINDER J, l.J. BLOODWORTH ", P. BOCK 9, H. BREUKER k, R.M. BROWN g, R. BRUN k, A. BUIJS k, H.J. BURCKHART k, p. CAPILUPPI o, R.K. CARNEGIE f, A.A. CARTER a, J.R. CARTER d, C.Y. CHANG i, D.G. CHARLTON k, J.T.M. CHRIN ~', I. COHEN b, W.J. COLLINS d J.E. CONBOY P, M. COUCH ", M. COUPLAND q, M. CUFFIANI °, S. DADO r, G.M. DALLAVALLE o, M.M. DENINNO o, A. DIECKMANN 9, M. DITTMAR ', M.S. DIXIT t, E. DUCHOVNI u, I.P. D U E R D O T H k.2, D. DUMAS r, H. EL MAMOUNI h, P.A. ELCOMBE d, P.G. ESTABROOKS f, E. ETZION o, F. FABBRI o, p. FARTHOUAT v, H.M. FISCHER m, D.G. FONG i, M.T. FRENCH ~, C. FUKUNAGA ", B. GANDOIS v, O. GANEL u, J.W. GARY 9, J. GASCON h, N.I. GEDDES g, C.N.P. GEE g, C. GEICH-GIMBEL m, S.W. GENSLER e, F.X. GENTIT ", G. GIACOMELLI o, V. GIBSON d, W.R. GIBSON a, J.D. GILLIES g, J. GOLDBERG r, M.J. G O O D R I C K d, W. GORN ~, D. GRANITE ~, E. GROSS ", P. GROSSE- WIESMANN k, j. GRUNHAUS b, H. HAGEDORN J, J. HAGEMANN k, M. HANSROUL k, C.K. HARGROVE t j. HART d, P.M. HATTERSLEY ", M. HAUSCHILD k, C.M. HAWKES k, E. HEFLIN s, R.J. HEMINGWAY f, R.D. HEUER k, J.C. HILL d, S.J. HILLIER n C. HO s, J.D. HOBBS ¢, P.R. HOBSON x, D. HOCHMAN u, B. HOLL k, R.J. HOMER ", S.R. HOU ~, C.P. HOWARTH P, R.E. HUGHES-JONES ", P. IGO-KEMENES ~, H. IHSSEN 9 D.C. IMRIE ", A. JAWAHERY i, P.W. JEFFREYS g, H. JEREMIE h, M. JIMACK k, M. JOBES ", R.W.L. JONES ~, P. JOVANOVIC n D. KARLEN r, K. KAWAGOE *, T. KAWAMOTO ,.v, R.G. KELLOGG i, B.W. KENNEDY o, C. KLEINWORT k, D.E. KLEM t, G. KNOP m, T. KOBAYASHI ~', T.P. K O K O T T m, L. KOPKE k, R. KOWALEWSKI r, H. KREUTZMANN m, j. VON KROGH 9, J. KROLL ¢, M. KUWANO ", P. KYBERD ~, G.D. LAFFERTY ¢, F. LAMARCHE h, W.J. LARSON s, M.M.B. LASOTA ~, J.G. LAYTER ~, P. LE DU ", P. LEBLANC h, A.M. LEE ', D. LELLOUCH k P. LENNERT 9, L. LESSARD h, L. LEVINSON u, S.L. LLOYD ~, F.K. LOEBINGER ¢, J.M. LORAH i B. LORAZO h, M.J. LOSTY t, j. LUDWIG J, N. LUPU r, j. MA ~.3 A.A. MACBETH ¢, M. MANNELLI k, S. MARCELLINI °, G. MARINGER m A.J. MARTIN ~, J.P. MARTIN h T. MASH1MO ", P. M,~TTIG k, U. MAUR m, T.J. McMAHON ", A.C. McPHERSON f.4, F. MEIJERS k, D. MENSZNER 9, F.S. MERRITT e, H. MES t, A. MICHELINI k, R.P. MIDDLETON ~, G. MIKENBERG ~, D.J. MILLER P, C. MILSTENE b M. MINOWA ", W. MOHR J, A. MONTANARI °, T. MORI ", M.W. MOSS c, A. MULLER ", P.G. MURPHY ':, W.J. MURRAY d, B. NELLEN r , H.H. NGUYEN ¢, M. NOZAKI w, A.J.P. O 'DOWD ¢, S.W. O'NEALE k,S, B.P. O 'NEILL ~, F.G. OAKHAM t, F. ODORICI °, M. OGG f, H. OH ~, M.J. OREGLIA ~, S. ORITO ", G.N. PATRICK s, S.J. PAWLEY ¢, P. PFISTER J, J.E. PILCHER ¢, J.L. P INFOLD ~, D.E. PLANE k, B. POLl o, A. POULADDEJ f T.W. PRITCHARD ~', G. QUAST k, j. RAAB k M.W. R E D M O N D ¢, D.L. REES ", M. REGIMBALD h, K. RILES s, C.M. ROACH d, S.A. ROBINS ~, A. ROLLNIK m, J.M. RONEY ~, S. ROSSBERG J, A.M. ROSS1 o.6, p. R O U T E N B U R G f, K. RUNGE J, O. RUNOLFSSON k, S. SANGHERA f, R.A. SANSUM ~, M. SASAKI "', B.J. SAUNDERS g,
0370-2693/90/$ 03.50 © Elsevier Science Publishers B.V. ( North-Holland ) 497

Volume 240, number 3,4 PHYSICS LETTERS B 26 April 1990
A.D. SCHAILE J, O. SCHAILE j, W. SCHAPPERT r, p. S C H A R F F - H A N S E N k H. V O N D E R S C H M I T T ~, S. S C H R E I B E R m, j . S C H W A R Z J, A. S H A P I R A u B.C. S H E N s, P. S H E R W O O D P, A. S I M O N m G.P . S I R O L I o, A. S K U J A ', A .M. S M I T H k, T.J. S M I T H ", G.A. S N O W i, E.J. S P R E A D B U R Y P, R .W. S P R I N G E R i M. S P R O S T O N ~, K. S T E P H E N S c H.E. S T I E R J, R. S T R O H M E R ~, D. S T R O M e, H. T A K E D A w, T. T A K E S H I T A w T. T S U K A M O T O w, M.F. T U R N E R d, G. T Y S A R C Z Y K - N I E M E Y E R ~, D. V A N D E N P L A S h G.J . V A N D A L E N s, C.J. V I R T U E t A. W A G N E R Q, C. W A H L j, C.P. W A R D d D.R. W A R D d j . W A T E R H O U S E r, P.M. W A T K I N S ", A.T. W A T S O N ", N.K. W A T S O N ", M. W E B E R ~, S. W E I S Z k, N. W E R M E S ~, M. W E Y M A N N k, G.W. WILSON k J.A. WILSON n I. WINGERTER k V-H. W I N T E R E R J, N.C. W O O D P, S. W O T T O N k B. W U E N S C H m, T .R. W Y A T T c, R. Y A A R I ", Y. Y A N G s'3, G. Y E K U T I E L I ~, T. Y O S H I D A w, W. Z E U N E R k G.T. Z O R N i a n d S. Z Y L B E R A J C H v • Queen Mar3' and Westfield College. University of London, London E1 4NS. UK b Department of Physics and Astronomy. Tel A viv University, Tel A viv 69978. Israel
Schuster Laboratory. Department of Physics, The University. Manchester M l 3 9PL. UK d Cavendish Laboratory. Cambridge CB30tlE. UK
Enrico Fermi lnstitute and Department of Physics. University of Chicago. Chicago lL 606 3 7, USA r Department of Physics, Carleton University. Colonel By Drive. Ottawa, Ontario KIS 5B6. Canada s RutherfigrdAppleton Laboratory. ('hilton, Di&'ot. Oxfordshire OX11 OQX. UK h Laboratoire de Ph.vsique Nuclkaire, Universit~ de Montr~;al. Montreal. Quebec, H3C 3.17. Canada
Department of Physics and Astronomy, Universit), of Maryland, College Park, MD 20742, t,L~;A J FakultiitJ~r Physik, Albert Ludwtgs Universit?it. D-7800 Freiburg. FRG k Ct:'RN, European Organisation for Particle Physics, CH-1211 Geneva 23. Switzerland
Ph),sikalisches lnstitut, Universitdit tleidelberg, D-6900 lteidelberg, FRG m Physikalisches Institut, Universit?it Bonn, D-5300 Bonn 1. FRG " School of Physics andSpace Research. University of Birmingham, Birmingham BI5 271: UK ° Dipartimento di Fisica dell' Universit~t di Bologna and INFN, 1-40126 Bologna. Italy P University College London, London 14'('IE 6BI~ UK q Birkbeck College, London WCIE 71t~: UK
Department of Ph3'sics, Technion-lsrael Institute of Technology. lta(fa 32000, Israel Department of Physics. University of Cal(Ibrnia. Riverside. C4 92521, USA
' National Research Council of Canada. Herzberg Institute of Astrophysics. Ottawa. Ontario KIA OR6. Canada Nuclear Physics Department. 14'eizmann Institute of Science, Rehovot 76100. Israel DPhI'E. CEN Saclay. F-91191 Gif-sur-Yvette. France International Centre.lbr Elementary t'arttcle Physics and Department of Physics, Untverszt), of Tokyo, Tokyo 113, Japan and Kobe University, Kobe 657, Japan Brunel University, Uxbridge, Middlesex UB8 3PII, UK
Received 26 February 1990
This paper is d e d i c a t e d to the memor .v o f E l i zabe th S p r e a d b u r v who d i e d on February 6th 1990.
We report on a measurement of the mass of the Z ° boson, its total width, and its partial decay widths into hadrons and leptons. On the basis of 25801 hadronic decays and 1999 decays into electrons, muons or taus, selected over eleven energy points between 88.28 GeV and 95.04 GeV, we obtain from a combined fit to hadrons and leptons a mass of Mz= 9 I. 154 + 0.021 (exp) ± 0.030 (LEP) GeV, and a total width of l z = 2.536 _+ 0.045 GeV. The errors on Mz have been separated into the experimental error and the uncertainty due to the LEP beam energy. The measured leptonic partial widths are F,c= 81.2 + 2.6 MeV, F , ,= 82.6 + 5.8 MeV, and / ' , ,=85.7+7.1 MeV, consistent with lepton universality. From a fit assuming lepton universality we obtain F~.~-= 81.9 + 2.0 MeV. The hadronic partial width is/"h.d = 1838 + 46 MeV. From the measured total and partial widths a model inde- pendent value for the invisible width is calculated to be F.,,v=453 + 44 MeV. The errors quoted include both the statistical and the systematic uncertainties.
498

Volume 240, number 3,4 PHYSICS LETTERS B 26 April 1990
1. Introduction
The s tandard model, describing the unification of the weak and electromagnetic interactions, contains as a central element the massive vector boson Z °, the neutral carr ier of the weak force. Following the suc- cessful start of the new accelerators SLC and LEP several groups presented their first measurements of the parameters of the Z n [ 1-5 ]. Some of these mea- surements have recently been updated taking into ac- count most of the currently available da ta [6 ]. We present here a measurement of the parameters of the Z °, based on the entire data sample collected in ! 989 with the OPAL detector. This corresponds to a six- fold increase in luminosi ty compared with our pre- vious publ icat ions [4,7]. An improved unders tand- ing of the detector has led to a significant reduct ion in the systematic uncertaint ies of the measurements .
In this publ icat ion we present a combined analysis of the hadronic and leptonic decays of the Z ° based on a measurement of the hadronic and leptonic cross sections as a function of energy. The cross sections were measured at 11 centre-of-mass energies between 88.28 and 95.04 GeV by repeatedly scanning across the Z ° resonance. Measurements at nearby energies, within 10 MeV, were combined into one data point at the luminosi ty-weighted average energy. The mea- surement of the energies was performed by the LEP Division. The residual fractional error in the energy of each beam was 3 × 10⁻⁴, corresponding to 30 MeV in the centre-of-mass energy. This error enters as a scale uncertainty in the measurement of the Z ° mass. The fractional point- to-point error in the energy was 1 × 10 -4. The centre-of-mass energy values used in our previous publ icat ions [4,7 ] have since been cor- rected by + 4 3 MeV due to a better unders tanding of the LEP energy scale.
Also at: TRIUMF, Vancouver, Canada. 2 On leave from Manchester University, Manchester M 13 9PL,
UK. On leave from Harbin Institute of Technology, Harbin, P.R. China.
4 Now at Applied Silicon Inc. On leave from Birmingham University, Birmingham B I5 2TT, UK.
6 Present address: Dipartimento di Fisica, Universita della Calabria, 1-87036 Rende, Italy.
F rom a fit to the cross sections for hadronic and leptonic decay modes as a function of energy, in the region of the Z ° resonance, we de termine the mass and total width of the Z ° and its part ial decay widths into hadrons and leptons. The invisible width is ob- tained from the difference between the measured to- tal width and the sum of all observed partial widths. These results are compared with the expectat ions from the s tandard model.
2. The OPAL detector
The da ta were recorded with the OPAL detector [8] at the CERN e+e - coll ider LEP. The tracking of charged particles was performed with a je t chamber, a large volume drift chamber d iv ided into 24 azi- muthal sectors with 159 layers of wires. The jet chamber, together with a vertex detector and a z- chamber, is posi t ioned inside a solenoidal coil, which is surrounded by a time-of-flight counter array, a lead- glass electromagnetic calor imeter with a presampler , an inst rumented magnet return yoke serving as a hadron calor imeter and four layers of outer muon chambers. Forward detectors serve as a luminosi ty monitor .
The electromagnetic calorimeter , which played a central role in this analysis, consists of a cylindrical array of lead-glass blocks, covering the region I cos 01 < 0.82, where 0 is the angle with respect to the beam direction, and lead-glass blocks in the endcaps, covering the region 0.81 < [cos 01 <0.98. The blocks each subtend a solid angle of approximate ly 40 × 40 mrad 2. They project towards the interact ion point in the barrel region and along the beam direct ion in the endcaps. The two sections of the electromagnetic cal- or imeter together cover 98% of the solid angle. The time-of-flight system ( T O F ) covers the region Icos01 <0.82 and consists of 160 scinti l lator bars. More details about the detector and the trigger have been given in refs. [4,7].
For Monte Carlo studies the OPAL detector was s imulated using a computer program [9 ], which in- cludes the detector geometry and mater ial as well as effects of resolution and efficiencies.
499

Volume 240, number 3.4 PHYSICS LETTERS B 26 April 1990
3. The luminosil)' measurement
The integrated luminosity of the colliding beams was determined by the measurement of small angle Bhabha scattering, a process insensitive to Z ° effects. The measurement used the forward detector, consist- ing of two identical elements placed around the beam pipe at either end of the central tracking chambers. In this analysis two components of this detector were used in a complementary, manner: (i) a calorimeter provided a high statistics measurement of the rela- tive luminosity at each beam energy; (ii) a set of pro- portional tube chambers with a well defined geome- try and acceptance provided the absolute calibration.
Each calorimeter consists of a cylindrical lead- scintillator sandwich divided into 16 azimuthal seg- ments and two longitudinal sections: a presampler of 4 radiation lengths (Xo), and a main calorimeter of 22 Xo [4]. For 45 GcV electrons, the energy resolu- tion o f the calorimeter was measurement to be i.3 GeV ( 19% x /~) , with 84% of the energy deposited in the main calorimeter. Light sharing between adja- cent segments and between inner and outer readouts of the main calorimeter was used to determine the center of the showers. The polar angle resolution var- ied between 1 and I 0 mrad, being best near the inner edge of the calorimeter, while the resolution in azi- muth varied between 3.5 and 35 mrad, being best at the segment boundaries. The acceptance of te calo- rimeter extends from 39 to 155 mrad, and is essen- tially complete in azimuth.
The proportional tube chambers are positioned be- tween the presampler and main sections of the calo- rimeter. These chambers each consistent of a verti- cal. horizontal, and diagonal plane of proportional tubes [ 10] of 1 cm: cross section. The positions of the centroids of showers from incident electrons or photons are measured using the pulse height infor- mation from the tubes. For 45 GeV electrons, the tube chambers have 1.3 mrad resolution in 0 and ~ and dctcct 99.3% of the showers. The tube chamber acceptance extends from 50 mrad to 135 mrad in po- lar angle, and covers 95% in azimuth. The positions of the tube chambers were surveyed to 1.0 mm and were checked with electron tracks measured in drift chambers [ I 1 ] in front of the calorimeter.
To select events for the absolutc luminosity cali- bration a fiducial region was defined well within the
tube chamber and calorimeter acceptance, extending from 58 mrad to 124 mrad in polar angle from the nominal beam axis, and excluding azimuthal angles within 10 degrees of the horizontal and vertical planes. Panicles emitted from the interaction point in this angular region traversed only a minimum of material before reaching the forward detectors (less than 0.2 Xo). The average of the angles measured on the two sides of the event was required to lie within this fiducial region. Therefore the acceptance was largely independent of the position and size of the beam intersection region. To reject background due to off-momentum beam particles, the difference in the azimuthal angles between the two ends, AO, was re- quired to be in the range between 160 ~ and 200: Fi- nally, the average of the energies of the largest cluster in each calorimeter was required to be larger than of the beam energy. One quadrant of the tube cham- bers was not used since one segment in the corre- sponding calorimeter region was defective.
The detector read-out was triggered when the en- ergy sum in each forward calorimeter exceeded 15 GeV overall, or 12 GeV in back-to-back clusters. The overall trigger efficiency was found to be 99.0 + 0.3% for the events selected by these cuts. Fig. 1 shows the energies measured in the two calorimeters for all events prior to the energy cut. The vertical and hori- zontal arms of the distribution correspond to radia- tive events in which one photon escapes undetected. A correction o f 0.55%. with an uncertainty of 0.5%, was applied to account for the events that had a low measured energy at both ends o f the detector. Most o f these events were found to be small angle Bhabha events in which the electrons were outside the tube chamber acceptance but had showered into the fidu- cial volume.
The BABAMC Monte Carlo program [12] was used to generate e+e - ~ c + e - (),) events, distributed at various energies across the Z" resonance. A gaus- sian smearing of the angles and energies of the gen- erated particles was introduced to simulate the ef- fects of detector resolution seen in the data. Interference with the Z ° changed the cross section for cvcnts within the tube chamber acceptance by a max- imum of 1.0% from the simple 1/s QED dependence. The cross section corresponding to the selection cri- teria described above was calculated to be 18.17 + 0.02 nb at the Z ° peak. A theoretical systematic error
500

Volume 240, number 3,4 PHYSICS LETTERS B 26 April 1990
L d ,, , ; , , ~ / ,j : \ .. ~ , . . , m ~ , , ~ r • 4 0 :{ ,~,,//,.~ • ' "::::.~;-t.z.,.. -.
~, 3, S ~ ' ,..; ~ ." .~ : . ~ i ; , .
,'x, , ; ; ~ ~ : ; "/× ~ :: "z ~ , / , U / ~ ? / X ~/,"
O0 2 0 4 0 GO E, (OeV)
Fig. 1. The energies measured in the two forward calorimeters, E~ versus E,, for luminosity event candidates passing the tube chamber selection cuts. The shaded region is excluded by the trigger requirement that at least 12 GeV be deposited in opposite calorimeter segments. Events in the region above the diagonal satisfy the requirement that 2/3 of the centre-of-mass energy is observed in the calorimeter.
of 1% was assigned to this calculation [ 13 ]. A 0.14% correction was applied to account for the contribu- tion of the processes e+e - --*y'/. The radiative energy tails in fig. 1 agreed well with the predictions of the Monte Carlo program. Throughout the fiducial re- gion the measured average polar angles agreed well with the simulated distribution, which corresponds approximately to 1/03. as shown in fig. 2.
The sources of error in the absolute luminosity normalisat ion are detailed in table 1. The dominan t contr ibut ion is the limited precision in the tube chambers survey, while further errors arise from small discrepancies between the data and the Monte Carlo prediction and residual uncertainties in determining the various correction factors. The final error of 2.2% includes a statistical error of 0.7% corresponding to 17379 events in the calibration sample.
A check was made on the accuracy of the tube chamber luminosity calibration by using the shadow of the beam pipe support ring to establish a well de- fined inner edge for the calorimeter. This support is a precisely machined a lumin ium ring with a conical
-o o
E 10
O3
C d) >
Ill
10
0 . 0 8 O. 12 @ . . . . . ~ ( , rod)
Fig. 2. Angular distribution of luminosity event candidates, as measured by the tube chambers. The arrows show the boundaries of the fiducial region, inside of which the data follow the ex- pected 1/03 distribution, shown by the curve.
Table 1 Contributions to the absolute luminosity measurement uncer- tainty. The systematic errors contributing to the overall uncer- tainty are listed and then combined with the statistical error.
Source of error Magnitude
theory 1% radial survey 1.5% efficiency of tube chambers 0.5% trigger efficiency 0.3% energy cut 0.5% radial cut 0.5% background subtraction 0.5%
total systematic error 2.1%
statistical error 0.7%
total uncertainty 2.2%
outer surface that points to the interaction region at a polar angle of 47 mrad. It has a thickness of two radiation lengths and is located 40 cm in front of the forward calorimeter. The addit ion of this material in front of the calorimeter alters the energy sharing be- tween the presampler and the main calorimeter sig- nificantly. The energy deposited in the main calorim- eter is about 15 GcV lower in the shadow of the beam pipe support ring than beyond it. This discontinuity of the energy distribution in the main calorimeter ae-
501

Volume 240, number 3.4 PHYSICS LETTERS B 26 April 1990
curately defines the edge of the acceptance at small 0. A measurement using this method, which is indepen- dent of the tube chambers, agreed with the tube chamber measurement to within 0.8 + 2.6%.
The relative luminosi ty between points of different beam energy was measured using the main calor im- eters only. Events were selected in which the average energy of the largest clusters seen in the main sec- tions of each calor imeter exceeded 70% of the beam energy. This requirement was high enough to el imi- nate the background, but was 3 s tandard devia t ions below the peak from well contained Bhabha events. It rejected Bhabha events only partially contained due to the radiat ion of an energetic photon or shower leakage at the edges of the calorimeter . To reduce backgrounds, the difference, AO, in the az imuthal an- gles of the largest clusters was required to be in the range 160 ° < A¢ < 200 ° . A total of 58 124 events were selected by these cuts. of which less than 0. I% were background.
The energy cal ibrat ion of the main ca lor imeter could be main ta ined to within 0.5% over the entire per iod of data taking. As a consequence, the cross section for luminosi ty events defined by these re- quirements was stable with t ime to within 0.8%. With an effective geometrical acceptance extending from 47 to 142 mrad in polar angle, the cross section was affected by Z ° interference by at most 0.3%. Because the energy cut was imposed on the average of the energies in the two calorimeters , the acceptance was largely independent o f beam displacements and the size of the beam intersection region.
Thc acceptance o f the ca lor imeter selection was normal iscd to the tube chamber acceptance for a sample which included 70% of the data taking pe- riod. The Bhabha cross section for the ca lor imeter based luminosi ty measurement was thereby found to be 40.2 + 0.9 nb at the Z ° peak. The stabil i ty of the measurement was checked by compar ing the tube chamber and ca lor imeter luminosi t ies as a function of LEP fill and beam energy. No statist ically signifi- cant systematic differences were observed. The beam energy dependent systematic error of the integrated luminosity was est imated to be 1% and was taken into account as a point- to-point systematic error in the cross section measurements .
The da ta recorded in 1989 correspond to an inte- grated luminosi ty of about 1.4 p b - t. For the follow-
ing analyses only those periods of data taking were used in which all detector components essential for the measurement were operat ing properly.
4. The hadronic decays
The criteria used to select hadronic Z ° decays were nearly identical to the ones described in our previous publ ica t ion [4] . The selection was mainly based on energy clusters in the electromagnet ic calorimeter . Clusters in the barrel region were required to have an energy o f at least 100 MeV, and clusters in the end cap were required to contain at least two adjacent lead-glass blocks and have an energy of at least 200 MeV. The following three requirements defined a mul t ihadron candidate: ( i ) at least 8 clusters, ( i i ) a total energy deposi ted in the lead glass of at least 10% of the centre-of-mass energy
R.i~= Z Ec'us/x/~>0'1 ,
where Edo~ is the energy of each cluster, and ( i i i ) an energy imbalance along the beam direct ion which satisfied
[ E(Ec, .~ 'cos 0) 1 Rbal = < 0 .65 . E/G.s The measured dis t r ibut ions of these variables are shown in fig. 3. The cut on the number of clusters efficiently e l iminated Z ° decays into e+e - and z+z - . The Rv,~ cut discarded two-photon and beam-gas events. The cut in Rba, rejected beam-wal l , beam-gas and b e a m - h a l o events, and cosmic rays in the end caps.
In order to reject cosmic ray background in the barrel region, information from the TOF counters was used. All events for which at least four TOF counters fired within 8 ns of the expected t ime were accepted. Events with less than four TOF counters for which at least 50% of the observed energy was seen in the bar- rel lead glass were rejected. All remaining events with N ~ F < 4 were visually inspected: this corresponded to less than 2% of all hadronic events. Out of this sample 36 events were rejected by the scan as being of cosmic-ray, beam-wal l and b e a m - h a l o origin. The remaining background from each of these sources was es t imated to be less than 0.1%. A total of 25801 had- ronic Z ° decays remained after all these cuts, and the
502

Volume 240, number 3,4 PHYSICS LETTERS B 26 April 1990
f . i • • (a) c
,3) • > 1200
I , i
I L _ 0 10 20 50 40 50 60
N c l u s
0 0 ~ 1 0
g3 C" @ > LH 10
lO
. . . . . . (c)
0 0.2 o.4 0.6 0.8 ] Rbo l
corresponding integrated luminosity was 1.25 pb- 1. The main contamination in the hadronic data
sample came from x+x - events; a background frac- tion of 0.33 + 0.04% was estimated by using Monte Carlo events generated with the KORALZ generator [ 14 ]. This estimate was checked with the data using the charged track multiplicity. The resulting back- ground fraction was consistent with the Monte Carlo estimate. The contribution of the process e + e - ~ e+e - to the hadronic event sample was found to be less than 0.1%. The background from two-photon processes was estimated by a Monte Carlo calcula- tion using a quark-parton model [15] and was checked with the data by measuring the ratio of the numbers of events with high and low Rvis as function of beam energy. Both estimates gave consistent re- suits; the background was 0.03 + 0.03% under the Z ° peak and 0.2 + 0.2% in the tail region.
To calculate the acceptance of the event selection
0
- ~ 2 0 0 0
c @ >
i , i
0 0.2 0.4 0.6 0.8 1 1.2 R v i s
Fig. 3. The measured distributions of the variables used in the selection of hadronic events, each shown after applying all other cuts: (a) Number of clusters in the electromagnetic calorimeter. ( b ) Visible fraction of centre-of-mass energy, Rv,, (see text ). (c) Longitudinal energy imbalance Rb=, (see text). The simulated distributions using a QCD parton shower model are also shown. The arrows indicale the cuts applied.
procedure, the process e+e ---,qdl with subsequent hadronisation was simulated using the JETSET par- ton shower model with five flavors and string frag- mentation [ 16 ]. There is good agreement between the model predictions and the properties of the hadronic event sample (see for example fig. 3 and ref. [ 17] ). An acceptance of 97.7% with a negligible statistical error was calculated for multihadronic events. Var- ious checks were made to estimate the uncertainty in the acceptance calculation. The effect of uncertain- ties in the fragmentation model was estimated to be 0.5% by varying the parameters of the JETSET model and by using the HERWIG hadronisation model [ 18 ]. Imperfections in the detector simulation lead to a variation of the acceptance of 0.5%. The energy dependence of the acceptance in the region of the scan was 0.2%. The error due to the specific choice of the hadronic selection cuts was estimated to be 0.2%. The resulting total systematic error on the selection and
503
Volume 240, number 3,4 PHYSICS LETTERS B 26 April 1990
acceptance o fhad ron i c events was 0.8%. The overall trigger efficiency for hadronic decays
of the Z ° that would pass the acceptance cri teria was de te rmined from the redundancy between the three main trigger modes: the TOF trigger, the track trigger and electromagnet ic energy trigger. For each trigger mode the efficiency was measured as a function of the direct ion of the thrust axis, Or. The resulting overall trigger inefficiency in the region of I cos 0-r I <0 .8 was found to be less than 0.01%, while the inefficiency for events in forward direct ion, I cos 0r I> 0.8, was less than 0.1% and therefore also negligible.
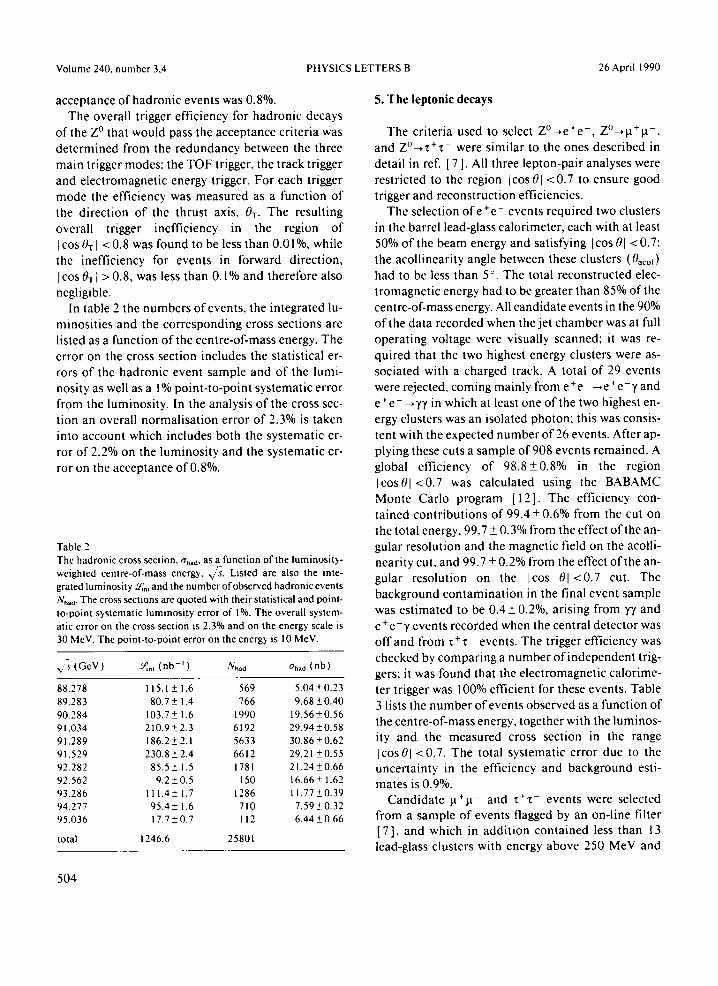
In table 2 the numbers o f events, the integrated lu- minosi t ies and the corresponding cross sections arc listed as a function of the centre-of-mass energy. The error on the cross section includes the statistical er- rors of the hadronic event sample and of the lumi- nosity as well as a 1% point - to-point systematic error from the luminosity. In the analysis of the cross sec- tion an overall normal isa t ion error of 2.3% is taken into account which includes both the systematic er- ror of 2.2% on the luminosi ty and the systematic er- ror on the acceptance of 0.8%.
Table 2 The hadronic cross section, Oh,d, as a function of the luminosity- weighted centre-of-mass energy, ~.,/s. Listed are also the inte- grated luminosity ff;,t and the number of observed hadronic events N~d. The cross sections are quoted with their statistical and point- to-point systematic luminosity error of 1%. The overall system- atic error on the cross section is 2.3% and on the energy scale is 30 MeV. The point-to-point error on the energy is 10 MeV.
\,,'~" (GeV) ~,~, (nb- ') Nh,d Oh,d (nb)
88.278 115.1 + 1.6 569 5.04-+0.23 89.283 80.7 -+ 1.4 766 9.68 + 0.40 90.284 103.7 + 1.6 1990 19.56+0.56 91.034 210.9+2.3 6192 29.94_+0.58 91.289 186.2 + 2. I 5633 30.86 _+ 0.62 91.529 230.8_+2.4 6612 29.21 +0.55 92.282 85.5_+ 1.5 1 7 8 1 21.24+0.66 92.562 9.2__.0.5 150 16.66+ 1.62 93.286 111.4_+ 1.7 1286 11.77 +0.39 94.277 95.4-+ 1.6 710 7.59+0.32 95.036 17.7-+0.7 112 6.44+0.66
total 1246.6 25801
5. The leptonic decays
The criteria used to select Z ° - ,e+e - , Z°~p.+la - , and Z ° ~ z + x - were s imilar to the ones described in detail in ref. [ 7 ]. All three lepton-pair analyses were restricted to the region Icos 01 <0.7 to ensure good trigger and reconstruct ion efficiencies.
The selection o f e + e - events required two clusters in the barrel lead-glass calorimeter , each with at least 50% of the beam energy and satisfying [cos 0l <0.7; the acol l ineari ty angle between these clusters (()aco~) had to bc less than 5 °. The total reconstructed elec- t romagnet ic energy had to be greater than 85% of the centre-of-mass energy. All candidate events in the 90% of the data recorded when the jet chamber was at full operat ing voltage were visually scanned; it was re- quired that the two highest energy clusters were as- sociated with a charged track. A total of 29 events were rejected, coming mainly from e+e - ~ e + e - T and e ÷ e - --'TT in which at least one of the two highest en- ergy clusters was an isolated photon; this was consis- tent with the expected number of 26 events. After ap- plying these cuts a sample of 908 events remained. A global efficiency of 98 .8+0 .8% in the region I c os01<0 .7 was calculated using the BABAMC Monte Carlo program [12]. The efficiency con- ta ined contr ibut ions of 99.4 + 0.6% from the cut on the total energy, 99.7 + 0.3% from the effect of the an- gular resolution and the magnetic field on the acolli- ncarity cut, and 99.7 + 0.2% from the effect of the an- gular resolution on the Icos 01<0 .7 cut. The background contaminat ion in the final event sample was es t imated to be 0.4 + 0.2%, arising from ~ and c + e - T events recorded when the central detector was off and from x+z- events. The trigger efficiency was checked by compar ing a number of independent trig- gers; it was found that the electromagnetic calorime- ter trigger was 100% efficient for these events. Table 3 lists the number of events observed as a function of the centre-of-mass energy, together with the luminos- ity and the measured cross section in the range [cos01 <0.7 . The total systematic error due to the uncer ta inty in the efficiency and background esti- mates is 0.9%.
Candida te la ' la - and ~+x- events were selected from a sample of events flagged by an on-line filter [7] , and which in addi t ion contained less than 13 lead-glass clusters with energy above 250 MeV and
504

Volume 240, number 3,4 PHYSICS LETTERS B 26 April 1990
Table 3 The measured cross section, oc%~'- for the reaction e + e- ~e +e-, in the region I cos 01 < 0.7 and acollinearity angle 0,,~ < 5 ~, as a function of the luminosity-weighted centre-of-mass energy. Listed are also the integrated luminosities --q;nt, the event counts N~°~- and the cor- rected cross sections 0~0~ - (see text ). The errors quoted arc statistical only.
, ~ ¢ * c - o ' ¢ . ¢ _ ,~' s ~ , , .o~ a , .¢- . . . . (nb) ¢o,~ (nb) (GeV) ( r i b - ' ) Icos 01 <0.7 Icos 01 <0.7
88.279 116.3 + 1.6 30 0.260 + 0.048 0.256 + 0.047 89.285 66.8 + 1.3 30 0.453 + 0.083 0.445 _+ 0.082 90.284 118.0 ± 1.7 78 0.666 + 0.076 0.655 + 0.075 91.035 231.3 -'- 2.4 202 0.880 _~ 0.063 0.864 + 0.06 I 91.287 251.0 ___ 2.5 237 0.952 ___ 0.063 0.935 + 0.06 I 91.530 236.3 +- 2.4 210 0.896 _~ 0.062 0.880 + 0.061 92.285 76.8 + 1.4 41 0.538 _+ 0.085 0.530 + 0.083 92.563 10.1 +0.5 2 0.199_+0.141 0.196+0.139 93.285 I 17.2 + 1.7 45 0.387 + 0.058 0.383 + 0.057 94.282 92.0 + 1.6 28 0.307 + 0.058 0.305 ~ 0.058 95.036 19.0+_0.7 5 0.266-+0.119 0.265-,-0.119
total 1334.8 908
less than 1 I charged tracks with PT> 1 00 MeV, where Pr is the m o m e n t u m o f the track in the p lane perpcn- d icu la r to the e l e c t r o n - p o s i t r o n b e a m di rec t ion .
Events were classif ied as la+la - cand ida tes i f they con ta ined at least two charged tracks iden t i f ied as muons . Both tracks had to satisfy the requ i rements : p > 6 GeV, Icos01 <0 .7 , and d o < l cm, where do is the d is tance o f closest approach o f the track to the beam axis. The angle be tween the two tracks in 0 had to be greater than 250 mrad . A track was classif ied as a m u o n i f it sat isf ied any one o f the fol lowing cri teria: ( i ) there were at least two hits in the barrel m u o n chamber s associa ted with the track wi th in A¢~=70 mrad, ( i i ) wi th in AO= 70 m r a d there was a t rack seg- ment in the barrel hadron ca lor imeter , with hits in at least f ive o f the n ine layers, ( i i i ) the m o m e n t u m was larger than 15 G e V and the sum o f the energies in the barrel lead glass o f all clusters wi th in A¢ = 200 m r a d was less than 3 GeV. The eff ic iencies o f these three cr i tcr ia were 9 1 . 6 + 0 . 8 % , 60 .3+ 1.3% and 92 .5+ 0.7%, respect ively.
I n fo rma t ion f rom the T O F counte rs was used to r e m o v e the background f rom cosmic rays. Events were r equ i red to con ta in at least one T O F coun te r which measu red a t i m e wi th in 10 ns o f that expec ted for a par t ic le c o m i n g f rom the in te rac t ion point . In addi t ion , we cons ide red the dif ference, At, be tween the t imes measu red by pairs o f T O F counte rs sepa- rated in az imuth by more than 165 °; even ts in which
A t > 10 ns for all such pairs were re jected as cosmic rays. Af te r apply ing these cuts a sample o f 585 events r emained , with a negligible background f rom cosmic rays.
Triggers for la+ta + even ts were p r o v i d e d by the central de tec tor , the T O F counters , and the m u o n chambers . The resul t ing high degree o f r edundancy enabled the eff ic iencies o f the ind iv idua l c o m p o - nents to be measu red using the la+la - even ts them- selves. In this way the eff ic iency o f the c o m b i n e d trigger was found to be 99.5 + 0.5%. By s imi la r means the eff ic iency o f the on- l ine fil ter was found to be 9 9 . 5 + 0 . 5 % .
We eva lua ted the accep tance o f the r e q u i r e m e n t that la+la - events con ta in two tracks wi th in [cos01 < 0 . 7 to be 60 .0+ 1.1%, using ~t+la - even ts genera ted with the K O R A L Z M o n t e Car lo p rogram [ 14] and then passed through the de tec to r s imula- t ion. This p rogram genera tes e + e - ~ l a + l , t - and e + e - ~ + x - accord ing to the s tandard model , in- c lud ing the effects f rom init ial and final state radia- t ion. Us ing the same program, we calcula ted a back- g round o f 3 . 7 + 0 . 9 % from Z ° ~ x + ~ - and f rom a M o n t e Car lo s imula t ion [15] o f e + e - - ~ e + e - l a + l a - we ca lcula ted a background o f 0.4 + 0.4%.
A n u m b e r o f sys temat ic checks o f the analysis were pe r fo rmed . F r o m a search for la+l a - events in which one o f the tracks in the centra l de tec to r was not re- cons t ruc ted we eva lua ted a track f inding eff ic iency of
505
Volume 240, number 3,4 PHYSICS LETTERS B 26 April 1990
99.9 + 0. 1%. The number of selected events was found to be insensit ive to large changes in the cuts de- scribed above. These studies ident if ied a number of imperfect ions in the s imulat ion of the detector by the Monte Carlo program and wc es t imated an addi - t ional efficiency factor of 99 + 1% to account for this fact. Taking into account the efficiency, acceptance and background we obta ined an overall correct ion factor of 1.63 + 0.04 for the number ofla+la - events.
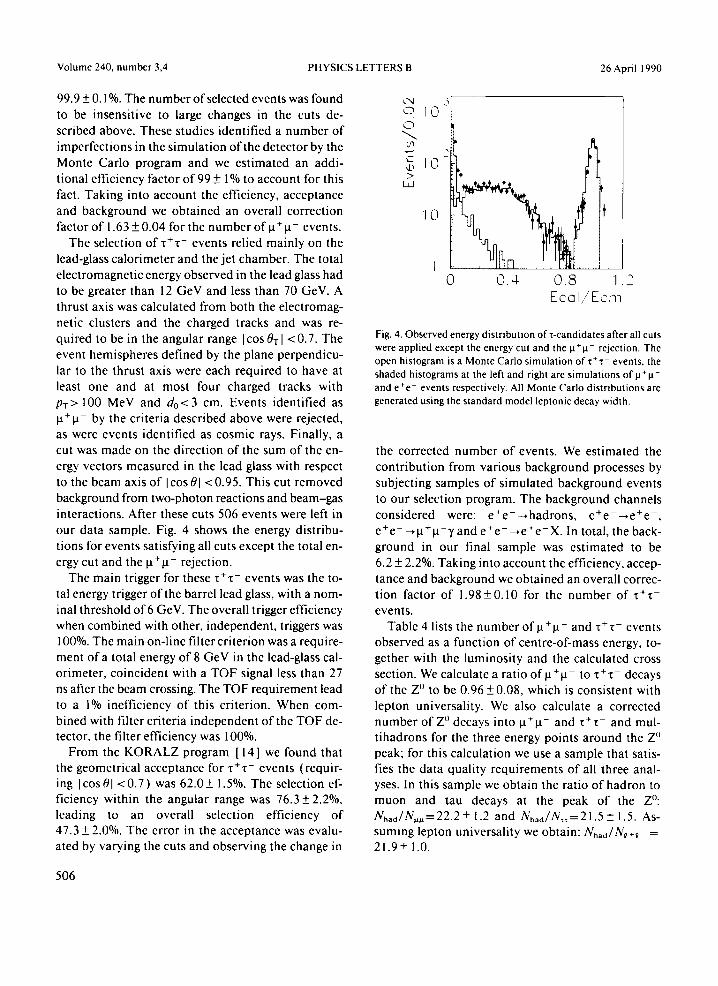
The selection o f x+z - events relied mainly on the lead-glass ca lor imeter and the jet chamber. The total e lectromagnet ic energy observed in the lead glass had to be greater than 12 GeV and less than 70 GeV. A thrust axis was calculated from both the electromag- netic clusters and the charged tracks and was re- quired to be in the angular range Icos Ovl <0.7. The event hemispheres defined by the plane perpendicu- lar to the thrust axis were each required to have at least one and at most four charged tracks with PT> 100 MeV and d o < 3 cm. Events identif ied as ~+ta- by the cri teria described above were rejected, as wcrc events identif ied as cosmic rays. Finally, a cut was made on the direct ion of the sum of the en- ergy vectors measured in the lead glass with respect to the beam axis o f Icos01 <0.95. This cut removed background from two-photon reactions and beam-gas interactions. After these cuts 506 events were left in our data sample. Fig. 4 shows the energy dis t r ibu- tions for events satisfying all cuts except the total en- ergy cut and the ta+la - rejection.
The main trigger for these T+x - events was the to- tal energy trigger of the barrel lead glass, with a nom- inal threshold of 6 GeV. The overall trigger efficiency when combined with other, independent , triggers was 100%. The main on-l ine filter cr i ter ion was a require- ment of a total energy o f 8 GeV in the lead-glass cal- or imeter , coincident with a TOF signal less than 27 ns after the beam crossing. The TOF requirement lead to a 1% inefficiency of this cri terion. When com- bined with filter cri teria independent of the TOF de- lector, the filter efficiency was 100%.
From thc K O R A L Z program [ 14] we found that the geometrical acceptance for ~+'t- events (requir- ing Icos01 < 0 . 7 ) was 62.0-+ 1.5%. The selection ef- ficiency within the angular range was 76.3-+ 2.2%, leading to an overall selection efficiency of 47.3 -+ 2.0%. The error in the acceptance was evalu- ated by varying the cuts and observing the change in
,.?'4 0
01 4 - - "
c @ >
i,i
I 0
I0
I0
1 0
f
0.4 0.8 1 Ecal/ 'Ecrn
Fig. 4. Observed energy distribution of "t-candidates after all cuts were applied except the energy cut and the p.+la- rejection. The open histogram is a Monte Carlo simulation of T + ~- events, the shaded histograms at the left and right are simulations of ~t +l a- and e÷e - events respectively. All Monte Carlo distributions are generated using the standard model leptonic decay width.
the corrected number o f events. We est imated the contr ibut ion from various background processes by subjecting samples o f s imulated background events to our selection program. The background channels considered were: e+e - - . h a d r o n s , c+e - - - , e+e - , c+e - - - ,p+p.-y and e+e - ~ e + e - X. In total, the back- ground in our final sample was es t imated to be 6.2 + 2.2%. Taking into account the efficiency, accep- tance and background we obta ined an overall correc- t ion factor of 1 .98+0.10 for the number of x+~ - events.
Table 4 lists the number of p.+p - and x+~- events observed as a function of centre-of-mass energy, to- gether with the luminosi ty and the calculated cross section. We calculate a rat io of~t+~ - to z*~ - decays of the Z ° to be 0.96_+ 0.08, which is consistent with lepton universality. We also calculate a corrected number o f Z ° decays into p*~t- and ~+~- and mul- t ihadrons for the three energy points a round the Z ° peak: for this calculation we use a sample that satis- fies the data quali ty requirements of all three anal- yses. In this sample we obtain the ratio of hadron to muon and tau decays at the peak of the Z°: Nhaa/ N , , = 22.2 +_ 1.2 and Nh~a/N,~=21.5 +_ 1.5. As- suming lepton universal i ty we obtain: N~ad/N~.~ = 21.9_+ 1.0.
506
Volume 240, number 3,4 PHYSICS LETTERS B 26 April 1990
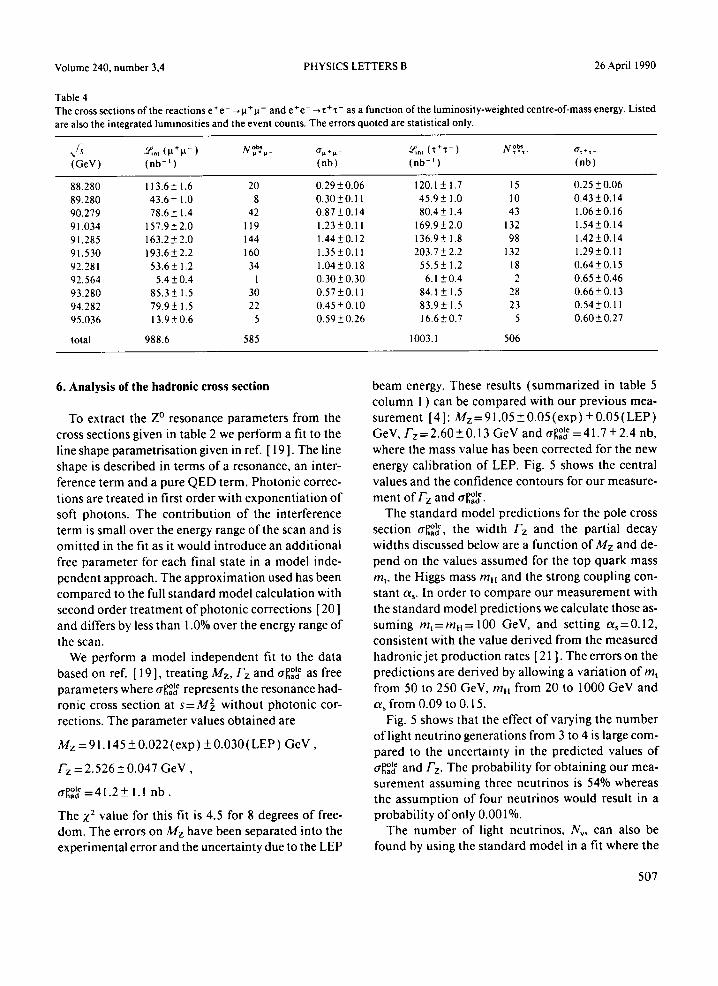
Table 4 The cross sections of the reactions e +e- --,la +p- and e +e- --, x+-t- as a function of the luminosity-weighted centre-of-mass energy. Listed are also the integrated luminosities and the event counts. The errors quoted are statistical only.
.. /~, ,÷t- o'~ +~_ ~,~ .~,,, (B+p. - ) N),. X_°~ o'), +),- ~n, (I+T - ) ,otn (GeV) (rib -i ) (nb) (nb -) ) (nb)
88.280 113.6+ 1.6 20 0.29+0.06 120.1 + 1.7 15 0.25+0.06 89.280 43.6 + 1.0 8 0.30+0.11 45.9+ 1.0 10 0.43_+0.14 90.279 78.6 + 1.4 42 0.87 _+ 0.14 80.4 _+ 1.4 43 1.06 + 0.16 91.034 157.9_+2.0 119 1.23_+0.1 I 169.9_+2.0 132 1.54+0.14 91.285 163.2_+2.0 144 1.44_+0.12 136.9_+ 1.8 98 1.42-+0.14 91.530 193.6 _+ 2.2 160 1.35 _+ 0.11 203.7 _+ 2.2 132 1.29 _+ 0.11 92.281 53.6 + 1.2 34 1.04-+0.18 55.5-+ 1.2 18 0.64-+0.15 92.564 5.4-+0.4 1 0.30-+0.30 6.1 _+0.4 2 0.65-+0.46 93.280 85.3+ 1.5 30 0.57-+0.11 84.1 _+ 1.5 28 0.66_+0.13 94.282 79.9_+ 1.5 22 0.45+_0.10 83.9_+ 1.5 23 0.54+0.11 95.036 13.9 _+ 0.6 5 0.59 + 0.26 16.6 _+ 0.7 5 0.60_+ 0.27
total 988.6 585 1003.1 506
6. Analysis of the hadronic cross section
To extract the Z ° resonance parameters from the cross sections given in table 2 we perform a fit to the line shape parametrisation given in ref. [ 19 ]. The line shape is described in terms of a resonance, an inter- ference term and a pure QED term. Photonic correc- tions are treated in first order with exponentiation o f soft photons. The contribution of the interference term is small over the energy range of the scan and is omitted in the fit as it would introduce an additional free parameter for each final state in a model inde- pendent approach. The approximation used has been compared to the full standard model calculation with second order treatment of photonic corrections [ 20 ] and differs by less than 1.0% over the energy range of the scan.
We perform a model independent fit to the data based on ref. [ 19 ], treating Mz, Fz and t r ~ ~ as free parameters where t r ~ ~ represents the resonance had- ronic cross section at s=M~ without photonic cor- rections. The parameter values obtained are
Mz =91.145 +0 .022(exp) +0 .030 (LEP) G e V ,
Fz =2 .526+0 .047 G e V ,
trl]°~ =41.2 + _ 1.1 nb .
The Z 2 value for this fit is 4.5 for 8 degrees of free- dom. The errors on Mz have been separated into the experimental error and the uncertainty due to the LEP
beam energy. These results (summarized in table 5 column I ) can be compared with our previous mea- surement [ 4 ]: Mz = 91.05 + 0.05 (exp) + 0.05 (LEP) GeV, F z = 2 . 6 0 + 0.13 GeV and ~'had~P°~C =41.7 + 2.4 nb, where the mass value has been corrected for the new energy calibration of LEP. Fig. 5 shows the central values and the confidence contours for our measure- ment o f Fz and t r ~ c.
The standard model predictions for the pole cross section t r ~ , the width Fz and the partial decay widths discussed below are a function of Mz and de- pend on the values assumed for the top quark mass m t, the Higgs mass mn and the strong coupling con- stant oq. In order to compare our measurement with the standard model predictions we calculate those as- suming mt= mu = 100 GeV, and setting a s = 0.12, consistent with the value derived from the measured hadronicjet production rates [ 21 ]. The errors on the predictions are derived by allowing a variation of m t from 50 to 250 GeV, mH from 20 tO 1000 GeV and a~ from 0.09 to 0.15.
Fig. 5 shows that the effect of varying the number of light neutrino generations from 3 to 4 is large com- pared to the uncertainty in the predicted values of c r ~ ~ and f'z. The probability for obtaining our mea- surement assuming three neutrinos is 54% whereas the assumption of four neutrinos would result in a probability o f only 0.001%.
The number o f light neutrinos, Nv, can also be found by using the standard model in a fit where the
507

Volume 240, number 3,4 PHYSICS LETTERS B 26 April 1990
Table 5 Results of the fit to the hadronic data and of the combined fit to the hadronic and leptonic data. Mz has an additional error of 30 MeV from the energy uncertainty. The fourth column indicates the standard model expectations assuming our measured Z ° mass, three gen- erations of light neutrinos, top quark and Higgs masses set to 100 GeV and cq to 0.12.
Hadronic data All data All data All data SM expectation only without lepton with lepton excluding mt= mH = 100 GeV
universality universality electrons oq = 0.12
Mz [GeV] 91.145+0.022 91.154+0.021 91.154+0.021 91.144+0.021 91.154 (input) Fz [ GeV l 2.526 _+ 0.047 2.536 + 0.045 2.536 +_ 0.045 2.532 + 0.045 2.483 tr~ e [nb] 41.2 +1.1 41.4 +_1.1 41.4 --1.1 41.4 +1.1 41.4
F¢~[MeV 1 81.2 +2.6 F~ [MeV l 82.6 _+5.8 F,~ [MeV] 85.7 _+7.1 F~.~_ [MeV l 81.9 _+2.0 82.1 _+2.2 83.4 Fha d [GeV ] 1.854 -+ 0.058 1.838 -+ 0.046 1.822 + 0.052 1.734 F,,~ [MeV] 433 -+61 453 -+44 463 -+48 499
z2/NDOF 4.5/5 30.8/32 31.2/34 19.3/25
¸ - . 4 6 c-
,. ~, 4 4
t3 42
4 0
.58
"2~ " .3C
k
3 6 2 . 3 ....... 2 . 4 2 .5 2 .6 2 .7 2 .8 (o v)
Fig. 5. The confidence contours in the Fz-a~,~ ~ plane. Shown are the one, two and three standard deviation contours of our mea- surement. The small square shows the best fit to the data; the circle shows the standard model prediction for 3 light neutrino generations, the large square the prediction for 4 neutrinos. The bars reflect the uncertainty in the predictions when the top quark mass is varied from 50 to 250 GeV, the Higgs mass from 20 to 1000 GeV and oq between 0.09 and 0.15.
on ly o t h e r free p a r a m e t e r is Mz. In th i s fit, t h e to ta l w i d t h a n d h a d r o n i c po le c ross s ec t ion are p a r a m e - t r i sed by
r~ = ~ + 3r~" + N~F~ ~ ,
S M M ~p,,R~ __ 12n Fc /~hau ~'had -- M 2 F~:
508
_ Q a 4+t.3 M e V a n d Here , /~h M = 1734+47-21 MeV, F TM . . . . . 0.6 /-~M = 166.2_+~:7 M e V are the s t a n d a r d m o d e l p red ic - t i o n s for the par t i a l w i d t h for h a d r o n s , e l e c t r o n s a n d for e ach l ight n e u t r i n o . T h e two p a r a m e t e r fit y ie lds
M z = 9 1 . 1 4 1 + 0 . 0 2 2 ( c x p ) + 0 . 0 3 0 ( L E P ) G e V ,
Nv = 3.09 + 0 .19 ( exp ) _+ oio6 ( t h e o r ) ,
w i th a Z 2 o f 5.5 for 9 degrees o f f r e e d o m . T h o u g h th i s m e t h o d to d e t e r m i n e the n u m b e r o f
l ight n e u t r i n o s is the s ta t i s t i ca l ly m o s t prec ise one, it re l ies o n the va l i d i t y o f the s t a n d a r d m o d e l p red ic - t i on for all t he Z ° pa r t i a l wid ths . T h i s c o n s t r a i n t c an be r e m o v e d by a m e a s u r e m e n t o f t he h a d r o n i c a n d the l e p t o n i c par t i a l w id ths .
7. Combined analysis of hadrons and leptons
In the fo l lowing we desc r ibe h o w Mz, I z a n d the pa r t i a l w i d t h s F~, F , , F, and/- 'had a r e d e t c r m i n e d , in a m o d e l i n d e p e n d e n t way, f rom o u r m e a s u r e m e n t o f the l ine s h a p e s for the four p rocesses e + e - - , h a d r o n s , e + e - , la+la - , a n d ~ + ~ - .
T h e s y s t e m a t i c u n c e r t a i n t i e s o f the decay w i d t h s are h igh ly co r re l a t ed . N o r m a l i s a t i o n a n d p o i n t - t o - p o i n t ene rgy scale u n c e r t a i n t i e s a re c o m p l e t e l y cor- r e l a t ed for the four channe l s . F u r t h e r c o r r e l a t i o n s are i n t r o d u c e d by the r a t io F~/M~ .F~ used in e x t r a c t i n g

Volume 240, number 3,4 PHYSICS LETTERS B 26 April 1990
the four partial widths from the measured cross sec- tions. We therefore perform a combined fit to the four line shapes, based on a z2-minimisation which takes into account the full covariance matrix of data. This procedure allows us to take into account all system- atic errors on the cross sections mentioned above as well as their correlations. The uncertainties of all pa- rameters can therefore be determined correctly. Be- cause of the implicit assumption of gaussian proba- bility distributions, this method precludes the use of low statistics data points. For the lepton analysis data points have been discarded if the standard model prediction amounts to less than 10 observed events for the measured luminosity. The fitting procedure was checked using a maximum likelihood method.
For all final states excluding the e+e - channel, we use the line shape parametrisation as described in ref. [ 19 ]. Due to the presence of the t-channel the cross- section for e+e - --,e÷e - diverges if no angular cut is applied. For the e+e - final state, however, the effect of an angular cut strongly depends on the resonance parameters. We therefore use in our fit a parametris- ation of the differential cross section which is inte- grated for each choice o f parameters in the angular range of measured data. This parametrisation, de- scribed in ref. [22 ], is based on the line shape pro- gram BHABHA [23] which uses the formalism de- veloped in ref. [ 24 ]. The program accounts for ),- and Z-exchange in s- ant t-channel and all possible inter- ference terms. Photonic corrections are treated in a first order calculation with exponentiation of soft photons. Hard photons are treated in the collinear approximation. The t-channel effects are large: the peak cross section is enhanced by approximately 15% for Icos 01 <0.7 and the line shape significantly dis- torted with respect to the pure s-channel process.
The program requires the specification of kine- matic cuts on the photon energy (k) and the opening angle (~) between the hard photon and the final-state electron or positron. Our measured cross section, however, is obtained by requiring that the acollinear- ity angle (0aco~) between electron and positron is smaller than 5 ° . In order to compare the results of the theoretical calculation with our measurement we have used cuts on k and ~ that give the best approxi- mation to the kinematic region 0acot< 5 ~, namely k < 0.083Ebeam and ~< 5 ° . We have applied a correc- tion factor to the data to account for the fact that the
two kinematic regions are not precisely the same. This factor has been calculated by using the program BHABHA iteratively and varies from - 1 . 6 % to - 2 . 3 % over the energy range of the scan. As a check this correction factor has also been calculated using the BABAMC Monte Carlo program [ 12 ]. The two methods agree to approximately 1% near the Z ° peak. There is another correction to be made to the data in order to compensate for the loss due to acollinear events near to the boundary of the acceptance at I cos 0[ = 0.7. This correction has also been estimated using the BABAMC Monte Carlo at each point of the energy scan: it ranges from 0.5 to 1.5%. The corrected cross sections are listed in the last column of table 3. The systematic error in the calculation of the cross section for the process e+e - ~ e + e - by the program BHABHA, with the cuts k<0.083E~am and ~ < 5 °, was estimated to be 2.5% by comparing the results o f the line shape program with those of the BABAMC program. Because the exponentiation of soft photons is not performed in BABAMC, for the purpose of this comparison we did not use exponentiation in the line shape program; no systematic error has been as- signed to the exponentiation procedure used in the BHABHA program. When combined with the exper- imental uncertainty of 0.9% on the efficiency and background estimates, the total systematic error of the corrected Bhabha cross section is 2.7%.
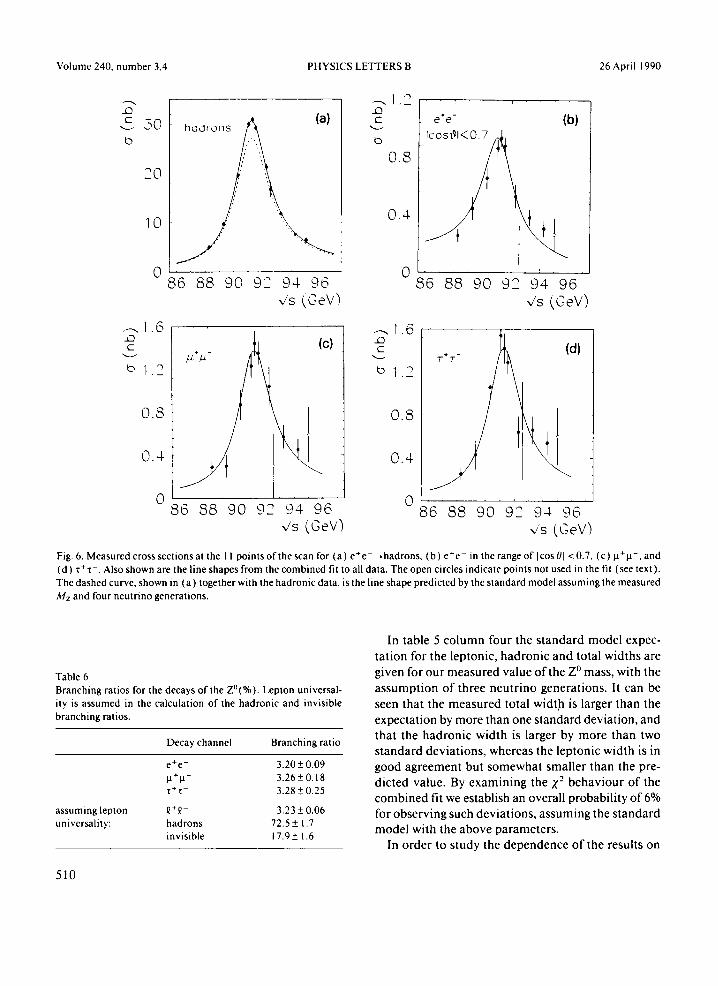
The line shapes resulting from the combined fit are shown in fig. 6, superimposed on the data. The pa- rameter values for this fit are summarised in table 5 column 2. As expected, the values of Mz, Fz and apole had, as obtained from the combined fit, agree well with those derived from the hadronic data alone. The leptonic widths we observe are consistent with lepton universality. We therefore repeat the fit constraining all leptonic widths to be equal. The result of this fit is given in table 5 column 3. With the assumption of lepton universality the line shape parameters can also be extracted without using the e+e - data. While this procedure degrades the statistical significance of the results, it removes potential sources of systematic er- rors in the treatment of the electron channel through the approximation given in ref. [22]. The result of this fit is given in table 5 column 4. A combined fit can also be used to determine the decay branching ratios o f the Z °, the results are summarised in table 6.
509
Volume 240, number 3,4 PHYSICS LETTERS B 26 April 1990
50 7 (a)
20
10
0
.--.1.6 E
.£3
86 8 8 90 92 94 96 ,is (OeV~
t-
0.8
0 .4
0
' i
e'e- (b)
Ic°st~K Z
86 88 90 92 94 96 ,/s (CeV)
0.8
0.4
_ (c) ---. 1.6 -£3 c- b l . 2
0.8
0.4
(d)
0 o 86 88 90 92 94 96 86 88 90 92 94 96
vs (Oev) v's (OeV~
Fig. 6. Measured cross sections at the 11 points of the scan for (a) e+e - ~hadrons , (b ) e+e - in the range of I cos 01 <0.7, (c) la+l a - , and (d) t+ T-. Also shown are the line shapes from the combined fit to all data. The open circles indicate points not used in the fit ( see text ). The dashed curve, shown in (a) together with the hadronic data, is the line shape predicted by the standard model assuming the measured Mz and four neutrino generations.
Table 6 Branching ratios for the decays of the Z°(% ). Lepton universal- ity is assumed in the calculation of the hadronic and invisible branching ratios.
Decay channel Branching ratio
assuming lepton universality:
e+e - 3 .20+0.09 la+la - 3 .26+0.18 ~+~- 3 .28+0.25
I~+~ - 3 .23+0.06 hadrons 72.5 + 1.7 invisible 17.9 + 1.6
In table 5 column four the standard model expec- tation for the leptonic, hadronic and total widths are given for our measured value of the Z ° mass, with the assumption of three neutrino generations. It can be seen that the measured total width is larger than the expectation by more than one standard deviation, and that the hadronic width is larger by more than two standard deviations, whereas the leptonic width is in good agreement but somewhat smaller than the pre- dicted value. By examining the X 2 behaviour of the combined fit we establish an overall probability of 6% for observing such deviations, assuming the standard model with the above parameters.
In order to study the dependence of the results on
510

Volume 240, number 3,4 PHYSICS LETTERS B 26 April 1990
the values assumed for the top quark mass and the strong coupling constant, we vary m, between 50 and 250 GeV and as between 0.09 and 0.15, setting mH tO 20 GeV. The deviation of the standard model pre- diction from our measurement is minimized when we set both, m t and as, to the maximum value of the spccified ranges. With this assumption we would have assigned a probability of 25% to our results. In this estimate QCD corrections up to second order to the hadronic partial width were taken into account. The inclusion of the third order perturbative coefficient [25] alters these corrections from about 4% (in sec- ond order) to 4.4% for as=0 .12 : this increases the calculated hadronic width by 7 MeV.
The standard model partial widths all increase ap- preciably with increasing top mass. Fig. 7 shows our measurements of the hadronic and leptonic partial widths; also indicated is the uncertainty of the stan- dard model prediction with the parameter range con- sidered here. In the ratio of the partial widths the de- pendence on the top quark mass is reduced. In particular, the allowed range of values for the ratio of the hadronic to the leptonic partial width, RSz M , is
n ~.~io, SM r'SM/F'SM ,%<21.1 u . x . . ' - -< ,t x z ~ Z h a d / , J ~ + p -
~> t.D
= 1.9 L-..
, . . . . . . . . . .
i( i: i 1.8
1.7 0 . 0 8 0 . 0 8 4
r,+, - (GeV)
Fig. 7. The confidence contours in the Fh.a-F+ ÷~ - plane. The one and two standard deviation contours of our measurement, using all data, are shown as solid lines. The small dot shows the value of the best fit. The triangle and the broken lines show the best fit and the one and two standard deviation contours of our measure- ment, excluding, however, the e+e - data. The large dot shows the standard model predictions for three light neutrino genera- tions, the line reflects the uncertainty in the predictions when the top quark mass is varied from 50 to 250 GeV, and the Higgs mass from 20 to 1000 GeV. The shaded area indicates the effect on l~,,a of also varying cq between 0.09 and 0.15.
where the range of R T M reflects mainly the uncer- tainty assigned to as in second order QCD. The ratio Rz has the additional feature that some experimental systematic errors cancel: in particular it is indepen- dent of the absolute luminosity measurement. Our determinat ion of Rz, from the combined fit, is
R z = F h a d / F~ +~- = 22.43 _+ 0.75 .
The value of Rz is in agreement with the corrected ratio of the number of hadronic to la+~t - and x+T - events, observed near the peak, ( N h , d / N ~ + ~ - ) f =
22.1 +_ 1.0, where the factor f = l . 0 1 3 accounts for photon exchange in the s-channel. Within the param- eter range considered here our measurement of Rz differs from the standard model prediction by 1.8 to 2.4 standard deviations.
The results from the combined fit can also be ex- pressed as a model independent measure of the invis- ible width by the relation,
F , . v = r z - 3F~ +~- - F h . d .
We obtain
Fin ~ = 4 5 3 + 4 4 MeV.
Based on the standard model value of Fs~ M given above, we obtain,
F / r ' S M = N v = 2 . 7 3 + 0 . 2 6 ( e P)-o.o4(t eo ) i n v t - - v _ _ x +0.02 h r .
This measurement of the invisible width excludes four generations of light neutr inos with standard model couplings by more than 4 standard deviations. The measurement lies below the standard model predic- tion for three generations with light neutr inos by about one standard deviation. This observation should not, however, be considered independently of the deviation of Rz discussed above.
8. Summary
We have measured the production and decay of the Z ° into hadrons and lcptons. The results presented here are based on 25801 hadronic decays and 1999 leptonic decays collectcd during a scan around the Z ° resonance.
We have fit the Z ° line shape parameters using the
511

Volume 240, number 3,4 PHYSICS LETTERS B 26 April 1990
c o m b i n e d hadron ic and lep tonic data. F r o m this fit we d e t e r m i n e the Z ° mass to be M z = 9 1 . 1 5 4 + 0.021 _+0.030 GeV, its total wid th F z = 2.536 + 0.045 GeV, and the lep tonic wid ths Fcc= 81.2 _+ 2.6 MeV, F , , = 8 2 . 6 + 5 . 8 MeV, F ~ = 8 5 . 7 + 7 . 1 MeV. We f ind good ag reemen t wi th l ep ton universa l i ty ; pe r fo rming a fit wi th this cons t ra in t imposed , we ob ta in for the lep tonic wid th F~+~_ =81 .9_+2 .0 MeV and for the hadron ic wid th I'had = 1.838 _+ 0.046 GeV.
In this s t andard m o d e l the rat io RZ=Fha,~/F~+~- depends only weakly on the a s sumed values o f the top quark and Higgs masses. The p red ic t ed va lue for Rz lies be tween 20.6 and 21.1 where the range ma in ly reflects the uncer t a in ty in a~. F r o m the c o m b i n e d fit we obta in a value R z = 22.43 + 0.75 which differs f rom the s t andard mode l p red ic t ion by a p p r o x i m a t e l y two s t andard dev ia t ions .
The invis ib le width , d e t e r m i n e d by sub t rac t ing the had ron ic and three t imes the lep tonic par t ia l wid th f rom the total wid th is found to be F , , v = 4 5 3 + 4 4 MeV. By using the s t andard mode l wid th to neut r i -
_ _ X +0 .02 nos we obtain Nv=2.73+0.26(e p)_o.o4(theor). This m e a s u r e m e n t exc ludes four gene ra t ions o f light neu t r inos with s t andard mode l coupl ings by m o r e than four s tandard dev ia t ions .
Acknowledgement
It is a p leasure to thank the LEP Div i s ion for the cff ic ient o p e r a t i o n o f the mach ine , the precise infor- ma t ion on the abso lu te energy, and the i r con t i nu ing close coope ra t i on with ou r expe r imen ta l group. In add i t i on to the suppor t s ta f f at our own ins t i tu t ions we are p leased to acknowledge the fol lowing: the B u n d e s m i n i s t e r i u m f'tir Fo r schung und Technoiogie , F R G , the D e p a r t m e n t o f Energy, USA, the Inst i tut de Reche rche F o n d a m e n t a l e du C o m m i s s a r i a t a l 'Energie A t o m i q u e , the Israeli Min i s t ry o f Science, the M i n c r v a Gesel lschaf t , the Na t iona l Science Founda t i on , USA, the Natura l Sciences and Engi- neer ing Research Counci l , Canada , the Japanese Minis t ry o f Educa t ion , Science and Cu l tu re ( the M o n b u s h o ) and a grant unde r the M o n b u s h o Inter- na t iona l Science Research Program, the Science and Engineer ing Research Counci l , U K and the A.P. Sloan Founda t i on .
[ 1 ] G.S. Abrams et al., Phys. Rev. Lett. 63 (1989) 724, 2173. [2] L3 Collab., B. Adeva et al., Phys. Lett. B 231 (1989) 509. [3] ALEPH Collab., D. Decamp et al., Phys. Lett. B 231 (1989)
519. [ 4 ] OPAL Collab.. M.Z. Akrawy et al., Phys. Lett. B 231 ( 1989 )
530. [ 5 ] DELPHI Collab., P. Aarnio et al., Phys. Lett. B 231 ( 1989 )
539. [6] ALEPH Collab., D. Decamp et al., Phys. Lett. B 235 (1990)
399; L3 Collab., B. Adeva et al., Phys. Lett. B 237 (1990) 136; B238 (1990) 122.
[ 7 ] OPAL Collab., M.Z. Akrawy et al., Phys. Left. B 235 (1990) 379.
[ 8 ] OPAL Technical proposal (1983) and CERN/LEPC/83-4; OPAL Collab., K. Ahmet et al., The OPAL detector at LEP, to be submitted to Nucl. Instrum. Methods.
[9] J. Allison et al., Comput. Phys. Commun. 47 (1987) 55; R. Brun el al., GEANT 3, Report DD/EE/84-1 (CERN, Geneva, 1989).
[10] D.C. lmrie et al., Nucl. lnstrum. Methods A 283 (1989) 515.
[ 11 ] B.E. Anderson et al., Nucl. Instrum. Methods A 283 ( 1989 ) 650.
[12] M. B~Shm, A. Denner and W. Hollik, Nucl. Phys. B 304 (1988) 687; F.A. Berends, R. Kleiss and W. Hollik, Nucl. Phys. B 304 (1988) 712.
[ 13 ] R. Kleiss ct al., in: Z physics at LEP I, CERN Yellow Book 89-08, eds. G. Altarelli et al., Vol. 3 (1989) p. 126.
[ 14] S. Jadach et al., in: Z physics at LEPI, CERN Yellow Book 89-08, eds. G. Altarelli et al.. Vol. 1 (1989); KORALZ. Version 37.
[ 15 ] F.A. Berends, P.H. Daverveldt and R. Kleiss, Comput. Phys. Commun. 40 (1986) 271,285, 309.
[16IT. Sj6strand, Comput. Phys. Commun. 39 (1986) 347; JETSET, Version 7. I.
[ 17 ] OPAL Collab., M.Z. Akrawy et al., Phys. Lett. B 236 ( 1990 ) 364.
[ 18] G. Marchesini and B.R. Webber, Nucl. Phys. B 310 (1988) 461; HERWIG, Version 3.2.
[ 19 ] D. Bardin et al., in: Z physics at LEP I, CERN Yellow Book 89-08, eds. G. Altarelli et al., Vol. 1 (1989) p. 89.
[20] W.J.P. Beenakker, F.A. Berends and S.C. van der Marck, Line shape program ZSHAPE (Instituut Lorentz, University of Leiden, POB 9506, 2300 RA Leiden, The Netherlands).
[21 ] OPAL Collab., M.Z. Akrawy el al., Phys. Left. B 235 (1990) 389.
[ 22 ] M. Caffo, E. Remiddi and F. Semeria, in: Z physics at LEP 1, CERN Yellow Book 89-08, eds. G. Aharelli et al., Vol 1 (1989)p. 171.
[23] M. Caffo, E. Remiddi and F. Semeria, Program BHABHA. [241M. Greco, Phys. Left. B 177 (1986) 97. [25]Z. Kunszt and P. Nason, in: Z physics at LEP1, CERN
Yellow Book 89-08, eds. G. Altarelli et al., Vol. I (1989) p. 373.
512