a cluster in a crowded environment: xmm-newton and chandra observations of a3558
TRANSCRIPT
A&A 463, 839–851 (2007)DOI: 10.1051/0004-6361:20054621c© ESO 2007
Astronomy&
Astrophysics
A cluster in a crowded environment: XMM-Newtonand Chandra observations of A3558�
M. Rossetti1,2, S. Ghizzardi2, S. Molendi2, and A. Finoguenov3
1 Università degli Studi di Milano, Dip. di Fisica, via Celoria 16 20133 Milano, Italy2 INAF – Istituto di Astrofisica Spaziale e Fisica Cosmica Milano, via Bassini 15, 20133 Milano, Italy
e-mail: [email protected]; [email protected] Max Planck Institut fur extraterrestrische Physik, 85748 Garching, Germany
Received 1 December 2005 / Accepted 12 October 2006
ABSTRACT
Combining XMM-Newton and Chandra data, we have performed a detailed study of Abell 3558. Our analysis shows that its dynamicalhistory is more complicated than previously thought. We have found some traits typical of cool core clusters (surface brightnesspeaked at the center, peaked metal abundance profile) and others that are more common in merging clusters, like deviations fromspherical symmetry in the thermodynamic quantities of the ICM. This last result has been achieved with a new technique for derivingtemperature maps from images. We have also detected a cold front and, with the combined use of XMM-Newton and Chandra, wehave characterized its properties, such as the speed and the metal abundance profile across the edge. This cold front is probably due tothe sloshing of the core, induced by the perturbation of the gravitational potential associated with a past merger. The hydrodynamicprocesses related to this perturbation have presumably produced a tail of lower entropy, higher pressure and metal rich ICM, whichextends behind the cold front for 500 kpc. The unique characteristics of A3558 are probably due to the very peculiar environment inwhich it is located: the core of the Shapley supercluster.
Key words. galaxies: clusters: general – galaxies: clusters: individual: Abell 3558 – X-rays: galaxies: clusters
1. Introduction
Superclusters are the most massive objects in the Universe andare destined to collapse. By studying superclusters, we can ob-serve the processes related to individual components at an earlystage of merging. These are: mutual interaction between thecomponents, accretion history of the member clusters, interac-tion between the collapsed objects and the intra superclustermedium.
The Shapley Supercluster (Shapley 1930) is one of thelargest concentrations of mass in the local Universe (Bardelliet al. 1994; Zucca et al. 1993; Ettori et al. 1997). The core ofthe concentration is dominated by the greatest cluster complexof the supercluster, which is composed of A3562, SC 1329-313,SC 1327-312, A3558 and A3556 (from SE to W). Many mul-tiwavelength observations have been carried out on the core ofthe Shapley Supercluster, from which the total gravitating massis estimated to be 1015−1016 h−1
50 M� (Metcalfe et al. 1994; Ettoriet al. 1997). The detected low surface brightness X-ray emis-sion connects A3558 with the two groups and A3562 and prob-ably also with A3556 (Kull & Böhringer 1999). Also the galaxyisodensity contours extend over the whole complex (Bardelliet al. 1998), indicating the presence of a structure on superclusterscales. Akimoto et al. (2003) have calculated the mean densityof the core region of the Shapley supercluster to be 25 timesgreater than the critical density. This density is larger than thevalue needed to decouple from the cosmic expansion and con-tract, even if smaller than that needed to virialize. Therefore,
� Appendices A and B are only available in electronic form athttp://www.aanda.org
they suggest that the whole A3558 complex is now in an earlyphase of contraction.
The central galaxy cluster in the core region is A3558, whichis also the brightest and most massive cluster in the complex. TheROSAT image of the core complex (Kull & Böhringer 1999)shows that the X-ray surface brightness of A3558 is elongatedin the SE-NW direction, along which the other members andthe galaxy distribution are also aligned (Bardelli et al. 1994).Therefore the infall of matter onto A3558 should be dominantalong this direction.
The temperature distribution of the ICM has been inves-tigated using ASCA data by Markevitch & Vikhlinin (1997),Hanami et al. (1999) and Akimoto et al. (2003), showing de-viations from spherical symmetry.
A radio analysis of the A3558 complex (Venturi et al. 2000)underlines the absence of extended radio sources (halos andrelics, which are observed in many merging clusters) in A3558.Also the radio-optical luminosity function for early-type galax-ies in the complex is significantly lower than that derived fora sample of early-type galaxies in clusters.
In this paper we present results from XMM-Newton andChandra observations of A3558. In Sect. 2 we present the anal-ysis and describe a new technique to produce temperature maps;in Sect. 3 we present the most interesting features of the clusterand in Sect. 4 we summarize our results and discuss the dynam-ical state of the cluster.
At the nominal redshift of A3558 (z = 0.047), 1 arcmin cor-responds to 54 kpc (H0 = 70 h70 km s−1 Mpc−1). All quoted er-rors are at 1σ, unless otherwise stated.
Article published by EDP Sciences and available at http://www.aanda.org or http://dx.doi.org/10.1051/0004-6361:20054621
840 M. Rossetti et al.: XMM-Newton and Chandra observations of A3558
Table 1. Source and background observations.
Obj name NH SXR bkg a
(1022 cm−2) (cts s−1 arcmin−2)
A3558 0.0389 (301 ± 10) × 10−6
PHL 5200 0.0526 (111 ± 8) × 10−6
PKS 0312-770 0.0797 (122 ± 6) × 10−6
a Average X-ray background count rate in the 3/4 keV band, derivedfrom the ROSAT all-sky survey diffuse background maps.
2. Data analysis
2.1. XMM-Newton data reduction
A3558 was observed by XMM-Newton during revolution 388with the EPIC detectors in Full Frame Mode with the thickfilter. We have obtained calibrated event files for the MOS1,MOS2 and PN cameras with SAS version 6.0. These files arethen manually screened to remove remaining bright pixels orcolumns. To reject soft proton flares, we accumulate light curvesin the 10–12 keV energy band, where the emission is dominatedby the particle-induced background. A visual inspection of thelight curve reveals that the observation is not badly affected bysoft protons: we remove only 0.5 ks, using the σ-clipping tech-nique (Marty et al. 2002), leaving an exposure of 43 ks for theMOS cameras and 35 ks for the PN.
For the study of galaxy clusters, especially in their outskirts,it is very important to subtract the instrumental background.The quiescent particle induced background can be properly sub-tracted using a large collection of background data, such as longobservations of blank sky fields. In this case, the choice wasnot easy because there are not many blank sky fields observa-tions performed with the thick filter. We have selected two fieldsPHL 5200 & PKS 0312-770 which have similar characteristicsto the source (see Table 1). We have applied to these observationsthe same selection criteria applied to the source, we removedpoint sources, reprojected the files to the observation coordinatesand merged the fields with the SAS task merge, for a total expo-sure of 79 ks for the PN and 81 ks for the MOS detectors.
The intensity of the quiescent particles background maydiffer during the observations of the source and of the blankfields. We have compared the count rates at energies greater than10 keV, where the emission is dominated by the background, inthe source and blank sky fields: the level of count rates duringbackground observations is about 10% higher than that of thesource observation. To correct for this effect we renormalizedthe background by multiplying it by a factor of 0.87 before per-forming background subtraction.
2.2. Chandra data reduction
Chandra observed A3558 in 2001 with the Advanced CCDImaging Spectrometer (ACIS). We have created standard leveltwo event files, screened for background flares using version 2.4of the ACIS calibration products available with the version 3.02of the CIAO package. The useful time for the analysis after thescreening is 13.9 ks.
We have performed background subtraction using the “blanksky” datasets enclosed in the CIAO Calibration Database. Wehave processed the background file with the same procedure ofthe source file and we have reprojected it to the Abell 3558 ob-servation sky coordinates.
2.3. Maps from images
Using data from X-ray imaging spectrometers, such as EPIC andACIS, we can derive a 2-dimensional temperature map of thecluster. In order to exploit the spatial resolution of these instru-ments, we want to obtain at the same time as much “spectral”and “spatial” information as possible. To do this, we have de-rived temperature maps from X-ray images using two differentand complementary techniques: the wavelets + hardness ratioanalysis (Briel et al. 2004) and the broad band fitting with adap-tive binning, that we will describe in Sect. 2.3.1. Combining thetemperature map and the surface brightness image, we also de-rived pseudo-pressure and pseudo-entropy maps. Besides givinginformations themselves, the maps can be used to select interest-ing regions for a proper spectral analysis.
2.3.1. Maps from adaptive binning + broad band fitting
Temperature maps of galaxy clusters are often obtained applyingadaptive smoothing to X-ray images (Markevitch et al. 2000), inorder to emphasize spatial details. The smoothing technique in-creases the local signal to noise ratio by correlating neighboringpixels through a convolution process. One of the problems of thistechnique is that it is often difficult to handle the statistics of thecorrelations introduced by the smoothing. The adaptive binningtechnique locally groups and averages together data, allowing usto have a firmer control on the statistics: this is why it should bepreferred when a precise error estimation is needed.
Rather than using the hardness ratio technique, we haveperformed a “broad band fitting” starting from images, as inMarkevitch et al. (2000). The combined use of these techniquesallows us to have a good control on the statistics and to producequantitative thermodynamic maps (i.e. maps with their associ-ated errors). In the following, we will describe the applicationof this technique to EPIC images, but it can also be easily ap-plied to ACIS data (see Ghizzardi et al. 2005 for an applicationto Chandra images).
We extract images in five energy bands (0.4–0.8 keV,0.8–1.2 keV, 1.2–2 keV, 2–4 keV, 4–10 keV) from the eventfiles of the observation and of the background and we gener-ate exposure maps in the same energy bands with the SAS taskeexpmap. Then we select the images with lowest signal (i.e. oneof the MOS images in the hardest energy band) and we performadaptive binning on this image, in order to group pixels in binswith the same signal to noise ratio. To do this we have usedthe 2-dimensional adaptive binning technique by Cappellari &Copin (2003), which is based on the Voronoi tessellation. Thisprocedure has been applied to the MOS1 image of A3558 in the4–10 keV energy band with a target signal to noise ratio of 10;the same binning is applied to all images, assuring a minimumS/N = 10 in all bins in all images, since the statistics in the PNand in the other bands is better than in the image we have se-lected. For each bin, we sum the count rates of MOS1, MOS2and PN, obtaining the EPIC count rate and its error in each bandand we compare them with a grid of predicted count rates, gen-erated with XSPEC using absorbed mekal models with differenttemperatures and normalizations, while the absorption columnand redshift are fixed to the known values for this cluster and theiron abundance is fixed at 0.3 solar. We select our “best fit” val-ues for temperature and normalization as those that minimize χ2.Using the χ2 matrix, we can also find values within a fixed ∆χ2
and we can associate errors with best fit parameters.
M. Rossetti et al.: XMM-Newton and Chandra observations of A3558 841
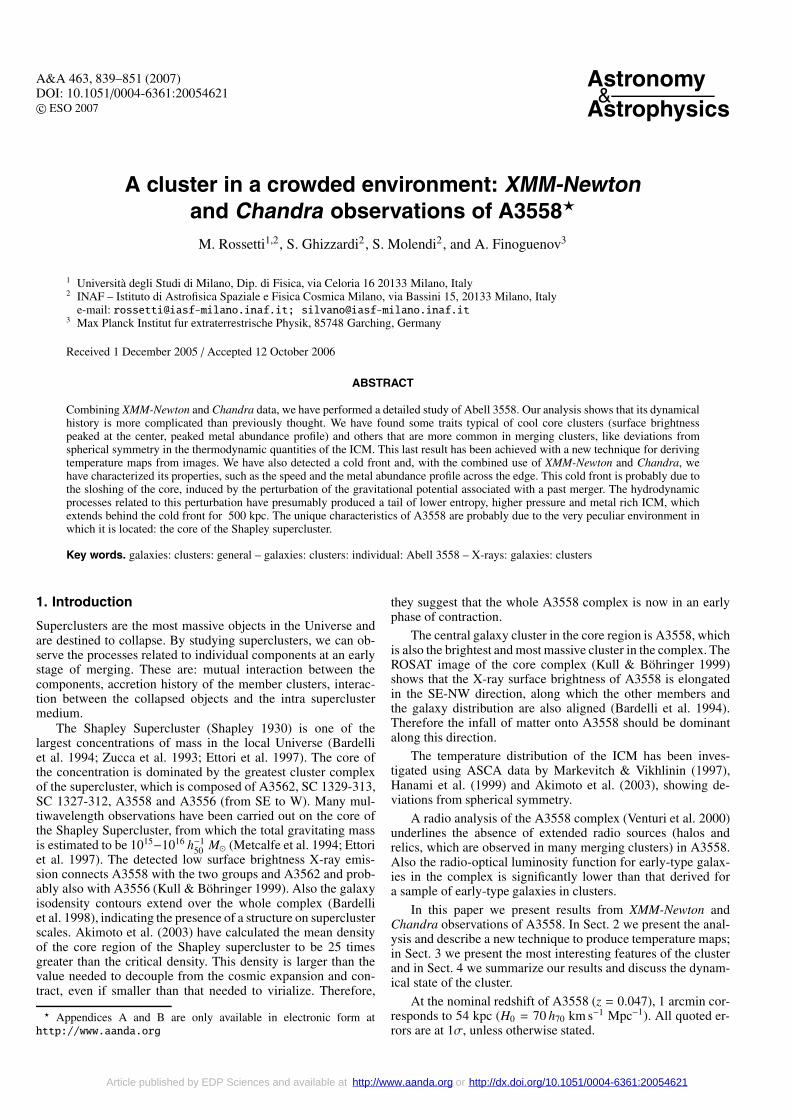
Fig. 1. Maps of the main thermodynamic quan-tities of the cluster, obtained with the adap-tive binning and broad band fitting technique.Upper left: “projected emission measure”(XSPEC Normalization per pixel); upper right:temperature (keV), lower left: pseudo-pressure(arbitrary units); lower right: pseudo entropy(arbitrary units). Coordinates on the maps areright ascension and declination.
The normalization values are in XSPEC units:
K =10−14
4π(DA(1 + z))2
∫nenHdV, (1)
where DA is the angular size distance to the source (cm), ne is theelectron density (cm−3), and nH is the hydrogen density (cm−3).If we divide the normalization by the number of pixels in eachbin (K/Np), we obtain the “projected emission measure” that isproportional to the square of the electron density n2
e, integratedalong the line of sight.
Using this “projected emission measure” we can obtain foreach bin the “pseudo-entropy” s and “pseudo-pressure” P, de-fined as:
s ≡ T
(KNp
)−1/3
P ≡ T
(KNp
)1/2
, (2)
and we can produce maps of these important thermodynamicquantities.
The maps obtained with this technique with EPIC are shownin Fig. 1. Our technique can also produce for each of these maps,two maps corresponding to the upper and lower limit at a givenconfidence level. These maps are extremely useful to determinewhether the gradients that we observe in Fig. 1 are significant ornot. We have applied this analysis to the “blue spot” in the tem-perature map at the center of the cluster (Fig. 2a), correspond-ing to the brightest bin. Its temperature, kT = (3.7+0.22
−0.18) keV,
is significantly lower than the mean value of the adjacent bins,kT = (4.89 ± 0.11) keV. Moreover the χ2 of the “fit” in thisbin is higher than in the surrounding bins (Fig. 2b), suggestingthat the fit in the blue spot is worse than in the other regions.Investigation of the Chandra image (Fig. 7) shows that the bluespot coincides with the AGN located in the BCG. This showsthat our technique is able to recognize the spectral shape, even ifwe use large energy bands.
The typical relative errors on the temperature are of the orderof 3−5% in a circle of radius 7 arcminutes from the SB peak,while at outer radii, errors grow to about 5−10%. The largererrors (∼10%) are found in the southern and western regions,where the surface brightness decreases more rapidly: in these re-gions the dominant factor of indetermination in temperature isthe background subtraction.
We do not show here the maps obtained from ACIS images:because of the short exposure of this observation we cannotproduce maps with bins smaller than in EPIC maps. A deeperChandra observation could allow us to exploit the full potentialand the spatial resolution of the ACIS instrument.
2.3.2. Maps from wavelet + hardness ratio
In Fig. 3 we show the maps of the main thermodynamic quan-tities obtained with hardness ratio (HR) and wavelet decom-position, with the technique described in Briel et al. (2003).The interest in this technique is more focused on detecting the

842 M. Rossetti et al.: XMM-Newton and Chandra observations of A3558
Fig. 2. Center of A3558 (inner 160 arcsec). Upper panel: temperaturemap, lower panel: χ2 map (3 d.o.f.). Coordinates on the maps are rightascension and declination.
regions where there are temperature gradients than in the abso-lute values, since they are used to select regions for a properspectral analysis. The main advantage of the wavelet decompo-sition is to reveal the small-scale features, which may not beresolved by the binning method.
A qualitative comparison with the maps in Fig. 1 shows thatthey are consistent: the features detected with the new techniqueare seen also in Fig. 3.
Only the temperature maps can be compared quantitatively(Figs. 1b and 3b), since the other maps have different units. Thefact that temperatures are always higher in the HR map is notworrying because the purpose of this technique is not to pro-duce quantitative temperature maps. Moreover, the simplifiedHR technique that we have used here assumes that the obser-vation is performed with a medium filter and therefore can over-estimate the temperature.
2.4. Maps from spectral analysis
In order to test our technique we have compared the temperatureand normalization maps that we derive from images with thesame maps obtained from a proper spectral analysis. With theresults of the spectral analysis we have produced temperatureand “projected emission measure” maps that can be comparedto the maps obtained from images (Fig. 1).
A plot of the temperature obtained with our technique ver-sus the temperature obtained with spectral analysis is shown inFig. 4.
The mean absolute deviation (|Timage/Tspectral − 1|) is 8.8%,with a 1.7% dispersion around the mean. The largest deviationbetween the temperature estimates is (Tim − Tsp) = 4.5(σ2
im +
σ2spe)0.5). A similar analysis of the difference between the tem-
perature obtained using MOS1 data and that obtained fromthe PN shows comparable variations (mean deviation 17.3% andscatter 5.3%).
Therefore the error associated with our technique is some-what smaller than the systematic error associated with cross-calibration uncertainties between MOS and PN.
The good agreement between the results of our techniqueand those of the spectral analysis confirms that the maps ob-tained from images can substitute for those obtained from thespectra in all the cases where a proper spectral analysis wouldrequire too much time, as for instance in long observations ofbright clusters or in large samples.
2.5. Ratio maps
The most interesting features in a non-relaxed galaxy cluster arethe deviations from the spherical symmetry, which would be ex-pected in an ideal relaxed cluster. Such deviations can be seenin any ICM observable (see for instance the “residual” image ofthe Coma Cluster, by Neumann et al. 2003). We have decidedto look for deviations in pressure (since it is strongly related tothe Dark Matter distribution) and in entropy. First we have de-rived pressure and entropy in all the polygons produced by theVoronoi tessellation, using the results of spectral analysis andmaking the volume estimates as described in Henry et al. (2004)and Mahdavi et al. (2005). Then we calculate the predicted “re-laxed” values, using the best fit models to the pressure and en-tropy profiles in a sample of clusters (Finoguenov et al. 2005)and centering them on the surface brightness peak (the impactof the choice of the center of symmetry will be discussed later).Finally we divide the observed values by the predicted one ineach polygon, obtaining the ratio maps shown in Fig. 5. Thearea-weighted fractional scatter in the entropy and pressure is0.23 ± 0.01 and 0.27 ± 0.01, respectively, inside a circular re-gion of r = 0.5r500 (r � 9.2 arcmin from the cluster center).
Since this technique is strongly based on geometrical andsymmetry assumptions, we have recalculated the maps using an-other point as the center of the cluster. This “new center” is thecenter of the surface brightness isophotes (we will discuss inSect. 3 the choice of this point) and is located ∼70 arcsec SEof the surface brightness peak. In Table 2, we compare the frac-tional scatter obtained using the different centers.
The choice of the center does not have a strong impact eitheron the values of the pressure and entropy scatter, especially atlarge scales, or on the ratio maps. The structures that appear inFig. 5 are seen also in the maps with the other center (that wedo not show here). Some obvious changes can be found only inthe inner regions: if we use the “SB center” the main surfacebrightness peak appears as a substructure.

M. Rossetti et al.: XMM-Newton and Chandra observations of A3558 843
Fig. 3. Maps of the main thermodynamic quan-tities of the cluster, obtained with wavelet de-composition and hardness ratio. Upper left:wavelet decomposed image of the cluster;upper right: temperature (keV); lower left:pseudo-pressure (arbitrary units); lower right:pseudo-entropy (arbitrary units). Coordinateson the maps are right ascension and declina-tion. The hot zone in the NW is an artefact dueto both high background in the hard band andto its position near the edge of the FoV.
Fig. 4. Temperature derived in each polygon with our technique ver-sus the weighted mean of the best fit temperature in each detector ob-tained from spectral analysis. The continuous line represents the idealexpected relation Timage = Tspectral.
3. Results
The morphology of the cluster in X-rays can provide importantinformation on its dynamical state. In Figs. 6 and 7 we showthe images from EPIC and ACIS-S3 respectively. The peak ofthe surface brightness coincides with the BCG, which hosts an
AGN. Comparing the image of this cluster with images froma sample of nearby clusters (Ghizzardi et al. 2005) we have ob-served that the X-ray emission is not as peaked as in cool coreclusters, but the peak is more apparent than in the clusters thatare currently undergoing a major merger.
The surface brightness contours in Fig. 6 show that the distri-bution of the ICM is elliptical, elongated in the SE-NW direction(inclination = 50◦). Excluding the inner regions (r < 120 arcsecfrom the SB peak), the cluster appears remarkably symmetriclarge scales. Approximating the contours in Fig. 6 with ellipses,we found that their center does not change significantly if weexclude the inner contours. This center can be considered thecenter of symmetry of the cluster: it is located �70 arcsec SE ofthe surface brightness peak. Such offsets are not uncommon inclusters.
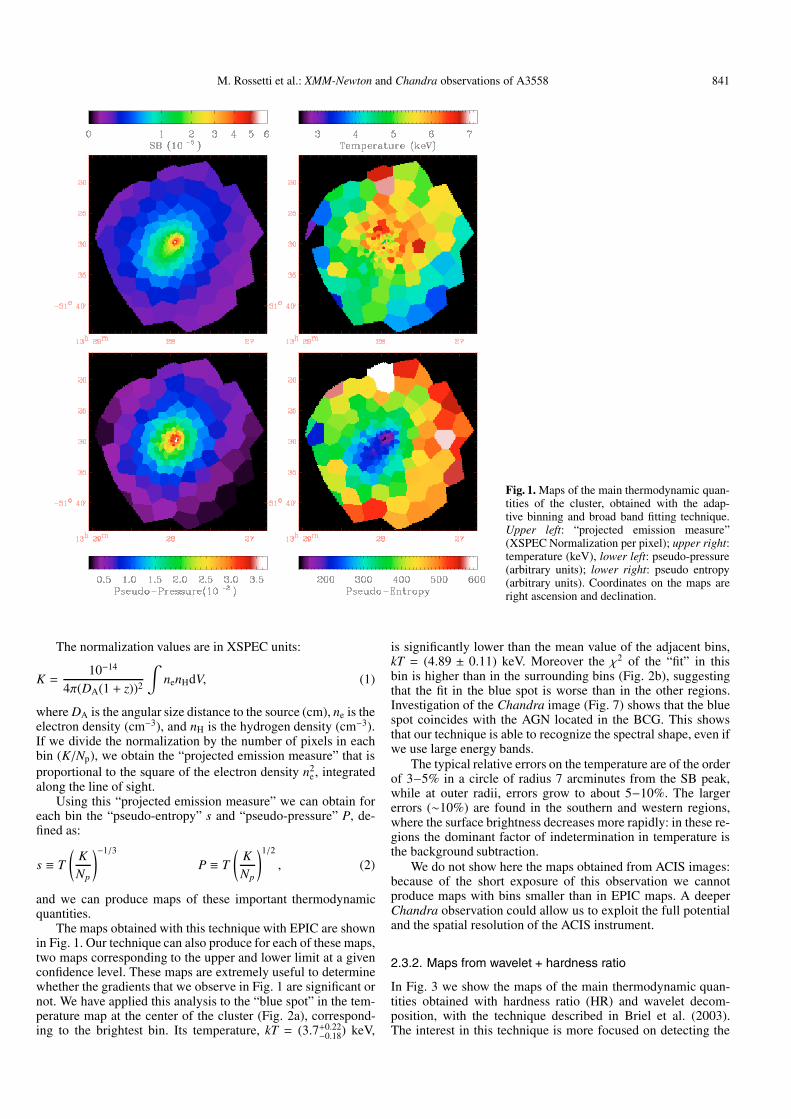
In the Chandra image (Fig. 7) there is a clear brightness dis-continuity (visible even if at a lower resolution in Fig. 6) in theNW sector. This edge is similar to those observed with Chandrain many clusters (Markevitch et al. 2000; Vikhlinin et al. 2001;Dupke & White 2003): the analysis of the surface brightness pro-file and of the temperature discontinuity (Sect. 3.1) confirms thatit is a cold front.
The temperature maps (Figs. 1b and 3b) confirm that thecluster is not spherically symmetric: we see a “hot bridge” (kT =(6.2±0.5) keV) which surrounds the cluster center on three sides,while the temperature in the SE sector at the same distance from

844 M. Rossetti et al.: XMM-Newton and Chandra observations of A3558
Fig. 5. Ratio maps of pressure (left) and en-tropy (right). The regions labeled “*” have nodata because of the subtraction of point sources.The white circle is the region considered for theanalysis of the pressure excess, while the blackcircle is the reference region. Coordinates onthe maps are right ascension and declination.
Table 2. Fractional entropy and pressure scatter obtained using the sur-face brightness peak (SB peak) and the center of large scale X-rayisophotes (SB center) as center of symmetry.
Region a Center Entropy Pressurer < 0.1r500 SB peak (0.179 ± 0.011) (0.629 ± 0.011)
SB center (0.193 ± 0.008) (0.667 ± 0.012)r < 0.2r500 SB peak (0.180 ± 0.006) (0.413 ± 0.006)
SB center (0.161 ± 0.005) (0.448 ± 0.007)r < 0.5r500 SB peak (0.227 ± 0.010) (0.276 ± 0.009)
SB center (0.233 ± 0.012) (0.272 ± 0.007)
a Circular region inside which the scatter is calculated. The radius is ex-pressed in fraction of r500: radius inside which the cluster mass densityis 500 times the critical density of the universe.
the center is significantly lower (kT = (5.1 ± 0.4) keV, ∼20%),similar to the temperature of the cluster core. The entropy maps(Figs. 1d and 3d) do not show the spherical symmetry typicalof relaxed clusters: the low entropy gas extends from the coretowards the SE for about 500 kpc. The pressure maps (Figs. 1cand 3c) seem to suggest that this quantity is more sphericallysymmetric than the others but a detailed analysis shows thatthere is an elongation of contours in the direction of the low-entropy tail. This is also confirmed by the ratio pressure map(Fig. 5) which shows a clear deviation from radial symmetry inthe SE sector and the presence of a secondary pressure peak. Theentropy ratio map (Fig. 5) confirms the presence of low-entropygas in the SE sector. These features in the ratio maps are stillpresent even if we select the large scale center of symmetry asour center.
It is apparent in our analysis that the regions where the ICMshows the most deviant features from the rest of the cluster arelocated in the SE sector.
In comparison to the typical scatter revealed in a representa-tive sample (Finoguenov et al. 2005), A3558 does not exhibitan anomalous amount of entropy or pressure substructures atlarge scales (r < 0.5r500).
3.1. The cold front
In order to characterize the edge seen in Chandra images, wehave extracted the surface brightness profile across the edge(Fig. 8a): the discontinuity is apparent from the change of the
Fig. 6. This EPIC flux image in the 0.4–2 keV band is computed fol-lowing a procedure similar to the one described in Baldi et al. (2002).The EPIC source counts image, S EPIC, is computed by summing theMOS1, MOS2 and PN source images, while an EPIC source exposuremap, tEPIC, is computed by summing the source exposure maps of eachdetector. The EPIC count rate image is defined as: crEPIC ≡ S EPIC/tEPIC.The total conversion factor (count rate to flux) c fEPIC has been calcu-lated using the exposure times for MOS1, MOS2 and PN, the conver-sion factors for the three instruments, c fMOS1, c fMOS2, c fPN, and follow-ing the formula: tEPIC
c fEPIC=
tMOS1c fMOS1
+tMOS2
c fMOS2+
tPNc fPN
. It is easy to show thatthe EPIC source flux image is then: FEPIC = c fEPIC · crEPIC. Similarlywe compute the EPIC background flux image from the MOS1, MOS2and PN background images and exposure maps. Finally by subtractingthe EPIC background flux image from the source flux image we derivean EPIC net flux image in units of 10−15 erg cm−2 s−1 pixel−1 (one pixelis 8.5 ∗ 8.5 arcsec2). Coordinates on the image are right ascension anddeclination.
slope at a projected distance b � 100 arcsec from the clustercenter.
We have extracted spectra from Chandra and XMM data incircular annuli inside and outside the discontinuity. Fitting themwith mekal models, we derive the temperature profile across theedge (Fig. 8c): the gas is colder where the surface brightness is
M. Rossetti et al.: XMM-Newton and Chandra observations of A3558 845
Fig. 7. Chandra image of the cluster in the band 0.8−3 keV, adaptivelysmoothed using the CIAO task csmooth. The black curved line showsthe position of the cold front, and the white elliptical sectors are usedfor the surface brightness profiles in Appendix A. Coordinates on theimage are right ascension and declination.
higher and therefore it is a cold front. Both instruments showthe temperature jump across the discontinuity, but with the bet-ter statistics of the XMM-Newton observation, the temperaturevalues measured by EPIC are more accurate.
Measuring the pressure jump across the cold front allows usto calculate the speed of the moving cloud (Landau & Lifshitz1959; Vikhlinin et al. 2001):
Pst
Pout=
⎧⎪⎪⎪⎨⎪⎪⎪⎩(1 + γ−1
2 M2)γ/(γ−1)
M < 1
M2(γ+1
2
) γ+1γ−1
(γ − γ−1
2M2
)−1/(γ−1)M > 1
where Pst is the pressure at the stagnation point, that can be ap-proximated by the pressure just inside the cold front, Pout is thepressure of the external, undisturbed gas, γ is the adiabatic indexand M is the Mach number of the motion of the cold cloud intothe external gas. To calculate the pressure ratio, we derive thedensity jump from the fit of the surface brightness profile withthe model described in Appendix A: we obtain nin/nout = 1.88 ±0.13. We calculate the temperature jump with XMM-Newtonsince the statistical errors on the temperatures are smaller. Afterdeprojection (Ettori et al. 2002), we obtain Tin/Tout = 0.85 ±0.11. This leads to a pressure ratio Pst/Pout = 1.60 ± 0.19,that corresponds to a subsonic motion, with a Mach numberM = 0.78+0.12
−0.15. Therefore, the cloud is moving with a speedv = Mvs = 936+144
−180 km s−1, relative to the gas outside the coldfront.
In the expression taken from Landau & Lifshitz (1959), Poutshould be the pressure far upstream from the cold front, but un-fortunately this does not apply easily to clusters since the pres-sure exhibits a strong gradient. For this reason, we have usedfor Pout the value in a region immediately outside the edge,which could be compressed and heated by the motion of the coldcloud. Therefore, we must consider the Mach number M = 0.8a lower limit for the speed of the cloud.
If the motion of the cold front were supersonic, we wouldexpect the presence of a shock in front of the moving cloud.The shock would compress and heat the ICM leading to a sec-ond discontinuity in surface brightness and temperature. Wehave searched for the possible bow shock using the XMM obser-vation, analyzing surface brightness and temperature profile inelliptical annuli in the sector shown in Fig. 7. Up to 200 arcsecfrom the edge of the cold front, there are no significant indica-tions of a change in the slope in the surface brightness profileor of a temperature discontinuity. We can use Moeckel’s method(Vikhlinin et al. 2001) to determine an upper limit to the Machnumber of the moving cloud: a stand-off distance between thecloud and the shock of �200 arcsec corresponds to a Mach num-ber M � 1.09. Therefore, we can conclude that the motion of thecloud is probably subsonic, with a Mach number in the range0.78−1.09. The large indetermination on this result reflects theimportance of the unavoidable assumptions on which it is based.Also the geometry and the symmetry of the system are very im-portant and to prove this, we have used a simpler and less accu-rate model than that in Appendix A to fit the surface brightnessprofile across the edge, assuming spherical symmetry centeredon the BCG. With this model we have found a lower densityjump (nin/nout = 1.43 ± 0.04) and therefore a lower but consis-tent Mach number M = 0.53 ± 0.07.
The metalicity profile across the cold front obtained withXMM-Newton spectra (Fig. 8d) could give us potentially impor-tant information on the origin of cold fronts. Large metalicitydiscontinuities are expected in some cold fronts due to mergingwhere the core of an interacting subcluster is traveling throughthe ICM of a cluster poor in metals or through the outskirtsof a cluster. The absence of a strong discontinuity in the metalabundance is consistent with several possible scenarios: a “merg-ing” cold front which travels through an ICM that happens tohave a similar metalicity and also a “sloshing” core (Markevitchet al. 2001).
The mean metalicity inside the cold front, Zin = (0.41 ±0.03) Z�, is higher than the abundance in the gas outside, Zout =(0.31 ± 0.03) Z�, at a 3σ level, but the profile is consistent witha smooth decreasing profile, like those observed in cool coreclusters (De Grandi & Molendi 2001), or with a metalicity jumpless than 0.1 (30–40%). We conclude that the present data do notallow us to rule out any possible interpretation.
The distribution of entropy inside the core of the cluster (in-ner 120 arcsec) is intriguing: the gas with lowest entropy is lo-cated NW of the central AGN, near the discontinuity of the coldfront (Fig. 9). In some numerical simulations (Heinz et al. 2003;Ascasibar & Markevitch 2006), the flow of gas past the mov-ing cloud induces slow motions inside the cloud, which shouldtransport gas from the center of the subcluster towards the inter-face. Our entropy distribution suggests that the low entropy gaslocated at the center of the cluster is moving towards the surfacebrightness discontinuity.
3.2. The anomalous SE sector
As we have already outlined, there is a direction in A3558 inwhich the ICM seems to have thermodynamic properties differ-ent from what we found in other sectors of the cluster: the SE re-gions. A low-entropy tail is observed in Figs. 1d and 3d, extend-ing from the core toward the SE for ∼500 kpc. Also the pressureis different in this sector, as seen in the ratio map (Fig. 5): it isabout a factor of two higher than predicted.
The presence of unresolved clumps of denser matter couldbias our estimate of pressure, since the density fluctuations

846 M. Rossetti et al.: XMM-Newton and Chandra observations of A3558
Fig. 8. Upper left: surface brightness profile ob-tained with Chandra across the discontinuity.Upper right: electron density profile with themodel described in Appendix A. Lower left:projected temperature profiles across the coldfront, obtained from ACIS spectra (red trian-gles) and EPIC spectra (black crosses). In or-der to reduce the effect of the EPIC PSF wedid not extract the spectra in a slice of width30 arcsec around the cold front. Lower right:metal abundance profile across the cold front,using XMM-Newton spectra.
Fig. 9. Entropy map in the inner regions of the cluster. The circle radiusis 113 arcsec, which corresponds to the distance between the center andthe cold front. The gas with lowest entropy is located west from the cen-ter, in the direction of the surface brightness discontinuity. Coordinateson the image are right ascension and declination.
enhance the cluster luminosity over what would be expected fora smooth, single-phase ICM (Mathiesen et al. 1999). From thetest described in Appendix B, we conclude that the pressure ex-cess is not an artifact due to unresolved clumps and that it musthave a physical origin.
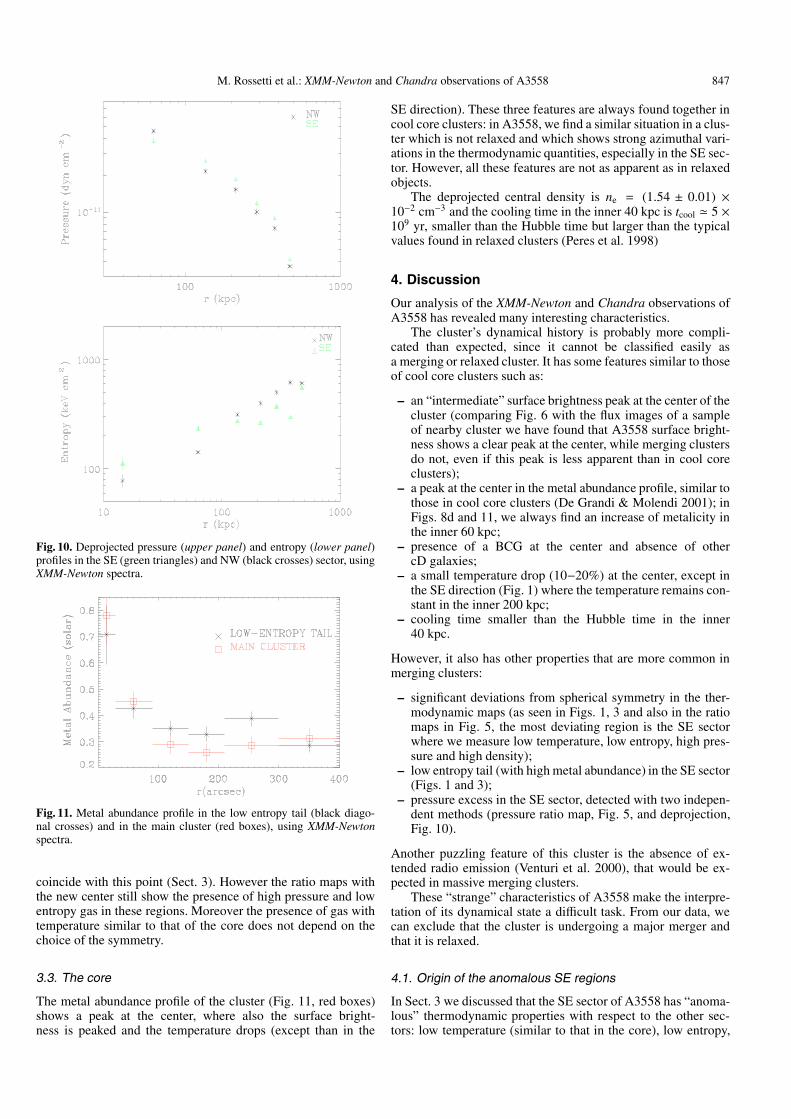
Projected entropy and pressure map are perhaps not com-pletely reliable. To test the robustness of the detection of theanomalous thermodynamic properties of the SE sector we havecompared these results to those obtained from an independenttechnique. In Fig. 10 we show the deprojected pressure and en-tropy profile in two opposite sectors of the cluster, obtained withspectral analysis and the deprojection technique described inEttori et al. (2002). The entropy in the SE sector between 100and 500 kpc is significantly lower than in the other direction, aspredicted by the projected maps and the deprojected data areconsistent with a pressure excess in these regions, even if atlower statistical significance.
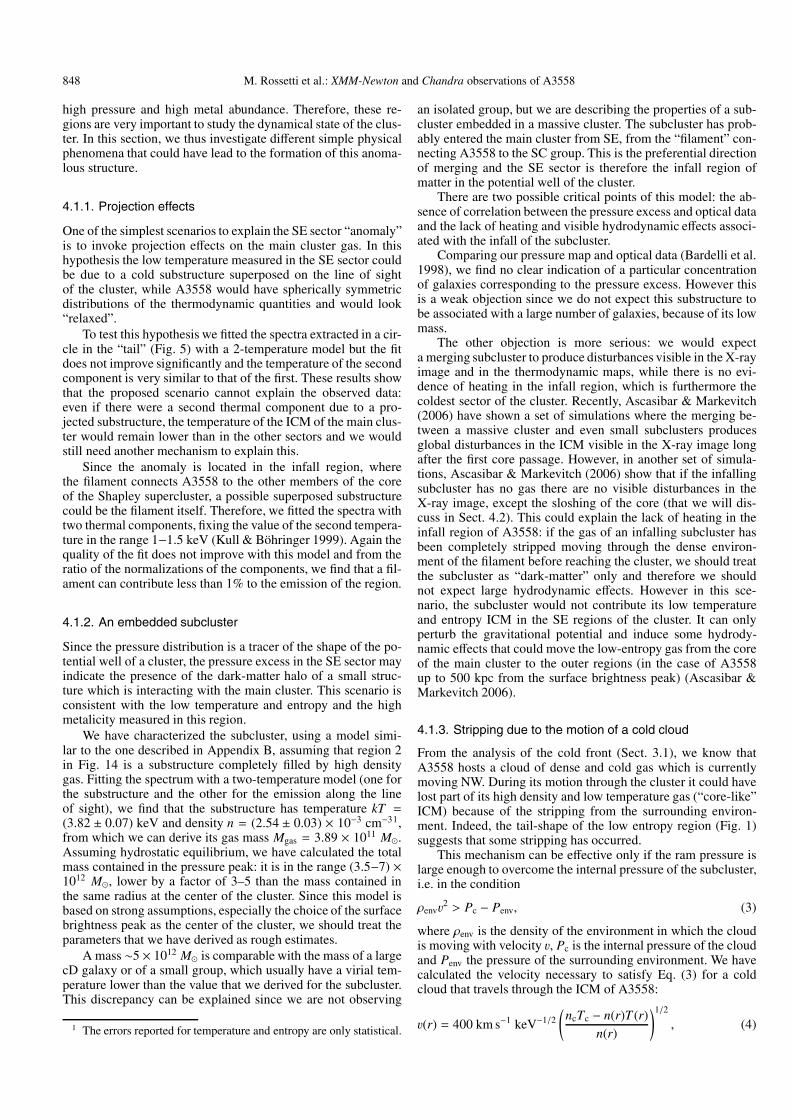
In order to study the metal distribution, we have extractedspectra from radial annuli in two sectors: one corresponding tothe low entropy tail and the other to the rest of the cluster. Theseprofiles (Fig. 11) show that the abundance is higher in the regionsof the low entropy gas than in the other regions. This suggeststhat the chemical history of the gas is different in the SE regionwith respect to other regions of the cluster.
The anti-correlation between entropy and metal abundanceis usually observed in the core of relaxed clusters. In the tail wefind both low-entropy and high metal abundance (and also highpressure): this suggests that in the past this gas could have beenat the center of a relaxed structure. Moreover, this also indicatesthat the processes that are responsible for the formation of thissubstructure did not significantly change the entropy of the ICMand therefore they are close to adiabatic.
The results that come from the profiles are based on an un-derlying assumption: that the center from which we have ex-tracted them (i.e. the peak of the surface brightness) is the cen-ter of the cluster. We have some indications that the point wechose could be the center of the potential well of A3558 (coinci-dence with the pressure peak ant the BCG), but we have alreadyoutlined that the center of the large scale symmetry does not
M. Rossetti et al.: XMM-Newton and Chandra observations of A3558 847
Fig. 10. Deprojected pressure (upper panel) and entropy (lower panel)profiles in the SE (green triangles) and NW (black crosses) sector, usingXMM-Newton spectra.
Fig. 11. Metal abundance profile in the low entropy tail (black diago-nal crosses) and in the main cluster (red boxes), using XMM-Newtonspectra.
coincide with this point (Sect. 3). However the ratio maps withthe new center still show the presence of high pressure and lowentropy gas in these regions. Moreover the presence of gas withtemperature similar to that of the core does not depend on thechoice of the symmetry.
3.3. The core
The metal abundance profile of the cluster (Fig. 11, red boxes)shows a peak at the center, where also the surface bright-ness is peaked and the temperature drops (except than in the
SE direction). These three features are always found together incool core clusters: in A3558, we find a similar situation in a clus-ter which is not relaxed and which shows strong azimuthal vari-ations in the thermodynamic quantities, especially in the SE sec-tor. However, all these features are not as apparent as in relaxedobjects.
The deprojected central density is ne = (1.54 ± 0.01) ×10−2 cm−3 and the cooling time in the inner 40 kpc is tcool � 5 ×10⁹ yr, smaller than the Hubble time but larger than the typicalvalues found in relaxed clusters (Peres et al. 1998)
4. Discussion
Our analysis of the XMM-Newton and Chandra observations ofA3558 has revealed many interesting characteristics.
The cluster’s dynamical history is probably more compli-cated than expected, since it cannot be classified easily asa merging or relaxed cluster. It has some features similar to thoseof cool core clusters such as:
– an “intermediate” surface brightness peak at the center of thecluster (comparing Fig. 6 with the flux images of a sampleof nearby cluster we have found that A3558 surface bright-ness shows a clear peak at the center, while merging clustersdo not, even if this peak is less apparent than in cool coreclusters);
– a peak at the center in the metal abundance profile, similar tothose in cool core clusters (De Grandi & Molendi 2001); inFigs. 8d and 11, we always find an increase of metalicity inthe inner 60 kpc;
– presence of a BCG at the center and absence of othercD galaxies;
– a small temperature drop (10−20%) at the center, except inthe SE direction (Fig. 1) where the temperature remains con-stant in the inner 200 kpc;
– cooling time smaller than the Hubble time in the inner40 kpc.
However, it also has other properties that are more common inmerging clusters:
– significant deviations from spherical symmetry in the ther-modynamic maps (as seen in Figs. 1, 3 and also in the ratiomaps in Fig. 5, the most deviating region is the SE sectorwhere we measure low temperature, low entropy, high pres-sure and high density);
– low entropy tail (with high metal abundance) in the SE sector(Figs. 1 and 3);
– pressure excess in the SE sector, detected with two indepen-dent methods (pressure ratio map, Fig. 5, and deprojection,Fig. 10).
Another puzzling feature of this cluster is the absence of ex-tended radio emission (Venturi et al. 2000), that would be ex-pected in massive merging clusters.
These “strange” characteristics of A3558 make the interpre-tation of its dynamical state a difficult task. From our data, wecan exclude that the cluster is undergoing a major merger andthat it is relaxed.
4.1. Origin of the anomalous SE regions
In Sect. 3 we discussed that the SE sector of A3558 has “anoma-lous” thermodynamic properties with respect to the other sec-tors: low temperature (similar to that in the core), low entropy,
848 M. Rossetti et al.: XMM-Newton and Chandra observations of A3558
high pressure and high metal abundance. Therefore, these re-gions are very important to study the dynamical state of the clus-ter. In this section, we thus investigate different simple physicalphenomena that could have lead to the formation of this anoma-lous structure.
4.1.1. Projection effects
One of the simplest scenarios to explain the SE sector “anomaly”is to invoke projection effects on the main cluster gas. In thishypothesis the low temperature measured in the SE sector couldbe due to a cold substructure superposed on the line of sightof the cluster, while A3558 would have spherically symmetricdistributions of the thermodynamic quantities and would look“relaxed”.
To test this hypothesis we fitted the spectra extracted in a cir-cle in the “tail” (Fig. 5) with a 2-temperature model but the fitdoes not improve significantly and the temperature of the secondcomponent is very similar to that of the first. These results showthat the proposed scenario cannot explain the observed data:even if there were a second thermal component due to a pro-jected substructure, the temperature of the ICM of the main clus-ter would remain lower than in the other sectors and we wouldstill need another mechanism to explain this.
Since the anomaly is located in the infall region, wherethe filament connects A3558 to the other members of the coreof the Shapley supercluster, a possible superposed substructurecould be the filament itself. Therefore, we fitted the spectra withtwo thermal components, fixing the value of the second tempera-ture in the range 1−1.5 keV (Kull & Böhringer 1999). Again thequality of the fit does not improve with this model and from theratio of the normalizations of the components, we find that a fil-ament can contribute less than 1% to the emission of the region.
4.1.2. An embedded subcluster
Since the pressure distribution is a tracer of the shape of the po-tential well of a cluster, the pressure excess in the SE sector mayindicate the presence of the dark-matter halo of a small struc-ture which is interacting with the main cluster. This scenario isconsistent with the low temperature and entropy and the highmetalicity measured in this region.
We have characterized the subcluster, using a model simi-lar to the one described in Appendix B, assuming that region 2in Fig. 14 is a substructure completely filled by high densitygas. Fitting the spectrum with a two-temperature model (one forthe substructure and the other for the emission along the lineof sight), we find that the substructure has temperature kT =(3.82 ± 0.07) keV and density n = (2.54 ± 0.03) × 10−3 cm−31,from which we can derive its gas mass Mgas = 3.89 × 10¹¹ M�.Assuming hydrostatic equilibrium, we have calculated the totalmass contained in the pressure peak: it is in the range (3.5−7) ×1012 M�, lower by a factor of 3–5 than the mass contained inthe same radius at the center of the cluster. Since this model isbased on strong assumptions, especially the choice of the surfacebrightness peak as the center of the cluster, we should treat theparameters that we have derived as rough estimates.
A mass ∼5 × 10¹² M� is comparable with the mass of a largecD galaxy or of a small group, which usually have a virial tem-perature lower than the value that we derived for the subcluster.This discrepancy can be explained since we are not observing
1 The errors reported for temperature and entropy are only statistical.
an isolated group, but we are describing the properties of a sub-cluster embedded in a massive cluster. The subcluster has prob-ably entered the main cluster from SE, from the “filament” con-necting A3558 to the SC group. This is the preferential directionof merging and the SE sector is therefore the infall region ofmatter in the potential well of the cluster.
There are two possible critical points of this model: the ab-sence of correlation between the pressure excess and optical dataand the lack of heating and visible hydrodynamic effects associ-ated with the infall of the subcluster.
Comparing our pressure map and optical data (Bardelli et al.1998), we find no clear indication of a particular concentrationof galaxies corresponding to the pressure excess. However thisis a weak objection since we do not expect this substructure tobe associated with a large number of galaxies, because of its lowmass.
The other objection is more serious: we would expecta merging subcluster to produce disturbances visible in the X-rayimage and in the thermodynamic maps, while there is no evi-dence of heating in the infall region, which is furthermore thecoldest sector of the cluster. Recently, Ascasibar & Markevitch(2006) have shown a set of simulations where the merging be-tween a massive cluster and even small subclusters producesglobal disturbances in the ICM visible in the X-ray image longafter the first core passage. However, in another set of simula-tions, Ascasibar & Markevitch (2006) show that if the infallingsubcluster has no gas there are no visible disturbances in theX-ray image, except the sloshing of the core (that we will dis-cuss in Sect. 4.2). This could explain the lack of heating in theinfall region of A3558: if the gas of an infalling subcluster hasbeen completely stripped moving through the dense environ-ment of the filament before reaching the cluster, we should treatthe subcluster as “dark-matter” only and therefore we shouldnot expect large hydrodynamic effects. However in this sce-nario, the subcluster would not contribute its low temperatureand entropy ICM in the SE regions of the cluster. It can onlyperturb the gravitational potential and induce some hydrody-namic effects that could move the low-entropy gas from the coreof the main cluster to the outer regions (in the case of A3558up to 500 kpc from the surface brightness peak) (Ascasibar &Markevitch 2006).
4.1.3. Stripping due to the motion of a cold cloud
From the analysis of the cold front (Sect. 3.1), we know thatA3558 hosts a cloud of dense and cold gas which is currentlymoving NW. During its motion through the cluster it could havelost part of its high density and low temperature gas (“core-like”ICM) because of the stripping from the surrounding environ-ment. Indeed, the tail-shape of the low entropy region (Fig. 1)suggests that some stripping has occurred.
This mechanism can be effective only if the ram pressure islarge enough to overcome the internal pressure of the subcluster,i.e. in the condition
ρenvv2 > Pc − Penv, (3)
where ρenv is the density of the environment in which the cloudis moving with velocity v, Pc is the internal pressure of the cloudand Penv the pressure of the surrounding environment. We havecalculated the velocity necessary to satisfy Eq. (3) for a coldcloud that travels through the ICM of A3558:
v(r) = 400 km s−1 keV−1/2
(ncTc − n(r)T (r)
n(r)
)1/2
, (4)
M. Rossetti et al.: XMM-Newton and Chandra observations of A3558 849
Fig. 12. The crosses show the position of thecenter of large scale symmetry. Upper left:EPIC flux image with the ellipses used to ap-proximate contours, upper right: temperaturemap, lower left: pressure ratio map and lowerright: pseudo-entropy map. The green crossshows the position of the centroid of X-raylarge scale isophotes.
where n(r) and T (r) are the properties of the ICM, as a functionof the distance from the cluster center. In the hypothesis that themoving cloud can be described by the properties of the ICM in-side the cold front, we derive that the required speed is consistentwith the value obtained from the analysis of the cold front onlyat distances smaller than 150 kpc from the cluster center. Thelow entropy gas located at the end of the tail (500 kpc) cannothave been stripped and deposited “in situ” during the motion ofthe cloud through the cluster, since the stripping can be effectiveonly in the inner regions where the density of the environment islarge.
4.1.4. A3558 former core
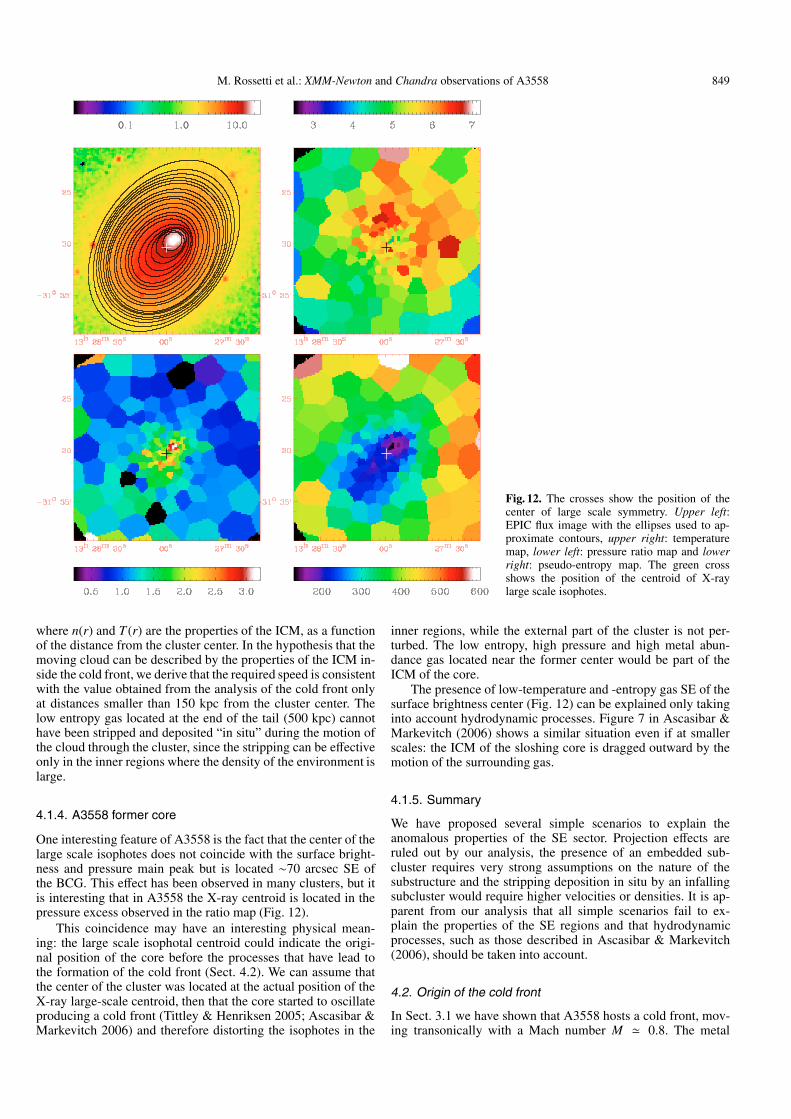
One interesting feature of A3558 is the fact that the center of thelarge scale isophotes does not coincide with the surface bright-ness and pressure main peak but is located ∼70 arcsec SE ofthe BCG. This effect has been observed in many clusters, but itis interesting that in A3558 the X-ray centroid is located in thepressure excess observed in the ratio map (Fig. 12).
This coincidence may have an interesting physical mean-ing: the large scale isophotal centroid could indicate the origi-nal position of the core before the processes that have lead tothe formation of the cold front (Sect. 4.2). We can assume thatthe center of the cluster was located at the actual position of theX-ray large-scale centroid, then that the core started to oscillateproducing a cold front (Tittley & Henriksen 2005; Ascasibar &Markevitch 2006) and therefore distorting the isophotes in the
inner regions, while the external part of the cluster is not per-turbed. The low entropy, high pressure and high metal abun-dance gas located near the former center would be part of theICM of the core.
The presence of low-temperature and -entropy gas SE of thesurface brightness center (Fig. 12) can be explained only takinginto account hydrodynamic processes. Figure 7 in Ascasibar &Markevitch (2006) shows a similar situation even if at smallerscales: the ICM of the sloshing core is dragged outward by themotion of the surrounding gas.
4.1.5. Summary
We have proposed several simple scenarios to explain theanomalous properties of the SE sector. Projection effects areruled out by our analysis, the presence of an embedded sub-cluster requires very strong assumptions on the nature of thesubstructure and the stripping deposition in situ by an infallingsubcluster would require higher velocities or densities. It is ap-parent from our analysis that all simple scenarios fail to ex-plain the properties of the SE regions and that hydrodynamicprocesses, such as those described in Ascasibar & Markevitch(2006), should be taken into account.
4.2. Origin of the cold front
In Sect. 3.1 we have shown that A3558 hosts a cold front, mov-ing transonically with a Mach number M � 0.8. The metal
850 M. Rossetti et al.: XMM-Newton and Chandra observations of A3558
abundance profile across the brightness discontinuity is consis-tent with a smooth decreasing profile and with a small (30−40%)jump.
Several mechanism have been proposed in the literature forthe origin of cold fronts: they could be the remnant of a mergingsubcluster, as in A3667 (Vikhlinin et al. 2001), or the core of thecluster “sloshing” in the potential well, as in A1795 (Markevitchet al. 2001; Tittley & Henriksen 2005; Ascasibar & Markevitch2006).
If the cold front that we have detected is the remnant ofa subcluster that is falling on A3558 with a subsonic motion,we would expect to recognize also the parent cluster’s core, andthis is not clearly detected either in the X-rays or in the optical.To support this hypothesis we have to make one of two strongassumptions: either that the moving subcluster is superposed onthe line of sight to the core of the main cluster or that the maincluster core has been almost completely destroyed by the merg-ing subcluster. Moreover, since we do not observe a metalicitydiscontinuity across the cold front, we also have to assume thatthe metal abundance distribution of the subcluster must be simi-lar to that of the main cluster.
The other possible origin of the cold front is the “sloshing”scenario, which can describe two phenomena: the oscillation ofthe gas component of the core (Markevitch et al. 2001) and theoscillation of the whole core, dark matter and gas in responseto the off-axis merger between the cluster and a group, as sug-gested by Tittley & Henriksen (2005). Recently Ascasibar &Markevitch (2006) have shown that these two cases are not sep-arate, since a perturbation of the gravitational potential inducesmotion of the gas, which quickly decouples from its dark mat-ter component. However, we compare our results also with themodels of Markevitch et al. (2001) and of Tittley & Henriksen(2005), because they predict simpler observational properties,which can be more easily compared with real data.
In the model of Markevitch et al. (2001), the gas has decou-pled from its dark matter component and oscillates in the poten-tial well of the cluster. Since in A3558 the pressure peak of thecluster (i.e. the bottom of the potential well) coincides with thepeak of the surface brightness (i.e. the center of the gas cloud), aswe can see in Fig. 1, we conclude that, in this scenario, the mov-ing gas cloud is now in the center of its oscillation and thereforein the point of maximum velocity. This would also explain thehigh Mach number (M � 0.8), compared to other sloshing coldfronts (Markevitch et al. 2001).
If the sloshing is due to the oscillation of the gravitationalpotential (Tittley & Henriksen 2005), the coincidence betweenpressure and surface brightness is expected and we cannot deter-mine the position of the oscillating body with respect to the cen-ter of its oscillation. In their paper, Tittley & Henriksen (2005)highlight three main observational signatures of this kind of coldfront, but we could verify only the third (the gradients of com-pressed density must point through the center of the cluster) be-cause we detected only one cold front.
The environment of superclusters is ideal to observe thesloshing class of cold fronts, since the merging rate is higherthan in field clusters. We have identified two groups that maybe responsible for the perturbations in the potential well: the“subcluster” (if we interpret the anomalous SE sector as a merg-ing substructure as in Sect. 4.1.2) and the group SC 1327-312.In either case, to be responsible for the oscillation of the core,these structures must have already passed the point of closestencounter with A3558. It is difficult to suppose that the low-mass subcluster has already reached the point of closest en-counter with the core of A3558: we have to assume that it has
entered with a non-zero angle with respect to the plane of the skyand it is now behind or in front of the cluster. In this scenario,the core would have already completed half of its oscillation.A past closest approach between A3558 and SC 1327-312 seemsmore plausible. The group could have passed north of the clus-ter to reach its actual position. A similar scenario is proposed byBardelli et al. (1998): they suggest that A3558 and another clus-ter (whose remnants are A3562, SC 1329-313 and SC 1327-312)collided in the past.
It is difficult to compare our data more quantitatively with themodel proposed by Tittley & Henriksen (2005), because their re-sults are based only on two sets of simulations with fixed massratios (30:1 and 10:1) and none of our candidate groups hasa similar mass ratio with respect to A3558 (∼100:1 for the sub-cluster and ∼4:1 for SC 1327-312, Ettori et al. 1997). Moreover,as outlined by Ascasibar & Markevitch (2006), complex hydro-dynamic processes should be taken into account.
Comparing our results with the possible cold front modelsdoes not allow us to rule out completely any possible interpre-tation. However we prefer the “sloshing” model, since the inter-pretation of the cold front of A3558 as the remnant of a mergingsubcluster would require too much coincidence.
4.3. The global picture
In this section we attempt to develop a unified picture and tointerpret the dynamical state of the cluster. We have excludedthat the cluster is relaxed and we have shown that all the mainfeatures of the cluster are consequences of interaction. However,we still have to discriminate between two classes of mergingscenarios: one where the observed features are a direct effectof the interaction and the other where we see the consequenceof hydrodynamic processes that follow the perturbation of thegravitational potential.
A possible scenario is the infall of a subcluster, that hasentered A3558 from SE and is currently moving towards NW.This merging will produce, as direct effects, the cold front (sep-aration edge between the ICM of the subcluster and that ofthe main cluster) and the stripped tail. However, we calculated(Sect. 4.1.3) that a higher velocity would be required for thestripping to form the tail. Moreover, a subcluster falling in thepotential well of A3558 would have acquired a kinetic energymuch greater than the value that we derive from the velocity ofthe cold front. This “missing energy” should have been trans-formed into thermal energy, but we have no evidence of heat-ing. This merger should have produced disturbances visible inthe morphology of the cluster, while the presence of a largescale symmetry disfavors this scenario. We have already shown(Sect. 4.2) that the interpretation of the cold front as a mergingsubcluster would require too much coincidence: the superposi-tion between the subcluster and the core and similar metalicity.
The main features of A3558 can also be interpreted as an in-direct effect of an interaction. The “sloshing scenario” can ex-plain not only the cold front, but also the tail. As explained inAscasibar & Markevitch (2006) the cool gas would be displacedfrom the potential minimum and, because of the ram pressureof the surrounding gas, part of this cool gas would expand adia-batically and move outward. This scenario is consistent with theobserved large scale symmetry, whose center does not coincidewith the surface brightness peak. Finally the absence of currentstrong interactions with other structures can explain the lack ofextended radio emission and the presence of a sort of cool core.
Our analysis favors a scenario where the gravitational poten-tial of A3558 has recently been perturbed by a merger that has

M. Rossetti et al.: XMM-Newton and Chandra observations of A3558 851
induced oscillations of the core without destroying the structureof the cluster. A qualitative comparison between our data andthe simulations shows that hydrodynamic effects, such as thosedescribed in Ascasibar & Markevitch (2006), may indeed playan important role in the physics of the ICM.
5. Conclusions
Our analysis has shown that A3558 cannot be considered eithera relaxed cluster, even if it has a sort of “cool core” in its inner re-gions, or a merging one. It hosts a cold front, moving NW, whichis probably due to the oscillation of the gravitational potential.During these oscillations, hydrodynamic processes have pro-duced a “tail” of low-entropy, high-pressure and metal rich ICM.The lack of current strong interactions with other structures canexplain the absence of extended radio emission.
However, something has perturbed the dynamical state ofA3558. This “perturbing factor” is probably now outside A3558:a past merger with SC 1327-312 or with a more massive clusterwhose remnants are A3562, SC 1329-313 and SC 1327-312 (assuggested by Bardelli et al. 1998), may have perturbed the grav-itational potential. Indeed, in the processes related to the forma-tion of a “supercluster” structure (Akimoto et al. 2003), thereare frequent interactions that can have induced the “sloshing” ofthe core.
Acknowledgements. We thank the anonymous referee for useful suggestions.We thank M. Cappellari for providing the Voronoi 2D-binning method byCappellari and Copin (2003) and for useful suggestions on the application ofthe method to X-ray data. We thank S. Bardelli for providing optical data andS. Borgani for useful suggestions. M.R. is grateful for hospitality and supportfrom MPE in Garching. A.F. acknowledges support from BMBF/DLR undergrant 50 OR 0207 and MPG, and is grateful for hospitality from INAF-IASFin Milan. This paper is based on observations obtained with XMM-Newton,an ESA science mission with instruments and contributions directly fundedby ESA Member States and the USA (NASA). The XMM-Newton project issupported by the Bundesministerium für Wirtschaft und Technologie/DeutschesZentrum für Luft- und Raumfahrt (BMWI/DLR, FKZ 50 OX 0001), the Max-Planck Society and the Heidenhain-Stiftung, and also by PPARC, CEA, CNES,and ASI.
References
Akimoto, F., Kondou, K., Furuzawa, A., Tawara, Y., & Yamashita, K. 2003, ApJ,596, 170
Ascasibar, Y., & Markevitch, M. 2006, ApJ, submitted[arXiv:astro-ph/0603246]
Baldi, A., Molendi, S., Comastri, A., et al. 2002, ApJ, 564, 190Bardelli, S., Zucca, E., Vettolani, G., et al. 1994, MNRAS, 267, 665Bardelli, S., Pisani, A., Ramella, M., Zucca, E., & Zamorani, G. 1998, MNRAS,
300, 589Briel, U. G., Finoguenov, A., & Henry, J. P. 2004, A&A, 426, 1Cappellari, M., & Copin, Y. 2003, MNRAS, 342, 345De Grandi, S., & Molendi, S. 2001, ApJ, 551, 153Dupke, R., & White, R. E. 2003, ApJ, 583, L13Ettori, S., Fabian, A. C., & White, D. A. 1997, MNRAS, 289, 787Ettori, S., De Grandi, S., & Molendi, S. 2002, A&A, 391, 841Finoguenov, A., Böhringer, H., & Zhang, Y. 2005, A&A, 442, 827Ghizzardi, S., Molendi, S., Leccardi, A., & Rossetti, M. 2005
[arXiv:astro-ph/0511445]Hanami, H., Tsuru, T., Shimasaku, K., et al. 1999, ApJ, 521, 90Heinz, S., Churazov, E., Forman, W., Jones, C., & Briel, U. G. 2003, MNRAS,
346, 13Henry, J. P., Finoguenov, A., & Briel, U. G. 2004, ApJ, 615, 181Kull, A., & Böhringer, H. 1999, A&A, 341, 23Landau, L. D., & Lifshitz, E. M. 1959, Fluid mechanics, Course of theoretical
physics (Oxford: Pergamon Press)Mahdavi, A., Finoguenov, A., Böhringer, H., Geller, M. J., & Henry, J. P. 2005,
ApJ, 622, 187Markevitch, M., & Vikhlinin, A. 1997, ApJ, 474, 84Markevitch, M., Ponman, T. J., Nulsen, P. E. J., et al. 2000, ApJ, 541, 542Markevitch, M., Vikhlinin, A., & Mazzotta, P. 2001, ApJ, 562, L153Marty, P. B., Kneib, J. P., Sadat, R., Ebeling, H., & Smail, I. 2002, SPIE, 4851,
202 [arXiv:astro-ph/0209270]Mathiesen, B., Evrard, A. E., & Mohr, J. J. 1999, ApJ, 520, L21Metcalfe, N., Godwin, J. G., & Peach, J. V. 1994, MNRAS, 267, 431Neumann, D. M., Lumb, D. H., Pratt, G. W., & Briel, U. G. 2003, A&A, 400,
811Peres, C. B., Fabian, A. C., Edge, A. C., et al. 1998, MNRAS, 298, 416Shapley, H. 1930, Harvard College Observatory Bulletin, 874, 9Tittley, E. R., & Henriksen, M. 2005, ApJ, 618, 227Venturi, T., Bardelli, S., Morganti, R., & Hunstead, R. W. 2000, MNRAS, 314,
594Vikhlinin, A., Markevitch, M., & Murray, S. S. 2001, ApJ, 551, 160Zucca, E., Zamorani, G., Scaramella, R., & Vettolani, G. 1993, ApJ, 407, 470

M. Rossetti et al.: XMM-Newton and Chandra observations of A3558, Online Material p 1
Online Material
M. Rossetti et al.: XMM-Newton and Chandra observations of A3558, Online Material p 2
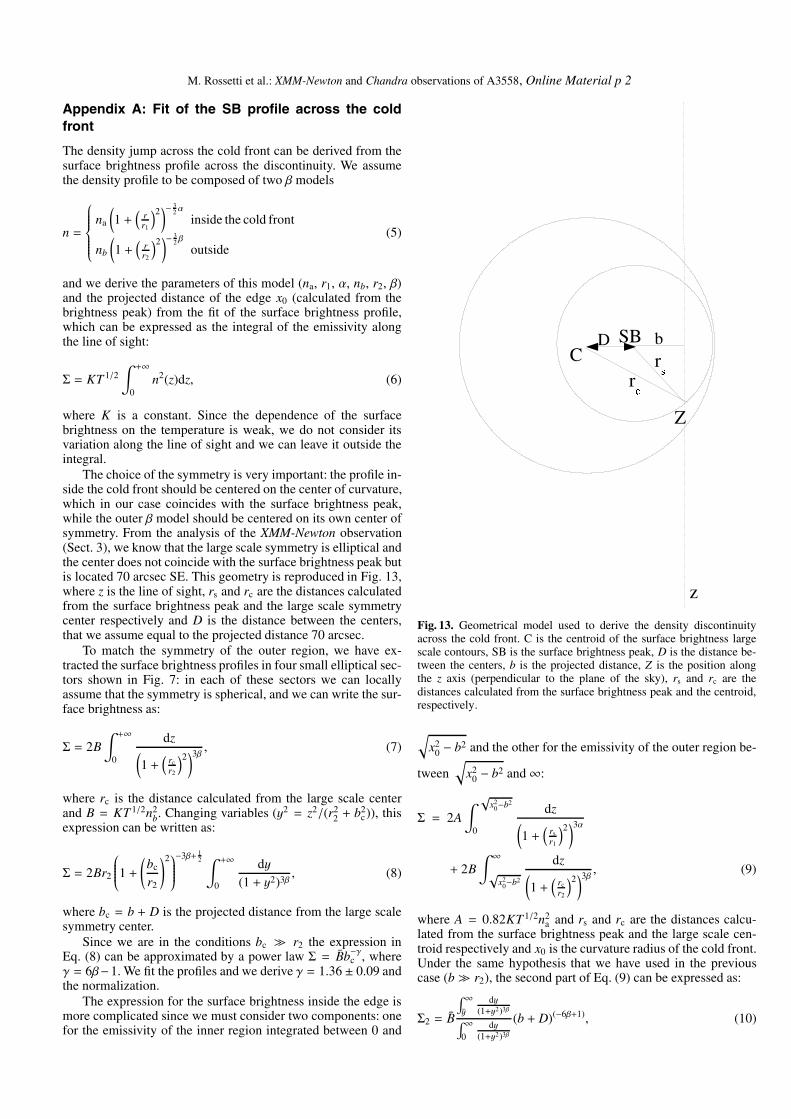
Appendix A: Fit of the SB profile across the coldfront
The density jump across the cold front can be derived from thesurface brightness profile across the discontinuity. We assumethe density profile to be composed of two β models
n =
⎧⎪⎪⎪⎪⎪⎨⎪⎪⎪⎪⎪⎩na
(1 +
(rr1
)2)− 3
2α
inside the cold front
nb
(1 +
(rr2
)2)− 3
2 β
outside(5)
and we derive the parameters of this model (na, r1, α, nb, r2, β)and the projected distance of the edge x0 (calculated from thebrightness peak) from the fit of the surface brightness profile,which can be expressed as the integral of the emissivity alongthe line of sight:
Σ = KT 1/2∫ +∞
0n2(z)dz, (6)
where K is a constant. Since the dependence of the surfacebrightness on the temperature is weak, we do not consider itsvariation along the line of sight and we can leave it outside theintegral.
The choice of the symmetry is very important: the profile in-side the cold front should be centered on the center of curvature,which in our case coincides with the surface brightness peak,while the outer β model should be centered on its own center ofsymmetry. From the analysis of the XMM-Newton observation(Sect. 3), we know that the large scale symmetry is elliptical andthe center does not coincide with the surface brightness peak butis located 70 arcsec SE. This geometry is reproduced in Fig. 13,where z is the line of sight, rs and rc are the distances calculatedfrom the surface brightness peak and the large scale symmetrycenter respectively and D is the distance between the centers,that we assume equal to the projected distance 70 arcsec.
To match the symmetry of the outer region, we have ex-tracted the surface brightness profiles in four small elliptical sec-tors shown in Fig. 7: in each of these sectors we can locallyassume that the symmetry is spherical, and we can write the sur-face brightness as:
Σ = 2B∫ +∞
0
dz(1 +
(rcr2
)2)3β, (7)
where rc is the distance calculated from the large scale centerand B = KT 1/2n2
b. Changing variables (y2 = z2/(r22 + b2
c)), thisexpression can be written as:
Σ = 2Br2
⎛⎜⎜⎜⎜⎜⎝1 +
(bc
r2
)2⎞⎟⎟⎟⎟⎟⎠−3β+ 1
2 ∫ +∞
0
dy(1 + y2)3β
, (8)
where bc = b + D is the projected distance from the large scalesymmetry center.
Since we are in the conditions bc r2 the expression inEq. (8) can be approximated by a power law Σ = Bb−γc , whereγ = 6β−1. We fit the profiles and we derive γ = 1.36 ± 0.09 andthe normalization.
The expression for the surface brightness inside the edge ismore complicated since we must consider two components: onefor the emissivity of the inner region integrated between 0 and
Fig. 13. Geometrical model used to derive the density discontinuityacross the cold front. C is the centroid of the surface brightness largescale contours, SB is the surface brightness peak, D is the distance be-tween the centers, b is the projected distance, Z is the position alongthe z axis (perpendicular to the plane of the sky), rs and rc are thedistances calculated from the surface brightness peak and the centroid,respectively.
√x2
0 − b2 and the other for the emissivity of the outer region be-
tween√
x20 − b2 and∞:
Σ = 2A∫ √x2
0−b2
0
dz(1 +
(rsr1
)2)3α
+ 2B∫ ∞√
x20−b2
dz(1 +
(rcr2
)2)3β, (9)
where A = 0.82KT 1/2n2a and rs and rc are the distances calcu-
lated from the surface brightness peak and the large scale cen-troid respectively and x0 is the curvature radius of the cold front.Under the same hypothesis that we have used in the previouscase (b r2), the second part of Eq. (9) can be expressed as:
Σ2 = B
∫ ∞y
dy(1+y2)3β∫ ∞
0dy
(1+y2)3β
(b + D)(−6β+1), (10)

M. Rossetti et al.: XMM-Newton and Chandra observations of A3558, Online Material p 3
where y =√
x20 − b2/(b+D) and b is the projected distance from
the surface brightness peak.The first term in Eq. (9) cannot be approximated with a
power law because we are not in the case b r1:
Σ1 = 2Ar1
⎛⎜⎜⎜⎜⎜⎝1 +(
br1
)2⎞⎟⎟⎟⎟⎟⎠−3α+ 1
2 ∫ (x20−b2
r21+b2
)1/2
0
dy(1 + y2)3α
·
Fitting the surface brightness profile in the inner region, ex-tracted in the spherical sector shown in Fig. 7, with the func-tion Σ = Σ1 + Σ2, leaving the parameters of Σ2 fixed to the bestfit value for the outer region, we derive the parameters na, r1and α. Evaluating the β model at r = 110 we derive the den-sity nin at the position of the discontinuity and the density jumpnin/nout = (1.43 ± 0.04). The best fit model for the density isshown in Fig. 8b.
Appendix B: The clumping test
To test if the observed excess could be due to clumping we haveextracted the spectra in the region where the surface brightnessexcess is greatest (the white circle in Fig. 5), and fitted it with atwo temperature model. To account for the projection effects wehad to assume some geometrical and physical conditions.
We consider two identical cylinders (Fig. 14) of radius R andheight h = 2R, with the bases perpendicular to the line of sight(the bases corresponds to the circles in Fig. 5: the white circle isthe base of cylinder 2 while the black one is that of cylinder 1).We assume that the cluster is spherically symmetric around thesurface brightness peak, with the only dishomogenity located incylinder 2 and filling its volume with a filling factor φ. The emis-sion in direction 1 is due to the homogeneous gas with density n1of cylinder 1 and to the gas on the line of sight with density ne(r):the XSPEC normalization of the mekal model that we have usedto fit the spectrum can be expressed as
N1 = 2k∫ ∞
h/2n2
e(r)Adr + kn21V, (11)
where A is the area of the base, V = Ah is the volume of thecylinder, k is the XSPEC constant
k =10−14
4π(Da(1 + z)2), (12)
and Da is the angular size distance to the source (cm). The valueof the gas density at b � 200 kpc, n1 = 7.52 × 10⁻⁴ cm−3, hasbeen derived from the deprojection in spherical sectors.
The emission of cylinder 2 has two thermal components: onedue to the clump with density nc and the other due to the ho-mogeneous gas with density n1, filling the remaining volume.The normalization due to this second component (N2) can beexpressed in terms of the normalization in direction 1, N1:
N2 = 2k∫ ∞
h/2n2
e(r)Adr + kn21(1 − φ)V = N1 − kn2
1φV. (13)
Fig. 14. Geometrical model adopted for the clumping test. R is the ra-dius of the circles from which we extract the spectra, h is the width ofthe region in which we assume there are clumps (along the line of sight),b and r are the projected and three-dimensional distances, respectively,calculated from the surface brightness peak.
We have fitted the spectrum from direction 2, with a two-temperature model varying the temperature of the “clump” com-ponent and its filling factor. The best fit combination of theseparameters, Tc = 3 keV and φ = 0.1, leads to a density in theclump which is about ten times higher than the density of theother component. Since the temperature ratio is much smaller(Tu/Tc = 1.97), the clump component is not in pressure equilib-rium with the surrounding medium. Even with greater filling fac-tors the pressure equilibrium can never be achieved, unless weforce the temperature to unrealistically low values which worsensignificantly the quality of the fit. This analysis indicates that thepressure enhancement observed in the ratio maps is not an arti-fact due to unresolved clumps and that it must have a physicalorigin.