a changing world: mexico facing the 21 century energy ... · sources: inegi; pemex, anuario...
TRANSCRIPT
A changing world: Mexico facing the 21st century
energy revolution
Interna

CONTENT:
1. Global Outlook of the Oil & Gas sector
2. International Lessons
3. Oil & Gas sector in Mexico today
4. Assessing Mexico’s potential
5. The sector we envision

GLOBAL OUTLOOK ON THE OIL & GAS SECTOR

OIL AND GAS WILL REMAIN THE BACKBONE OF GLOBAL ENERGY SUPPLY
• By 2030 oil & gas will still account for 54% of global energy supply
• Since 1980 proven oil reserves have grown by 142%
Source: BP, (2013) World Outlook 2030.
Total energy output by source, 1990-2030 Billion tonne of oil equivalent (Gtoe)
Renewables Coal Oil & Gas Nuclear

THE WORLD OF LARGE, EASY OIL FIELDS IS COMING TO AN END
DEEP WATERS UNCONVENTIONAL
REQUIRED INVESTMENT
HUMAN CAPITAL
EXPLORATION/PRODUCTION
EASY OIL NEW RESOURCES
• Future output will come primarily from projects with high marginal and sunk costs due to the geological and technical complexity of untapped reservoirs.
• The scale of new reservoirs will be much smaller tan that of 20th century reservoirs

WORLD HYDROCARBON POTENTIAL: USA AND CANADA AS NEW LEADERS RANKING OF REGIONS BY RESERVES OF CONVENTIONAL AND UNCONVENTIONAL RESOURCES (2011)
Source: IMCO with data from BP Statistical Review of World Energy 2012, World Energy Council, World Bank, Canadian Energy Research Institute
Europe
Mexico
South America
Africa
Middle East
Asia-Pacific
USA- Canada
Former Soviet Union
Conventional oil & gas Conventional oil & gas + Unconventional

HUMAN CAPITAL AND TECHNOLOGY AS THE KEY TO SUCCESS
INNOVATION
PATENTS 2011
540
22
Source: Lecture by Dr. Pedro Silva, “Desarrollo Técnico y Tecnológico en Pemex Exploración y Producción”, August 2012

USA IS THE NEW ARABIA
• Unconventional oil & gas have changed the landscape of the industry
• North America (excl.
Mexico) now has the largest potential of any región
• Technology has
shattered the traditional paradigm of the oil & gas sector. It holds the key to future growth.
Source: EIA, available at: http://www.eia.gov/pub/oil_gas/natural_gas/analysis_publications/maps/maps.htm

INTERNATIONAL LESSONS

SAUDI ARABIA: PRIVATE INVESTMENT IN REFINING, PETROCHEMICAL INDUSTRY AND GAS SHALE
• Private investment in downstream (oil refining, petrochemical
industry) • Since 2003 allowed foreign investment in gas exploration • Shell, Eni, Repsol, Sinopec, Lukoil signed deals to explore for gas
with Saudi Aramco
SAUDI ARAMCO REFINING CAPACITY (1000 OF DAILY BARRELS) 1,002
1,005 2,012
Domestic jointventures
Internationaljoint ventures
Operaciónexclusiva SaudiAramco
Fuente: Saudi Aramco, Annual Review 2011

CUBA: PRAGMATIC ENERGY OUTLOOK VS POLITICAL IDEOLOGY
• Participation of several foreign oil firms • Risk contracts • Block allocation: 43 inland and 59
offshore (Exclusive Economic Zone)
Source: Institute of Americas, Jorge Piñón, 2011 & Nenurkar, Neelesh et al., 2011, Cuba’s Offshore Oil Development: Background and U.S. Policy Considerations, Congressional Research Service
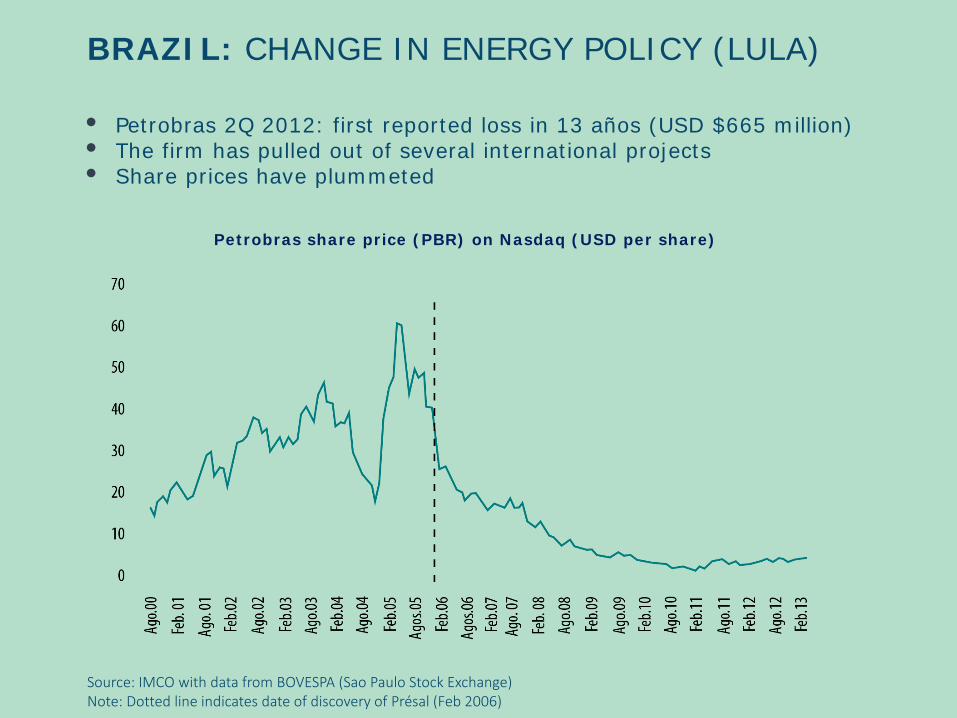
• Petrobras 2Q 2012: first reported loss in 13 años (USD $665 million) • The firm has pulled out of several international projects • Share prices have plummeted
Source: IMCO with data from BOVESPA (Sao Paulo Stock Exchange) Note: Dotted line indicates date of discovery of Présal (Feb 2006)
Petrobras share price (PBR) on Nasdaq (USD per share)
BRAZIL: CHANGE IN ENERGY POLICY (LULA)

NORWAY: OIL RENT MANAGEMENT WITH AN INTERGENERATIONAL OUTLOOK
• NORWAY OIL RENT IS REVERSED IN A SOVEREIGN INVESTMENT FUND WHICH IS EQUIVALENT TO 1.47 TIMES THE NORWEGIAN GDP
• GOV´T MAY USE ONLY THE FUND INTEREST
Source: IMCO with data from World Bank and Sovereign Wealth Fund Institute
GOVERNMENT PENSION FUND (1.15% DEL PIB GLOBAL)
737 BILLION DOLLARS
500 BILLION DOLLARS
GOVERNMENT PENSION FUND (2012)
NORWEGIAN GDP (2012)

NORWAY: INCREASED EXPLORATION UNDER OPEN MARKET CUMULATIVE GROWTH IN RESERVES AND MAIN DISCOVERIES*
PROVEN RESERVES AND RESOURCES Billion barrels of oil equivalent
DIFFERENCE BETWEEN AN OPEN MARKET AND CLOSED ONE
Increase in execution
Number of discoveries *From opening-up of sector Source: Wood Mackenzie

COLOMBIA: MODEL OF EFFECTIVE REGULATION AND SEVERAL OPERATING COMPANIES
• 2005-2011: oil output rose 73%
SHARE OF TOTAL OIL OUTPUT IN 2011, BY FIRM (%)
Source: IMCO with data from Ecopetrol, Informe Estadístico Petrolero 2012

COLOMBIA Stock-market performance of Ecopetrol vs Petrobras
Source: www.marketwatch.com

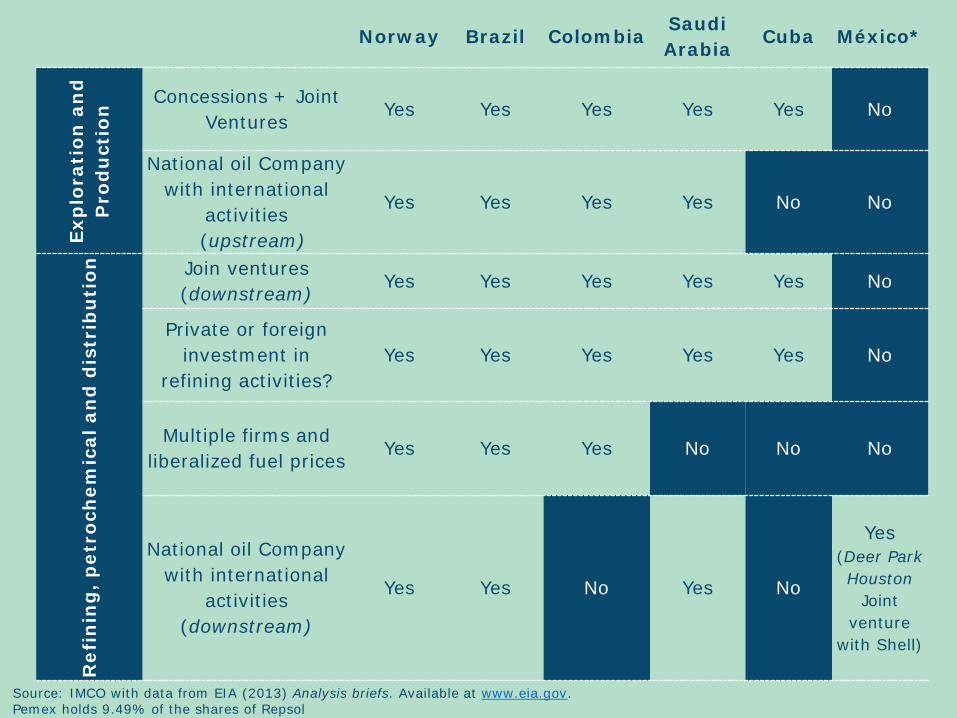
MEXICO IS THE ONLY COUNTRY WHERE A NATIONAL OIL COMPANY HOLDS A MONOPOLY OVER THE ENTIRE VALUE CHAIN OF THE OIL & GAS SECTOR
Norway Brazil Colombia Saudi Arabia
Cuba México*
Exp
lora
tion
an
d
Pro
du
ctio
n Concessions + Joint
Ventures Yes Yes Yes Yes Yes No
National oil Company with international
activities (upstream)
Yes Yes Yes Yes No No
Ref
inin
g, p
etro
chem
ical
an
d d
istr
ibu
tion
Join ventures (downstream)
Yes Yes Yes Yes Yes No
Private or foreign investment in
refining activities? Yes Yes Yes Yes Yes No
Multiple firms and liberalized fuel prices
Yes Yes Yes No No No
National oil Company with international
activities (downstream)
Yes Yes No Yes No
Yes (Deer Park Houston
Joint venture
with Shell)
Source: IMCO with data from EIA (2013) Analysis briefs. Available at www.eia.gov. Pemex holds 9.49% of the shares of Repsol
OIL & GAS SECTOR IN MEXICO

PROVEN RESERVES HAVE DECREASED 41% SINCE 2001
Note: Reserves are classified as: Proven=1P; Proven+Probable =2P; Proven+ Probable+Possible=3P= Total reserves. Source: Pemex, Anuario estadístico 2012
Proven Probable Possible
Volum
e of
oil re
serve
s /
Billio
n bar
rels
of oi
l equ
ivalen
t

RESERVE-REPLACEMENT RATIO HAS IMPROVED STEADILY IN RECENT YEARS AND REACHED 100% IN 2011 FOR THE FIRST TIME SINCE THE DISCOVERY OF CANTARELL
Source: PEMEX, Anuario estadístico 2012 * BOE : Barrel of Oil Equivalent
Oil output Reserve replacement
Reserve-replacement ratio (%)
Out
put
and
rese
rve
repl
acem
ent
(B
n BO
E*)

MEXICO’S PROVEN RESERVES ARE MOSTLY IN FIELDS OF HIGH TECHNICAL COMPLEXITY
Source: PEMEX, Reservas de México 2012 *Reserves as of Dec 31, 2011
7,564
6,246 Less complex reservoirs (45%)
13.810
Reservoirs of high technical complexity (55%)
Proven reserves (1P) 2011* (Billionn Barrels of Oil Equivalent)

Fields of high technical complexity
2,342
3,797
743 294
388
Burgos 8.2 Low ratio price/cost
Poza Rica- Altamira 26.8 Mature fields
Chicontepec 18.9 Low productivity of formations
KU-MA_ZA 4.6 Heavy and Ultra-heavy oil
Cantarell 8 Secondary & Improved Recovery
Field
Production cost 2011 (USD/toe) Complexity
Average Pemex E&P:
6.1
55%
Source: PEMEX, Reservas de México 2012 *Reserves as of Dec 31, 2011
Proven reserves (1P) 2011* (Billionn Barrels of Oil Equivalent)
MEXICO’S PROVEN RESERVES ARE MOSTLY IN FIELDS OF HIGH TECHNICAL COMPLEXITY

DEPLETION OF CANTARELL COULD NOT BE OFFSET BY THE INCREASE IN OUTPUT OF KU-MA-ZA AND TABASCO SHORE
Oil o
utput
Barre
ls/da
y (10
00s)
Source: PEMEX, Producción por Activo

GAS OUTPUT IN DECLINE SINCE 2009 DUE TO DEPLETION OF CANTARELL, LACK OF INVESTMENT IN BURGOS AND LOW RESERVE REPLACEMENT RATIO IN VERACRUZ
Output of gas fields Million Standard Cubic Feet per Day
Source: National Hydrocarbon Commission (CNH) Does not include Nitrogen. Output per project

DOMESTIC CONSUMPTION OF DRY NATURAL GAS IS GROWING AT 6% A YEAR DUE TO DEMAND FROM ELECTRICITY GENERATION, PEMEX AND THE INDUSTRIAL SECTOR Dry natural gas: domestic supply vs demand Billion Standard Cubic Feet
7.4
3.4
2.2
0.9
2011
7.9
2009
3.1
1.1
2010
7.8
3.6
2008
3.3
7.2
2.3
1.2
0.8 2.8
1.0
2007
7.0
3.2
2.6
1.0
2006
6.5
3.0
2.4
1.0
2005
5.9
2.8
2.0
0.9
2004
5.7
2.6
2.1
1.0
2003
5.3
2.4
1.8
0.9
2002
4.9
2.3
1.5
1.0
2001
4.4
1.1
2.9
3.7
Oil sector
Electricity generation Industrial demand Residential demand and services* Supply of dry natural gas
Source: Ministry of Energy (SENER), Prospectiva de Gas Natural 2012. *Including Transport
+80%

873
1,749
0200400600800
1,0001,2001,4001,6001,8002,000
2011 2010 2009 2008 2007 2006 2005 2004 2003 2002 2001
Imports
Stagnated natural gas
supply
Quickly growing demand
Inadequate import
infrastructure
Risk and vulnerability of
supply
SINCE 2005 NATURAL GAS IMPORTS HAVE GROWN BY 100% DUE TO DOMESTIC MARKET IMBALANCES. BUT IMPORT INFRASTRUCTURE IS LIMITED AND UNDER STRAIN.
Dry natural gas imports Million Standard Cubic Feet
Source: EIA

INVESTMENT HAS GROWN, ESPECIALLY IN E&P. BUT IT IS STILL NOT ENOUGH TO BRING OUTPUT BACK TO 3 MILLION BARRELS A DAY (B/D). Investment Billion dollars
Source: PEMEX, Anuario estadístico de PEMEX 2012 and SEC, 20-F

Cumulative investment in portfolio
Cumulative profitability of investment portfolio
+
+ Upstream (E&P projects)
R= Budgetary restriction
R
Mid- and Downstream projects (e.g. oil
refining, petrochemical)
Projects without funding
IN A SCENARIO OF LIMITED INVESTMENT FUNDS, UPSTREAM PROJECTS (I.E. E&P) CAPTURE THE MAJORITY OF FUNDS SINCE THEY ARE THE MOST PROFITABLE
Conceptual

2008 2009 2010 2011 P
832
581
1,413
976
583
1,559
1,034
677
1,711
1,278
772
2,050
1,454
547
2,000
1,426
654
2,080
1,444
1,133
2003
382
1,270
989
294
796 696
2005 2006 2002
474
2004
751
2007
876
2,320
Billion Mexican Pesos (MXN)
Other revenues Revenue from PEMEX
Federal Government revenues
Sources: INEGI; PEMEX, Anuario Estadístico 2012.
PEMEX PROVIDES ABOUT 35% OF TOTAL FEDERAL REVENUES EACH YEAR
30 34 37 41 37 40 38 27 31 38
PEMEX as % of total revenues

Billion Constant Pesos (2011)
Source: PEMEX, Memoria de Labores
2002-2011: EACH PESO SPENT ON PEMEX (INVESTMENT AND RUNNING COSTS) PROVIDES A RETURN OF 2.5 PESOS THROUGH TAXES AND OTHER FISCAL REVENUES
Investment and operating costs versus fiscal revenues
The ratio has been 1.7 since 2009
294
382
474
581 583
677
772
547
654
876
152 157 205 193 200 204 207
374 388 418
2002 2003 2004 2005 2006 2007 2008 2009 2010 2011
PEMEX costs + investment Total taxes paid by PEMEX

IN 2012 PEMEX POSTED MXN 121 BILLION LOSS, AFTER PAYING MXN 907 BILLION IN TAXES
Figures in MXN billions Net balance by subsidiary, 2012*
Source: PEMEX 20-F SEC * After taxes

ASSESSING MEXICO’S POTENTIAL

MEXICO’S POTENTIAL IS VAST (MATURE FIELDS, DEEPWATER, SHALE). NO SINGLE FIRM CAN EXPLOIT IT ON ITS OWN.
Potential (reserves & prospective resources) Million barrels of oil equivalent (boe)
Source: IMCO with data from PEMEX (PEP), 2012
Overall potential
Unconventional prospective resources (shale oil & gas)
Conventional prospective resources (land and Gulf of Mexico)
Total reserves

MEXICO NEEDS A NEW MODEL
-
500
1,000
1,500
2,000
2,500
3,000
3,500
4,000
1938
1942
1946
1950
1954
1958
1962
1966
1970
1974
1978
1982
1986
1990
1994
1998
2002
2006
2010
Daily
bar
rels,
100
0s
Oil output in Mexico, 1938-2011
0500
1,0001,5002,0002,5003,0003,500
KMZ Cantarell
Litoral de Tabasco Abkatún-Pol Chuc
Samaria-Luna
• Five projects account for over 80% of national output • Oil output has fallen by about 800,000 b/d since 2004 • Declining production portfolio operating costs on the rise • New discoveries are smaller and more expensive to develop
Source: PEMEX

INVESTMENTS REQUIRED TO DEVELOP EXISTING OPPORTUNITIES FAR EXCEED PEMEX’S BUDGET AS WELL AS ITS PROJECT EXECUTION CAPABILITIES
Source: IMCO estimate. Please refer to methodological for further information.
ESTIMATED OF INVESTMENT REQUIRED USD billion
*Pemex investment Budget 2013
PEMEX TAKE MORE THAN 30 YEARS

THE SECTOR WE ENVISION
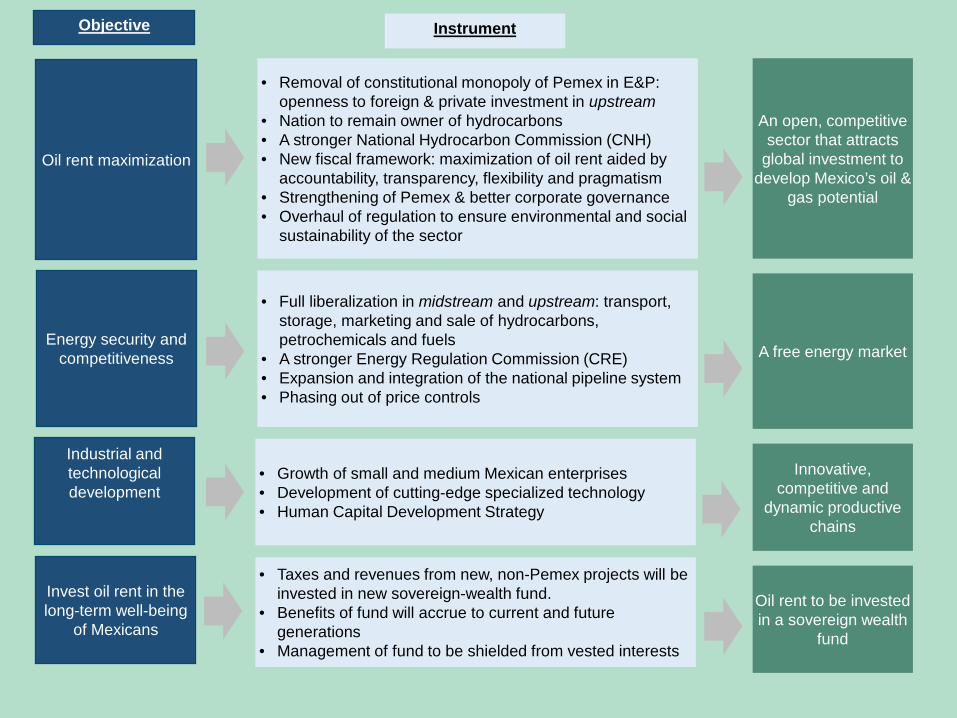
Energy security and competitiveness
Oil rent maximization
Industrial and technological development
Invest oil rent in the long-term well-being
of Mexicans
A free energy market
An open, competitive sector that attracts
global investment to develop Mexico’s oil &
gas potential
Innovative, competitive and
dynamic productive chains
Oil rent to be invested in a sovereign wealth
fund
• Full liberalization in midstream and upstream: transport, storage, marketing and sale of hydrocarbons, petrochemicals and fuels
• A stronger Energy Regulation Commission (CRE) • Expansion and integration of the national pipeline system • Phasing out of price controls
• Removal of constitutional monopoly of Pemex in E&P: openness to foreign & private investment in upstream
• Nation to remain owner of hydrocarbons • A stronger National Hydrocarbon Commission (CNH) • New fiscal framework: maximization of oil rent aided by
accountability, transparency, flexibility and pragmatism • Strengthening of Pemex & better corporate governance • Overhaul of regulation to ensure environmental and social
sustainability of the sector
• Growth of small and medium Mexican enterprises • Development of cutting-edge specialized technology • Human Capital Development Strategy
• Taxes and revenues from new, non-Pemex projects will be invested in new sovereign-wealth fund.
• Benefits of fund will accrue to current and future generations
• Management of fund to be shielded from vested interests
Objective Instrument

@imcomx
www.imco.org.mx
facebook.com/IMCOmx
#ReformaEnergética