a case study jake blanchard spring 2010 uncertainty analysis for engineers1
TRANSCRIPT

Uncertainty Analysis for Engineers 1
A Case StudyJake BlanchardSpring 2010

Uncertainty Analysis for Engineers 2
IntroductionThese slides contain a
description of a case study of an uncertainty analysis
You should use this as a model for your final projects

Uncertainty Analysis for Engineers 3
The CaseWe are concerned with widget productionThe question is how many widgets should we
produce in order to maximize profitAssume you are a manufacturer of widgets,
which are purchased seasonallyFixed production costs are $40,000 per yearThe unit cost varies between $2,000 and $2,400
above the fixed costs, depending on the year. Demand typically fluctuates from 30 to 50 units
per year. The off-season sales price is $500 each for the
first ten units and between 0 and $500 for the remainder.
The sales price is fixed at $8,000 per unit.

Uncertainty Analysis for Engineers 4
VariablesP=profitM=# manufacturedD=demandS=in-season salesUP=unit priceUC=unit costTO=total off-season revenueOff=off-season price (first 10)OffExtra=price for rest of widgetsI=inventory (M-S)F=fixed costTC=total costR=revenue

Uncertainty Analysis for Engineers 5
AlgorithmP=R-TCTC=F+UC*MR=UP*S+TOI=M-D
10*)10(*10
100*
00
IOffExtraIOff
IOffI
I
TOff
MDM
MDD
S
Uncertainty Analysis for Engineers 6
Input DistributionsTo start, assume all distributions
are uniform, with the limits defined on the previous slide
Also consider the case where the distributions are normal, with the same means and variances as the uniform distributions

Uncertainty Analysis for Engineers 7
AnalysisWhat is profit, assuming all
variables are at their mean (this is first order approximation of the mean)?
What is first order estimate of variance?
What is sensitivity for all random inputs?
Plot histogram for profit.Plot histogram for normal
distributions.

Uncertainty Analysis for Engineers 8
First Order Estimate of ProfitPutting in all mean values and
setting M=40 gives a profit of $192,000
If we vary M, the first order estimate of the mean profit is
20 25 30 35 40 45 50 55 600.6
0.8
1
1.2
1.4
1.6
1.8
2x 10
5
Number of Widgets Manufactured
Firs
t O
rder
Est
imat
e of
Pro
fit

Uncertainty Analysis for Engineers 9
First Order Estimate of VarianceFor M=40-, variance is estimated
to be 2.1e7 $2
For M=40+, variance is estimated to be 1.9e9 $2

Uncertainty Analysis for Engineers 10
Sensitivity
1010
100
10
100
00
II
I
dOffExtra
dP
IOffExtraUP
IOffUP
I
dD
dP
MdUC
dP
Uncertainty Analysis for Engineers 11
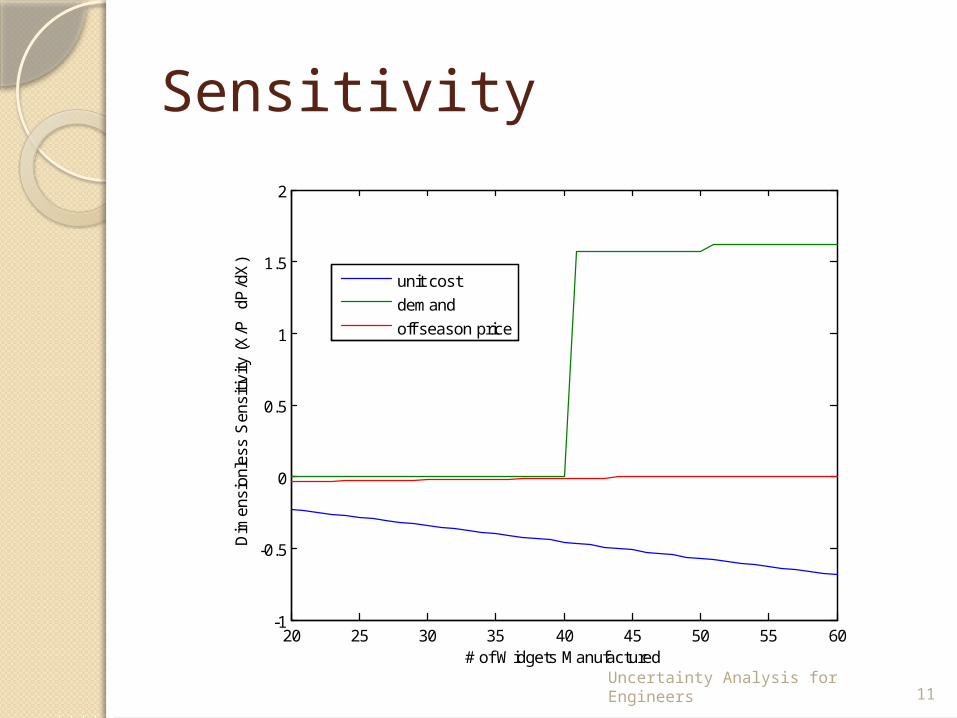
Sensitivity
20 25 30 35 40 45 50 55 60-1
-0.5
0
0.5
1
1.5
2
# of Widgets Manufactured
Dim
ensi
onle
ss S
ensi
tivity
(X
/P
dP/d
X)
unit cost
demand
off season price

Uncertainty Analysis for Engineers 12
Results for M=40Mean Profit from MC is $170,000,
compared to $190,000 first order estimate
Mean variance from MC is 6.6e8, compared to estimates of 2.1e7 below 40 and 1.9e9 above 40

Uncertainty Analysis for Engineers 13
Profit Histograms – M=30
1.28 1.3 1.32 1.34 1.36 1.38 1.4
x 105
0
0.5
1
1.5
2
2.5
3x 10
4
Profit ($)

Uncertainty Analysis for Engineers 14
Profit Histograms – M=40
1 1.1 1.2 1.3 1.4 1.5 1.6 1.7 1.8 1.9 2
x 105
0
1
2
3
4
5
6
7
8
9x 10
4
Profit ($)

Uncertainty Analysis for Engineers 15
Profit Histograms – M=50
0.8 1 1.2 1.4 1.6 1.8 2 2.2 2.4 2.6
x 105
0
0.5
1
1.5
2
2.5
3x 10
4
Profit ($)

Uncertainty Analysis for Engineers 16
Mean Profit vs. M
20 25 30 35 40 45 50 55 600.6
0.8
1
1.2
1.4
1.6
1.8x 10
5
# of Widgets Manufactured
Pro
fit (
$)

Uncertainty Analysis for Engineers 17
Normal DistributionsNow repeat for normal
distributions

Uncertainty Analysis for Engineers 18
Results for M=40Mean Profit from MC is $175,000,
compared to $190,000 first order estimate (Unif dist gave $170,000)
Mean variance from MC is 6.64e8, compared to estimates of 2.1e7 below 40 and 1.9e9 above 40 (Unif Dist gave 6.6e8)

Uncertainty Analysis for Engineers 19
Profit Histograms – M=30
0 2 4 6 8 10 12 14 16
x 104
0
0.5
1
1.5
2
2.5
3
3.5
4x 10
5
Profit ($)
1.28 1.3 1.32 1.34 1.36 1.38 1.4
x 105
0
0.5
1
1.5
2
2.5
3x 10
4
Profit ($)

Uncertainty Analysis for Engineers 20
Profit Histograms – M=40
-0.5 0 0.5 1 1.5 2 2.5
x 105
0
0.5
1
1.5
2
2.5x 10
5
Profit ($)
1 1.1 1.2 1.3 1.4 1.5 1.6 1.7 1.8 1.9 2
x 105
0
1
2
3
4
5
6
7
8
9x 10
4
Profit ($)

Uncertainty Analysis for Engineers 21
Profit Histograms – M=50
-0.5 0 0.5 1 1.5 2 2.5 3
x 105
0
1
2
3
4
5
6
7
8x 10
4
Profit ($)
0.8 1 1.2 1.4 1.6 1.8 2 2.2 2.4 2.6
x 105
0
0.5
1
1.5
2
2.5
3x 10
4
Profit ($)

Uncertainty Analysis for Engineers 22
Mean Profit vs. MNo change in this plot

Uncertainty Analysis for Engineers 23
DecisionHow many widgets should we
manufacture?