a case study. and length of stay in a special library 134
TRANSCRIPT

10 THE SCIENCE OF DESIGN BULLETIN OF JSSD Vol. xx No.x 20xx
and Length of Stay in a Special Library:A Case Study. Annuals of Library Science and Documentation. 36(4), 134-138.
13. .McAndrew, F.T. (1993). Environmental Psychology. California: Brooks/Cole Publishing Company.
14.Reed, S. K. (1988). Cognition:Theory and Applications. Pacific Grove, Ca., Brooks/Cole, 5.
15.Allen, G. L. (2003). Functional families of spatial abilities: Poor relations and rich prospects. International Journal of Testing, 3(3), 251-262.
16.McGee, M. G.. (1979a). Human spatial abilities: Psychomertic studies and environmental, genetic, hormonal, and neurological influences. Psychological-Bulletin, 86 (5), 889-918.
17.Evans, G. Fellows J., Zorn, M., & Doty, K. (1980). Cognitive mapping and architecture. Journal of Applied Psychology, 65(4), 474-478.
18.Ingwersen, P. (1982). Research procedures in the library: Analyzed from the cognitive point of view. Journal of Documentation, 38(4), pp. 165-191.
19.Carroll, J. B. (1993). Human cognitive abilities : A survey of factor-analytic studies. New York : Cambridge University Press.
20.Hillier. (1984) The Social Logic of Space. Cambridge University Press, Cambridge.
21.Hillier, Bill et. al. (1987). Ideas Are In Things: an application of the space syntax method to discovering house genotypes. Environment and Planning B: Planning and Design, vol.14.
22.B. Hillier. (1996). Space Is The Machine. Cambridge University Press, Cambridge.
23.Simon chih-feng SHU. (2000). Housing Layout and Crime Vulnerability. Urban Design International, Stockton Press, Houndmills, Basingstoke, UK.
24.Decio,G.R.Carugati(1998).From Kitchen to Kitchen, Electa, Milan Elemond Editori Associati.
25.Nai-An Chu (2007), From requirements to design (Donald C.Gause & Gerald M. Weinberg),Taipei:EcoTrend。(in Chinese)
26.Li-Lin Hsieh (1998), Kitchen space design (Johnny Grey),Taipei:Bacon cultural undertakings, Ltd. (in Chinese)
1
EVENT-RELATED POTENTIAL (ERP) STUDY OF USERS’ INCONGRUITY EFFECT TO EMOTIONAL DESIGN
Yu-Min Fang*, Ming-Huang Lin**
* Department of Industrial Design, National United University, 1 Lien-Da Road, Miao-Li 360, Taiwan ** Institute of Applied Arts, National Chiao Tung University, 1001 Ta-Hsueh Road, Hsinchu 300, Taiwan
Abstract: While practicing emotional design, usually experts suggest that the surprising and contradiction is a prelude to evoke users’ positive emotion associated with humor. In this study, the scientific experiments were implemented to examine the event-related potential (ERP) brainwave signal as well as “incongruity” condition. The analysis was carried out to the specific ERP components – N270 and N400. N270 is an endogenous ERP component of conflict effect; the N400 associated with the emotion of confusion. This experiment presented the stimuli with the combination of coherent/contradiction conditions and humor/neutral attributes, and recorded the ERP signal to detect brainwave variations. By analyzing these two components at medial part scalp sites – Fz, Cz, and Pz, the result evidenced that the humor products with contradiction condition did evoke greater brainwave amplitude, and correspond to the experts’ design guidelines. Key words: emotional design; incongruity effect; humor design; event-related potential (ERP)
1. Introduction In the consumer market with intense competition, most
basic product functions have been fulfilled because of the long-developed and matured technology. According to the relevant studies of observing the shopping behavior, nowadays the consumers seek the merchandise generally not only based on their rational consideration on the functionality, but also another important factors. In the well-known book “Designing Pleasurable Products”, Jordan indicated that an appreciation of pleasure in product use is fast becoming of primary importance to both consumer and the design industry alike [1]. Consumers demand functionality, expect usability and are seeking products that elicit more abstract feelings, such as reflected status, or giving pleasure. Therefore, designers find that consumers’ emotional interaction with products is playing an important role to affect the preference of the products. More and more designers reverse their interest to creating products with emotional interpretation and make use of meaningful expression to create humor and stimulate the interaction between the consumers and designed products [2].
While practicing emotional design, usually experts suggest that the surprising and contradiction is a prelude to evoking humor. The related studies also suggested that some incongruity situations must be detected before humor can be comprehended [3] [4]. Though these claims correspond to the experts’ suggestion and are widely acknowledged, few scientific analyses and confirmations have been carried out to verify these common rules. Accordingly this research tries to explore the following questions: (1) Should the surprising and contradiction be the necessary condition to evoke humor as the specialists’ claim? (2) Incongruity condition had been verified on textual and verbal materials, could this effect be found in product design? (3) Can we apply scientific instrument to examine these design guidelines?
2. Literature Review 2.1 Emotional Design and Humor Product
More researches related to emotional design were popular in design field in recent years. Norman (2002) indicated that emotion and affect changes the operating
89 THE SC IENCE OF DES IGN BULLET I N OF JSSD Vol. 62 No. 1 2015
Original papersReceived August 6, 2014; Accepted December 20, 2014
Copyright © 2012 日本デザイン学会 All Rights Reserved.

2
parameters of cognition [5]. Products designed for more relaxed, pleasant occasions can enhance their usability through pleasant, aesthetic design. Therefor, products designed for emotional factor are more essential; and emotion and affect have become important integration factor to create the users’ interaction with products in daily life [6]. Jordan also identifies four types of human pleasures – physio, socio, psycho, and ideo pleasure. He also claims that success in the marketplace is dependent on connecting with users in one or more of these ways [1].
Fornari indicated that choices in everyday life are dominated by emotion [7]; Winnicott (1971) confirmed that even the adult need playful objects, as the fulfillments of the memory of the happiness and satisfaction in childhood [8]. Alberto Alessi, the CEO of ALESSI, said that in the deep side of our heart, we need naive, childish, and uncomplicated things to make us released and experience pleasure [7] [9].
2.2 Incongruity Theory
Norman(2004)indicated that people tend to pay less attention to familiar things; and scientists have shown that the biggest responses always come with the least expected event [10]. Surprise means that a situation is not as anticipated, or what happens is not what is expected. To look at design from this point, the positive effect of surprise possesses its advantage.
Cognitive humor theories have in common that they postulate the detection or perception of an incongruity – a disproportion, disagreement or discrepancy between elements in the joke – which forms the basis of any kind of humorous experience to be essential for experiencing humor [4] [11-13]. According to Shultz (1976) there is a conflict between what is expected, and what actually occurs (incongruity or punch line) [11]. In other words: humor involves bringing together two normally disparate ideas, concepts, or situations in a surprising or unexpected manner [12, 13]. McGhee (1979) identified four attributes of incongruity – Absurd, unexpected, inappropriate, out-of-context events [14]. Therefore, incongruity is often described to be a necessary (but probably not sufficient) element that potentially funny stimuli have in common [12, 13].
This study focused on the evidence of incongruity conditions in humor products. Since incongruity is probably not sufficient element for humor, the limitation of this study needed to be discussed. According to “Incongruity -
Resolution” theory, after successfully evoked incongruity condition, there are resolution processes needed to be fulfilled [4, 15]. That is, the incongruity should to be resolved and then humor can be comprehended. But restricted by the limited scope of this study, the second cognitive process “Resolution” is suggested to be further examined by other researchers.
3. Research Method 3.1 The Measurement Methods and Enhancements
In the design studies, the popular method of measuring subjects’ respond toward the products (objects) or images is applying adjective descriptions of the semantic differences (SD) and further to the multidimensional scale (MDS), for example, the numerous researches into Kansei Engineering in Japan [16], and the research in multidimensional space [17,18]. Though the current measurement has achieved fruitful results, ERP (event-related potential) method might be useful to enhance the reliability and accuracy of current measurement. The ERP signal can measure the objective psychological response, and can be borrowed as a new tool for design assessment. Different from the questionnaires, ERP can detect subjects’ initial and earliest response. By asking subjects to watch the guiding words and product images, brainwave variations can be recorded. The data of inattentive subjects or false response can be excluded via examining the waveform [2, 19].
3.2 The ERP Method and the Selection of Brainwave Components
ERPs are voltage fluctuations that are associated in time with some physical or mental occurrence, and can provide important information about how the human brain normally processes information [20]. These potentials can be recorded from the human scalp (Figure 1) and extracted from the ongoing electroencephalogram (EEG, Figure 2) by means of filtering and signal averaging. Generally ERP recording instrument includes an elastic fabric head cap with sintered electrodes, a monopolar digital amplifier, and acquisition and analysis software for processing and analyzing ERP data. In this study, the stimuli (instructional phases and product images) were uploaded in the visual image display software, and the display time, interval, and sequence were determined.
90 B U L L E T I N OF JSSD Vol. 62 No. 1 2015 THE SC IENCE OF DES IGN

2
parameters of cognition [5]. Products designed for more relaxed, pleasant occasions can enhance their usability through pleasant, aesthetic design. Therefor, products designed for emotional factor are more essential; and emotion and affect have become important integration factor to create the users’ interaction with products in daily life [6]. Jordan also identifies four types of human pleasures – physio, socio, psycho, and ideo pleasure. He also claims that success in the marketplace is dependent on connecting with users in one or more of these ways [1].
Fornari indicated that choices in everyday life are dominated by emotion [7]; Winnicott (1971) confirmed that even the adult need playful objects, as the fulfillments of the memory of the happiness and satisfaction in childhood [8]. Alberto Alessi, the CEO of ALESSI, said that in the deep side of our heart, we need naive, childish, and uncomplicated things to make us released and experience pleasure [7] [9].
2.2 Incongruity Theory
Norman(2004)indicated that people tend to pay less attention to familiar things; and scientists have shown that the biggest responses always come with the least expected event [10]. Surprise means that a situation is not as anticipated, or what happens is not what is expected. To look at design from this point, the positive effect of surprise possesses its advantage.
Cognitive humor theories have in common that they postulate the detection or perception of an incongruity – a disproportion, disagreement or discrepancy between elements in the joke – which forms the basis of any kind of humorous experience to be essential for experiencing humor [4] [11-13]. According to Shultz (1976) there is a conflict between what is expected, and what actually occurs (incongruity or punch line) [11]. In other words: humor involves bringing together two normally disparate ideas, concepts, or situations in a surprising or unexpected manner [12, 13]. McGhee (1979) identified four attributes of incongruity – Absurd, unexpected, inappropriate, out-of-context events [14]. Therefore, incongruity is often described to be a necessary (but probably not sufficient) element that potentially funny stimuli have in common [12, 13].
This study focused on the evidence of incongruity conditions in humor products. Since incongruity is probably not sufficient element for humor, the limitation of this study needed to be discussed. According to “Incongruity -
Resolution” theory, after successfully evoked incongruity condition, there are resolution processes needed to be fulfilled [4, 15]. That is, the incongruity should to be resolved and then humor can be comprehended. But restricted by the limited scope of this study, the second cognitive process “Resolution” is suggested to be further examined by other researchers.
3. Research Method 3.1 The Measurement Methods and Enhancements
In the design studies, the popular method of measuring subjects’ respond toward the products (objects) or images is applying adjective descriptions of the semantic differences (SD) and further to the multidimensional scale (MDS), for example, the numerous researches into Kansei Engineering in Japan [16], and the research in multidimensional space [17,18]. Though the current measurement has achieved fruitful results, ERP (event-related potential) method might be useful to enhance the reliability and accuracy of current measurement. The ERP signal can measure the objective psychological response, and can be borrowed as a new tool for design assessment. Different from the questionnaires, ERP can detect subjects’ initial and earliest response. By asking subjects to watch the guiding words and product images, brainwave variations can be recorded. The data of inattentive subjects or false response can be excluded via examining the waveform [2, 19].
3.2 The ERP Method and the Selection of Brainwave Components
ERPs are voltage fluctuations that are associated in time with some physical or mental occurrence, and can provide important information about how the human brain normally processes information [20]. These potentials can be recorded from the human scalp (Figure 1) and extracted from the ongoing electroencephalogram (EEG, Figure 2) by means of filtering and signal averaging. Generally ERP recording instrument includes an elastic fabric head cap with sintered electrodes, a monopolar digital amplifier, and acquisition and analysis software for processing and analyzing ERP data. In this study, the stimuli (instructional phases and product images) were uploaded in the visual image display software, and the display time, interval, and sequence were determined.
3
Figure 1. An electrode position map on the scalp
Figure 2. The real-time waveform recorded from the electroencephalogram
According to previous studies, the common ERP
components related to image processing are: (1) N100, the index of attention [21, 22]; (2) N170, facial recognition [23, 24]; (3) N270, conflict indication; (4) P300, attention and recognition [25]; (5) N400, confusion. In this study, “incongruity condition” was examined, therefore related ERP brainwave components, N270 and N400, were chosen to analyze.
Figure 3 illustrates the brainwave of N270. The previous studies demonstrated that the N270 is an endogenous ERP component with an index to the processing or identification of conflicts [26-28]. N270 was verified with more negative in high-conflict condition than in low-conflict condition [29]. It was well qualified to simulate the contradiction condition. Figure 4 illustrates the N400, which is associated with the emotion of confusion. ERP studies have elicited a large negative component peaking around 400 ms (N400 effect) by presenting incongruent (relative to congruent)
word pairs, or unrelated pictures [30, 31]. In this study, the mixture of words and pictures were further investigated.
Figure 3. The example for ERP component N270 in position P4.
Figure 4. The example for ERP component N400 in position CZ. 3.3 Data Reduction and Analysis
According to the above-mentioned ERP studies, two possible earlier components, especially distributed along the midline of brain at Fz, Cz, and Pz electrodes (figure 5), were investigated as following: (1) N270, identified with the interval between 220 and 290 msec; and 2) N400, identified with the interval between 380 and 500 msec. In this study, the interval for each component was adjusted and determined in accordance with researchers’ previous suggestions [31-35] and our observation that if the peak of amplitude shown in the appropriate range. Mean amplitudes were calculated from these intervals.
91 THE SC IENCE OF DES IGN B U L L E T I N OF JSSD Vol. 62 No. 1 2015Copyright © 2015 日本デザイン学会 All Rights Reserved.

4
Figure 5. The selected 3 electrodes (medial part scalp sites: Fz, Cz, and Pz) for ERP
In order to correctly obtain the ERP data for peak of amplitude and latency in each component, according to previous studies [2], the following rules were defined: (1) Set the parameter of the investigated interval in the analysis software (e.g., set the interval range for N400 around the 380-500 ms time window); (2) Make sure the peak of amplitude was located on the setting range. If not, the range of time window should be adjusted to get the modified interval with effective peak of amplitude; (3) After adjusting and identifying that each component exhibited peak of amplitude in defined interval, the value of peak of amplitude and the related latency can be obtained and further calculated. 4. Experiment Procedure
This experiment presented the stimuli with coherent/contradiction and humor/neutral attributes, and recorded the ERP signal to detect brainwave variations. While shoppers seek targets, usually form a conventional mental image in advance. They expect to shop some specific products they want. The previous studies on verbal and non-verbal humor materials usually excluded the shoppers’ expectations to stimuli [2]. Therefore, this experiment simulated the process of shopping behavior - the expectation to specific product by displaying instructional phase firstly, then the expected product images in sequence.
4.1 Subject
10 of the graduate and undergraduate students of National Taiwan University of Science and Technology were selected for the experiments. There are 6 males and 4 females, whose mean age is 23 years old. 4 of them are with design background. None of the subjects has neural disease of visual illness or brain injury.
4.2 Stimuli The stimuli of this experiment combined “Instructional
Phase” and “Product Image” into one group (Table 1), and these two images were shown in sequence.
Table 1. Stimuli: “Instructional Phase” and “Product Image”
Intro Phase
Product Image
Toothpick Container
Hum
or Product
“Magic Bunny”, by Stefano Giovannoni
Norm
al Product
Hand- W
ash Soap Container
Hum
or Product
“Mr. Cold”, by Massimo Giacon
Norm
al Product
The instructional phase indicated the next image shown,
and included two images with text - “The next image is Toothpick Container” and “The next image is Soap Container”. The product images included two categories of product - Toothpick Container and Hand- Wash Soap Container, and each category, revised from previous research and determined by questionnaire survey, consisted of one emotional product (with humor attributes) by Alessi and three normal products (with neutral attributes). Totally
92 B U L L E T I N OF JSSD Vol. 62 No. 1 2015 THE SC IENCE OF DES IGN

4
Figure 5. The selected 3 electrodes (medial part scalp sites: Fz, Cz, and Pz) for ERP
In order to correctly obtain the ERP data for peak of amplitude and latency in each component, according to previous studies [2], the following rules were defined: (1) Set the parameter of the investigated interval in the analysis software (e.g., set the interval range for N400 around the 380-500 ms time window); (2) Make sure the peak of amplitude was located on the setting range. If not, the range of time window should be adjusted to get the modified interval with effective peak of amplitude; (3) After adjusting and identifying that each component exhibited peak of amplitude in defined interval, the value of peak of amplitude and the related latency can be obtained and further calculated. 4. Experiment Procedure
This experiment presented the stimuli with coherent/contradiction and humor/neutral attributes, and recorded the ERP signal to detect brainwave variations. While shoppers seek targets, usually form a conventional mental image in advance. They expect to shop some specific products they want. The previous studies on verbal and non-verbal humor materials usually excluded the shoppers’ expectations to stimuli [2]. Therefore, this experiment simulated the process of shopping behavior - the expectation to specific product by displaying instructional phase firstly, then the expected product images in sequence.
4.1 Subject
10 of the graduate and undergraduate students of National Taiwan University of Science and Technology were selected for the experiments. There are 6 males and 4 females, whose mean age is 23 years old. 4 of them are with design background. None of the subjects has neural disease of visual illness or brain injury.
4.2 Stimuli The stimuli of this experiment combined “Instructional
Phase” and “Product Image” into one group (Table 1), and these two images were shown in sequence.
Table 1. Stimuli: “Instructional Phase” and “Product Image”
Intro Phase
Product Image
Toothpick Container
Hum
or Product
“Magic Bunny”, by Stefano Giovannoni
Norm
al Product
Hand- W
ash Soap Container
Hum
or Product
“Mr. Cold”, by Massimo Giacon
Norm
al Product
The instructional phase indicated the next image shown,
and included two images with text - “The next image is Toothpick Container” and “The next image is Soap Container”. The product images included two categories of product - Toothpick Container and Hand- Wash Soap Container, and each category, revised from previous research and determined by questionnaire survey, consisted of one emotional product (with humor attributes) by Alessi and three normal products (with neutral attributes). Totally
5
there are 16 groups of combinations, consisted by two instructional phases and 8 product images. In order to exclude the extraneous interference, all stimuli shared the same gray background.
In this experiment design, two levels for Incongruity variance are (1) Contradiction condition: The incorrect instructional phase for next product images shown to simulate the incongruity condition; (2) Coherent condition: The correct instructional phase for next product images shown. Table 2 illustrates the four combination groups of stimuli for analysis: (1) Group 1: Coherent condition with neutral product images; (2) Group 2: Coherent condition with humor product images; (3) Group 3: Contradiction condition with neutral product images. (4) Group 4: Contradiction condition with humor product images.
Table 2. The combination of stimuli
Product Attribute Factor
Incongruity Factor
Humor Product Normal (Neutral) Product
Contradiction Condition
Group 4 Contradiction/Humor
Group 3 Contradiction/Normal
Coherent Condition
Group 2 Coherent/Humor
Group 1 Coherent/Normal
In this experiment design, the following issues were
investigated: (1) Will the specific ERP components N270 and N400 which related with conflict and confusion be evoked when the displayed information and image was contradictive and incongruity condition occurred? (2) Will the humor product evoke greater N270 and N400 than the neutral one? (3) Will the combination group of inconsistent instructional phase and humor product evoke greater N270 and N400 than the one of consistent instructional phase and normal product, and it correspond to the design guideline? 4.3 Procedure
After short briefing, the subject sat and wore the electrode cap. The subject was instructed to watch the images carefully to check the consistence between the instructional phase and product images, and then answer the questions -“Does the instructional phase provide the right information?” by clicking the mouse. If the subject agreed with this question, they clicked left-button, if not, the right-button. To avoid the possibility of clicking wrong button, a printed-paper was placed under the mouse to indicate the meaning of the left and right clicks. The stimuli
group (Instructional Phase and Product Image) appeared one by one for 1 second, and inter-trial interval was 1.7 seconds. Each stimulus group randomly presented 20 times. There were totally 320 trials each person. An experiment lasted about 20 minutes. 4.4 Recording
EEG was recorded by 40 electrodes Ag/AgCl sintered electrode cap (Quick cap, Compumedics Neuroscan, USA, Figure 6). Electrode positions included the standard 10-20 system locations and additional intermediate positions. Horizontal and vertical EOG (Electrooculography) were monitored using four facial electrodes laces on the outer canthi of the eyes and in the inferior and superior areas of the orbit. EEG was continuously recorded, digitized at a rate of 1000 Hz with a linked mastoids reference. The signal was amplified by NuAmps (Compumedics Neuroscan, USA, Figure 7), band-pass filtered at 0.1-40 Hz.
Figure 6. The elastic fabric head cap (Quick cap).
Figure 7. The monopolar digital amplifier (NuAmps)
To construct this experiment, the Quick-Cap should be
connected to the NuAmps, and to the computer with installed acquisition and analysis software SCAN4.3 (Figure 8), for processing and analyzing ERP data.
93 THE SC IENCE OF DES IGN B U L L E T I N OF JSSD Vol. 62 No. 1 2015Copyright © 2015 日本デザイン学会 All Rights Reserved.

6
Figure 8. The analysis software, SCAN 4.3
Visual Image Display System, displayed by a laptop
computer monitor, is a browser interface that presents digital images for custom stimulus and task design (STIM2). Through STIM2, the stimuli are put in, and the display time, interval, and sequence are determined. The researcher can observe the ongoing experiment through another monitor (Figure 9). The STIM2 controls time setting and provides the time signal to the SCAN 4.3 while recording the data. The mixed data can be analyzed later by the analysis software.
Figure 9. The ongoing experiment
In EEG data file, there are common artifacts, including
eye blinks, eye movements, skin potentials, and muscle activity [36]. The reasons why using rectification to reject failure trials are to minimize the EEG noise and start analysis with data containing minimal artifacts. Epoch continuous EEG data were segmented from 200 ms. prior to stimulus to 1000 ms.. And a band pass digital filter was between 0.1-40 Hz and later applied to remove unwanted frequency components. The average re-reference were transformed into the M1 and M2 sites, reference electrodes placed at the right and left mastoids, and baseline-corrected relative to the interval -100 to 0 ms.. After VEOG (vertical
Electrooculography) channel was subjected to an artifact rejection of ± 75 μV to reject trial with excessive EMG (Electromyography) or other noise transients and linear trends were rectified. The ERP data at least 16 trials free were further average proceeded directly for the identified conditions separately whether didn’t achieve the value were rejected. 5. Result
Repeated measure ANOVA was performed with electrode location (Fz, Cz, and Pz) and stimuli group as within-subject factors. Post-hoc comparisons were made to determine the significance of pairwise contrasts, using Tukey’s two-factor HSD procedure (p<0.05). The subjects’ ERP waveform and behavioral data were analyzed and summarized as following:
5.1 Behavioral Result
The subjects were instructed to watch the stimuli and answer the question about the consistence between the instructional phase and product images by clicking the mouse. On the users’ click, the subjects’ response data were recorded by ERP record system, and were integrated and summarized. The mouse-clicking result showed that the average response time of 10 subjects was significantly
different (F(3, 3103)=55.707, p=0.000) between four
groups of the combination of stimuli (Table 3). The sequence was: Group 3 (Contradiction/Normal) > Group 4 (Contradiction/ Humor) > Group 2 (Coherent/Humor) > Group 1 (Coherent/Normal). The post hoc tests indicated that all groups reached significant difference (p=0.00~0.04 < 0.05) except Group 3 and 4 (p=0.98 > 0.05). In addition, the accuracy of these clicks was analyzed. Since the low error rate (4.875%) and no significant meaning, we had decided to exclude the trial data with wrong clicks.
These results can be concluded that, while in coherent condition, the subject showed greater hesitation in humor product than in neutral product; but in contradiction condition, the subject showed no significant difference in mouse-clicking behavior between humor and neutral product.
94 B U L L E T I N OF JSSD Vol. 62 No. 1 2015 THE SC IENCE OF DES IGN

6
Figure 8. The analysis software, SCAN 4.3
Visual Image Display System, displayed by a laptop
computer monitor, is a browser interface that presents digital images for custom stimulus and task design (STIM2). Through STIM2, the stimuli are put in, and the display time, interval, and sequence are determined. The researcher can observe the ongoing experiment through another monitor (Figure 9). The STIM2 controls time setting and provides the time signal to the SCAN 4.3 while recording the data. The mixed data can be analyzed later by the analysis software.
Figure 9. The ongoing experiment
In EEG data file, there are common artifacts, including
eye blinks, eye movements, skin potentials, and muscle activity [36]. The reasons why using rectification to reject failure trials are to minimize the EEG noise and start analysis with data containing minimal artifacts. Epoch continuous EEG data were segmented from 200 ms. prior to stimulus to 1000 ms.. And a band pass digital filter was between 0.1-40 Hz and later applied to remove unwanted frequency components. The average re-reference were transformed into the M1 and M2 sites, reference electrodes placed at the right and left mastoids, and baseline-corrected relative to the interval -100 to 0 ms.. After VEOG (vertical
Electrooculography) channel was subjected to an artifact rejection of ± 75 μV to reject trial with excessive EMG (Electromyography) or other noise transients and linear trends were rectified. The ERP data at least 16 trials free were further average proceeded directly for the identified conditions separately whether didn’t achieve the value were rejected. 5. Result
Repeated measure ANOVA was performed with electrode location (Fz, Cz, and Pz) and stimuli group as within-subject factors. Post-hoc comparisons were made to determine the significance of pairwise contrasts, using Tukey’s two-factor HSD procedure (p<0.05). The subjects’ ERP waveform and behavioral data were analyzed and summarized as following:
5.1 Behavioral Result
The subjects were instructed to watch the stimuli and answer the question about the consistence between the instructional phase and product images by clicking the mouse. On the users’ click, the subjects’ response data were recorded by ERP record system, and were integrated and summarized. The mouse-clicking result showed that the average response time of 10 subjects was significantly
different (F(3, 3103)=55.707, p=0.000) between four
groups of the combination of stimuli (Table 3). The sequence was: Group 3 (Contradiction/Normal) > Group 4 (Contradiction/ Humor) > Group 2 (Coherent/Humor) > Group 1 (Coherent/Normal). The post hoc tests indicated that all groups reached significant difference (p=0.00~0.04 < 0.05) except Group 3 and 4 (p=0.98 > 0.05). In addition, the accuracy of these clicks was analyzed. Since the low error rate (4.875%) and no significant meaning, we had decided to exclude the trial data with wrong clicks.
These results can be concluded that, while in coherent condition, the subject showed greater hesitation in humor product than in neutral product; but in contradiction condition, the subject showed no significant difference in mouse-clicking behavior between humor and neutral product.
7
Table 3. Behavioral result in four groups for the average response time of 10 subject’s mouse clicking (unit: msec., standard deviation of means in parentheses).
Group Mean 1 437.06 (133.168) 2 495.63 (139.501) 3 540.21(137.206) 4 536.82 (121.697)
5.2 ERP Result 5.2.1 The Brain Waveform
The figure 10 illustrates the average of waveform of Group 1~4 at the CZ electrode (the largest amplitudes in this case). After the onset of a stimulus beginning around 270 ms, we noted that the negative waveforms N270. Group 3 and Group 4 shows the greater similar amplitudes and is distinctly larger than Group 2; while Group 1 shows the smallest amplitude. Around 400 ms, only the greater amplitude of Group 4 is noted. It means that the combination group of contradiction condition with humor product images evokes significant N400 effects.
Figure 10. The waveform of Group 1~4 at the CZ electrode. 5.2.2 The Amplitude for N270
The previous studies demonstrate that the emotional (terrified or delighted) human faces or false mathematical equations might evoke N270, which is an index to the conflict identification and also related to the processing of emotions and confusions. The table 4 shows the mean of peak amplitude and latency of Group 1~4 for N270 epoch (220–290 ms) superimposed at Fz, Cz, and Pz sites.
Table 4. The mean of peak amplitude and latency of Group 1~4 for N270 at Fz, Cz, and Pz sites (standard deviation of means in parentheses).
Group peak amplitude (µV) latency (ms) 1 -3.4514(5.08240) 266.5167(23.58) 2 -4.3363(3.89612) 257.5000(22.44) 3 -6.7827(5.76395) 266.3056(24.47) 4 -6.8508(5.32173) 272.5667(28.05)
ANOVA restricted to Group 1~4 revealed that the
peak amplitude of N270 was significantly different
(F(3, 156)=4.518, p=0.005). The sequence was: Group 4
> Group 3 > Group 2 > Group 1. The analysis of N270 superimposed at Fz, Cz, and Pz sites indicated that there was significant difference in incongruity factor (p=0.000 < 0.05), whereas product attribute factor and interaction between incongruity and attribute factor was not significantly different.
In this case, the post hoc tests indicated that the ERPs effect of Group 4 was more negative-going than Group 1 (p
=0.005), others show no significant difference. The results
suggested that the contradiction condition with humor product images (comparing with the coherent condition with neutral product images) did evoke greater N270, while incongruity factor (Contradiction/Coherent) represented a more important role than product attribute (Humor/Neutral) did. Furthermore, the amplitudes for N270 at Fz, Cz, and Pz sites were analyzed separately, the result corresponded with the previous analysis but showed less significant difference.
These results showed that whether the humor or neutral product did not significantly impact ERP latency while in contradiction condition. It might indicate that contradiction condition confused subjects, then subjects were aware of this unexpected condition and started the ratiocination and recognition process. This mental process decreased the impact of humor product. Regarding to incongruity theory, this study confirmed that the contradiction condition results in confusion, but there was no evidence that humor product impacts the ERP brainwave. 5.2.3 The Latency for N270
ANOVA restricted to Group 1~4 revealed that the
latency of N270 was significantly different (p=0.009). The
sequence was: Group 4 > Group 3 > Group 1 > Group 2. The analysis of N270 superimposed at Fz, Cz, and Pz sites
95 THE SC IENCE OF DES IGN B U L L E T I N OF JSSD Vol. 62 No. 1 2015Copyright © 2015 日本デザイン学会 All Rights Reserved.
8
indicated that there was significant difference in incongruity factor (p=0.000 < 0.05), whereas product attribute factor and interaction between incongruity and attribute factor was not significantly different.
In this case, the post hoc tests indicated that the ERPs
effect of Group 4 was longer than Group 2 (p=0.004),
others showed no significant difference. The results suggested no valid explanation except that later latency of N270 was detected when subjects responded to contradiction condition.
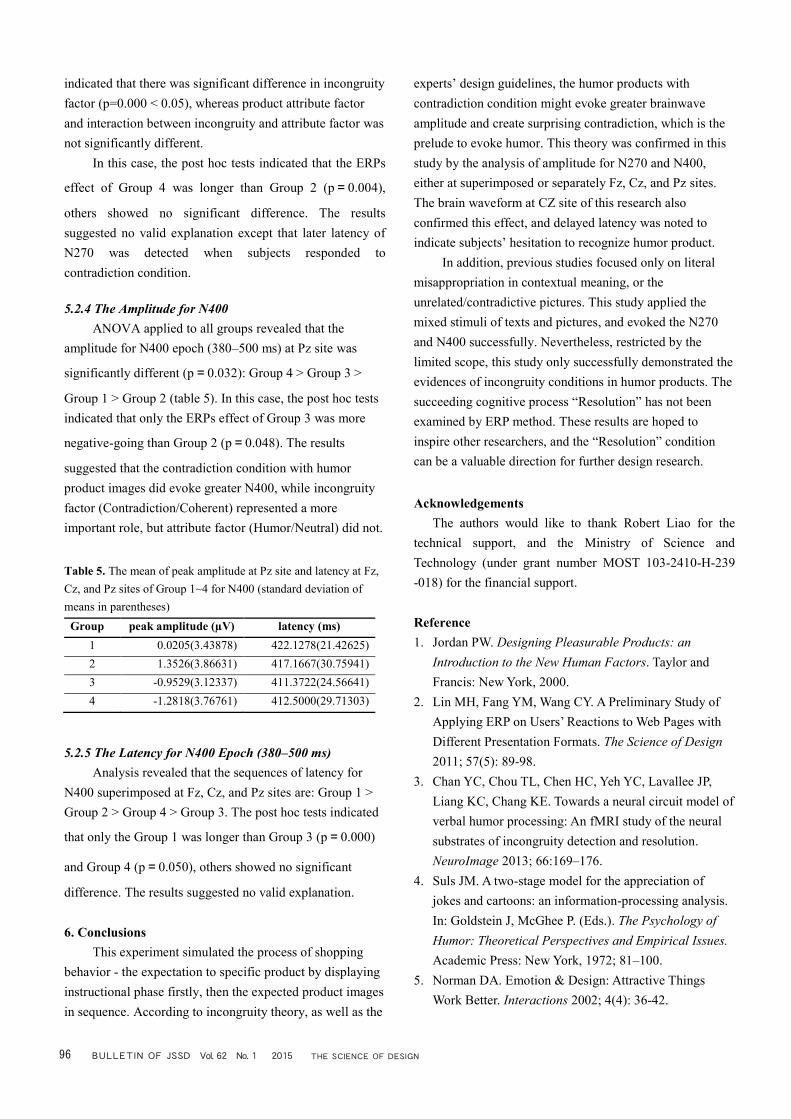
5.2.4 The Amplitude for N400 ANOVA applied to all groups revealed that the
amplitude for N400 epoch (380–500 ms) at Pz site was
significantly different (p=0.032): Group 4 > Group 3 >
Group 1 > Group 2 (table 5). In this case, the post hoc tests indicated that only the ERPs effect of Group 3 was more
negative-going than Group 2 (p=0.048). The results
suggested that the contradiction condition with humor product images did evoke greater N400, while incongruity factor (Contradiction/Coherent) represented a more important role, but attribute factor (Humor/Neutral) did not.
Table 5. The mean of peak amplitude at Pz site and latency at Fz, Cz, and Pz sites of Group 1~4 for N400 (standard deviation of means in parentheses)
Group peak amplitude (µV) latency (ms) 1 0.0205(3.43878) 422.1278(21.42625) 2 1.3526(3.86631) 417.1667(30.75941) 3 -0.9529(3.12337) 411.3722(24.56641) 4 -1.2818(3.76761) 412.5000(29.71303)
5.2.5 The Latency for N400 Epoch (380–500 ms) Analysis revealed that the sequences of latency for
N400 superimposed at Fz, Cz, and Pz sites are: Group 1 > Group 2 > Group 4 > Group 3. The post hoc tests indicated
that only the Group 1 was longer than Group 3 (p=0.000)
and Group 4 (p=0.050), others showed no significant
difference. The results suggested no valid explanation.
6. Conclusions This experiment simulated the process of shopping
behavior - the expectation to specific product by displaying instructional phase firstly, then the expected product images in sequence. According to incongruity theory, as well as the
experts’ design guidelines, the humor products with contradiction condition might evoke greater brainwave amplitude and create surprising contradiction, which is the prelude to evoke humor. This theory was confirmed in this study by the analysis of amplitude for N270 and N400, either at superimposed or separately Fz, Cz, and Pz sites. The brain waveform at CZ site of this research also confirmed this effect, and delayed latency was noted to indicate subjects’ hesitation to recognize humor product.
In addition, previous studies focused only on literal misappropriation in contextual meaning, or the unrelated/contradictive pictures. This study applied the mixed stimuli of texts and pictures, and evoked the N270 and N400 successfully. Nevertheless, restricted by the limited scope, this study only successfully demonstrated the evidences of incongruity conditions in humor products. The succeeding cognitive process “Resolution” has not been examined by ERP method. These results are hoped to inspire other researchers, and the “Resolution” condition can be a valuable direction for further design research.
Acknowledgements
The authors would like to thank Robert Liao for the technical support, and the Ministry of Science and Technology (under grant number MOST 103-2410-H-239 -018) for the financial support. Reference 1. Jordan PW. Designing Pleasurable Products: an
Introduction to the New Human Factors. Taylor and Francis: New York, 2000.
2. Lin MH, Fang YM, Wang CY. A Preliminary Study of Applying ERP on Users’ Reactions to Web Pages with Different Presentation Formats. The Science of Design 2011; 57(5): 89-98.
3. Chan YC, Chou TL, Chen HC, Yeh YC, Lavallee JP, Liang KC, Chang KE. Towards a neural circuit model of verbal humor processing: An fMRI study of the neural substrates of incongruity detection and resolution. NeuroImage 2013; 66:169–176.
4. Suls JM. A two-stage model for the appreciation of jokes and cartoons: an information-processing analysis. In: Goldstein J, McGhee P. (Eds.). The Psychology of Humor: Theoretical Perspectives and Empirical Issues. Academic Press: New York, 1972; 81–100.
5. Norman DA. Emotion & Design: Attractive Things Work Better. Interactions 2002; 4(4): 36-42.
96 B U L L E T I N OF JSSD Vol. 62 No. 1 2015 THE SC IENCE OF DES IGN

8
indicated that there was significant difference in incongruity factor (p=0.000 < 0.05), whereas product attribute factor and interaction between incongruity and attribute factor was not significantly different.
In this case, the post hoc tests indicated that the ERPs
effect of Group 4 was longer than Group 2 (p=0.004),
others showed no significant difference. The results suggested no valid explanation except that later latency of N270 was detected when subjects responded to contradiction condition.
5.2.4 The Amplitude for N400 ANOVA applied to all groups revealed that the
amplitude for N400 epoch (380–500 ms) at Pz site was
significantly different (p=0.032): Group 4 > Group 3 >
Group 1 > Group 2 (table 5). In this case, the post hoc tests indicated that only the ERPs effect of Group 3 was more
negative-going than Group 2 (p=0.048). The results
suggested that the contradiction condition with humor product images did evoke greater N400, while incongruity factor (Contradiction/Coherent) represented a more important role, but attribute factor (Humor/Neutral) did not.
Table 5. The mean of peak amplitude at Pz site and latency at Fz, Cz, and Pz sites of Group 1~4 for N400 (standard deviation of means in parentheses)
Group peak amplitude (µV) latency (ms) 1 0.0205(3.43878) 422.1278(21.42625) 2 1.3526(3.86631) 417.1667(30.75941) 3 -0.9529(3.12337) 411.3722(24.56641) 4 -1.2818(3.76761) 412.5000(29.71303)
5.2.5 The Latency for N400 Epoch (380–500 ms) Analysis revealed that the sequences of latency for
N400 superimposed at Fz, Cz, and Pz sites are: Group 1 > Group 2 > Group 4 > Group 3. The post hoc tests indicated
that only the Group 1 was longer than Group 3 (p=0.000)
and Group 4 (p=0.050), others showed no significant
difference. The results suggested no valid explanation.
6. Conclusions This experiment simulated the process of shopping
behavior - the expectation to specific product by displaying instructional phase firstly, then the expected product images in sequence. According to incongruity theory, as well as the
experts’ design guidelines, the humor products with contradiction condition might evoke greater brainwave amplitude and create surprising contradiction, which is the prelude to evoke humor. This theory was confirmed in this study by the analysis of amplitude for N270 and N400, either at superimposed or separately Fz, Cz, and Pz sites. The brain waveform at CZ site of this research also confirmed this effect, and delayed latency was noted to indicate subjects’ hesitation to recognize humor product.
In addition, previous studies focused only on literal misappropriation in contextual meaning, or the unrelated/contradictive pictures. This study applied the mixed stimuli of texts and pictures, and evoked the N270 and N400 successfully. Nevertheless, restricted by the limited scope, this study only successfully demonstrated the evidences of incongruity conditions in humor products. The succeeding cognitive process “Resolution” has not been examined by ERP method. These results are hoped to inspire other researchers, and the “Resolution” condition can be a valuable direction for further design research.
Acknowledgements
The authors would like to thank Robert Liao for the technical support, and the Ministry of Science and Technology (under grant number MOST 103-2410-H-239 -018) for the financial support. Reference 1. Jordan PW. Designing Pleasurable Products: an
Introduction to the New Human Factors. Taylor and Francis: New York, 2000.
2. Lin MH, Fang YM, Wang CY. A Preliminary Study of Applying ERP on Users’ Reactions to Web Pages with Different Presentation Formats. The Science of Design 2011; 57(5): 89-98.
3. Chan YC, Chou TL, Chen HC, Yeh YC, Lavallee JP, Liang KC, Chang KE. Towards a neural circuit model of verbal humor processing: An fMRI study of the neural substrates of incongruity detection and resolution. NeuroImage 2013; 66:169–176.
4. Suls JM. A two-stage model for the appreciation of jokes and cartoons: an information-processing analysis. In: Goldstein J, McGhee P. (Eds.). The Psychology of Humor: Theoretical Perspectives and Empirical Issues. Academic Press: New York, 1972; 81–100.
5. Norman DA. Emotion & Design: Attractive Things Work Better. Interactions 2002; 4(4): 36-42.
9
6. Västfjäll D, Kleiner M. Emotion in Product Sound Design. Proceedings of Journées Design; Sonore, Paris 2002; 20-21.
7. Fornari F, quoted by Lin MH. Alessi- The Dream Factory of Italian Design. Sungoodbooks Company: Taipei, Taiwan, 2005.
8. Winnicott DW. Playing and Reality. Routledge: New York, 1971.
9. Alessi A. Designer as Playmates. Ottagono, Editrice Compositori, Italy, 2002; 78~81.
10. Norman DA. Emotional Design - Why We Love (or Hate) Everyday Things. Basic Books: New York, 2004.
11. Schultz T. A Cognitive—Developmental Analysis of Humor. in Humor and Laughter: Theory, Research and Applications. Tony Chapman and Hugh Foot (eds.). Wiley: New York, 1976; 12–13.
12. Samsona AC, Zyssetbc S, Hubera O. Cognitive humor processing: Different logical mechanisms in nonverbal cartoons—an fMRI study. Social Neuroscience 2008; 3(2): 125-140.
13. Samsona AC, Hempelmannb CF, Hubera O, Zyssetc S. Neural substrates of incongruity-resolution and nonsense humor. Neuropsychologia 2009; 47(4): 1023–1033.
14. McGhee PE. Humor, Its Origin and Development. W. H. Freeman and company: San Francisco, 1979.
15. Wilson CP. Jokes Form, Content, Use And Function. New York, London, 1979: Academic Press.
16. Nagamachi M. Kansei Engineering: a new ergonomic consumer oriented technology for product development. International Journal of Industrial Ergonomics 1995; 15: 3-11.
17. Green PE, Carmone FJ, Smith SM. Multidimensional scaling concepts and applications. Allyn & Bacon: Boston, 1989.
18. Hsiao SW, Chen CH. A semantic and shape grammar based approach for product design. Design Studies 1997; 18(3): 275-296.
19. Lin MH, Fang YM. The Feature Manipulation And Cognition In Contemporary Vernacular Design. The Science of Design 2007; 54(1): 21-30.
20. Picton TW, Bentin S, Berg P, Donchin E, Hillyard SA, R Johnson JR, G.A. Miller, Ritter W, Ruchkin DS, Rugg MD, Taylor MJ. Guidelines for using human event-related potentials to study cognition: Recording standards and publication criteria. Psychophysiology 2000; 37: 127-152.
21. Johnston VS, Burleson M, and Miller DR. Emotional value and late positive components of ERPs, In Johnson R, Rohrbaugh Jr JW, & Parasuraman R (Eds.). Current trends in event-related potentials research (EEG suppl. 40), Amsterdam: Elsevier. 1987: 198–203.
22. Johnston VS, Miller DR, & Burleson MH. Multiple P3s to emotional stimuli and their theoretical significance, Psychophysiology 1986; 23: 684–694.
23. Allison T, Ginter H, and McCarthy G. Face recognition in human extrastriate cortex. Neurophysiol 1994; 71: 821-825.
24. Puce A, Allison T, and Spencer SS. Comparison of cortical activation evoked by faces measured by intracranial field potentials and functional MRI: two case studies. Hum Brain Mapp 1997; 5: 298-305.
25. Donchin E, and Coles MG. Is the P300 component a manifestation of context updating? Behavioral and Brain Sciences 1988; 11: 357–427.
26. Sato W, Kochiyama T, Yoshikawa S, Matsumura M. Emotional Expression Boosts Early Visual Processing of The Face: ERP Recording And Its Decomposition By Independent Component Analysis. Neuroreport 2001; 12(4).
27. Wang H, Wang Y, Kong J, Cui L, Tian S. Enhancement of conflict processing activity in human brain under task relevant condition. Neuroscience Letters 2001; 298: 155– 158.
28. Wang Y, Wang H. Cui L, Tian S, Zhang Y. The N270 component of the event-related potential reflects supramodal conflict processing in humans, Neuroscience Letters 2002; 332, 25–28.
29. Zhang X, Wang Y, Li S, Wang L. Event-related potential N270, a negative component to identification of conflicting information following memory retrieval. Clin Neurophysiol 2003; 114(12): 2461-8.
30. Kutas M, Hillyard SA. Reading Senseless Sentences: Brain Potentials Reflect Semantic Incongruity. Science 1980; 207: 203-205.
31. Barrett SE, Rugg MD, Perrett DI. Event-related potentials and the matching of familiar and unfamiliar faces. Neuropsychologia 1988; 26(1): 105-117.
32. Alice MP, Marzia DZ, Alberto Z. The emergence of semantic categorization in early visual processing: ERP indices of animal vs. artifact recognition. BMC Neuroscience 2007; 8(24): 1-16.
33. Kiefer M. Perceptual and semantic sources of category-specific effects: Event-related potentials during picture and word categorization. Memory and Cognition
97 THE SC IENCE OF DES IGN B U L L E T I N OF JSSD Vol. 62 No. 1 2015Copyright © 2015 日本デザイン学会 All Rights Reserved.

10
2001; 29(1): 100-116. 34. Sim EJ, Kiefer M. Category-related brain activity to
natural categories is associated with the retrieval of visual features: Evidence from repetition effects during visual and functional judgments. Cognitive Brain Research 2005; 24, 260-273.
35. Strüber D, Polich J. P300 and slow wave from oddball and single-stimulus visual tasks: inter-stimulus interval effects. International Journal of Psychophysiology 2002; 45(3): 187-196.
36. Luck SJ. Ch. 4: Averaging. Artifact rejection, and Artifact Correction. An introduction to the event-related potential technique. MIT Press, Cambridge, MA, 2005; 131–174.
98 B U L L E T I N OF JSSD Vol. 62 No. 1 2015 THE SC IENCE OF DES IGN