inicc data by country - hai rates, length of stay ...lengthofstay... · “hai rates, length of...
TRANSCRIPT

“HAI Rates, Length Of Stay, Mortality, Microorganism Profile, And Bacterial
Resistance In ICU. Data By Country:
Findings Of INICC Members”
Dr. Victor D. Rosenthal, MD, MSC, CIC INICC Founder and Chairman
.

Peer Review Manuscripts indexed in Pubmed, published by INICC
Members from: Latin America

Data collected by Hospital Team, using INICC Surveillance forms and methods, applying CDC NHSN Criteria for HAIs. Data analyzed by Dr. Victor D. Rosenthal (VDR). Paper drafted by VDR, revised and approved by Hospital Team, and submitted to the journal by VDR

Table 1. Overall nosocomial infection rates by hospital.
Hospital Hospital discharges
(n)
Patients with NI
Patients with NI (%)
Patient days
Number of NI
NI per 1000 patient days
A 23 10 43.0 293 20 68.0
B 101 18 17.8 527 26 49.3
C 89 29 53.9 602 82 136.21
Total 213 57 26.76 1422 128 90
Nosocomial infections in medical-surgical intensive care units in Argentina: attributable mortality and length of stay. Rosenthal VD, Guzman S, Orellano PAm J Infect Control. 2003 Aug;31(5):291-5.
Data collected by Hospital Team, using INICC Surveillance forms and methods, applying CDC NHSN Criteria for HAIs. Data analyzed by Dr. Victor D. Rosenthal (VDR). Paper drafted by VDR, revised and approved by Hospital Team, and submitted to the journal by VDR
Period of this Study: 1998-1999

Table 2. Distribution of nosocomial infection sites
Infection Site N %
Central Line-associated bloodstream infection 41 32
Ventilator-associated pneumonia 32 25
Catheter-associated Urinary tract infection 29 22.6
Peripheral line-associated Phlebitis 2 1.6
Peripheral line-associated BSI 10 7.8 Non ventilator-associated Pneumonia 14 10.9
Total 128 100
Data collected by Hospital Team, using INICC Surveillance forms and methods, applying CDC NHSN Criteria for HAIs. Data analyzed by Dr. Victor D. Rosenthal (VDR). Paper drafted by VDR, revised and approved by Hospital Team, and submitted to the journal by VDR
Nosocomial infections in medical-surgical intensive care units in Argentina: attributable mortality and length of stay. Rosenthal VD, Guzman S, Orellano PAm J Infect Control. 2003 Aug;31(5):291-5.
Period of this Study: 1998-1999
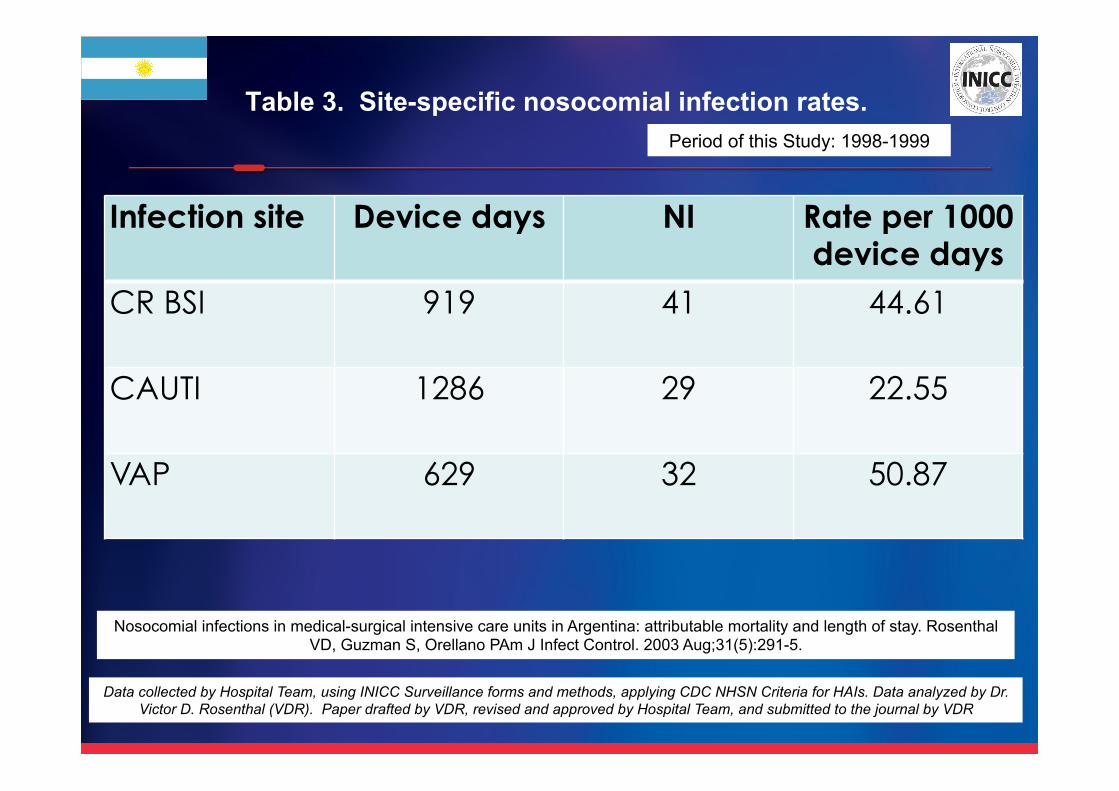
Table 3. Site-specific nosocomial infection rates.
Infection site Device days NI Rate per 1000 device days
CR BSI 919 41 44.61
CAUTI 1286 29 22.55
VAP 629 32 50.87
Data collected by Hospital Team, using INICC Surveillance forms and methods, applying CDC NHSN Criteria for HAIs. Data analyzed by Dr. Victor D. Rosenthal (VDR). Paper drafted by VDR, revised and approved by Hospital Team, and submitted to the journal by VDR
Nosocomial infections in medical-surgical intensive care units in Argentina: attributable mortality and length of stay. Rosenthal VD, Guzman S, Orellano PAm J Infect Control. 2003 Aug;31(5):291-5.
Period of this Study: 1998-1999

Table 4. Attributable Mortality, and ALOS extra Days.
Infection site ALOS Attributable extra days
Mortality Attributable mortality
CR BSI 26.08 13.94 (15/24) 62.5 25.3
CAUTI 17.50 5.36 (6/14) 42.9 5.7
VAP 22.14 10.00 (10/14) 71.4 34.2
Control 12.14 - (16/43) 37.2 -
Data collected by Hospital Team, using INICC Surveillance forms and methods, applying CDC NHSN Criteria for HAIs. Data analyzed by Dr. Victor D. Rosenthal (VDR). Paper drafted by VDR, revised and approved by Hospital Team, and submitted to the journal by VDR
Nosocomial infections in medical-surgical intensive care units in Argentina: attributable mortality and length of stay. Rosenthal VD, Guzman S, Orellano PAm J Infect Control. 2003 Aug;31(5):291-5.
Period of this Study: 1998-1999

Data collected by Hospital Team, using INICC Surveillance forms and methods, applying CDC NHSN Criteria for HAIs. Data analyzed by Dr. Victor D. Rosenthal (VDR). Paper drafted by VDR, revised and approved by Hospital Team, and submitted to the journal by VDR

Table 1. Features of the consortium hospitals and ICUs studied
hospital Hospital A Hospital B Hospital C Hospital D Overall
Hospitals, n 1 1 1 1 4 Academic
Teaching
1 0 0 0 1 (25%)
Public 1 1 1 1 100 (100%) Private Community
0 0 0 0 0 (0%)
ICUs, n 2 1 1 1 5 Experience of ICP (range), years
5 2 5 7 4-5
Patients n 656 289 270 142 1357 Patients-days n 5213 878 1952 839 8882 ASIS score, mean 3.92 (2569/654) 3.29 (861/261) 4.45 (24/107) 3.54
(297/119) 3.62
(3834/1058)
Device-associated nosocomial infection rates in intensive care units in four Mexican public hospitals Ramirez Barba EJ, Rosenthal VD, Higuera F, Oropeza MS, Hernández HT, López MS, Lona EL, Duarte P, Ruiz J, Hernandez RR, Chavez A,
Cerrato IP, Ramirez GE, Safdar N. Am J Infect Control. 2006 May;34(4):244-7.
Data collected by Hospital Team, using INICC Surveillance forms and methods, applying CDC NHSN Criteria for HAIs. Data analyzed by Dr. Victor D. Rosenthal (VDR). Paper drafted by VDR, revised and approved by Hospital Team, and submitted to the journal by VDR
Period of this Study: 2002-2004

Table 2. Device usage in the ICUs studied
hospital
Hospital A Hospital B Hospital C Hospital D Overall
Total ICU days 5213 878 1952 839 8882
Ventilator-days 1743 67 1352 399 3561
Ventilator usage 0.33 0.08 0.69 0.48 0.40
CVC-days 5593 642 1785 686 8706
CVC usage 1.07 0.73 0.91 0.82 0.98
Urinary catheter-days
3116 676 1709 729 6230
Catheter usage 0.60 0.77 0.88 0.87 0.70
Data collected by Hospital Team, using INICC Surveillance forms and methods, applying CDC NHSN Criteria for HAIs. Data analyzed by Dr. Victor D. Rosenthal (VDR). Paper drafted by VDR, revised and approved by Hospital Team, and submitted to the journal by VDR
Device-associated nosocomial infection rates in intensive care units in four Mexican public hospitals Ramirez Barba EJ, Rosenthal VD, Higuera F, Oropeza MS, Hernández HT, López MS, Lona EL, Duarte P, Ruiz J, Hernandez RR, Chavez A,
Cerrato IP, Ramirez GE, Safdar N. Am J Infect Control. 2006 May;34(4):244-7.
Period of this Study: 2002-2004

Table 3. VAP in the participant ICUs
Hospital A Hospital B Hospital C Hospital D Overall
VAP, no.of cases 40 0 27 2 69 Rate per 100 patients (%) 6.1 0.0 10.0 1.4 5.1 (69/1357)
Rate per 1000 ventilator-days 22.9 0.0 19.9 5.0 19.4 (69/3561)
Proportion of cases (%):
Acinetobacter spp 5.0 0.0 0.0 0.0 2.9 Candida spp. 2.5 0.0 3.7 0.0 2.9 E.Coli 8.0 0.0 0.0 100.0 7.2 Enterobacter 8.0 0.0 26.0 0.0 14.5 Klebsiella 12.5 0.0 3.7 0.0 8.7 Micrococo 5.0 0.0 0.0 0.0 2.9 Proteus 0.0 0.0 4.0 0.0 1.4 Pseudomonas aeruginosa 17.5 0.0 37.0 0.0 24.6
Staphylococcus aureus 12.5 0.0 14.8 0.0 13.0
Coagulase-negative staphylococci 2.5 0.0 3.7 0.0 2.9
Serratia 5.0 0.0 3.7 0.0 4.3
Data collected by Hospital Team, using INICC Surveillance forms and methods, applying CDC NHSN Criteria for HAIs. Data analyzed by Dr. Victor D. Rosenthal (VDR). Paper drafted by VDR, revised and approved by Hospital Team, and submitted to the journal by VDR
Device-associated nosocomial infection rates in intensive care units in four Mexican public hospitals Ramirez Barba EJ, Rosenthal VD, Higuera F, Oropeza MS, Hernández HT, López MS, Lona EL, Duarte P, Ruiz J, Hernandez RR, Chavez A,
Cerrato IP, Ramirez GE, Safdar N. Am J Infect Control. 2006 May;34(4):244-7.
Period of this Study: 2002-2004

Table 4. CVC- related BSI in the participant ICUs
Hospital A Hospital B Hospital C Hospital D Overall CVC-related BSI, no. of cases 100 4 27 16 147 Rate per 100 patients (%) 15.2 1.4 10.0 11.3 10.8 (147/1357) Rate per 1000 CVC-days 17.9 6.2 15.1 23.3 16.9 (147/8706) Proportion of cases (%): Acinetobacter spp 4.0 0.0 0.0 0.0 3.3 Alcaligenes 2.0 0.0 0.0 0.0 1.6 Candida spp. 0.0 0.0 23.8 0.0 4.1 Citrobacter 1.0 0.0 0.0 0.0 0.8 Criptococcus 1.0 0.0 0.0 0.0 0.8 E.Coli 0.0 0.0 4.8 0.0 0.8 Enterobacter 7.0 0.0 14.3 0.0 8.2 Klebsiella 2.0 0.0 0.0 100.0 2.5 Proteus 2.0 0.0 0.0 0.0 1.6 Pseudomonas aeruginosa 2.0 0.0 33.3 0.0 7.4 Staph Staphylococcus aureus 5.0 0.0 4.8 0.0 4.9
Coagulase-negative staphylococci 27.0 0.0 9.5 0.0 23.8 Serratia 1.0 0.0 0.0 0.0 0.8 Salmonella 1.0 0.0 0.0 0.0 0.8
Data collected by Hospital Team, using INICC Surveillance forms and methods, applying CDC NHSN Criteria for HAIs. Data analyzed by Dr. Victor D. Rosenthal (VDR). Paper drafted by VDR, revised and approved by Hospital Team, and submitted to the journal by VDR
Device-associated nosocomial infection rates in intensive care units in four Mexican public hospitals Ramirez Barba EJ, Rosenthal VD, Higuera F, Oropeza MS, Hernández HT, López MS, Lona EL, Duarte P, Ruiz J, Hernandez RR, Chavez A,
Cerrato IP, Ramirez GE, Safdar N. Am J Infect Control. 2006 May;34(4):244-7.
Period of this Study: 2002-2004

Table 5. CAUTI in the participant ICUs
Hospital A Hospital B Hospital C Hospital D Overall
CAUTI, no. of cases 30 3 31 2 66 Rate per 100 patients (%) 4.6 1.0 11.5 1.4 4.9 (66/1357)
Rate per 1000 catheter-days 9.6 4.4 18.1 2.7 10.6 (66/8882)
Proportion of cases (%):
Acinetobacter spp 3.3 0.0 0.0 0.0 1.6 Candida spp. 3.3 0.0 61.3 0.0 32.8 E.Coli 20.0 100.0 3.2 0.0 12.5 Enterobacter 6.7 0.0 12.9 0.0 9.4 Klebsiella 3.3 0.0 0.0 0.0 1.6 Morgane 3.3 0.0 0.0 0.0 1.6 Proteus 3.3 0.0 0.0 0.0 1.6 Pseudomonas aeruginosa 6.7 0.0 9.7 50.0 9.4
Staphylococcus aureus 0.0 0.0 9.7 0.0 4.7
Coagulase-negative staphylococci 0.0 0.0 3.2 0.0 1.6
Serratia 23.3 0.0 0.0 0.0 10.9
Data collected by Hospital Team, using INICC Surveillance forms and methods, applying CDC NHSN Criteria for HAIs. Data analyzed by Dr. Victor D. Rosenthal (VDR). Paper drafted by VDR, revised and approved by Hospital Team, and submitted to the journal by VDR
Device-associated nosocomial infection rates in intensive care units in four Mexican public hospitals Ramirez Barba EJ, Rosenthal VD, Higuera F, Oropeza MS, Hernández HT, López MS, Lona EL, Duarte P, Ruiz J, Hernandez RR, Chavez A,
Cerrato IP, Ramirez GE, Safdar N. Am J Infect Control. 2006 May;34(4):244-7.
Period of this Study: 2002-2004

Table 6. Mortality of device-associated nosocomial infections in the participants ICUs
Hospital A Hospital B Hospital C Hospital D Overall RR 95% CI P-value
Overall Crude Mortality of patients without infection, %
25.9 (126/487) 2.5 (7/280) 21.3 (45/211) 14.8 (18/122) 17.8 (196/1100) 1.0 - -
Crude unadjusted attributable mortality of patients with VAP, %
47.5 (19/40) 0.0 (0/0) 25.9 (7/27) 50 (1/2) 39.1 (27/69) 2.20 1.47 – 3.28 0.0000
Crude unadjusted attributable mortality of patients with CVC-associated BSI, %
52.0 (52/100) 0.0 (0/4) 25.9 (7/27) 6.3 (1/16) 40.8 (60/147) 2.29 1.72 – 3.06 0.0000
Crude unadjusted attributable mortality of patients with CAUTI, %
36.7 (11/30) 0.0 (0/3) 29.0 (9/31) 0.0 (0/2) 30.3 (20/66) 1.70 1.07 – 2.69 0.0220
Data collected by Hospital Team, using INICC Surveillance forms and methods, applying CDC NHSN Criteria for HAIs. Data analyzed by Dr. Victor D. Rosenthal (VDR). Paper drafted by VDR, revised and approved by Hospital Team, and submitted to the journal by VDR
Device-associated nosocomial infection rates in intensive care units in four Mexican public hospitals Ramirez Barba EJ, Rosenthal VD, Higuera F, Oropeza MS, Hernández HT, López MS, Lona EL, Duarte P, Ruiz J, Hernandez RR, Chavez A,
Cerrato IP, Ramirez GE, Safdar N. Am J Infect Control. 2006 May;34(4):244-7.
Period of this Study: 2002-2004

Table 7. Comparison of device utilization and rates of device–associated nosocomial infection in the ICUs
of the consortium and in U.S. ICUs.
U.S. NNIS- 1992-2004
These hospitals RR
Device utilization
Mechanical ventilator 0.35 – 0.43* 0.40 (0.08 – 0.69) + 0.93
Central vascular catheter
0.49 - 0.56 0.98 (0.73 - 1.07) 1.75
Urinary catheter 0.78 – 0.82 0.70 (0.60 – 0.88) 0.85
Rates, per 1000 device-days
Ventilator-associated pneumonia
4.6 – 5.1 19.4 (5.0 – 22.9) 3.8
CVC-associated bloodstream infection
3.1 - 3.4 16.9 (6.2 – 23.3) 5.0
Catheter-associated urinary tract infection
3.1- 3.3 10.6 (2.7 – 18.1) 3.2
Data collected by Hospital Team, using INICC Surveillance forms and methods, applying CDC NSHN Criteria for HAIs. Data analyzed by Dr. Victor D. Rosenthal (VDR). Paper drafted by VDR, revised and approved by Hospital Team, and submitted to the journal by VDR
Device-associated nosocomial infection rates in intensive care units in four Mexican public hospitals Ramirez Barba EJ, Rosenthal VD, Higuera F, Oropeza MS, Hernández HT, López MS, Lona EL, Duarte P, Ruiz J, Hernandez RR, Chavez A,
Cerrato IP, Ramirez GE, Safdar N. Am J Infect Control. 2006 May;34(4):244-7.
Period of this Study: 2002-2004

Data collected by Hospital Team, using INICC Surveillance forms and methods, applying CDC NSHN Criteria for HAIs. Data analyzed by Dr. Victor D. Rosenthal (VDR). Paper drafted by VDR, revised and approved by Hospital Team, and submitted to the journal by VDR
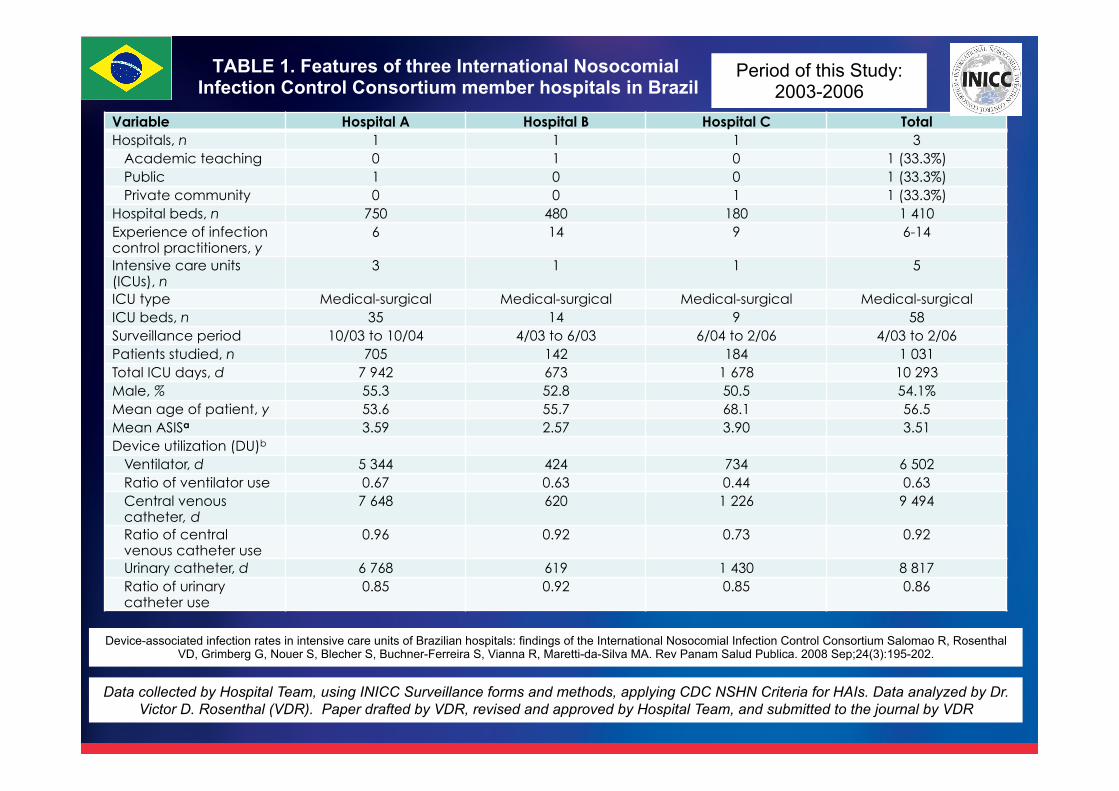
TABLE 1. Features of three International Nosocomial Infection Control Consortium member hospitals in Brazil
Variable Hospital A Hospital B Hospital C Total Hospitals, n 1 1 1 3
Academic teaching 0 1 0 1 (33.3%) Public 1 0 0 1 (33.3%) Private community 0 0 1 1 (33.3%)
Hospital beds, n 750 480 180 1 410 Experience of infection control practitioners, y
6 14 9 6-14
Intensive care units (ICUs), n
3 1 1 5
ICU type Medical-surgical Medical-surgical Medical-surgical Medical-surgical ICU beds, n 35 14 9 58 Surveillance period 10/03 to 10/04 4/03 to 6/03 6/04 to 2/06 4/03 to 2/06 Patients studied, n 705 142 184 1 031 Total ICU days, d 7 942 673 1 678 10 293 Male, % 55.3 52.8 50.5 54.1% Mean age of patient, y 53.6 55.7 68.1 56.5 Mean ASISa 3.59 2.57 3.90 3.51 Device utilization (DU)b
Ventilator, d 5 344 424 734 6 502 Ratio of ventilator use 0.67 0.63 0.44 0.63 Central venous catheter, d
7 648 620 1 226 9 494
Ratio of central venous catheter use
0.96 0.92 0.73 0.92
Urinary catheter, d 6 768 619 1 430 8 817 Ratio of urinary catheter use
0.85 0.92 0.85 0.86
Data collected by Hospital Team, using INICC Surveillance forms and methods, applying CDC NSHN Criteria for HAIs. Data analyzed by Dr. Victor D. Rosenthal (VDR). Paper drafted by VDR, revised and approved by Hospital Team, and submitted to the journal by VDR
Device-associated infection rates in intensive care units of Brazilian hospitals: findings of the International Nosocomial Infection Control Consortium Salomao R, Rosenthal VD, Grimberg G, Nouer S, Blecher S, Buchner-Ferreira S, Vianna R, Maretti-da-Silva MA. Rev Panam Salud Publica. 2008 Sep;24(3):195-202.
Period of this Study: 2003-2006

TABLE 2. Device-associated infections per 1000 device-days in intensive care units of three
Brazilian INICC member hospitals
Infection site
Device type
Device-days (n)
DAIs (n) Distribution of DAIs (%)
Rate per 100
patients
Rate per 1000
device-daysa
VAP MV 6 502 254 44.3 13.2 20.9
CVC-BSI CVC 9 494 26 28.0 8.3 9.1
CAUTI UC 8 817 27 27.7 8.2 9.6
Data collected by Hospital Team, using INICC Surveillance forms and methods, applying CDC NHSN Criteria for HAIs. Data analyzed by Dr. Victor D. Rosenthal (VDR). Paper drafted by VDR, revised and approved by Hospital Team, and submitted to the journal by VDR
Device-associated infection rates in intensive care units of Brazilian hospitals: findings of the International Nosocomial Infection Control Consortium Salomao R, Rosenthal VD, Grimberg G, Nouer S, Blecher S, Buchner-Ferreira S, Vianna R, Maretti-da-Silva
MA. Rev Panam Salud Publica. 2008 Sep;24(3):195-202.
Period of this Study: 2003-2006

TABLE 3. Microbiological profile of DAIs in the intensive care units of three INICC
member hospitals in Brazil
Pathogen Proportion of cases (%) Enterobacteriaceae 22.8 Pseudomonas spp. 22.6 Candida spp. 15.9 Acinetobacter spp. 14.6 Staphylococcus aureus 11.3 Coagulase-negative staphylococci 8.4 Enterococcus spp. 2.5 Stenotrophomonas spp. 0.8 Streptococcus spp. 0.8
Data collected by Hospital Team, using INICC Surveillance forms and methods, applying CDC NHSN Criteria for HAIs. Data analyzed by Dr. Victor D. Rosenthal (VDR). Paper drafted by VDR, revised and approved by Hospital Team, and submitted to the journal by VDR
Device-associated infection rates in intensive care units of Brazilian hospitals: findings of the International Nosocomial Infection Control Consortium Salomao R, Rosenthal VD, Grimberg G, Nouer S, Blecher S, Buchner-Ferreira S, Vianna R, Maretti-da-Silva
MA. Rev Panam Salud Publica. 2008 Sep;24(3):195-202.
Period of this Study: 2003-2006

TABLE 4. Resistance of pathogens in the intensive care units of three INICC member hospitals in Brazil
Bacteria Antibiotic used Percentage resistance
Enterobacteriaceae Ceftriaxone 96.7
Enterobacteriaceae Ceftazidime 79.3
Enterobacteriaceae Piperacillin-tazobactam 85.7
Enterococci Vancomycin 0.0
P. aeruginosa Ciprofloxacin 71.3
P. aeruginosa Ceftazidime 75.5
P. aeruginosa Imipenem 27.7
P. aeruginosa Piperacillin-tazobactam 100
S. aureus Methicillin 95.7
Data collected by Hospital Team, using INICC Surveillance forms and methods, applying CDC NHSN Criteria for HAIs. Data analyzed by Dr. Victor D. Rosenthal (VDR). Paper drafted by VDR, revised and approved by Hospital Team, and submitted to the journal by VDR
Device-associated infection rates in intensive care units of Brazilian hospitals: findings of the International Nosocomial Infection Control Consortium Salomao R, Rosenthal VD, Grimberg G, Nouer S, Blecher S, Buchner-Ferreira S, Vianna R, Maretti-da-Silva
MA. Rev Panam Salud Publica. 2008 Sep;24(3):195-202.
Period of this Study: 2003-2006

Data collected by Hospital Team, using INICC Surveillance forms and methods, applying CDC NHSN Criteria for HAIs. Data analyzed by Dr. Victor D. Rosenthal (VDR). Paper drafted by VDR, revised and approved by Hospital Team, and submitted to the journal by VDR

Table 1. Features of the consortium hospitals and ICUs studied
Hospital
A B C D E F G H I Overall
Hospitals, n 1 1 1 1 1 1 1 1 1 9
Academic
teaching
1 0 1 0 0 0 0 0 0 2 (22.2%)
Public 0 0 0 0 0 1 0 1 1 3 (33.3%)
Private
Community
0 1 0 1 1 0 1 0 0 4 (44.4%)
ICUs, n 1 1 2 1 1 1 1 1 1 10
Experience of
ICP (range),
years
8 5 8 15 4 4 30 4 5 4-30
Patients n 478 154 578 291 239 58 52 26 296 2172
Patients-days n 3878 1127 3210 1497 1108 542 372 233 2636 14603
Sex % (male) 58.6 59.1 55.9 44.0 59.0 51.7 40.4 53.8 56.4 55.0
Data collected by Hospital Team, using INICC Surveillance forms and methods, applying CDC NHSN Criteria for HAIs. Data analyzed by Dr. Victor D. Rosenthal (VDR). Paper drafted by VDR, revised and approved by Hospital Team, and submitted to the journal by VDR
Device-associated infection rate and mortality in intensive care units of 9 Colombian hospitals: findings of the International Nosocomial Infection Control Consortium.Moreno CA, Rosenthal VD, Olarte N, Gomez WV, Sussmann O, Agudelo JG, Rojas C,
Osorio L, Linares C, Valderrama A, Mercado PG, Bernate PH, Vergara GR, Pertuz AM, Mojica BE, Navarrete Mdel P, Romero AS, Henriquez D. Infect Control Hosp Epidemiol. 2006 Apr;27(4):349-56.
Period of this Study: 2002-2005

Table 2. Overall microbiological profile and bacterial resistance in the participant ICUs
Proportion of cases (%): Acinetobacter 4.5 Alcaligenes 0.6 Candida 5.1 E.Coli 14.2 Enterobacter 7.4 Enterococcus 2.3 Haemophilius 2.3 Klebsiella 14.8 Proteus 1.1 Pseudomonas aeruginosa 11.4 Staphylococcus aureus 25.6 Coagulase-negative staphylococci 9.7 Serratia 0.6 Streptococcus 0.6 Susceptibility of microorganisms (% resistant): S. aureus / methicillin (MRSA) 65.4 (17/26) Enterobacteriaceae / ceftriaxone 40.0 (10/25) Enterobacteriaceae / ceftazidima 28.3 (13/46) Enterobacteriaceae / piperacilina tazobactma 37.5 (6/16) P. aeruginosa / ciprofloxacina 40.0 (6/15) P. aeruginosa / ceftazidima 50.0 (5/10) P. aeruginosa / imipenem 19.0 (4/21) P. aeruginosa / piperacilina tazobactma 33.3 (2/6) Enterococci/ vancomycin 0.0
Data collected by Hospital Team, using INICC Surveillance forms and methods, applying CDC NHSN Criteria for HAIs. Data analyzed by Dr. Victor D. Rosenthal (VDR). Paper drafted by VDR, revised and approved by Hospital Team, and submitted to the journal by VDR
Device-associated infection rate and mortality in intensive care units of 9 Colombian hospitals: findings of the International Nosocomial Infection Control Consortium.Moreno CA, Rosenthal VD, Olarte N, Gomez WV, Sussmann O, Agudelo JG, Rojas C,
Osorio L, Linares C, Valderrama A, Mercado PG, Bernate PH, Vergara GR, Pertuz AM, Mojica BE, Navarrete Mdel P, Romero AS, Henriquez D. Infect Control Hosp Epidemiol. 2006 Apr;27(4):349-56.
Period of this Study: 2002-2005

Table 3. Device associated infection rates in the participant ICUs
VAP, no. of cases 86 Rate per 100 patients (%) 4.0 (86/2172) Rate per 1000 ventilator-days 10.0 (86/8593) CVC-related BSI, no. of cases 126 Rate per 100 patients (%) 5.8 (126/2172) Rate per 1000 CVC-days 11.3 (126/11110) CAUTI, no. of cases 54 Rate per 100 patients (%) 2.5 (54/2172) Rate per 1000 catheter-days 4.3 (54/12433)
Data collected by Hospital Team, using INICC Surveillance forms and methods, applying CDC NHSN Criteria for HAIs. Data analyzed by Dr. Victor D. Rosenthal (VDR). Paper drafted by VDR, revised and approved by Hospital Team, and submitted to the journal by VDR
Device-associated infection rate and mortality in intensive care units of 9 Colombian hospitals: findings of the International Nosocomial Infection Control Consortium.Moreno CA, Rosenthal VD, Olarte N, Gomez WV, Sussmann O, Agudelo JG, Rojas C,
Osorio L, Linares C, Valderrama A, Mercado PG, Bernate PH, Vergara GR, Pertuz AM, Mojica BE, Navarrete Mdel P, Romero AS, Henriquez D. Infect Control Hosp Epidemiol. 2006 Apr;27(4):349-56.
Period of this Study: 2002-2005

Table 4. Extra Mortality of device-associated nosocomial infections in the participants ICUs
Crude
Mortality Extra
mortality RR IC % P. value
Patients without
infection, % 18.1 - 1.0
Patients with VAP, % 35.0 16.9 1.93 1.24 – 3.00 0.0028
Patients with CVC-
associated BSI, % 36.6 18.5 2.02 1.42 – 2.87 0.0000
Patients with CAUTI, % 28.6 10.5 1.58 0.78 – 3.18 0.1987
Data collected by Hospital Team, using INICC Surveillance forms and methods, applying CDC NHSN Criteria for HAIs. Data analyzed by Dr. Victor D. Rosenthal (VDR). Paper drafted by VDR, revised and approved by Hospital Team, and submitted to the journal by VDR
Device-associated infection rate and mortality in intensive care units of 9 Colombian hospitals: findings of the International Nosocomial Infection Control Consortium.Moreno CA, Rosenthal VD, Olarte N, Gomez WV, Sussmann O, Agudelo JG, Rojas C,
Osorio L, Linares C, Valderrama A, Mercado PG, Bernate PH, Vergara GR, Pertuz AM, Mojica BE, Navarrete Mdel P, Romero AS, Henriquez D. Infect Control Hosp Epidemiol. 2006 Apr;27(4):349-56.
Period of this Study: 2002-2005

Table 5. Comparison of device utilization and rates of device–associated nosocomial infection in the ICUs of the consortium and
in U.S. ICUs.
U.S. NNIS- 1992-2004 1
INICC Hospitals- 2002-2005
RR
Device utilization
Mechanical ventilator 0.35 – 0.43* 0.59 1.37
Central vascular catheter 0.49 - 0.56 0.76 1.35
Urinary catheter 0.78 – 0.82 0.85 1.03
Rates, per 1000 device-days
Ventilator-associated pneumonia 4.6 – 5.1 10.0 1.96
CVC-associated bloodstream infection 3.1 - 3.4 11.3 3.32
Catheter-associated urinary tract infection
3.1- 3.3 4.3 1.30
Proportion (%) of device-associated infections with resistance:
S.aureus / methicillin. 48.1 36.2 0.75
Enterobacteriaceae / ceftriaxone 17.4 36.2 2.08
Enterococci / vancomycin 13.6 0.0 -
Data collected by Hospital Team, using INICC Surveillance forms and methods, applying CDC NHSN Criteria for HAIs. Data analyzed by Dr. Victor D. Rosenthal (VDR). Paper drafted by VDR, revised and approved by Hospital Team, and submitted to the journal by VDR
Device-associated infection rate and mortality in intensive care units of 9 Colombian hospitals: findings of the International Nosocomial Infection Control Consortium.Moreno CA, Rosenthal VD, Olarte N, Gomez WV, Sussmann O, Agudelo JG, Rojas C,
Osorio L, Linares C, Valderrama A, Mercado PG, Bernate PH, Vergara GR, Pertuz AM, Mojica BE, Navarrete Mdel P, Romero AS, Henriquez D. Infect Control Hosp Epidemiol. 2006 Apr;27(4):349-56.
Period of this Study: 2002-2005
Data collected by Hospital Team, using INICC Surveillance forms and methods, applying CDC NSHN Criteria for HAIs. Data analyzed by Dr. Victor D. Rosenthal (VDR). Paper drafted by VDR, revised and approved by Hospital Team, and submitted to the journal by VDR

Table 1. Features of the International Nosocomial Infection Control Consortium Hospitals and Intensive Care Units*
Hospitals A and B, Havana, Cuba.
Variable Medical Surgical ICU Trauma ICU Overall ICUs, n 1 1 2 Hospitals, n (%) 1 1 2
Academic teaching 1 1 2 (100%) Public 0 0 0 Private community 0 0 0
Patients studied, n 836 1,146 1,982 Total ICU days, d 4,762 9,750 14,512 Device use*
Ventilator days, d 1,902 4,515 6,417 Ventilator use, 0.40 0.46 0.44 CL days, d 3,028 6,863 9,891 CL use, 0.64 0.70 0.68 Urinary catheter days, d 3,867 6,822 10,689 Urinary catheter use, 0.81 0.70 0.74
Data collected by Hospital Team, using INICC Surveillance forms and methods, applying CDC NSHN Criteria for HAIs. Data analyzed by Dr. Victor D. Rosenthal (VDR). Paper drafted by VDR, revised and approved by Hospital Team, and submitted to the journal by VDR
Device-associated infection rates in adult intensive care units of Cuban university hospitals: International Nosocomial Infection Control Consortium (INICC) findings. Guanche-Garcell H, Requejo-Pino O, Rosenthal VD, Morales-Pérez C, Delgado-González
O, Fernández-González D. Int J Infect Dis. 2011 May;15(5):e357-62.
Period of this Study: 2006-2009

Table 2. Device associated infections per 1000 devices days: VAP, CLA-BSI, and CAUTI. Hospitals A and B,
Havana, Cuba.
Infection site Device type
Device- days
DA-HAI Distribution of device associated DA-HAI (%)
Rate per 100 patients
Rate per 1000 device-days
VAP (Overall rate) MV 6,417 337 76% 17.0% 52.5 (95% CI 47.2 – 58.3) Trauma ICU MV 4,515 298 78% 26.0% 66.0 (95% CI 58.9 – 73.7) Medical Surgical ICU MV 1,902 39 63% 4.7% 20.5 (95% CI 14.6 – 27.9) CLA-BSI (Overall rate) CL 9,891 20 4% 1.0% 2.0 (95% CI 1.2 – 3.1) Trauma ICU CL 6,863 13 3% 1.1% 1.9 (95% CI 1.0 – 3.3) Medical Surgical ICU CL 3,028 7 11% 0.8% 2.3 (95% CI 0.9 – 4.8) CAUTI (Overall rate) UC 10,689 87 20% 4.4% 8.1 (95% CI 6.5 – 10.0) Trauma ICU UC 6,822 71 19% 6.2% 10.4 (95% CI 8.1 – 13.1) Medical Surgical ICU UC 3,867 16 26% 1.9% 4.1 (95% CI 2.4 – 6.7)
Data collected by Hospital Team, using INICC Surveillance forms and methods, applying CDC NSHN Criteria for HAIs. Data analyzed by Dr. Victor D. Rosenthal (VDR). Paper drafted by VDR, revised and approved by Hospital Team, and submitted to the journal by VDR
Device-associated infection rates in adult intensive care units of Cuban university hospitals: International Nosocomial Infection Control Consortium (INICC) findings. Guanche-Garcell H, Requejo-Pino O, Rosenthal VD, Morales-Pérez C, Delgado-González
O, Fernández-González D. Int J Infect Dis. 2011 May;15(5):e357-62.
Period of this Study: 2006-2009

Table 3.Hand Hygiene compliance in the participant ICUs. Comparison per stratum. Hospital A, Havana, Cuba.
Variable % ( # HH / # opportunities)
Comparison RR 95% CI P.Value Gender Female 45.2% F vs M 1.15 0.83 - 1.58 0.3921 Male 51.9% HCW Nurses 49.3% Ns vs Ph 1.48 0.21 - 10.57 0.6950 Physicians 43.3% Ns vs AS 1.14 0.64 - 2.01 0.6574 Ancillary Staff 33.3% Ph vs AS 1.30 0.17 - 9.94 0.7998 Procedure Non-invasive 46.3% NI vs I 1.15 0.82 - 1.61 0.4218 invasive 53.1% Work Shift Morning 49.5% M vs A 1.05 0.76 - 1.46 0.7746 Afternoon 47.2%
Data collected by Hospital Team, using INICC Surveillance forms and methods, applying CDC NSHN Criteria for HAIs. Data analyzed by Dr. Victor D. Rosenthal (VDR). Paper drafted by VDR, revised and approved by Hospital Team, and submitted to the journal by VDR
Device-associated infection rates in adult intensive care units of Cuban university hospitals: International Nosocomial Infection Control Consortium (INICC) findings. Guanche-Garcell H, Requejo-Pino O, Rosenthal VD, Morales-Pérez C, Delgado-González
O, Fernández-González D. Int J Infect Dis. 2011 May;15(5):e357-62.
Period of this Study: 2006-2009

Table 4. Extra Mortality of patients with device-associated nosocomial infections in the Medical-Surgical ICU. Hospital
A, Havana, Cuba.
patients (n)* Crude Mortality
Extra Mortality RR 95% CI P-value
Patients without infection, %
782 33.0% - 1.0
Patients with CLA-BSI, % 4 50.0% 17% 1.52 0.4 – 6.1 0.5552
Patients with VAP, % 5 80.0% 47% 2.42 0.9 – 6.5 0.0693
Data collected by Hospital Team, using INICC Surveillance forms and methods, applying CDC NSHN Criteria for HAIs. Data analyzed by Dr. Victor D. Rosenthal (VDR). Paper drafted by VDR, revised and approved by Hospital Team, and submitted to the journal by VDR
Device-associated infection rates in adult intensive care units of Cuban university hospitals: International Nosocomial Infection Control Consortium (INICC) findings. Guanche-Garcell H, Requejo-Pino O, Rosenthal VD, Morales-Pérez C, Delgado-González
O, Fernández-González D. Int J Infect Dis. 2011 May;15(5):e357-62.
Period of this Study: 2006-2009

Table 5. Extra Length of stay of patients with device-associated nosocomial infections in the Medical-Surgical
ICU.Hospital A, Havana, Cuba.
Average Length of Stay
Extra Length of Stay 95% CI RR
Patients without infection, days 4.9 - 4.6 - 5.2 1.0
Patients with CLA-BSI, days 23.3 18.3 9.4 - 85.8 4.7
Patients with VAP, days 23.8 18.9 10.5 - 73.3 4.9
Data collected by Hospital Team, using INICC Surveillance forms and methods, applying CDC NSHN Criteria for HAIs. Data analyzed by Dr. Victor D. Rosenthal (VDR). Paper drafted by VDR, revised and approved by Hospital Team, and submitted to the journal by VDR
Device-associated infection rates in adult intensive care units of Cuban university hospitals: International Nosocomial Infection Control Consortium (INICC) findings. Guanche-Garcell H, Requejo-Pino O, Rosenthal VD, Morales-Pérez C, Delgado-González
O, Fernández-González D. Int J Infect Dis. 2011 May;15(5):e357-62.
Period of this Study: 2006-2009

Table 6. Microorganism profile in the participant ICUs. Hospital A, Havana, Cuba.
Microorganism related to DA-HAI
CLA-BSI related VAP related CAUTI related Overall %
Acinetobacter spp. 33.3% 15.4% 0% 10.3%
Escherichia coli 33.3% 15.4% 53.8% 34.5%
Klebsiella spp. 0% 23.1% 15.4% 17.2%
Pseudomonas spp. 0% 30.8% 7.7% 17.2%
Pneumoccoccus spp. 0% 7.7% 0% 3.4%
coagulasa negative Staphylococcus
33.3% 7.7% 23.1% 17.2%
Data collected by Hospital Team, using INICC Surveillance forms and methods, applying CDC NSHN Criteria for HAIs. Data analyzed by Dr. Victor D. Rosenthal (VDR). Paper drafted by VDR, revised and approved by Hospital Team, and submitted to the journal by VDR
Device-associated infection rates in adult intensive care units of Cuban university hospitals: International Nosocomial Infection Control Consortium (INICC) findings. Guanche-Garcell H, Requejo-Pino O, Rosenthal VD, Morales-Pérez C, Delgado-González
O, Fernández-González D. Int J Infect Dis. 2011 May;15(5):e357-62.
Period of this Study: 2006-2009

Data collected by Hospital Team, using INICC Surveillance forms and methods, applying CDC NSHN Criteria for HAIs. Data analyzed by Dr. Victor D. Rosenthal (VDR). Paper drafted by VDR, revised and approved by Hospital Team, and submitted to the journal by VDR

Table 1. Features of the consortium hospitals, ICUs and patients studied
Hospital A Hospital B Hospital C Overall
Hospitals, n 1 1 1 3 Academic Teaching 0 0 0 0 Public 1 0 1 2 (66.7%) Private Community 0 1 0 1 (33.3%) ICUs, n 1 1 1 3 Experience of ICP (range), years 8 2 8 6 Patients n 473 357 345 1175 Patients-days n 2129 1577 1935 5641 Sex % (male) 50.1 64.4 56.5 56.3 (662/5641) Age 47.3 61.6 62.5 56.1 ASIS score, mean 2.76 2.28 3.17 2.70
Data collected by Hospital Team, using INICC Surveillance forms and methods, applying CDC NSHN Criteria for HAIs. Data analyzed by Dr. Victor D. Rosenthal (VDR). Paper drafted by VDR, revised and approved by Hospital Team, and submitted to the journal by VDR
Device-associated infection rates and mortality in intensive care units of Peruvian hospitals: findings of the International Nosocomial Infection Control Consortium. Cuellar LE, Fernandez-Maldonado E, Rosenthal VD, Castaneda-Sabogal A, Rosales
R, Mayorga-Espichan MJ, Camacho-Cosavalente LA, Castillo-Bravo LI. Rev Panam Salud Publica. 2008 Jul;24(1):16-24.
Period of this Study: 2003-2007

Table 2. Global rates of health care associated infection by 100 patients and by 1000 bed days
Hospital A Hospital B Hospital C Overall
Number of HCAI 46 48 38 132
Number of patients 473 357 345 1175
HCAI (%) 9.7 13.4 11.0 11.2
Bed days 2129 1577 1935 5641
HCAI per 1000 bed days
21.6 30.4 19.6 23.4
Data collected by Hospital Team, using INICC Surveillance forms and methods, applying CDC NSHN Criteria for HAIs. Data analyzed by Dr. Victor D. Rosenthal (VDR). Paper drafted by VDR, revised and approved by Hospital Team, and submitted to the journal by VDR
Device-associated infection rates and mortality in intensive care units of Peruvian hospitals: findings of the International Nosocomial Infection Control Consortium. Cuellar LE, Fernandez-Maldonado E, Rosenthal VD, Castaneda-Sabogal A, Rosales
R, Mayorga-Espichan MJ, Camacho-Cosavalente LA, Castillo-Bravo LI. Rev Panam Salud Publica. 2008 Jul;24(1):16-24.
Period of this Study: 2003-2007

Table 3. Proportion of Health care associated infections in the ICU studied
Hospital A Hospital B Hospital C Overall
Total NI 46 48 38 132
Proportion of VAP (%) 69.6 47.9 65.8 60.6
Proportion of CVC-related BSI (%)
13.0 29.2 26.3 22.7
Proportion of CAUTI (%) 17.4 22.9 7.9 16.7
Data collected by Hospital Team, using INICC Surveillance forms and methods, applying CDC NSHN Criteria for HAIs. Data analyzed by Dr. Victor D. Rosenthal (VDR). Paper drafted by VDR, revised and approved by Hospital Team, and submitted to the journal by VDR
Device-associated infection rates and mortality in intensive care units of Peruvian hospitals: findings of the International Nosocomial Infection Control Consortium. Cuellar LE, Fernandez-Maldonado E, Rosenthal VD, Castaneda-Sabogal A, Rosales
R, Mayorga-Espichan MJ, Camacho-Cosavalente LA, Castillo-Bravo LI. Rev Panam Salud Publica. 2008 Jul;24(1):16-24.
Period of this Study: 2003-2007
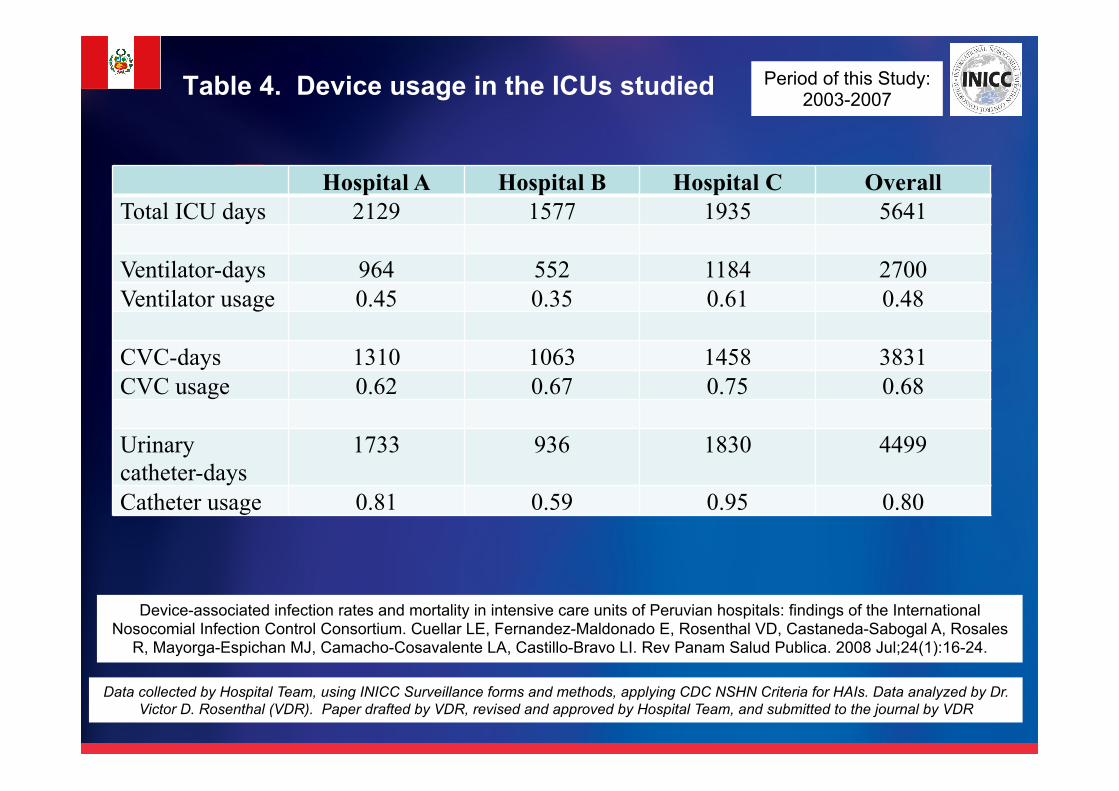
Table 4. Device usage in the ICUs studied
Hospital A Hospital B Hospital C Overall Total ICU days 2129 1577 1935 5641 Ventilator-days 964 552 1184 2700 Ventilator usage 0.45 0.35 0.61 0.48 CVC-days 1310 1063 1458 3831 CVC usage 0.62 0.67 0.75 0.68 Urinary catheter-days
1733 936 1830 4499
Catheter usage 0.81 0.59 0.95 0.80
Data collected by Hospital Team, using INICC Surveillance forms and methods, applying CDC NSHN Criteria for HAIs. Data analyzed by Dr. Victor D. Rosenthal (VDR). Paper drafted by VDR, revised and approved by Hospital Team, and submitted to the journal by VDR
Device-associated infection rates and mortality in intensive care units of Peruvian hospitals: findings of the International Nosocomial Infection Control Consortium. Cuellar LE, Fernandez-Maldonado E, Rosenthal VD, Castaneda-Sabogal A, Rosales
R, Mayorga-Espichan MJ, Camacho-Cosavalente LA, Castillo-Bravo LI. Rev Panam Salud Publica. 2008 Jul;24(1):16-24.
Period of this Study: 2003-2007

Table 5. Overall microbiological profile and bacterial resistance in the participant ICUs
Hospital A Hospital B Hospital C Overall Proportion of cases (%): Acinetobacter 7.5 (3/40) 0 8.0 (2/25) 4.7 (5/107) Candida spp. 10.0 (4/40) 33.3 (14/42) 0 16.8 (18/107) Citrobacter 0 0 4.0 (1/25) 0.9 (1/107) E.Coli 10.0 (4/40) 11.9 (5/107) 8.0 (2/25) 10.3 (11/107) Enterobacter 10.0 (4/40) 19.0 (8/42) 4.0 (1/25) 12.1 (13/107) Enterococcus 7.5 (3/40) 0 4.0 (1/25) 3.7 (4/107) Klebsiella 5.0 (2/40) 2.4 (1/42) 16.0 (4/25) 6.5 (7/107) Pseudomonas aeruginosa 12.5 (5/40) 14.3 (6/42) 20.0 (5/25) 15.0 (16/107) Staphylococcus aureus 20.0 (8/40) 11.9 (5/42) 32.0 (8/25) 19.6 (21/107) Coagulase-negative staphylococci 15.0 (6/40) 0 4.0 (1/25) 6.5 (7/107) Streptococcus sp 0 7.1 (3/42) 0 2.8 (3/107) Stenotropomonas 2.5 (1/40) 0 0 0.9 (1/107) Susceptibility of microorganisms (% resistant):
S. aureus / methicillin (MRSA) 90.0 (9/10) 33.3 (3/9) 94.7 (18/19) 78.9 (30/38) Enterobacteriaceae / ceftriaxone 0.0 (0/2) 6.8 (3/44) 71.4 (20/28) 31.1 (23/74) Enterobacteriaceae / ceftazidima 50.0 (2/4) 5.1 (2/39) 70.8 (17/24) 31.3 (21/67) Enterobacteriaceae / piperacillin tazobactam
0.0 (0/1) 0.0 (0/4) 34.6 (9/26) 29.0 (9/31)
P. aeruginosa / ciprofloxacina 60.0 (3/5) 42.9 (3/7) 82.4 (14/17) 69.0 (20/29) P. aeruginosa / ceftazidima 57.1 (4/7) 46.2 (6/13) 77.8 (14/18) 63.2 (24/38) P. aeruginosa / imipenem 0.0 (0/3) 50.0 (1/2) 52.9 (9/17) 45.5 (10/22) P. aeruginosa / piperacilin tazobactam 0 0.0 (0/1) 33.3 (6/18) 31.6 (6/19) Enterococci/ vancomycin 0 0 0 0.0 (0/0) Acinetobacter / piperacilin tazobactam 0 0 75.0 (3/4) 75.0 (3/4)
Data collected by Hospital Team, using INICC Surveillance forms and methods, applying CDC NSHN Criteria for HAIs. Data analyzed by Dr. Victor D. Rosenthal (VDR). Paper drafted by VDR, revised and approved by Hospital Team, and submitted to the journal by VDR
Device-associated infection rates and mortality in intensive care units of Peruvian hospitals: findings of the International Nosocomial Infection Control Consortium. Cuellar LE, Fernandez-Maldonado E, Rosenthal VD, Castaneda-Sabogal A, Rosales
R, Mayorga-Espichan MJ, Camacho-Cosavalente LA, Castillo-Bravo LI. Rev Panam Salud Publica. 2008 Jul;24(1):16-24.
Period of this Study: 2003-2007
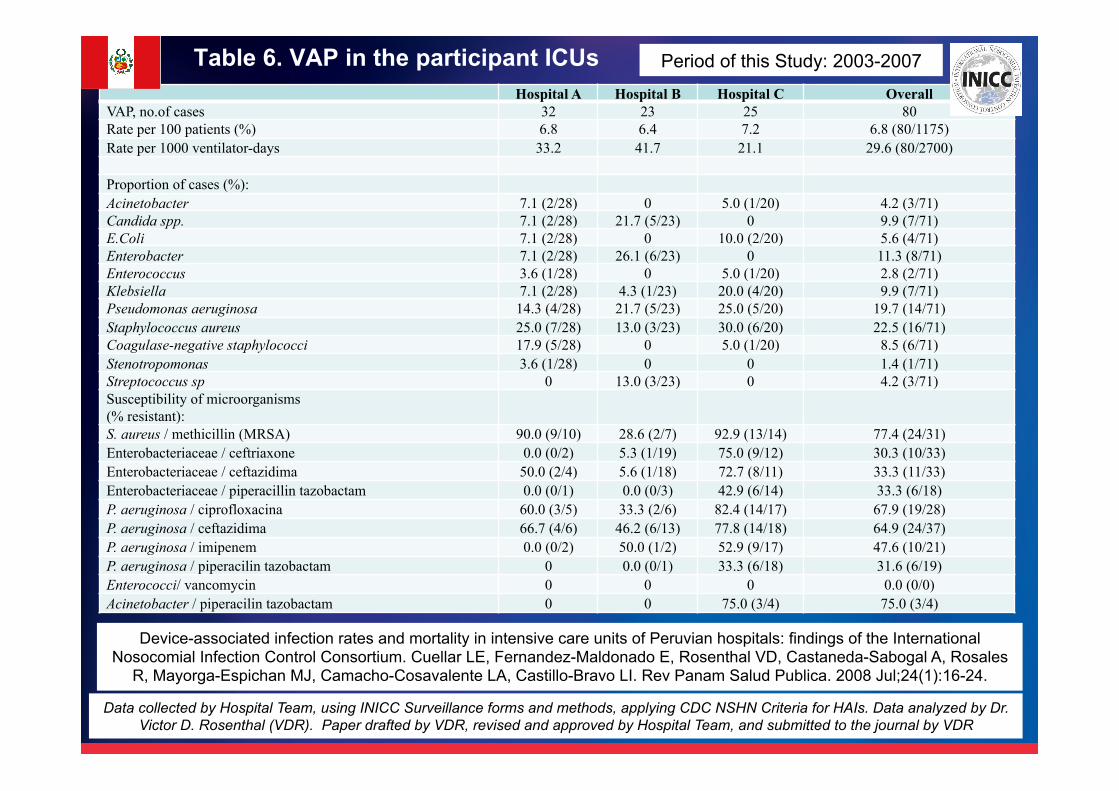
Table 6. VAP in the participant ICUs Hospital A Hospital B Hospital C Overall VAP, no.of cases 32 23 25 80 Rate per 100 patients (%) 6.8 6.4 7.2 6.8 (80/1175) Rate per 1000 ventilator-days 33.2 41.7 21.1 29.6 (80/2700) Proportion of cases (%): Acinetobacter 7.1 (2/28) 0 5.0 (1/20) 4.2 (3/71) Candida spp. 7.1 (2/28) 21.7 (5/23) 0 9.9 (7/71) E.Coli 7.1 (2/28) 0 10.0 (2/20) 5.6 (4/71) Enterobacter 7.1 (2/28) 26.1 (6/23) 0 11.3 (8/71) Enterococcus 3.6 (1/28) 0 5.0 (1/20) 2.8 (2/71) Klebsiella 7.1 (2/28) 4.3 (1/23) 20.0 (4/20) 9.9 (7/71) Pseudomonas aeruginosa 14.3 (4/28) 21.7 (5/23) 25.0 (5/20) 19.7 (14/71) Staphylococcus aureus 25.0 (7/28) 13.0 (3/23) 30.0 (6/20) 22.5 (16/71) Coagulase-negative staphylococci 17.9 (5/28) 0 5.0 (1/20) 8.5 (6/71) Stenotropomonas 3.6 (1/28) 0 0 1.4 (1/71) Streptococcus sp 0 13.0 (3/23) 0 4.2 (3/71) Susceptibility of microorganisms (% resistant):
S. aureus / methicillin (MRSA) 90.0 (9/10) 28.6 (2/7) 92.9 (13/14) 77.4 (24/31) Enterobacteriaceae / ceftriaxone 0.0 (0/2) 5.3 (1/19) 75.0 (9/12) 30.3 (10/33) Enterobacteriaceae / ceftazidima 50.0 (2/4) 5.6 (1/18) 72.7 (8/11) 33.3 (11/33) Enterobacteriaceae / piperacillin tazobactam 0.0 (0/1) 0.0 (0/3) 42.9 (6/14) 33.3 (6/18) P. aeruginosa / ciprofloxacina 60.0 (3/5) 33.3 (2/6) 82.4 (14/17) 67.9 (19/28) P. aeruginosa / ceftazidima 66.7 (4/6) 46.2 (6/13) 77.8 (14/18) 64.9 (24/37) P. aeruginosa / imipenem 0.0 (0/2) 50.0 (1/2) 52.9 (9/17) 47.6 (10/21) P. aeruginosa / piperacilin tazobactam 0 0.0 (0/1) 33.3 (6/18) 31.6 (6/19) Enterococci/ vancomycin 0 0 0 0.0 (0/0) Acinetobacter / piperacilin tazobactam 0 0 75.0 (3/4) 75.0 (3/4)
Data collected by Hospital Team, using INICC Surveillance forms and methods, applying CDC NSHN Criteria for HAIs. Data analyzed by Dr. Victor D. Rosenthal (VDR). Paper drafted by VDR, revised and approved by Hospital Team, and submitted to the journal by VDR
Device-associated infection rates and mortality in intensive care units of Peruvian hospitals: findings of the International Nosocomial Infection Control Consortium. Cuellar LE, Fernandez-Maldonado E, Rosenthal VD, Castaneda-Sabogal A, Rosales
R, Mayorga-Espichan MJ, Camacho-Cosavalente LA, Castillo-Bravo LI. Rev Panam Salud Publica. 2008 Jul;24(1):16-24.
Period of this Study: 2003-2007

Table 7. CVC- related BSI in the participant ICUs
Hospital A Hospital B Hospital C Overall CVC-related BSI, no. of cases 6 14 10 30 Rate per 100 patients (%) 1.3 3.9 2.9 2.6 (30/1775) Rate per 1000 CVC-days 4.6 13.2 6.9 7.8 (30/3831) Proportion of cases (%): Acinetobacter spp 0 0 33.3 (1/3) 6.3 (1/16) Candida spp. 40.0 (2/5) 37.5 (3/8) 0 31.3 (5/16) Enterobacter 20.0 (1/5) 25.0 (2/8) 0 18.8 (3/16) Pseudomonas aeruginosa 0 12.5 (1/8) 0 6.3 (1/16) Staphylococcus aureus 20.0 (1/5) 25.0 (2/8) 66.7 (2/3) 31.3 (5/16) Coagulase-negative staphylococci 20.0 (1/5) 0 0 6.3 (1/16) Susceptibility of microorganisms (% resistant):
S. aureus / methicillin (MRSA) 0 50.0 (1/2) 100.0 (5/5) 85.7 (6/7) Enterobacteriaceae / ceftriaxone 0 20.0 (1/5) 80.0 (4/5) 50.0 (5/10) Enterobacteriaceae / ceftazidima 0 0.0 (0/2) 100.0 (2/2) 50.0 (2/4) Enterobacteriaceae / piperacillin tazobactam 0 0.0 (0/1) 14.3 (1/7) 12.5 (1/8)
P. aeruginosa / ciprofloxacina 0 100.0 (1/1) 0 100.0 (1/1) P. aeruginosa / ceftazidima 0 0 0 0 (0/0) P. aeruginosa / imipenem 0 0 0 0 (0/0) P. aeruginosa / piperacillin tazobactam 0 0 0 0 (0/0)
Enterococci / vancomycin 0 0 0 0 (0/0) Acinetobacter / piperacillin tazobactam 0 0 0 0 (0/0)
Data collected by Hospital Team, using INICC Surveillance forms and methods, applying CDC NSHN Criteria for HAIs. Data analyzed by Dr. Victor D. Rosenthal (VDR). Paper drafted by VDR, revised and approved by Hospital Team, and submitted to the journal by VDR
Device-associated infection rates and mortality in intensive care units of Peruvian hospitals: findings of the International Nosocomial Infection Control Consortium. Cuellar LE, Fernandez-Maldonado E, Rosenthal VD, Castaneda-Sabogal A, Rosales
R, Mayorga-Espichan MJ, Camacho-Cosavalente LA, Castillo-Bravo LI. Rev Panam Salud Publica. 2008 Jul;24(1):16-24.
Period of this Study: 2003-2007

Table 8. CAUTI in the participant ICUs Hospital A Hospital B Hospital C Overall CAUTI, no. of cases 8 11 3 22 Rate per 100 patients (%) 1.7 3.1 0.9 1.9 (22/1175) Rate per 1000 catheter-days 4.6 11.8 1.6 4.9 (30/4499) Proportion of cases (%): Acinetobacter 14.3 (1/7) 0 0 5.0 (1/20) Candida spp. 0 54.5 (6/11) 0 30.0 (6/20) Citrobacter 0 0 50.0 (1/2) 5.0 (1/20) E.Coli 28.6 (2/7) 45.5 (5/11) 0 35.0 (7/20) Enterobacter 14.3 (1/7) 0 50.0 (1/2) 10.0 (2/20) Enterococcus 28.6 (2/17) 0 0 10.0 (2/20) Pseudomonas aeruginosa 14.3 (1/7) 0 0 5.0 (1/20) Susceptibility of microorganisms (% resistant):
S. aureus / methicillin (MRSA) 0 0 0 0.0 (0/0) Enterobacteriaceae / ceftriaxone 0 5.0 (1/20) 63.6 (7/11) 25.8 (8/31) Enterobacteriaceae / ceftazidima 0 5.3 (1/19) 63.6 (7/11) 26.7 (8/30) Enterobacteriaceae / piperacillin tazobactam 0 0 40.0 (2/5) 40.0 (2/5) P. aeruginosa / ciprofloxacina 0 0 0 0.0 (0/0) P. aeruginosa / ceftazidima 0.0 (0/1) 0 0 0.0 (0/1) P. aeruginosa / imipenem 0.0 (0/1) 0 0 0.0 (0/1) P. aeruginosa / piperacillin tazobactam 0 0 0 0.0 (0/0) Enterococci / vancomycin 0 0 0 0.0 (0/0) Acinetobacter / piperacillin tazobactam 0 0 0 0.0 (0/0)
Data collected by Hospital Team, using INICC Surveillance forms and methods, applying CDC NSHN Criteria for HAIs. Data analyzed by Dr. Victor D. Rosenthal (VDR). Paper drafted by VDR, revised and approved by Hospital Team, and submitted to the journal by VDR
Device-associated infection rates and mortality in intensive care units of Peruvian hospitals: findings of the International Nosocomial Infection Control Consortium. Cuellar LE, Fernandez-Maldonado E, Rosenthal VD, Castaneda-Sabogal A, Rosales
R, Mayorga-Espichan MJ, Camacho-Cosavalente LA, Castillo-Bravo LI. Rev Panam Salud Publica. 2008 Jul;24(1):16-24.
Period of this Study: 2003-2007
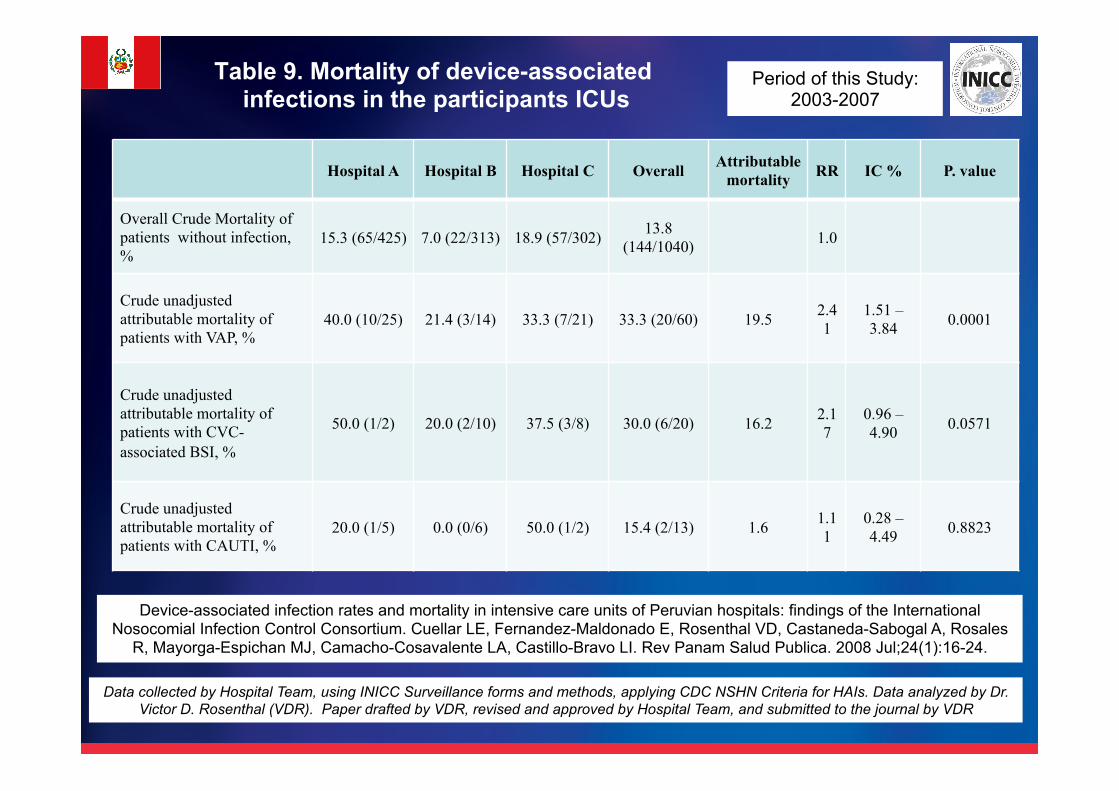
Table 9. Mortality of device-associated infections in the participants ICUs
Hospital A Hospital B Hospital C Overall Attributable mortality RR IC % P. value
Overall Crude Mortality of patients without infection, %
15.3 (65/425) 7.0 (22/313) 18.9 (57/302) 13.8 (144/1040) 1.0
Crude unadjusted attributable mortality of patients with VAP, %
40.0 (10/25) 21.4 (3/14) 33.3 (7/21) 33.3 (20/60) 19.5 2.41
1.51 – 3.84 0.0001
Crude unadjusted attributable mortality of patients with CVC-associated BSI, %
50.0 (1/2) 20.0 (2/10) 37.5 (3/8) 30.0 (6/20) 16.2 2.17
0.96 – 4.90 0.0571
Crude unadjusted attributable mortality of patients with CAUTI, %
20.0 (1/5) 0.0 (0/6) 50.0 (1/2) 15.4 (2/13) 1.6 1.11
0.28 – 4.49 0.8823
Data collected by Hospital Team, using INICC Surveillance forms and methods, applying CDC NSHN Criteria for HAIs. Data analyzed by Dr. Victor D. Rosenthal (VDR). Paper drafted by VDR, revised and approved by Hospital Team, and submitted to the journal by VDR
Device-associated infection rates and mortality in intensive care units of Peruvian hospitals: findings of the International Nosocomial Infection Control Consortium. Cuellar LE, Fernandez-Maldonado E, Rosenthal VD, Castaneda-Sabogal A, Rosales
R, Mayorga-Espichan MJ, Camacho-Cosavalente LA, Castillo-Bravo LI. Rev Panam Salud Publica. 2008 Jul;24(1):16-24.
Period of this Study: 2003-2007

Table 10. Comparison of device utilization and rates of device–associated health care associated infection in the ICUs of
Peru and in U.S. ICUs.
U.S. NNIS- 1992-2004
Hospitals RR
Device utilization Mechanical ventilator 0.35 – 0.43* 0.48 (0.35 – 0.61) + 1.11 Central vascular catheter 0.49 - 0.56 0.68 (0.62 – 0.75) 1.21 Urinary catheter 0.78 – 0.82 0.80 (0.59 – 0.95) 0.97
Rates, per 1000 device-days
Ventilator-associated pneumonia 4.6 – 5.1 29.6 (21.1 – 41.7) 5.80
CVC-associated bloodstream infection 3.1 - 3.4 7.8 (4.6 – 13.2) 2.29
Catheter-associated urinary tract infection 3.1- 3.3 4.9 (4.6 – 11.8) 1.48
Proportion (%) of device-associated infections with resistance:
S.aureus / methicillin. 48.1 78.9 (30/38) 1.64 Enterobacteriaceae / ceftriaxone 17.4 31.1 (23/74) 1.78
Enterococci / vancomycin 29.1 0.0 (0/0) -
Data collected by Hospital Team, using INICC Surveillance forms and methods, applying CDC NSHN Criteria for HAIs. Data analyzed by Dr. Victor D. Rosenthal (VDR). Paper drafted by VDR, revised and approved by Hospital Team, and submitted to the journal by VDR
Device-associated infection rates and mortality in intensive care units of Peruvian hospitals: findings of the International Nosocomial Infection Control Consortium. Cuellar LE, Fernandez-Maldonado E, Rosenthal VD, Castaneda-Sabogal A, Rosales
R, Mayorga-Espichan MJ, Camacho-Cosavalente LA, Castillo-Bravo LI. Rev Panam Salud Publica. 2008 Jul;24(1):16-24.
Period of this Study: 2003-2007

Data collected by Hospital Team, using INICC Surveillance forms and methods, applying CDC NSHN Criteria for HAIs. Data analyzed by Dr. Victor D. Rosenthal (VDR). Paper drafted by VDR, revised and approved by Hospital Team, and submitted to the journal by VDR

Table 1. Features of the pediatric and neonatal Intensive Care Units
Variable pediatric ICU neonatal ICU Overall
ICUs, n 1 1
Patients studied, n 1,145 1,270 2,415
Total ICU days, d 9,517 30,663 40,180
Device use*
Ventilator days, d 7,709 8,634 16,343
Ventilator use 0.81 0.28 0.41
Central line days, d 6,344 15,819 22,163
Central line use 0.67 0.52 0.55
Urinary catheter days, d 3,437 - 3,437
Urinary catheter use** 0.36 - 0.36
Data collected by Hospital Team, using INICC Surveillance forms and methods, applying CDC NSHN Criteria for HAIs. Data analyzed by Dr. Victor D. Rosenthal (VDR). Paper drafted by VDR, revised and approved by Hospital Team, and submitted to the journal by VDR
Device-associated infections rates in pediatrics and neonatal intensive care units in El Salvador: findings of the INICC. Dueñas L, Bran de Casares A, Rosenthal VD, Jesús Machuca L. J Infect Dev Ctries. 2011 Jul 4;5(6):445-51.
Period of this Study: 2007-2009

Table 2. Device-associated infections per 1000 devices days: VAP, CLA-BSI, and CAUTI in pediatric and neonatal ICU
ICU Infection site
Device type
Device- days
DA- HAI
Distribution of device associated HAI (%)
Rate per 100 patients (%)
Rate per 1000 device-days*
PICU
VAP MV 7,709 93 53 8.1 12.1 (95% CI 9.7 – 14.8)
CLA-BSI CL 6,344 64 36 5.6 10.1 (95% CI 7.8 – 12.8)
CAUTI UC 3,437 20 11 1.7 5.8 (95% CI 3.6 – 9.0)
NICU VAP MV 8,634 139 47 10.9 16.1 (95% CI 13.5 – 19.0)
CLA-BSI CL 15,819 157 53 12.4 9.9 (95% CI 8.4 – 11.6)
Data collected by Hospital Team, using INICC Surveillance forms and methods, applying CDC NSHN Criteria for HAIs. Data analyzed by Dr. Victor D. Rosenthal (VDR). Paper drafted by VDR, revised and approved by Hospital Team, and submitted to the journal by VDR
Device-associated infections rates in pediatrics and neonatal intensive care units in El Salvador: findings of the INICC. Dueñas L, Bran de Casares A, Rosenthal VD, Jesús Machuca L. J Infect Dev Ctries. 2011 Jul 4;5(6):445-51.
Period of this Study: 2007-2009

Table 3. Extra mortality of patients with device-associated nosocomial infections in the pediatric
and neonatal ICUs
ICU Patient infection site number of patients*
Crude Mortality
Extra Mortality (%)
RR 95% CI P-value
PICU
no HAI, % 994 13.6% - 1.0 11.5 – 15.9
CLA-BSI 40 25.0% 11.4 1.84 0.97 - 3.50 0.0586
VAP 63 19.0% 5.5 1.4 0.78 - 2.53 0.2592
CAUTI 11 18.2% 4.6 1.34 0.33 - 5.41 0.681
NICU
no HAI 962 12.3% - 1.0
CLA-BSI 108 38.0% 25.7 3.09 2.17 - 4.42 0.0001
VAP 100 23.0% 10.7 1.88 1.20 - 2.93 0.0050
Data collected by Hospital Team, using INICC Surveillance forms and methods, applying CDC NSHN Criteria for HAIs. Data analyzed by Dr. Victor D. Rosenthal (VDR). Paper drafted by VDR, revised and approved by Hospital Team, and submitted to the journal by VDR
Device-associated infections rates in pediatrics and neonatal intensive care units in El Salvador: findings of the INICC. Dueñas L, Bran de Casares A, Rosenthal VD, Jesús Machuca L. J Infect Dev Ctries. 2011 Jul 4;5(6):445-51.
Period of this Study: 2007-2009

Table 4. Extra length of stay of patients with device-associated nosocomial infections in the
pediatric and neonatal ICUs.
ICU Patient infection site* Average Length of Stay
Extra Length of Stay RR 95% CI
PICU
no HAI 6.2 - 6.2 5.8 - 6.5
CLA-BSI 19.1 12.9 19.1 14.1 - 26.5
VAP 18.6 12.4 18.6 11.8 - 24.0
CAUTI 13.5 7.4 13.5 7.8 - 26.8
NICU
no HAI 16.7 16.7 15.7 - 17.8
CLA-BSI 37.7 21.0 37.7 31.3 - 45.9
VAP 42.3 25.5 42.3 34.8 - 51.9
Data collected by Hospital Team, using INICC Surveillance forms and methods, applying CDC NSHN Criteria for HAIs. Data analyzed by Dr. Victor D. Rosenthal (VDR). Paper drafted by VDR, revised and approved by Hospital Team, and submitted to the journal by VDR
Device-associated infections rates in pediatrics and neonatal intensive care units in El Salvador: findings of the INICC. Dueñas L, Bran de Casares A, Rosenthal VD, Jesús Machuca L. J Infect Dev Ctries. 2011 Jul 4;5(6):445-51.
Period of this Study: 2007-2009
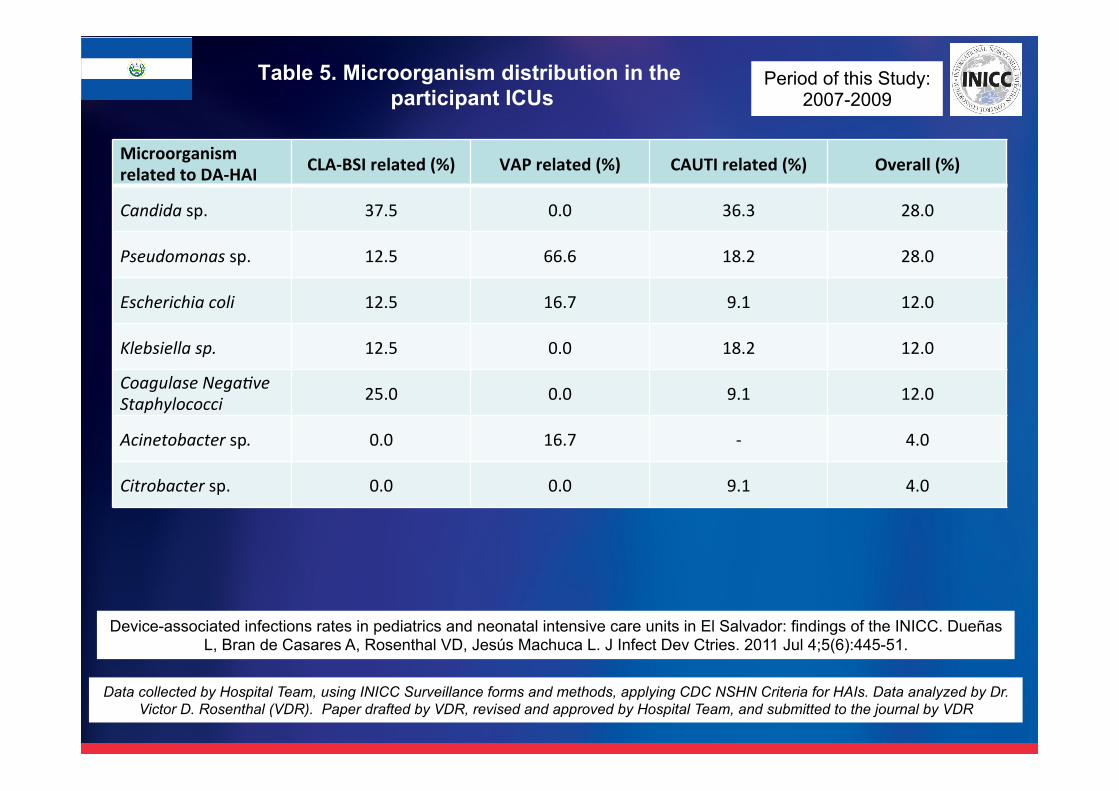
Table 5. Microorganism distribution in the participant ICUs
Microorganism related to DA-‐HAI CLA-‐BSI related (%) VAP related (%) CAUTI related (%) Overall (%)
Candida sp. 37.5 0.0 36.3 28.0
Pseudomonas sp. 12.5 66.6 18.2 28.0
Escherichia coli 12.5 16.7 9.1 12.0
Klebsiella sp. 12.5 0.0 18.2 12.0
Coagulase Nega8ve Staphylococci 25.0 0.0 9.1 12.0
Acinetobacter sp. 0.0 16.7 -‐ 4.0
Citrobacter sp. 0.0 0.0 9.1 4.0
Data collected by Hospital Team, using INICC Surveillance forms and methods, applying CDC NSHN Criteria for HAIs. Data analyzed by Dr. Victor D. Rosenthal (VDR). Paper drafted by VDR, revised and approved by Hospital Team, and submitted to the journal by VDR
Device-associated infections rates in pediatrics and neonatal intensive care units in El Salvador: findings of the INICC. Dueñas L, Bran de Casares A, Rosenthal VD, Jesús Machuca L. J Infect Dev Ctries. 2011 Jul 4;5(6):445-51.
Period of this Study: 2007-2009

Peer Review Manuscripts indexed in Pubmed, published by INICC
Members from: Europe

Data collected by Hospital Team, using INICC Surveillance forms and methods, applying CDC NHSN Criteria for HAIs. Data analyzed by Dr. Victor D. Rosenthal (VDR). Paper drafted by VDR, revised and approved by Hospital Team, and submitted to the journal by VDR

Table I. Features of the consortium hospitals and patients studied ICUs
Hospital
A B C D E F G H I J K L Overall
Hospitals, n 1 1 1 1 1 1 1 1 1 1 1 1 12
ICUs, n 1 2 1 1 1 1 1 1 1 1 1 1 13
Experience
of ICP
(range),
years
3 13 5 5 7 3 12 3 8 4 6 3 3-13
Surveillan
ce period 10/03 to
04/06 9/03 to
12/05 6/04 to
4/06 1/04 to
1/06 1/04 to
1/06 8/03 to
10/04 1/04 to
2/06 5/05 to
1/06 1/04 to
8/04 9/05 to
12/05 2/04 to
5/04 10/05 to
3/06 8/03 to
04/06
Patients n 656 479 412 343 337 317 310 220 53 34 21 106 3,288
Patients-
days n 6,512 6,543 6,154 3,190 4,313 3,230 4,106 1,427 620 490 393 653 37,631
ASIS score,
mean 4.47 2.46 3.61 2.55 3.11 4.11 3.59 3.44 3.68 3.47 3.10 3.27 3.47
Sex (male),
% 61.4 56.3 73.2 62.2 64.2 53.9 53.0 65.5 50.9 67.6 52.4 61.3 61.0
Age (years),
mean 51.9 52.5 42.1 49.2 47.9 59.0 46.1 39.7 58.1 57.5 65.6 59.06 49.86
Data collected by Hospital Team, using INICC Surveillance forms and methods, applying CDC NHSN Criteria for HAIs. Data analyzed by Dr. Victor D. Rosenthal (VDR). Paper drafted by VDR, revised and approved by Hospital Team, and submitted to the journal by VDR
Device-associated hospital-acquired infection rates in Turkish intensive care units. Findings of the International Nosocomial Infection Control Consortium (INICC). Leblebicioglu H, Rosenthal VD, Arikan OA, Ozgültekin A, Yalcin AN, Koksal I, Usluer G,
Sardan YC, Ulusoy S; Turkish Branch of INICC. J Hosp Infect. 2007 Mar;65(3):251-7.
Period of this Study: 2002-2005
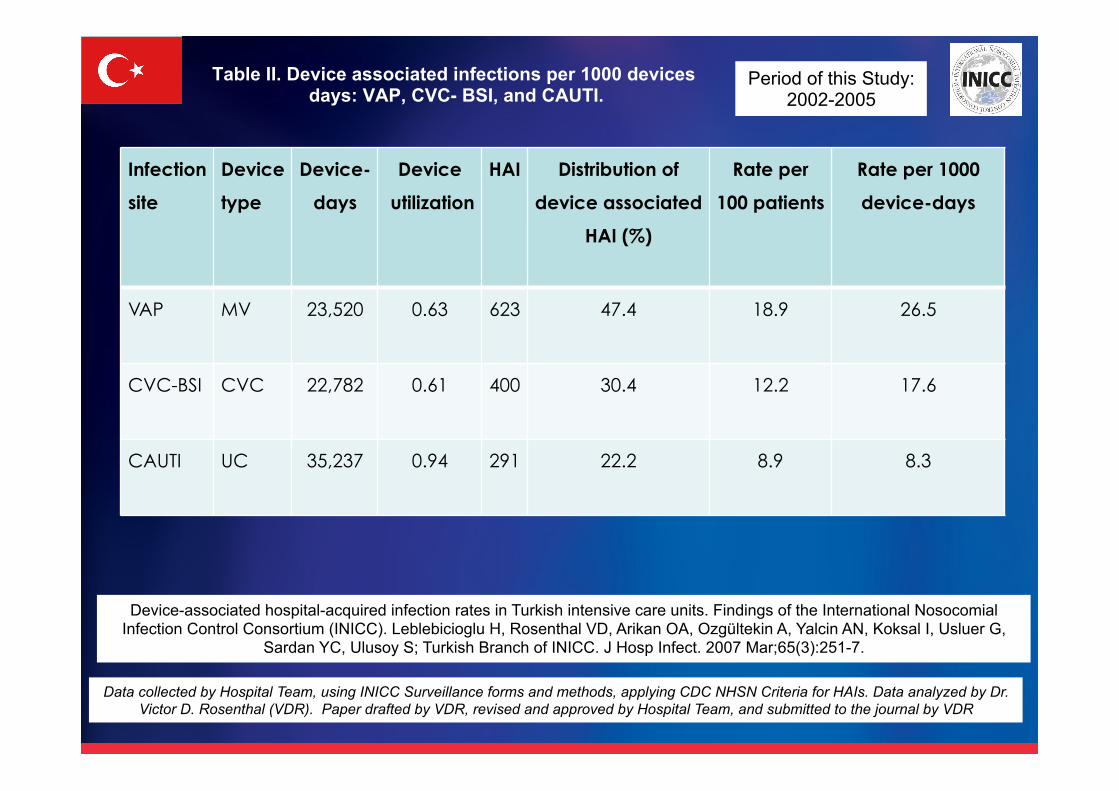
Table II. Device associated infections per 1000 devices days: VAP, CVC- BSI, and CAUTI.
Infection
site Device
type Device-
days Device
utilization HAI Distribution of
device associated
HAI (%)
Rate per
100 patients Rate per 1000
device-days
VAP MV 23,520 0.63 623 47.4 18.9 26.5
CVC-BSI CVC 22,782 0.61 400 30.4 12.2 17.6
CAUTI UC 35,237 0.94 291 22.2 8.9 8.3
Data collected by Hospital Team, using INICC Surveillance forms and methods, applying CDC NHSN Criteria for HAIs. Data analyzed by Dr. Victor D. Rosenthal (VDR). Paper drafted by VDR, revised and approved by Hospital Team, and submitted to the journal by VDR
Device-associated hospital-acquired infection rates in Turkish intensive care units. Findings of the International Nosocomial Infection Control Consortium (INICC). Leblebicioglu H, Rosenthal VD, Arikan OA, Ozgültekin A, Yalcin AN, Koksal I, Usluer G,
Sardan YC, Ulusoy S; Turkish Branch of INICC. J Hosp Infect. 2007 Mar;65(3):251-7.
Period of this Study: 2002-2005

Table III. Overall susceptibility of microorganisms (% resistant):
Susceptibility of microorganisms % resistant S. aureus / methicillin (MRSA) 89.2 Enterobacteriaceae / ceftriaxone 48.2 Enterobacteriaceae / ceftazidima 52.0 Enterobacteriaceae / piperacillin tazobactam 33.2 P. aeruginosa / ciprofloxacina 51.1 P. aeruginosa / ceftazidima 50.7 P. aeruginosa / imipenem 38.7 P. aeruginosa / piperacilin tazobactam 30.0 Enterococci/ vancomycin 1.9 Acinetobacter / piperacilin tazobactam 87.1
Data collected by Hospital Team, using INICC Surveillance forms and methods, applying CDC NHSN Criteria for HAIs. Data analyzed by Dr. Victor D. Rosenthal (VDR). Paper drafted by VDR, revised and approved by Hospital Team, and submitted to the journal by VDR
Device-associated hospital-acquired infection rates in Turkish intensive care units. Findings of the International Nosocomial Infection Control Consortium (INICC). Leblebicioglu H, Rosenthal VD, Arikan OA, Ozgültekin A, Yalcin AN, Koksal I, Usluer G,
Sardan YC, Ulusoy S; Turkish Branch of INICC. J Hosp Infect. 2007 Mar;65(3):251-7.
Period of this Study: 2002-2005

Data collected by Hospital Team, using INICC Surveillance forms and methods, applying CDC NSHN Criteria for HAIs. Data analyzed by Dr. Victor D. Rosenthal (VDR). Paper drafted by VDR, revised and approved by Hospital Team, and submitted to the journal by VDR

Table 1. Characteristics of the Intensive Care Unit
Patients studied, n 847
Total ICU days, d 9,386
Device use*
Ventilator days, d 7,089
Ventilator use, 0.76
CL days, d 8,725
CL use, * 0.93
Urinary catheter days, d 8,720
Urinary catheter use, 0.93
Data collected by Hospital Team, using INICC Surveillance forms and methods, applying CDC NSHN Criteria for HAIs. Data analyzed by Dr. Victor D. Rosenthal (VDR). Paper drafted by VDR, revised and approved by Hospital Team, and submitted to the journal by VDR
Device-associated infection rates and extra length of stay in an intensive care unit of a university hospital in Wroclaw, Poland: International Nosocomial Infection Control Consortium's (INICC) findings. Kübler A, Duszynska W, Rosenthal VD, Fleischer M,
Kaiser T, Szewczyk E, Barteczko-Grajek B. J Crit Care. 2012 Feb;27(1):105.e5-10.
Period of this Study: 2007-2010

Table 2. Device associated infections rates (VAP, CLA-BSI, and CAUTI
Infection site Device type
Device- days
DA- HAI
Distribution of DA-HAI
(%)
Rate per 100 patients
Rate per 1000 device-days
VAP MV 7,089 129 62.6% 15.2% 18.2 (15.5 – 21.6)
CLA-BSI CL 8,725 35 17.0% 4.1% 4.01 (2.8 – 5.6)
CAUTI UC 8,720 42 20.4% 0.5% 4.8 (3.5 – 6.5)
Data collected by Hospital Team, using INICC Surveillance forms and methods, applying CDC NSHN Criteria for HAIs. Data analyzed by Dr. Victor D. Rosenthal (VDR). Paper drafted by VDR, revised and approved by Hospital Team, and submitted to the journal by VDR
Device-associated infection rates and extra length of stay in an intensive care unit of a university hospital in Wroclaw, Poland: International Nosocomial Infection Control Consortium's (INICC) findings. Kübler A, Duszynska W, Rosenthal VD, Fleischer M,
Kaiser T, Szewczyk E, Barteczko-Grajek B. J Crit Care. 2012 Feb;27(1):105.e5-10.
Period of this Study: 2007-2010

Table 3. Excess length of stay of patients with device-associated infections
Average Length of Stay
Extra Length of Stay 95% CI RR
Patients without infection, days 6.9 - 5.8 – 8.5 1.0
Patients with CLA-BSI, days 10.0 3.1 3.2 – 87.7 1.4
Patients with VAP, days 15.5 8.6 6.4 – 56.9 2.2
Patients with CAUTI, days 15.0 8.1 4.5 – 132.6 2.2
Data collected by Hospital Team, using INICC Surveillance forms and methods, applying CDC NSHN Criteria for HAIs. Data analyzed by Dr. Victor D. Rosenthal (VDR). Paper drafted by VDR, revised and approved by Hospital Team, and submitted to the journal by VDR
Device-associated infection rates and extra length of stay in an intensive care unit of a university hospital in Wroclaw, Poland: International Nosocomial Infection Control Consortium's (INICC) findings. Kübler A, Duszynska W, Rosenthal VD, Fleischer M,
Kaiser T, Szewczyk E, Barteczko-Grajek B. J Crit Care. 2012 Feb;27(1):105.e5-10.
Period of this Study: 2007-2010
Peer Review Manuscripts indexed in Pubmed, published by INICC
Members from: Asia

Data collected by Hospital Team, using INICC Surveillance forms and methods, applying CDC NHSN Criteria for HAIs. Data analyzed by Dr. Victor D. Rosenthal (VDR). Paper drafted by VDR, revised and approved by Hospital Team, and submitted to the journal by VDR

Table 1. Features of the participant Hospitals and patients.
Hospital A B C D E F G Overall
ICUs, n 1 3 4 1 1 1 1 12
Surveillance Period 7/04 to 7/05 9/04 to 5/06 4/06 to 3/07 7/05 to 3/07 1/05 to 3/06 1.07 to 3/07 2/06 to 3/06 7/04 to 3/07
Experience of the
infection control
practitioner, y
17 17 2 2 20 2 1 1-20
Patients studied, n 3,052 2,655 2,151 2,032 751 151 43 10,835
Total ICU days, d 15,302 14,681 8,121 10,532 2,873 791 218 52,518
Men, % 84.0 81.3 62.8 66.1 69.2 79.5 74.4 74.6
Mean age, y 58.2 57.6 55.76 56.37 43.46 49.32 42.7 56.0
Mean ASIS 2.34 2.10 3.15 2.51 3.69 3.99 2.70 2.60
Device use
Ventilator days, d 3,632 680 2,846 4,060 1,903 228 132 13,481
Ventilator use,
proportion 0.24 0.05 0.35 0.39 0.66 0.29 0.61 0.26
CVC days, d 17,960 5,030 3,054 7,081 3,196 30 196 36,857
CVC use,
proportion 1.17 0.34 0.38 0.67 1.11 0.43 0.90 0.70
Urinary catheter
days, d 9,213 3,748 5,289 8,519 2,824 662 209 30,464
Urinary catheter
use, proportion 0.60 0.26 0.65 0.81 0.98 0.84 0.96 0.58
Data collected by Hospital Team, using INICC Surveillance forms and methods, applying CDC NHSN Criteria for HAIs. Data analyzed by Dr. Victor D. Rosenthal (VDR). Paper drafted by VDR, revised and approved by Hospital Team, and submitted to the journal by VDR
Device-associated nosocomial infection rates in intensive care units of seven Indian cities. Findings of the International Nosocomial Infection Control Consortium (INICC). Mehta A, Rosenthal VD, Mehta Y, Chakravarthy M, Todi SK, Sen N, Sahu S, Gopinath R, Rodrigues C, Kapoor P, Jawali V, Chakraborty P, Raj JP, Bindhani D,
Ravindra N, Hegde A, Pawar M, Venkatachalam N, Chatterjee S, Trehan N, Singhal T, Damani N. J Hosp Infect. 2007 Oct;67(2):168-74.
Period of this Study: 2004-2007

Table 2. HAIs per 1000 devices days: VAP, CVC-BSI, and CAUTI.
Infection
site
Device
type
Device-
days
Device
utilization
HAI Distribution
of HAI (%)
Rate per
100
patients
Rate per
1000
device-
days
VAP MV 13,481 0.26 141 29.6% 1.3% 10.46
CVC-BSI CVC 36,857 0.70 292 61.3% 2.7% 7.92
CAUTI UC 30,464 0.58 43 9.0% 0.4% 1.41
Data collected by Hospital Team, using INICC Surveillance forms and methods, applying CDC NHSN Criteria for HAIs. Data analyzed by Dr. Victor D. Rosenthal (VDR). Paper drafted by VDR, revised and approved by Hospital Team, and submitted to the journal by VDR
Device-associated nosocomial infection rates in intensive care units of seven Indian cities. Findings of the International Nosocomial Infection Control Consortium (INICC). Mehta A, Rosenthal VD, Mehta Y, Chakravarthy M, Todi SK, Sen N, Sahu
S, Gopinath R, Rodrigues C, Kapoor P, Jawali V, Chakraborty P, Raj JP, Bindhani D, Ravindra N, Hegde A, Pawar M, Venkatachalam N, Chatterjee S, Trehan N, Singhal T, Damani N. J Hosp Infect. 2007 Oct;67(2):168-74.
Period of this Study: 2004-2007

Table 3. Comparison of DAI rates (per 1000 device-days) in the studied ICUs, in ICUs of the International Nosocomial Infection Control Consortium
(INICC) and the U.S. National Healthcare Safety Network (NHSN).
Studied ICUs 2002–2007
Pooled Mean
INICC 2002–2007
Pooled Mean (Interquartile range, 25%-75%)
U.S. NHSN 2005- 2006
Pooled Mean (Interquartile range, 25%-75%)
Coronary ICU CLAB 9.9 9.9 (0.0 – 11.8) 2.8 (0.0 - 4.2) CAUTI 6.4 6.4 (0.0 – 13.3) 4.6 (2.8 - 5.5) VAP 20.2 20.2 (7.3 – 33.2) 2.8 (0.0 - 4.5) Medical-surgical ICU CLAB 8.9 8.9 (3.7 – 16.5) 2.4 (0.6 – 3.1) CAUTI 6.6 6.6 (2.5 – 8.3) 3.4 (1.9 - 4.5) VAP 19.8 19.8 (9.6 – 24.1) 3.6 (1.3 - 5.1) Pediatric ICU CLAB 6.9 6.9 (7.9 – 19.2) 5.3 (1.1 - 6.5) CAU 4.0 4.0 (0.0 – 3.3) 5.2 (0.0 - 6.0) VAP 7.9 7.9 (3.0 – 14.2) 2.5 (0,0 - 2.8) Newborn ICU (1501-2500 g)
CLAB 15.2 15.2 (0.0 – 21.8) 4.2 (0.0 – 4.1) VAP 6.68 6.68 (0.0 – 4.2) 1.1 (0.0 – 0.2)
Data collected by Hospital Team, using INICC Surveillance forms and methods, applying CDC NHSN Criteria for HAIs. Data analyzed by Dr. Victor D. Rosenthal (VDR). Paper drafted by VDR, revised and approved by Hospital Team, and submitted to the journal by VDR
Device-associated nosocomial infection rates in intensive care units of seven Indian cities. Findings of the International Nosocomial Infection Control Consortium (INICC). Mehta A, Rosenthal VD, Mehta Y, Chakravarthy M, Todi SK, Sen N, Sahu
S, Gopinath R, Rodrigues C, Kapoor P, Jawali V, Chakraborty P, Raj JP, Bindhani D, Ravindra N, Hegde A, Pawar M, Venkatachalam N, Chatterjee S, Trehan N, Singhal T, Damani N. J Hosp Infect. 2007 Oct;67(2):168-74.
Period of this Study: 2004-2007

Table 4. Comparison of antimicrobial resistance rates (%)in the studied ICUs, in the ICUs of the International Nosocomial Infection Control
Consortium (INICCC) and the U.S. National Nosocomial Surveillance System (NNIS).
Pooled mean (range) (Interquartile range, 25%-75%)
Pooled mean (range) (Interquartile range, 25%-75%)
Pooled mean (range) (Interquartile range, 25%-75%)
Antimicrobial-resistant pathogen Studied ICUs 2002–2007
INICC 2002–2007 U.S. NNIS 1992- 2004
Methicillin-resistant Staph aureus (MRSA) 80.8 80.8 (50.0 – 100.0) 52.9 (32.7-603)
Methicillin-resistant coagulase-negative staphylococci
75.2 75.2 (64.0 – 100.0) 76.6 (69.4-83.8)
Vancomycin-resistant enterococcus spp 9.4 9.4 (0.0 – 6.3) 13.9 (5- 24.3)
Ciprofloxacin/ofloxacin-resistant Pseudomonas aeruginosa
52.4 52.4 (40.0 – 75.0) 34.8 (17.4-41.3)
Imipenem-resistant P aeruginosa 53.8 53.8 (0.0 – 100.0) 19.1 (8.3-25.5)
Ceftazidime-reisistant P aeruginosa 36.6 36.6 (0.0 – 52.4) 13.9 (5-16.9)
Piperacillin-resistant P aeruginosa 51.7 51.7 (33.3 – 72.7) 17.50 (7.5-19.5)
Ceph3-resistant Enterobacter spp 50.8 50.8 (36.4 – 75.0) 27.70 (17.4-36.4)
Carbapenem-resistant Enterobacter spp 59.8 59.8 (48.1 – 93.9) 0.70 (0.0-0.0)
Ceph3-resistant Klebsiella pneumoniae 7.8 7.8 (0.0-81.3) 6.20 (0.0-8.0)
Ceph3-resistant Escherichia coli 68.8 68.8 (25.0 – 90.3) 1.3 (0.0-2.6)
Ciprofloxacin/ofloxacin-resistant E coli 52.6 52.6 (0.0 – 75.1) 7.30 (0.0-8.2)
Data collected by Hospital Team, using INICC Surveillance forms and methods, applying CDC NHSN Criteria for HAIs. Data analyzed by Dr. Victor D. Rosenthal (VDR). Paper drafted by VDR, revised and approved by Hospital Team, and submitted to the journal by VDR
Device-associated nosocomial infection rates in intensive care units of seven Indian cities. Findings of the International Nosocomial Infection Control Consortium (INICC). Mehta A, Rosenthal VD, Mehta Y, Chakravarthy M, Todi SK, Sen N, Sahu
S, Gopinath R, Rodrigues C, Kapoor P, Jawali V, Chakraborty P, Raj JP, Bindhani D, Ravindra N, Hegde A, Pawar M, Venkatachalam N, Chatterjee S, Trehan N, Singhal T, Damani N. J Hosp Infect. 2007 Oct;67(2):168-74.
Period of this Study: 2004-2007

Data collected by Hospital Team, using INICC Surveillance forms and methods, applying CDC NHSN Criteria for HAIs. Data analyzed by Dr. Victor D. Rosenthal (VDR). Paper drafted by VDR, revised and approved by Hospital Team, and submitted to the journal by VDR

Table 1. Features of the participating hospitals
Variable Hospital, n (%) 70 (100%)
Type of Hospital Academic, n (%) 33 (47%)
Public, n (%) 37 (53%)
Complexity Level Complexity level 2, n (%) 36 (51%)
Complexity level 3, n (%) 34 (49%)
Number of ICP 1 ICP, n (%) 34 (49%)
2-3 ICPs, n (%) 28 (40%)
More tan 3 ICPs, n (%) 8 (11%)
Data collected by Hospital Team, using INICC Surveillance forms and methods, applying CDC NHSN Criteria for HAIs. Data analyzed by Dr. Victor D. Rosenthal (VDR). Paper drafted by VDR, revised and approved by Hospital Team, and submitted to the journal by VDR
Device-associated infection rates in 398 intensive care units in Shanghai, China: International Nosocomial Infection Control Consortium (INICC) findings. Tao L, Hu B, Rosenthal VD, Gao X, He L. Int J Infect Dis. 2011 Nov;15(11):e774-80.
Period of this Study: 2004-2009

Table 2. Pooled means and 95% CI of the distribution of central line-associated blood stream infection rates (per 1000 central line-days) and central line utilization ratios by type of
adult and pediatric ICUs: Type of ICU No of
ICUs No of
patients No of
CLABSI
CL-days Pooled mean
CLABSI rate
95% CI
Burn ICU 8 169 0 351 0.0 -
Cardiothoracic ICU 48 61189 332 166943 2.0 1.8 - 2.2
Coronary Care ICU 59 88287 190 59337 3.2 2.7 - 3.7
General ICU 47 64707 719 198871 3.6 3.4 - 3.9
Medical ICU 53 24664 164 38207 4.3 3.7 - 5.0
Neuro-Surgical ICU 43 26944 145 64521 2.2 1.9 - 2.6
Pediatric ICU 19 17365 68 19462 3.5 2.7 - 4.4
Respiratory ICU 48 10668 84 30598 2.7 2.2 - 3.4
Surgical ICU 64 95491 870 251631 3.5 3.2 - 3.7
Trauma ICU 9 2043 6 5394 1.1 0.4 - 2.4
Overall 398 391,527 2,578 835,313 3.1 3.0 – 3.2
Data collected by Hospital Team, using INICC Surveillance forms and methods, applying CDC NHSN Criteria for HAIs. Data analyzed by Dr. Victor D. Rosenthal (VDR). Paper drafted by VDR, revised and approved by Hospital Team, and submitted to the journal by VDR
Device-associated infection rates in 398 intensive care units in Shanghai, China: International Nosocomial Infection Control Consortium (INICC) findings. Tao L, Hu B, Rosenthal VD, Gao X, He L. Int J Infect Dis. 2011 Nov;15(11):e774-80.
Period of this Study: 2004-2009

Table 2. Pooled means and 95% CI of the distribution of central line-associated blood stream infection rates (per
1000 central line-days) and central line utilization ratios by type of adult and pediatric ICUs:
Type of ICU No of ICUs Central line-days
Patient days Pooled mean DUR
95% CI
Burn ICU 8 351 663 0.53 0.49 - 0.57
Cardiothoracic ICU 48 166943 416574 0.40 0.39 - 40.1
Coronary Care ICU 59 59337 691444 0.09 0.08 - 0.09
General ICU 47 198871 655734 0.30 0.30 - 0.30
Medical ICU 53 38207 213547 0.18 0.18 - 0.18
Neuro-Surgical ICU 43 64521 235930 0.27 0.27 - 0.28
Pediatric ICU 19 19462 195671 0.10 0.09 - 0.10
Respiratory ICU 48 30598 123524 0.25 0.24 - 0.25
Surgical ICU 64 251631 699138 0.36 0.36 - 0.36
Trauma ICU 9 5394 13019 0.41 0.41 - 0.43
Overall 398 835,313 3,245,243 0.26 0.26 – 0.26
Data collected by Hospital Team, using INICC Surveillance forms and methods, applying CDC NHSN Criteria for HAIs. Data analyzed by Dr. Victor D. Rosenthal (VDR). Paper drafted by VDR, revised and approved by Hospital Team, and submitted to the journal by VDR
Device-associated infection rates in 398 intensive care units in Shanghai, China: International Nosocomial Infection Control Consortium (INICC) findings. Tao L, Hu B, Rosenthal VD, Gao X, He L. Int J Infect Dis. 2011 Nov;15(11):e774-80.
Period of this Study: 2004-2009

Table 3. Pooled means and 95% CI of the distribution of Ventilator Associated Pneumonia rates (per 1000 mechanical ventilator-days)
and mechanical ventilator utilization ratios by type of adult and
Type of ICU No of ICUs
No of patients
No of VAP
MV days Pooled mean
VAP rate
95% CI
Burn ICU 8 169 1 134 7.5 0.1 - 40.9
Cardiothoracic ICU 48 61189 975 78901 12.4 11.6 - 13.1
Coronary Care ICU 59 88287 437 25507 17.1 16.0 - 18.8
General ICU 47 64707 4103 165007 24.9 24.1 - 25.6
Medical ICU 53 24664 535 25219 21.2 19.5 - 23.1
Neuro-Surgical ICU 43 26944 1487 63360 23.5 22.3 - 24.7
Pediatric ICU 19 17365 220 20806 10.6 9.2 - 12.1
Respiratory ICU 48 10668 676 31186 21.7 20.0 - 23.4
Surgical ICU 64 95491 2626 126230 20.8 20.2 - 21.6
Trauma ICU 9 2043 164 4186 39.2 33.5 - 45.5
Overall 398 391,527 11,224 540,535 20.8 20.4 - 21.1
Data collected by Hospital Team, using INICC Surveillance forms and methods, applying CDC NHSN Criteria for HAIs. Data analyzed by Dr. Victor D. Rosenthal (VDR). Paper drafted by VDR, revised and approved by Hospital Team, and submitted to the journal by VDR
Device-associated infection rates in 398 intensive care units in Shanghai, China: International Nosocomial Infection Control Consortium (INICC) findings. Tao L, Hu B, Rosenthal VD, Gao X, He L. Int J Infect Dis. 2011 Nov;15(11):e774-80.
Period of this Study: 2004-2009
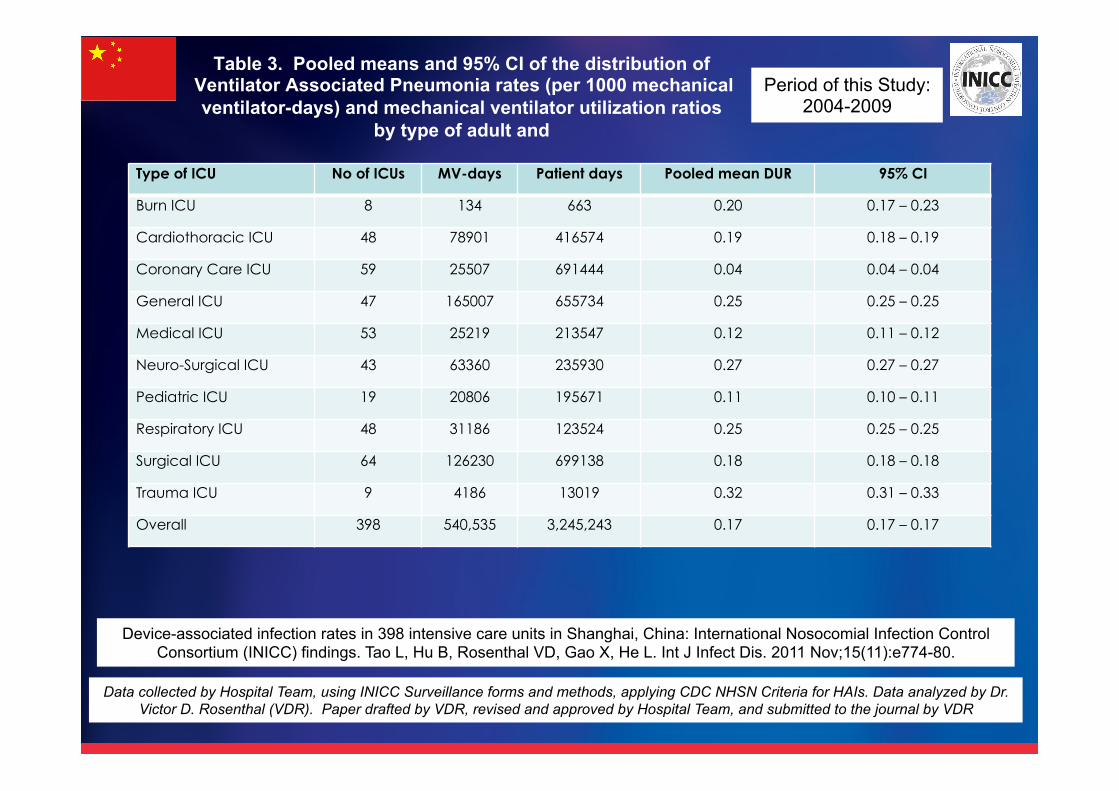
Table 3. Pooled means and 95% CI of the distribution of Ventilator Associated Pneumonia rates (per 1000 mechanical ventilator-days) and mechanical ventilator utilization ratios
by type of adult and
Type of ICU No of ICUs MV-days Patient days Pooled mean DUR 95% CI
Burn ICU 8 134 663 0.20 0.17 – 0.23
Cardiothoracic ICU 48 78901 416574 0.19 0.18 – 0.19
Coronary Care ICU 59 25507 691444 0.04 0.04 – 0.04
General ICU 47 165007 655734 0.25 0.25 – 0.25
Medical ICU 53 25219 213547 0.12 0.11 – 0.12
Neuro-Surgical ICU 43 63360 235930 0.27 0.27 – 0.27
Pediatric ICU 19 20806 195671 0.11 0.10 – 0.11
Respiratory ICU 48 31186 123524 0.25 0.25 – 0.25
Surgical ICU 64 126230 699138 0.18 0.18 – 0.18
Trauma ICU 9 4186 13019 0.32 0.31 – 0.33
Overall 398 540,535 3,245,243 0.17 0.17 – 0.17
Data collected by Hospital Team, using INICC Surveillance forms and methods, applying CDC NHSN Criteria for HAIs. Data analyzed by Dr. Victor D. Rosenthal (VDR). Paper drafted by VDR, revised and approved by Hospital Team, and submitted to the journal by VDR
Device-associated infection rates in 398 intensive care units in Shanghai, China: International Nosocomial Infection Control Consortium (INICC) findings. Tao L, Hu B, Rosenthal VD, Gao X, He L. Int J Infect Dis. 2011 Nov;15(11):e774-80.
Period of this Study: 2004-2009

Table 4. Pooled means and 95% CI of the distribution of catheter-associated urinary tract infection rates (per 1000 urinary catheter -days)
and urinary catheter utilization ratios by type of adult and pediatric
Type of ICU No of ICUs
No of patients
No of CAUTI
UC-days Pooled mean
CAUTI rate
95% CI
Burn ICU 8 169 0 452 0.0 -
Cardiothoracic ICU 48 61189 206 144694 1.4 1.2 - 1.6
Coronary Care ICU 59 88287 1050 82220 12.8 12.0 - 13.6
General ICU 47 64707 2596 297760 8.7 8.4 - 9.1
Medical ICU 53 24664 637 67243 9.5 8.7 - 10.2
Neuro-Surgical ICU 43 26944 585 129187 4.5 4.2 - 4.9
Pediatric ICU 19 17365 39 14742 2.6 1.9 - 3.6
Respiratory ICU 48 10668 331 41392 8.0 7.2 - 8.9
Surgical ICU 64 95491 1550 312618 5.0 4.7 - 5.2
Trauma ICU 9 2043 70 7707 9.1 7.1 - 11.5
Overall 398 391,527 7,064 1,098,013 6.4 6.3 - 6.6
Data collected by Hospital Team, using INICC Surveillance forms and methods, applying CDC NHSN Criteria for HAIs. Data analyzed by Dr. Victor D. Rosenthal (VDR). Paper drafted by VDR, revised and approved by Hospital Team, and submitted to the journal by VDR
Device-associated infection rates in 398 intensive care units in Shanghai, China: International Nosocomial Infection Control Consortium (INICC) findings. Tao L, Hu B, Rosenthal VD, Gao X, He L. Int J Infect Dis. 2011 Nov;15(11):e774-80.
Period of this Study: 2004-2009

Table 4. Pooled means and 95% CI of the distribution of catheter-associated urinary tract infection rates (per 1000
urinary catheter -days) and urinary catheter utilization ratios by type of adult and pediatric
Type of ICU No of ICUs UC-days Patient days Pooled mean DUR
95% CI
Burn ICU 8 452 663 0.68 0.65 - 0.72
Cardiothoracic ICU 48 144694 416574 0.35 0.35 - 0.35
Coronary Care ICU 59 82220 691444 0.12 0.12 - 0.12
General ICU 47 297760 655734 0.45 0.45 - 0.46
Medical ICU 53 67243 213547 0.31 0.31 - 0.32
Neuro-Surgical ICU 43 129187 235930 0.55 0.55 - 0.56
Pediatric ICU 19 14742 195671 0.08 0.07 - 0.08
Respiratory ICU 48 41392 123524 0.34 0.33 - 0.34
Surgical ICU 64 312618 699138 0.45 0.45 - 0.45
Trauma ICU 9 7707 13019 0.59 0.58 - 0.60
Overall 398 1,098,013 3,245,243 0.34 0.34 - 0.34
Data collected by Hospital Team, using INICC Surveillance forms and methods, applying CDC NHSN Criteria for HAIs. Data analyzed by Dr. Victor D. Rosenthal (VDR). Paper drafted by VDR, revised and approved by Hospital Team, and submitted to the journal by VDR
Device-associated infection rates in 398 intensive care units in Shanghai, China: International Nosocomial Infection Control Consortium (INICC) findings. Tao L, Hu B, Rosenthal VD, Gao X, He L. Int J Infect Dis. 2011 Nov;15(11):e774-80.
Period of this Study: 2004-2009

Table 5. Pooled means and 95% CI of the distribution of device-associated infection rates (per 1000 invasive device-days) by
hospital size
Hospital Size No of patients
CLAB rate (95% CI)
VAP rate (95% CI)
CAUTI rate (95% CI)
200 to 500 beds 51,854 3.4 (3.0 – 3.7) 20.2 (19.1 – 21.4) 8.0 (7.5 – 8.6)
501 to 800 beds 144,669 2.2 (2.0 – 2.4) 20.9 (20.2 – 21.6) 7.5 (7.2 – 7.7)
801 beds or bigger 194,877 3.5 (3.4 – 3.7) 20.8 (20.3 – 21.3) 5.6 (5.4 – 5.7)
Data collected by Hospital Team, using INICC Surveillance forms and methods, applying CDC NSHN Criteria for HAIs. Data analyzed by Dr. Victor D. Rosenthal (VDR). Paper drafted by VDR, revised and approved by Hospital Team, and submitted to the journal by VDR
Device-associated infection rates in 398 intensive care units in Shanghai, China: International Nosocomial Infection Control Consortium (INICC) findings. Tao L, Hu B, Rosenthal VD, Gao X, He L. Int J Infect Dis. 2011 Nov;15(11):e774-80.
Period of this Study: 2004-2009

Table 6. Pooled means and 95% CI of the distribution of device-associated infection rates (per 1000 invasive device -
days) by year
Year No of patients
CLAB rate (95% CI) VAP rate (95% CI)
CAUTI rate (95% CI)
2004 18,335 3.0 (2.4 – 3.6) 26.0 (24.0 – 28.2) 7.4 (6.7 – 8.2)
2005 65,080 2.5 (2.3 – 2.8) 23.2 (22.2 – 24.2) 7.2 (6.8 – 7.6)
2006 69,010 2.8 (2.5 – 3.1) 23.6 (22.7 – 24.7) 7.4 (7.0 – 7.8)
2007 80,841 2.7 (2.2 – 3.0) 22.3 (21.5 – 23.2) 6.4 (6.1 – 6.7)
2008 78,021 4.3 (4.0 – 4.6) 19.0 (18.1 – 19.8) 6.4 (6.1 – 6.7
2009 80,249 3.0 (2.7 – 3.2) 15.8 (15.1 – 16.5) 4.9 (4.6 – 5.2)
Data collected by Hospital Team, using INICC Surveillance forms and methods, applying CDC NSHN Criteria for HAIs. Data analyzed by Dr. Victor D. Rosenthal (VDR). Paper drafted by VDR, revised and approved by Hospital Team, and submitted to the journal by VDR
Device-associated infection rates in 398 intensive care units in Shanghai, China: International Nosocomial Infection Control Consortium (INICC) findings. Tao L, Hu B, Rosenthal VD, Gao X, He L. Int J Infect Dis. 2011 Nov;15(11):e774-80.
Period of this Study: 2004-2009

Table 7. Comparison of DA-HAI rates (per 1000 device-days) in the ICUs of the International Nosocomial Infection Control Consortium (INICC) Shanghai hospitals and the U.S. National Healthcare Safety
Network.
INICC Shanghai, China 2004–2009
Pooled Mean (95% CI)
INICC 2004- 2009 Pooled Mean (95% CI)
U.S. NHSN 2006- 2008
Pooled Mean (95% CI) Medical ICU
CLABSI 4.3 (3.7 – 5.0) 14.7 (13.8 – 15.6) 1.9 (1.8 – 2.0) CAUTI 9.5 (8.7 – 10.2) 6.3 (5.8 – 6.8) 3.9 (3.7 – 4.2) VAP 21.2 (19.5 – 23.1) 7.7 (7.1 – 8.3) 2.2 (2.0 – 2.4)
Surgical ICU CLABSI 3.5 (3.2 – 3.7) 5.0 (4.7 – 5.4) 2.3 (2.2 – 2.4) CAUTI 5.0 (4.7 – 5.2) 5.0 (4.7 – 5.4) 4.3 (4.1 –4.5) VAP 20.8 (20.2 – 21.6) 16.3 (15.7 – 17.0) 4.9 (4.6 – 5.1)
Pediatric ICU CLABSI 3.5 (2.7 – 4.4) 10.7 (9.9 – 11.5) 3.0 (2.8 – 3.2 ) CAUTI 2.6 (1.9 – 3.6) 4.7 (4.1 – 5.5) 4.2 (3.8 – 4.7) VAP 10.6 (9.2 – 12.1) 6.5 (5.9 – 7.1) 1.8 (1.6 – 2.1)
Data collected by Hospital Team, using INICC Surveillance forms and methods, applying CDC NSHN Criteria for HAIs. Data analyzed by Dr. Victor D. Rosenthal (VDR). Paper drafted by VDR, revised and approved by Hospital Team, and submitted to the journal by VDR
Device-associated infection rates in 398 intensive care units in Shanghai, China: International Nosocomial Infection Control Consortium (INICC) findings. Tao L, Hu B, Rosenthal VD, Gao X, He L. Int J Infect Dis. 2011 Nov;15(11):e774-80.
Period of this Study: 2004-2009

Table 8. Distribution of pathogens involved in device-associated health care associated infections.
Microorganism related to DA-HAI CLABSI related (n: 845)
VAP related (n: 6,151)
CAUTI related (n: 2,047)
Overall (n: 9,043)
Acinetobacter baumanii 12.3% 25.4% 3.0% 19.1%
Pseudomonas aeruginosa 5.1% 23.5% 3.3% 17.2%
Klebsiella pneumoniae 6.9% 14.6% 5.8% 11.9%
Staphylococcus aureus 15.9% 15.0% 1.2% 11.9%
Candida spp. 14.0% 1.4% 35.7% 10.4%
Escherichia coli 10.1% 5.1% 19.1% 8.7%
Enterococcus faecium 1.7% 0.0% 13.3% 3.2%
Stenotrophomonas spp. 1.9% 4.2% 0.1% 3.1%
Enterobacter spp. 3.3% 2.6% 2.4% 2.6%
Enterococcus faecalis 5.1% 0.0% 8.5% 2.4%
Other Staphylococcus 14.1% 0.2% 2.6% 2.0%
Other Gram negative 2.2% 1.9% 1.3% 1.8%
Other Pseudomonas 1.3% 1.7% 0.7% 1.4%
Proteus spp. 0.6% 1.2% 1.1% 1.1%
Flavobacterium spp. 0.5% 0.9% 0.1% 0.7%
Streptococcus spp. 1.7% 0.0% 0.7% 0.3%
Other pathogens 3.3% 2.1% 1.1% 2.2%
Data collected by Hospital Team, using INICC Surveillance forms and methods, applying CDC NSHN Criteria for HAIs. Data analyzed by Dr. Victor D. Rosenthal (VDR). Paper drafted by VDR, revised and approved by Hospital Team, and submitted to the journal by VDR
Device-associated infection rates in 398 intensive care units in Shanghai, China: International Nosocomial Infection Control Consortium (INICC) findings. Tao L, Hu B, Rosenthal VD, Gao X, He L. Int J Infect Dis. 2011 Nov;15(11):e774-80.
Period of this Study: 2004-2009

Data collected by Hospital Team, using INICC Surveillance forms and methods, applying CDC NSHN Criteria for HAIs. Data analyzed by Dr. Victor D. Rosenthal (VDR). Paper drafted by VDR, revised and approved by Hospital Team, and submitted to the journal by VDR

Table 1. Demographics of Patient Population and Device Use by Intensive Care Unit
Hospital 1 Hospital 2 Hospital 3 Hospital 4
All Medical-Cardiac
Medical- Surgical
Medical-Surgical
Medical-Surgical
Neurological Medical-Cardiac Surgical
Contribution to study
Study period Aug-08/Jul-10 Aug-09 /Jul-10 Aug-09/Jun-10 Jul-09/ Jun-10 Jul-09/ Jun-10 Jul-09 /Jun-10 Aug-08/Jul-09 Aug-08/ Jul-09
ICU Admissions during study period
2631 157 294 277 155 113 889 746
Bed days contributed
17359 953 1869 2689 1849 1695 4090 4214
Hospital characteristics
Hospital size (beds)
1380 1565 1200 1700
ICP experience
1 to 3 years 18 years 17 years 20 years
Patient Characteristics
Age, median(range)
60 (1 - 100) 62 (31 - 82) 64 (15 - 98) 55 (1 - 98) 58 (11 - 94) 63 (18 - 85) 57 (3 - 99) 62 (6- 100)
Male, n(%) 1721 (65) 108 (69) 189 (64) 173 (62) 95 (61) 71 (63) 563 (63) 513 (69)
Apache score, median (range)
9 (0 - 54) 7 (1 - 16) 21 (0 - 51) 14 (0 - 43) 12 (0 - 46) 12 (0 - 42) 5 (0 - 54) 11 (2 - 37)
Device Use
DUR (CL) 0.71(0.70-0.73) 1.24 (1.17-1.31)
0.15 (0.13-0.16)
0.57(0.54-0.6) 0.7(0.66-0.74) 0.58 (0.55-0.62) 0.91(0.88-0.94) 0.81(0.78-0.84)
DUR (MV) 0.43(0.42-0.44) 0.5(0.47-0.53) 0.13(0.12-0.15) 0.47(0.45-0.49) 0.49(0.47-0.51) 0.23(0.21-0.25) 0.4 (0.38-0.41) 0.61(0.59-0.62)
DUR (UC) 0.76 (0.75-0.77)
0.99(0.98-0.99) 0.4(0.38-0.42) 0.7(0.68-0.71) 0.8(0.78-0.82) 0.61(0.59-0.64) 0.9 (0.89-0.91) 0.81(0.8-0.83)
Device-associated infection rates, device use, length of stay, and mortality in intensive care units of 4 Chinese hospitals: International Nosocomial Control Consortium findings. Hu B, Tao L, Rosenthal VD, Liu K, Yun Y, Suo Y, Gao X, Li R, Su D, Wang H, Hao C, Pan W,
Saunders CL. Am J Infect Control. 2013 Apr;41(4):301-6.
Data collected by Hospital Team, using INICC Surveillance forms and methods, applying CDC NSHN Criteria for HAIs. Data analyzed by Dr. Victor D. Rosenthal (VDR). Paper drafted by VDR, revised and approved by Hospital Team, and submitted to the journal by VDR
Period of this Study: 2008-2010

Table 2. Hand Hygiene Compliance and Central Line Care Monitoring by Intensive Care Unit
Hospital 1 Hospital 2 Hospital 3 Hospital 4
All Medical-Cardiac
Medical -Surgical
Medical-Surgical
Medical-Surgical
Neurological Medical-Cardiac
Hand Hygiene compliance
51% 77% 37% 47% 40% 59% -
Date in the intravascular device administration set
95.6% - 95.2% 93.7% 99.7% 100.0% 100.0%
Presence of Sterile Gauze
99.9% - 99.5% 100.0% 100.0% 100.0% 100.0%
Sterile Gauze in Good condition
93.7% - 87.4% 92.0% 99.7% 100.0% 100.0%
Device-associated infection rates, device use, length of stay, and mortality in intensive care units of 4 Chinese hospitals: International Nosocomial Control Consortium findings. Hu B, Tao L, Rosenthal VD, Liu K, Yun Y, Suo Y, Gao X, Li R, Su D, Wang H, Hao C, Pan W,
Saunders CL. Am J Infect Control. 2013 Apr;41(4):301-6.
Data collected by Hospital Team, using INICC Surveillance forms and methods, applying CDC NSHN Criteria for HAIs. Data analyzed by Dr. Victor D. Rosenthal (VDR). Paper drafted by VDR, revised and approved by Hospital Team, and submitted to the journal by VDR
Period of this Study: 2008-2010

Table 3. Stratified Mortality, Length of Stay and Device-Associated Healthcare Associated Infection Rate
N Mortality, N (%)
LOS, median (range)
CLA-BSI (Lab diagnosed)
CLABSI rate/1000 CL
days(95%CI)
VAP VAP rate/1000 MV days (95%CI)
CA-UTI CAUTI rate/1000 UC days
(95% CI) All 2631 142 (5.4) 3 (1-231) 95 (64) 7.66 (4.41-15.45) 78 10.46 (5.5-19.4) 17 1.29 (.73-2.35)
Apache Score
1 to 10 1396 27 (1.93) 3 (1-108) 37 (26) 7.18 (3.6-22.08) 18 8.7 (4.71-16.47) 6 1.16 (.56-3.78)
11 to 20 644 51 (7.92) 4 (1-89) 36 (25) 9.04 (3.84-23.54) 35 11.67 (6.16-22.37)
3 .69 (.24-2.3)
≥21 325 47 (14.46) 5 (1-99) 16 (9) 9.26 (5.97-16.16) 11 8.47 (4.95-14.52) 7 3.35 (1.6-8.26)
Missing 266 17 6 14 1
LOS
1 to 5 1834 53 (2.89) 2 6 (1) 1.63 (.62-6.54) 0 0 (.-.) 0 0 (.-.)
6 to 10 405 31 (7.65) 7 23 (16) 12.21 (3.89-57.17)
6 5.42 (.55-216.09) 2 1.01 (.27-6.15)
≥11 392 58 (14.80) 18 66 (47) 9.65 (5.96-17.21) 72 14.42 (9.66-21.05)
15 2.05 (1.34-3.26)
ICU 2631 142 (5.4) 3 (1-231) 95 (64) 7.66 (4.41-15.45) 78 10.46 (5.5-19.4) 17 1.29 (.73-2.35)
Hospital 1 - Medical Cardiac
157 3 (1.9) 5 (1-60) 4 (3) 3.38 (1.27-9.02) 5 10.5 (4.37-25.24) 0 0 (.-.)
Hospital 2 –Medical-Surgical
294 29 (9.8) 4 (1-44) 3 (1) 11.03 (3.56-34.2) 6 24.19 (10.87-53.85)
2 2.66 (.67-0.65)
Hospital 2 - Medical-Surgical
277 38 (13.7) 6 (1-108) 8 (6) 5.23 (2.62-10.46) 26 20.7 (14.09-30.4) 4 2.13 (.8-5.68)
Hospital 3 - Medical-Surgical
155 23 (14.8) 7 (1-76) 14 (6) 10.84 (6.42-18.31)
9 9.97 (5.19-19.16) 4 2.69 (1.01-.18)
Hospital 3 - Neurological
113 4 (3.5) 10 (1-99) 4 (1 4.05 (1.52-10.79) 7 18.13 (8.65-38.04)
1 .96 (.14-6.83)
Hospital 4 - Medical Cardiac
889 23 (2.6) 2 (1-91) 46 (37) 12.34 (9.24-16.47)
13 7.99 (4.64-13.75) 5 1.36 (.57-3.27)
Hospital 4 - Surgical
746 22 (3.0) 3 (1-231) 16 (10) 4.7 (2.88-7.67) 12 4.69 (2.67-8.26) 1 .29 (.04-2.07)
Device-associated infection rates, device use, length of stay, and mortality in intensive care units of 4 Chinese hospitals: International Nosocomial Control Consortium findings. Hu B, Tao L, Rosenthal VD, Liu K, Yun Y, Suo Y, Gao X, Li R, Su D, Wang H, Hao C, Pan W,
Saunders CL. Am J Infect Control. 2013 Apr;41(4):301-6.
Period of this Study: 2008-2010


Table 1. Features of the International Nosocomial Infection Control Consortium Hospitals and Intensive Care Units*. Hospitals A, B, C.
Variable Burn ICU Surgical ICU Coronary ICU Medical Surgical ICU
Neurosurgical ICU
Pediatric ICU Newborn ICU Overall
ICUs, n 1 1 1 2 1 1 2 9
Hospital type
Academic 0 0 1 2 1 1 1 6
Private 1 1 0 0 0 0 1 3
Patients studied, n 191 225 847 1,331 293 252 1,813 4,952
Total ICU days, d 2,156 1,503 2,210 7,588 1,548 1,638 24,090 40,733
Device use*
Ventilator days, d 135 1,246 596 4,513 881 391 2,279 10,041
Ventilator use 0.06 0.83 0.27 0.59 0.57 0.24 0.09 0.25
CL days, d 9 84 739 3,025 268 486 625 5,236
CL use 0.001 0.06 0.33 0.40 0.17 0.30 0.03 0.13
Urinary catheter days, d 402 1,397 1,236 4,886 1,924 214 - 10,093
Urinary catheter use 0.19 0.93 0.56 0.64 0.99 0.13 - 0.25
Data collected by Hospital Team, using INICC Surveillance forms and methods, applying CDC NSHN Criteria for HAIs. Data analyzed by Dr. Victor D. Rosenthal (VDR). Paper drafted by VDR, revised and approved by Hospital Team, and submitted to the journal by VDR
Device-associated infections rates in adult, pediatric, and neonatal intensive care units of hospitals in the Philippines: International Nosocomial Infection Control Consortium (INICC) findings Navoa-Ng JA, Berba R, Galapia YA, Rosenthal VD,
Villanueva VD, Tolentino MC, Genuino GA, Consunji RJ, Mantaring JB 3rd. Am J Infect Control. 2011 Sep;39(7):548-54.
Period of this Study: 2005-2009

Table 2. Device associated infections per 1000 devices days: VAP, CLAB, and CAUTI in the participating ICUs. Hospitals
A, B, and C.
Type of
ICU
Infection
site
Device
type
Device-
days
DA-
HAI
(n)
Distribution of
DA-HAI (%)
Rate per
100 patients
Rate per 1000
device-days
Adult VAP MV 7,371 123 67.2 4.3 16.7 (95% CI 14.0 – 20.0)
Adult CLAB CL 4,125 19 10.4 0.7 4.6 (95% CI 2.7 – 7.2)
Adult CAUTI UC 9,845 41 22.4 0.4 4.2 (95% CI 3.0 – 5.7)
Pediatric VAP MV 391 5 55.6 2.0 12.8 (95% CI 4.1 – 29.6)
Pediatric CLAB CL 486 4 44.4 1.6 8.2 (95% CI 2.2 – 20.1)
Pediatric CAUTI UC 214 0 0 0 0
Neonatal VAP MV 2,279 1 14.3 0.1 0.44 (95% CI 0.01 – 2.45)
Neonatal CLAB CL 625 6 85.7 0.3 9.60 (95% CI 3.5 – 20.8)
Data collected by Hospital Team, using INICC Surveillance forms and methods, applying CDC NSHN Criteria for HAIs. Data analyzed by Dr. Victor D. Rosenthal (VDR). Paper drafted by VDR, revised and approved by Hospital Team, and submitted to the journal by VDR
Device-associated infections rates in adult, pediatric, and neonatal intensive care units of hospitals in the Philippines: International Nosocomial Infection Control Consortium (INICC) findings Navoa-Ng JA, Berba R, Galapia YA, Rosenthal VD,
Villanueva VD, Tolentino MC, Genuino GA, Consunji RJ, Mantaring JB 3rd. Am J Infect Control. 2011 Sep;39(7):548-54.
Period of this Study: 2005-2009

Table 3. Crude Extra Mortality of patients with device-associated health care associated infections in the participating ICUs. Hospitals A and B.
Type of ICU Type of patient Patients Crude Mortality
Crude Extra Mortality
RR 95% CI P-value
Adult Patients without DA-HAI, %
2291 6.8% - - 5.8 – 7.9
Adult Patients with CLA-BSI, % 10 10.0% 3.2% 1.48 0.21 - 10.56 0.695
Adult Patients with VAP, % 72 9.7% 3.0% 1.44 0.67 - 3.06 0.3454
Adult Patients with CAUTI, % 26 3.8% -2.9% 0.57 0.08 - 4.06 0.5683
Pediatric Patients without infection, %
240 3.8% - - 1.7 – 7.0
Pediatric Patients with CLA-BSI, % 4 50.0% 46.3% 13.3 2.88 - 61.71 0.0001
Pediatric Patients with VAP, % 3 0.0% -3.8% undefined undefined 0.7373
Pediatric Patients with CAUTI, % 0 -
Neonatal Patients without infection, %
1,729 5.6% - 4.6 – 6.8
Neonatal Patients with CLA-BSI, % 4 25.0% 19.4% 4.46 0.62 – 32.0 0.1033
Neonatal Patients with VAP, % 0 - - - - -
Data collected by Hospital Team, using INICC Surveillance forms and methods, applying CDC NSHN Criteria for HAIs. Data analyzed by Dr. Victor D. Rosenthal (VDR). Paper drafted by VDR, revised and approved by Hospital Team, and submitted to the journal by VDR
Device-associated infections rates in adult, pediatric, and neonatal intensive care units of hospitals in the Philippines: International Nosocomial Infection Control Consortium (INICC) findings Navoa-Ng JA, Berba R, Galapia YA, Rosenthal VD,
Villanueva VD, Tolentino MC, Genuino GA, Consunji RJ, Mantaring JB 3rd. Am J Infect Control. 2011 Sep;39(7):548-54.
Period of this Study: 2005-2009
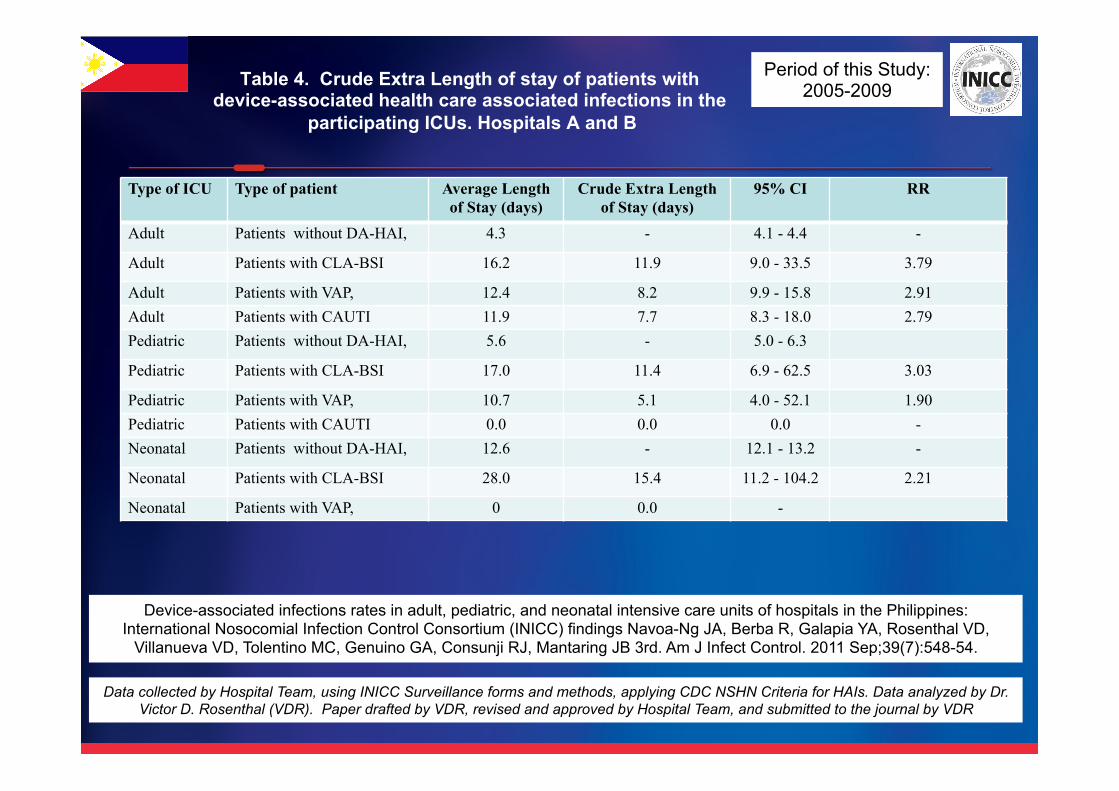
Table 4. Crude Extra Length of stay of patients with device-associated health care associated infections in the
participating ICUs. Hospitals A and B
Type of ICU Type of patient Average Length of Stay (days)
Crude Extra Length of Stay (days)
95% CI RR
Adult Patients without DA-HAI, 4.3 - 4.1 - 4.4 -
Adult Patients with CLA-BSI 16.2 11.9 9.0 - 33.5 3.79
Adult Patients with VAP, 12.4 8.2 9.9 - 15.8 2.91 Adult Patients with CAUTI 11.9 7.7 8.3 - 18.0 2.79 Pediatric Patients without DA-HAI, 5.6 - 5.0 - 6.3
Pediatric Patients with CLA-BSI 17.0 11.4 6.9 - 62.5 3.03
Pediatric Patients with VAP, 10.7 5.1 4.0 - 52.1 1.90 Pediatric Patients with CAUTI 0.0 0.0 0.0 - Neonatal Patients without DA-HAI, 12.6 - 12.1 - 13.2 -
Neonatal Patients with CLA-BSI 28.0 15.4 11.2 - 104.2 2.21
Neonatal Patients with VAP, 0 0.0 -
Data collected by Hospital Team, using INICC Surveillance forms and methods, applying CDC NSHN Criteria for HAIs. Data analyzed by Dr. Victor D. Rosenthal (VDR). Paper drafted by VDR, revised and approved by Hospital Team, and submitted to the journal by VDR
Device-associated infections rates in adult, pediatric, and neonatal intensive care units of hospitals in the Philippines: International Nosocomial Infection Control Consortium (INICC) findings Navoa-Ng JA, Berba R, Galapia YA, Rosenthal VD,
Villanueva VD, Tolentino MC, Genuino GA, Consunji RJ, Mantaring JB 3rd. Am J Infect Control. 2011 Sep;39(7):548-54.
Period of this Study: 2005-2009
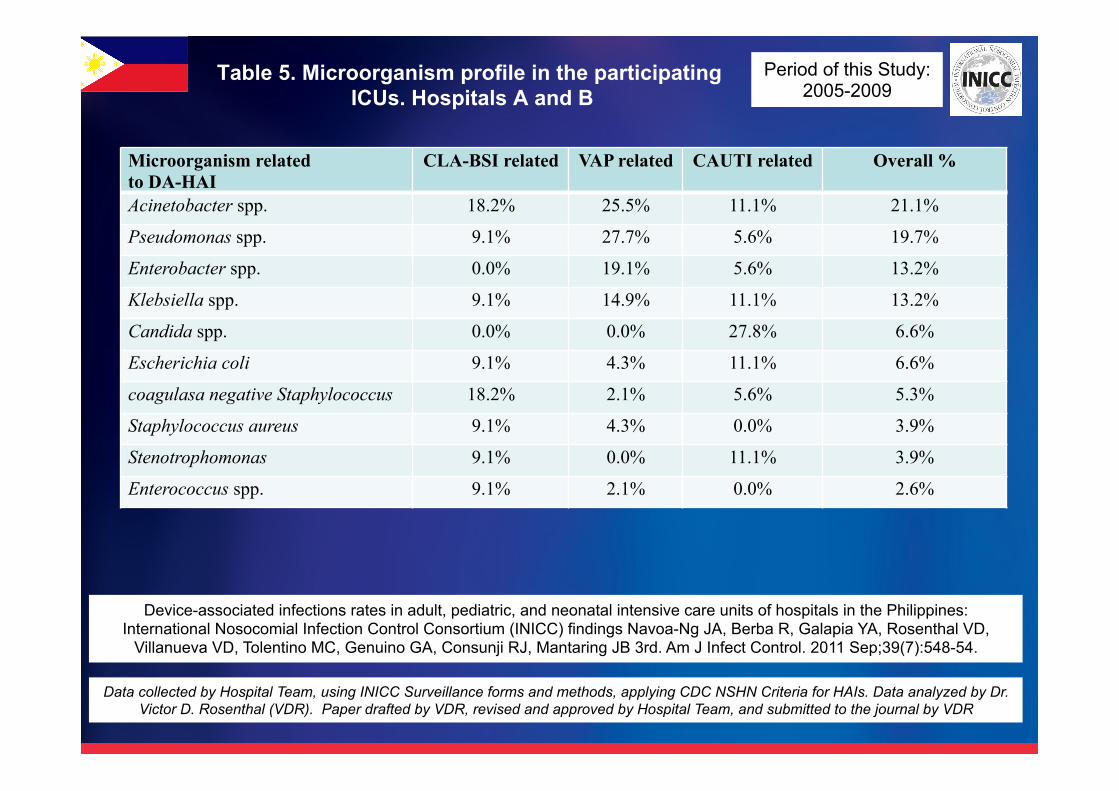
Table 5. Microorganism profile in the participating ICUs. Hospitals A and B
Microorganism related to DA-HAI
CLA-BSI related VAP related CAUTI related Overall %
Acinetobacter spp. 18.2% 25.5% 11.1% 21.1%
Pseudomonas spp. 9.1% 27.7% 5.6% 19.7%
Enterobacter spp. 0.0% 19.1% 5.6% 13.2%
Klebsiella spp. 9.1% 14.9% 11.1% 13.2%
Candida spp. 0.0% 0.0% 27.8% 6.6%
Escherichia coli 9.1% 4.3% 11.1% 6.6%
coagulasa negative Staphylococcus 18.2% 2.1% 5.6% 5.3%
Staphylococcus aureus 9.1% 4.3% 0.0% 3.9%
Stenotrophomonas 9.1% 0.0% 11.1% 3.9%
Enterococcus spp. 9.1% 2.1% 0.0% 2.6%
Data collected by Hospital Team, using INICC Surveillance forms and methods, applying CDC NSHN Criteria for HAIs. Data analyzed by Dr. Victor D. Rosenthal (VDR). Paper drafted by VDR, revised and approved by Hospital Team, and submitted to the journal by VDR
Device-associated infections rates in adult, pediatric, and neonatal intensive care units of hospitals in the Philippines: International Nosocomial Infection Control Consortium (INICC) findings Navoa-Ng JA, Berba R, Galapia YA, Rosenthal VD,
Villanueva VD, Tolentino MC, Genuino GA, Consunji RJ, Mantaring JB 3rd. Am J Infect Control. 2011 Sep;39(7):548-54.
Period of this Study: 2005-2009
Peer Review Manuscripts indexed in Pubmed, published by INICC
Members from: Middle East and Africa

Dat
a co
llect
ed b
y H
ospi
tal T
eam
, usi
ng IN
ICC
Sur
veill
ance
form
s an
d m
etho
ds, a
pply
ing
CD
C N
SH
N C
riter
ia fo
r HA
Is. D
ata
anal
yzed
by
Dr.
Vict
or D
. Ros
enth
al (V
DR
). P
aper
dra
fted
by V
DR
, rev
ised
and
app
rove
d by
Hos
pita
l Tea
m, a
nd s
ubm
itted
to th
e jo
urna
l by
VD
R

Table 1. Characteristics of the Intensive Care Unit, member of the International Nosocomial Infection Control
Consortium
Variable Overall Number of hospital beds 320 Number of ICU beds 8 ICUs, n 1 ICU type Medical Surgical Surveillance Period 11/2007 to 03/2010 Range of experience of the infection control practitioner, y 15 Number of medical staff 4 Patients studied, n 666 Total ICU days, d 5,506 Device use*
Ventilator days, d 3,561 Ventilator use, 0.65 Central line days, d 2,691 Central line use, 0.49 Urinary catheter days, d 5,340 Urinary catheter use, 0.97
International nosocomial infection control consortium findings of device-associated infections rate in an intensive care unit of a lebanese university hospital. Kanj S, Kanafani Z, Sidani N, Alamuddin L, Zahreddine N, Rosenthal V. J Glob Infect Dis. 2012 Jan;4(1):15-21.
Data collected by Hospital Team, using INICC Surveillance forms and methods, applying CDC NSHN Criteria for HAIs. Data analyzed by Dr. Victor D. Rosenthal (VDR). Paper drafted by VDR, revised and approved by Hospital Team, and submitted to the journal by VDR
Period of this Study: 2007-2010

Table 2. Device associated infections rates (VAP, CLA-BSI, and CAUTI)
Infection site
Device type
Device- days
DA- HAI
Distribution of DA-HAI (%)
Rate per 100 patients
Rate per 1000 device-days*
VAP MV 3,561 29 45% 4.35% 8.1 (95% CI 5.5 – 11.7)
CLA-BSI CL 2,691 14 22% 2.10% 5.2 (95% CI 2.8 – 8.7)
CAUTI UC 5,340 22 34% 3.30% 4.1 (95% CI 2.6 – 6.2)
International nosocomial infection control consortium findings of device-associated infections rate in an intensive care unit of a lebanese university hospital. Kanj S, Kanafani Z, Sidani N, Alamuddin L, Zahreddine N, Rosenthal V. J Glob Infect Dis. 2012 Jan;4(1):15-21.
Data collected by Hospital Team, using INICC Surveillance forms and methods, applying CDC NSHN Criteria for HAIs. Data analyzed by Dr. Victor D. Rosenthal (VDR). Paper drafted by VDR, revised and approved by Hospital Team, and submitted to the journal by VDR
Period of this Study: 2007-2010

Table 3. Excess mortality of patients with device-associated infections
Crude Mortality
Extra Mortality RR 95% CI P-value
Patients without DA-HAI, % 19.1%
Patients with CLA-BSI, % 60.0% 40.9% 3.14 1.38 - 7.13 0.0039
Patients with VAP, % 15.0% - 0.78 0.25 - 2.47 0.6780
Patients with CAUTI, % 12.5% - 0.65 0.16 - 2.65 0.5487
International nosocomial infection control consortium findings of device-associated infections rate in an intensive care unit of a lebanese university hospital. Kanj S, Kanafani Z, Sidani N, Alamuddin L, Zahreddine N, Rosenthal V. J Glob Infect Dis. 2012 Jan;4(1):15-21.
Data collected by Hospital Team, using INICC Surveillance forms and methods, applying CDC NSHN Criteria for HAIs. Data analyzed by Dr. Victor D. Rosenthal (VDR). Paper drafted by VDR, revised and approved by Hospital Team, and submitted to the journal by VDR
Period of this Study: 2007-2010

Table 4. Excess length of stay of patients with device-associated infections
Average Length of Stay
Extra Length of Stay 95% CI RR
Patients without DA-HAI, % 7.3 6.8 - 7.9
Patients with CLA-BSI, % 13.8 6.5 7.7 - 28.4 1.88
Patients with VAP, % 18.8 11.4 12.3 - 30.5 2.56
Patients with CAUTI, % 15.8 8.5 9.9 - 27.4 2.16
International nosocomial infection control consortium findings of device-associated infections rate in an intensive care unit of a lebanese university hospital. Kanj S, Kanafani Z, Sidani N, Alamuddin L, Zahreddine N, Rosenthal V. J Glob Infect Dis. 2012 Jan;4(1):15-21.
Data collected by Hospital Team, using INICC Surveillance forms and methods, applying CDC NSHN Criteria for HAIs. Data analyzed by Dr. Victor D. Rosenthal (VDR). Paper drafted by VDR, revised and approved by Hospital Team, and submitted to the journal by VDR
Period of this Study: 2007-2010

Table 5. Distribution of pathogens involved in device-associated infections
Microorganism related to DA-HAI CLA-BSI related
VAP related
CAUTI related Overall %
Escherichia coli 36.3% 29.2% 35.0% 32.7% Acinetobacter spp. 27.3% 37.5% 20.0% 29.1% Candida spp. 0.0% 0.0% 25.0% 9.1% Klebsiella spp. 0.0% 12.5% 5.0% 7.3% coagulase negative staphylococci 27.3% 4.2% 0.0% 7.3% Stenotrophomonas spp. 0.0% 8.3% 5.0% 5.5% Enterobacter spp. 9.1% 0.0% 5.0% 3.6% Pseudomonas spp. 0.0% 8.3% 0.0% 3.6% Enterococcus spp. 0.0% 0.0% 5.0% 1.8%
International nosocomial infection control consortium findings of device-associated infections rate in an intensive care unit of a lebanese university hospital. Kanj S, Kanafani Z, Sidani N, Alamuddin L, Zahreddine N, Rosenthal V. J Glob Infect Dis. 2012 Jan;4(1):15-21.
Data collected by Hospital Team, using INICC Surveillance forms and methods, applying CDC NSHN Criteria for HAIs. Data analyzed by Dr. Victor D. Rosenthal (VDR). Paper drafted by VDR, revised and approved by Hospital Team, and submitted to the journal by VDR
Period of this Study: 2007-2010

Data collected by Hospital Team, using INICC Surveillance forms and methods, applying CDC NSHN Criteria for HAIs. Data analyzed by Dr. Victor D. Rosenthal (VDR). Paper drafted by VDR, revised and approved by Hospital Team, and submitted to the journal by VDR

Table 1. Features of the consortium hospitals, ICUs and patients studied
Hospitals, n 1 1 Academic Teaching 1 1 (100%) Public 0 0% Private Community 0 0% ICUs, n 1 1 Experience of ICP (range), years 16 16 Patients n 269 269 Patients-days n 1818 1818 Sex % (male) 48.0 (129/269) 48.0 (129/269) Age 43.1 43.1 ASIS score, mean 3.77 3.77
Data collected by Hospital Team, using INICC Surveillance forms and methods, applying CDC NSHN Criteria for HAIs. Data analyzed by Dr. Victor D. Rosenthal (VDR). Paper drafted by VDR, revised and approved by Hospital Team, and submitted to the journal by VDR
Health-care associated infections rates, length of stay, and bacterial resistance in an intensive care unit of Morocco: findings of the International Nosocomial Infection Control Consortium (INICC). Madani N, Rosenthal VD, Dendane T, Abidi K, Zeggwagh AA,
Abouqal R. Int Arch Med. 2009 Oct 7;2(1):29.
Period of this Study: 2004-2008

Table 2. Global rates of health care associated infection by 100 patients and by 1000 bed days
Number of HCAI 52 52
Number of patients 269 269
HCAI (%) 19.3 19.3
Bed days 1818 1818
HCAI per 1000 bed days 28.6 28.6
Data collected by Hospital Team, using INICC Surveillance forms and methods, applying CDC NSHN Criteria for HAIs. Data analyzed by Dr. Victor D. Rosenthal (VDR). Paper drafted by VDR, revised and approved by Hospital Team, and submitted to the journal by VDR
Health-care associated infections rates, length of stay, and bacterial resistance in an intensive care unit of Morocco: findings of the International Nosocomial Infection Control Consortium (INICC). Madani N, Rosenthal VD, Dendane T, Abidi K, Zeggwagh AA,
Abouqal R. Int Arch Med. 2009 Oct 7;2(1):29.
Period of this Study: 2004-2008

Table 3. Proportion of Health care associated infections in the ICU studied
Total NI 52 52
Proportion of VAP (%) 53.8 53.8 Proportion of CVC-related BSI (%) 13.5 13.5
Proportion of CAUTI (%) 32.7 32.7
Data collected by Hospital Team, using INICC Surveillance forms and methods, applying CDC NSHN Criteria for HAIs. Data analyzed by Dr. Victor D. Rosenthal (VDR). Paper drafted by VDR, revised and approved by Hospital Team, and submitted to the journal by VDR
Health-care associated infections rates, length of stay, and bacterial resistance in an intensive care unit of Morocco: findings of the International Nosocomial Infection Control Consortium (INICC). Madani N, Rosenthal VD, Dendane T, Abidi K, Zeggwagh AA,
Abouqal R. Int Arch Med. 2009 Oct 7;2(1):29.
Period of this Study: 2004-2008

Table 4. Device usage in the ICUs studied
Total ICU days 1818 1818 Ventilator-days 573 573 Ventilator usage 0.32 0.32 CVC-days 414 414 CVC usage 0.23 0.23 Urinary catheter-days 1321 1321 Catheter usage 0.73 0.73
Data collected by Hospital Team, using INICC Surveillance forms and methods, applying CDC NSHN Criteria for HAIs. Data analyzed by Dr. Victor D. Rosenthal (VDR). Paper drafted by VDR, revised and approved by Hospital Team, and submitted to the journal by VDR
Health-care associated infections rates, length of stay, and bacterial resistance in an intensive care unit of Morocco: findings of the International Nosocomial Infection Control Consortium (INICC). Madani N, Rosenthal VD, Dendane T, Abidi K, Zeggwagh AA,
Abouqal R. Int Arch Med. 2009 Oct 7;2(1):29.
Period of this Study: 2004-2008

Table 5. Overall microbiological profile and bacterial resistance in the participant ICUs
Proportion of cases (%): Acinetobacter 31.9 (15/47) 31.9 (15/47) Candida spp. 4.3 (2/47) 4.3 (2/47) E.Coli 10.6 (5/47) 10.6 (5/47) Enterobacter 4.3 (2/47) 4.3 (2/47) Klebsiella 12.8 (6/47) 12.8 (6/47) Pseudomonas aeruginosa 27.7 (13/47) 27.7 (13/47) Staphylococcus aureus 6.4 (3/47) 6.4 (3/47) Coagulase-negative staphylococci 2.1 (1/47) 2.1 (1/47) Susceptibility of microorganisms (% resistant):
S. aureus / methicillin (MRSA) 0.0 (0/8) 0.0 (0/8) Enterobacteriaceae / ceftriaxone 71.7 (38/53) 71.7 (38/53) Enterobacteriaceae / ceftazidima 61.1 (33/54) 61.1 (33/54) Enterobacteriaceae / piperacillin tazobactam 58.8 (10/17) 58.8 (10/17) P. aeruginosa / ciprofloxacina 0 0 P. aeruginosa / ceftazidima 28.6 (6/21) 28.6 (6/21) P. aeruginosa / imipenem 9.5 (2/21) 9.5 (2/21) P. aeruginosa / piperacilin tazobactam 0.0 (0/4) 0.0 (0/4) Enterococci/ vancomycin 0.0 (0/0) 0.0 (0/0) Acinetobacter / piperacilin tazobactam 100.0 (5/5) 100.0 (5/5)
Data collected by Hospital Team, using INICC Surveillance forms and methods, applying CDC NSHN Criteria for HAIs. Data analyzed by Dr. Victor D. Rosenthal (VDR). Paper drafted by VDR, revised and approved by Hospital Team, and submitted to the journal by VDR
Health-care associated infections rates, length of stay, and bacterial resistance in an intensive care unit of Morocco: findings of the International Nosocomial Infection Control Consortium (INICC). Madani N, Rosenthal VD, Dendane T, Abidi K, Zeggwagh AA,
Abouqal R. Int Arch Med. 2009 Oct 7;2(1):29.
Period of this Study: 2004-2008

Table 6. VAP in the participant ICUs
VAP, no.of cases 28 28 Rate per 100 patients (%) 10.4 10.4 (28/269) Rate per 1000 ventilator-days 48.9 48.9 (28/573) Proportion of cases (%): Acinetobacter 45.8 (11/24) 45.8 (11/24) E.Coli 4.2 (1/24) 4.2 (1/24) Enterobacter 4.2 (1/24) 4.2 (1/24) Klebsiella 4.2 (1/24) 4.2 (1/24) Pseudomonas aeruginosa 37.5 (9/24) 37.5 (9/24) Staphylococcus aureus 4.2 (1/24) 4.2 (1/24) Susceptibility of microorganisms (% resistant):
S. aureus / methicillin (MRSA) 0.0 (0/3) 0.0 (0/3) Enterobacteriaceae / ceftriaxone 66.7 (8/12) 66.7 (8/12) Enterobacteriaceae / ceftazidima 54.5 (6/11) 54.5 (6/11) Enterobacteriaceae / piperacillin tazobactam 50.0 (2/4) 50.0 (2/4) P. aeruginosa / ciprofloxacina 0.0 (0/0) 0.0 (0/0) P. aeruginosa / ceftazidima 26.7 (4/15) 26.7 (4/15) P. aeruginosa / imipenem 13.3 (2/15) 13.3 (2/15) P. aeruginosa / piperacilin tazobactam 0.0 (0/2) 0.0 (0/2) Enterococci/ vancomycin 0.0 (0/0) 0.0 (0/0) Acinetobacter / piperacilin tazobactam 100.0 (4/4) 100.0 (4/4)
Data collected by Hospital Team, using INICC Surveillance forms and methods, applying CDC NSHN Criteria for HAIs. Data analyzed by Dr. Victor D. Rosenthal (VDR). Paper drafted by VDR, revised and approved by Hospital Team, and submitted to the journal by VDR
Health-care associated infections rates, length of stay, and bacterial resistance in an intensive care unit of Morocco: findings of the International Nosocomial Infection Control Consortium (INICC). Madani N, Rosenthal VD, Dendane T, Abidi K, Zeggwagh AA,
Abouqal R. Int Arch Med. 2009 Oct 7;2(1):29.
Period of this Study: 2004-2008

Table 7. CVC- related BSI in the participant ICUs
CVC-related BSI, no. of cases 7 7 Rate per 100 patients (%) 2.6 (7/269) 2.6 (7/269) Rate per 1000 CVC-days 16.9 (7/414) 16.9 (7/414) Proportion of cases (%): Acinetobacter spp 14.3 (1/7) 14.3 (1/7) Candida spp. 14.3 (1/7) 14.3 (1/7) Enterobacter 14.3 (1/7) 14.3 (1/7) Pseudomonas aeruginosa 28.6 (2/7) 28.6 (2/7) Staphylococcus aureus 14.3 (1/7) 14.3 (1/7) Coagulase-negative staphylococci 14.3 (1/7) 14.3 (1/7) Susceptibility of microorganisms (% resistant):
S. aureus / methicillin (MRSA) 0.0 (0/5) 0.0 (0/5) Enterobacteriaceae / ceftriaxone 93.3 (14/15) 93.3 (14/15) Enterobacteriaceae / ceftazidima 76.5 (13/17) 76.5 (13/17) Enterobacteriaceae / piperacillin tazobactam 57.1 (4/7) 57.1 (4/7) P. aeruginosa / ciprofloxacina 0.0 (0/0) 0.0 (0/0) P. aeruginosa / ceftazidima 0.0 (0/2) 0.0 (0/2) P. aeruginosa / imipenem 0.0 (0/2) 0.0 (0/2) P. aeruginosa / piperacillin tazobactam 0.0 (0/1) 0.0 (0/1) Enterococci / vancomycin 0.0 (0/0) 0.0 (0/0) Acinetobacter / piperacillin tazobactam 100.0 (1/1) 100.0 (1/1)
Data collected by Hospital Team, using INICC Surveillance forms and methods, applying CDC NSHN Criteria for HAIs. Data analyzed by Dr. Victor D. Rosenthal (VDR). Paper drafted by VDR, revised and approved by Hospital Team, and submitted to the journal by VDR
Health-care associated infections rates, length of stay, and bacterial resistance in an intensive care unit of Morocco: findings of the International Nosocomial Infection Control Consortium (INICC). Madani N, Rosenthal VD, Dendane T, Abidi K, Zeggwagh AA,
Abouqal R. Int Arch Med. 2009 Oct 7;2(1):29.
Period of this Study: 2004-2008

Table 8. CAUTI in the participant ICUs CAUTI, no. of cases 17 17 Rate per 100 patients (%) 6.3 (17/269) 6.3 (17/269) Rate per 1000 catheter-days 12.9 (17/1321) 12.9 (17/1321) Proportion of cases (%): Acinetobacter 18.8 (3/16) 18.8 (3/16) Candida spp. 6.3 (1/16) 6.3 (1/16) E.Coli 25.0 (4/16) 25.0 (4/16) Klebsiella 31.3 (5/16) 31.3 (5/16) Pseudomonas aeruginosa 12.5 (2/16) 12.5 (2/16) Staphylococcus Aureus 6.3 (1/16) 6.3 (1/16) Susceptibility of microorganisms (% resistant):
S. aureus / methicillin (MRSA) 0 0 Enterobacteriaceae / ceftriaxone 61.5 (16/26) 61.5 (16/26) Enterobacteriaceae / ceftazidima 53.8 (14/26) 53.8 (14/26) Enterobacteriaceae / piperacillin tazobactam 66.7 (4/6) 66.7 (4/6) P. aeruginosa / ciprofloxacina 0.0 (0/0) 0.0 (0/0) P. aeruginosa / ceftazidima 50.0 (2/4) 50.0 (2/4) P. aeruginosa / imipenem 0.0 (0/4) 0.0 (0/4) P. aeruginosa / piperacillin tazobactam 0.0 (0/1) 0.0 (0/1) Enterococci / vancomycin 0.0 (0/0) 0.0 (0/0) Acinetobacter / piperacillin tazobactam 0.0 (0/0) 0.0 (0/0)
Data collected by Hospital Team, using INICC Surveillance forms and methods, applying CDC NSHN Criteria for HAIs. Data analyzed by Dr. Victor D. Rosenthal (VDR). Paper drafted by VDR, revised and approved by Hospital Team, and submitted to the journal by VDR
Health-care associated infections rates, length of stay, and bacterial resistance in an intensive care unit of Morocco: findings of the International Nosocomial Infection Control Consortium (INICC). Madani N, Rosenthal VD, Dendane T, Abidi K, Zeggwagh AA,
Abouqal R. Int Arch Med. 2009 Oct 7;2(1):29.
Period of this Study: 2004-2008

Table 9. Mortality of device-associated infections in the participants ICUs
Hospital Overall Attributable mortality
RR IC % P. value
Overall Crude Mortality of patients without infection, %
25.1 (57/227) 25.1 (57/227) 1.0
Crude unadjusted attributable mortality of patients with VAP, %
62.5 (10/16) 62.5 (10/16) 37.4 2.49 1.27 – 4.87 0.0059
Crude unadjusted attributable mortality of patients with CVC-associated BSI, %
100.0 (1/1) 100.0 (1/1) 74.9 3.98 0.55 – 28.76 0.1384
Crude unadjusted attributable mortality of patients with CAUTI, %
33.3 (3/9) 33.3 (3/9) 8.2 1.33 0.42 – 4.24 0.6313
Data collected by Hospital Team, using INICC Surveillance forms and methods, applying CDC NSHN Criteria for HAIs. Data analyzed by Dr. Victor D. Rosenthal (VDR). Paper drafted by VDR, revised and approved by Hospital Team, and submitted to the journal by VDR
Health-care associated infections rates, length of stay, and bacterial resistance in an intensive care unit of Morocco: findings of the International Nosocomial Infection Control Consortium (INICC). Madani N, Rosenthal VD, Dendane T, Abidi K, Zeggwagh AA,
Abouqal R. Int Arch Med. 2009 Oct 7;2(1):29.
Period of this Study: 2004-2008

Table 10. Comparison of device utilization and rates of device–associated health care associated infection in
the ICUs of Morocco and in U.S. ICUs.
U.S. NNIS- 1992-2004
Hospital RR
Device utilization Mechanical ventilator 0.35 – 0.43* 0.32 0.74 Central vascular catheter 0.49 - 0.56 0.23 0.41
Urinary catheter 0.78 – 0.82 0.73 0.89 Rates, per 1000 device-days
Ventilator-associated pneumonia 4.6 – 5.1 48.9 9.58
CVC-associated bloodstream infection 3.1 - 3.4 16.9 4.97
Catheter-associated urinary tract infection 3.1- 3.3 12.9 3.90
Proportion (%) of device-associated infections with resistance:
S.aureus / methicillin. 48.1 0.0 (0/8) - Enterobacteriaceae / ceftriaxone 17.4 71.7 (38/53) 4.12
Enterococci / vancomycin 29.1 0.0 (0/0) -
Data collected by Hospital Team, using INICC Surveillance forms and methods, applying CDC NSHN Criteria for HAIs. Data analyzed by Dr. Victor D. Rosenthal (VDR). Paper drafted by VDR, revised and approved by Hospital Team, and submitted to the journal by VDR
Health-care associated infections rates, length of stay, and bacterial resistance in an intensive care unit of Morocco: findings of the International Nosocomial Infection Control Consortium (INICC). Madani N, Rosenthal VD, Dendane T, Abidi K, Zeggwagh AA,
Abouqal R. Int Arch Med. 2009 Oct 7;2(1):29.
Period of this Study: 2004-2008

Data collected by Hospital Team, using INICC Surveillance forms and methods, applying CDC NSHN Criteria for HAIs. Data analyzed by Dr. Victor D. Rosenthal (VDR). Paper drafted by VDR, revised and approved by Hospital Team, and submitted to the journal by VDR

Table 1. Features of the International Nosocomial Infection Control Consortium Hospitals and Intensive Care Units
Variable Hospital A Hospital B Hospital C Overall Hospitals, n (%) 1 1 1 3
Academic teaching 1 0 1 2 (66%) Public 0 1 0 1 (33%) Private community 0 0 0 0
Hospital number of beds 400 150 1000 400-1000
ICUs, n 1 1 1 3 ICU type PICU PICU RICU PICU & RICU Surveillance Period 04/2009 to 09/2009 06/2010 to 07/2010 12/2008 to 12/2009 12/2008 to 07/2010 Range of experience of the infection control practitioner, y
1 3 2 1-3
Patients studied, n 119 24 473 616 Total ICU days, d 1,274 261 2,930 6,000 Device use*
Ventilator days, d 510 57 1,077 1,644 Ventilator use, 0.40 0.22 0.37 0.27 Central Line days, d 794 112 1,021 1,927
Central Line use, 0.62 0.43 0.35 0.32 Urinary catheter days, d 466 67 1,551 2,084
Urinary catheter use, 0.37 0.26 0.53 0.35
Device-associated infection rates in adult and pediatric intensive care units of hospitals in Egypt. International Nosocomial Infection Control Consortium (INICC) findings. Rasslan O, Seliem ZS, Ghazi IA, El Sabour MA, El Kholy AA, Sadeq FM, Kalil M, Abdel-Aziz D, Sharaf HY, Saeed A, Agha H, El-Abdeen SA, El Gafarey M, El Tantawy A, Fouad L, Abel-Haleim MM, Muhamed T, Saeed H, Rosenthal VD. J Infect
Public Health. 2012 Dec;5(6):394-402.
Data collected by Hospital Team, using INICC Surveillance forms and methods, applying CDC NSHN Criteria for HAIs. Data analyzed by Dr. Victor D. Rosenthal (VDR). Paper drafted by VDR, revised and approved by Hospital Team, and submitted to the journal by VDR
Period of this Study: 2009-2010

Table 2. Device-associated health care associated infections per 1000 devices days: ventilator-associated pneumonia, central line-associated blood stream infection, and catheter-associated urinary tract infection
in the pediatric and respiratory intensive care unit.
Type of ICU
Infection site
Device type
Device- days
DA- HAI
Distribution of DA-HAI (%)
Rate per 100 patients (%) Rate per 1000 device-days*
PICU VAP MV 567 18 51.4 12.6 31.7 (95% CI 19.9 – 49.8)
PICU CLABSI CL 906 15 48.6 11.9 18.8 (95% CI 10.9 – 29.9)
PICU CAUTI UC 533 0 0.0 0.0 0.0
RICU VAP MV 1,077 79 51% 16.7 73.4 (95% CI 58.5 – 90.6)
RICU CLABSI CL 1,021 23 15% 4.9 22.5 (95% CI 14.3 – 33.6)
RICU CAUTI UC 1,551 53 34% 11.2 34.2 (95% CI 25.7 – 44.5)
Device-associated infection rates in adult and pediatric intensive care units of hospitals in Egypt. International Nosocomial Infection Control Consortium (INICC) findings. Rasslan O, Seliem ZS, Ghazi IA, El Sabour MA, El Kholy AA, Sadeq FM, Kalil M, Abdel-Aziz D, Sharaf HY, Saeed A, Agha H, El-Abdeen SA, El Gafarey M, El Tantawy A, Fouad L, Abel-Haleim MM, Muhamed T, Saeed H, Rosenthal VD. J Infect
Public Health. 2012 Dec;5(6):394-402.
Data collected by Hospital Team, using INICC Surveillance forms and methods, applying CDC NSHN Criteria for HAIs. Data analyzed by Dr. Victor D. Rosenthal (VDR). Paper drafted by VDR, revised and approved by Hospital Team, and submitted to the journal by VDR
Period of this Study: 2009-2010
Thank you very much Contact us by email: [email protected] Contact us in our Web Page: www.INICC.org Follow us : - in facebo in “Hospital Infection INICC” - in Twitter in in “@inicc_org”