a career in statistics - university of washingtonfaculty.washington.edu/fscholz/reports/career.pdfa...
TRANSCRIPT

A Career in Statistics
Fritz ScholzBoeing Phantom Works & UW
February 23, 2006

Biographical SketchBoeing Technology | Phantom Works E&IT Mathematics and Computing Technology
• 1963-66: Studies of Mathematics & Physics
at the University of Gottingen, Germany =⇒ Prediploma ≈ BA/BS
• On a lark applied for a VW scholarship.
Was told to aim for Statistics since Mathematics could be studied
equally well in Germany, whereas Statistics was hardly represented there.
• 1966-71: Studied Probability & Statistics
at the University of California, Berkeley =⇒ Ph.D. in Statistics
• Taught at Berkeley 1971-72, at the UW Mathematics Department 1972-78.
1

Biographical Sketch (contd.)Boeing Technology | Phantom Works E&IT Mathematics and Computing Technology
• In 1978 joined the Applied Statistics Group at Boeing Computer Services
which ultimately transformed into Boeing Phantom Works after the merger
with McDonnell Douglas.
• UW Affiliate (Associate) Professor of Statistics since (1980) 1992
• Boeing Technical Fellow in 1991,
• Fellow of the American Statistical Association in 1997
2

MEA / The Boeing Math GroupBoeing Technology | Phantom Works E&IT Mathematics and Computing Technology
Mathematics & Engineering Analysis (MEA)is culturally very diverse/international and consists of
• Mathematical Modeling [16] (the Engineering side)
• Applied Statistics [13, 12 PhDs]
• Operations Research [13]
• Computational Mathematics [17] (Differential Equation & Linear Algebra)
• Modeling & Simulation Technology [25]
• Geometry & Optimization [17]
3

DiversityBoeing Technology | Phantom Works E&IT Mathematics and Computing Technology
Applied Statistics GroupRoberto Altschul, Ph.D. Mathematics, Case Western Reserve U.
Sabyasachi "Shobbo" Basu, Ph.D. Statistics, U. of Wisconsin
Andrew Booker, Ph.D. Mathematics, U. of Washington
Roman Fresnedo, Ph.D. Statistics, U. of California - Berkeley
Stephen P. Jones, Ph.D. Statistics, U. of Wisconsin
I-Li Lu, Ph.D. Statistics, U. of Virginia
Martin Meckesheimer, Ph.D. Industrial Engineering, Pennsylvania State U.
Ranjan Paul, Ph.D. Statistics, U. of Maryland
Julio Peixoto, Ph.D. Statistics, Iowa State U.
Fritz Scholz, Ph.D. Statistics, U. of California - Berkeley
Shuguang Song, Ph.D. Statistics, U. of Washington
Winson Taam, Ph.D. Statistics, U. of Wisconsin
Valeria Thompson, M.S. Statistics, U. of Washington
4
M&CT: Home of MEABoeing Technology | Phantom Works E&IT Mathematics and Computing Technology
• MEA
• Computing Systems Technology
• Intelligent Information Systems
Home of Data & Text Mining
a separate Statistics group with special focus
5
Application AreasBoeing Technology | Phantom Works E&IT Mathematics and Computing Technology
• Commercial Aviation
707, 717, 727, 737, 747, 757, 767, 777, and next up 787
• Military Aviation
Bombers, fighter jets, transport planes, helicopters
• Space
Space Shuttle, International Space Station, rockets
• Outside commercial business
DOE, NRC, NASA, EPRI, AT&T etc.
6

Wide Spectrum of Statistical Problem AreasBoeing Technology | Phantom Works E&IT Mathematics and Computing Technology
• data mining
(Data from manufacturing, business processes,
airline operations and maintenance =⇒ improve efficiency)
• statistical quality & process control
(Boeing internal & interfacing with suppliers)
• design of experiments
(making most effective use of expensive experimental units
through fractional factorial designs)
• design & analysis of computer experiments
(using expensive computer models efficiently for best design)
7
Wide Spectrum of Statistical Problem AreasBoeing Technology | Phantom Works E&IT Mathematics and Computing Technology
• reliability & risk analysis (high reliability through redundancy design,
analysis of lifetime data, assess significance of incidents,
constant vigilance, 10−9 an industry standard, software reliability)
• statistical tolerancing & metrology (engineering/manufacturing tolerances, mea-
surement system calibration, accuracy Assessment)
• interaction with regulatory agencies (FAA, NTSB, ICAO, MIL-HDBKs)
8
A Guiding Principle: Academia vs IndustryBoeing Technology | Phantom Works E&IT Mathematics and Computing Technology
• the task is to find a path from A to B
• after considerable effort one finds that a path to C is easier & elegant
• this works fine for academic publishing since nobody insists on the goal B.
• In Industry you Keep your Eye on B,
and Achieve it by whatever Hop, Skip, and Jump Method
Possibly not an Airtight Argument,
but Supported by Simulations and other Checks
• This is Usually not Elegant or Publishable, often Proprietary
9
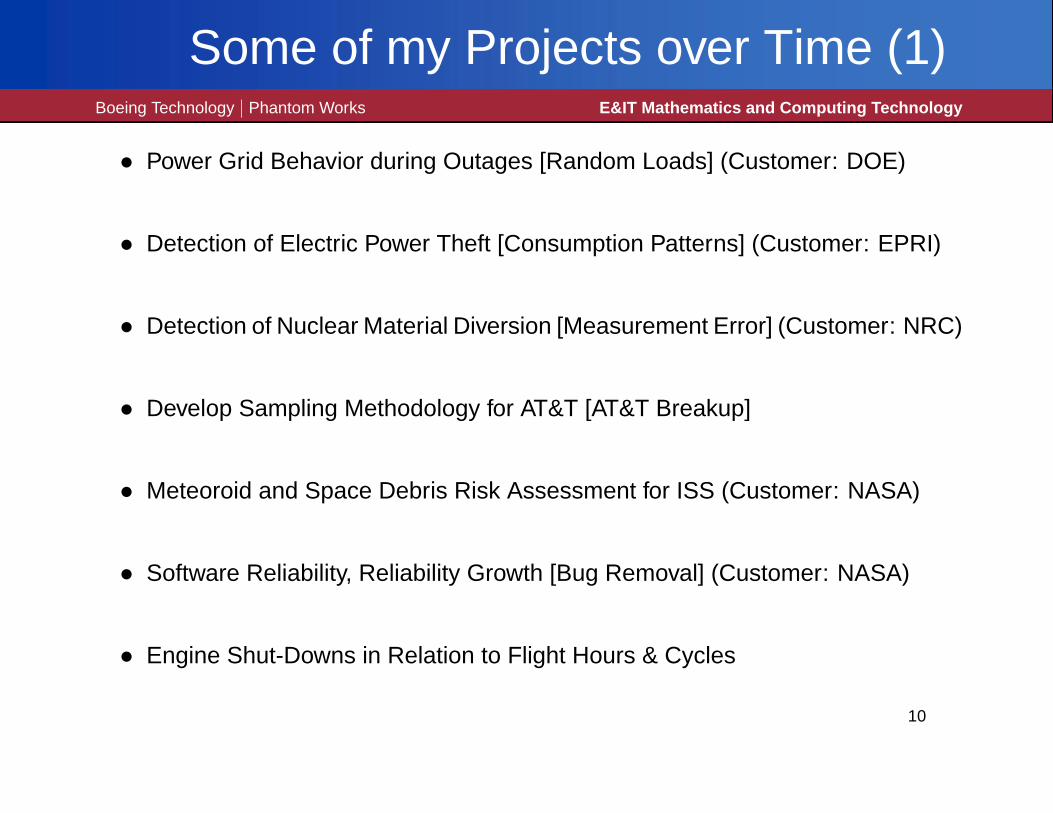
Some of my Projects over Time (1)Boeing Technology | Phantom Works E&IT Mathematics and Computing Technology
• Power Grid Behavior during Outages [Random Loads] (Customer: DOE)
• Detection of Electric Power Theft [Consumption Patterns] (Customer: EPRI)
• Detection of Nuclear Material Diversion [Measurement Error] (Customer: NRC)
• Develop Sampling Methodology for AT&T [AT&T Breakup]
• Meteoroid and Space Debris Risk Assessment for ISS (Customer: NASA)
• Software Reliability, Reliability Growth [Bug Removal] (Customer: NASA)
• Engine Shut-Downs in Relation to Flight Hours & Cycles
10
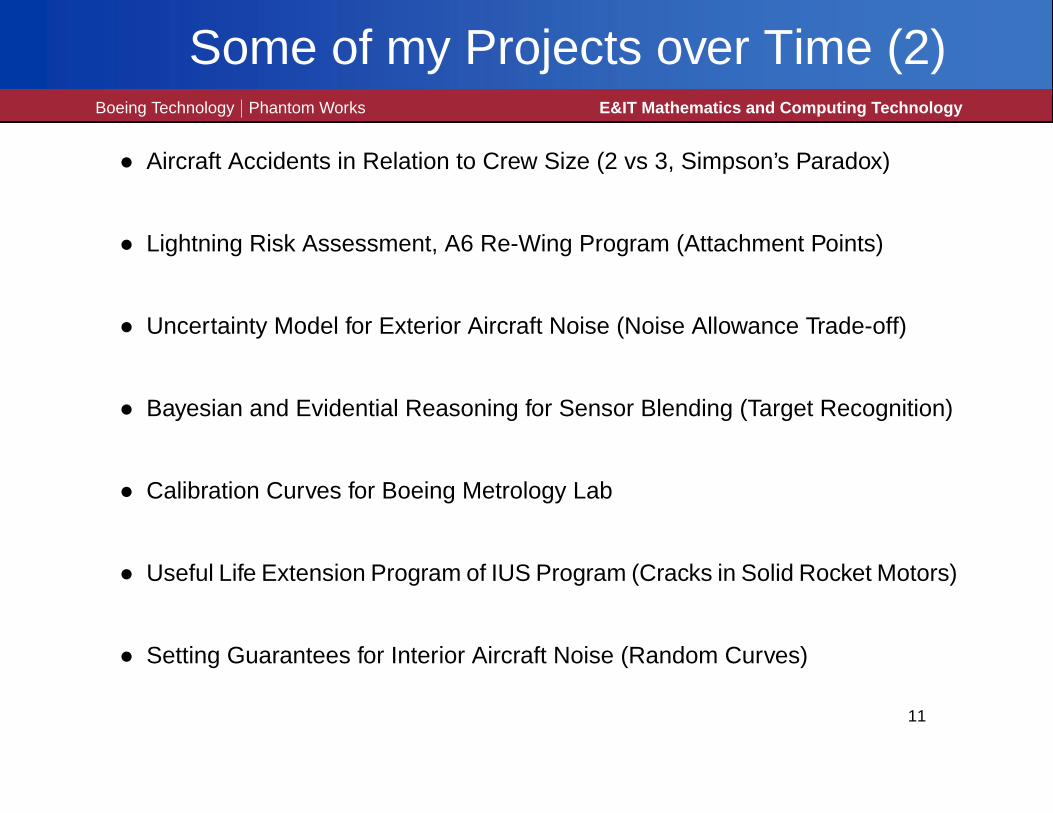
Some of my Projects over Time (2)Boeing Technology | Phantom Works E&IT Mathematics and Computing Technology
• Aircraft Accidents in Relation to Crew Size (2 vs 3, Simpson’s Paradox)
• Lightning Risk Assessment, A6 Re-Wing Program (Attachment Points)
• Uncertainty Model for Exterior Aircraft Noise (Noise Allowance Trade-off)
• Bayesian and Evidential Reasoning for Sensor Blending (Target Recognition)
• Calibration Curves for Boeing Metrology Lab
• Useful Life Extension Program of IUS Program (Cracks in Solid Rocket Motors)
• Setting Guarantees for Interior Aircraft Noise (Random Curves)
11
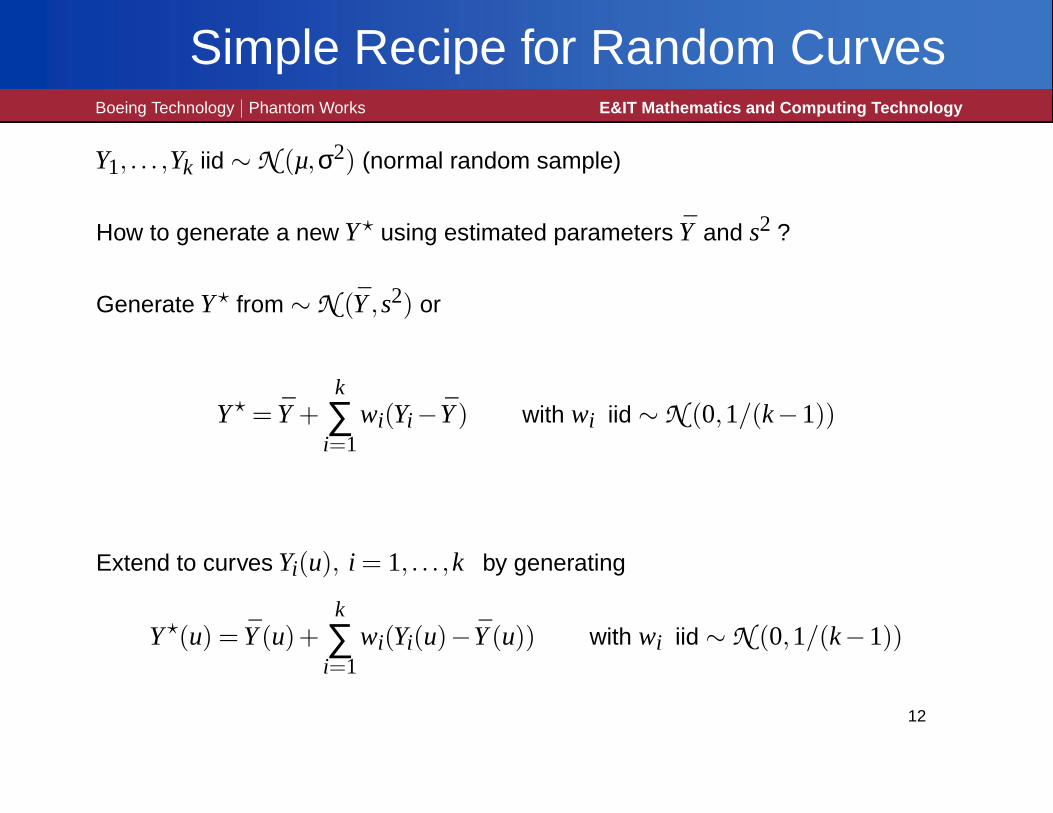
Simple Recipe for Random CurvesBoeing Technology | Phantom Works E&IT Mathematics and Computing Technology
Y1, . . . ,Yk iid ∼N (µ,σ2) (normal random sample)
How to generate a new Y? using estimated parameters Y and s2 ?
Generate Y? from ∼N (Y,s2) or
Y? = Y +k
∑i=1
wi(Yi−Y) with wi iid ∼N (0,1/(k−1))
Extend to curves Yi(u), i = 1, . . . ,k by generating
Y?(u) = Y(u)+k
∑i=1
wi(Yi(u)−Y(u)) with wi iid ∼N (0,1/(k−1))
12

Random CurvesBoeing Technology | Phantom Works E&IT Mathematics and Computing Technology
0 2 4 6 8 10
−3
00
20
original sample of curves
u
y(u
)
0 2 4 6 8 10
−4
00
40
bootstrapped curves
u
y* (
u)
13
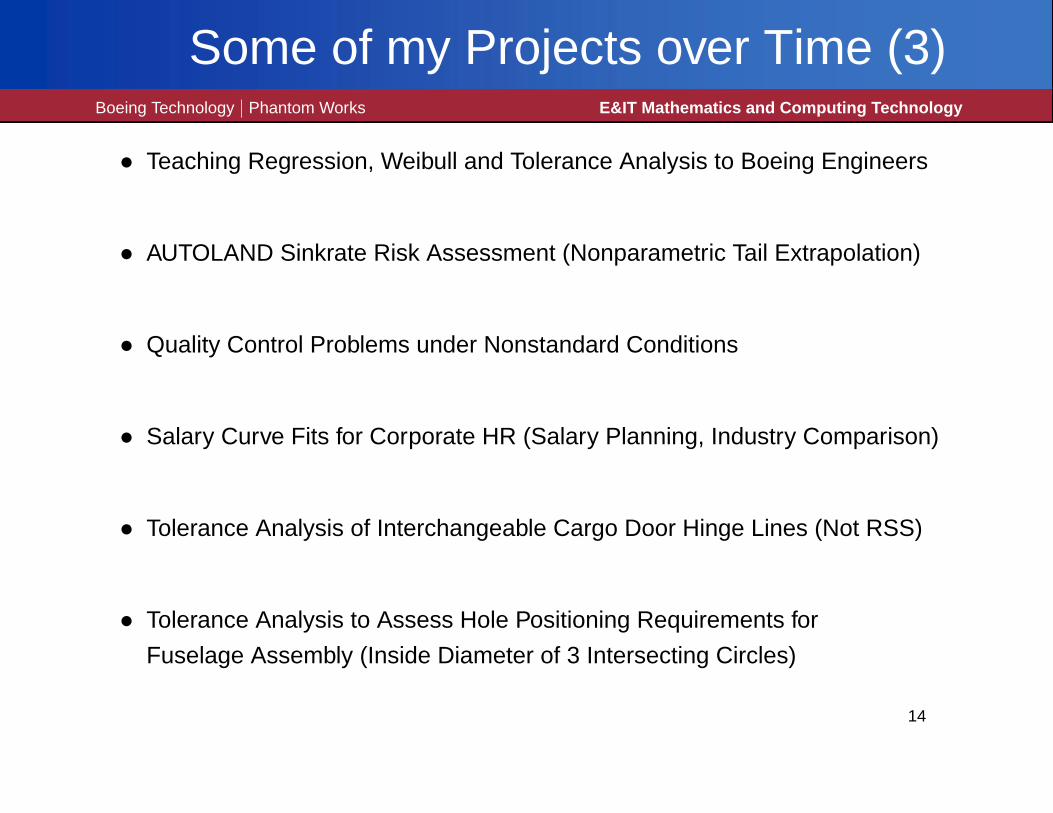
Some of my Projects over Time (3)Boeing Technology | Phantom Works E&IT Mathematics and Computing Technology
• Teaching Regression, Weibull and Tolerance Analysis to Boeing Engineers
• AUTOLAND Sinkrate Risk Assessment (Nonparametric Tail Extrapolation)
• Quality Control Problems under Nonstandard Conditions
• Salary Curve Fits for Corporate HR (Salary Planning, Industry Comparison)
• Tolerance Analysis of Interchangeable Cargo Door Hinge Lines (Not RSS)
• Tolerance Analysis to Assess Hole Positioning Requirements for
Fuselage Assembly (Inside Diameter of 3 Intersecting Circles)
14

Inside Diameter of 3 Intersecting Circles IBoeing Technology | Phantom Works E&IT Mathematics and Computing Technology
• •
•
•
• ••
15
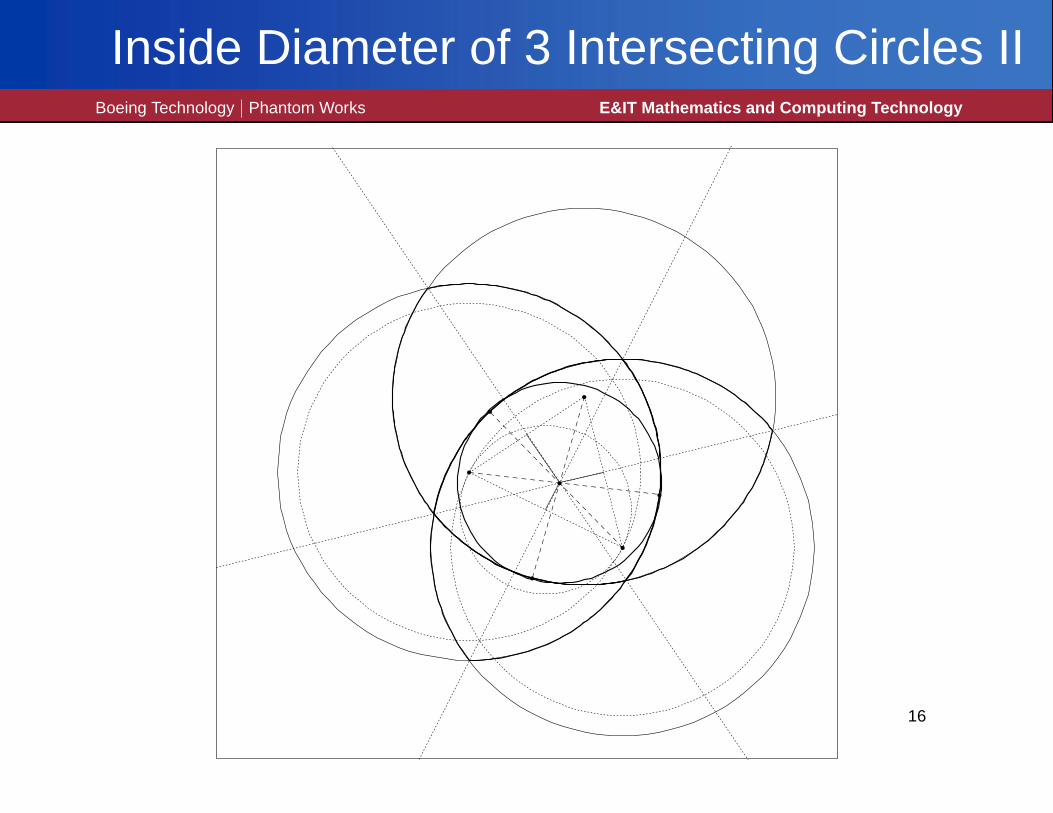
Inside Diameter of 3 Intersecting Circles IIBoeing Technology | Phantom Works E&IT Mathematics and Computing Technology
•
•
•
••
•
•
16
Some of my Projects over Time (4)Boeing Technology | Phantom Works E&IT Mathematics and Computing Technology
• Statistical Tolerancing for Fuselage Assembly Modeling,Collaboration with IBM (Disk Drives)and Boeing Wichita ATA Program =⇒ Patent: Statistical Tolerancing
• Provide Statistical Expertise as Part of Air India Litigation (Vertigo, Horizon)and Alaska 261 Crash (Jack Screw)
• Risk Analysis for Space Shuttle Solid Booster Rocket Bolt Hang-up Problem
• Risk Assessment for the CH-47 Helicopter Fleet due to Rotor Blade Swirls
• Taxiway Centerline Deviations for 747 (Joint Research with FAA)Extreme Value Behavior, Separation of Taxiways, Taxiway Widths,Implications for A-380, Support FAA in Dealing with ICAO
17
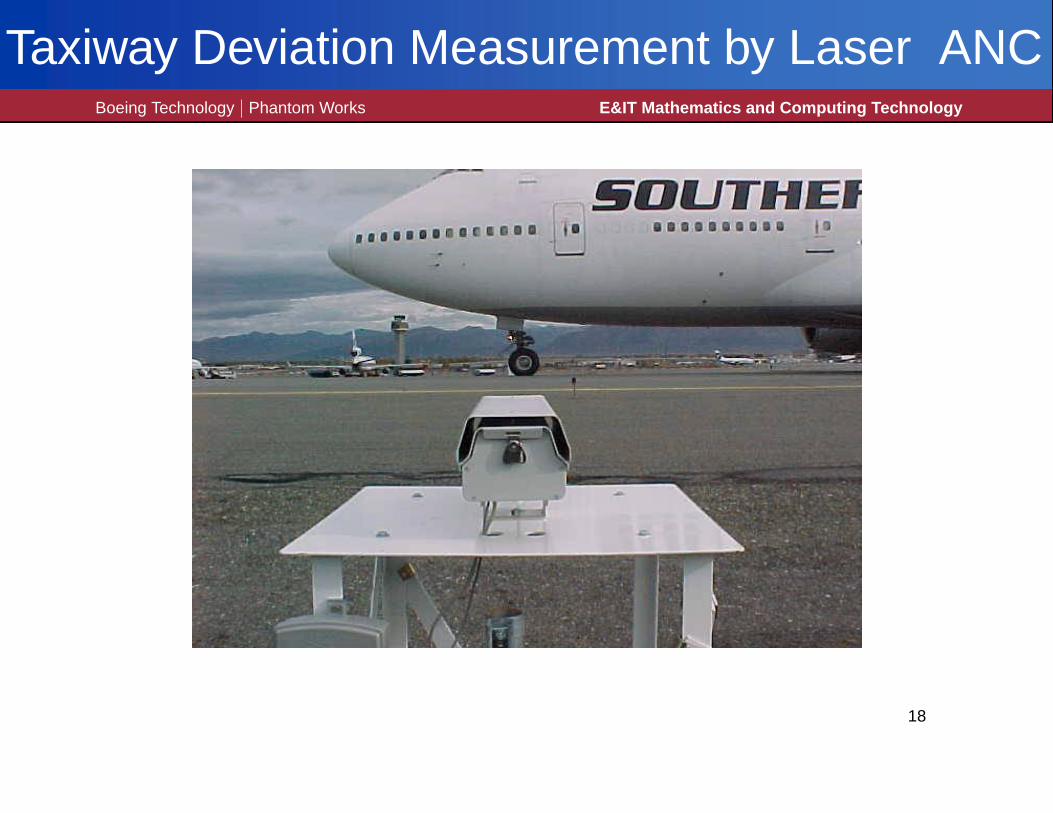
Taxiway Deviation Measurement by Laser ANCBoeing Technology | Phantom Works E&IT Mathematics and Computing Technology
18

Extrapolation of 747 Absolute DeviationsBoeing Technology | Phantom Works E&IT Mathematics and Computing Technology
−5 0 5 10
510
1520
Nonparametric Extrapolation
transformed p(i)
sam
ple
extre
mes
(ft)
1.e−1
1.e−2
1.e−3
1.e−4
1.e−5
1.e−6
1.e−7
1.e−8sample size n = 9796
quantile estimates : 15.84, 13.04, 10.48, 8.133, 5.985 (slope: 1 , intercept: 8.797 )
95 % quantile upper bounds : 16.66, 13.69, 10.98, 8.492, 6.215 (slope: 1.06 , intercept: 9.196 )
at right tail probabilities : p = 2e−07, 2e−06, 2e−05, 2e−04, 0.002
extreme value coefficient: 0.03836
using extremes 1 through 700
19

Wandering Aircraft on TaxiwayBoeing Technology | Phantom Works E&IT Mathematics and Computing Technology
20

Nose Gear to Main Gear Forced SinusoidBoeing Technology | Phantom Works E&IT Mathematics and Computing Technology
Assume the Distance between Nose Gear Centroid and Main Gear Centroid is L.
If the Nose Gear Deviation Y1(t) from Centerline is a Sinusoid
Y1(t) = ∆+Asin(2πt/T +θ)
then the Main Gear Deviation Y2(t) Follows a Sinusoid with Same Frequency
(in Steady State)
Y2(t) = ∆+A′sin(2πt/T +θ+ϕ)
with
A′ =A√
(2πL/TV)2+1and ϕ =−arctan(2πL/TV)
V is the Aircraft Velocity
21
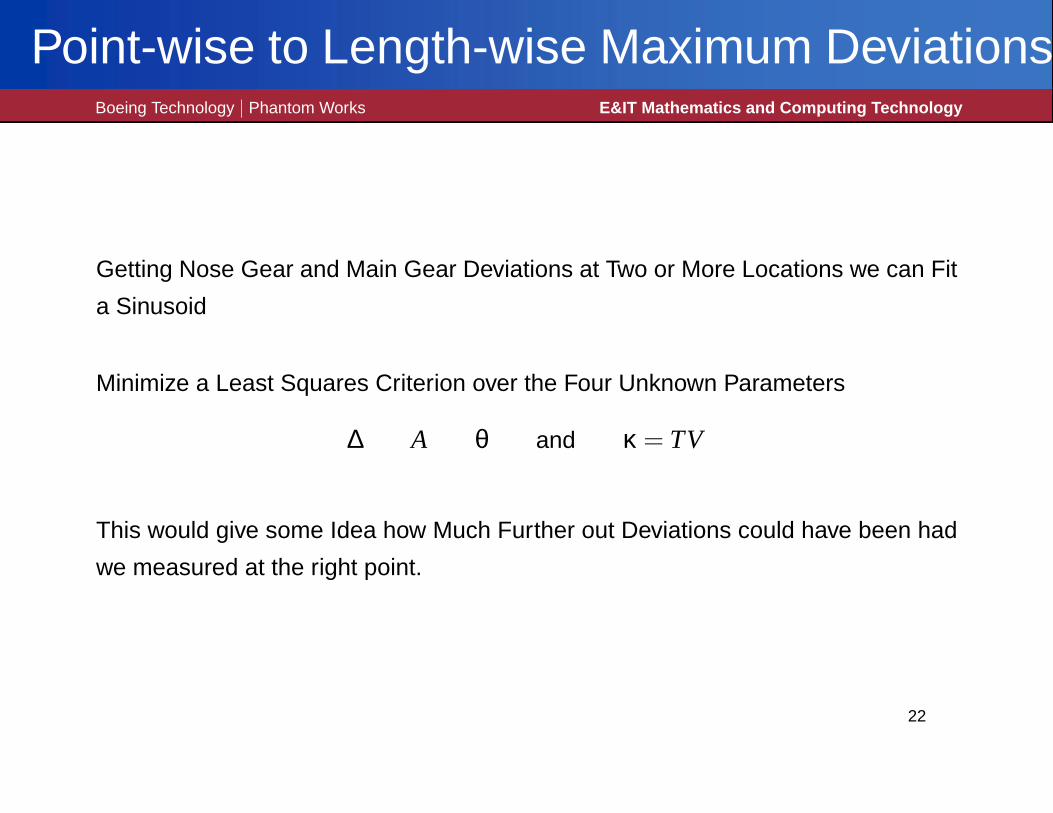
Point-wise to Length-wise Maximum DeviationsBoeing Technology | Phantom Works E&IT Mathematics and Computing Technology
Getting Nose Gear and Main Gear Deviations at Two or More Locations we can Fit
a Sinusoid
Minimize a Least Squares Criterion over the Four Unknown Parameters
∆ A θ and κ = TV
This would give some Idea how Much Further out Deviations could have been had
we measured at the right point.
22

Some of my Projects over Time (5)Boeing Technology | Phantom Works E&IT Mathematics and Computing Technology
• Assess Small Sample Properties of Bootstrap Methology
The Bootstrap Gave Wings to Statistics, Handling Almost All Problems
Very Intuitive and Appealing to Engineers
• Develop Monotone Confidence Bounds for Weibull Analysis (Web Page Tool)
• Transfer Previous Results to Logistic Regression Analysis,
Assessing Crack and Damage Detection
• Handle Hundreds of Hotline Calls
23

The International Space Station (ISS)Boeing Technology | Phantom Works E&IT Mathematics and Computing Technology
24
Space RubbleBoeing Technology | Phantom Works E&IT Mathematics and Computing Technology
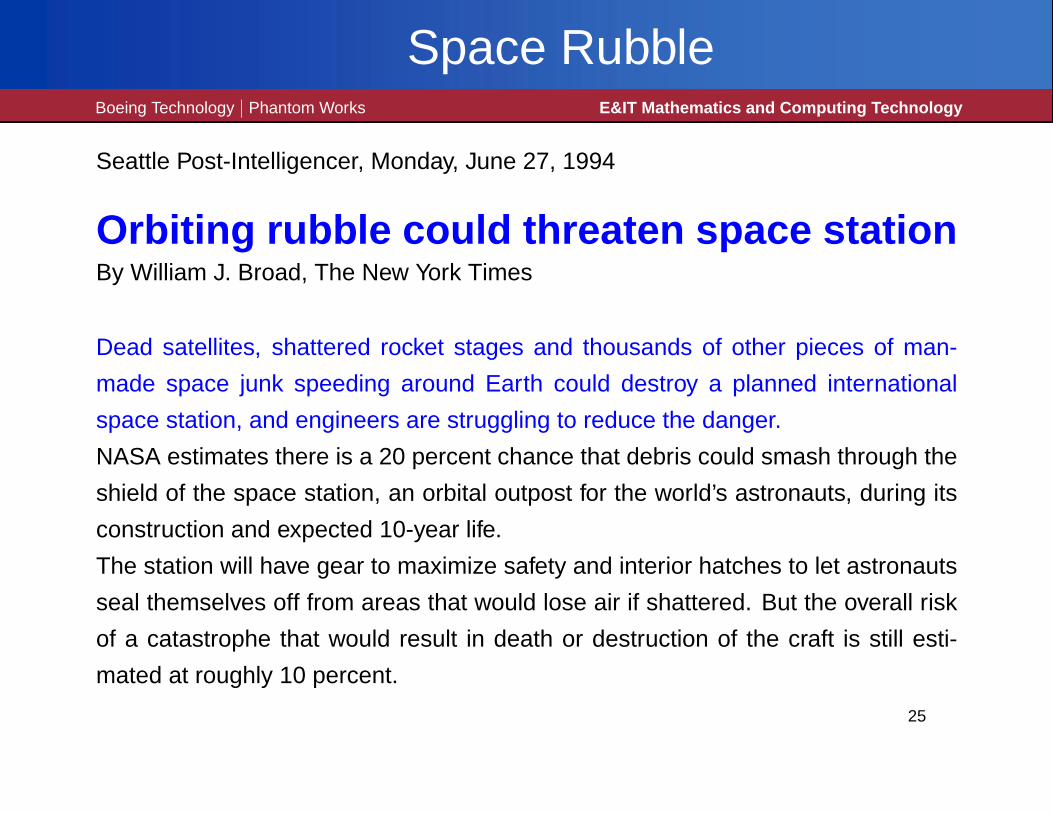
Seattle Post-Intelligencer, Monday, June 27, 1994
Orbiting rubble could threaten space stationBy William J. Broad, The New York Times
Dead satellites, shattered rocket stages and thousands of other pieces of man-
made space junk speeding around Earth could destroy a planned international
space station, and engineers are struggling to reduce the danger.
NASA estimates there is a 20 percent chance that debris could smash through the
shield of the space station, an orbital outpost for the world’s astronauts, during its
construction and expected 10-year life.
The station will have gear to maximize safety and interior hatches to let astronauts
seal themselves off from areas that would lose air if shattered. But the overall risk
of a catastrophe that would result in death or destruction of the craft is still esti-
mated at roughly 10 percent.
25
Space RubbleBoeing Technology | Phantom Works E&IT Mathematics and Computing Technology
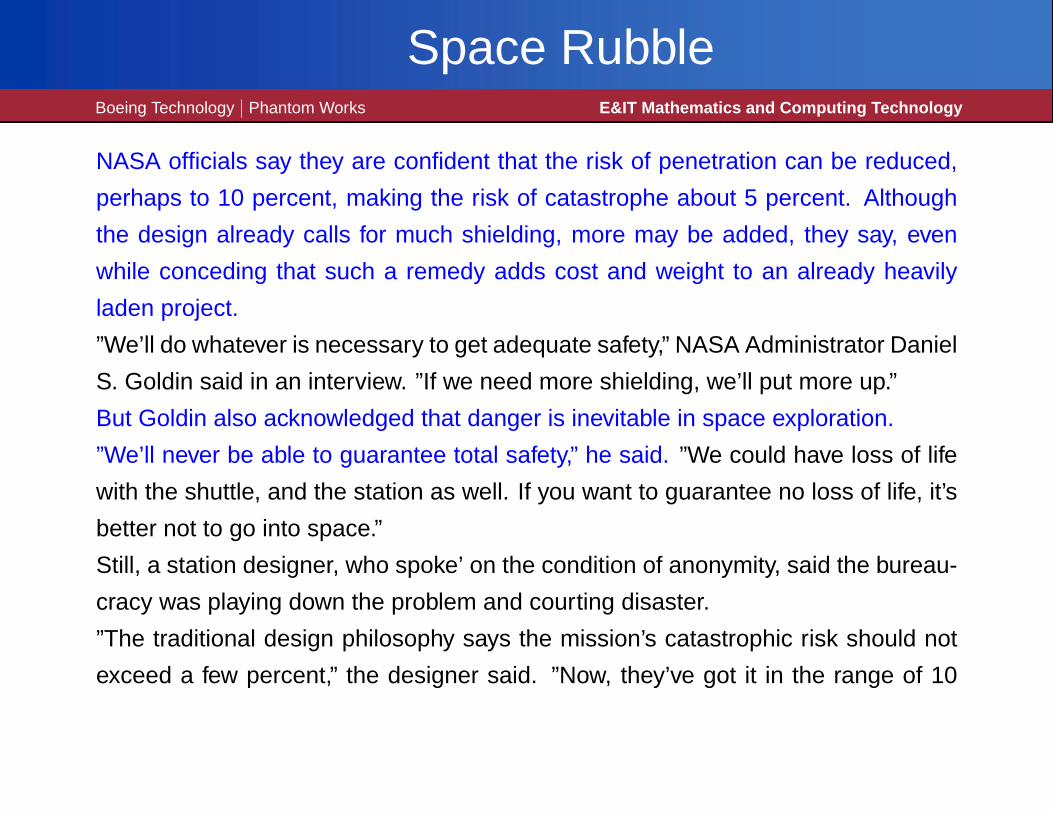
NASA officials say they are confident that the risk of penetration can be reduced,
perhaps to 10 percent, making the risk of catastrophe about 5 percent. Although
the design already calls for much shielding, more may be added, they say, even
while conceding that such a remedy adds cost and weight to an already heavily
laden project.
”We’ll do whatever is necessary to get adequate safety,” NASA Administrator Daniel
S. Goldin said in an interview. ”If we need more shielding, we’ll put more up.”
But Goldin also acknowledged that danger is inevitable in space exploration.
”We’ll never be able to guarantee total safety,” he said. ”We could have loss of life
with the shuttle, and the station as well. If you want to guarantee no loss of life, it’s
better not to go into space.”
Still, a station designer, who spoke’ on the condition of anonymity, said the bureau-
cracy was playing down the problem and courting disaster.
”The traditional design philosophy says the mission’s catastrophic risk should not
exceed a few percent,” the designer said. ”Now, they’ve got it in the range of 10
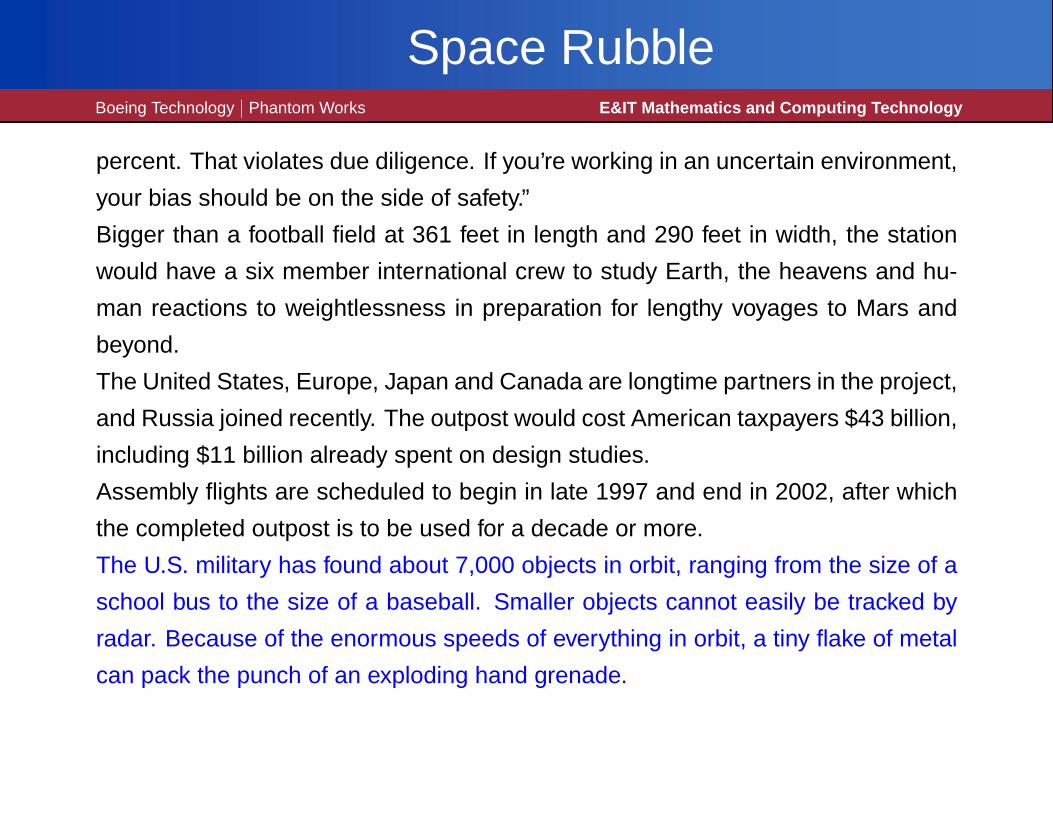
Space RubbleBoeing Technology | Phantom Works E&IT Mathematics and Computing Technology
percent. That violates due diligence. If you’re working in an uncertain environment,
your bias should be on the side of safety.”
Bigger than a football field at 361 feet in length and 290 feet in width, the station
would have a six member international crew to study Earth, the heavens and hu-
man reactions to weightlessness in preparation for lengthy voyages to Mars and
beyond.
The United States, Europe, Japan and Canada are longtime partners in the project,
and Russia joined recently. The outpost would cost American taxpayers $43 billion,
including $11 billion already spent on design studies.
Assembly flights are scheduled to begin in late 1997 and end in 2002, after which
the completed outpost is to be used for a decade or more.
The U.S. military has found about 7,000 objects in orbit, ranging from the size of a
school bus to the size of a baseball. Smaller objects cannot easily be tracked by
radar. Because of the enormous speeds of everything in orbit, a tiny flake of metal
can pack the punch of an exploding hand grenade.

ISS Wall DesignBoeing Technology | Phantom Works E&IT Mathematics and Computing Technology
• The Modules of the ISS Have a Double Wall Design
– How thick should the walls be?
– How much space between the walls?
– What material?
– Other design factors.
• Risk of Penetration by Meteoroids and Space Debris
• Objective: Minimize Penetration Risk Subject to Economic Considerations
• Thicker Walls Lead to Heavier and More Costly Payloads.
26
The Poisson Process Probability ModelBoeing Technology | Phantom Works E&IT Mathematics and Computing Technology
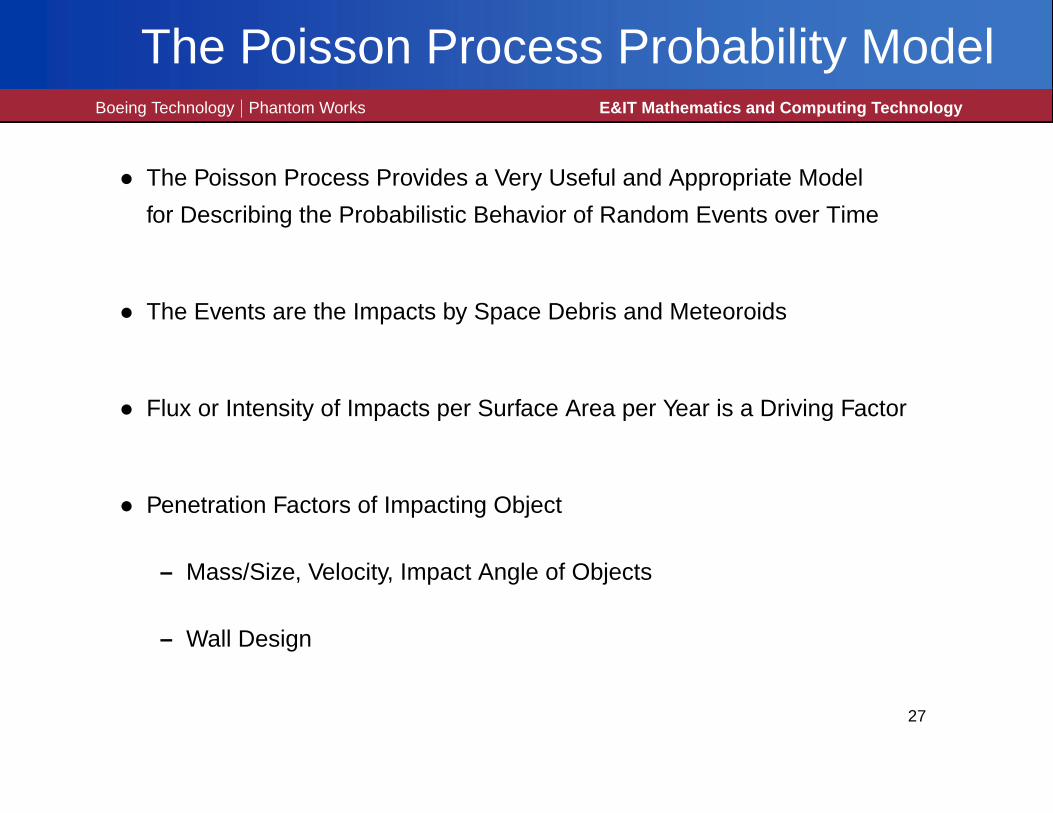
• The Poisson Process Provides a Very Useful and Appropriate Model
for Describing the Probabilistic Behavior of Random Events over Time
• The Events are the Impacts by Space Debris and Meteoroids
• Flux or Intensity of Impacts per Surface Area per Year is a Driving Factor
• Penetration Factors of Impacting Object
– Mass/Size, Velocity, Impact Angle of Objects
– Wall Design
27
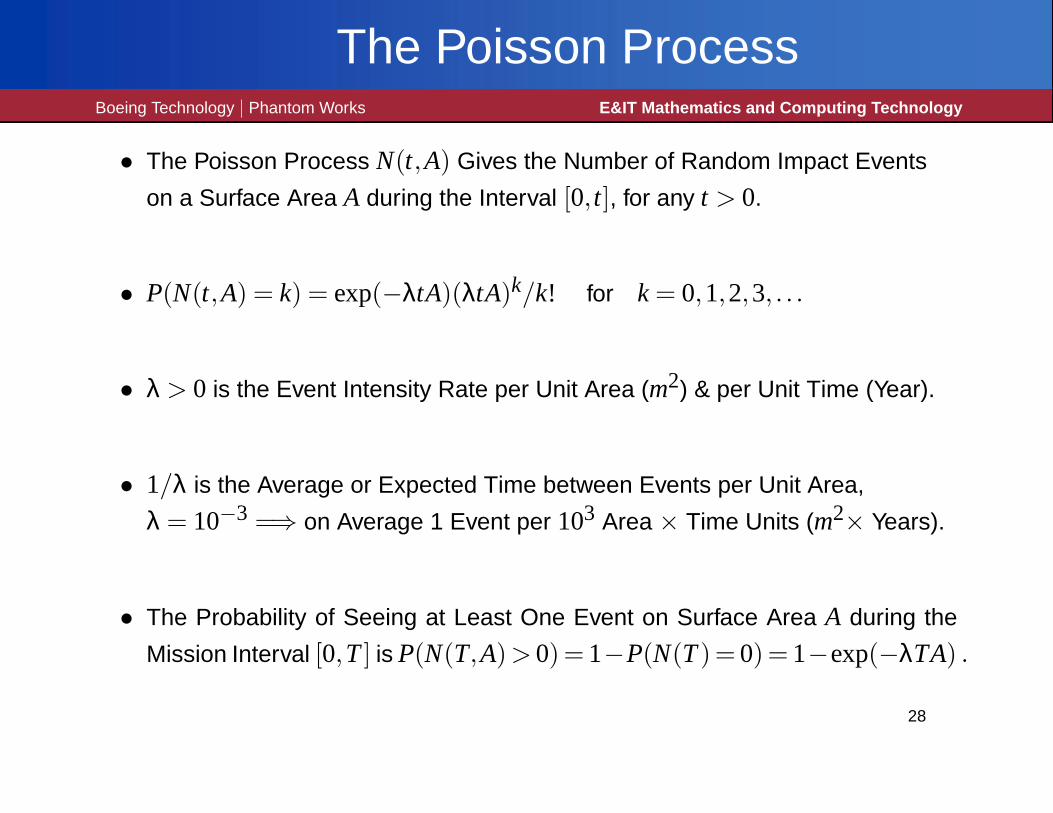
The Poisson ProcessBoeing Technology | Phantom Works E&IT Mathematics and Computing Technology
• The Poisson Process N(t,A) Gives the Number of Random Impact Events
on a Surface Area A during the Interval [0, t], for any t > 0.
• P(N(t,A) = k) = exp(−λtA)(λtA)k/k! for k = 0,1,2,3, . . .
• λ > 0 is the Event Intensity Rate per Unit Area (m2) & per Unit Time (Year).
• 1/λ is the Average or Expected Time between Events per Unit Area,
λ = 10−3 =⇒ on Average 1 Event per 103 Area × Time Units (m2× Years).
• The Probability of Seeing at Least One Event on Surface Area A during the
Mission Interval [0,T] is P(N(T,A)> 0)= 1−P(N(T)= 0)= 1−exp(−λTA) .
28
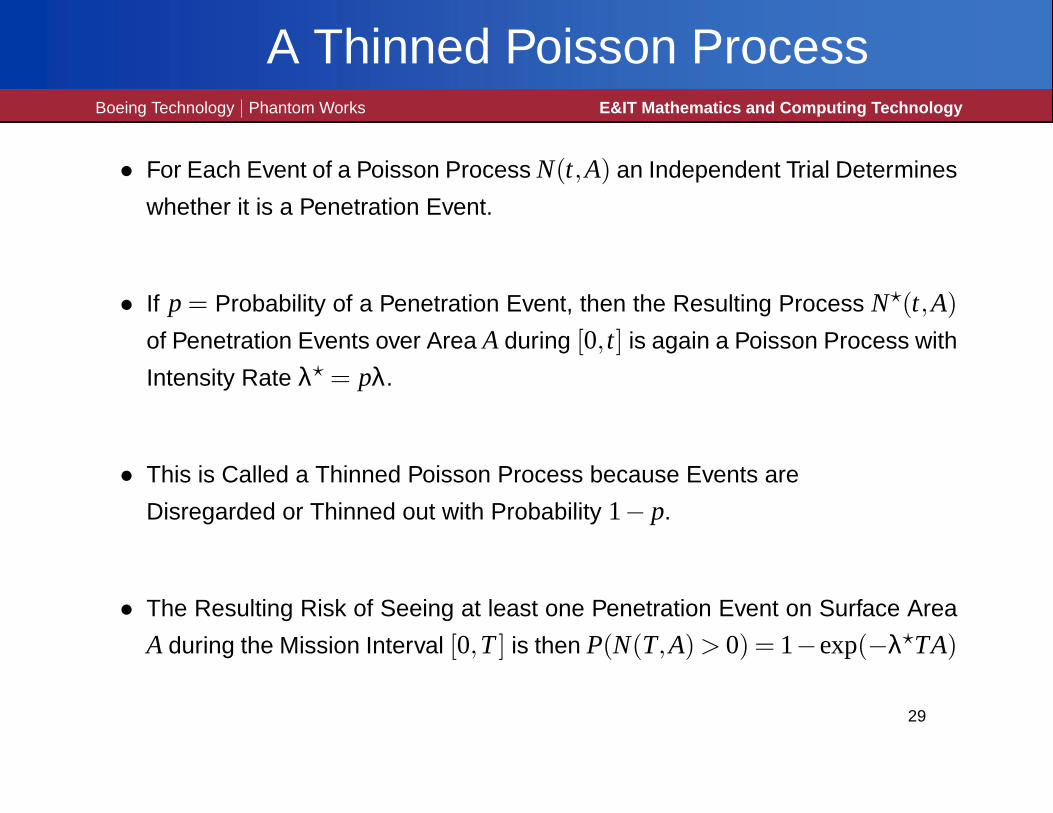
A Thinned Poisson ProcessBoeing Technology | Phantom Works E&IT Mathematics and Computing Technology
• For Each Event of a Poisson Process N(t,A) an Independent Trial Determines
whether it is a Penetration Event.
• If p = Probability of a Penetration Event, then the Resulting Process N?(t,A)of Penetration Events over Area A during [0, t] is again a Poisson Process with
Intensity Rate λ? = pλ.
• This is Called a Thinned Poisson Process because Events are
Disregarded or Thinned out with Probability 1− p.
• The Resulting Risk of Seeing at least one Penetration Event on Surface Area
A during the Mission Interval [0,T] is then P(N(T,A) > 0) = 1−exp(−λ?TA)
29
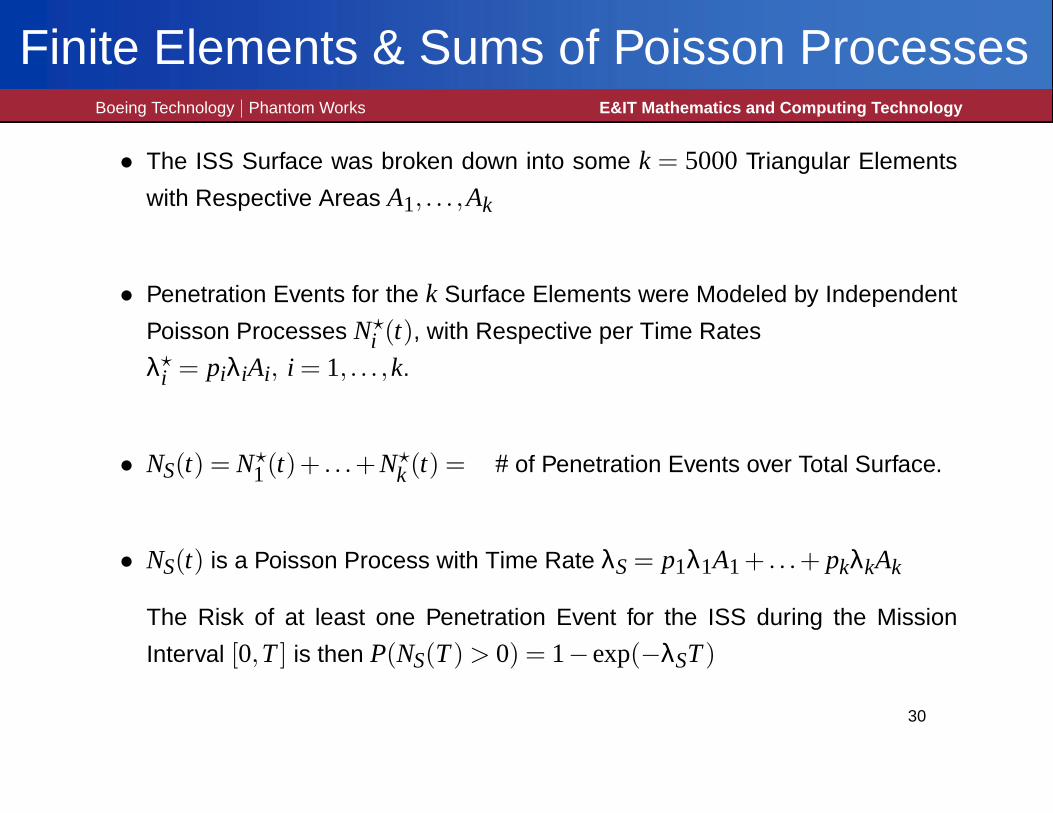
Finite Elements & Sums of Poisson ProcessesBoeing Technology | Phantom Works E&IT Mathematics and Computing Technology
• The ISS Surface was broken down into some k = 5000Triangular Elements
with Respective Areas A1, . . . ,Ak
• Penetration Events for the k Surface Elements were Modeled by Independent
Poisson Processes N?i (t), with Respective per Time Rates
λ?i = piλiAi, i = 1, . . . ,k.
• NS(t) = N?1(t)+ . . .+N?
k(t) = # of Penetration Events over Total Surface.
• NS(t) is a Poisson Process with Time Rate λS= p1λ1A1+ . . .+ pkλkAk
The Risk of at least one Penetration Event for the ISS during the Mission
Interval [0,T] is then P(NS(T) > 0) = 1−exp(−λST)
30

Finite Element ISS Surface GridBoeing Technology | Phantom Works E&IT Mathematics and Computing Technology
z y
'(x 31
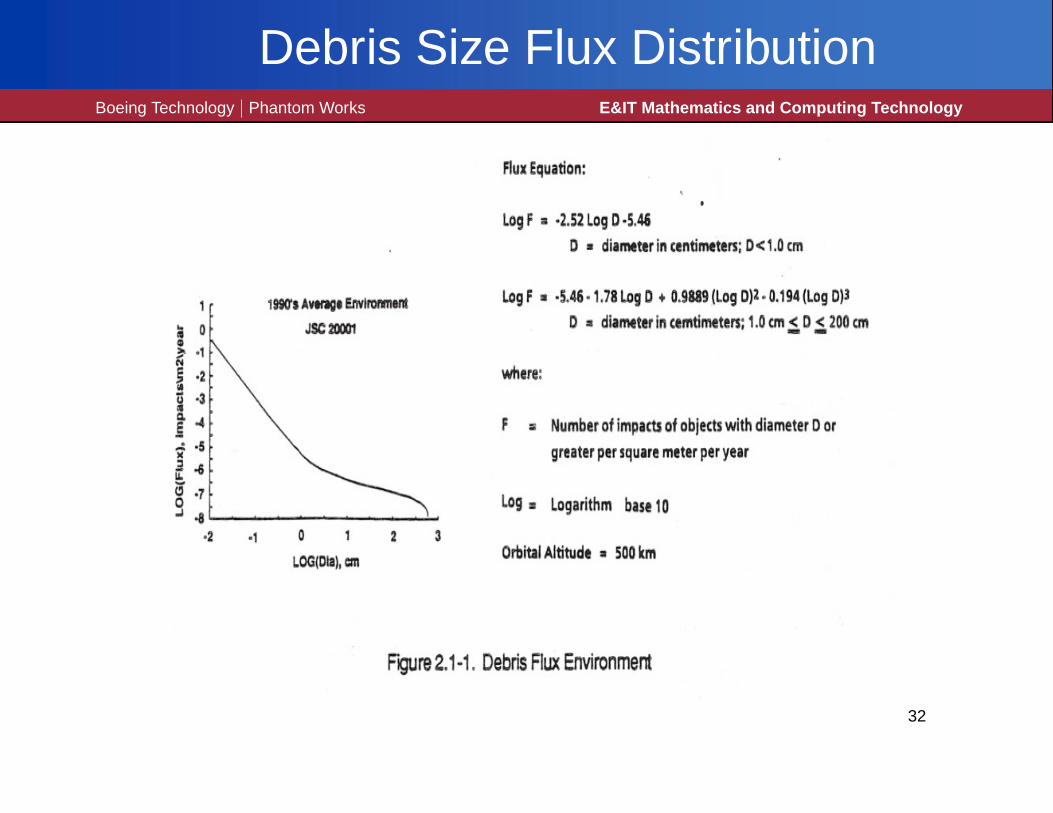
Debris Size Flux DistributionBoeing Technology | Phantom Works E&IT Mathematics and Computing Technology
1990's Average environment
JSC 20001
-1 o
LOG(Dla), em
2 3
Flux Equation:
Log F •• -2.52 Log D-5.46D •• diameter in centimeters; D< 1.0 cm
Log F •• -5.46 - 1.78 Log D + 0.9889 (Log D)2. 0.194 (Log D)3
D •• diameter in cemtimeters; 1.0 em ::. D .::.200 cm
where:
F '" Number at impacts at objects with diameter D or
greater per square meter per year
Log = Logarithm base 10
Orbital Altitude •• 500 km
FlQUre2.1-1. Debris Flux Environment
32

Impact Angle DistributionBoeing Technology | Phantom Works E&IT Mathematics and Computing Technology
SPACE STATION IMPACT ANGLE DISTRIBUTIONF'IGURE EIGHT CONF'IGURATION
1.0
0.90.8~
0.7
J (IJ~ 0.6(IJ 0Ita. 0.5W >1=:5
0.4:J ~:J() 0..3
0.20.10.0
0
10 20' .30 40 50 60 70 80 90
IMPACT ANGLE. DEG
Figure 2.8-1. Impact Angle Probability Distnbution 33

Meteoroid Velocity DistributionBoeing Technology | Phantom Works E&IT Mathematics and Computing Technology
0.60
0.500040
>- ~.0 0.30c .00L-a.. 0.20
0.100.00
3
[]
Meteoroid Impact Velocity DistributionComparision of NASA SP-8013 with
and without motion effects
Space Station Velocity 7.5 km/sec
9 15 21 27 33 39 45 51 57 63 69 75
Impact Velocity, km/secRelative to Orbiting ~ Relative to Stationary
Space Station Space Station (per SP-R013)
Figure 2.2~3. Meteoroid Impact Velocity Distribution Relative to Space Station34

Debris Velocity DistributionBoeing Technology | Phantom Works E&IT Mathematics and Computing Technology
1.00
0.900.800.70>-
0.60~ .0 0.50c .00L.- 0040a..
0.300.200.100.000
2 4
Cumulative ProbabilityMan-made Debris
6 8 10 12
Relative Velocity, km/sec
14 16 18
Figure 2.8-2. Impact Velocity Probability Distribution35

Wall Filtering ProbabilitiesBoeing Technology | Phantom Works E&IT Mathematics and Computing Technology
92%0.8 E2.0~ 90%c EU)
.U) U)
Q)U)c Q)
~c
.~ 0.6 -61.5..c I- ..cI-"0 "0Q) Q)..c(f) 0.4
..c
(f) 1.0
0.2 -I 0.5
94% 95% 96% 97%
Optimum Weight line;;;;
;;;
Probability of No Penetrationfor the module pattern.
93%
Impact Angle, deg
o 45 65NAS8-36426 •.•••
Other Studies 0 L:1 02.5
3.01.2
1.0
CONFIGURATION FOR ANALYSIS
SPACING = 101.6 MM (4 IN)WITH MLI
EXPOSURE DURATION = 10 YEARS0-1 0I0123456
Backwall Thickness, mmI
IIIII0
0.050.100.150.200.25Backwall Thickness, in
Figure 3.2-1. Module Design Data Comparison With Test Data. 36

ISS Penetration Risk MapBoeing Technology | Phantom Works E&IT Mathematics and Computing Technology
37