9828 explore manual - successline · pdf filein grade 9 and plan in grade 11 ... vi 1.1...
TRANSCRIPT

TECHNICAL MANUAL


TECHNICAL MANUAL

ACT endorses the Code of Fair Testing Practices in Education and the Code ofProfessional Responsibilities in Educational Measurement, guides to the conductof those involved in educational testing. ACT is committed to ensuring that eachof its testing programs upholds the guidelines in each Code.
A copy of each Code may be obtained free of charge from ACT CustomerServices (68), P.O. Box 1008, Iowa City, IA 52243-1008, 319/337-1429.
Visit ACT’s website at www.act.org.
© 2007 by ACT, Inc. All rights reserved.
9828

Figures . . . . . . . . . . . . . . . . . . . . . . . . . . . . . . . . . . . . . . . . . . . . . . . . . . . . . . . . . . . . . . . . . . . . . . . . . . . . . . . . . . . . . . . . . . . . . v
Tables . . . . . . . . . . . . . . . . . . . . . . . . . . . . . . . . . . . . . . . . . . . . . . . . . . . . . . . . . . . . . . . . . . . . . . . . . . . . . . . . . . . . . . . . . . . . . vi
Preface . . . . . . . . . . . . . . . . . . . . . . . . . . . . . . . . . . . . . . . . . . . . . . . . . . . . . . . . . . . . . . . . . . . . . . . . . . . . . . . . . . . . . . . . . . . . vii
Chapter 1 The EXPLORE Program . . . . . . . . . . . . . . . . . . . . . . . . . . . . . . . . . . . . . . . . . . . . . . . . . . . . . . . . . . . . . . . . . . . . . 1Overview and Purpose of the EXPLORE Program . . . . . . . . . . . . . . . . . . . . . . . . . . . . . . . . . . . . . . . . . . . . . . . . . . . . . . 1Code of Fair Testing Practices in Education and Code of Professional Responsibilities
in Educational Measurement . . . . . . . . . . . . . . . . . . . . . . . . . . . . . . . . . . . . . . . . . . . . . . . . . . . . . . . . . . . . . . . . . . . . 2Philosophical Basis for the Tests of Educational Development . . . . . . . . . . . . . . . . . . . . . . . . . . . . . . . . . . . . . . . . . . . . . 2Administering the EXPLORE Program. . . . . . . . . . . . . . . . . . . . . . . . . . . . . . . . . . . . . . . . . . . . . . . . . . . . . . . . . . . . . . . . 3
Administration Schedule . . . . . . . . . . . . . . . . . . . . . . . . . . . . . . . . . . . . . . . . . . . . . . . . . . . . . . . . . . . . . . . . . . . . . . 3Support Materials . . . . . . . . . . . . . . . . . . . . . . . . . . . . . . . . . . . . . . . . . . . . . . . . . . . . . . . . . . . . . . . . . . . . . . . . . . . 4ACT’s Standards for Test Administration and Security . . . . . . . . . . . . . . . . . . . . . . . . . . . . . . . . . . . . . . . . . . . . . . . 4
Chapter 2 The EXPLORE Tests of Educational Development . . . . . . . . . . . . . . . . . . . . . . . . . . . . . . . . . . . . . . . . . . . . . . . 5Description of the EXPLORE Tests . . . . . . . . . . . . . . . . . . . . . . . . . . . . . . . . . . . . . . . . . . . . . . . . . . . . . . . . . . . . . . . . . . 5
The English Test . . . . . . . . . . . . . . . . . . . . . . . . . . . . . . . . . . . . . . . . . . . . . . . . . . . . . . . . . . . . . . . . . . . . . . . . . . . . 5The Mathematics Test. . . . . . . . . . . . . . . . . . . . . . . . . . . . . . . . . . . . . . . . . . . . . . . . . . . . . . . . . . . . . . . . . . . . . . . . 5The Reading Test . . . . . . . . . . . . . . . . . . . . . . . . . . . . . . . . . . . . . . . . . . . . . . . . . . . . . . . . . . . . . . . . . . . . . . . . . . . 6The Science Test . . . . . . . . . . . . . . . . . . . . . . . . . . . . . . . . . . . . . . . . . . . . . . . . . . . . . . . . . . . . . . . . . . . . . . . . . . . 6
Test Development Procedures . . . . . . . . . . . . . . . . . . . . . . . . . . . . . . . . . . . . . . . . . . . . . . . . . . . . . . . . . . . . . . . . . . . . . . 6Test Specifications . . . . . . . . . . . . . . . . . . . . . . . . . . . . . . . . . . . . . . . . . . . . . . . . . . . . . . . . . . . . . . . . . . . . . . . . . . 6
Content Specifications. . . . . . . . . . . . . . . . . . . . . . . . . . . . . . . . . . . . . . . . . . . . . . . . . . . . . . . . . . . . . . . . . . . 6Statistical Specifications . . . . . . . . . . . . . . . . . . . . . . . . . . . . . . . . . . . . . . . . . . . . . . . . . . . . . . . . . . . . . . . . . 6
Selection of Item Writers. . . . . . . . . . . . . . . . . . . . . . . . . . . . . . . . . . . . . . . . . . . . . . . . . . . . . . . . . . . . . . . . . . . . . . 6Item Construction . . . . . . . . . . . . . . . . . . . . . . . . . . . . . . . . . . . . . . . . . . . . . . . . . . . . . . . . . . . . . . . . . . . . . . . . . . . 9Review of Items . . . . . . . . . . . . . . . . . . . . . . . . . . . . . . . . . . . . . . . . . . . . . . . . . . . . . . . . . . . . . . . . . . . . . . . . . . . . 9Item Tryouts . . . . . . . . . . . . . . . . . . . . . . . . . . . . . . . . . . . . . . . . . . . . . . . . . . . . . . . . . . . . . . . . . . . . . . . . . . . . . . . 9Item Analysis of Tryout Units . . . . . . . . . . . . . . . . . . . . . . . . . . . . . . . . . . . . . . . . . . . . . . . . . . . . . . . . . . . . . . . . . 10Assembly of New Forms. . . . . . . . . . . . . . . . . . . . . . . . . . . . . . . . . . . . . . . . . . . . . . . . . . . . . . . . . . . . . . . . . . . . . 10Content and Fairness Review of Test Forms . . . . . . . . . . . . . . . . . . . . . . . . . . . . . . . . . . . . . . . . . . . . . . . . . . . . . 11Review Following Operational Administration. . . . . . . . . . . . . . . . . . . . . . . . . . . . . . . . . . . . . . . . . . . . . . . . . . . . . 11
EXPLORE Scoring Procedures . . . . . . . . . . . . . . . . . . . . . . . . . . . . . . . . . . . . . . . . . . . . . . . . . . . . . . . . . . . . . . . . . . . . 11
Chapter 3 ACT’s College Readiness Standards and College Readiness Benchmarks . . . . . . . . . . . . . . . . . . . . . . . . . . 12ACT’s College Readiness Standards . . . . . . . . . . . . . . . . . . . . . . . . . . . . . . . . . . . . . . . . . . . . . . . . . . . . . . . . . . . . . . . . 12
Description of the College Readiness Standards . . . . . . . . . . . . . . . . . . . . . . . . . . . . . . . . . . . . . . . . . . . . . . . . . . 12Determining the Score Ranges for the College Readiness Standards (1997). . . . . . . . . . . . . . . . . . . . . . . . . . . . 12Developing the College Readiness Standards . . . . . . . . . . . . . . . . . . . . . . . . . . . . . . . . . . . . . . . . . . . . . . . . . . . . 13
The Process . . . . . . . . . . . . . . . . . . . . . . . . . . . . . . . . . . . . . . . . . . . . . . . . . . . . . . . . . . . . . . . . . . . . . . . . . 13Conducting an Independent Review of the College Readiness Standards . . . . . . . . . . . . . . . . . . . . . . . . . 15
Refining the College Readiness Standards for EXPLORE and PLAN (2001) . . . . . . . . . . . . . . . . . . . . . . . . . . . . 16Periodic Review of the College Readiness Standards . . . . . . . . . . . . . . . . . . . . . . . . . . . . . . . . . . . . . . . . . . . . . . 16
Interpreting and Using the College Readiness Standards . . . . . . . . . . . . . . . . . . . . . . . . . . . . . . . . . . . . . . . . . . . . . . . . 17ACT’s College Readiness Benchmarks . . . . . . . . . . . . . . . . . . . . . . . . . . . . . . . . . . . . . . . . . . . . . . . . . . . . . . . . . . . . . . 17
Description of the College Readiness Benchmarks . . . . . . . . . . . . . . . . . . . . . . . . . . . . . . . . . . . . . . . . . . . . . . . . 17Data Used to Establish the Benchmarks for the ACT . . . . . . . . . . . . . . . . . . . . . . . . . . . . . . . . . . . . . . . . . . . . . . 17Procedures Used to Establish the Benchmarks for EXPLORE and PLAN . . . . . . . . . . . . . . . . . . . . . . . . . . . . . . 18
Interpreting the EXPLORE and PLAN Benchmarks for Students Who Test With EXPLOREin Grade 9 and PLAN in Grade 11 . . . . . . . . . . . . . . . . . . . . . . . . . . . . . . . . . . . . . . . . . . . . . . . . . . . . . . . . . . . . . . . 18
Intended Uses of the Benchmarks for Students, Schools, Districts, and States . . . . . . . . . . . . . . . . . . . . . . . . . . . . . . . 18Interpreting EPAS Test Scores With Respect to Both ACT’s College Readiness Standards
and ACT’s College Readiness Benchmarks . . . . . . . . . . . . . . . . . . . . . . . . . . . . . . . . . . . . . . . . . . . . . . . . . . . . . . . . 18
iii
Contents

Chapter 4 Technical Characteristics of the EXPLORE Tests of Educational Development . . . . . . . . . . . . . . . . . . . . . . 19Scaling and Norming . . . . . . . . . . . . . . . . . . . . . . . . . . . . . . . . . . . . . . . . . . . . . . . . . . . . . . . . . . . . . . . . . . . . . . . . . . . . 19
Scaling Study (1999). . . . . . . . . . . . . . . . . . . . . . . . . . . . . . . . . . . . . . . . . . . . . . . . . . . . . . . . . . . . . . . . . . . 19Norming Study (2005) . . . . . . . . . . . . . . . . . . . . . . . . . . . . . . . . . . . . . . . . . . . . . . . . . . . . . . . . . . . . . . . . . . 19
Sampling for the 1999 Study . . . . . . . . . . . . . . . . . . . . . . . . . . . . . . . . . . . . . . . . . . . . . . . . . . . . . . . . . . . . . . . . . 19Sample Design and Data Collection . . . . . . . . . . . . . . . . . . . . . . . . . . . . . . . . . . . . . . . . . . . . . . . . . . . . . . . 19Data Editing. . . . . . . . . . . . . . . . . . . . . . . . . . . . . . . . . . . . . . . . . . . . . . . . . . . . . . . . . . . . . . . . . . . . . . . . . . 20Weighting. . . . . . . . . . . . . . . . . . . . . . . . . . . . . . . . . . . . . . . . . . . . . . . . . . . . . . . . . . . . . . . . . . . . . . . . . . . . 20Response Rates . . . . . . . . . . . . . . . . . . . . . . . . . . . . . . . . . . . . . . . . . . . . . . . . . . . . . . . . . . . . . . . . . . . . . . 20Obtained Precision . . . . . . . . . . . . . . . . . . . . . . . . . . . . . . . . . . . . . . . . . . . . . . . . . . . . . . . . . . . . . . . . . . . . 22
Scaling . . . . . . . . . . . . . . . . . . . . . . . . . . . . . . . . . . . . . . . . . . . . . . . . . . . . . . . . . . . . . . . . . . . . . . . . . . . . . . . . . . 22The Score Scale . . . . . . . . . . . . . . . . . . . . . . . . . . . . . . . . . . . . . . . . . . . . . . . . . . . . . . . . . . . . . . . . . . . . . . 22The Scaling Process . . . . . . . . . . . . . . . . . . . . . . . . . . . . . . . . . . . . . . . . . . . . . . . . . . . . . . . . . . . . . . . . . . . 23
Norms for the 2005 National Sample . . . . . . . . . . . . . . . . . . . . . . . . . . . . . . . . . . . . . . . . . . . . . . . . . . . . . . . . . . . 24The Norming . . . . . . . . . . . . . . . . . . . . . . . . . . . . . . . . . . . . . . . . . . . . . . . . . . . . . . . . . . . . . . . . . . . . . . . . . . . . . 24Sampling for the 2005 Norming Study . . . . . . . . . . . . . . . . . . . . . . . . . . . . . . . . . . . . . . . . . . . . . . . . . . . . . . . . . . 24
Sample Design . . . . . . . . . . . . . . . . . . . . . . . . . . . . . . . . . . . . . . . . . . . . . . . . . . . . . . . . . . . . . . . . . . . . . . . 24Data Editing. . . . . . . . . . . . . . . . . . . . . . . . . . . . . . . . . . . . . . . . . . . . . . . . . . . . . . . . . . . . . . . . . . . . . . . . . . 24Weighting. . . . . . . . . . . . . . . . . . . . . . . . . . . . . . . . . . . . . . . . . . . . . . . . . . . . . . . . . . . . . . . . . . . . . . . . . . . . 25Nonresponse and Bias . . . . . . . . . . . . . . . . . . . . . . . . . . . . . . . . . . . . . . . . . . . . . . . . . . . . . . . . . . . . . . . . . 25Precision Estimates. . . . . . . . . . . . . . . . . . . . . . . . . . . . . . . . . . . . . . . . . . . . . . . . . . . . . . . . . . . . . . . . . . . . 25Norming Results . . . . . . . . . . . . . . . . . . . . . . . . . . . . . . . . . . . . . . . . . . . . . . . . . . . . . . . . . . . . . . . . . . . . . . 25Estimated PLAN Composite Score Ranges . . . . . . . . . . . . . . . . . . . . . . . . . . . . . . . . . . . . . . . . . . . . . . . . . 26
Equating . . . . . . . . . . . . . . . . . . . . . . . . . . . . . . . . . . . . . . . . . . . . . . . . . . . . . . . . . . . . . . . . . . . . . . . . . . . . . . . . . . . . . . 36Reliability . . . . . . . . . . . . . . . . . . . . . . . . . . . . . . . . . . . . . . . . . . . . . . . . . . . . . . . . . . . . . . . . . . . . . . . . . . . . . . . . . . . . . 36
Reliability, Measurement Error, and Effective Weights . . . . . . . . . . . . . . . . . . . . . . . . . . . . . . . . . . . . . . . . . . . . . . 36Validity . . . . . . . . . . . . . . . . . . . . . . . . . . . . . . . . . . . . . . . . . . . . . . . . . . . . . . . . . . . . . . . . . . . . . . . . . . . . . . . . . . . . . . . 43
Overview . . . . . . . . . . . . . . . . . . . . . . . . . . . . . . . . . . . . . . . . . . . . . . . . . . . . . . . . . . . . . . . . . . . . . . . . . . . . . . . . . 43Measuring Educational Achievement . . . . . . . . . . . . . . . . . . . . . . . . . . . . . . . . . . . . . . . . . . . . . . . . . . . . . . . . . . . 43
Content Validity for EXPLORE Scores . . . . . . . . . . . . . . . . . . . . . . . . . . . . . . . . . . . . . . . . . . . . . . . . . . . . . 43EXPLORE Test Scores . . . . . . . . . . . . . . . . . . . . . . . . . . . . . . . . . . . . . . . . . . . . . . . . . . . . . . . . . . . . . . . . . 43Statistical Relationships Between EXPLORE, PLAN, and ACT Scores . . . . . . . . . . . . . . . . . . . . . . . . . . . . 45EXPLORE Scores and Course Grades . . . . . . . . . . . . . . . . . . . . . . . . . . . . . . . . . . . . . . . . . . . . . . . . . . . . 46Growth From Grade 8 to Grade 12. . . . . . . . . . . . . . . . . . . . . . . . . . . . . . . . . . . . . . . . . . . . . . . . . . . . . . . . 49EXPLORE and PLAN College Readiness Benchmarks . . . . . . . . . . . . . . . . . . . . . . . . . . . . . . . . . . . . . . . . 50
Chapter 5 The EXPLORE Interest Inventory and Other Program Components . . . . . . . . . . . . . . . . . . . . . . . . . . . . . . . . 52Interest Inventory . . . . . . . . . . . . . . . . . . . . . . . . . . . . . . . . . . . . . . . . . . . . . . . . . . . . . . . . . . . . . . . . . . . . . . . . . . . . . . . 52
Overview . . . . . . . . . . . . . . . . . . . . . . . . . . . . . . . . . . . . . . . . . . . . . . . . . . . . . . . . . . . . . . . . . . . . . . . . . . . . . . . . . 52Score Reporting Procedure . . . . . . . . . . . . . . . . . . . . . . . . . . . . . . . . . . . . . . . . . . . . . . . . . . . . . . . . . . . . . . . . . . 52World-of-Work Map. . . . . . . . . . . . . . . . . . . . . . . . . . . . . . . . . . . . . . . . . . . . . . . . . . . . . . . . . . . . . . . . . . . . . . . . . 52Norms . . . . . . . . . . . . . . . . . . . . . . . . . . . . . . . . . . . . . . . . . . . . . . . . . . . . . . . . . . . . . . . . . . . . . . . . . . . . . . . . . . . 53
Sampling . . . . . . . . . . . . . . . . . . . . . . . . . . . . . . . . . . . . . . . . . . . . . . . . . . . . . . . . . . . . . . . . . . . . . . . . . . . . 53Weighting. . . . . . . . . . . . . . . . . . . . . . . . . . . . . . . . . . . . . . . . . . . . . . . . . . . . . . . . . . . . . . . . . . . . . . . . . . . . 53
Precision . . . . . . . . . . . . . . . . . . . . . . . . . . . . . . . . . . . . . . . . . . . . . . . . . . . . . . . . . . . . . . . . . . . . . . . . . . . . . . . . . 53Representativeness . . . . . . . . . . . . . . . . . . . . . . . . . . . . . . . . . . . . . . . . . . . . . . . . . . . . . . . . . . . . . . . . . . . . . . . . 56Psychometric Support for UNIACT. . . . . . . . . . . . . . . . . . . . . . . . . . . . . . . . . . . . . . . . . . . . . . . . . . . . . . . . . . . . . 56
Chapter 6 Reporting EXPLORE Results . . . . . . . . . . . . . . . . . . . . . . . . . . . . . . . . . . . . . . . . . . . . . . . . . . . . . . . . . . . . . . . . 57Standard Reporting Services . . . . . . . . . . . . . . . . . . . . . . . . . . . . . . . . . . . . . . . . . . . . . . . . . . . . . . . . . . . . . . . . . . . . . . 57Supplemental Reporting Services . . . . . . . . . . . . . . . . . . . . . . . . . . . . . . . . . . . . . . . . . . . . . . . . . . . . . . . . . . . . . . . . . . 57
References . . . . . . . . . . . . . . . . . . . . . . . . . . . . . . . . . . . . . . . . . . . . . . . . . . . . . . . . . . . . . . . . . . . . . . . . . . . . . . . . . . . . . . . . 58
iv

3.1 Score Ranges for EXPLORE, PLAN, and the ACT . . . . . . . . . . . . . . . . . . . . . . . . . . . . . . . . . . . . . . . . . . . . . . . . . . . . . 12
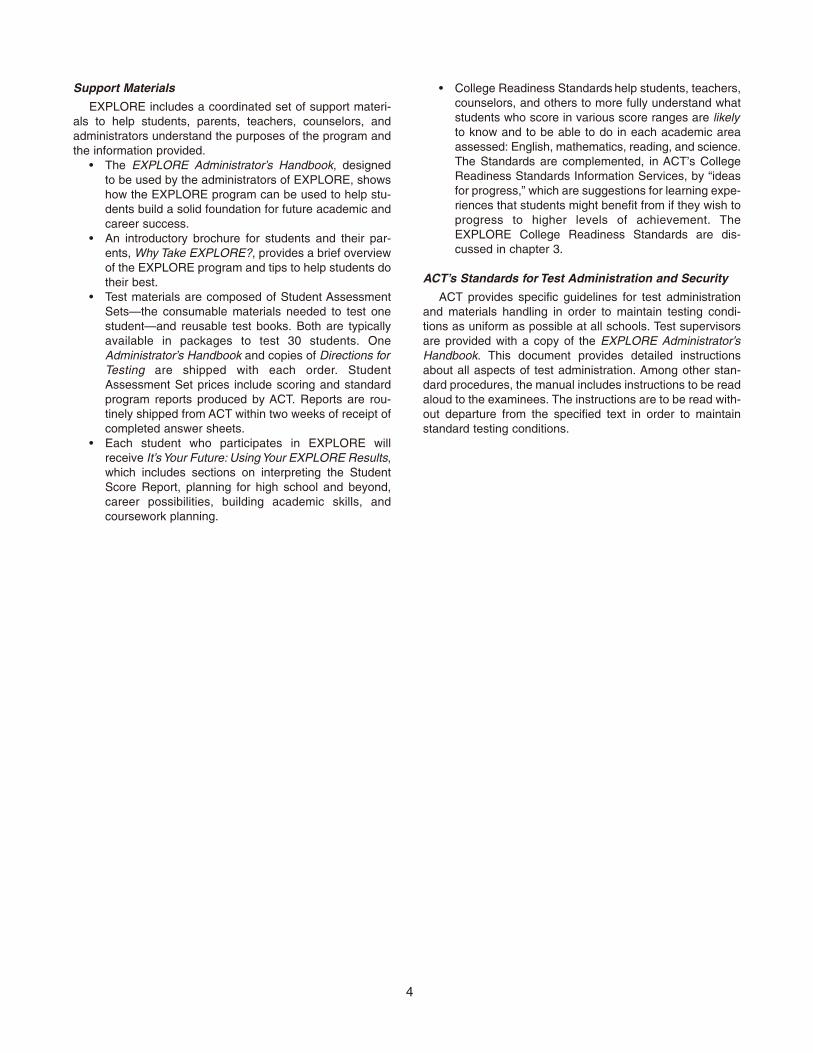
4.1 Conditional Standard Errors of Measurement for EXPLORE Test Scores. . . . . . . . . . . . . . . . . . . . . . . . . . . . . . . . . . . . 38
4.2 Conditional Standard Errors of Measurement for EXPLORE Subscores . . . . . . . . . . . . . . . . . . . . . . . . . . . . . . . . . . . . 39
4.3 Average Increase In PLAN Mathematics Scores From Taking Rigorous Mathematics Courses, Regardless of Prior Achievement . . . . . . . . . . . . . . . . . . . . . . . . . . . . . . . . . . . . . . . . . . . . . . . . . . . . . . . . . . . . . . . . 47
4.4 Average Increase In PLAN Science Scores From Taking Rigorous Science Courses, Regardless of Prior Achievement . . . . . . . . . . . . . . . . . . . . . . . . . . . . . . . . . . . . . . . . . . . . . . . . . . . . . . . . . . . . . . . . 47
4.5 EPAS Growth Trajectories Calculated at Grades 8 Through 12 for Expected Within-School Average E(Yij), High School A, and High School B . . . . . . . . . . . . . . . . . . . . . . . . . . . . . . . . . . . . . . . . . . . . . . . . . . . . . . . . . . . . . . . 49
4.6 Conditional Probability of Meeting/Exceeding an ACT English Score = 18, Given Students’ EXPLORE or PLAN English Score . . . . . . . . . . . . . . . . . . . . . . . . . . . . . . . . . . . . . . . . . . . . . . . . . . . . . . . . . . . . . . . . . . . . . . . . 50
4.7 2005–2006 National EXPLORE-Tested Students Likely to Be Ready for College-Level Work (in percent) . . . . . . . . . . 51
5.1 World-of-Work Map. . . . . . . . . . . . . . . . . . . . . . . . . . . . . . . . . . . . . . . . . . . . . . . . . . . . . . . . . . . . . . . . . . . . . . . . . . . . . . 54
5.2 UNIACT Technical Manual Table of Contents . . . . . . . . . . . . . . . . . . . . . . . . . . . . . . . . . . . . . . . . . . . . . . . . . . . . . . . . . 55
v
Figures

vi
1.1 Components of EPAS . . . . . . . . . . . . . . . . . . . . . . . . . . . . . . . . . . . . . . . . . . . . . . . . . . . . . . . . . . . . . . . . . . . . . . . . . . . . 2
2.1 Content Specifications for the EXPLORE English Test . . . . . . . . . . . . . . . . . . . . . . . . . . . . . . . . . . . . . . . . . . . . . . . . . . 7
2.2 Content Specifications for the EXPLORE Mathematics Test . . . . . . . . . . . . . . . . . . . . . . . . . . . . . . . . . . . . . . . . . . . . . . 8
2.3 Content Specifications for the EXPLORE Reading Test. . . . . . . . . . . . . . . . . . . . . . . . . . . . . . . . . . . . . . . . . . . . . . . . . . 8
2.4 Content Specifications for the EXPLORE Science Test . . . . . . . . . . . . . . . . . . . . . . . . . . . . . . . . . . . . . . . . . . . . . . . . . . 9
2.5 Difficulty Distributions and Mean Discrimination Indices From the 1999, 2003, and 2005 EXPLORE Operational Administrations . . . . . . . . . . . . . . . . . . . . . . . . . . . . . . . . . . . . . . . . 10
3.1 Illustrative Listing of Mathematics Items by Score Range . . . . . . . . . . . . . . . . . . . . . . . . . . . . . . . . . . . . . . . . . . . . . . . 13
3.2 Number of Items Reviewed During 1997 National Review . . . . . . . . . . . . . . . . . . . . . . . . . . . . . . . . . . . . . . . . . . . . . . 14
3.3 Percentage of Agreement of 1997 National Expert Review . . . . . . . . . . . . . . . . . . . . . . . . . . . . . . . . . . . . . . . . . . . . . . 15
3.4 Percentage of Agreement of 2000 National Expert Review . . . . . . . . . . . . . . . . . . . . . . . . . . . . . . . . . . . . . . . . . . . . . . 16
3.5 ACT’s College Readiness Benchmarks . . . . . . . . . . . . . . . . . . . . . . . . . . . . . . . . . . . . . . . . . . . . . . . . . . . . . . . . . . . . . 17
4.1 Sample Sizes . . . . . . . . . . . . . . . . . . . . . . . . . . . . . . . . . . . . . . . . . . . . . . . . . . . . . . . . . . . . . . . . . . . . . . . . . . . . . . . . . 20
4.2 Response Rates by Grade . . . . . . . . . . . . . . . . . . . . . . . . . . . . . . . . . . . . . . . . . . . . . . . . . . . . . . . . . . . . . . . . . . . . . . . 21
4.3 Summary of Response Rates Within Schools . . . . . . . . . . . . . . . . . . . . . . . . . . . . . . . . . . . . . . . . . . . . . . . . . . . . . . . . 21
4.4 Precision of the Samples . . . . . . . . . . . . . . . . . . . . . . . . . . . . . . . . . . . . . . . . . . . . . . . . . . . . . . . . . . . . . . . . . . . . . . . . 22
4.5 Original to New Scale Concordance. . . . . . . . . . . . . . . . . . . . . . . . . . . . . . . . . . . . . . . . . . . . . . . . . . . . . . . . . . . . . . . . 23
4.6 Response Rates by School . . . . . . . . . . . . . . . . . . . . . . . . . . . . . . . . . . . . . . . . . . . . . . . . . . . . . . . . . . . . . . . . . . . . . . 24
4.7 Response Rates Within Schools . . . . . . . . . . . . . . . . . . . . . . . . . . . . . . . . . . . . . . . . . . . . . . . . . . . . . . . . . . . . . . . . . . 24
4.8 Demographic Characteristics for Norming Sample and Population, Grade 8 . . . . . . . . . . . . . . . . . . . . . . . . . . . . . . . . 26
4.9 Demographic Characteristics for Norming Sample and Population, Grade 9 . . . . . . . . . . . . . . . . . . . . . . . . . . . . . . . . 27
4.10 Estimated Standard Errors for Proportions. . . . . . . . . . . . . . . . . . . . . . . . . . . . . . . . . . . . . . . . . . . . . . . . . . . . . . . . . . . 27
4.11 Scale Score Statistics for EXPLORE Tests and Subscores . . . . . . . . . . . . . . . . . . . . . . . . . . . . . . . . . . . . . . . . . . . . . . 28
4.12 EXPLORE National Norms for Fall Grade 8. . . . . . . . . . . . . . . . . . . . . . . . . . . . . . . . . . . . . . . . . . . . . . . . . . . . . . . . . . 30
4.13 EXPLORE National Norms for Spring Grade 8 . . . . . . . . . . . . . . . . . . . . . . . . . . . . . . . . . . . . . . . . . . . . . . . . . . . . . . . 31
4.14 EXPLORE National Norms for Fall Grade 9. . . . . . . . . . . . . . . . . . . . . . . . . . . . . . . . . . . . . . . . . . . . . . . . . . . . . . . . . . 32
4.15 Observed Counts and Probabilities of Coverage (EXPLORE Fall Grade 8 and PLAN Fall Grade 10) . . . . . . . . . . . . . 33
4.16 Observed Counts and Probabilities of Coverage (EXPLORE Fall Grade 9 and PLAN Fall Grade 10) . . . . . . . . . . . . . 34
4.17 Estimated PLAN Grade 10 Composite Score Intervals for EXPLORE Grade 8 Composite Scores . . . . . . . . . . . . . . . 35
4.18 Estimated PLAN Grade 10 Composite Score Intervals for EXPLORE Grade 9 Composite Scores . . . . . . . . . . . . . . . 35
4.19 Estimated Reliabilities and Standard Errors of Measurement for EXPLORE Tests and Subscores . . . . . . . . . . . . . . . 40
4.20 Scale Score Covariances and Effective Weights for Form A Grade 8 . . . . . . . . . . . . . . . . . . . . . . . . . . . . . . . . . . . . . . 41
4.21 Scale Score Covariances and Effective Weights for Form A Grade 9 . . . . . . . . . . . . . . . . . . . . . . . . . . . . . . . . . . . . . . 41
4.22 Scale Score Covariances and Effective Weights for Form B Grade 8 . . . . . . . . . . . . . . . . . . . . . . . . . . . . . . . . . . . . . . 42
4.23 Scale Score Covariances and Effective Weights for Form B Grade 9 . . . . . . . . . . . . . . . . . . . . . . . . . . . . . . . . . . . . . . 42
4.24 Correlations Between EXPLORE Test Scores and Subscores . . . . . . . . . . . . . . . . . . . . . . . . . . . . . . . . . . . . . . . . . . . 44
4.25 Correlations Observed and (Disattenuated), Between EXPLORE, PLAN, and ACT Test Scale Scores . . . . . . . . . . . . 45
4.26 Correlation Between EXPLORE Score and Course Grades . . . . . . . . . . . . . . . . . . . . . . . . . . . . . . . . . . . . . . . . . . . . . 46
4.27 Means and Correlations for EXPLORE and High School Grade Point Average . . . . . . . . . . . . . . . . . . . . . . . . . . . . . . 48
4.28 Composite Score Means for the Three Test Batteries, by Grade and Core Coursework at Time of ACT Testing. . . . . 48
5.1 Selected Demographic and Educational Characteristics of Grade 8 UNIACT Norm Group Students . . . . . . . . . . . . . 56
Tables

vii
This manual contains information, primarily of a technicalnature, about the EXPLORE® program. The principal focusof this manual is to document the EXPLORE program’s tech-nical adequacy in light of its intended purposes.
The content of this manual responds to requirements of the testing industry as established in the Code ofProfessional Responsibilities in Educational Measurement(NCME Ad Hoc Committee on the Development of a Code of Ethics, 1995), the Standards for Educational andPsychological Testing (AERA, APA, & NCME, 1999), and theCode of Fair Testing Practices in Education (Joint Committeeon Testing Practices, 2004).
ACT regularly conducts research studies as part of theongoing formative evaluation of its programs. These studiesare aimed at ensuring that the programs remain technicallysound. Information gleaned from these studies is also usedto identify aspects of the programs that might be improved orenhanced. The information reported in this manual wasderived from studies that have been conducted for the
EXPLORE program since its inception. ACT will continue toconduct research on the EXPLORE program and will reportfuture findings in updated versions of this manual. Thosewho wish to receive more detailed information on a topic dis-cussed in this manual, or on a related topic, are encouragedto contact ACT.
Qualified researchers wishing to access data in order toconduct research designed to advance knowledge about theEXPLORE program are also encouraged to contact ACT. Aspart of its involvement in the testing process, ACT is com-mitted to continuing and supporting such research, docu-menting and disseminating its outcomes, and encouragingothers to engage in research that sheds light on theEXPLORE program and its uses. Please direct comments orinquiries to Elementary and Secondary School Programs,ACT Development Area, P.O. Box 168, Iowa City, Iowa52243-0168.
Iowa City, IowaApril 2007
Preface


1
Chapter 1The EXPLORE® Program
Overview and Purpose of the EXPLORE Program
Students in the eighth and ninth grades are at an excitingpoint in their lives—with a world of possibilities open toexplore. The comprehensive EXPLORE® program from ACThelps students make the most of their opportunities andhelps guide them in future educational and career planning.
Like all of ACT’s assessment programs, EXPLORE isbased on the belief that young people—and their parents,teachers, counselors, and school administrators—will makemore productive plans and decisions if they have organized,relevant information available when they need it most.
EXPLORE is an every-student program that assessesacademic progress at the eighth- and ninth-grade levels,helps students understand and begin to explore the widerange of career options open to them, and assists them indeveloping a high school coursework plan that preparesthem to achieve their post–high school goals.
EXPLORE includes four 30-minute multiple-choicetests—English, Mathematics, Reading, and Science.EXPLORE also collects information about student interests,needs, plans, and selected background characteristics thatcan be useful in guidance and planning activities.
ACT makes available to EXPLORE test takers andprospective EXPLORE test takers various materials about testpreparation and the interpretation of test results. An overviewof the test and a selection of sample test questions are avail-able to students online at www.actstudent.org/explore. TheStudent Score Report each examinee receives after testingcontains four sections: (a) Your Scores, (b) Your Plans, (c) YourCareer Possibilities, and (d) Your Skills. The report is accom-panied by a booklet, It’s Your Future: Using Your EXPLOREResults, which provides interpretive information about the testresults and provides suggestions for making educational plans,for building academic skills, and for exploring occupations.
EXPLORE functions as a stand-alone program or as thepoint of entry into the secondary-school level of ACT’s Edu-cational Planning and Assessment System (EPAS™)—anintegrated series of assessment programs that includesEXPLORE, PLAN®, the ACT®, and WorkKeys®. When usedtogether, the assessments in the EPAS system give educa-tors at the middle-school and secondary-school levels apowerful, interrelated sequence of instruments to measurestudent development from eighth through twelfth grade.
The EXPLORE, PLAN, and ACT programs are scoredalong a common scale extending from 1 to 36; the maximumscore on EXPLORE is 25, the maximum PLAN score is 32,and the maximum ACT score is 36. Because they arereported on the same score scale, EPAS assessment resultsinform students, parents, teachers, and counselors aboutindividual student strengths and weaknesses while there isstill time to address them.
The EXPLORE, PLAN, and ACT assessments provideinformation about how well a student performs compared toother students. They also provide standards-based interpre-tations through the EPAS College Readiness Standards™—statements that describe students’ performance in terms ofthe knowledge and skills they have acquired. Because theCollege Readiness Standards focus on the integrated,higher-order thinking skills that students develop in GradesK–12 and that are important for success both during andafter high school, the Standards provide a common lan-guage for secondary and postsecondary educators.
Using the College Readiness Standards, secondary edu-cators can pinpoint the skills students have and those theyare ready to learn next. The Standards clarify college expec-tations in terms that high school teachers understand. TheStandards also offer teachers guidance for improvinginstruction to help correct student deficiencies in specificareas. EPAS results can be used to identify students whoare on track to being ready for college. ACT’s CollegeReadiness Benchmark Scores—for English Composition,Algebra, Social Sciences, and Biology—were developed tohelp identify EPAS examinees who would likely be ready fordoing college-level work in these courses or course areas.Chapter 3 gives details about the College ReadinessStandards and Benchmarks.
EPAS is designed to help students plan for further edu-cation and explore careers, based on their own skills, inter-ests, and aspirations. EPAS results give schools a way toget students engaged in planning their own futures. Whenthey know what colleges expect, in terms they can under-stand, students can take ownership and control of their infor-mation, and they can use it to help make a smooth transitionto postsecondary education or training. Table 1.1 summa-rizes the EPAS components.

Code of Fair Testing Practices in Education and Code of Professional Responsibilities in
Educational Measurement
Since publication of the original edition in 1988, ACT hasendorsed the Code of Fair Testing Practices in Education(Joint Committee on Testing Practices, 2004), a statement ofthe obligations to test takers of those who develop, adminis-ter, or use educational tests and test data. The developmentof the Code was sponsored by a joint committee of theAmerican Association for Counseling and Development,Association for Measurement and Evaluation in Counselingand Development, American Educational ResearchAssociation, American Psychological Association, AmericanSpeech-Language-Hearing Association, and NationalCouncil on Measurement in Education to advance, in thepublic interest, the quality of testing practices.
The Code sets forth fairness criteria in four areas: devel-oping and selecting appropriate tests, administering andscoring tests, reporting and interpreting test results, andinforming test takers. Separate standards are provided fortest developers and for test users in each of these four areas.
ACT’s endorsement of the Code represents a commit-ment to vigorously safeguard the rights of individuals partic-ipating in its testing programs. ACT employs an ongoingreview process whereby each of its testing programs is
routinely reviewed to ensure that it upholds the standardsset forth in the Code for appropriate test development prac-tice and test use.
Similarly, ACT endorses and is committed to complyingwith the Code of Professional Responsibilities inEducational Measurement (NCME Ad Hoc Committee on theDevelopment of a Code of Ethics, 1995), a statement of pro-fessional responsibilities for those who develop assess-ments; market and sell assessments; select assessments;administer assessments; interpret, use, and communicateassessment results; educate about assessment; and evalu-ate programs and conduct research on assessments.
A copy of each Code may be obtained free of charge fromACT Customer Services (68), P.O. Box 1008, Iowa City,Iowa 52243-1008, 319/337-1429.
Philosophical Basis for the Testsof Educational Development
The EXPLORE multiple-choice tests of educationaldevelopment share a common philosophical basis with thePLAN and ACT tests. The three EPAS testing programsmeasure student development in the same curriculum areasof English, mathematics, reading, and science. In simplestterms, the principal difference between the three testing
2
Component Grades 8/9 Grade 10 Grades 11/12
Career and education planning
EXPLORE:Interest InventoryNeeds Assessment
PLAN:Interest InventoryCourse Taking
Needs Assessment
ACT:Interest InventoryCourse Taking and GradesStudent Profile
Objective assessments EXPLORE:EnglishMathematicsReadingScience
PLAN:EnglishMathematicsReadingScience
ACT:EnglishMathematicsReadingScienceWriting (optional)
Instructional support College Readiness StandardsCollege Readiness Standards
Information Services
College Readiness StandardsCollege Readiness Standards
Information Services
College Readiness StandardsCollege Readiness Standards
Information Services
Evaluation Summary ReportsEXPLORE/PLAN Linkage
Reports
Summary ReportsEXPLORE/PLAN Linkage
ReportsPLAN/ACT Linkage
Reports
Summary ReportsPLAN/ACT Linkage
Reports
Table 1.1Components of EPAS

programs is that they focus on knowledge and skills typicallyattained at different times in students’ secondary-schoolexperience. The ACT, for college-bound eleventh and twelfthgraders, focuses on knowledge and skills attained as thecumulative effect of school experience. PLAN, intended forall tenth graders, focuses on knowledge and skills typicallyattained early in students’ secondary school experience (byGrade 10), and EXPLORE, intended for all students ineighth and ninth grades, focuses on knowledge and skillsusually attained by Grade 8.
Because the content of the EXPLORE tests of educationaldevelopment is linked to the ACT framework, understandingthe philosophical basis of the EXPLORE tests requires anappreciation of the philosophical basis of the ACT.
The ACT tests of educational development are designedto measure how prepared students are to achieve the gen-eral academic goals of college. The principal philosophicalbasis for the ACT is that college preparedness is bestassessed by measuring, as directly as possible, the academic skills that students will need in order to perform college-level work. Complexity is certainly a characteristic ofsuch skills. Thus, the ACT tests are designed to determinehow skillful students are in solving problems, graspingimplied meanings, drawing inferences, evaluating ideas, andmaking judgments. In addition, the ACT tests of educationaldevelopment are oriented toward the general content areasof college and high school instructional programs. The testquestions require students to integrate the knowledge andskills they possess in major curriculum areas with the stimu-lus material provided by the test. Briefly, then, thephilosophical basis for the ACT tests rests on two pillars: (a) the tests should measure academic skills necessary foreducation and work after high school and (b) the content ofthe tests should be related to major curriculum areas.
Tests of general educational development are used in theACT, PLAN, and EXPLORE because, when compared toother types of tests, it was judged that they better satisfy thediverse requirements of tests intended to facilitate the tran-sition to high school, college, or work. By contrast, measuresof examinee knowledge of specific course content (asopposed to curriculum areas) often do not provide a com-mon baseline for comparisons of students, because coursesvary so much across schools, and even within schools. Inaddition, course-specific tests may not measure students’skills in problem solving and in the integration of knowledgefrom a variety of courses.
Tests of educational development can also be contrastedwith tests of academic aptitude. The stimuli and test ques-tions for aptitude tests are often purposefully chosen to bedissimilar to instructional materials, and each test within abattery of aptitude tests is usually designed to be homo-geneous in psychological structure. Consequently, oftenaptitude tests are not designed to reflect the complexity ofcourse work or the interactions among the skills measured.
Also, because tests of educational development measuremany of the same skills that are taught in school, the best
preparation for such tests should be course work. Thus,tests of educational development should send students aclear message that high test scores are not simply a matterof innate ability—they reflect a level of achievement that hasbeen earned as a result of hard work and dedication inschool.
Finally, the ACT, PLAN, and EXPLORE tests are intendedto reflect educational goals that are widely accepted andjudged by educators to be important for success in collegeand work. As such, the content of the tests is designed witheducational considerations, rather than statistical and empir-ical techniques, given paramount importance. For example,content representativeness of the tests is more importantthan choosing the most highly discriminating items.
Administering the EXPLORE Program
Administration Schedule
The EXPLORE tests (English, Mathematics, Reading,and Science) should be administered in a single session andwill require approximately two hours thirty minutes to threehours total administration time, including the non-test por-tions. The EXPLORE program is available year-round foradministration by schools at a time of their choosing.Because national normative information (percentage ofexaminees who scored at or below the earned scale scoreof the examinee) on EXPLORE reports is based on studentswho took the EXPLORE tests in a single session, interpreta-tion of results from administration of the tests in two or moresessions should be done with caution. If local normativeinformation is important to the test user, it is important thatall students in the local population be tested under similaradministration schedules.
Eighth-grade students who test in August throughJanuary will receive Fall Eighth-Grade Norms. Eighthgraders who test in February through July will receive SpringEighth-Grade Norms. Ninth-grade students will receive FallNinth-Grade Norms regardless of their test date. (If yourschool chooses to test ninth-grade students in the spring,keep in mind that these students will have had several moremonths of instruction than the norm group. Therefore,spring-tested ninth graders may show higher levels ofachievement when compared to the fall-tested norm groupthan if they had tested in the fall.) Students who are belowthe eighth grade when they take EXPLORE will receive FallEighth-Grade Norms on their student reports.
Students with physical or learning disabilities who cannotcomplete the EXPLORE multiple-choice tests in the stan-dard time limits, using standard test materials, may be testedunder special conditions and/or using special testing materi-als available from ACT. It should be noted, however, that nor-mative information is based on students who took theEXPLORE tests in a single session under the standard timelimits using standard test materials. Therefore, the normativeinformation reported for students testing under special con-ditions should be interpreted with caution.
3
Support Materials
EXPLORE includes a coordinated set of support materi-als to help students, parents, teachers, counselors, and administrators understand the purposes of the program andthe information provided.
• The EXPLORE Administrator’s Handbook, designedto be used by the administrators of EXPLORE, showshow the EXPLORE program can be used to help stu-dents build a solid foundation for future academic andcareer success.
• An introductory brochure for students and their par-ents, Why Take EXPLORE?, provides a brief overviewof the EXPLORE program and tips to help students dotheir best.
• Test materials are composed of Student AssessmentSets—the consumable materials needed to test onestudent—and reusable test books. Both are typicallyavailable in packages to test 30 students. OneAdministrator’s Handbook and copies of Directions forTesting are shipped with each order. StudentAssessment Set prices include scoring and standardprogram reports produced by ACT. Reports are rou-tinely shipped from ACT within two weeks of receipt ofcompleted answer sheets.
• Each student who participates in EXPLORE willreceive It’s Your Future: Using Your EXPLORE Results,which includes sections on interpreting the StudentScore Report, planning for high school and beyond,career possibilities, building academic skills, andcoursework planning.
• College Readiness Standards help students, teachers,counselors, and others to more fully understand whatstudents who score in various score ranges are likelyto know and to be able to do in each academic areaassessed: English, mathematics, reading, and science.The Standards are complemented, in ACT’s CollegeReadiness Standards Information Services, by “ideasfor progress,” which are suggestions for learning expe-riences that students might benefit from if they wish toprogress to higher levels of achievement. TheEXPLORE College Readiness Standards are dis-cussed in chapter 3.
ACT’s Standards for Test Administration and Security
ACT provides specific guidelines for test administrationand materials handling in order to maintain testing condi-tions as uniform as possible at all schools. Test supervisorsare provided with a copy of the EXPLORE Administrator’sHandbook. This document provides detailed instructionsabout all aspects of test administration. Among other stan-dard procedures, the manual includes instructions to be readaloud to the examinees. The instructions are to be read with-out departure from the specified text in order to maintainstandard testing conditions.
4

5
Description of the EXPLORE Tests
EXPLORE contains four multiple-choice tests—English,Mathematics, Reading, and Science. These tests aredesigned to measure students’ curriculum-related knowl-edge and the complex cognitive skills important for futureeducation and careers. EXPLORE results provide eighth-and ninth-grade students with the information they need tobegin making plans for high school and beyond.
The fundamental idea underlying the development anduse of these tests is that the best way to determine how well-prepared students are for further education and for work isto measure as directly as possible the knowledge and skillsneeded in those settings. ACT conducted a detailed analysisof three sources of information to determine which knowl-edge and skills should be measured by EXPLORE. First, theobjectives for instruction in Grades 6 through 9 for all statesthat had published them were studied. Second, the text-books on state-approved lists for courses in Grades 6through 8 were reviewed. Third, educators in Grades 7through 12 and at the postsecondary level were consulted todetermine the knowledge and skills taught in Grades 6through 8 that are prerequisite to successful performance inhigh school. Information from these sources helped to definea scope and sequence for each of the areas measured byEXPLORE.
Curriculum study is ongoing at ACT. Curricula in eachcontent area (English, mathematics, reading, and science) inthe EXPLORE tests are reviewed on a periodic basis. ACT’sanalyses include reviews of tests, curriculum guides, andnational standards; surveys of current instructional practice;and meetings with content experts (see ACT, ACT NationalCurriculum Survey ® 2005–2006, 2007).
The EXPLORE tests are designed to be developmentallyand conceptually linked to those of PLAN and the ACT. Toreflect that continuity, names of the multiple-choice tests arethe same across the three programs and the EXPLORE testscores are on the same score scales as those of PLAN andthe ACT. The programs are similar in their focus on criticalthinking skills and in their common curriculum base.Specifications for the EXPLORE program are consistentwith, and should be seen as a logical extension of, the con-tent and skills measured in the PLAN and ACT programs.
The English Test
The EXPLORE English Test (40 items, 30 minutes) mea-sures the student’s understanding of the conventions ofstandard written English (punctuation, grammar and usage,
and sentence structure) and of rhetorical skills (strategy,organization, and style). The test stresses the analysis of thekinds of prose that students are required to read and write inmost middle- and secondary-school programs, rather thanthe rote recall of rules of grammar. The test consists of fourprose passages, each accompanied by a number of multi-ple-choice test items. Different passage types are employedto provide a variety of rhetorical situations.
Some items refer to underlined portions of the passageand offer several alternatives to the portion underlined. Thestudent must decide which choice is most appropriate in thecontext of the passage. Some items ask about an underlinedportion, a section of the passage, or the passage as a whole.The student must decide which choice best answers thequestion posed. Many items offer “NO CHANGE” to the pas-sage as one of the choices. The questions are numberedconsecutively. Each item number refers to a correspondinglynumbered portion underlined in the passage or to a corre-sponding numeral in a box located at the appropriate point inthe passage.
Two subscores are reported for this test, aUsage/Mechanics subscore based on 25 items and aRhetorical Skills subscore based on 15 items.
The Mathematics Test
The EXPLORE Mathematics Test (30 items, 30 minutes)measures the student’s mathematical reasoning. The testemphasizes quantitative reasoning rather than memori-zation of formulas or computational skills. In particular, itemphasizes the ability to solve practical quantitative prob-lems that are encountered in middle-school and junior-highcourses. The items included in the Mathematics Test coverfour cognitive levels: knowledge and skills, direct application,understanding concepts, and integrating conceptual under-standing.
Students should have calculators available when takingthis test and are encouraged to use the calculator they aremost comfortable with. The test includes problems for whicha calculator is clearly the best tool to use, and others wherea non-calculator solution is appropriate. Some questions onthe test may be solved with or without a calculator, neitherstrategy being clearly superior to the other. Students mustchoose when to use and when not to use calculators.
The items in the Mathematics Test are classified accord-ing to four content categories: Pre-Algebra, ElementaryAlgebra, Geometry, and Statistics/Probability.
Chapter 2The EXPLORE Tests of Educational Development

The Reading Test
The EXPLORE Reading Test (30 items, 30 minutes)measures the student’s level of reading comprehension as aproduct of skill in referring and reasoning. That is, the testitems require students to derive meaning from several textsby: (a) referring to what is explicitly stated and (b) reasoningto determine implicit meanings. Specifically, items will askthe student to use referring and reasoning skills to determinemain ideas; locate and interpret significant details; under-stand sequences of events; make comparisons; compre-hend cause-effect relationships; determine the meaning ofcontext-dependent words, phrases, and statements; drawgeneralizations; and analyze the author’s or narrator’s voiceor method. The test comprises three prose passages thatare representative of the level and kinds of text commonlyencountered in middle-school and junior-high curricula; pas-sages on topics in the social sciences, prose fiction, and thehumanities are included. Each passage is preceded by aheading that identifies what type of passage it is (e.g.,“Prose Fiction”), names the author, and may include a briefnote that helps in understanding the passage. Each passageis accompanied by a set of multiple-choice test items. Theseitems do not test the rote recall of facts from outside the pas-sage, isolated vocabulary questions, or rules of formal logic.Rather, the test focuses upon the complex of complemen-tary and mutually supportive skills that readers must bring tobear in studying written materials across a range of subjectareas.
The Science Test
The EXPLORE Science Test (28 items, 30 minutes)measures scientific reasoning skills acquired up to Grade 8.The test presents six sets of scientific information, each fol-lowed by a number of multiple-choice test items. The scien-tific information is conveyed in one of three different formats:data representation (graphs, tables, and other schematicforms), research summaries (descriptions of several relatedexperiments), or conflicting viewpoints (expressions of sev-eral related hypotheses or views that are inconsistent withone another). The items require students to recognize andunderstand the basic features of, and concepts related to,the information provided; to examine critically the relation-ships between the information provided and the conclusionsdrawn or hypotheses developed; and to generalize fromgiven information to gain new information, draw conclusions,or make predictions.
The Science Test is based on the type of content that istypically covered in science courses through Grade 8.Materials are drawn from the life sciences, Earth/space sci-ences, and physical sciences. The test emphasizes scientificreasoning skills over recall of scientific content, skill in math-ematics, or skill in reading.
Test Development Procedures
This section describes the procedures that are used inthe development of the four tests described above. The testdevelopment cycle required to produce each new form of theEXPLORE tests takes as long as two and one-half years andinvolves several stages.
Test Specifications
Two types of test specifications are used in the develop-ment of the EXPLORE tests: content specifications and sta-tistical specifications.
Content Specifications. Content specifications for theEXPLORE tests were developed through the curricularanalysis discussed in chapter 1. While care is taken toensure that the basic structure of the EXPLORE testsremains the same from year to year so that the scale scoresare comparable, the specific characteristics of the test itemsused in each specification category are reviewed regularly.Consultant panels are convened to review the new forms ofthe test in order to verify their content accuracy and thematch of the content of the tests to the content specifica-tions. At this time, the characteristics of the items that fulfillthe content specifications are also reviewed. While the gen-eral content of the test remains constant, the specific kindsof items in a specification category may change slightly. Thebasic structure of the content specifications for each of theEXPLORE multiple-choice tests is provided in Tables 2.1through 2.4.
Statistical Specifications. Statistical specifications forthe tests indicate the level of difficulty (proportion correct)and minimum acceptable level of discrimination (biserialcorrelation) of the test items to be used.
The distribution of item difficulties was selected so thatthe tests will effectively differentiate among students whovary widely in their level of achievement. The tests are con-structed to have a mean item difficulty in the mid-60s for theEXPLORE national population and a range of difficultiesfrom about .20 to .95.
With respect to discrimination indices, the following stan-dards are used when selecting EXPLORE items: (1) itemsshould have a biserial correlation of 0.20 or higher withscores on a test measuring comparable content and (2)mathematics items in the difficulty range of .30–.95 shouldhave a biserial correlation of 0.30 or higher with scores on atest measuring comparable content.
Selection of Item Writers
ACT contracts with item writers to construct the items forEXPLORE. The item writers are content specialists in thedisciplines measured by the EXPLORE tests. Most areactively engaged in teaching. They teach at a number of dif-ferent levels, from middle school to university, and at a vari-ety of institutions, from small private schools to large publicinstitutions. They represent the diversity of the population ofthe United States with respect to ethnic background, gender,
6

7
and geographic location. ACT makes every effort to ensurethat the item writers for EXPLORE represent a cross sectionof educators in the United States.
Before being asked to write items for the EXPLORE tests,potential item writers are required to submit a sample set ofmaterials for review. An item writer’s guide that is specific tothe content area is provided to each item writer. The guidesinclude examples of items and provide item writers with thetest specifications and ACT’s requirements for content andstyle. Included are specifications for fair portrayal of groupsof individuals, avoidance of subject matter that may be unfa-miliar to members of a group of society, and nonsexist useof language.
Each sample set submitted by a potential item writer isevaluated by ACT Test Development staff. A decision con-cerning whether to contract with the item writer is made onthe basis of that evaluation.
Each item writer under contract is given an assignment toproduce a small number of multiple-choice items. The size ofthe assignment ensures that a diversity of material will beproduced and that the security of the testing program will bemaintained, since any item writer will know only a small pro-portion of the items produced. Item writers work closely withACT test specialists, who assist them in producing items ofhigh quality that meet the test specifications.
Table 2.1Content Specifications for the EXPLORE English Test
Six elements of effective writing are included in the English Test. These elements and the approximate proportion of thetest devoted to each are given below.
Content/Skills Proportion of test Number of items
Usage/Mechanics .64 25
Punctuation .15 6
Grammar and Usage .20 8
Sentence Structure .29 11
Rhetorical Skills .36 15
Strategy .12 5
Organization .12 5
Style .12 5
Total 1.00 40
a. Punctuation. The items in this category test the stu-dent’s knowledge of the conventions of internal andend-of-sentence punctuation, with emphasis on therelationship of punctuation to meaning (e.g., avoidingambiguity, identifying appositives).
b. Grammar and Usage. The items in this category testthe student’s understanding of agreement betweensubject and verb, between pronoun and antecedent,and between modifiers and the words modified; verbformation; pronoun case; formation of comparative andsuperlative adjectives and adverbs; and idiomaticusage.
c. Sentence Structure. The items in this category test thestudent’s understanding of relationships between andamong clauses, placement of modifiers, and shifts inconstruction.
d. Strategy. The items in this category test the student’sability to develop a given topic by choosing expres-sions appropriate to an essay’s audience and purpose;to judge the effect of adding, revising, or deleting sup-porting material; and to judge the relevancy of state-ments in context.
e. Organization. The items in this category test the stu-dent’s ability to organize ideas and to choose effectiveopening, transitional, and closing sentences.
f. Style. The items in this category test the student’s abil-ity to select precise and appropriate words andimages, to maintain the level of style and tone in anessay, to manage sentence elements for rhetoricaleffectiveness, and to avoid ambiguous pronoun refer-ences, wordiness, and redundancy.

8
Table 2.2Content Specifications for the EXPLORE Mathematics Test
The items in the Mathematics Test are classified according to four content categories. These categories and the approxi-mate proportion of the test devoted to each are given below.
Mathematics content area Proportion of test Number of items
Pre-Algebra .33 10
Elementary Algebra .30 9
Geometry .23 7
Statistics/Probability .14 4
Total 1.00 30
a. Pre-Algebra. Items in this category are based on oper-ations with whole numbers, integers, decimals, andfractions. The topics covered include place value,square roots, scientific notation, factors, ratio, and pro-portion and percent. Formal variables are not used.
b. Elementary Algebra. The items in this category arebased on operations with algebraic expressions. Theoperations include evaluation of algebraic expressionsby substitution; use of variables to express functionalrelationships, solution of linear equations in one vari-able, use of real number lines to represent numbers,and graphing of points in the standard coordinateplane.
c. Geometry. Items in this category cover such topics asthe use of scales and measurement systems, planeand solid geometric figures and associated relation-ships and concepts, the concept of angles and theirmeasures, parallelism, relationships of triangles, prop-erties of a circle, and the Pythagorean theorem. All ofthese topics are addressed at a level preceding formalgeometry.
d. Statistics/Probability. Items in this category cover suchtopics as elementary counting and rudimentary proba-bility; data collection, representation, and interpreta-tion; and reading and relating graphs, charts, and otherrepresentations of data. These topics are addressed ata level preceding formal statistics.
Table 2.3Content Specifications for the EXPLORE Reading Test
The items in the Reading Test are based on the prose passages that are representative of the kinds of writing commonlyencountered in middle-school and junior-high school curricula, including the social sciences, prose fiction, and the human-ities. The three content areas and the approximate proportion of the test devoted to each are given below.
Reading passage content Proportion of test Number of items
Prose Fiction .33 10
Social Sciences .33 10
Humanities .33 10
Total 1.00 30
a. Prose Fiction. The items in this category are based onshort stories or excerpts from short stories or novels.
b. Humanities. The items in this category are based onpassages from memoirs and personal essays, and inthe content areas of architecture, art, dance, ethics,film, language, literary criticism, music, philosophy,radio, television, or theater.
c. Social Sciences. The items in this category are basedon passages in anthropology, archaeology, biography,business, economics, education, geography, history,political science, psychology, or sociology.

9
Item Construction
The item writers must create items that are educationallyimportant as well as psychometrically sound. A large numberof items must be constructed because, even with good writ-ers, many items fail to meet ACT’s standards. Each itemwriter submits a set of items, called a unit, in a content area.
Review of Items
After a unit is accepted, it is edited to meet ACT’s speci-fications for content accuracy, word count, item classifica-tion, item format, and language. During the editing process,all test materials are reviewed for fair portrayal and balancedrepresentation of groups of society and nonsexist use of lan-guage. The unit is reviewed several times by ACT staff toensure that it meets all of ACT’s standards.
Copies of each unit are then submitted to content andfairness experts for external reviews prior to the pretestadministration of these units. The content reviewers areeighth-grade teachers, curriculum specialists, and college
and university faculty members. These content expertsreview the unit for content accuracy, educational importance,and grade-level appropriateness. The fairness reviewers areexperts in diverse educational areas who represent bothgenders and a variety of racial and ethnic backgrounds.These reviewers help ensure fairness to all examinees.
Any comments on the units by the content consultantsare discussed at a panel meeting with all the content con-sultants and ACT staff, and appropriate changes are madeto the unit(s). All fairness consultants’ comments arereviewed and discussed, and appropriate changes are madeto the unit(s).
Item Tryouts
The items that are judged acceptable in the reviewprocess are assembled into tryout units. Several units arethen combined and placed into booklets. The EXPLORE tryout units are administered in a special study under stan-dard conditions to a sample of students selected to be
Table 2.4Content Specifications for the EXPLORE Science Test
The Science Test is based on the type of content that is typically covered in early general science courses through Grade 8.Materials are drawn from the life sciences (such as biology, botany, ecology, health, human behavior, and zoology),Earth/space sciences (such as map reading, meteorology, geology, and astronomy), and physical sciences (such as sim-ple chemical formulas and equations and other basic chemistry, weights and measures, and basic principles of physics).The test emphasizes scientific reasoning skills over recall of specific scientific content, skill in mathematics, or skill in read-ing. Minimal arithmetic and algebraic computations may be required to answer some questions. The three formats and theapproximate proportion of the test devoted to each are given below.
Content areaa Format Proportion of test Number of items
Earth/Space Sciences Data Representation .43 12
Life Sciences Research Summaries .36 10
Physical Sciences Conflicting Viewpoints .21 6
Total 1.00 28aNote: All three content areas are represented in the test; there are three units in the life sciences, two units in the physical sciences, and one unit in the Earth/space sciences.
a. Data Representation. This format presents studentswith graphic and tabular material similar to that foundin science journals and texts. The items associatedwith this format measure skills such as graph reading,interpretation of scatterplots, and interpretation ofinformation presented in tables. The graphic or tabularmaterial may be taken from published materials; theitems are composed expressly for the Science Test.
b. Research Summaries. This format provides studentswith descriptions of one or more related experiments.The items focus on the design of experiments and the
interpretation of experimental results. The stimulus anditems are written expressly for the Science Test.
c. Conflicting Viewpoints. This format presents studentswith expressions of several hypotheses or views that,being based on differing premises or on incompletedata, are inconsistent with one another. The itemsfocus on the understanding, analysis, and comparisonof alternative viewpoints or hypotheses. Both the stim-ulus and the items are written expressly for theScience Test.

10
representative of the total examinee population. Each exam-inee in the tryout sample is administered a tryout bookletfrom one of the four academic areas covered by theEXPLORE tests. The time limits for the tryout units permitmost of the students to respond to all items.
Item Analysis of Tryout Units
Item analyses are performed on the tryout units. For agiven booklet the sample is divided into low, medium, andhigh groups by the individual’s total tryout test score. Thecutting scores for the three groups are the 27th and the 73rdpercentile points in the distribution of those scores.
Proportions of students in each of the groups correctlyanswering each tryout item are tabulated, as well as the pro-portion in each group selecting each of the incorrect options.Biserial and point-biserial correlation coefficients betweeneach item score (correct/incorrect) and the total score on thetryout unit are also computed.
The item analyses serve to identify statistically effectivetest questions. Items that were either too difficult or too easy,and those that failed to discriminate between students ofhigh and low educational development as measured by theirtryout test scores, are eliminated or revised. The biserial andpoint-biserial correlation coefficients, as well as the differ-ences between proportions of students answering the itemcorrectly in each of the three groups, are used as indices ofthe discriminating power of the tryout items.
Each item is reviewed following the item analysis. ACTstaff scrutinizes items determined to be of poor quality inorder to identify possible causes. Some items are revisedand placed in new tryout units following further review. Thereview process also provides feedback that helps decreasethe incidence of poor quality items in the future.
Assembly of New Forms
Items that are judged acceptable in the review processare placed in an item pool. Preliminary forms of theEXPLORE tests are constructed by selecting from this poolitems that match both the content and statistical specifica-tions for the tests.
For each test in a battery form, items are selected tomatch the content distribution for the test shown inTables 2.1 through 2.4. Items are also selected to complywith the desired statistical specifications as discussed in anearlier section. The distributions of item difficulty levelsobtained on a recent form of the four tests are displayed inTable 2.5. The data in the table are taken from randomsamples of approximately 2,000 students from theoperational administration of the tests in 1999, 2003, and2005. In addition to the item difficulty distributions, itemdiscrimination indices in the form of observed mean biserialcorrelations are reported.
Table 2.5Difficultya Distributions and Mean Discriminationb Indices
From the 1999, 2003, and 2005 EXPLORE Operational Administrations
Difficulty range English Mathematics Reading Science
.00–.09 0 0 0 0
.10–.19 0 1 0 0
.20–.29 0 3 1 1
.30–.39 7 8 1 4
.40–.49 16 13 16 15
.50–.59 15 16 20 20
.60–.69 26 18 24 22
.70–.79 30 9 16 10
.80–.89 21 14 10 7
.90–.99 5 8 2 5
Number of itemsc 120 90 90 84Mean difficultya .66 .62 .62 .61Mean discriminationb 0.58 0.59 0.61 0.59aDifficulty is the proportion of examinees correctly answering the item.bDiscrimination is the item-total biserial correlation coefficient.cThree forms of 40, 30, 30, and 28 items each for the English, Mathematics, Reading,and Science Tests, respectively.

Content and Fairness Review of Test Forms
The preliminary versions of the test forms are subjectedto several reviews to ensure that the items are accurate andthat the overall test forms are fair and conform to good testconstruction practice. The first review is performed by ACTstaff. Items are checked for content accuracy and conformi-ty to ACT style. The items are also reviewed to ensure thatthey are free of clues that could allow test-wise students toanswer the item correctly even though they lack knowledgein the subject area or the required skills.
The assembled forms are then submitted to content andfairness experts for external review prior to the operationaladministration of the forms. These consultants are not thesame individuals used for the content and fairness reviewsof tryout units.
The content consultants are eighth-grade teachers, cur-riculum specialists, and college and university faculty mem-bers. The content consultants review the forms for contentaccuracy, educational importance, and grade-level appropri-ateness. The fairness consultants are diversity experts ineducation who represent both genders and a variety of racialand ethnic backgrounds. The fairness consultants review theforms to help ensure fairness to all examinees.
After the external content and fairness reviews, ACT sum-marizes the results from the reviews. Comments from theconsultants are then reviewed by ACT staff members, andany necessary changes are made to the test forms.Whenever significant changes are made, the revised com-ponents are again reviewed by the appropriate consultantsand by ACT staff. If no further corrections are needed, thetest forms are prepared for printing.
In all, at least sixteen independent reviews are made ofeach test item before it appears on a national form ofEXPLORE. The many reviews are performed to help ensurethat each student’s level of achievement is accurately andfairly evaluated.
Review Following Operational Administration
After each operational administration, item analysisresults are reviewed for any abnormality such as substantialchanges in item difficulty and discrimination indices betweentryout and national administrations. Only after all anomalieshave been thoroughly checked and the final scoring keyapproved are score reports produced. Examinees areencouraged to challenge any items that they feel are ques-tionable in correctness. Once a challenge to an item israised and reported, the item will be reviewed by the expertsin the content area the item is assessing. In the event that aproblem is found with an item, necessary actions will betaken to eliminate or minimize the influence of the problemitem. In all cases, the person who challenges an item will besent a letter indicating the results of the review.
Also, after each operational administration, differentialitem functioning (DIF) analysis is conducted on the test data.DIF can be described as a statistical difference between theprobability of the specific population group (the “focal”
group) getting the item right and the comparison populationgroup (the “base” group) getting the item right given thatboth groups have the same level of expertise with respect tothe content being tested. The procedures currently used forthe analysis include the standardized difference in propor-tion-correct (STD) procedure and the Mantel-Haenszel com-mon odds-ratio (MH) procedure.
In ACT’s experience, the MH and STD procedures areuseful techniques in detecting DIF. Both techniques aredesigned for use with multiple-choice items, and bothrequire data from significant numbers of examinees to pro-vide reliable results. For a description of these statistics andtheir performance overall in detecting DIF, see the ACTResearch Report entitled Performance of Three ConditionalDIF Statistics in Detecting Differential Item Functioning onSimulated Tests (Spray, 1989). In the analysis on items in anEXPLORE form, large samples representing examineegroups of interest, e.g., males and females, are selectedfrom the total number of examinees taking the test. Theexaminees’ responses to each item on the test are analyzedusing the STD and MH procedures. Compared withpreestablished criteria, the items with MH and/or STD valuesexceeding the tolerance level are flagged. The flagged itemsare then further reviewed by the content specialists for pos-sible explanations of the unusual MH and/or STD results ofthe items. In the event that a problem is found with an item,necessary actions will be taken to eliminate or minimize theinfluence of the problem item.
EXPLORE Scoring Procedures
For each of the four tests in EXPLORE (English, Mathe-matics, Reading, Science), the raw scores (number of cor-rect responses) are converted to scale scores ranging from1 to 25. The score scale is discussed further on pages 22–23of this manual.
The Composite score is the average of the four scalescores rounded to the nearest whole number (0.5 roundsup). The minimum Composite score is 1; the maximum is 25.
In addition to the four EXPLORE test scores andComposite score, two subscores are reported for the EnglishTest. As for each of the four tests, the raw scores for the sub-score items are converted to scale scores. These subscoresare reported on a score scale ranging from 1 to 12.
National norms are reported as cumulative percent forthe four EXPLORE test scores, two subscores, andComposite score. EXPLORE norms are intended to be rep-resentative of the performance of all eighth graders (in thefall, and in the spring) and ninth graders (in the fall), respec-tively, in the nation, and are based on administrations ofEXPLORE to classes of eighth and ninth graders in publicand private schools throughout the United States. Normingprocedures are discussed further on pages 24–36 of thismanual.
11

12
ACT’s College Readiness Standards
Description of the College Readiness Standards
In 1997, ACT began an effort to make EPAS test resultsmore informative and useful. This effort yielded CollegeReadiness Standards for each of the EPAS programs. TheEPAS College Readiness Standards are statements thatdescribe what students who score in various score rangeson the EPAS tests are likely to know and to be able to do.For example, students who score in the 16–19 range on thePLAN English Test typically are able “to select the most log-ical place to add a sentence in a paragraph,” while studentswho score in the 28–32 score range are able “to add a sen-tence to introduce or conclude a fairly complex paragraph.”The Standards reflect a progression of skills in each of thefive tests: English, Reading, Mathematics, Science, andWriting. ACT has organized the standards by strands—related areas of knowledge and skill within each test—forease of use by teachers and curriculum specialists. Thecomplete College Readiness Standards are posted on ACT’swebsite: www.act.org. They also are available in poster for-mat from ACT Educational Services at 319/337-1040. ACTalso offers College Readiness Standards InformationServices, a supplemental reporting service based on theStandards.
College Readiness Standards for EXPLORE, PLAN, andthe ACT are provided for six score ranges (13–15, 16–19,20–23, 24–27, 28–32, and 33–36) along a score scale that iscommon to EXPLORE (1–25), PLAN (1–32), and the ACT(1–36). Students who score in the 1–12 range are most likelybeginning to develop the skills and knowledge described inthe 13–15 score range. The Standards are cumulative, whichmeans that if students score, for example, in the 20–23 rangeon the English Test, they are likely able to demonstrate mostor all of the skills and understandings in the 13–15, 16–19,and 20–23 score ranges.
College Readiness Standards for Writing, which ACTdeveloped in 2005, are available only for the ACT and are
provided for five score ranges (3–4, 5–6, 7–8, 9–10, and11–12) based on ACT Writing Test scores obtained (sum oftwo readers’ rating using the six-point holistic scoring rubricfor the ACT Writing Test). Scores below 3 do not permit use-ful generalizations about students’ writing abilities.
Since the three EPAS testing programs—EXPLORE,PLAN, and the ACT—are designed to measure students’progressive development of knowledge and skills in thesame four academic areas through Grades 8–12, theStandards are correlated across programs as much as pos-sible. The Standards in the 13–15, 16–19, 20–23, and 24–27score ranges apply to scores for all three programs. TheStandards in the 28–32 score range are specific to PLANand the ACT, and the scores in the 33–36 score range arespecific to the ACT. Figure 3.1 illustrates the score-rangeoverlap among the three programs.
Determining the Score Ranges for the CollegeReadiness Standards (1997)
When ACT began work on the College ReadinessStandards in 1997, the first step was to determine the num-ber of score ranges and the width of each score range. To dothis, ACT staff reviewed EPAS normative data and consid-ered the relationships among EXPLORE, PLAN, and theACT. This information was considered within the context ofhow the test scores are used—for example, the use of theACT scores in college admissions and course-placementdecisions.
In reviewing the normative data, ACT staff analyzed thedistribution of student scores across the respective EPASscore scales (EXPLORE 1–25, PLAN 1–32, and ACT 1–36).The staff also considered course placement research thatACT has conducted over the last forty years. ACT’s CoursePlacement Service provides colleges and universities withcutoff scores that are used for placement into appropriateentry-level college courses. Cutoff scores based on admis-sions and course placement criteria were used to help definethe score ranges of all three EPAS programs.
Chapter 3ACT’s College Readiness Standards and
College Readiness Benchmarks
Figure 3.1. Score ranges for EXPLORE, PLAN, and the ACT.
EXPLORE
PLAN
ACT
13–15 16–19 20–23 24–27 28–32 33–36

Itemno.
Item difficulties for students scoring in the score range of:
13–15 16–19 20–23 24–27 28–32 33–36
1 .62 .89 .98 .99 1.00 1.002 .87 .98 .99 .99 1.006 .60 .86 .94 .97 .99 .997 .65 .92 .98 .99 .99 1.00
20 .84 .94 .97 .98 .9927 .85 .97 .99 .99 .994 .92 .97 .99 1.005 .94 .97 .99 .99. . . . .. . . . .. . . . .8 .82 .95 .98 .999 .80 .89 .96 .99
21 .82 .92 .97 .9913 .90 .97 .9915 .90 .97 .9917 .87 .98 1.0018 .83 .93 .9822 .81 .91 .9824 .83 .96 .9829 .87 .98 1.0034 .86 .95 .9936 .82 .93 .9939 .85 .96 .9944 .84 .96 .9925 .95 .9928 .97 1.00. . .. . .. . .
35 .86 .9647 .86 .9732 .9533 .9246 .9049 .9551 .9852 .9853 .9256 .9857 .8658 .9559 .8660 .96
13
After analyzing all the data and reviewing different possi-ble score ranges, ACT staff concluded that the score ranges1–12, 13–15, 16–19, 20–23, 24–27, 28–32, and 33–36would best distinguish students’ levels of achievement so asto assist teachers, administrators, and others in relatingEPAS test scores to students’ skills and understandings.
Developing the College Readiness Standards
After reviewing the normative data, college admissionscriteria, and information obtained through ACT’s CoursePlacement Service, content area test specialists wrote theCollege Readiness Standards based on their analysis of theskills and knowledge students need in order to respond suc-cessfully to test items that were answered correctly by 80%or more of the examinees who scored within each scorerange. Content specialists analyzed test items taken fromdozens of test forms. The 80% criterion was chosenbecause it offers those who use the College ReadinessStandards a high degree of confidence that students scoringin a given score range will most likely be able to demon-strate the skills and knowledge described in that range.
The Process. Four ACT content teams were identified,one for each of the tests (English, Mathematics, Reading,and Science) included in the three EPAS programs. Eachcontent team was provided with numerous EPAS test formsalong with tables that showed the percentages of studentsin each score range who answered each test item correctly(the item difficulties). Item difficulties were computed sepa-rately based on groups of students whose scores fell withineach of the defined score ranges.
The College Readiness Standards were identified bytest, by program, beginning with the ACT. Each contentteam was provided with 10 forms of the ACT and the itemdifficulties computed separately for each score range foreach of the items on the forms. For example, the mathe-matics content team reviewed 10 forms of the ACTMathematics Test. There are 60 items in each ACTMathematics Test form, so 600 ACT Mathematics itemswere reviewed in all. An illustrative table displaying the infor-mation provided to the mathematics content team for oneACT Mathematics Test form is shown in Table 3.1.
The shaded areas in Table 3.1 show the items that metthe 0.80 or above item difficulty criterion for each of thescore ranges. As illustrated in Table 3.1, a cumulative effectcan be noted: the items that are correctly answered by 80%of the students in Score Range 16–19 also appear in ScoreRange 20–23; the items that are correctly answered by 80%of the students in Score Range 20–23 also appear in ScoreRange 24–27; and so on. By using this information, the con-tent teams were able to isolate and review the items byscore ranges across test forms.
Table 3.1Illustrative Listing of Mathematics Items
by Score Range

14
Table 3.2Number of Items Reviewed During 1997 National Review
Number of items for each testing program
Content area EXPLORE PLAN ACT
English 40 50 75
Mathematics 30 40 60
Reading 30 25 40
Science 28 30 40
Number of items per form 128 145 215
Total number of test forms reviewed 4 9 10
Total number of items reviewed 512 1,305 2,150
The procedures described allowed the content teams toconceptualize what is measured by each of the academictests. Each content team followed the same basic process asthey reviewed the test items in each academic test in thethree assessment programs, EXPLORE, PLAN, and the ACT:1. Multiple forms of each academic test were distributed.2. The knowledge, skills, and understandings that are nec-
essary to answer the test items in each score rangewere identified.
3. The additional knowledge, skills, and understandingsthat are necessary to answer the test items in the nextscore range were identified. This process was repeatedfor all the score ranges.
4. All the lists of statements identified by each content spe-cialist were merged into a composite list. The compositelist was distributed to a larger group of content special-ists.
5. The composite list was reviewed by each content spe-cialist and ways to generalize and to consolidate thevarious skills and understandings were identified.
6. The content specialists met as a group to discuss theindividual, consolidated lists and prepared a master listof skills and understandings, organized by score ranges.
7. The master list was used to review at least three addi-tional test forms, and adjustments and refinements weremade as necessary.
8. The adjustments were reviewed by the content special-ists and “final” revisions were made.
9. The “final” list of skills and understandings was used toreview additional test forms. The purpose of this reviewwas to determine whether the College ReadinessStandards adequately and accurately described theskills and understandings measured by the items, byscore range.
10. The College Readiness Standards were once againrefined.
These steps were used to review test items for all fourmultiple-choice academic tests in all three testing programs.As work began on the PLAN and EXPLORE test items, theCollege Readiness Standards developed for the ACT wereused as a baseline, and modifications or revisions weremade as necessary.
Table 3.2 reports the total number of test items reviewedfor each content area and for each testing program.

15
Conducting an Independent Review of the CollegeReadiness Standards. As a means of gathering contentvalidity evidence, ACT invited nationally recognized scholarsfrom high school and university English, mathematics, read-ing, science, and education departments to review theCollege Readiness Standards. These teachers andresearchers were asked to provide ACT with independent,authoritative reviews of the College Readiness Standards.
The content area experts were selected from among can-didates having experience with and an understanding of theacademic tests on EXPLORE, PLAN, and the ACT. Theselection process sought and achieved a diverse represen-tation by gender, ethnic background, and geographic loca-tion. Each participant had extensive and current knowledgeof his or her field, and many had acquired national recogni-tion for their professional accomplishments.
The reviewers were asked to evaluate whether theCollege Readiness Standards (a) accurately reflected theskills and knowledge needed to correctly respond to testitems (in specific score ranges) in EXPLORE, PLAN, and theACT and (b) represented a continuum of increasinglysophisticated skills and understandings across the scoreranges. Each national content area team consisted of threecollege faculty members currently teaching courses in cur-riculum and instruction, and three classroom teachers, oneeach from Grades 8, 10, and 12. The reviewers were pro-vided with the complete set of College Readiness Standardsand a sample of test items falling in each of the scoreranges, by academic test and program.
The samples of items to be reviewed by the consultantswere randomly selected for each score range in all four aca-demic tests for all three assessment programs. ACTbelieved that a random selection of items would ensure amore objective outcome than would preselected items.Ultimately, 17 items for each score range were selected (85 items per testing program, or a total of 255 items for all
three programs). Before identifying the number of items thatwould comprise each set of items in each score range, it wasfirst necessary to determine the target criterion for the levelof agreement among the consultants. ACT decided upon atarget criterion of 70%. It was deemed most desirable for thepercentage of matches to be estimated with an accuracy ofplus or minus 0.05. That is, the standard error of the esti-mated percent of matches to the Standards should be nogreater than 0.05. To estimate a percentage around 70%with that level of accuracy, 85 observations were needed.Since there were five score ranges, the number of items perscore range to be reviewed was 17 (85 ÷ 5 = 17).
The consultants had two weeks to review the CollegeReadiness Standards. Each reviewer received a packet ofmaterials that contained the College Readiness Standards,sets of randomly selected items (17 per score range), intro-ductory material about the College Readiness Standards, adetailed set of instructions, and two evaluation forms.
The sets of materials submitted for the experts’ reviewwere drawn from 13 ACT forms, 8 PLAN forms, and 4EXPLORE forms. The consultants were asked to performtwo main tasks in their area of expertise: Task 1—Judge theconsistency between the Standards and the correspondingsample items provided for each score range; Task 2—Judgethe degree to which the Standards represent a cumulativeprogression of increasingly sophisticated skills and under-standings from the lowest score range to the highest scorerange. The reviewers were asked to record their ratingsusing a five-point Likert scale that ranged from StronglyAgree to Strongly Disagree. They were also asked to sug-gest revisions to the language of the Standards that wouldhelp the Standards better reflect the skills and knowledgemeasured by the sample items.
ACT collated the consultants’ ratings and comments asthey were received. The consultants’ reviews in all but twocases reached ACT’s target criterion, as shown in Table 3.3.
Table 3.3Percentage of Agreement of 1997 National Expert Review
EXPLORE PLAN/ACT
Task 1 Task 2 Task 1 (PLAN) Task 1 (ACT) Task 2
English 65% 80% 75% 75% 86%
Mathematics 80% 100% 70% 95% 100%
Reading 75% 75% 75% 60% 100%
Science 95% 100% 100% 70% 80%

16
That is, 70% or more of the consultants’ ratings were Agreeor Strongly Agree when judging whether the Standards ade-quately described the skills required by the test items andwhether the Standards adequately represented the cumula-tive progression of increasingly sophisticated skills from thelowest to the highest score ranges. The two exceptions werethe EXPLORE English Test and the ACT Reading Test,where the degree of agreement was 65% and 60%, respec-tively. Each ACT staff content area team met to review allcomments made by all the national consultants. The teamsreviewed all suggestions and adopted a number of helpfulclarifications in the language of the Standards, particularly inthe language of the EXPLORE English Test Standards andthe ACT Reading Test Standards—those two cases in whichthe original language had failed to meet the target criterion.
Refining the College Readiness Standards forEXPLORE and PLAN (2001)
In 2001, the score scale for EXPLORE and PLAN wasrefined. This required that the College Readiness Standardsfor EXPLORE and PLAN be reexamined.
The approach used in 1997 to develop the Standardswas used to reexamine the Standards for EXPLORE andPLAN in 2000. Staff reviewed items, at each EXPLORE andPLAN score interval, that were answered correctly by 80%or more of the EXPLORE and PLAN examinees. Using thePLAN College Readiness Standards as a baseline,EXPLORE test items were reviewed to ensure that thePLAN College Readiness Standards adequately describedthe skills and understandings students were being asked todemonstrate in each score range.
As in the 1997 study, a national independent panel ofcontent experts was convened in each of the four multiple-choice academic tests to ensure that the refinedEXPLORE/PLAN Standards (a) accurately reflected theskills and knowledge needed to correctly respond to testitems in the common score ranges and (b) represented a
continuum of increasingly sophisticated skills and under-standings across the entire score range. As was the case in1997, content area experts were identified in the areas ofEnglish, mathematics, reading, and science. Each contentarea team consisted of three reviewers, one each from mid-dle school/junior high, high school, and college/university.
For each academic test, the consultants were asked toreview sets of test items, arranged by score range, and thecorresponding College Readiness Standards. The PLANreviewers received two sets of test items, an EXPLORE setand a PLAN set, along with the corresponding Standards. Acriterion of 17 items per score range was chosen.
As was the case in 1997, the reviewers were asked torecord their ratings using a five-point Likert scale that rangedfrom Strongly Agree to Strongly Disagree. They were alsoasked to suggest revisions to the language of the Standardsthat would help the Standards better reflect the skills andknowledge measured by the sample items. A target criterionof 70% agreement was again identified. The consultants’review in all cases reached ACT’s target criterion, as shownin Table 3.4.
Periodic Review of the College Readiness Standards
In addition to the regularly scheduled independentreviews conducted by national panels of subject matterexperts, ACT also periodically conducts internal reviews ofthe College Readiness Standards. ACT identifies three tofour new forms of the ACT, PLAN, and EXPLORE (forEXPLORE, fewer forms are available) and then analyzes thedata and the corresponding test items, by score range. Thepurposes of these reviews are to ensure that (a) theStandards reflect the knowledge and skills being measuredby the items in each score range and (b) the Standardsreflect a cumulative progression of increasingly sophisti-cated skills and understandings from the lowest score rangeto the highest. Minor refinements intended to clarify the lan-guage of the Standards have resulted from these reviews.
Table 3.4Percentage of Agreement of 2000 National Expert Review
EXPLORE PLAN
Task 1 Task 2 Task 1 Task 2
English 90% 100% 73% 100%
Mathematics 75% 100% 100% 100%
Reading 100% 100% 87% 100%
Science 75% 100% 90% 100%

17
Interpreting and Using the College Readiness Standards
Because new EPAS test forms are developed at regularintervals and because no one test form measures all of theskills and knowledge included in any particular Standard, theCollege Readiness Standards must be interpreted as skillsand knowledge that most students who score in a particularscore range are likely to be able to demonstrate. Since therewere relatively few test items that were answered correctlyby 80% or more of the students who scored in the lowerscore ranges, the standards in these ranges should be inter-preted cautiously.
It is important to recognize that the EPAS tests neithermeasure everything students have learned nor does any testmeasure everything necessary for students to know to besuccessful in their next level of learning. The EPAS testsinclude questions from a large domain of skills and fromareas of knowledge that have been judged important for suc-cess in high school, college, and beyond. Thus, the CollegeReadiness Standards should be interpreted in a responsibleway that will help students, parents, teachers, and adminis-trators to:
• Identify skill areas in which students might benefit fromfurther instruction
• Monitor student progress and modify instruction toaccommodate learners’ needs
• Encourage discussion among principals, curriculumcoordinators, and classroom teachers as they evalu-ate their academic programs
• Enhance discussions between educators and parentsto ensure that students’ course selections are appro-priate and consistent with their post-high school plans
• Enhance the communication between secondary andpostsecondary institutions
• Identify the knowledge and skills students enteringtheir first year of postsecondary education shouldknow and be able to do in the academic areas of lan-guage arts, mathematics, and science
• Assist students as they identify skill areas they need tomaster in preparation for college-level coursework
ACT’s College Readiness Benchmarks
Description of the College Readiness Benchmarks
The ACT College Readiness Benchmarks (see Table 3.5)are the minimum ACT test scores required for students tohave a high probability of success in first-year, credit-bearingcollege courses—English Composition, social sciencescourses, Algebra, or Biology. In addition to the Benchmarksfor the ACT, there are corresponding EXPLORE and PLANBenchmarks for use by students who take these programs togauge their progress in becoming college ready in the eighthand tenth grades, respectively. Students who meet aBenchmark on the ACT have approximately a 50% chanceof earning a B or better and approximately a 75% chance orbetter of earning a C or better in the corresponding collegecourse or courses. Students who meet a Benchmark onEXPLORE or PLAN are likely to have approximately thissame chance of earning such a grade in the correspondingcollege course(s) by the time they graduate high school.
Data Used to Establish the Benchmarks for the ACT
The ACT College Readiness Benchmarks are empiricallyderived based on the actual performance of students in col-lege. As part of its Course Placement Service, ACT providesresearch services to colleges to help them place students inentry-level courses as accurately as possible. In providingthese research services, ACT has an extensive databaseconsisting of course grade and test score data from a largenumber of first-year students and across a wide range ofpostsecondary institutions. These data provide an overallmeasure of what it takes to be successful in selected first-year college courses. Data from 98 institutions and over90,000 students were used to establish the Benchmarks. Foreach course, all colleges that supplied data for that coursewere included. If a college sent data from more than a singleyear, only data from the most recent year were included. Thenumbers and types of college varied by course. Because thesample of colleges in this study is a “convenience” sample(that is, based on data from colleges that chose to participate
Table 3.5ACT’s College Readiness Benchmarks
EPAS subject test College courseEXPLORE test score
PLAN test score
ACT test score
English English Composition 13 15 18
Mathematics College Algebra 17 19 22
Reading College Social Sciences 15 17 21
Science College Biology 20 21 24

18
in ACT’s Course Placement Service), there is no guaranteethat it is representative of all colleges in the U.S. Therefore,ACT weighted the sample so that it would be representativeof the variety of schools in terms of their selectivity.
Procedures Used to Establish the Benchmarks forEXPLORE and PLAN
The College Readiness Benchmarks for EXPLORE andPLAN were developed using about 150,000 records of stu-dents who had taken EXPLORE in the fall of Grade 8, PLANin the fall of Grade 10, and the ACT in Grades 11 or 12. First,the probabilities at each EXPLORE and PLAN test scorepoint were estimated and associated with meeting theappropriate Benchmark for the ACT. Next, the EXPLOREand PLAN test scores were identified in English, Reading,Mathematics, and Science that corresponded most closelyto a 50% probability of success at meeting each of the fourBenchmarks established for the ACT.
Interpreting the EXPLORE and PLAN Benchmarks for Students Who Test With EXPLORE in Grade 9
and PLAN in Grade 11
The EXPLORE and PLAN Benchmarks were establishedusing scores of Grade 8 (EXPLORE) and Grade 10 (PLAN)students. Students who take EXPLORE in Grade 9 or PLANin Grade 11 are generally more academically prepared thanstudents who take them in Grade 8 or Grade 10, respec-tively. Benchmark results for Grade 9 and 11 students whoachieve scores near the Benchmarks should therefore beinterpreted with caution.
Intended Uses of the Benchmarks for Students,Schools, Districts, and States
ACT, PLAN, and EXPLORE results give students an indi-cation of how likely they are to be ready for college-levelwork. The results let students know if they have developedor are developing the foundation for the skills they will need
by the time they finish high school. PLAN and EXPLOREresults provide an early indication of the student’s collegereadiness. Students who score at or above the CollegeReadiness Benchmarks in English, mathematics, and sci-ence are likely to be on track to do well in entry-level collegecourses in these subjects. Students scoring at or above thereading Benchmark are likely to be developing the level ofreading skills they will need in all of their college courses.For students taking EXPLORE and PLAN, this assumes thatthese students will continue to work hard and take challeng-ing courses throughout high school.
States can use the Benchmarks as a tool for establishingminimum standards for high school graduation in statewideassessment contexts that are aimed at preparing highschool graduates for postsecondary education. Junior highand high schools can use the Benchmarks for EXPLOREand PLAN as a means of evaluating students’ early progresstoward college readiness so that timely interventions can bemade when necessary, or as an educational counseling orcareer planning tool.
Interpreting EPAS Test Scores With Respect to Both ACT’s College Readiness Standards and
ACT’s College Readiness Benchmarks
The performance levels on ACT’s EPAS tests necessaryfor students to be ready to succeed in college-level work are defined in ACT’s College Readiness Benchmarks.Meanwhile, the skills and knowledge a student currently has(and areas for improvement) can be identified by examiningthe student’s EPAS test scores with respect to ACT’s empir-ically derived College Readiness Standards. These twoempirically derived tools are designed to help a studenttranslate the student’s EPAS test scores into a clear indica-tor of the student’s current level of college readiness and tohelp the student identify key knowledge and skill areas thestudent needs to improve in order to increase the student’slikeliness to achieve college success.

19
This chapter discusses the technical characteristics—thescore scale, norms, equating, and reliability—of theEXPLORE tests of educational development.
Scaling and Norming
The information on the scaling presented here was col-lected in a special study to rescale the tests. Data for thisstudy were collected in the fall of 1999. Data for the normscomes from a special study done in the fall of 2005. Thesestudies are briefly described below, with fuller discussionsfollowing.
Scaling Study (1999). Data to scale the EXPLORE testwere obtained from a sample of eighth- and tenth-grade stu-dents in the fall of 1999. The eighth graders were adminis-tered the EXPLORE battery and a scaling test in one of thefour subject areas. The tenth graders were administered thePLAN battery and a scaling test in one of the four subjectareas. The scaling tests taken by the eighth and tenthgraders were identical and were used to link EXPLORE tothe PLAN score scales in each of the four subject areas.Approximately 11,500 students participated in the scalingstudy, and about 80% of the student records were retainedfor analysis.
Norming Study (2005). Data to establish the norms forthe EXPLORE tests were collected in a special study donein the fall of 2005. Both eighth and ninth graders participatedin the study. Each student took the EXPLORE battery. Thetotal sample consisted of approximately 7,500 studentsacross both grades. To create the norms, the sample datawere combined with the data from schools that useEXPLORE operationally.
Sampling for the 1999 Study
Data for the 1999 EXPLORE scaling/norming study wereobtained from samples of eighth-, ninth-, and tenth-gradestudents, which were intended to be nationally representa-tive. The eighth graders were each administered theEXPLORE battery and a scaling test in one of the four sub-ject areas. Similarly, the tenth-grade examinees took thePLAN battery and a scaling test in one of the four subjectareas. The scaling tests taken by both eighth- and tenth-grade examinees were identical and were used to linkEXPLORE to the PLAN score scales in each of the four sub-ject areas. The EXPLORE battery scores from the eighth-grade and ninth-grade examinees were used to obtainnationally representative norms for Grade 8 Fall, Grade 9Fall, and (interpolated) Grade 8 Spring. PLAN battery scoresfrom the sample of fall-tested tenth-grade examinees wereused to obtain nationally representative Fall Grade 10norms.
Sample Design and Data Collection. The Fall 1999study had multiple goals and the sampling design was devel-oped to take into account those goals. In particular, the goals were to:1. rescale the EXPLORE tests;2. develop nationally representative norms for EXPLORE
Grade 8 Fall;3. develop nationally representative norms for EXPLORE
Grade 8 Spring;4. develop nationally representative norms for EXPLORE
Grade 9 Fall;5. develop nationally representative norms for PLAN Grade
10 Fall; and6. develop norms for the college-bound students in the
PLAN Grade 10 Fall national sample.
The results of the 1999 scaling are reported in this sec-tion. The results of the 2005 norming study, which supersedethe 1999 norming results, are reported on pages 24–36.
The eighth-grade EXPLORE norms for spring-tested stu-dents were to be interpolated from the norms for the fall-tested eighth graders and the norms for the fall-tested ninthgraders. Because of this, it was decided to sample botheighth- and ninth-grade students from the same schools.However, many schools do not have both an eighth and aninth grade. To overcome this, school contact was made atthe district level, with the intention of getting both an eighthand a ninth grade from a district to participate in the study.
The target population consisted of students enrolled ineighth, ninth, and tenth grades in schools in the UnitedStates. The overall sampling design was two-stage, withstratification of the first-stage units (schools). The explicitstratification variable was school size. In order to obtain anationally representative sample, schools were sorted ongeographic region, within school size strata. A systematicsample was then selected from each school size stratum.
The goal of the sampling was to estimate any proportionto within .05 with probability .95, equivalent to a standarderror of 0.025 for the estimate, assuming the variable ofinterest is normally distributed. That is, suppose the value ofinterest is the proportion of students in Grade 8 who willscore at or below an 18 on the EXPLORE English Test. Thesample size is chosen so that 95 times out of 100, the sam-ple will produce an estimate of the proportion at or below 18that is within .05 of the true proportion. This should be truefor any proportion calculated.
In anticipation that some schools would not participate inthe study, many more schools were invited to participate thanwere required to achieve the targeted precision. During therecruitment, the number of participating schools in each stra-tum were carefully monitored to maintain the representative-ness of the sample with respect to the stratification variables.
Chapter 4Technical Characteristics of
the EXPLORE Tests of Educational Development

20
Data Editing. Data were edited at the school, classroom,and student levels. The following editing rules were used toexclude data from the scaling data set.
1. If an inappropriate grade (a blank was okay) wasgridded.
2. If there was a score of zero on any of the four main tests(a zero on a subscore was okay).
3. If too many items on any test were omitted. The defini-tion of “too many items” depended on the test length.
4. If the examinee, classroom, or school was identified onan irregularity report.
5. If the examinee marked special testing or extended timeon the answer sheet.
6. If the administrator mistimed the test.7. If the battery was administered over two or more days,
rather than on one day.8. If the scaling test was not administered.9. If the scaling test was administered before the battery.
10. If the scaling test was administered on the same day asthe battery.
11. If the scaling test was not spiraled within classroom.12. If the examinee’s score was voided by the administrator.13. If the examinee volunteered to be in the study, rather
than being in a selected classroom.
The following editing rules were used with the normingdata.
1. If an inappropriate grade (a blank was okay) wasgridded.
2. If there was a score of zero on any of the four main tests(a zero on a subscore was okay).
3. If too many items on any test were omitted. The defini-tion of “too many items” depended on the test length.
4. If the examinee, classroom, or school was identified onan irregularity report.
5. If the examinee marked special testing or extended timeon the answer sheet.
6. If the administrator mistimed the test.7. If the battery was administered over two or more days,
rather than on one day.8. If the examinee’s score was voided by the administrator.9. If the school district was represented in either the
eighth-grade or ninth-grade samples, but not both.
These rules were applied separately for each test, to formfour scaling groups and four norming groups. Extensive datacleanup measures were taken to ensure that the data avail-able for analysis were the best possible, given the data thatwere collected. About 16,500 students participated in the
norming: approximately 64% of the student records collectedfor the norming were retained for analysis. About 11,500 stu-dents participated in the scaling: approximately 80% of theeighth- and tenth-grade student records collected for thescaling were retained for analysis. The final sample sizes aregiven in Table 4.1.
Weighting. For the scaling and norming process, individ-ual examinee records were multiplied by weights. Theweighting was an attempt to adjust for some of the nonre-sponse seen in both schools and strata, and to thus betterrepresent the populations. The weight for a student in schooli with stratum j is given by
wgt(i, j) = · · K,
whereNij = the total number of students at school i in stratum j,nij = the number of students at school i in stratum j in the
sample,Mj = the total number of schools in stratum j, andmj = the number of schools in stratum j in the sample.
K is a constant chosen to scale the weights so that the totalweighted sample size is equal to the size of a random sam-ple that would give the same precision. Weights were calcu-lated for Grades 8, 9, and 10 separately.
Response Rates. One type of nonresponse in this studywas among schools: not every school invited to participatedid so. Attempts were made to choose replacement schoolsfrom the same strata as the schools they were replacing sothat the obtained sample would be representative with
Mj____mj
Nij____nij
Table 4.1Sample Sizes
Sample size Sample size Sample size(number of for norms for scaling
Grade schools) (students) (students)
8 47 4,879 7,065
9 41 6,660 —
10 49 5,004 4,504

respect to the stratification variable. Nevertheless, it is con-ceivable that schools’ willingness to participate in this studycould be related to their students’ academic development,independent of school size. If this were true, then the nonre-sponse among schools would introduce a bias in the results.In fact, with school-level response rates as low as thoseshown in Table 4.2, the error due to this nonresponse ispotentially the largest of all sources of error.
A second type of nonresponse was among studentswithin a participating school. Within-school participationrates are provided in Table 4.3. The reported rates are theproportion of students actually tested relative to the numberof enrolled students reported. In general, the participationrate is quite high, typically about 80%. Any school that testedfewer than 50% of the students was called and asked whythe participation rate was low. If the low value was due torandom subsampling, the school was included in the study.If no reason could be given, or the reason was judged toaffect the quality of the results, the records from that schoolwere deleted. Four schools in the tenth-grade sample weredeleted for this reason.
21
Table 4.2Response Rates by Grade
Number of Number Numberdistricts/schools agreeing to in the
Grade contacted participate final sample
8 925 72 47
9 925 55 41
10 505 67 49
Table 4.3Summary of Response Rates Within Schools
Grade Minimum Median Maximum
8 52% 76% 100%
9 21% 88% 100%
10 39% 82% 100%

22
Obtained Precision. Sampling theory allows the estima-tion of precision and effective sample sizes. The targetedlevel of precision was to estimate any proportion, P(x), towithin 0.05 with probability .95. The obtained levels of preci-sion are the estimated standard errors of P(x) in Table 4.4.The effective sample sizes, which are based on precision,were smaller than the actual sample sizes. Because sepa-rate data sets were constructed for each of the four subjectareas, the precision of the samples varies.
Scaling
Scale scores are reported for the EXPLORE English,Mathematics, Reading, and Science Tests, and for theUsage/Mechanics and Rhetorical Skills subscores. AComposite score, calculated by averaging over the four testscores and rounding to an integer, is also reported. Becausesubscores and test scores were scaled separately, there isno arithmetic relationship between subscores and the testscores. The Usage/Mechanics and Rhetorical Skills sub-scores will not necessarily sum to the English Test score.
The Score Scale. Scale scores for the four tests and theComposite range from a low of 1 to a high of 25. Scalescores for the subscores range from 1 to 12.
The scores reported for the four EXPLORE tests areapproximately on the same scale as the scores on the corre-sponding tests of the PLAN battery (ACT, 1999). EXPLOREis intended to be a shorter and less difficult version of PLAN,and these testing programs have similar, although not identi-cal, content specifications. EXPLORE was designed primarilyfor eighth graders (although it is also used with ninthgraders), whereas PLAN is primarily for tenth graders. To
facilitate longitudinal comparisons between EXPLOREscores for eighth graders and PLAN scores for tenth graders,the score scales for EXPLORE were constructed with theconsideration that they be approximately on the same scaleas PLAN. Being “on the same scale” means that theEXPLORE test score obtained by an examinee can be inter-preted as approximately the PLAN test score the examineewould obtain if that examinee had taken PLAN at the time ofthe EXPLORE testing. If this property were exactly achieved,the mean EXPLORE and PLAN scale scores would be thesame for any given group of examinees.
The rationale for making the maximum EXPLORE scalescore lower than the maximum PLAN score was to leaveroom at the top of the scale for educational development thatoccurs between the eighth and tenth grades. The PLAN testsare intended to assess skills typically achieved by the tenthgrade. Some of these skills are not expected in the eighthgrade and are not assessed by EXPLORE. Making 25 themaximum scale score on the EXPLORE tests, rather than 32as for the PLAN tests, ensures that EXPLORE and PLAN arenot on the same scale at high values of the PLAN scale.
The PLAN scale was constructed to be approximately onthe same scale as the ACT. Even though EXPLORE andPLAN are approximately on the same scale, and PLAN andthe ACT are approximately on the same scale, it can not bestated that EXPLORE and the ACT are approximately on thesame scale. The approximate equality of the scales holds foradjacent batteries, but the EXPLORE and the ACT are toodisparate in subject matter and difficulty (eighth grade ver-sus twelfth grade) for the same-scale property to extendfrom EXPLORE directly to the ACT.
Table 4.4Precision of the Samples
Estimated standard Coefficient EffectiveGrade Analysis error of P(x) of variation sample size
8 English Scaling 0.031 262Mathematics Scaling 0.031 0.06 264Reading Scaling 0.032 252Science Scaling 0.032 238
9 0.038 0.05 172
10 English Scaling 0.019 679Mathematics Scaling 0.021 0.04 549Reading Scaling 0.027 331Science Scaling 0.029 295

23
The Scaling Process. For each of the four subject areas,the scaling test taken by both eighth- and tenth-grade exam-inees was used to link the EXPLORE scale to the PLANscale. A strong true score model was fit to the PLAN andEXPLORE number-correct score distributions for each test,and to the number-correct score distributions for the fourscaling tests. Estimates of the true score distributions wereused to compute scales (one for each EXPLORE test) thatwere close to the corresponding PLAN scales.
The score scales constructed for the four tests based onthe Fall 1999 data were first used operationally in the fall of2001. The score scales introduced in the fall of 2001 were dif-ferent from the score scales used prior to Fall 2001. Scoresreported for the four EXPLORE test scores from administra-tions prior to Fall 2001 are not interchangeable with scores
reported for administrations during or after the fall of 2001.Table 4.5 is a concordance relating scores on the originalscale (used in administrations prior to Fall 2001) to the cur-rent scale (used in Fall 2001 and later administrations).
EXPLORE was first administered operationally in 1992using scales that were developed in a special study con-ducted in that year. The scales for the four tests werereplaced in 2001, whereas the scales for the two subscoresremain those introduced in 1992. The subscore scales wereconstructed to have means of approximately 7 and standarderrors of measurement of approximately 1 for examinees inthe 1992 sample. A procedure described by Kolen (1988)was used to construct the scales. More complete descrip-tions of the 1992 scaling can be found in two previousEXPLORE Technical Manuals (1994 and 1997).
Table 4.5Original to New Scale Concordance
Original New scale scores Originalscale scalescore English Mathematics Reading Science Composite score
1 1 1 7 2 1 12 3 1 8 4 3 23 5 2 8 6 5 34 7 3 9 8 6 45 8 3 9 9 8 56 9 5 10 11 9 67 9 7 10 12 10 78 10 9 11 12 11 89 10 10 11 13 11 9
10 11 11 12 14 12 1011 12 12 12 15 13 1112 12 13 13 15 13 1213 13 14 13 15 14 1314 14 15 14 16 15 1415 15 15 14 17 15 1516 16 16 15 17 16 1617 17 17 15 18 17 1718 18 17 16 18 18 1819 18 18 17 19 18 1920 20 18 18 19 19 2021 22 19 19 20 20 2122 23 21 21 21 21 2223 23 23 22 22 22 2324 25 24 23 23 24 2425 25 25 25 25 25 25

Grade Minimum Median Maximum
8 67% 93% 100%
9 58% 89% 100%
Norms for the 2005 National Sample
The norms for EXPLORE tests are intended to representnational populations of eighth- and ninth-grade students.Nationally representative norming samples were obtainedusing the weighting process described previously.
The Norming
Sampling for the 2005 Norming Study
Data for the EXPLORE norming study were obtainedfrom two places: (a) the group of schools that used theEXPLORE test during the fall of 2005 and (b) a sample ofschools from among the nonusers of EXPLORE. A samplewas taken for both the eighth and ninth grades. For theschools in the sample, the students were given a completeEXPLORE battery. The data from the sample of nonuserschools were combined with the census information from theuser schools to create the norms. This was done for botheighth-grade fall norms and ninth-grade fall norms. Thenorms for the spring of Grade 8 were then calculated byinterpolation.
Because of the interpolation, it was advantageous to useeighth- and ninth-grade samples from the same schools. Ofcourse, some schools do not have both an eighth and a ninthgrade, so for each school contacted to participate in theGrade 8 study, a letter was sent to the district to try and geta Grade 9 school from the same district. Note that thismeans that some schools with a Grade 9 were more likely tobe chosen than others, depending on the number of eighth-
grade schools that feed into that ninth-grade school. It isunlikely that the chance of selection for ninth-grade schoolsvaried enough to affect the norms.
Sample Design. The sample design for the study was astratified cluster sample. The stratification variables are sizeof school and region of country. The cluster consists of allstudents at a particular school. The list of schools used wasobtained from the Market Data Retrieval EducationalDatabase in 2005. First, all schools that had orderedEXPLORE, either for the eighth or ninth grade, were deleted.The schools were separated into the strata, and a randomnumber was assigned to each school. The schools with thelowest random numbers were selected for invitation to thestudy. Because it was anticipated that many schools woulddecline the invitation, many more schools were invited thanwere needed for the study. The actual numbers that wereinvited, that agreed to participate, and that did participate areincluded in Table 4.6.
Data Editing. Data from the participating nonuserschools and from users were edited using the followingrules. A student record was excluded under any of the con-ditions listed below:1. The grade on the school header did not match the grade
level under study.2. The grade supplied by the student did not match the
grade level on the school header.3. The EXPLORE Composite score was not in a valid range.4. The student had special accommodations.5. The student was not fall tested.
24
Table 4.7Response Rates Within Schools
Table 4.6Response Rates by School
Invited Grade Number agreeing to participate Number in the final sample
4,4208 34 29
9 40 33

Under these rules, the eighth-grade norms are based onthe records from 3,002 students from 29 nonuser schoolsand 436,534 students from 3,411 user schools. The ninth-grade norms are based on records from 4,440 students from33 nonuser schools and 154,768 students from 718 userschools.
Weighting. For the norming process, each individual stu-dent record is weighted according to its proportion in thepopulation relative to the proportion in the sample. The goalof the weighting is to make the sample representative of thepopulation, and to adjust for nonresponse. In Grade 8, theweight was the product of three terms:
Weight (i,j) = · · I(nonuser),
whereMj = the total number of schools in the population in
stratum j,mj = the total number of schools in the sample in
stratum j,Nij = the total number of students in school i in stratum j,nij = the sample number of students in school i in
stratum j,NU = the total number of nonuser schools,nu = the number of nonuser schools in the sample, andI(nonuser) is an indicator function that is equal to 1 fornonusers and 0 for users.
Note that the third component of the weight is equal to 1 foruser schools, as there is no sample to adjust for.
For Grade 9, the weights were the same, but a fourthcomponent was added, to adjust for an imbalance in thesample with respect to public and private schools. Thus, theweight for a student in Grade 9 is given by
Weight (i,j) = · · I(nonuser) ·
I(private) + I(public) ,
wherePR = percentage of students in private schools in the
population,pr = percentage of students in private schools in the
sample,PU = percentage of students in public schools in the
population,pu = percentage of students in public schools in the
population,I(private) is an indicator function that is equal to 1 for students in private schools and 0 otherwise, and I(public) is an indicator function that is equal to 1 for students in public schools and 0 otherwise.
Nonresponse and Bias. There are two basic types ofnonresponse in this study: nonresponse by schools andnonresponse by students. Nonresponse by schools occursbecause not every school contacted agrees to participate.Nonresponse by students occurs because not every studentat the given grade level in the school takes the test. Bias canoccur due to nonresponse if the schools or students who donot respond are different than the schools or students whodo, with regard to test scores. Table 4.6 gives the responserates for schools, which, as is typical, are quite low. Table 4.7gives the response rates within schools. These are quitehigh, typically over 90%. Therefore, bias due to nonresponsewithin schools is unlikely to be a problem. Bias due to nonresponse at the school level was potentially more seri-ous. To allow for this, various demographic variables werechecked to see if the sample appeared representative. If itwas not, then an adjustment was made. As previously men-tioned, the Grade 9 sample was adjusted to correct for animbalance in the public/private school mix. The demographicsummary is given in Tables 4.8 and 4.9.
Precision Estimates. Based on the sample value, stan-dard errors for proportions can be calculated, and those forthe eighth- and ninth-grade median scores are given in Table4.10. Standard errors for scores other than the medianwould be smaller. The standard error was based on theComposite score; standard errors for the subject area testswould be similar.
Norming Results. Scale score summary statistics, aver-age standard errors of measurement (SEM), and reliabilitiesfor examinees in the 2005 nationally representative normingsample of fall-tested eighth graders and ninth graders aregiven in Table 4.11. No data were collected on spring-testedeighth graders. However, assuming that academic growthbetween fall of the eighth grade and fall of the ninth grade islinear, and that the three months of summer count as onlyone month, summary statistics for spring-tested eighthgraders were estimated and also are presented in Table 4.11.This table does not contain estimates of the standard errorsof measurement or reliability for Spring eighth graders,because data were not available.
Data from the national sample were used to develop per-cents-at-or-below for the four EXPLORE test scores, theComposite score, and the two subscores. The percent-at-or-below corresponding to a scale score is defined as the per-cent of examinees with scores equal to or less than the scalescore. Tables 4.12, 4.13, and 4.14 contain percents-at-or-below for the EXPLORE test scores, subscores, andComposite score. Table 4.12 contains the norms (i.e., thepercents-at-or-below) for fall eighth-grade students basedon the 2005 national sample of fall eighth graders. Table4.13 presents the norms for spring eighth-grade students.The spring eighth-grade norms are interpolated valuesobtained from the 2005 national samples of fall eighth-gradestudents and fall ninth-grade students. Table 4.14 containsthe norms for fall ninth-grade students based on the 2005national sample of fall ninth-grade students.
PU___pu
PR___pr
NU___nu
Nij___nij
Mj___mj
NU___nu
Nij___njj
Mj___mj
25

26
Table 4.8Demographic Characteristics for Norming Sample and Populationa
Grade 8
aPopulation percentages for gender and race come from the United StatesDepartment of Education, Digest of Education Statistics, 2002. Population per-centages for school affiliation and geographic region come from the Market DataRetrieval Educational Database, 2005.
CategorySample
percentagePopulation percentage
Gender
Male 50 50
Female 50 50
Racial/Ethnic Origin
African American/Black 24 17
American Indian/Alaska Native 2 1
Caucasian American/White 53 60
Hispanic 4 17
Asian American 6 4
Other/Multiracial/Prefer Not to Respond 12
School Affiliation
Private 10 5
Public 90 95
Geographic Region
East 38 39
Midwest 26 25
Southwest 12 12
West 24 24
An examinee’s standing on different tests should be com-pared by using the percents-at-or-below shown in the normstables and not by using scale scores. The reason for prefer-ring percents-at-or-below for such comparisons is that thescales were not constructed to ensure that, for example, ascale score of 6 on the English Test is comparable to a 6 onthe Mathematics, Reading or Science Tests. In contrast,examinee percents-at-or-below on different tests indicatestandings relative to the same comparison group.
Even comparison of percents-at-or-below does not permitcomparison of standing in different skill areas in anyabsolute sense. The question of whether a particular exam-inee is stronger in science reasoning than in mathematics,assessed by the corresponding tests, can be answered onlyin relation to reference groups of other examinees. Whetherthe answer is “yes” or “no” can depend on the group.
Estimated PLAN Composite Score Ranges. The dataused to construct the first set of estimated PLAN Compositescore ranges consists of scores for eighth-grade examineeswho were administered EXPLORE in fall 2003 as eighthgraders and who took PLAN in fall 2005 as sophomores. Thisdata set contained 194,355 examinees. Of the examineeswho took EXPLORE in the fall of 2003 only examinees who
took PLAN in fall 2005 as sophomores were includedbecause the estimated PLAN Composite score interval isdefined to refer to the score that an examinee would obtain inthe fall of his or her sophomore year.
Table 4.15 contains the bivariate frequencies of EXPLOREand PLAN Composite scores for the 194,355 examinees. Therows of Table 4.15 give EXPLORE Composite scores and thecolumns give PLAN Composite scores. For example, the cellcorresponding to an EXPLORE Composite score of 15 and aPLAN Composite score of 17 contains the number 5596. Thismeans of the 194,355 examinees, 5,596 received anEXPLORE Composite score of 15 in the fall of 2003 and aPLAN Composite score of 17 in Fall 2005.
A second table of bivariate frequencies, for examinees tak-ing EXPLORE in Grade 9, contains the data used for the sec-ond set of estimated PLAN Composite score ranges andconsists of scores for examinees who were administeredEXPLORE in Grade 9 and PLAN one year later in Grade 10 inthe fall of (a) 2002 and 2003, (b) 2003 and 2004, or (c) 2004and 2005, respectively. Three years were combined to get anadequate sample size for ninth-grade EXPLORE examinees.These results are shown in Table 4.16.
(Text continues on p. 35.)

27
Table 4.9Demographic Characteristics for Norming Sample and Populationa
Grade 9
aPopulation percentages for gender and race come from the United StatesDepartment of Education, Digest of Education Statistics, 2002. Population per-centages for school affiliation and geographic region come from the Market DataRetrieval Educational Database, 2005.
CategorySample
percentagePopulation percentage
Gender
Male 50 50
Female 50 50
Racial/Ethnic Origin
African American/Black 14 17
American Indian/Alaska Native 1 1
Caucasian American/White 64 60
Hispanic 6 17
Asian American 6 4
Other/Multiracial/Prefer Not to Respond 9
School Affiliation
Private 10 5
Public 90 95
Geographic Region
East 41 39
Midwest 22 25
Southwest 14 12
West 23 24
Grade Estimated standard error
8 0.054
9 0.030
Table 4.10Estimated Standard Errors for Proportions

28
English
Form A Form B Combined
Statistics Fall 8 Fall 9 Fall 8 Fall 9 Spring 8a
Mean 14.13 15.52 14.77 15.22 14.87
SD 4.12 4.28 4.31 4.62 4.27
Skewness 0.41 0.18 0.29 0.23 0.29
Kurtosis 2.83 2.37 2.65 2.37 2.54
SEM 1.57 1.64 1.64 1.65 —
Reliability .85 .85 .85 .87 —
Table 4.11Scale Score Statistics for EXPLORE Tests and Subscores
Mathematics
Form A Form B Combined
Statistics Fall 8 Fall 9 Fall 8 Fall 9 Spring 8a
Mean 15.12 16.29 15.04 15.60 15.69
SD 4.06 4.09 3.68 4.00 4.09
Skewness –0.10 –0.28 –0.49 –0.35 –0.20
Kurtosis 3.33 3.61 4.17 4.05 3.46
SEM 1.71 1.65 1.55 1.61 —
Reliability .82 .84 .82 .84 —
Reading
Form A Form B Combined
Statistics Fall 8 Fall 9 Fall 8 Fall 9 Spring 8a
Mean 13.80 15.30 14.22 14.87 14.58
SD 3.66 4.23 3.60 4.14 4.01
Skewness 0.91 0.49 0.70 0.56 0.69
Kurtosis 3.58 2.52 3.16 2.62 2.91
SEM 1.52 1.75 1.50 1.57 —
Reliability .83 .83 .83 .86 —
(table continues)

29
Science
Form A Form B Combined
Statistics Fall 8 Fall 9 Fall 8 Fall 9 Spring 8a
Mean 15.86 16.85 16.28 16.72 16.38
SD 2.93 3.16 3.23 3.58 3.11
Skewness 0.15 –0.03 0.06 –0.09 0.08
Kurtosis 4.36 4.10 3.88 3.74 4.09
SEM 1.39 1.44 1.42 1.45 —
Reliability .77 .79 .81 .84 —
Table 4.11 (continued)Scale Score Statistics for EXPLORE Tests and Subscores
Usage/Mechanics
Form A Form B Combined
Statistics Fall 8 Fall 9 Fall 8 Fall 9 Spring 8a
Mean 7.38 7.99 7.55 7.74 7.69
SD 2.24 2.18 2.24 2.34 2.23
Skewness –0.35 –0.61 –0.52 –0.52 –0.48
Kurtosis 2.68 3.13 2.95 2.81 2.86
SEM 1.04 1.01 1.05 1.03 —
Reliability .78 .78 .78 .80 —
Rhetorical Skills
Form A Form B Combined
Statistics Fall 8 Fall 9 Fall 8 Fall 9 Spring 8a
Mean 6.86 7.62 7.35 7.49 7.27
SD 2.14 2.13 2.14 2.24 2.16
Skewness 0.19 –0.04 –0.01 –0.02 0.05
Kurtosis 2.48 2.26 2.35 2.33 2.32
SEM 1.13 1.11 1.10 1.10 —
Reliability .72 .73 .74 .76 —
aThe moments for Spring Grade 8 were based on interpolation between the distri-butions for Fall Grade 8 and Fall Grade 9. Data were not available for calculatingreliabilities or standard errors of measurement for Spring.

30
Scale score English Mathematics Reading Science
Usage/Mechanics
RhetoricalSkills Composite
Scale score
25 100 100 100 100 100 2524 99 98 99 99 99 2423 98 97 98 98 99 2322 96 96 97 97 98 2221 93 95 95 96 96 2120 90 92 94 94 94 2019 86 89 91 90 90 1918 83 83 88 84 85 1817 78 75 85 74 79 1716 73 64 79 60 71 1615 67 53 73 45 61 1514 59 41 64 30 50 1413 50 31 54 18 37 1312 39 23 42 10 100 100 24 1211 28 17 29 5 99 99 14 1110 18 12 16 3 93 94 7 109 10 9 7 1 81 85 3 98 5 6 2 1 65 75 1 87 2 4 1 1 48 63 1 76 1 3 1 1 33 47 1 65 1 2 1 1 20 28 1 54 1 1 1 1 11 12 1 43 1 1 1 1 5 4 1 32 1 1 1 1 2 1 1 21 1 1 1 1 1 1 1 1
Mean 14.2 15.1 13.8 15.9 7.4 6.9 14.9 MeanSD 4.1 4.0 3.7 3.0 2.2 2.1 3.3 SD
Table 4.12EXPLORE National Norms for Fall Grade 8

31
Scale score English Mathematics Reading Science
Usage/Mechanics
RhetoricalSkills Composite
Scale score
25 100 100 100 100 100 2524 99 97 98 99 99 2423 98 96 96 97 99 2322 95 94 95 96 97 2221 91 92 93 94 94 2120 87 90 90 91 91 2019 83 85 87 87 86 1918 78 78 83 79 80 1817 73 69 78 67 72 1716 67 58 72 53 64 1615 60 46 65 38 53 1514 52 35 56 25 42 1413 43 26 47 15 31 1312 33 19 36 9 100 100 20 1211 23 14 24 5 98 99 12 1110 14 10 14 3 91 92 6 109 8 7 6 1 78 82 2 98 4 5 2 1 60 69 1 87 2 4 1 1 42 56 1 76 1 2 1 1 28 40 1 65 1 1 1 1 17 23 1 54 1 1 1 1 9 9 1 43 1 1 1 1 5 3 1 32 1 1 1 1 2 1 1 21 1 1 1 1 1 1 1 1
Mean 14.9 15.7 14.6 16.4 7.7 7.3 15.5 MeanSD 4.3 4.1 4.0 3.1 2.2 2.2 3.5 SD
Table 4.13EXPLORE National Norms for Spring Grade 8

32
Scale score English Mathematics Reading Science
Usage/Mechanics
RhetoricalSkills Composite
Scale score
25 100 100 100 100 100 2524 99 97 97 98 99 2423 97 95 95 97 98 2322 93 93 92 95 96 2221 89 90 90 93 92 2120 84 87 86 89 88 2019 79 81 82 83 81 1918 74 74 78 73 74 1817 68 63 72 61 66 1716 61 52 65 46 56 1615 54 40 57 32 46 1514 45 29 48 20 35 1413 36 21 39 12 25 1312 27 15 30 7 100 100 16 1211 18 11 20 4 98 98 9 1110 11 8 12 2 90 90 5 109 6 6 6 1 74 78 2 98 3 4 2 1 55 64 1 87 1 3 1 1 37 49 1 76 1 2 1 1 23 33 1 65 1 1 1 1 13 18 1 54 1 1 1 1 7 7 1 43 1 1 1 1 4 2 1 32 1 1 1 1 2 1 1 21 1 1 1 1 1 1 1 1
Mean 15.5 16.3 15.3 16.9 8.0 7.6 16.1 MeanSD 4.3 4.1 4.2 3.2 2.2 2.1 3.5 SD
Table 4.14EXPLORE National Norms for Fall Grade 9

33
Tabl
e 4.
15O
bse
rved
Co
un
ts a
nd
Pro
bab
iliti
es o
f C
over
age
EX
PL
OR
E F
all G
rad
e 8
and
PL
AN
Fal
l Gra
de
10
1 2 3 4 5 6 7 8 9 10 11 12 13 14 15 16 17 18 19 20 21 22 23 24 25
12
34
56
78
910
1112
1314
1516
1718
1920
2122
2324
2526
2728
2930
3132
Row
Row
Pro
b.To
tal
Hits
Cov
.
1943
5514
6824
.76
PLA
N
EXPLORE
00
00
00
00
00
00
00
00
00
00
00
00
00
00
00
00
00
.00
00
00
00
00
00
00
00
00
00
00
01
00
00
00
00
00
10
.00
00
00
00
00
00
00
10
00
00
00
00
00
00
00
00
00
10
.00
00
00
00
00
00
00
00
00
00
00
00
00
00
00
00
00
00
.00
00
00
01
00
01
22
50
01
01
00
00
00
00
00
00
00
1310
.77
00
00
01
00
24
1613
125
20
00
00
00
00
00
00
00
00
5545
.82
00
00
00
03
916
4258
5623
47
34
10
00
00
00
00
00
00
226
172
.76
00
01
00
33
1545
137
231
205
9642
163
64
14
10
00
00
00
00
081
361
8.7
6
00
00
01
518
3410
931
556
159
629
012
558
348
109
31
12
10
10
00
00
2182
1581
.72
10
00
01
310
4515
347
695
312
5789
138
519
866
3414
85
01
00
00
00
00
045
0135
77.7
9
00
00
15
211
5016
656
114
2123
4720
0712
8557
322
997
4418
82
00
00
00
00
00
8827
7060
.80
00
00
01
512
4312
142
813
5229
1438
0231
6318
6485
030
211
537
236
42
00
01
00
00
1504
511
743
.78
00
00
01
34
1672
296
835
2181
4169
4968
4149
2452
989
331
8449
219
82
00
00
00
020
639
1573
8.7
6
00
00
00
21
549
139
413
1135
2514
4531
5586
4723
2607
1063
319
9838
157
30
20
10
00
2325
117
447
.75
00
00
00
03
514
6519
443
610
3525
3745
7555
9646
8326
7410
5937
312
735
74
11
00
00
023
424
1752
8.7
5
00
00
00
11
14
2083
184
440
1043
2335
4055
5195
4314
2496
1076
392
131
306
80
00
00
021
815
1606
0.7
4
00
00
00
10
24
1440
7717
436
693
520
4536
3143
8736
9122
5110
8037
812
238
144
10
00
019
255
1396
0.7
3
00
00
00
00
05
711
4562
151
340
815
1771
2993
3503
2946
1940
973
438
143
4916
12
00
016
211
1235
5.7
6
00
00
00
10
01
48
1525
4811
128
567
814
7722
1125
6222
4415
5292
442
315
852
185
00
012
802
1004
6.7
8
00
00
00
10
00
08
38
1836
7921
357
310
4815
6118
7716
8412
0873
238
314
756
240
10
9660
7378
.76
00
00
00
00
00
52
15
1013
2565
148
358
715
1023
1220
1147
958
629
335
158
4216
10
6876
5063
.74
00
00
00
00
00
02
11
43
718
4999
203
394
590
770
747
636
473
273
108
282
144
0932
16.7
3
01
00
00
00
00
00
00
30
12
1522
6111
421
736
444
643
343
132
820
275
180
2733
2002
.73
00
00
00
00
00
00
00
01
00
36
924
4187
145
209
233
230
161
8829
112
6797
8.7
7
00
00
00
00
00
10
00
00
00
00
02
88
1541
6077
6446
243
349
247
.71

34
1 2 3 4 5 6 7 8 9 10 11 12 13 14 15 16 17 18 19 20 21 22 23 24 25
12
34
56
78
910
1112
1314
1516
1718
1920
2122
2324
2526
2728
2930
3132
Row
Row
Pro
b.To
tal
Hits
Cov
.
1734
7213
2153
.76
PLA
N
EXPLORE
00
00
00
00
00
00
00
00
00
00
00
00
00
00
00
00
00
.00
00
00
00
00
00
00
00
00
00
00
00
00
00
00
00
00
00
.00
00
00
00
00
00
10
00
00
00
00
00
00
00
00
00
00
11
1.00
00
00
00
00
11
30
00
00
10
00
00
00
00
00
00
00
65
.83
00
00
11
11
13
23
30
01
00
00
00
00
00
00
00
00
1710
.59
00
10
00
11
36
2116
42
11
01
00
00
00
00
00
00
00
5846
.79
00
00
00
14
1334
7279
3212
43
00
00
00
00
00
00
00
00
254
198
.78
00
01
01
27
2883
166
225
153
4811
45
01
01
00
00
00
00
00
073
650
2.6
8
00
00
26
23
4417
842
153
740
713
836
157
52
31
03
10
00
00
00
018
1111
80.6
5
00
00
11
314
6320
458
399
991
142
114
547
215
32
10
12
00
00
00
00
3427
2697
.79
00
02
04
49
7823
969
815
1418
7613
4554
916
654
1012
43
01
00
00
00
00
065
6854
33.8
3
01
00
00
311
4817
466
115
8429
3529
9017
4660
820
252
153
36
00
02
10
00
00
1104
581
70.7
4
00
00
01
15
2410
033
511
1826
6643
3138
4820
6967
518
377
269
64
00
10
10
00
015
480
1196
3.7
7
00
00
01
04
643
147
475
1460
3213
4958
4223
2129
792
207
5627
107
62
20
00
00
017
768
1385
4.7
8
00
00
00
03
720
7717
859
715
9935
1550
1541
4020
6574
119
466
297
20
20
00
00
018
257
1426
9.7
8
00
00
00
11
510
3682
207
605
1640
3461
4691
3950
2134
762
228
6121
55
10
00
00
017
906
1374
2.7
7
00
00
00
01
47
2049
8520
955
215
8833
1541
8834
5719
6579
724
678
244
11
00
00
016
591
1254
8.7
6
00
00
11
01
04
1222
2867
183
604
1563
3001
3587
2976
1749
774
300
8627
84
00
00
014
998
1131
3.7
5
00
00
00
00
12
414
1426
9021
558
014
3126
0030
6924
2015
3772
333
495
2512
12
00
013
195
9626
.73
00
00
00
00
11
46
1010
1656
191
588
1247
2021
2390
2082
1337
783
349
128
5011
30
00
1128
486
13.7
6
00
00
00
00
00
23
79
915
4414
047
710
0315
7217
8116
2011
7966
435
616
043
93
00
9096
6816
.75
00
00
00
10
10
11
22
24
1242
107
324
677
1024
1257
1208
950
632
350
141
514
00
6793
5071
.75
00
00
10
00
11
11
20
21
47
2978
202
387
669
792
842
693
498
292
124
465
046
7834
94.7
5
00
00
00
00
00
00
01
11
02
58
4594
206
284
412
454
406
363
237
9318
026
3019
19.7
3
00
00
00
01
00
00
10
00
00
01
47
2040
7712
113
916
817
085
363
873
683
.78
Tabl
e 4.
16O
bse
rved
Co
un
ts a
nd
Pro
bab
iliti
es o
f C
over
age
EX
PL
OR
E F
all G
rad
e 9
and
PL
AN
Fal
l Gra
de
10

35
The estimated PLAN Composite score ranges were con-structed based on the bivariate distribution of EXPLORE andPLAN Composite scores. A PLAN Composite score rangefor each EXPLORE Composite score was developed suchthat the interval contained approximately 75% of the PLANComposite scores actually earned by students with thatEXPLORE Composite score.
For example, in the sample of 194,355 students who tookEXPLORE in the fall of their eighth-grade year and PLAN inthe fall of tenth grade, 23,424 earned an EXPLOREComposite score of 15. When these 23,424 students tookPLAN in Grade 10, their actual PLAN Composite scoresranged from 8 to 27; 75% of them earned PLAN scores inthe range of 16 to 19.
The resulting score ranges are reported in Table 4.17. Forexample, Table 4.17 indicates that, for an EXPLOREComposite score of 15, the lower limit of the estimated
PLAN Composite score range is 16 and the upper limit is 19.The width of the ranges varies with the EXPLOREComposite score. The ranges are widest at the top and bot-tom. However, there were few data at the bottom of thescale. Table 4.17 is appropriate for examinees who takeEXPLORE in the fall of eighth grade.
The score ranges are presented in Table 4.15 as shadedcells. The numbers in the column labeled “Row Total” givethe total number of examinees for the EXPLORE Compositescore corresponding to that row. The column labeled “RowHits” gives the number of examinees whose obtained PLANComposite score was within the estimated score range inthat row (the sum of the numbers in the shaded cells). Thelast column, labeled “Prob. Cov.,” is the proportion of theexaminees in each row whose obtained PLAN Compositescore was within their estimated PLAN Composite scorerange (this is referred to as the probability of coverage).
Table 4.17Estimated PLAN Grade 10 Composite Score
Intervals for EXPLORE Grade 8 Composite Scores
PLAN intervalsEXPLOREscore Low score High score
1 8 112 8 113 8 114 8 115 10 136 10 137 10 138 10 139 10 13
10 11 1411 12 1512 13 1613 14 1714 15 1815 16 1916 17 2017 18 2118 19 2319 19 2320 20 2421 21 2522 23 2723 24 2824 25 2925 27 30
Table 4.18Estimated PLAN Grade 10 Composite Score
Intervals for EXPLORE Grade 9 Composite Scores
PLAN intervalsEXPLOREscore Low score High score
1 8 122 8 123 8 124 8 125 8 126 9 127 9 128 9 129 9 12
10 10 1311 11 1412 11 1413 12 1514 13 1615 14 1716 15 1817 16 1918 18 2119 19 2220 20 2421 21 2522 22 2623 23 2724 24 2825 26 30
(Text continued from p. 26.)

36
These probabilities of coverage are reasonably constantacross EXPLORE Composite scores (the major discrep-ancies occur at EXPLORE Composite scores where therewere few examinees). As reported at the bottom ofTable 4.15, the proportion of all examinees whose estimatedPLAN Composite score range contained their obtainedPLAN Composite score (the overall probability of coverage)was .76.
A similar analysis was conducted for students who tookEXPLORE in the fall of Grade 9 and who took PLAN in thefall of Grade 10. Tables 4.16 and 4.18 present the results.
Since both EXPLORE and PLAN are designed to be curriculum-based testing programs, some students will falloutside their estimated PLAN Composite score range. If students do not maintain good academic work in school,their actual PLAN Composite scores may fall short of theirestimated score ranges. Conversely, some students whoimprove their academic performance may earn PLANComposite scores higher than their estimated score ranges.
Equating
Even though each form of the EXPLORE tests is con-structed to adhere to the same content and statistical speci-fications, the forms may be slightly different in difficulty. Tocontrol for these differences, subsequent forms are equatedto earlier forms and the scores reported to examinees arescale scores that have the same meaning regardless of theparticular form administered to examinees. Thus, scalescores are comparable across test forms and test dates.
Equating is conducted using a study in which each formis administered to approximately 2,000 examinees. Theexaminees in this sample are administered a spiraled set offorms—the new forms (“n – 1” of them) and one anchorform that has already been equated to previous forms.(Initially, of course, the anchor form is the form used toestablish the score scale.) This spiraling technique, in whichevery nth examinee receives the same form of the test,results in randomly equivalent groups taking the forms. Theuse of randomly equivalent groups is an important feature ofthe equating procedure and provides a basis for the largedegree of confidence in the continuity of scores.
Scores on the alternate forms are equated to the scorescale using equipercentile equating methodology. Inequipercentile equating, a score on Form X of a test and ascore on Form Y are considered to be equivalent if they havethe same percentile rank in a given group of examinees. Theequipercentile equating results are subsequently smoothedusing an analytic method described by Kolen (1984) toestablish a smooth curve, and the equivalents are roundedto integers. The conversion tables that result from thisprocess are used to transform raw scores on the new formsto scale scores.
The equipercentile equating technique is applied to theraw scores of each of the four tests for each form separately.The Composite score is not directly equated across forms.Instead, the Composite is calculated by rounding theunweighted average of the scale scores for the four equatedtests. The subscores are also separately equated using theequipercentile method. Note, in particular, that the equatingprocess does not lead to the English Test score being a sumof the two subscores.
Through the equipercentile equating method, it is possi-ble for an examinee answering all of the items correctly on aparticular test to receive a scale score less than the maxi-mum score of 25. Similarly, an examinee who answers all ofthe items correctly on a subscore might receive a scalescore less than the maximum score of 12 for that subscore.By allowing an all-correct raw score to convert to a scalescore less than the maximum, scale scores from differentEXPLORE forms are kept more comparable. EXPLORE testscores must be as comparable as possible from year to yearso that they accurately reflect how school, school district, orstatewide student achievement levels vary from year to year.
Reliability
Reliability, Measurement Error, and Effective Weights
Some degree of inconsistency or error is potentially con-tained in the measurement of any cognitive characteristic.An examinee administered one form of a test on one occa-sion and a second, parallel form on another occasion likelywould earn somewhat different scores on the twoadministrations. These differences might be due to theexaminee or the testing situation, such as differential moti-vation or differential levels of distractions on the two testings.Alternatively, these differences might result from attemptingto infer the examinee’s level of skill from a relatively smallsample of items.
Reliability coefficients are estimates of the consistency oftest scores. They typically range from zero to one, with val-ues near one indicating greater consistency and those nearzero indicating little or no consistency.
The standard error of measurement (SEM) is closelyrelated to test reliability. The standard error of measurementsummarizes the amount of error or inconsistency in scoreson a test. The original score scales for EXPLORE weredeveloped to have approximately constant standard errorsof measurement for all true scale scores (i.e., the conditionalstandard error of measurement as a function of true scalescore was constant). For the new scales, the SEM may varyacross the range of EXPLORE scale scores. The averageSEM is the average of the conditional standard errors ofmeasurement. If the distribution of measurement error isapproximated by a normal distribution, about two-thirds ofthe examinees can be expected to be mismeasured by lessthan 1 standard error of measurement.

��������x2 16
37
Figures 4.1 and 4.2 present the conditional standarderrors of measurement for the four tests and two subscoresas a function of true scale score for fall-tested eighth andninth graders. The minimum true scale score plotted isaround 5 for each test and around 2 for the two subscores.These are the lowest true scale scores plotted because onlya very small proportion of examinees would be expected tohave a true scale score lower than this for each test and sub-score. Some plots begin at higher scores because stableestimates could not be obtained at lower scores. Lines areplotted for every combination of form (A and B) and grade (8and 9). As can be seen, the estimated conditional standarderrors of measurement vary across the true score range.Values are generally between one and two score points in themiddle of the range. See Kolen, Hanson, and Brennan (1992)for details on the method used to produce these plots.
EXPLORE reliability coefficients and average standarderrors of measurement for the tests, subscores, andComposite are shown in Table 4.19 for the two forms andgrades. In all cases the data used to estimate the reliabilitiesand standard errors of measurement are weighted fre-quency distributions. Kuder-Richardson 20 (KR-20) internalconsistency reliability coefficients of raw scores are listedfirst. Scale score reliability coefficients and standard errorsof measurement are reported next. Scale score averagestandard errors of measurement were estimated using a fourparameter beta compound binomial model as described inKolen, Hanson, and Brennan (1992). The estimated scalescore reliability for test i (RELi) was calculated as
RELi = 1 – ,
where SEMi is the estimated scale score average standarderror of measurement and Si
2 is the observed scale scorevariance for test i.
The estimated standard error of measurement for theComposite (SEMc) was calculated as
SEMc =
where the summation is over the four tests. The estimatedreliability of the Composite (RELc) was calculated as
RELc = 1 –
where Sc2 is the observed variance of scores on the
Composite.
Scale scores from the four tests are summed and dividedby 4 in the process of calculating the Composite score. Thisprocess suggests that, in a sense, each test is contributingequally to the Composite. The weights used (.25, in thiscase) are often referred to as nominal weights.
Other definitions of the contribution of a test to a compos-ite may be more useful. Wang and Stanley (1970) describedeffective weights as an index of the contribution of a test toa composite. Specifically, the effective weights are definedas the covariance between a test score and the score on acomposite. These covariances can be summed over testsand then each covariance divided by their sum (i.e., thecomposite variance) to arrive at proportional effectiveweights. Proportional effective weights are referred to aseffective weights in the remainder of this discussion.
The covariances and effective weights are shown inTables 4.20 through 4.23. The values in the diagonals thatare not in brackets are the observed scale score variances(the diagonal values in brackets are the true scale scorevariances). With nominal weights of .25 for each test, theeffective weight for a test can be calculated by summing thevalues in the appropriate row that are not in brackets anddividing the resulting value by the sum of all covariancesusing the formula
(effective weight)i =
where covij is the observed covariance of test scores corre-sponding to row i and column j in the table. Effective weightsfor true scores, shown in brackets, are calculated similarly,with the true score variance [Si
2 · RELi] used in place of theobserved score variance.
The effective weights for the eighth and ninth graders arevery similar. The effective weights for English, Mathematics,and Reading are the largest of the effective weights. Theyare relatively high because they had the largest scale scorevariances and because their covariances with the other teststended to be the highest. These effective weights imply thatthese tests are somewhat more heavily weighted (relative tocomposite variance) in forming the Composite than theScience Test. Note that these effective weights are for thenationally representative samples and that the weights mightdiffer considerably from those for other examinee groups.
(Text continues on p. 43.)
∑jcovij________∑i∑jcovij
SEMc2
______Sc
2
∑i SEMi2
_________4
SEMi2
______Si
2

38
Figure 4.1. Conditional standard errors of measurement for EXPLORE test scores (figure continues).
Sta
ndar
d E
rror
of M
easu
rem
ent
True Scale Score
5 10 15 20 25
2.5
2.0
1.5
1.0
0.5
0.0
Conditional Standard Error of Measurement for English
Sta
ndar
d E
rror
of M
easu
rem
ent
True Scale Score
5 10 15 20 25
3.0
2.5
2.0
1.5
1.0
0.5
0.0
Conditional Standard Error of Measurement for Math
Sta
ndar
d E
rror
of M
easu
rem
ent
True Scale Score
5 10 15 20 25
2.5
2.0
1.5
1.0
0.5
0.0
Conditional Standard Error of Measurement for Reading
Form A Grade 8Form B Grade 8Form A Grade 9Form B Grade 9
Form A Grade 8Form B Grade 8Form A Grade 9Form B Grade 9
Form A Grade 8Form B Grade 8Form A Grade 9Form B Grade 9
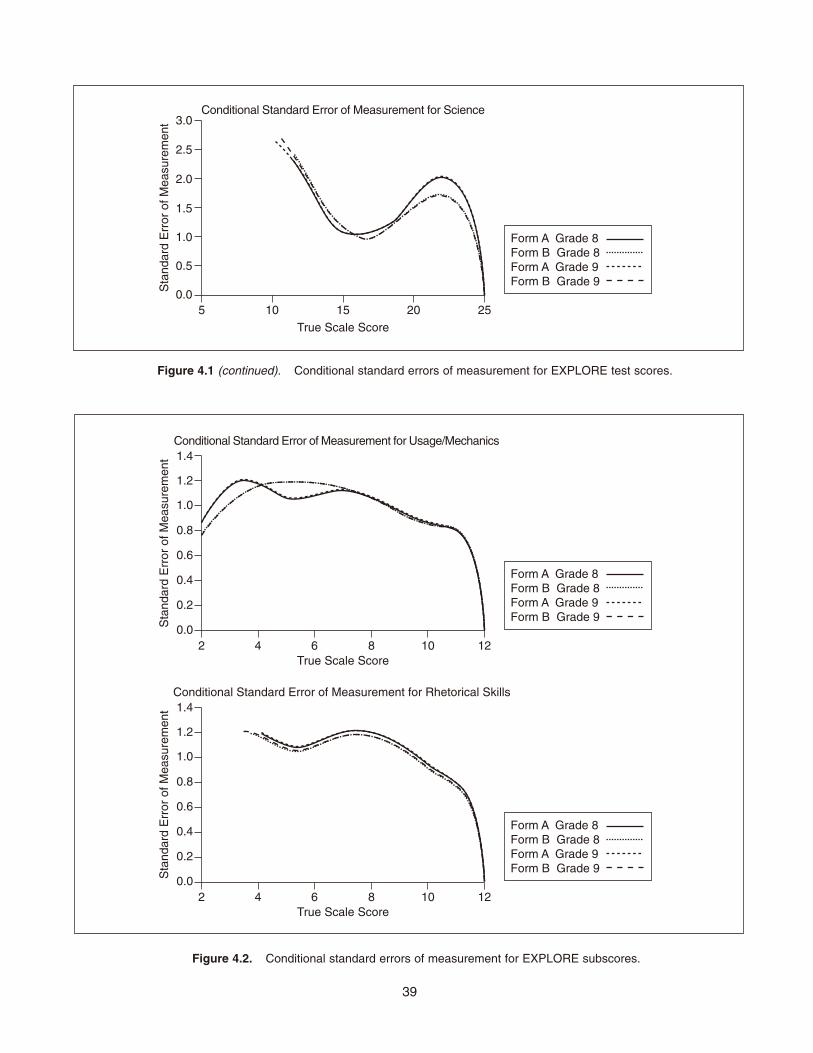
39
Figure 4.2. Conditional standard errors of measurement for EXPLORE subscores.
Figure 4.1 (continued). Conditional standard errors of measurement for EXPLORE test scores.
Sta
ndar
d E
rror
of M
easu
rem
ent
True Scale Score
5 10 15 20 25
3.0
2.5
2.0
1.5
1.0
0.5
0.0
Conditional Standard Error of Measurement for Science
Form A Grade 8Form B Grade 8Form A Grade 9Form B Grade 9
Sta
ndar
d E
rror
of M
easu
rem
ent
True Scale Score2 4 6 8 10 12
1.4
1.2
1.0
0.8
0.6
0.4
0.2
0.0
Conditional Standard Error of Measurement for Usage/Mechanics
Form A Grade 8Form B Grade 8Form A Grade 9Form B Grade 9
Form A Grade 8Form B Grade 8Form A Grade 9Form B Grade 9S
tand
ard
Err
or o
f Mea
sure
men
t
True Scale Score2 4 6 8 10 12
1.4
1.2
1.0
0.8
0.6
0.4
0.2
0.0
Conditional Standard Error of Measurement for Rhetorical Skills

40
Table 4.19Estimated Reliabilities and Standard Error of Measurement For EXPLORE Tests and Subscores
Usage/ RhetoricalStatistic English Mechanics Skills Mathematics Reading Science Composite
Form A Grade 8
Raw ScoresReliability .87 .81 .73 .84 .85 .83 —
Scale ScoresReliability .85 .78 .72 .82 .83 .77 .94SEM 1.57 1.04 1.13 1.71 1.52 1.39 0.78
Form A Grade 9
Raw ScoresReliability .88 .82 .76 .87 .87 .85 —
Scale ScoresReliability .85 .78 .73 .84 .83 .79 .95SEM 1.64 1.01 1.11 1.65 1.75 1.44 0.81
Form B Grade 8
Raw ScoresReliability .87 .80 .74 .86 .87 .86 —
Scale ScoresReliability .85 .78 .74 .82 .83 .81 .95SEM 1.64 1.05 1.10 1.55 1.50 1.42 0.77
Form B Grade 9
Raw ScoresReliability .88 .81 .77 .87 .89 .88 —
Scale ScoresReliability .87 .80 .76 .84 .86 .84 .95SEM 1.65 1.03 1.10 1.61 1.57 1.45 0.79

41
Table 4.20Scale Score Covariances and Effective Weights for Form A Grade 8
(Numbers in brackets relate to true scores.)
English Mathematics Reading Science
Number of items 40 30 30 28Proportion of total EXPLORE items .31 .23 .23 .22
English 16.93 11.75 11.65 8.50[14.47]
Mathematics 11.75 16.46 10.05 8.08[13.54]
Reading 11.65 10.05 13.37 7.53[11.06]
Science 8.50 8.08 7.53 8.59[6.65]
Effective weight .29 .27 .25 .19[.29] [.27] [.25] [.19]
Reliability .85 .82 .83 .77
Table 4.21Scale Score Covariances and Effective Weights for Form A Grade 9
(Numbers in brackets relate to true scores.)
English Mathematics Reading Science
Number of items 40 30 30 28Proportion of total EXPLORE items .31 .23 .23 .22
English 18.32 12.64 14.11 9.84[15.63]
Mathematics 12.64 16.75 11.90 9.09[14.02]
Reading 14.11 11.90 17.88 9.93[14.81]
Science 9.84 9.09 9.93 9.96[7.90]
Effective weight .28 .25 .27 .20[.28] [.25] [.27] [.20]
Reliability .85 .84 .83 .79

42
Table 4.22Scale Score Covariances and Effective Weights for Form B Grade 8
(Numbers in brackets relate to true scores.)
English Mathematics Reading Science
Number of items 40 30 30 28Proportion of total EXPLORE items .31 .23 .23 .22
English 18.57 10.74 11.25 10.03[15.85]
Mathematics 10.74 13.57 8.38 7.84[11.13]
Reading 11.25 8.38 12.95 8.50[10.73]
Science 10.03 7.84 8.50 10.42[8.44]
Effective weight .30 .24 .24 .22[.30] [.24] [.24] [.22]
Reliability .85 .82 .83 .81
Table 4.23Scale Score Covariances and Effective Weights for Form B Grade 9
(Numbers in brackets relate to true scores.)
English Mathematics Reading Science
Number of items 40 30 30 28Proportion of total EXPLORE items .31 .23 .23 .22
English 21.34 12.88 14.35 12.01[18.61]
Mathematics 12.88 15.96 10.93 10.23[13.37]
Reading 14.35 10.93 17.15 11.08[14.68]
Science 12.01 10.23 11.08 12.82[10.70]
Effective weight .29 .24 .25 .22[.29] [.24] [.25] [.22]
Reliability .87 .84 .86 .84
43
Validity
Overview
According to the Standards for Educational andPsychological Testing (AERA, APA, & NCME, 1999), “validityrefers to the degree to which evidence and theory support theinterpretations of test scores entailed by proposed use oftests” (p. 9). Arguments for the validity of an intended infer-ence made from a test may contain logical, empirical, and the-oretical components. A distinct validity argument is needed foreach intended use of a test. In this section, validity issues arediscussed for one of the most common interpretations anduses of EXPLORE: measuring eighth-grade students’ educa-tional achievement in particular subject areas.
Measuring Educational Achievement
Content Validity for EXPLORE Scores. The EXPLOREtests are designed to measure students’ problem-solvingskills and knowledge in particular subject areas. The useful-ness of EXPLORE scores for this purpose provides thefoundation for validity arguments for more specific uses(e.g., program evaluation).
The fundamental idea underlying the development anduse of EXPLORE tests is that the best way to determine stu-dent preparedness for further education and careers is tomeasure as directly as possible the knowledge and skills stu-dents will need in those settings. Tasks presented in the testsmust therefore be representative of scholastic tasks. Theymust be intricate in structure, comprehensive in scope, andsignificant in their own right, rather than narrow or artificialtasks that can be defended for inclusion in the tests solely onthe basis of their statistical correlation with a criterion. In thiscontext, content-related validity is particularly significant.
The EXPLORE tests contain a proportionately large num-ber of complex problem-solving skills. The tests are orientedtoward major areas of middle school and junior-high school
instructional programs, rather than toward a factorial defini-tion of various aspects of intelligence. Thus, EXPLOREscores, subscores, and skill statements based on the ACTCollege Readiness Standards are directly related to studenteducational progress and can be readily understood andinterpreted by instructional staff, parents, and students.
As described earlier in this chapter, the specific knowl-edge and skills selected for inclusion in EXPLORE weredetermined through a detailed analysis of three sources ofinformation. First, the objectives for instruction for Grades 6through 9 were obtained for all states in the United Statesthat had published such objectives. Second, textbooks onstate-approved lists for courses in Grades 6 through 8 werereviewed. Third, educators at the secondary (Grades 7through 12) and postsecondary levels were consulted todetermine the knowledge and skills taught in Grades 6through 8 prerequisite to successful performance in highschool. These three sources of information were analyzed todefine a scope and sequence (i.e., test content specifica-tions) for each of the areas measure by EXPLORE. Thesedetailed test content specifications have been developed toensure that the test content is representative of current middle-school and junior-high curricula. All forms arereviewed to ensure that they match these specifications.Throughout the item development process there is an ongo-ing assessment of the content validity of the tests.
EXPLORE Test Scores. This section provides evi-dence that the EXPLORE tests and subtests measureseparate and distinct skills. The data included all falleighth-, spring eighth-, and fall ninth-grade 2005–2006EXPLORE test takers. Correlations were developed for allpossible pairs of tests. As shown in Table 4.24, the scalescores on the four tests have correlations in the range of .65to .75 for fall-tested eighth-grade students, .65 to .73 forspring-tested eighth-grade students, and .69 to .77 for ninth-grade students, indicating that examinees who score well onone test also tend to score well on another.
(Text continued from p. 37.)

44
Table 4.24Correlations Between EXPLORE Test Scores and Subscores
Usage/ RhetoricalTest score Mechanics Skills Mathematics Reading Science Composite
Fall Eighth Grade (N = 427,117)
English .91 .90 .70 .75 .71 .90Usage/Mechanics .72 .67 .67 .65 .83Rhetorical Skills .64 .70 .66 .83
Mathematics .66 .69 .86Reading .73 .88Science .87
Spring Eighth Grade (N = 43,779)
English .90 .90 .69 .73 .71 .90Usage/Mechanics .71 .65 .65 .65 .82Rhetorical Skills .64 .69 .66 .83
Mathematics .65 .70 .86Reading .73 .88Science .87
Fall Ninth Grade (N = 145,060)
English .92 .91 .72 .77 .74 .91Usage/Mechanics .74 .69 .69 .68 .84Rhetorical Skills .67 .73 .69 .84
Mathematics .69 .71 .87Reading .75 .90Science .88

45
Statistical Relationships Between EXPLORE, PLANand ACT Scores. The EXPLORE, PLAN, and ACT tests allmeasure student educational development in the same cur-ricular areas of English, mathematics, reading, and science.The EXPLORE scale ranges from 1 (lowest) to 25, PLANfrom 1 to 32, and ACT from 1–36. Each test includes a com-puted Composite score equal to the average of the four testscores in the four curriculum areas (English, Mathematics,Reading, and Science). The three programs focus on knowl-edge and skills typically attained within these curriculumareas at different times in students’ secondary-school expe-rience. Thus, performance on EXPLORE should be directlyrelated to performance on PLAN and the ACT.
Table 4.25 shows the correlations between EXPLORE,PLAN, and ACT scale scores for 352,405 students who tookEXPLORE, PLAN, and the ACT in Grades 8, 10, and 11–12,respectively. The table shows observed correlations for alltest scores and disattenuated correlations (shown in paren-theses) for corresponding test scores across EXPLORE,PLAN, and the ACT. The observed correlations among thefour subject area tests are in the range of .53 to .75 and dis-attenuated correlations are in the range of .77 to .88. Theobserved correlations between tests suggest that perform-ance on the three test batteries is related.
Table 4.25Correlations, Observed and (Disattenuated), Between EXPLORE, PLAN, and ACT Test Scale Scores
PLAN
EXPLORE English Mathematics Reading Science Composite
English .74 (.85) .60 .63 .58 .75
Mathematics .60 .73 (.88) .53 .60 .72
Reading .67 .56 .63 (.77) .58 .71
Science .64 .63 .59 .62 (.78) .72
Composite .77 .73 .69 .69 .84 (.89)
ACT
EXPLORE English Mathematics Reading Science Composite
English .75 (.85) .60 .67 .61 .74
Mathematics .60 .73 (.85) .57 .66 .72
Reading .68 .56 .68 (.80) .60 .71
Science .65 .64 .63 .65 (.80) .72
Composite .79 .73 .74 .72 .83 (.87)

46
EXPLORE Scores and Course Grades. The resultsshown in Table 4.26 are based on the EXPLORE scores andself-reported course grades of students who took EXPLOREin Grade 8 in 2003–2004 and also took PLAN in Grade 10 in2005–2006. A total of 210,470 eighth-grade students hadvalid EXPLORE Composite scores and took the test understandard conditions.
Across individual courses, correlations between subjectarea EXPLORE scores and associated course gradesranged from .28 (Geography) to .42 (Algebra 1). However,correlations with subject area GPAs and overall high schoolGPA were much higher, ranging from .37 to .42 for subjectarea GPAs and from .47 to .55 for overall high school GPA.
In general, correlations between test scores and coursegrades are smaller than those between test scores due tothe lower reliabilities of course grades. For example, theintercorrelations among course grades could be consideredan estimate of the reliabilities of individual course grades.For these courses, the median correlation among pairs ofgrades is .57. Using this value as a reliability estimate forindividual course grades, disattenuated correlations amongtest scores and individual course grades ranged from .40(Geography) to .61 (Algebra 1).
Grade/grade average
No. of students Mean
Correlation for EXPLORE score
English Mathematics Reading Science Composite
English
English 9 175464 3.00 .41 .44
English 10 80801 3.06 .38 .41
English GPA 178539 2.99 .42 .46
Mathematics
Algebra 1 158716 2.97 .42 .43
Geometry 80776 3.13 .40 .42
Algebra 2 34801 3.21 .39 .40
Math GPA 166355 2.92 .42 .44
Social Studies
U.S. History 61780 3.14 .38 .42
World History 70044 3.16 .37 .42
Government/Civics 42408 3.17 .39 .44
World Cultures/Global Studies 13539 3.21 .39 .44
Geography 74309 3.31 .28 .32
Economics 11367 3.16 .38 .43
Social Studies GPA 172668 3.18 .37 .42
Science
Physical/Earth/General Science 123078 3.03 .38 .43
Biology 1 95581 3.06 .39 .44
Chemistry 1 18383 3.24 .34 .40
Science GPA 168395 3.02 .40 .45
Overall
Overall GPA 148640 3.08 .49 .48 .47 .48 .55
Table 4.26Correlations Between EXPLORE Scores and Course Grades

47
All students benefit from taking upper-level high schoolcourses and working hard in them, regardless of their levelof prior achievement—as students take more upper-levelcourses in high school, the increases in their proficiency arereflected in higher PLAN scores (see Figures 4.3 and 4.4).
Of all three EPAS assessments, EXPLORE is the earliestmeasure of academic achievement. Additional ACT researchexamined the relationship between high school grade point
average (HSGPA) at the time students took the ACT andtheir EXPLORE test scores at Grade 8. The data includedhigh school students who graduated in 2002, 2003, or 2004and took EXPLORE, PLAN, and the ACT. Self-reported highschool course grades from the ACT CGIS were used to cal-culate an overall HSGPA. EXPLORE means, HSPGAmeans, and correlations for each of the four EXPLORE testsand the Composite are presented in Table 4.27.
Figure 4.3. Average increase in PLAN Mathematics scores from taking rigorous mathematics courses, regardless of prior achievement.
Figure 4.4. Average increase in PLAN Science scores from taking rigorous science courses, regardless of prior achievement.
1.6
1.4
1.2
1
0.8
0.6
0.4
0.2
0General Science & Biology General Science, Biology, &
Other Science beyond Biology
Course pattern taken (Baseline = General Science)
0.5
1.4
5
4
3
2
1
0Alg 1 & Alg 2
or Alg 1 & GeomAlg 1, Geom,
& Alg 2Alg 1, Geom,
Alg 2, & Other Mathbeyond Alg 2
Course pattern taken (Baseline = No college-prep math)
4.6
2.8
1.2
0.2
Algebra

48
Table 4.28Composite Score Means for the Three Test Batteries, by Grade and Core Coursework at Time of ACT Testing
Table 4.27Means and Correlations for EXPLORE and High School Grade Point Average
The results showed a moderate relationship betweenHSGPA and EXPLORE test scores, even though the timespan between EXPLORE testing and HSGPA was about fouryears. The largest correlation was between the EXPLOREComposite and HSGPA. Corresponding correlation coeffi-cients for the four subject area tests ranged from .40(Reading) to .45 (Mathematics).
ACT also investigated whether taking or planning to takehigh school college-preparatory core coursework is relatedto ACT Composite scores for students with identicalEXPLORE Composite scores at Grade 8. Data for the studyconsisted of 2002 ACT-tested graduates from public middleand high schools who took EXPLORE, PLAN, and the ACT.Fifty-seven percent of the sample was female. Racial/ethnicaffiliations were 80% Caucasian, 8% African American, and
12% other ethnic backgrounds. EXPLORE, PLAN, and theACT Composite means were disaggregated by the time ofACT testing (junior or senior year) and whether or not thestudent had taken/planned to take core or less than core.Core courses are defined as four years of English and threeyears each of mathematics, science, and social studies.
The EXPLORE Composite means in Table 4.28 for stu-dents who took/planned to take the core curriculum werehigher than those for students who did not take core, giventheir EXPLORE scores. Thus, students who take EXPLOREand are encouraged to take the college-preparatory corecurriculum in high school are likely to achieve higher testscores on PLAN and the ACT than students who take lessthan core, regardless of whether ACT is taken as a junior or senior.
EXPLORE NEXPLORE
meansHSGPA means Correlations
English 221,805 16.5 3.30 .44
Mathematics 210,651 16.6 3.12 .45
Reading 210,666 16.4 3.40 .40
Science 210,493 17.8 3.25 .41
Composite 211,603 17.0 3.27 .54
Year took ACT Took core N EXPLORE PLAN ACT
Junior Yes 7,948 18.4 20.5 23.3
No 3,848 16.5 18.7 20.7
Senior Yes 21,236 17.0 19.1 21.9
No 10,534 15.2 17.4 19.4

49
Growth From Grade 8 to Grade 12. Results of ACT stu-dents show that EXPLORE, PLAN, and ACT can be used tomeasure growth in educational achievement across Grades8, 10, and 12.
Roberts and Bassiri (2005) investigated the relationshipbetween the initial academic achievement status of studentson EXPLORE at Grade 8, and their rate of change in aca-demic achievement at Grade 10 on PLAN and Grades 11/12on the ACT. The longitudinal achievement data for this studyconsisted of 34,500 students from 621 high schools who hadtaken EXPLORE (1998–1999), PLAN (1999–2000), and theACT (2001–2002). Linear growth over time for studentswithin schools was measured using EXPLORE, PLAN, andACT Composite scores. A multilevel growth model was usedto test the extent of the relationship between the initialachievement of students (measured by EXPLORE) and theirrate of educational growth (measured by PLAN and the ACT,respectively). The multilevel growth model for the study wasspecified, where the time of measure was nested within stu-dents and students were nested within high schools toaccount for variation at both levels.
The unconditional model showed an expected between-school grand mean equal to 16.35 for the EXPLOREComposite and achievement rate of growth equal to 1.16units per year. A strong correlation (r = .90) was foundbetween where students start on EXPLORE and their rate ofacademic achievement growth through high school, asmeasured by PLAN and the ACT. Within-school rates ofchange regressed on students’ EXPLORE scores explained
79% of the variation in student-level growth trajectories.These results showed that, on average, students’ initial levelof academic achievement is an important predictor of changein academic growth for students within schools. Althoughvariation between schools was observed (Figure 4.5), a stu-dent might be expected to increase his or her rate of changein academic growth by 0.19 scale units, on average, for eachunit increase on the EXPLORE Composite.
The Roberts and Bassiri study was extended by Bassiriand Roberts (2005) using the same sample and employingthe same growth model statistical methods to examine therelationship between high school core courses (four years ofEnglish and three years each of mathematics, science, andsocial studies) taken and student growth over time measuredwith EXPLORE, PLAN, and the ACT subject tests in English,Mathematics, Reading, and Science. Statistically significantinitial status and rate of change variances showed that stu-dents attending different schools do not start at the samelevel on EXPLORE or change at the same rate of academicachievement over time. Yet, on average, students within aschool who take EXPLORE can be expected to move tohigher Mathematics, English, Reading, and Science scoresover time as assessed by PLAN and the ACT. After control-ling for school-level characteristics (i.e., metropolitan area,proportion of ACT-tested students in a school, degree of inte-gration of race/ethnicity in a school, and initial achievementstatus of the school), and student-level variables (i.e., genderand race/ethnicity), EXPLORE-tested students who took thehigh school core curriculum showed statistically significantly
36
31
26
21
16
11
6
1
Grade8 10 11 12
Wit
hin
-Sch
oo
l EPA
S T
est
Mea
ns
School AE(Yij)School B
Figure 4.5. EPAS growth trajectories calculated at Grades 8 through 12 for expected within-school average E(Yij), high school A, and high school B.

50
faster rates of change to higher achievement scores onEnglish, Mathematics, Reading, and Science, compared toEXPLORE-tested students who did not take core (regressioncoefficients for each of the four tests equal 1.56, 1.37, 13.2,and 0.96, respectively). Based on these results, regardless ofwhere students start on EXPLORE, the rate of change inEPAS achievement is fastest for students who have taken thehigh school core curriculum.
EXPLORE and PLAN College Readiness Benchmarks.As described in chapter 3, ACT has identified CollegeReadiness Benchmarks for the ACT. These Benchmarks (ACTEnglish = 18, ACT Mathematics = 22, ACT Reading = 21, andACT Science = 24) reflect a 50% chance of a B or higher gradeor an 80% chance of a C or higher grade in entry-level, credit-bearing college English Composition, College Algebra, SocialSciences, and Biology courses. Subsequently, correspondingCollege Readiness Benchmarks were developed forEXPLORE and PLAN to reflect a student’s probable readinessfor college-level work in these same courses by the time he orshe graduates from high school.
The EXPLORE and PLAN College ReadinessBenchmarks were developed using approximately 150,000records of students who had taken EXPLORE, PLAN, andthe ACT. Using each of the EXPLORE subject area scoresand PLAN subject area scores, we estimated the conditionalprobabilities associated with meeting or exceeding the cor-responding ACT College Readiness Benchmark. Thus, eachEXPLORE (1–25) or PLAN (1–32) score was associatedwith an estimated probability of meeting or exceeding therelevant ACT Benchmark (see Figure 4.6 for English). Wethen identified the EXPLORE and PLAN scores that camethe closest to a .5 probability of meeting or exceeding theACT Benchmark, by subject area. These scores wereselected as the EXPLORE and PLAN Benchmarks.
The resulting EXPLORE and PLAN Benchmarks, with thecorresponding ACT Benchmarks, are given in Table 3.5.Figure 4.7 shows the percentages of 2005–2006 EXPLORE-tested students likely to be ready for college-level work,based on the EXPLORE benchmarks.
1.00
.90
.80
.70
.60
.50
.40
.30
.20
.10
.00
EXPLORE or PLAN English score
1 3 5 7 9 11 13 15 17 19 21 23 25 27 29 31
Pro
bab
ility
PLANEXPLORE
Figure 4.6. Conditional probability of meeting/exceeding an ACT English score = 18, given students’ EXPLORE or PLAN English score.

51
Figure 4.7. 2005–2006 national EXPLORE-tested students likely to be ready for college-level work (in percent).
100
90
80
70
60
50
40
30
20
10
0
EnglishComposition
EXPLOREEnglish
BenchmarkScore = 13
Per
cen
t R
ead
y
61
Algebra
EXPLOREMath
BenchmarkScore = 17
SocialSciences
EXPLOREReading
BenchmarkScore = 15
Biology
EXPLOREScience
BenchmarkScore = 20
StudentsMeeting All 4
EXPLOREBenchmark
Scores
3541
13 11

52
Interest Inventory
Overview
The Unisex Edition of the ACT Interest Inventory (UNI-ACT) helps students explore personally relevant career(occupational and educational) options. Using their UNIACTresults, students can explore occupations and academiccourses in line with their preferences for common, everydayactivities involving data, ideas, people, and things. UNIACTprovides scores on six scales paralleling Holland’s (1997) sixtypes of interests and occupations (see also Holland,Whitney, Cole, & Richards, 1969). Scale names (and corre-sponding Holland types) are Science & Technology(Investigative), Arts (Artistic), Social Service (Social),Administration & Sales (Enterprising), Business Operations(Conventional), and Technical (Realistic). Each scale con-sists of work-relevant activities (e.g., fix a toy, help settle anargument between friends, sketch and draw pictures) thatare familiar to students, either through participation or obser-vation. The activities have been carefully chosen to assessbasic interests while minimizing the effects of sex-roleconnotations. Since males and females obtain similar distri-butions of scores on the UNIACT scales, combined-sexnorms are used to obtain sex-balanced scores.
Score Reporting Procedure
The EXPLORE student score report suggests 2–3regions on the World-of-Work Map (Figure 5.1), the primaryprocedure used to link UNIACT scores to career options(Prediger & Swaney, 1995). Holland’s hexagonal model ofinterests and occupations (Holland, 1997; Holland et al.,1969) and the underlying Data/Ideas and Things/PeopleWork Task Dimensions (Prediger, 1982) form the core of themap. Holland’s types and ACT career clusters appear on theperiphery. The map is populated by 26 career areas (groupsof occupations). Each area consists of many occupationssharing similar work tasks. A simpler version of the map,without Holland’s types or ACT career clusters, is used onside 2 of the EXPLORE student score report.
The student guide It’s Your Future: Using Your EXPLOREResults describes how the World-of-Work Map is used forcareer exploration. Students are encouraged to exploreoccupations in career areas suggested by their UNIACTresults and their self-reported career plans. Students arealso encouraged to visit www.actstudent.org/explore togather occupational information, such as salary, growth, andentry requirements.
World-of-Work Map
The World-of-Work Map (WWM), which is empiricallybased, was updated in 2000. Career area content and loca-tions on the Map were determined from three databases: (a) expert ratings (Rounds, Smith, Hubert, Lewis, & Rivkin,1998) on Holland’s (1997) six work environments for each ofthe 1,122 occupations in the U.S. Department of Labor’s(DOL’s) O*NET Occupational Information Network(Peterson, Mumford, Borman, Jeanneret, & Fleishman,1999); (b) job analysis (JA) data for 1,573 recency-screenedoccupations in the Dictionary of Occupational Titles (U.S.DOL, 1991) database update (Dictionary of OccupationalTitles, 1999); and (c) Holland-type mean interest scores(four interest inventories, six samples) for persons pursuing640 (sometimes overlapping) occupations. These databasesprovided three diverse perspectives for the WWM update:(a) general nature of work (expert ratings); (b) detailednature of work (JA data); and (c) interests of workers (meaninterest scores).
The three databases were used to obtain Data/Ideas andThings/People scores for each of the 1,122 O*NET occupa-tions. For many of these occupations, scores for all threedatabases were available. For the Data/Ideas scores, corre-lations for database pairs were as follows: rating-JA (.78),rating-interest (.78), and JA-interest (.75). For theThings/People scores, the correlations were .81, .77, and.74, respectively. These correlations, which are unusuallyhigh for scores based on diverse assessment procedures,provide good support for the work task dimensions underly-ing the WWM and Holland’s (1997) hexagon. As expected,correlations between the Data/Ideas and Things/Peoplescores ranged near zero.
The work task dimension scores were used to plot theO*NET occupations in each of the previous Map’s 23 careerareas. The assignments of occupations to career areas werethen revised in order to increase career area homogeneitywith respect to basic work tasks. In addition, some careerareas were combined and new career areas were created.After a second set of plots was obtained, occupationalassignments were again revised. This process continueduntil career area homogeneity stabilized. Purpose of workand work setting were also considered.
The 3rd Edition WWM (Figure 5.1) has 26 career areas.Of the 26 career areas, 21 have content similar to careerareas on the previous edition of the WWM. The 26 careerareas are listed at www.actstudent.org/explore, where stu-dents can learn more about occupations in each area.
Chapter 5The EXPLORE Interest Inventoryand Other Program Components

53
Norms
Data for the Grade 8 UNIACT norms were obtained fromEXPLORE program files. The target population consisted ofstudents enrolled in Grade 8 in the United States. Althoughthe EXPLORE program tests a sizable percentage of U.S.high school students, some sample bias is inevitable. Toimprove the national representativeness of the sample, indi-vidual records were weighted to more closely match thecharacteristics of the target populations with respect to gen-der, ethnicity, school enrollment, school affiliation (public/private), and region of the country.
Sampling. Development of the norming sample beganwith schools that participated in EXPLORE testing during the2003–2004 academic year. Based on Market Data Retrieval(MDR; 2003) information, all schools in the United Stateswith public, private, Catholic, or Bureau of Indian Affairs affil-iation were retained. In addition, schools that contained aneighth grade and had at least ten EXPLORE-tested studentsduring the 2003–2004 academic year were retained. Withinretained schools, all students with a valid career choice anda complete set of valid interest inventory responses wereretained. The sample consisted of 273,964 students from2,739 schools. In general, schools use EXPLORE to test allGrade 8 students. The median proportion of students testedwas .81 for the group of 2,739 schools.
Weighting. As noted above, the sample was weighted tomake it more representative of the population of eighth gradersin the U.S. The proportion of eighth graders in the U.S. in eachgender/ethnicity category was approximated using populationcounts for the 10–14 age group from the 2000 Census (United
States Census Bureau, 2001). The proportion of U.S. eighthgraders in each enrollment size/affiliation/region category wascalculated using MDR (2003) data. Each student was assigneda weight as WGT = (N1/n1)*(N2/n2) where:
N1 = the number of students, in the population, from thegender/ethnicity category to which the studentbelongs,
n1 = the number of students, in the sample, from the gender/ethnicity category to which the studentbelongs,
N2 = the number of students, in the population, from theenrollment size/affiliation/region category to whichthe student belongs, and
n2 = the number of students, in the sample, from theenrollment size/affiliation/region category to whichthe student belongs.
Precision
By obtaining data from EXPLORE program files, we wereable to make the norming sample quite large so as to allow aprecise estimate of percentile ranks. For a simple randomsample of 16,587 student scores, there would be a 99%chance that the 50th percentile of the scores in the samplewas within one percentile rank of the 50th percentile of thescores in the target population. Although not a simple randomsample, the norming sample consisted of more than 250,000students, permitting precise estimation of percentiles.
(Text continues on p. 56.)

54
About the Map• The World-of-Work Map arranges 26 career areas (groups of similar jobs) into 12 regions. Together, the career areas cover all
U.S. jobs. Most jobs in a career area are located near the point shown. However, some may be in adjacent Map regions.
• A career area’s location is based on its primary work tasks. The four primary work tasks are working with—DATA: Facts, numbers, files, accounts, business procedures.IDEAS: Insights, theories, new ways of saying or doing something—for example, with words, equations, or music.PEOPLE: People you help, serve, inform, care for, or sell things to.THINGS: Machines, tools, living things, and materials such as food, wood, or metal.
• Six general types of work (“career clusters”) and related Holland types (RIASEC) are shown around the edge of the Map.The overlapping career cluster arrows indicate overlap in the occupational content of adjacent career clusters.
• Because of their People rather than Things orientation, the following two career areas in the Science & Technology Clusterare located toward the left side of the Map (Region 10): Medical Diagnosis & Treatment and Social Science.
Arts
Science & Technology
Soci
alSe
rvic
e
Administr
ation & Sales Business Operations
Technical
H. Transport Operation& Related
A. Employment-Related Services
B. Marketing& Sales D. Regulation
&Protection
E. Communi-cations &Records
F. FinancialTransactions
G. Distribution and Dispatching
K. Construction &Maintenance
L. Crafts &Related
M.Manufacturing& Processing
N. Mechanical& ElectricalSpecialties
O. Engineering & Technologies
P. Natural Science& TechnologiesT. Applied Arts
(Visual)
V. Applied Arts(Written &Spoken)
U. Creative &Performing Arts
W. Health Care
S R
I
E
A
C
Q. MedicalTech-nologies
X. Education
Y. Community Services
Z. PersonalServices
C. Manage-ment
12
2
1
3 4
5
6
7
8
910
11R.
MedicalDiagnosis
& Treatment
S.Social
Science
J. Computer/Info Specialties
I. Ag/Forestry& Related
ID E A S
THIN
GS
DATA
PEO
PLE
World-of-Work Map(Third Edition — COUNSELOR Version)
Figure 5.1. World-of-Work Map.
© 2000 by ACT, Inc. All rights reserved.

55
Chapter 1. Overview of The Unisex Edition of the ACT InterestInventory
ACT Programs Involving UNIACTDescription of UNIACT-R [1989 revision]
Basic Interest ScalesThe Data/Ideas and Things/People Summary Scales
Interpretive AidsACT Occupational Classification SystemThe World-of-Work MapBasic Interest Scale Profile
Historical Basis of UNIACTEditions of the ACT Interest InventoryEmpirical Relationships Among the Editions
Chapter 2. Rationale for Unisex Interest Scales
The Origin of Sex-restrictive ScoresIncidence of Sex RestrictivenessComparative Validity of Sex-restrictive and Sex-balanced Interest
ScoresSex-balanced Unisex Scales as an AlternativeSummary
Chapter 3. UNIACT Development and Revision
Summary of UNIACT Development: 1975-76Review of UNIACT Item Functioning: 1987UNIACT-R Item Development
Basic Interest ScalesSummary Scales
Correlations with Previous Editions of the ACT Interest InventoryDegree of Sex Balance
Male-Female Score OverlapCareer Options Suggested to Males and Females
Chapter 4. Scale Reliability and Stability
Reliability EstimatesUNIACTUNIACT-R
Stability EstimatesShort-term Stability
Intermediate-term StabilityLong-term Stability
Chapter 5. Norms
Norms SamplesWeightingRepresentativeness of Norms
Norms Distributions
Chapter 6. Convergent and Discriminant Validity
UNIACT-R Scale IntercorrelationsUNIACT-R Scale Structure
Theory-based Dimensions Underlying UNIACT-RResponse Set FactorEvidence from Other Measures of Holland’s Types
Correlations with Other MeasuresOther Measures of Holland’s TypesOther Measures of InterestsCareer-related Experiences
Measures of Academic and Career-related AbilitySummary
Chapter 7. Criterion-Related Validity: Group Profiles, HexagonLocations, and Hit Rates
Agreement Between Criterion Group Type and the PredominantInterests of Groups
Criterion Group Profile Validity: Qualitative EvaluationCriterion Group Profile Validity: Quantitative Evaluation
Mapping Criterion Groups on Holland’s HexagonMap of College MajorsHexagon Locations Based on Score ProfilesHexagon Location Validity: Qualitative EvaluationHexagon Location Validity: Quantitative Evaluation
Agreement Between Criterion Group Type and the PredominantInterests of Individuals
Validity Determined Via High-point CodeValidity Determined Via Career Counseling Decision Rules
Summary
Chapter 8. Other Indicators of Criterion-Related Validity
Analyses Based on Strong’s PropositionsSample and VariablesResults
Satisfaction and Persistence CriteriaSatisfaction with College MajorSatisfaction with OccupationPersistence in College MajorPersistence in Occupation
Experience as a Moderator of Interest Score ValiditySample and VariablesResults
Chapter 9. Appropriateness for Racial/Ethnic Minority GroupMembers
ReliabilitySex BalanceScale StructureCriterion-related Validity
Qualitative EvaluationQuantitative Evaluation
References
Appendix A. The ACT Vocational Research Program: List of ReportsAppendix B. List of Non-ACT-Sponsored Reports Relevant to
UNIACT-RAppendix C. ACT Interest Inventory Summary Profiles for 648
Educational and Occupational GroupsAppendix D. UNIACT-R ItemsAppendix E. UNIACT-R NormsAppendix F. UNIACT-R Scoring Procedures
Figure 5.2. UNIACT Technical Manual table of contents.

56
Table 5.1Selected Demographic and Educational Characteristics of
Grade 8 UNIACT Norm Group Students
Weighted sampleCharacteristic proportion U.S. proportiona U.S. category
GenderFemale .48 .49 FemaleMale .52 .51 Male
Racial/EthnicAfrican American/Black .11 .13 African American/BlackAmerican Indian, Alaska Native .01 .01 American Indian/Alaska NativeAsian American, Pacific Islander .04 .03 Asian/Native Hawaiian/Other
Pacific IslanderCaucasian American/White .56 .60 WhiteHispanicb .14 .13 Hispanic/Latino EthnicityOther, Prefer Not to Respond, Blank .12 c —Multiracial .03 .03 Two or more races
Estimated Enrollment<126 .25 .25126–254 .24 .25255–370 .25 .25>370 .26 .25
School AffiliationPublic .90 .90 PublicPrivate .10 .10 Private
Geographic RegionEast .40 .42 EastMidwest .21 .21 MidwestSouthwest .13 .13 SouthwestWest .26 .24 West
a U.S. proportion for gender and ethnicity estimated from the 2000 Census (2001) age 10–14 group. U.S. proportions for enrollment and region obtained from the Market Data Retrieval Educational Database (2003).
b Combination of two racial/ethnic categories: “Mexican American/Chicano” and “Puerto Rican, Cuban, OtherHispanic Origin.”
c U.S. proportion not available.
Representativeness
One way to determine the type and extent of sample biasis to compare demographic characteristics of the normingsample with national statistics for various educational anddemographic variables. The sample weights describedabove were used to obtain the weighted sample proportionsin Table 5.1. This table compares demographic characteris-tics of the norming sample to national statistics, permitting ageneral examination of the representativeness of the norm-ing sample. As can be seen, the norming sample appears tobe reasonably representative of the national population. Forexample, the weighted sample is very similar to the nationalpopulation with respect to geographic region—within 2 per-centage points in each region.
Psychometric Support for UNIACT
UNIACT’s 128-page Technical Manual (Swaney, 1995)describes UNIACT’s rationale, interpretive aids, develop-ment, norms, reliability, and validity. To provide readers withan overview of the information available, the table of con-tents of the UNIACT Technical Manual is listed in Figure 5.2.Four of the nine chapters summarize validity evidence,including score profiles for 648 career groups (N = 79,040).Internal consistency reliability coefficients for the six 15-itemscales, based on the Grade 8 norms sample, ranged from.84 to .91 (median = .86). ACT invites readers to examinethe full scope of information available on UNIACT. Singlecopies of the UNIACT Technical Manual are available at nocharge from ACT Career Transitions Department (65), P.O.Box 168, Iowa City, IA 52243-0168.
(Text continued from p. 53.)
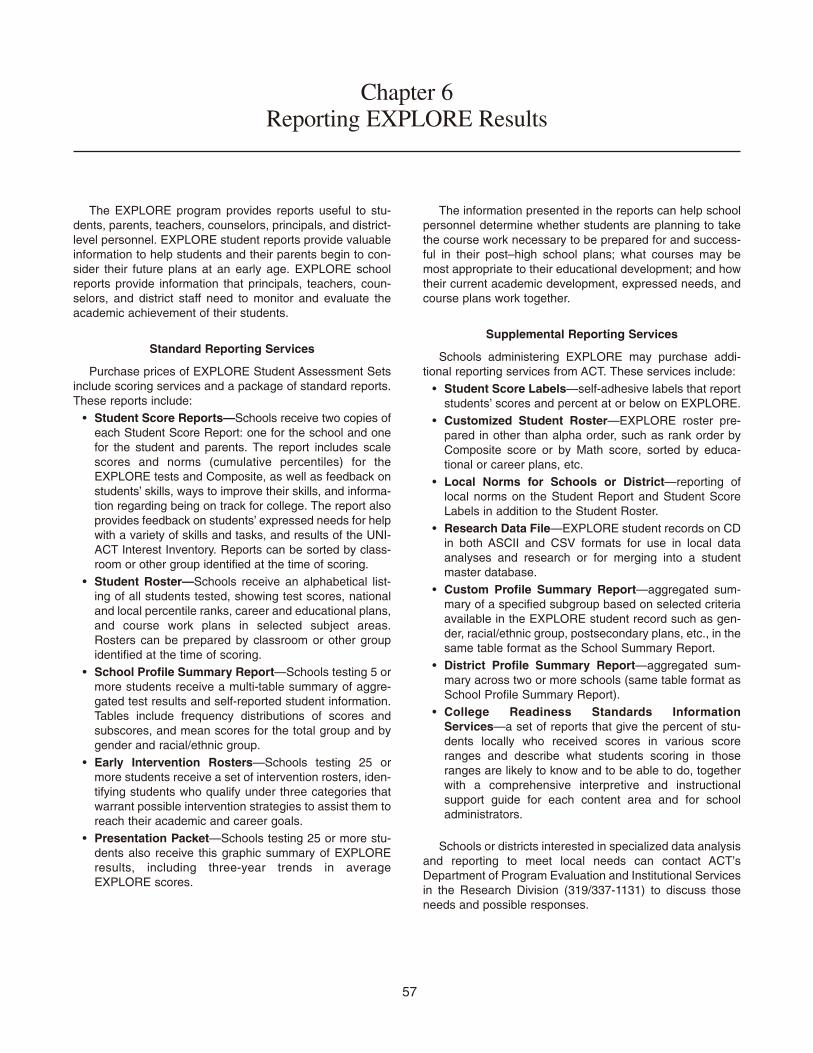
57
The EXPLORE program provides reports useful to stu-dents, parents, teachers, counselors, principals, and district-level personnel. EXPLORE student reports provide valuableinformation to help students and their parents begin to con-sider their future plans at an early age. EXPLORE schoolreports provide information that principals, teachers, coun-selors, and district staff need to monitor and evaluate theacademic achievement of their students.
Standard Reporting Services
Purchase prices of EXPLORE Student Assessment Setsinclude scoring services and a package of standard reports.These reports include:
• Student Score Reports—Schools receive two copies ofeach Student Score Report: one for the school and onefor the student and parents. The report includes scalescores and norms (cumulative percentiles) for theEXPLORE tests and Composite, as well as feedback onstudents’ skills, ways to improve their skills, and informa-tion regarding being on track for college. The report alsoprovides feedback on students’ expressed needs for helpwith a variety of skills and tasks, and results of the UNI-ACT Interest Inventory. Reports can be sorted by class-room or other group identified at the time of scoring.
• Student Roster—Schools receive an alphabetical list-ing of all students tested, showing test scores, nationaland local percentile ranks, career and educational plans,and course work plans in selected subject areas.Rosters can be prepared by classroom or other groupidentified at the time of scoring.
• School Profile Summary Report—Schools testing 5 ormore students receive a multi-table summary of aggre-gated test results and self-reported student information.Tables include frequency distributions of scores andsubscores, and mean scores for the total group and bygender and racial/ethnic group.
• Early Intervention Rosters—Schools testing 25 ormore students receive a set of intervention rosters, iden-tifying students who qualify under three categories thatwarrant possible intervention strategies to assist them toreach their academic and career goals.
• Presentation Packet—Schools testing 25 or more stu-dents also receive this graphic summary of EXPLOREresults, including three-year trends in averageEXPLORE scores.
The information presented in the reports can help schoolpersonnel determine whether students are planning to takethe course work necessary to be prepared for and success-ful in their post–high school plans; what courses may bemost appropriate to their educational development; and howtheir current academic development, expressed needs, andcourse plans work together.
Supplemental Reporting Services
Schools administering EXPLORE may purchase addi-tional reporting services from ACT. These services include:
• Student Score Labels—self-adhesive labels that reportstudents’ scores and percent at or below on EXPLORE.
• Customized Student Roster—EXPLORE roster pre-pared in other than alpha order, such as rank order byComposite score or by Math score, sorted by educa-tional or career plans, etc.
• Local Norms for Schools or District—reporting oflocal norms on the Student Report and Student ScoreLabels in addition to the Student Roster.
• Research Data File—EXPLORE student records on CDin both ASCII and CSV formats for use in local dataanalyses and research or for merging into a studentmaster database.
• Custom Profile Summary Report—aggregated sum-mary of a specified subgroup based on selected criteriaavailable in the EXPLORE student record such as gen-der, racial/ethnic group, postsecondary plans, etc., in thesame table format as the School Summary Report.
• District Profile Summary Report—aggregated sum-mary across two or more schools (same table format asSchool Profile Summary Report).
• College Readiness Standards InformationServices—a set of reports that give the percent of stu-dents locally who received scores in various scoreranges and describe what students scoring in thoseranges are likely to know and to be able to do, togetherwith a comprehensive interpretive and instructional support guide for each content area and for schooladministrators.
Schools or districts interested in specialized data analysisand reporting to meet local needs can contact ACT’sDepartment of Program Evaluation and Institutional Servicesin the Research Division (319/337-1131) to discuss thoseneeds and possible responses.
Chapter 6Reporting EXPLORE Results

58
American College Testing Program. (1988). Interim psy-chometric handbook for the 3rd edition ACT CareerPlanning Program (1988 update). Iowa City, IA: Author.
American College Testing Program. (1994). EXPLORE tech-nical manual. Iowa City, IA: Author.
ACT. (1997). EXPLORE technical manual. Iowa City, IA:Author.
ACT. (1999). PLAN technical manual. Iowa City, IA: Author.
ACT. (2001). EXPLORE technical manual. Iowa City, IA:Author.
ACT. (2007). ACT National Curriculum Survey ® 2005–2006.Iowa City, IA: Author.
ACT. (2007). Directions for testing. Iowa City, IA: Author.
ACT. (2007). EXPLORE administrator’s handbook. IowaCity, IA: Author.
ACT. (2007). It’s your future: Using your EXPLORE results.Iowa City, IA: Author.
ACT. (2007). Why take EXPLORE? Iowa City, IA: Author.
American Educational Research Association, AmericanPsychological Association, & National Council on Mea-surement in Education. (1999). Standards for educa-tional and psychological testing. Washington, DC:American Educational Research Association.
Bassiri, D., & Roberts, W. L. (2005). Using latent growthanalysis to investigate relationships between EPASacademic development and student/school characteris-tics. Paper presented at the annual meeting of theAmerican Educational Research Association, Montreal,Quebec, Canada.
Dictionary of occupational titles [Data file: DOTFILE.DOC].(1999). Des Moines, IA: NOICC Crosswalk and DataCenter [producer and distributor].
Hanson, B. A. (1991). A comparison of bivariate smoothingmethods in common-item equipercentile equating.Applied Psychological Measurement, 15, 391–408.
Harris, D. J. (Ed.) (2001). Methodology used in the 1999EXPLORE scaling. Iowa City, IA: Author.
Holland, J. L. (1997). Making vocational choices: A theory ofvocational personalities and work environments (3rd.ed.). Odessa, FL: Psychological Assessment Resources.
Holland, J. L., Whitney, D. R., Cole, N. S., & Richards, J. M.(1969). An empirical occupational classification derivedfrom a theory of personality and intended for practiceand research (ACT Research Report No. 29). Iowa City,IA: ACT.
Joint Committee on Testing Practices. (2004). Code of fairtesting practices in education. Washington, DC: Author.
Kolen, M. J. (1988). Defining score scales in relation tomeasurement error. Journal of Education Measure-ment, 25, 97–110.
Kolen, M. J. (1984). Effectiveness of analytic smoothing inequipercentile equating. Journal of Educational Statis-tics, 9, 25–44.
Kolen, M. J., & Hanson, B. A. (1989). Scaling the ACTAssessment. In R. L. Brennan (Ed.) Methodology usedin scaling the ACT Assessment and P-ACT+. Iowa City,IA: American College Testing Program.
Kolen, M. J., Hanson, B. A., & Brennan, R. L. (1992). Condi-tional standard errors of measurement for scale scores.Journal of Educational Measurement, 29, 285–307.
Market Data Retrieval Educational Database [Electronicdata type]. (2003). Chicago: Market Data Retrieval.
Market Data Retrieval Educational Database [Electronicdata type]. (2005). Chicago: Market Data Retrieval.
NCME Ad Hoc Committee on the Development of a Code ofEthics. (1995). Code of professional responsibilities ineducational measurement. Washington, DC: NationalCouncil on Measurement in Education.
Peterson, N. G., Mumford, M. D., Borman, W. C., Jeanneret,P. R., & Fleishman, E. A. (1999). An occupational infor-mation system for the 21st century: The development ofO*NET. Washington, DC: American PsychologicalAssociation.
Prediger, D. J. (1982). Dimensions underlying Holland’shexagon: Missing link between interests and occupa-tions? Journal of Vocational Behavior, 21, 259–287.
Prediger, D. J., & Swaney, K. B. (1995). Using UNIACT in acomprehensive approach to assessment for careerplanning. Journal of Career Assessment, 3, 429–451.
Roberts, W. L. & Bassiri, D. (2005). Assessing the relation-ship between students’ initial achievement level and rateof change in academic growth within and between highschools. Paper presented at the annual meeting of theAmerican Educational Research Association, Montreal,Quebec, Canada.
Rosenbaum, P. R., & Thayer, D. T. (1987). Smoothing thejoint and marginal distributions of scored two-waycontingency tables in test equating. British Journal ofMathematical and Statistical Psychology, 40, 43–49.
References
(Please note that in 1996 the corporate name “The American College Testing Program” was changed to “ACT.”)

Rounds, J., Smith, T., Hubert, L., Lewis, P., & Rivkin, D.(1998). Development of occupational interest profiles(OIPs) for the O*NET. Raleigh, NC: SouthernAssessment Research and Development Center,Employment Security Commission of North Carolina.
Spray, J. A. (1989). Performance of three conditional DIFstatistics in detecting differential item functioning onsimulated tests (ACT Research Report No. 89-7). IowaCity, IA: American College Testing Program.
Swaney, K. B. (1995). Technical manual: Revised UnisexEdition of the ACT Interest Inventory (UNIACT). IowaCity, IA: ACT.
United States Census Bureau (2001). Census 2000Summary File 1. Retrieved using 2000 American FactFinder, July 15, 2004, from http://factfinder.census.gov.
United States Department of Education. (2002). Digest ofEducation Statistics. Washington, DC: U.S. Departmentof Education.
United States Department of Labor. (1991). Dictionary ofoccupational titles (4th ed., rev.). Washington, DC: U.S.Government Printing Office.
Wang, M. W., & Stanley, J. L. (1970). Differential weighting:A review of methods and empirical studies. Review ofEducational Research, 40, 663–705.
59