9. long-term trends in real wages of labourers
TRANSCRIPT
9.Long-term trends in real wages of labourers
Johan Söderberg
9.1. Introduction
This chapter presents a very long-term view of real wages of unskilled labourers in Sweden, particularly in Stockholm, from medieval times up to the present. Emphasis is on the pre-industrial era up to about 1860.
The wages series is based on the building accounts of Stockholm City, supple-mented with some institutional and parish archives.1 The accounts of the Town Council of Stockholm contain detailed descriptions of the building works initiated by the Council and the daily wages of various building workers. Here we focus on unskilled labourers, since this is the only category for which long series of daily wage rates are available.2 Parish accounts (e.g., Storkyrkoförsamlingen and the German Church) also provide information on wages. Wages were paid in cash and for most of the period examined there were no substantial additional benefits in kind (though the City occasionally did pay for the gloves used by labourers, and gave them some beer). In the late medieval era, though, beer and food could be a substantial part of wages (see Section 9.2 below).
For the period 1365–1864, wages refer to daily summer rates of male unskilled labourers in Stockholm (the 1365 quotation actually refers to the town of Nyköping, about 100 km south of Stockholm).3 From 1864 onwards, this series is linked to the series of wages for industrial and mining workers in Sweden presented by Svante
1 Söderberg (1987a); Jansson, Palm and Söderberg (1991); Söderberg, Jonsson and Persson (1991).
2 For wages of other groups of labourers in Stockholm (e.g., carpenters, masons, and female labourers) for the 17th and early 18th centuries, see Jansson, Palm and Söderberg (1991, pp. 18–21, pp. 96–108).
3 Daily wage rates of unskilled labourers in Stockholm 1860–64 are drawn from Höjer (1967, p. 423).
Exchange rates, prices, and wages, 1277–2008454
Prado in Chapter 10 below.4 Hence, the series presented is not homogeneous. Nev-ertheless, it should give a rough general overview of real wage trends over a very long period. As pointed out by Prado in the subsequent chapter, statistical agencies have not been eager to use the term ‘unskilled’ during the 20th century. As a result, the construction of reliable wage series for unskilled non-agricultural workers from the 1860s onwards will require further research.
Real wages are often used as an indicator of material living standards. It should be kept in mind, though, that real wage rates do not say anything about unemploy-ment. Real incomes may therefore evolve differently from real wages. Furthermore, the real wage rates of male labourers used here do not automatically mirror family or household incomes, to which women and children may have contributed as well. Also, the length of the working day and the intensity of work may vary in a way that is not reflected in daily wage rates. However, we rarely have information on unem-ployment, work intensity, and household incomes in the past. After all, real wage calculations often seem to be the single best proxy available for trends and fluctua-tions in purchasing power among various categories of labourers, at least when it comes to producing long-term series.
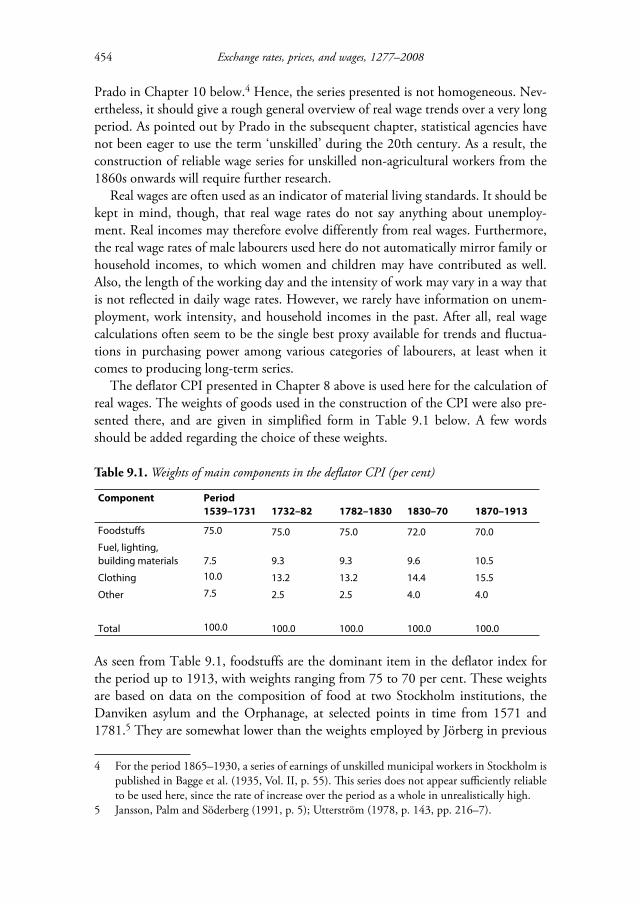
The deflator CPI presented in Chapter 8 above is used here for the calculation of real wages. The weights of goods used in the construction of the CPI were also pre-sented there, and are given in simplified form in Table 9.1 below. A few words should be added regarding the choice of these weights.
Table 9.1. Weights of main components in the defl ator CPI (per cent)
Component Period
1539–1731 1732–82 1782–1830 1830–70 1870–1913
Foodstuffs 75.0 75.0 75.0 72.0 70.0
Fuel, lighting,
building materials 7.5 9.3 9.3 9.6 10.5
Clothing 10.0 13.2 13.2 14.4 15.5
Other 7.5 2.5 2.5 4.0 4.0
Total 100.0 100.0 100.0 100.0 100.0
As seen from Table 9.1, foodstuffs are the dominant item in the deflator index for the period up to 1913, with weights ranging from 75 to 70 per cent. These weights are based on data on the composition of food at two Stockholm institutions, the Danviken asylum and the Orphanage, at selected points in time from 1571 and 1781.5 They are somewhat lower than the weights employed by Jörberg in previous
4 For the period 1865–1930, a series of earnings of unskilled municipal workers in Stockholm is published in Bagge et al. (1935, Vol. II, p. 55). Th is series does not appear suffi ciently reliable to be used here, since the rate of increase over the period as a whole in unrealistically high.
5 Jansson, Palm and Söderberg (1991, p. 5); Utterström (1978, p. 143, pp. 216–7).

9. Long-term trends in real wages of labourers 455
Swedish research.6 They are fairly close to weights used in modern international research. For Britain, Robert Allen assumes a weight of 73.5 per cent for foodstuffs (including beer and tobacco) in his construction of a price index employed to cap-
6 Jörberg (Vol. I, 1972, p. 119, p. 182, p. 349) used weights for foodstuff s ranging between 83.3 per cent (for the period 1732–1804) and 81.4 per cent (for the period 1865–1914).
Th e Ebonists, by Elias Martin (1739–1818).Source: Nationalmuseum.

Exchange rates, prices, and wages, 1277–2008456
ture real wage developments during the Industrial Revolution (1770–1869).7 This is slightly less that the weights put forward in earlier research by Feinstein (1998), who assumes a weight of 79 per cent for food and drink in 1788/92, declining somewhat to 76 per cent in 1828/32 and further to 73 per cent in 1858/62.8 The differences between various modern researchers in their assumptions about the share of food in the cost of living thus appear to be modest, as there is general agreement that food was the dominant component.
*
7 Allen (2007, p. 16). For Antwerp in the late 16th century, Scholliers (1960) constructs an index with a food component of 75 per cent, which is identical to the weight used in the present study for that period.
8 Feinstein (1998, p. 635).
Regulation of working hours and wages for journeymen and apprentices in the building sector (‘mur-gesäller’ and ‘mur-gossar’) and carpenters (‘timmermän’) in Göteborg in 1804. Th e length of the working day varied over the year, from 7 hours from 26 November to 21st January (from 8 a.m. to 4 p.m. with a 1-hour break) to 11¾ hours from 8 April to 15 Sep-tember (from 5 a.m. to 7 p.m. with a 2¼-hour break). Moreover, the daily wage varied with the number of hours per day. Journeymen earned around 15 per cent more than apprentices.Source: Göteborgs stadsarkiv, Oordnade inneliggande handlingar E II j:3

9. Long-term trends in real wages of labourers 457
Figure 9.1 below reports real wages of labourers from 1365 up to 2004. The main trends in real wages in Stockholm after 1500 can be divided into four phases:1. The first phase is characterized by a decline during most of the 16th century. 2. The second phase is a recovery during the 17th century, continuing up to about 1730. 3. A new phase of depression of real wages occurred from about 1730 up to 1800. 4. After about 1800, there is a strong upsurge in real wages.
These phases are further discussed below.
9.2. The medieval era and the 16th century
Data on late medieval wages in Sweden are very sparse. In modern research there has been no attempt to compare Swedish wages for the medieval era with those of later periods.9 In order to make such a comparison possible, some assumptions have to be made regarding medieval wage rates.
First, late medieval daily wage rates are of two kinds. Most of them refer to actual wages paid according to the accounts. In a few cases, however, regulations of maxi-mum wage rates were issued by the Stockholm City authorities. Normally, the rates given in such regulations should be expected to be lower than actual wages paid, since their purpose would be to counteract increases in market wages. For the years 1476, 1478, and 1496, the daily rates in Figure 9.1 refer to regulations issued by the Stockholm City authorities.10 They should be interpreted as probable minimum wages. Even as such, they suggest a relatively high level of real wages during the 15th century, continuing in the early years of the 16th century.
Second, some wage rates include food and beer, whereas others do not, while yet others do not give any information in this respect. For the years 1476, 1478, and 1496, the regulated daily summer cash wage rate was 0.5 öre. In addition, the labourer received food and beer. Here, the value of food and beer is estimated at 0.5 öre for these years. This is based on several pieces of information. Assuming that food comprised half the wage rate seems reasonable in the light of conditions in the copper-producing district at Kopparberget in the province of Dalarna. There, the daily wage rate for a labourer without food in 1499 was set at twice the wage rate including food.11 There are also examples from Stockholm of wage rates of labourers who were given no food being twice as high as when food was included in the daily wage. This relationship is found in 1517, for male as well as female labourers, and in
9 Note, though, the early attempt at real wage analysis by Sommarin (1908, pp. 42–51, p. 75). He argued that real wages of Swedish labourers were unusually favourable during the 15th cen-tury, especially its latter half. However, the major part of the prices he included in the discus-sion was of a normative character, expressed in various royal regulations.
10 Stockholms stads tänkeböcker 1474–1483 (1917, pp. 179, 467); Stockholms stads tänkeböcker 1492–1500 (1930, p. 271).
11 Sommarin (1908, pp. 47–8).

Exchange rates, prices, and wages, 1277–2008458
Figure 9.1. Real wages of unskilled labourers in Stockholm, 1365–1864, and industrial workers in Sweden 1865–2004 (index 1950 = 100).
Source: Table A9.1.Note: A vertical line marks the change in 1865 from unskilled labourers in Stockholm to industrial workers in Sweden.
1525–26.12 It may also be noted that the cost of a soldier’s daily food was set at 0.5 öre at Stockholm in 1508.13
During the late Middle Ages, beer could sometimes be a substantial part of the daily wage. This was the case at least in 1467, when beer made up 1/6 of the wage for some labourers and 1/8 of the wage for some others.14 This is suggestive of a fairly high living standard, since much of the energy content of the raw material (barley) is lost in the brewing process. Labourers living at the physical subsistence level would be expected to consume cereals in other forms, e.g. as bread or porridge. Beer grew in popularity in Sweden during the late Middle Ages and became a central item of con-sumption on festive occasions. At least seven litres of beer per person was, for exam-ple, consumed at the annual May feast at Stockholm City Hall in the 1460s.15 This of course also indicates that material living conditions exceeded the minimum level.
Although the number of observations before 1500 is small, a statistical test (t test)
12 1517: Handlingar rörande Helga lekamens gille II–IV (1923, p. 59, pp. 72–3, p. 75). 1525–1526: Handlingar rörande Helga lekamens gille II–IV (1923, p. 135, p. 137).
13 Stockholms stads skottebok 1501–1510 (1915, p. 274).14 Stockholms stads skottebok 1460–1468 (1926, p. 287).15 Dahlbäck (1987, p.171).
1
10
100
1,000
1300 1400 1500 1600 1700 1800 1900 2000

9. Long-term trends in real wages of labourers 459
reveals a significant difference in means between real wages before that year and those registered for the period 1500–1800.16
Late medieval labourers thus found themselves in a rather favourable situation, in Stockholm as well as in other parts of northern and western Europe, where popula-tion decline after the Black Death raised the price of labour.17 In Stockholm, how-ever, the high level of real wages did not last much beyond 1500. Real wages were quite volatile in the 1510s and ’20s. This is a turbulent period in Swedish history, characterized by war and civil unrest. The high volatility suggests a low level of wel-fare where basic living conditions were unstable. There are also many qualitative statements on the poverty of the country in the early 16th century.18
16 Assuming equal or unequal variances, the t value is -7.57 and -5.61, respectively. Both are sig-nifi cant at a very high level.
17 For an overview of conditions in England see Clark (2007a, p. 41); more detailed analysis in Clark (2005) and Clark (2007b).
18 See, e.g., Letter from the inhabitants of the province of Hälsingland, 19 February 1507 (SDhk 35724); Letter to Svante Nilsson 28 June 1508 on poverty in the province of Småland; Letters to Svante Nils-son 22 February 1509 (SDhk 36448) and 12 December 1508 (SDhk 36356) on poverty in north-ern Sweden and Finland. On the severe famine of 1509 see Olsson (1947). A letter to Svante Nilsson dated 1 September 1510 describes the lack of food in the mining district of Norberg (SDhk 36804). See also Letter from the Mayor and Council of Uppsala to Svante Nilsson, 14 July 1511 (SDhk 37033), reporting that the town, due to poverty, is unable to keep the prisoners assigned to it and that the peas-ants threaten to kill them if they stay much longer (see also SDhk 36759, 22 June, 1510).
Figure 9.2. Nominal wage rates of unskilled labourers in Stockholm and defl ator CPI, 1291–2004 (index 1780/89 = 100).
Source: Table A9.1.Note: Missing values in the defl ator CPI have been interpolated.
0
1
10
100
1,000
10,000
100,000
1,000,000
1250 1300 1350 1400 1450 1500 1550 1600 1650 1700 1750 1800 1850 1900 1950 2000
Wage rate CPI

Exchange rates, prices, and wages, 1277–2008460
The 16th century was characterized by strong population growth in Sweden as well as generally in northern and north-western Europe. Growing population pres-sure led to the expansion of cultivated land, and marginal land was increasingly used for grain production.19 Despite land reclamation, it seems that the total output of grains in Sweden did not keep pace with population growth. The decline in per capita grain production seems to have been the major force behind the substantial rise in the relative price of grains. Grain prices in Sweden rose more steeply than prices of animal foodstuffs, which in turn rose less than prices of textiles and building materials. This conforms to trends elsewhere in western Europe.20
After about 1540, the trend in real wages in Stockholm is clearly downward. By 1600, real wages were about 40 per cent lower than in 1540. This may seem a remarkably strong fall but it resembles trends found in several other places in Europe, e.g., in southern England and Valencia.21
The real wages of agricultural labourers in Sweden during the 16th century have not been systematically explored. It is clear, though, that these wages declined at least around mid-century, as nominal daily wage rates were practically unchanged, whereas food prices were rising. It should be remembered, though, that agricultural labourers in Sweden made up a small proportion of the total labour force at this time; the great increase in landless labourers did not take place until the 19th century.22
The real wages of unskilled labourers in Stockholm fell dramatically during the extreme inflation around 1573 and 1592. During the latter inflation period, there are indications in the sources of unusually severe conditions for these labourers. At the Horn brick-yard, quantities of herring and smelt were distributed to the workers in 1592 ‘in order that they would be serviceable for work’. This suggests that real incomes had fallen below the physiological minimum at which meaningful work could be carried out. Already in October 1591, the Stockholm City accounts register that extra cash payments were given to the day labourers ‘since they had a poor daily wage’.23
After the inflationary periods, however, real wages tended to return to their for-mer levels. Thus, extreme inflation had no lasting influence on real wages. Figure 9.2 illustrates that, as a rule, nominal wages in the pre-industrial era closely followed the changes in the general price level. Thus, the view often put forward in international literature, that nominal wages were frequently rather inflexible for long periods, does not fully fit the situation in Stockholm, where inflation was an ongoing phenome-non. There is no counterpart here, for example, to the stability of nominal wages observed in southern England from 1412 up to 1545, when daily wage rates of
19 Kriedte (1983); Abel (1967, p. 117).20 Myrdal and Söderberg (2002, pp. 96–108); Bowden (1967); Braudel and Spooner (1967, pp.
425–7, 482–3).21 Söderberg (1987a, p. 353).22 Söderberg (1987a, p. 354).23 Söderberg (1987a, p. 352).

9. Long-term trends in real wages of labourers 461
unskilled building labourers were unchanged at 4 pence a day.24 Sharp drops in wage rates relative to prices, as occurred around 1592, were rare in Stockholm.
9.3. The period c. 1600–1730
The most surprising feature of the long-term evolution of real wages is perhaps that the wars and the militarization of the Swedish economy during the Great Power Era (ending in 1721) did not prevent a growth in real wages. This is in agreement, how-ever, with upward real wage trends in several other places in Europe during the 17th century. The rise in real wages can be linked to stagnating or declining relative food prices and tendencies to depression in the agrarian sector.25
In the Stockholm case, it should be noted that the population increased rapidly in the 17th century, from about 10,000 in the early years of the century to nearly 60,000 around 1690. Demand for labour, e.g., for building and shipbuilding, seems to have been high as Stockholm became the capital of a centralized state.26
This expansion helps to explain the upward trend in real wages. It is part of a general European tendency for big towns and cities, often with a large administrative or mili-tary sector, to expand during the period 1600–1750. Besides Stockholm, several other capitals, e.g., Madrid, Paris, and Copenhagen, exhibited dynamic tendencies during this phase. On the other hand, many industrial towns regressed during this period.27
It may be of some interest to note that the length of the working day for carpen-ters and masons was regulated in 1675. The Stockholm magistrate decided that work should start at 5 a.m. and continue until 7 p.m. during the summer season (covering the light half of the year). The working day was thus set to comprise 14 hours. This decision was taken in response to complaints that workers did not arrive at work until 6 a.m. and left at 6 p.m. During the winter season (the dark half of the year) work was to be carried out from sunrise to sunset.28 If this regulation was adhered to, there must have been very little possibility of earning extra income by performing work over and above the summer-season working day.
9.4. The period c. 1730–1800
The trend towards stagnating or falling food prices ended during the first part of the 18th century. Rising grain prices was a general European tendency from about 1730 to 1800. As grain prices were still a major element of the cost of living of labourers and nominal wages were rather inflexible, the outcome was a depression of real wages
24 Brown and Hopkins (1981, p. 11).25 See, e.g., Hobsbawm (1965, p. 28); Slicher van Bath (1963, pp. 209–10); Felloni (1977, p. 28);
Brown and Hopkins (1981, p. 82).26 Jansson, Palm and Söderberg (1991, pp. 30–1).27 Vries (1984).28 Pursche (1979, pp. 100, 150 ff , 304).
Exchange rates, prices, and wages, 1277–2008462
similar to the one in the 16th century. A deep trough in real wages occurred during the Revolutionary and Napoleonic wars, due to sharply rising food prices. Despite substantial technological and institutional changes, around 1800 most urban as well as rural labourers actually seem to have been worse off in terms of material living standards than at any other time during the preceding five centuries.
As in the 16th century, it was grain prices in particular that rose strongly, in Swe-den as well as in Europe in general. The relative price change was driven by popula-tion growth. A new period of land reclamation started during the 18th century. The surplus from agrarian production was distributed more unequally than before. In general, farmers who produced a surplus for sale on the market should have gained from the relative price shift in favour of grains. Agricultural land prices and rents should be expected to have turned upwards. This was in fact the case in Sweden. In particular, prices of small landholdings surged upwards, stimulating the division of farms. As a result, income differentials between rich and poor widened. The stratum of landless labourers grew strongly after 1750.29
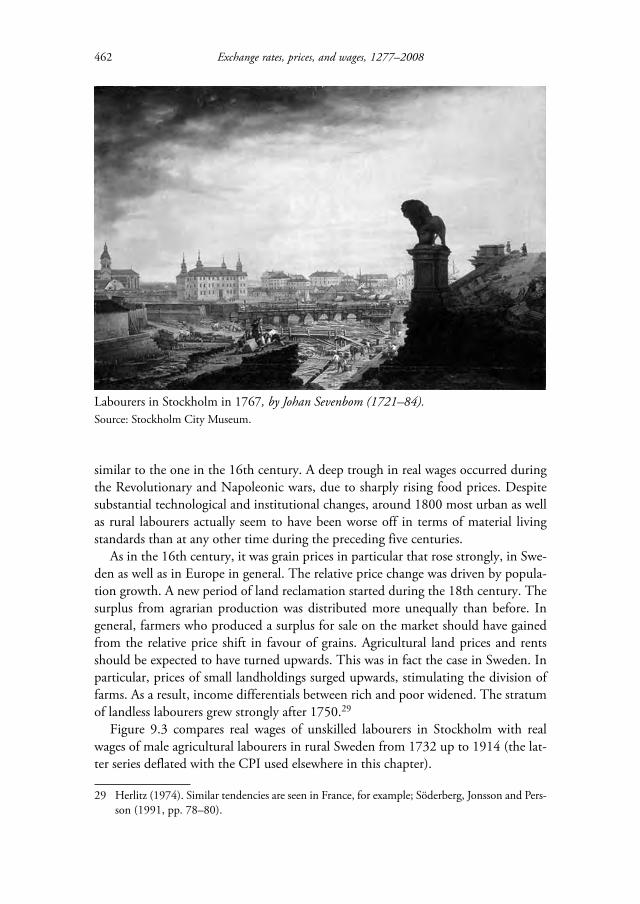
Figure 9.3 compares real wages of unskilled labourers in Stockholm with real wages of male agricultural labourers in rural Sweden from 1732 up to 1914 (the lat-ter series deflated with the CPI used elsewhere in this chapter).
29 Herlitz (1974). Similar tendencies are seen in France, for example; Söderberg, Jonsson and Pers-son (1991, pp. 78–80).
Labourers in Stockholm in 1767, by Johan Sevenbom (1721–84).Source: Stockholm City Museum.

9. Long-term trends in real wages of labourers 463
The real wage decline 1730–1800 was more pronounced in Stockholm than in rural Sweden. One reason for this may be that Stockholm real wages suffered not only from the price rise of grains and other foodstuffs, but also from de-industrializa-tion. The most important industrial branch in the capital was textile manufacturing, which declined during the second half of the 18th century and the first part of the 19th. Most of the silk industry, for example, ceased to exist. Low profits forced many Stockholm artisans into bankruptcy during the latter part of the 18th century, and their total number fell. Unemployment in the capital probably increased, and part of the labour force was driven into informal sector occupations. These informal occu-pations included illegal or quasi-legal activities such as the production of handicraft items without belonging to a guild, or the selling of alcohol or various goods in the streets.30 The economic problems affected demographic trends. The population of Stockholm hardly changed in the latter half of the 18th century and the early 19th, and the marriage rate fell from 13.3 per 1,000 in 1751–60 to only 8.2 in 1801–10.31
From Figure 9.3 we also see that the fluctuations in real wages in Stockholm exceeded those in rural Sweden. During years of high prices, the Stockholm curve tended to fall below that for rural Sweden, whereas the opposite was often true for low-price years. This is an effect of greater flexibility in nominal wage rates in Stock-holm compared to rural Sweden.
It should be kept in mind that these real wage trends are not typical of social groups who enjoyed substantial payment in kind. One large such group was male and female servants in urban as well as in rural Sweden. Food and lodging was the major part of their pay. The real wage decline for them must have been less steep during this period (and, correspondingly, the rise in their real wages during the 19th century should have been less pronounced than for labourers with no payment in kind). Some civil and military functionaries, particularly the clergy and officers of the county regiments, had their pay in kind from tithes and rents. They probably gained from the grain price rise. Urban functionaries, on the other hand, were often money-salaried. They became increasingly disadvantaged compared with their col-leagues in rural regions.32 Here, as elsewhere, we observe a redistribution of income from urban to rural regions during the latter part of the 18th century.
As seen in Figure 9.3, the erosion of real wages in Stockholm was pronounced in the period 1730–1800. Could it be realistic to assume such a dramatic downturn not only in real wage rates but also in real incomes and living standards? Probably not. The declining real wage rates of male labourers may to some extent have been com-pensated by increased labour market participation by women and children.
During the 18th and early 19th centuries, institutional changes were undertaken in Stockholm in order to facilitate the running of small businesses in certain branches
30 Söderberg, Jonsson and Persson (1991, pp. 46–64).31 Statistisk årsbok för Stockholms stad 38 (1905, p. 66).32 Artéus (1982, Chapter 5).

Exchange rates, prices, and wages, 1277–2008464
by women and widows. The authorities were well aware that many married men were unable to provide for their families, due to insufficient income, illness, or heavy drinking. In order to avoid increased poor relief costs, the authorities stimulated the opening of certain businesses to women. While most trades remained closed to women, quite a number of women were allowed to earn an income in various occu-pations: as hawkers (making and selling certain kinds of food), innkeepers, rowing mamsels, or bakers. They could also work as vendors of tobacco, certain textile goods or used clothes, furniture and household utensils.33 This expansion of female trades should to some degree have counteracted the decline of male incomes in lower social strata. Yet, this new interest in female employment could not prevent the loss of many jobs for women as textile manufactories closed.
In international research, the concept of ‘the industrious revolution’ has been used to delineate a new type of household behaviour, involving an increased supply of market-oriented and money-earning activities and a simultaneous increase in
33 Bladh (1991, pp. 50–56).
Figure 9.3. Real wage rates of unskilled labourers in Stockholm and of male agricultural labourers in Sweden, 1732–1914, index 1780/89 = 100.
Sources: Stockholm: see Figure 9.1; rural Sweden: Jörberg (1972), Vol. I, pp. 710 onwards.
0
50
100
150
200
250
300
350
400
1740 1760 1780 1800 1820 1840 1860 1880 1900 1920
Stockholm Rural Sweden

9. Long-term trends in real wages of labourers 465
demand for many kinds of goods offered in the market. This revolution, driven by consumer aspirations, took place roughly between 1650 and 1850 in western Europe. Even though real wage rates of labourers fell during most of the 18th century, annual household incomes could increase as a result of working longer hours during the year, a higher work intensity, greater specialization in household production, and increased labour market participation by women and children.34
In the Stockholm case, there were several ways in which household incomes could be further supplemented by children’s work. For example, the newspaper Dagligt Allehanda was started in Stockholm in 1767 as an advertising medium (in itself a typi-cal phenomenon of the rising consumer aspirations and market expansion connected with ‘the industrious revolution’). This newspaper was distributed by a combination of subscriptions and street sales by newspaper boys; contemporaries referred to the lat-ter method as ‘the English way’ of distribution.35
There is as yet no thorough study of Swedish conditions from the perspective of ‘the industrious revolution’ but there are several indications that such an interpreta-tion could be realistic. The growing role of married women in the Stockholm econ-omy fits this pattern. In Sweden as well as in England, the growth of second-hand markets in clothes and other goods was probably also important in making con-sumption cheap enough to include the lower classes.36 Consumers in Sweden, as else-where in western Europe, were attracted by new and exotic goods such as tobacco, sugar, and silk.
While the economy of Stockholm stagnated in the period 1760–1850, several towns in other parts of Sweden expanded. The growing incomes of peasants stimu-lated handicrafts and small industries such as book-binders’ shops, where hymnbooks, calendars and almanacs were made.37 New types of consumption were spreading to rural areas. In parts of northern Sweden during the late 18th century, the peasants criticized young people and servants for being affected by urban habits such as wearing watches, silk waistcoats, velvet trousers, and high hats with buckles and silk ribbons. This problem was said to be most serious along the trade routes to Stockholm.38 The traditional dark, uniform dress habits among the peasantry were giving way to more varied styles. ‘People are more inclined towards multiform than uniform’, one author from rural northern Sweden observed around 1770.39 In Småland in southern Swe-den, contemporaries observed that dress fashion was now changing from year to year. Men as well as women, not only married women but also girl servants, now dressed like the urban population. They followed the latest fashion, including silk items imported
34 Vries (2008).35 Sylwan (1896, pp. 496–504); Sylwan (1896, p. 430 n 2).36 On England see Lemire (1988). 37 Söderlund (1949).38 Svensson (1969, p. 82).39 Nordenström (1923, p. 60).

Exchange rates, prices, and wages, 1277–2008466
by the Swedish East India Company, and other colourful fabrics.40 In response to increased demand, cottage production of textiles grew in many rural areas and seems to have been better adapted to local demands than were the products of manufacto-ries in the capital.
De-industrialization in Stockholm thus went hand in hand with industrial (or proto-industrial) growth in rural areas. Like the changes in the previous period, this is also part of a broader European pattern, or what de Vries labels a new urbanization period from 1750 to 1800/1850. These regional shifts can also be interpreted against the background of the new consumer aspirations that were driving the industrious revolution. Much of the urban growth now took place in relatively small cities, stim-ulated by relative price shifts to the advantage of agrarian producers.41
9.5. The period after 1800
The dominant feature of Figure 9.1 is of course the steep increase in real wages after 1800. Real wages rose after the Napoleonic wars, as grain prices declined, but this growth did not continue in the second quarter of the 19th century. The first sus-tained rise in the purchasing power of labour did not materialize until after about
40 Gaslander (1982, pp. 66–8).41 Vries (1984).
Skeppsbron in 1860, in the old town of Stockholm, by Carl Johan Billmark (1804–70).Source: http://sv.wikipedia.org/wiki/Fil:Skeppsbron_1860_Carl_Johan_Billmark.jpg

9. Long-term trends in real wages of labourers 467
1870, when industrialization gained ground. At about that time, real wages of unskilled labourers in Stockholm began to depart from those of agricultural labour-ers in rural Sweden, as is evident from Figure 9.3.
Already by 1900, real wages were substantially higher than ever before. A new industrial structure was established in Stockholm. Mechanical engineering and typo-graphic industry, relying on relatively high wages, became key branches. Low-wage branches, such as the textile and match industries, could not survive in the capital and had to relocate to regions where wages were lower.
In 1895, the working day of Stockholm building labourers was still as long as 12 hours in the summer half of the year (April to September). By 1900, the working day had been shortened to 10 hours and the 48-hour week was introduced in 1920.42 In other words, an unprecedented wage rise went hand in hand with a substantial short-ening of working hours. This further underscores the improvement of labourers’ conditions connected with industrialization.
9.6. Volatility in real wages and prices
International research has emphasized that fluctuations in real wages (or in prices of basic necessities) can be seen as a welfare indicator. Large swings from one year to another had serious welfare implications. In times of falling prices, this could give rise to unforeseen increases in purchasing power, as nominal wages were inflexible. But in years of crisis, surging prices increased the risk of malnutrition and excess mortality. Unstable prices were a fundamental problem of pre-industrial economies due to the large fluctuations they caused in living conditions. Stable prices enhanced welfare by facilitating more regular provisioning with basic foodstuffs.43 The Italian economic historian, Carlo Cipolla, interprets the standard medieval economic policy of price regulation against the background of unstable prices and their repercussions on living standards.44
For this reason, it is important to assess not only the level of real wages but also the magnitude of the fluctuations around the trend. From Figure 9.1 it is immedi-ately obvious that the real wages of Stockholm labourers became more stable in the long run. The short-term fluctuations around the trend were clearly greater before the mid-18th century than afterwards. In other words, volatility was reduced. Figure 9.4 and Table 9.2 provide a clearer picture of how volatility has changed.
42 Bagge et al. (1935, Vol I, pp. 14–5).43 Persson (1999, p. 23, p. 31). 44 Cipolla (1967, pp. 404–7).

Exchange rates, prices, and wages, 1277–2008468
Figure 9.4. Volatility of real wages of labourers in Stockholm/Sweden 1468–2004, measured as the percentage year-on-year change in real wages.
Source: Table A9.1.
-100
-50
0
50
100
150
1450 1500 1550 1600 1650 1700 1750 1800 1850 1900 1950 2000
-100
-50
0
50
100
150
200
250
300
350
1250 1300 1350 1400 1450 1500 1550 1600 1650 1700 1750 1800 1850 1900 1950 2000
Figure 9.5. Volatility of the defl ator CPI, 1291–2004, measured as the percentage year-on-year change in the CPI.
Note: Missing values in the defl ator CPI have been interpolated.Source: Table A9.1.

9. Long-term trends in real wages of labourers 469
Table 9.2. Volatility in real wages and in the defl ator CPI, 1291–2004, measured as the standard deviation of the percentage year-on-year change.
Period Volatility of
real wages
Volatility of
deflator CPI
1291–1399 38.1
1400–99 17.8
1500–99 20.0 19.2
1600–99 16.4 14.7
1700–99 13.3 12.6
1800–99 9.5 6.9
1900–2004 4.7 7.0
Source: Table A9.1.
Due to the scarcity of medieval wage data, real wage volatility cannot be calculated before the 16th century. Price data are more continuous, however. This makes it possible to give a picture of price volatility for earlier periods. Figure 9.5 and Table 9.2 suggest that price volatility, as measured by the deflator CPI, was quite high dur-ing the period 1291–1399. However, the calculation of price volatility for this early period should be viewed with caution since data are sparse and the extremely high price in 1313 (which should perhaps be dated to the harvest year 1315) has a strong impact on the result. It should be added, however, that the period 1315–17 is well-known for harvest failures in northern Europe, probably the worst during the cen-tury. Crops were damaged by cold and wet weather, and the grain shortage led to extremely high prices.45
Data availability is much better from the early 15th century onwards. The fairly high level of volatility in the 15th century, and even more so in the 16th century, is probably realistic. The years of monetary crisis, described in Chapter 8 above, con-tributed to the high volatility in the 16th century. After that, volatility decreased for
45 Kershaw (1973, pp. 6–10); Jordan (1996, pp. 15–6, 50–2). Th e price of wheat and barley in England, in grams of silver per litre, was higher in 1316 and 1317 than in any other year between the start of the series in 1209 and the years 1623 and 1637, respectively. See the large price data fi le compiled by Gregory Clark, England_1209-1914_(Clark).xls, available from Global Price and Income History Group, http://gpih.ucdavis.edu/. At Lübeck, the very high price of rye in 1315 was noted by the chronicler Detmar; Lucas (1930, p. 353). Danish chroniclers also wrote about the high prices this year following the destruction of crops by rain; Historiske kild-eskrifter og bearbejdelser af dansk historie især fra det 16. aarhundrede, Vol. 1 (1873, p. 589). Th e Swedish price record from 1313 stems from the 15th-century chronicler Ericus Olai, who used a now lost source; Ahnlund (1953, p. 161). It is possible that this quotation should be dated to the harvest year of 1315 instead, since it seems unlikely that Sweden escaped this harvest fail-ure. Jordan (1996, p. 194 note 63) refers to Swedish chronicles mentioning unusual thunder and terrible displays of lightning in 1315. Th e rainy weather may be connected with an erup-tion of the volcano Kaharoa in New Zealand, which lasted about five years; Nairn et al (2004).

Exchange rates, prices, and wages, 1277–2008470
prices as well as real wages. The parallel trend is not surprising since short-run fluc-tuations in real wages were primarily due to changing prices of the goods included in the CPI, especially the price of grains, not to fluctuating nominal wages.
The reduction in the volatility of prices and real wages suggests more regular pro-visioning, leading to more stable living conditions after the 16th century. This reduc-tion continued throughout the pre-industrial era, no doubt due in part to the expan-sion of trade in the Baltic area in the 17th century, enabling Sweden to import grains from Livonia and other regions in times of high prices or harvest failures. It is also likely that Swedish harvests became more stable during the 19th century, producing a substantial decline in price volatility.
During the industrial period, prices as well as real wages became even more stable in the short run, despite temporary upturns during the World Wars. In particular, the First World War had a strong impact on price volatility. For this reason, overall price volatility during the period 1900–2004 was of the same magnitude as during the 19th century.
9.7. Concluding discussion
The real wage trends during the period up to about 1800 seem to agree with an eco-nomic model of the type presented by Thomas Robert Malthus more than two hun-dred years ago. According to Malthus, no long-term improvement in living standards was possible because population growth would tend to exceed the increase in food production. If the population declined (e.g., due to epidemics, famine, or war), the price of labour would rise. This would lead to an improvement for the labourers, but only temporarily, since renewed population growth would soon press real wages down again. Land reclamation could not solve the problem since the cultivation of less productive marginal lands would lead to rising food prices. Malthus assumed that agricultural productivity could not rise in the longer run. The actual pattern in Sweden, as well as in many other parts of Europe, fits this model fairly well. We have seen that strong population growth during most of the 16th and 18th centuries pushed real wages down, whereas real wages improved during the 17th century when population pressure was weaker.
No sustained growth in real wages occurred in the pre-industrial era. The years around 1800 were characterized by lower real wages than in any other period (though single years with even lower wages can be found in connection with the harvest fail-ures of the late 1590s). Real wages improved from the early 19th century onwards. Yet it was not until industrialization had gained momentum around 1870 that the highest levels in the pre-industrial era were surpassed. With industrialization, the Malthusian mechanism was no longer effective, as population as well as real wages surged upwards.
During the pre-industrial era up to 1800, an unskilled labourer could buy approx-imately 1 kg of butter for his daily wage. In 2004, the average male industrial worker

9. Long-term trends in real wages of labourers 471
could buy 25 times as much for his pre-tax daily wage. Despite some setbacks during the two world wars and a tendency towards weaker growth after the late 1970s, real wage development in the last two centuries is one of strong and almost uninter-rupted growth.
Volatility in real wages and prices has been used here as a welfare indicator, based on the assumption that large swings in these variables were harmful to labourers. The evolution of volatility tells a somewhat different story than does the mere movement of real wages. Prices as well as real wages became more stable in the long run, as the short-term fluctuations were already diminishing in the 17th century, followed by further reductions during the subsequent century. This levelling tendency is proba-bly due to the expansion of trade in grains, resulting in a more regular supply. So even if Stockholm labourers did not enjoy any sustained rise in real wages before the advent of industrialization, at least they benefited from more stable prices and wages.

Exchange rates, prices, and wages, 1277–2008472
Table A9.1. Daily nominal wage (in öre 1365-1624, öre kopparmynt 1625-1776, skilling 1777-1788, and skilling riksgälds 1789-1850), daily wage in gram silver, and real wage 1365-1850 (1950=100).
Year
No -
minal
wage
Gram
silver
Real
wageYear
No -
minal
wage
Gram
silver
Real
wageYear
No -
minal
wage
Gram
silver
Real
wage
1365 1 4.0 18 1552 3 2.7 17 15944
(16i)2.8 13
1430 0.83 2.2 16 1553 3 2.7 15 1595 5 3.6 14
1440 0.83 2.2 19 1554 3 2.4 15 1596 5 3.6 11
1467 1 2.6 22 1555 3 2.7 15 1597 5 3.6 9
1468 1 2.4 22 1556 3 2.7 14 1598 5 3.6 11
1476 1 2.2 24 1557 3 2.7 16 1599 5 3.6 11
1478 1 2.4 30 1558 3 2.6 16 1600 5 3.6 14
1496 1 2.3 25 1559 3 2.6 15 1601 4.5 3.1 10
1497 1 2.3 27 1560 3 2.6 14 1602 5 3.6 10
1501 1 1.8 23 1561 3.5 2.8 16 1603 5 3.6 11
1502 1 1.8 27 1562 3.5 2.8 13 1604 5 3.5 11
1509 1 1.7 15 1563 4.42 3.1 15 1605 5 3.6 12
1510 1.17 2.0 20 1564 5.33 3.4 14 1606 5 3.6 12
1512 1 1.7 19 1565 5.33 2.8 14 1607 5 3.6 11
1513 1.33 2.1 23 1566 8 4.1 22 1608 5 3.0 11
1516 1.33 2.5 25 1567 8 3.9 19 1609 6 3.7 12
1517 1.33 2.2 20 1568 8 3.4 17 1610 6 3.7 11
1518 1.33 1.9 21 1569 9 3.2 17 1611 6 3.2 12
1519 1.33 1.9 16 1570 10 3.2 14 1612 6 3.2 11
1520 1.33 2.0 21 1571 11 2.7 11 1613 6 2.7 11
1521 1.33 1.4 14 1572 11 1.8 10 1614 6.25 3.2 10
1522 1.33 0.8 10 1573 12 1.5 8 1615 6.5 3.2 11
1523 2.25i 1.0 11 1574 16 1.6 11 1616 7 3.4 12
1524 1 1.2 12 1575 21.33 2.4 15 1617 7 3.5 13
1525 1 1.4 12 1576 4 3.2 14 1618 7 3.4 11
1526 1 1.3 15 1577 4 3.0 15 1619 8 3.9 14
1529 1 1.1 11 1578 4 2.9 14 1620 8 3.9 16
1536 1 1.0 11 1579 4 3.0 14 1621 8 3.9 19
1537 1 1.1 11 1580 4 3.0 13 1622 8 3.9 16
1539 2 2.0 17 1581 4 3.0 14 1623 8 3.9 14
1540 2 1.7 17 1582 4 3.0 15 1624 8 3.9 14
1541 2.25 2.2 18 1583 4 3.0 15 1625 9 4.3 16
1542 2 2.1 14 1584 4 3.0 15 1626 9 4.1 14
1543 3 3.2 20 1585 4 3.0 14 1627 10 4.6 14
1544 3 2.7 19 1586 4 2.8 13 1628 12 4.0 12
1545 2.63 2.1 16 1587 4 2.8 13 1629 14 3.1 14
1546 2.25 1.8 16 1588 4 2.8 11 1630 18 3.7 13
1547 2.25 1.7 15 1589 4 2.8 12 1631 20 3.9 15
1548 2.5 2.0 16 1590 4 2.8 11 1632 16 3.4 13
1549 2.5 1.9 13 1591 4 2.7 11 1633 16 3.5 10
1550 3 2.5 15 15922
(8i)1.6 6 1634 16 3.9 11
1551 3 2.7 15 15932.75
(11i)2.0 7 1635 18 4.2 13
9. Long-term trends in real wages of labourers 473
Year
No -
minal
wage
Gram
silver
Real
wageYear
No -
minal
wage
Gram
silver
Real
wageYear
No -
minal
wage
Gram
silver
Real
wage
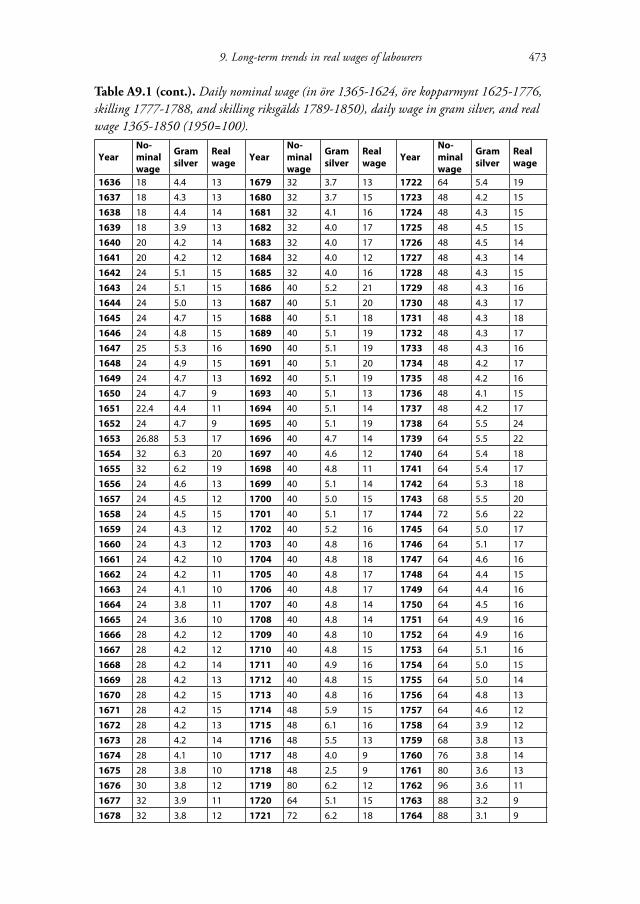
1636 18 4.4 13 1679 32 3.7 13 1722 64 5.4 19
1637 18 4.3 13 1680 32 3.7 15 1723 48 4.2 15
1638 18 4.4 14 1681 32 4.1 16 1724 48 4.3 15
1639 18 3.9 13 1682 32 4.0 17 1725 48 4.5 15
1640 20 4.2 14 1683 32 4.0 17 1726 48 4.5 14
1641 20 4.2 12 1684 32 4.0 12 1727 48 4.3 14
1642 24 5.1 15 1685 32 4.0 16 1728 48 4.3 15
1643 24 5.1 15 1686 40 5.2 21 1729 48 4.3 16
1644 24 5.0 13 1687 40 5.1 20 1730 48 4.3 17
1645 24 4.7 15 1688 40 5.1 18 1731 48 4.3 18
1646 24 4.8 15 1689 40 5.1 19 1732 48 4.3 17
1647 25 5.3 16 1690 40 5.1 19 1733 48 4.3 16
1648 24 4.9 15 1691 40 5.1 20 1734 48 4.2 17
1649 24 4.7 13 1692 40 5.1 19 1735 48 4.2 16
1650 24 4.7 9 1693 40 5.1 13 1736 48 4.1 15
1651 22.4 4.4 11 1694 40 5.1 14 1737 48 4.2 17
1652 24 4.7 9 1695 40 5.1 19 1738 64 5.5 24
1653 26.88 5.3 17 1696 40 4.7 14 1739 64 5.5 22
1654 32 6.3 20 1697 40 4.6 12 1740 64 5.4 18
1655 32 6.2 19 1698 40 4.8 11 1741 64 5.4 17
1656 24 4.6 13 1699 40 5.1 14 1742 64 5.3 18
1657 24 4.5 12 1700 40 5.0 15 1743 68 5.5 20
1658 24 4.5 15 1701 40 5.1 17 1744 72 5.6 22
1659 24 4.3 12 1702 40 5.2 16 1745 64 5.0 17
1660 24 4.3 12 1703 40 4.8 16 1746 64 5.1 17
1661 24 4.2 10 1704 40 4.8 18 1747 64 4.6 16
1662 24 4.2 11 1705 40 4.8 17 1748 64 4.4 15
1663 24 4.1 10 1706 40 4.8 17 1749 64 4.4 16
1664 24 3.8 11 1707 40 4.8 14 1750 64 4.5 16
1665 24 3.6 10 1708 40 4.8 14 1751 64 4.9 16
1666 28 4.2 12 1709 40 4.8 10 1752 64 4.9 16
1667 28 4.2 12 1710 40 4.8 15 1753 64 5.1 16
1668 28 4.2 14 1711 40 4.9 16 1754 64 5.0 15
1669 28 4.2 13 1712 40 4.8 15 1755 64 5.0 14
1670 28 4.2 15 1713 40 4.8 16 1756 64 4.8 13
1671 28 4.2 15 1714 48 5.9 15 1757 64 4.6 12
1672 28 4.2 13 1715 48 6.1 16 1758 64 3.9 12
1673 28 4.2 14 1716 48 5.5 13 1759 68 3.8 13
1674 28 4.1 10 1717 48 4.0 9 1760 76 3.8 14
1675 28 3.8 10 1718 48 2.5 9 1761 80 3.6 13
1676 30 3.8 12 1719 80 6.2 12 1762 96 3.6 11
1677 32 3.9 11 1720 64 5.1 15 1763 88 3.2 9
1678 32 3.8 12 1721 72 6.2 18 1764 88 3.1 9
Table A9.1 (cont.). Daily nominal wage (in öre 1365-1624, öre kopparmynt 1625-1776, skilling 1777-1788, and skilling riksgälds 1789-1850), daily wage in gram silver, and real wage 1365-1850 (1950=100).

Exchange rates, prices, and wages, 1277–2008474
Table A9.1 (cont.). Daily nominal wage (in öre 1365-1624, öre kopparmynt 1625-1776, skilling 1777-1788, and skilling riksgälds 1789-1850), daily wage in gram silver, and real wage 1365-1850 (1950=100).
Year
No -
minal
wage
Gram
silver
Real
wage Year
No -
minal
wage
Gram
silver
Real
wage Year
Gram
silver
Real
wage
1765 96 3.5 10 1808 20 7.1 8 1851 7.6 15
1766 112 4.7 14 1809 20 5.5 8 1852 7.6 16
1767 112 6.0 17 1810 20 4.4 8 1853 7.6 14
1768 88 5.6 15 1811 24 3.7 8 1854 8.0 15
1769 88 4.7 15 1812 24 4.5 7 1855 8.0 13
1770 88 4.1 14 1813 33 6.2 10 1856 9.6 14
1771 88 4.2 11 1814 33 5.9 10 1857 9.6 15
1772 112 5.0 14 1815 33 5.3 11 1858 11.2 20
1773 112 4.4 15 1816 33 4.8 10 1859 11.2 20
1774 112 4.6 17 1817 33 5.1 10 1860 9.6 16
1775 96 4.3 12 1818 33 5.1 10 1861 9.6 15
1776 112 5.0 14 1819 33 4.5 10 1862 9.6 16
17779.33ii
(112iii)5.0 14 1820 33 4.2 11 1863 9.6 17
1778 9.33 5.0 13 1821 30 4.1 10 1864 9.0 16
1779 9.33 5.0 13 1822 30 4.1 10 1865 9.7 18
1780 9.33 5.0 13 1823 37.5 5.1 14 1866 9.3 16
1781 9.33 5.0 13 1824 42 5.5 15 1867 9.7 15
1782 9.33 5.0 13 1825 49.5 6.7 17 1868 10.4 16
1783 9.33 5.0 12 1826 49.5 6.5 15 1869 11.0 19
1784 9.33 5.0 13 1827 49.5 6.1 16 1870 10.5 18
1785 9.33 5.0 12 1828 49.5 6.6 17 1871 10.8 18
1786 9.33 5.0 12 1829 54 7.4 18 1872 12.2 20
1787 9.33 5.0 13 1830 54 7.0 17 1873 13.0 19
1788 9.33 5.0 12 1831 51 6.1 15 1874 14.5 21
1789 9.33 4.9 12 1832 51 5.9 16 1875 15.0 21
1790 9.33 4.6 12 1833 54 6.3 17 1876 15.5 20
1791 9.33 4.5 12 1834 54 6.7 17 1877 15.5 21
1792 9.33 4.5 11 1835 54 7.2 17 1878 15.4 22
1793 9.33 4.5 11 1836 54 7.2 16 1879 14.7 22
1794 10.67 4.7 11 1837 54 7.2 16 1880 15.2 22
1795 10.67 5.1 10 1838 54 7.2 15 1881 16.1 22
1796 10.67 5.2 10 1839 54 7.2 16 1882 16.6 23
1797 10.67 5.2 10 1840 54 7.2 16 1883 17.0 23
1798 10.67 4.7 9 1841 54 7.2 15 1884 17.2 25
1799 10.67 4.0 8 1842 54 7.2 15 1885 17.8 26
1800 10.67 4.0 7 1843 54 7.2 16 1886 18.6 27
1801 10.67 3.8 7 1844 54 7.2 17 1887 18.9 28
1802 10.67 3.8 7 1845 54 7.2 16 1888 20.2 27
1803 12 4.3 8 1846 54 7.2 15 1889 21.5 28
1804 16 5.7 10 1847 54 7.2 15 1890 19.7 28
1805 16 5.7 10 1848 54 7.2 16 1891 21.2 27
1806 16 5.7 9 1849 54 7.2 16 1892 24.3 29
1807 16 5.7 9 1850 57 7.6 16 1893 27.9 30

9. Long-term trends in real wages of labourers 475
Table A9.1 (cont.). Daily nominal wage (in öre 1365-1624, öre kopparmynt 1625-1776, skilling 1777-1788, and skilling riksgälds 1789-1850), daily wage in gram silver, and real wage 1365-1850 (1950=100).
Year Gram silver Real wage Year Real wage Year Real wage
1894 34.6 32 1915 39 1936 71
1895 34.0 32 1916 38 1937 72
1896 34.1 33 1917 38 1938 74
1897 40.0 33 1918 37 1939 74
1898 43.4 34 1919 45 1940 71
1899 44.4 34 1920 55 1941 67
1900 45.0 34 1921 67 1942 69
1901 46.8 35 1922 58 1943 72
1902 53.9 35 1923 59 1944 74
1903 53.0 36 1924 60 1945 78
1904 51.4 37 1925 61 1946 83
1905 50.3 37 1926 64 1947 93
1906 47.7 38 1927 64 1948 95
1907 51.6 38 1928 65 1949 98
1908 65.4 38 1929 67 1950 100
1909 69.0 40 1930 70
1910 69.4 42 1931 72
1911 70.7 42 1932 71
1912 64.4 41 1933 72
1913 66.7 42 1934 72
1914 74.7 43 1935 71
i In klipping coins.ii In skilling.iii In öre kopparmynt. 1 daler kopparmynt (in 1625-1777) = 32 öre kopparmynt.

Exchange rates, prices, and wages, 1277–2008476
References
Digital sources
Global Price and Income History Group, England_1209-1914_(Clark).xls. Online at: http://gpih.ucdavis.edu/
SDhk = Svenskt diplomatariums huvudkartotek över medeltidsbreven. Online at: www.ra.se/ra/diplomat.html
Published sources
Abel, W (1967), Agricultural Fluctuations in Europe from the Th irteenth to the Twenti-eth Centuries, Methuen, London.
Ahnlund, N (1953), Stockholms historia före Gustav Vasa, Monografi er utgivna av Stockholms kommunalförvaltning, Stockholm.
Allen, R C (2007), Pessimism Preserved: Real Wages in the British Industrial Revo-lution, Oxford University Department of Economics Working Paper 314, Oxford.
Artéus, G (1982), Krigsmakt och samhälle i frihetstidens Sverige, Militärhistoriska för-laget, Stockholm.
Bagge, G, E Lundberg and I Svennilsson (1935), Wages in Sweden 1860–1930, Vol. I–II, P S King & Son, London.
Bladh, C (1991), Månglerskor. Att sälja från bod och korg i Stockholm 1819–1846, Stockholmsmonografi er utgivna av Stockholms stad, Stockholm.
Bowden, P (1967), ‘Agricultural prices, farm profi ts, and rents’, in J Th irsk (ed.), Th e Agrarian History of England and Wales IV, Cambridge University Press, Cam-bridge.
Braudel, F and F Spooner (1967), ‘Prices in Europe from 1450 to 1750’, Cambridge Economic History of Europe IV, Cambridge University Press, Cambridge.
Brown, H Phelps and S V Hopkins (1981), A Perspective of Wages and Prices, Meth-uen, London.
Cipolla, C M (1963), ‘Th e Italian and Iberian Peninsula’, in M M Postan, E E Rich and E Miller (eds.), Th e Cambridge Economic History of Europe III. Economic Organization and Policies in the Middle Ages, Cambridge University Press, Cam-bridge.
Clark, G (2005), ‘Th e Condition of the Working-Class in England, 1209–2004”, Journal of Political Economy, Vol. 113(6), pp. 1307–1340.
Clark, G (2007a), A Farewell to Alms: A Brief Economic History of the World, Prince-ton University Press, Princeton.
Clark G (2007b), ‘Farm Wages, Population and Economic Growth, England, 1209-1869’, Economic History Review, Vol. 60(1), pp. 97–135.
Dahlbäck, G (1987), I medeltidens Stockholm, Stockholms medeltidsmuseum, Stock-holm.
9. Long-term trends in real wages of labourers 477
Feinstein, C (1998), ‘Pessimism Perpetuated: Real Wages and the Standard of Living in Britain during and after the Industrial Revolution’, Journal of Economic His-tory, Vol. 58, No. 3 (Sep., 1998), pp. 625–658.
Felloni, G (1977), ‘Italy’, in C Wilson and G Parker (eds.), An Introduction to the Sources of European Economic History 1500-1800, Weidenfeld & Nicolson, Lon-don.
Gaslander, P (1982), Beskrifning om svenska allmogens sinnelag och seder, Västbo härad, Småland [1774], Rediviva, Stockholm.
Handlingar rörande Helga lekamens gille II–IV (1923), I Collijn (ed.), Almqvist & Wiksell, Stockholm.
Herlitz, L (1974), Jordegendom och ränta. Omfördelningen av jordbrukets merprodukt i Skaraborgs län under frihetstiden, Ekonomisk-historiska institutionen, Göte-borg.
Historiske kildeskrifter og bearbejdelser af dansk historie især fra det 16. aarhundrede, Vol. 1 (1873), Holger Rørdam (ed.), Monumenta historiæ danicæ, København.
Hobsbawm, E J (1965), ‘Th e General Crisis of the European Economy in the Seven-teenth Century’, in T Aston (ed.), Crisis in Europe, 1560–1660, London.
Höjer, T (1967), Sockenstämmor och kommunalförvaltning i Stockholm fram till 1864, Monografi er utgivna av Stockholms kommunalförvaltning, Stockholm.
Jansson, A, L A Palm and J Söderberg (1991), Dagligt bröd i onda tider: priser och löner i Stockholm och Västsverige 1500–1700, Institutet för lokalhistorisk forskn-ing, Göteborg.
Jordan, W C (1996), Th e Great Famine: Northern Europe in the Early Fourteenth Cen-tury, Princeton University Press, Princeton.
Jörberg, L (1972), A History of Prices in Sweden, Vol. I, Gleerup, Lund. Kershaw, I (1973), ‘Th e Great Famine’, Past and Present No. 59, pp. 3–50. Kriedte, P (1983), Peasants, Landlords and Merchant Capitalists; Europe and the World
Economy, 1500–1800, Berg, Oxford. Lemire, B (1988), ‘Consumerism in Preindustrial and Early Industrial England: Th e
Trade in Secondhand Clothes’, Journal of British Studies, Vol. 27 (Jan.), pp. 1–24.
Lucas, H S (1930), ‘Th e Great European Famine of 1315, 1316, and 1317’, Specu-lum, Vol. 5, No. 4 (Oct.), pp. 343–77.
Myrdal, J and J Söderberg (2002), Th e Agrarian Economy of Sixteenth-Century Swe-den, Almqvist & Wiksell International, Stockholm.
Nairn, I A et al (2004), ‘Rhyolite Magma Processes of the AD 1315 Kaharoa Erup-tion Episode, Tarawera Volcano, New Zealand’, Journal of Volcanology and Geo-thermal Research, Vol. 131, pp. 265–294.
Nordenström, M M (1923), Utkast till beskrifning öfwer Stöde socken vid Medelpads södra ådal belägen, N J G Wide (ed.), Ledin, Sundsvall.
Olsson, G (1946), ‘Freden i Köpenhamn 1509’, Studier tillägnade Curt Weibull, Elanders, Göteborg.

Exchange rates, prices, and wages, 1277–2008478
Persson, K G (1999), Grain Markets in Europe, 1500–1900: Integration and Deregu-lation, Cambridge University Press, Cambridge.
Pursche, W (1979), Timmermansämbetet i Stockholm före år 1700, Stockholms bygg-mästareförening, Stockholm.
Scholliers, E (1960), Loonarbeid en honger: de levensstandaard in de XVe en XVIe eeuw te Antwerpen, Antwerp.
Slicher van Bath, B H (1963), Th e Agrarian History of Western Europe, Edward Arnold, London.
Sommarin, E (1908), Bidrag till kännedom om arbetareförhållanden vid svenska berg-verk och bruk, Univ, Lund.
Statistisk årsbok för Stockholms stad, Vol. 38 (1905), Stockholms stads statistiska kon-tor, Stockholm.
Stockholms stads skottebok 1460–1468 (1926), J A Almqvist (ed.), Samfundet för utgivande av handskrifter rörande Skandinaviens historia, Stockholm.
Stockholms stads skottebok 1501–1510 (1915), H Hildebrand (ed.), Samfundet för utgivande av handskrifter rörande Skandinaviens historia, Stockholm.
Stockholms stads tänkeböcker 1474–1483 samt burspråk (1917), E Hildebrand (ed.), Samfundet för utgivande av handskrifter rörande Skandinaviens historia, Stock-holm.
Stockholms stads tänkeböcker 1492–1500 (1930), J A Almqvist (ed.), Samfundet för utgivande av handskrifter rörande Skandinaviens historia, Stockholm.
Svensson, S (1969), Bygd och yttervärld, Nordiska museet, Stockholm. Sylwan, O (1896), ‘Vår första dagstidning’, Ord och Bild, Vol. 3.Sylwan, O (1896), Svenska pressens historia till statshvälfningen 1772, Gleerup,
Lund.Söderberg, J (1987a), ‘Hade Heckscher rätt? Priser och reallöner i 1500-talets Stock-
holm’, Historisk tidskrift, Vol. 107, pp. 341–356.Söderberg, J (1987b), ‘Real Wage Trends in Urban Europe, 1730-1850: Stockholm in
a Comparative Perspective’, Social History, Vol. 12, pp. 155–176.Söderberg, J, U Jonsson and C Persson (1991), A Stagnating Metropolis: Th e Economy
and Demography of Stockholm, 1750–1850, Cambridge University Press, Cam-bridge.
Söderlund, E (1949), Hantverkarna, Vol. II, Tiden, Stockholm. Utterström, G (1978), Fattig och föräldralös i Stockholm på 1600- och 1700-talen,
Universitetsbiblioteket, Umeå.Vries, J de (1984), European Urbanization 1500–1800, Methuen, London. Vries, J de (2008), Th e Industrious Revolution: Consumer Behavior and the Household
Economy, 1650 to the Present, Cambridge University Press, Cambridge.