9. data modeling (entity relationship diagrams) system analysis and design program: bscs ii (advent...
TRANSCRIPT

9. Data Modeling 9. Data Modeling
(Entity Relationship (Entity Relationship Diagrams)Diagrams)
System Analysis And Design
Program: BSCS II (Advent Semester – 2014)
Lecturer: Rebecca Asiimwe
Email: [email protected]

Key Definitions
Slide 2
• A data model describes the data that flows through business processes in an organization.
• During the analysis phase, the data models present the logical organization of data without indicating how the data are stored, created or manipulated.
• In the design phase, the data model is changed to reflect how the data will be stored in databases and files.

Data model
Slide 3
• Analysts create process models to represent how business systems will operate
• They need to understand the information that is used and created by the business system- data modeling
• A data model shows the people, places and things of interest to an organization and the relationships among them.
• The logical data model shows the organization of data without indicating how it is stored, created, or manipulated.
• A physical data model shows how the data will actually be stored in the database.
• Normalization is the process analysts use to check for data redundancy.

The Entity-Relation Diagram (ERD)
Slide 4

What is an ERD?
Slide 5
• A picture showing the information created, stored, and used by a business system.
• Analysts can read an ERD to find out the individual pieces of information in a system and how they are related to each other.
• Special symbols are added on the ERD to communicate high-level business rules that need to be supported by the system
• Entities generally represent people, places, and things of interest to the organization.
• Lines are drawn between entities to represent relationships among the data (entities).

Using the ERD to Show Business Rules
Slide 6
• ERD symbols can show when one example of an entity must exist for an example of another to exist– A product must exist before it can be sold
• ERD symbols can show when one example of an entity can be related to only one or many examples of another entity– One doctor can have many patients, each
patient may have only one primary doctor

ERD Elements
Slide 7

Entity
Slide 8
• It’s a basic building block for a data model
• An entity is a person , place, event or thing about which data is collected. E.g. employee, an order, student
• It’s depicted by a rectangle and it is described by a singular noun.
• An entity has a name and an identifier- a way to locate information in the entity

Entities and Instances
Slide 9
Attributes
Slide 10
• Information captured about an entity e.g date of birth, first name, ID number e.t.c
• Only those used by the organization should be included in the model
• Attribute names are nouns
• Sometimes entity name is added at the beginning of the attribute name like student ID, student fName, student DOB.

Identifiers
Slide 11
• The identifier consists of one or more attributes that can uniquely identify each instance of the entity.
• Called Primary Keys

Identifier Types
Slide 12

Relationships
Slide 13
• Associations between entities• Connected by a line• Every relationship has a parent entity and
child entity• Should be labeled with active verb names
– One verb can describe a relationship in both directions
– Two verbs can describe each relationship

Cardinality
Slide 14
• Cardinality refers to the number of times instances in one entity can be related to instances in another entity– One instance in an entity refers to one and only
one instance in the related entity (1:1)– One instance in an entity refers to one or more
instances in the related entity (1:M)– One or more instances in an entity refer to one or
more instances in the related entity (M:M)

• A one-to-one relationship occurs where a single occurrence of one entity relates to one occurrence of a second entity.
• One student fills one seat and one seat is filled by one student.
15
One-to-One Relationship (1:1)
Student Seatfills

Establishing RelationshipsOne-To-One
16

Establishing RelationshipsOne-To-One: Logical View
17

Establishing RelationshipsOne-To-One: Data Example
18

Establishing RelationshipsOne-To-Many
19

• One-to-Many relationships occur when a single entity instance is related to many occurrences of a second entity.
• One customer places one or many orders
20
One-to-Many Relationship(1:N)
Customer Ordersplaces

Establishing RelationshipsOne-To-Many: Logical View
21

Establishing RelationshipsOne-To-Many : Data Example
22

• Many-to-many relationships occur where many instances of an entity relate to many instances of a second entity.
• These relationships usually contain a hidden entity which should be extracted
• Usually M:M relationships are broken into one or more pairs of one-to-many relationships
23
Many-to-Many Relationship (M:M)

Establishing RelationshipsMany-To-Many
24

Establishing RelationshipsMany-To-Many: Logical View
25

Establishing RelationshipsMany-To-Many: Data Example
26

Relationship Cardinality
Cardinality
One and only one
0 or 1
1 or more
0 or many
More than 1
Graphic
||
27

Example of an ERD
28

Modality
Slide 29
• Modality refers to the minimum number of times that an instance in one entity can be related to an instance in another entity– One means that an instance in the related
entity must exist for an instance in another entity to be valid
– Zero means that no instance in the related entity is necessary for an instance in another entity to be valid

Metadata
Slide 30
• Information about components of the model
• Metadata is stored in a repository so it can be shared by developers and users throughout the SDLC

Metadata Examples
Slide 31
An Entity can be described by:
An Attribute can be described by:
A Relationshipcan be described by:
NameDefinitionNotes
NameDescriptionAliasAcceptable ValuesFormatNotes
Verb phraseDefinitionCardinalityModalityNotes

Creating An Entity-Relationship Diagram
Slide 32

ERD Basics
Slide 33
• Drawing the ERD is an iterative process of trial and revision.
• ERDs can become quite complex, so it takes considerable practice.
Steps in Building ERDs
Slide 34
• Identify the entities
• Add appropriate attributes for each entity.
• Draw the relationships among entities to show how they are associated with one another.

ERD Building Tips
Slide 35
• Data stores of the DFD should correspond to entities
• Only include entities with more than one instance of information
• Don’t include entities associated with implementation of the system like the programmers, or the HW and SW components of the system. Focus on the data gathered about various objects/entities – data that your system captures and works with.

Design Guidelines
Slide 36
Best practices (rather than rules)– Entities should have many occurrences
– Avoid unnecessary attributes
– Clearly label all components
– Apply correct cardinality and modality
– Break attributes into lowest level needed e.g name can be broken down into first_name & last_name, address can be broken down into postal_address & physical_address
– Labels should reflect common business terms
– Assumptions should be clearly stated

Balancing ERDs with DFDs
Slide 37
• All analysis activities are interrelated• Process models contain two data components
– Data flows and data stores• The DFD data components need to balance the
ERD’s data stores (entities) and data elements (attributes)
• Check that all data stores and elements correspond between models
• Do not follow thoughtlessly -- check that the models make sense!

Summary
Slide 38
• The ERD is the most common technique for drawing data models. The building blocks of the ERD are:– Entities describe people, places, or things– Attributes capture information about the entity– Relationships associate data across entities
• Intersection, dependent, and independent entities must be recognized.
• The ERD must be balanced with the DFD.

Exercises:
• A company database needs to store information about employees (identified by employee_ID, fname, lname, salary and phone as attributes), departments (identified by department_ID, with department_name and budget as attributes), and children of employees ( identified by child_ID, name, employee_ID and age as attributes). Every employee belongs to one department.
• Draw an ERD for this scenario.
39
Exercises:
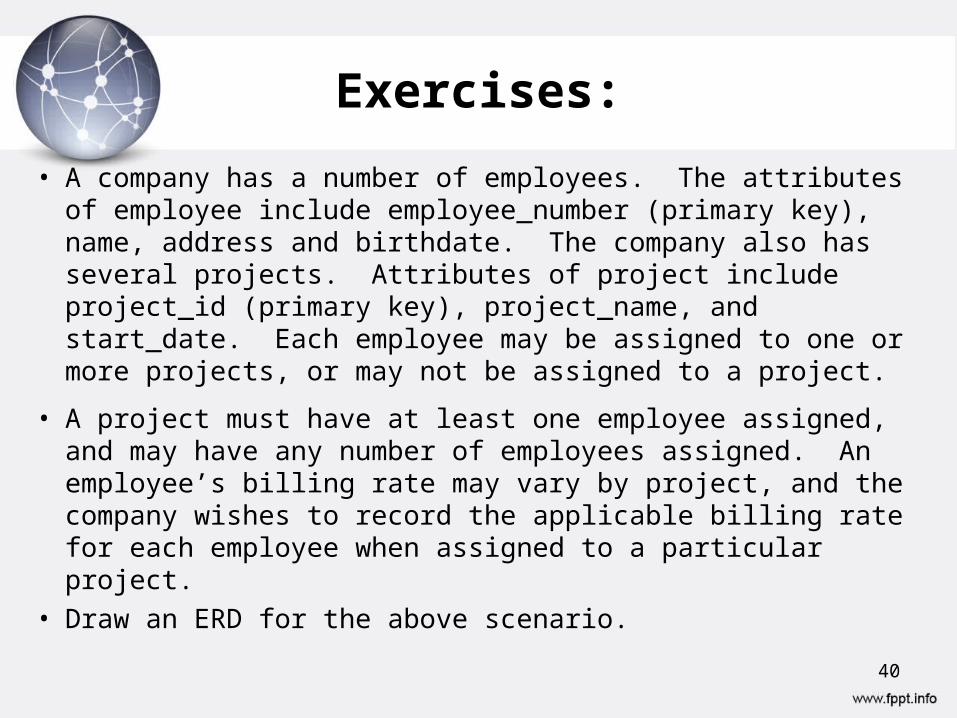
• A company has a number of employees. The attributes of employee include employee_number (primary key), name, address and birthdate. The company also has several projects. Attributes of project include project_id (primary key), project_name, and start_date. Each employee may be assigned to one or more projects, or may not be assigned to a project.
• A project must have at least one employee assigned, and may have any number of employees assigned. An employee’s billing rate may vary by project, and the company wishes to record the applicable billing rate for each employee when assigned to a particular project.
• Draw an ERD for the above scenario.
40

Q & A
41