82p. · document resume. tm 023 186. hoffmal., lee mcgraw. state dropout data collection practices:...
TRANSCRIPT

ED 383 735
AUTHORTITLE
INSTITUTION
REPORT NOPUB DATENOTEAVAILABLE FROM
PUB TYPE
EDRS PRICEDESCRIPTORS
DOCUMENT RESUME
TM 023 186
Hoffmal., Lee McGrawState Dropout Data Collection Practices: 1991-92School Year. Methodology Repert.National Center for Education Statistics (ED),Washington, DC.ISBN-0-16-045544-8; NCES-95-690Mar 9582p.U.S. Government Printing Office, Superintendent ofDocuments, Mail Stop: SSOP, Washingtion, DC20402-9328.Reports Evaluative/Feasibility (142) StatisticalData (110) Tests/Evaluation Instruments (160)
MF01/PC04 Plus Postage.*Data Collection; Definitions; Dropout Rate;*Dropouts; Elementary Secondary Education;Enrollment; Females; Males; *Research Methodology;*School Districts; Sex Differences; *State Programs;Surveys
IDENTIFIERS *Common Core of Data Program; National Center forEducation Statistics
ABSTRACTThe school year 1991-92 was the first in which states
reported school district level data on the numbers and types ofdropouts in the Common Core of Data (CCD) Agency Universe Survey.Information included numbers of male and female dropouts in 5racial/ethnic categories for grades 7 through 12. The CCD defined adropout as a student who had been enrolled at any time during theprevious school year and was not enrolled on October 1 of the currentschool year. Because it was the introductory year of such reporting,the National Center for Education Statistics (NCES) asked the stateshow successful they had been in meeting the requirements. Across the50 states and the District of Columbia, 43 states (including theDistrict of Columbia) reported dropout counts by school district,with the number expected to rise in 1993-94. Of the 43 reportingstates, 14 followed CCD standards so well that NCES can publish their1991-92 data. This study identified ways in which the state reportsdiffer d from CCD standards. Issues of reporting comprehensivenessare explored. Nineteen tables (including six in an appendix) and onefigure present survey findings. Three appendixes contain Dropout TaskForce report, dropout reporting interview questions, and technicalnotes. (SLD)
***********************************************************************
Reproductions supplied by EDRS are the best that can be madefrom the original document.
***********************************************************************

NATIONAL CENTER FOR EDUCATION STATISTICS
Methodology Report March 1995
to ropoutollection Practic
1 91-92 SchoolU.S. DEPARTMENT OF EDUCATION
Office of Educahanal Research and ImprovementEDUCATIONAL RESOURCES INFORMATION
CENTER (ERIC)
Th.s document has been thOrOduCe0 asrecerved from the person or organrzat.ononginahng d
0 Maio( changes have been made to improvereproduction quality
Points 01 new or opounnSSIaladill this loco.sent do not necessarily represent offIctaiOE RI pOS.hon or poky
U.S. Department of EducationOffice of Educational Research and Improvement NCE3 95-690
BEST COPY AVAILABLE
2

NATIONAL CENTER FOR EDUCATION STATISTICS
Methodology Report March 1995
tate Dropout HaCollection dices:19 1-92 School Y
Lee McGraw HoffmanElementary/Secondary Education Statistics Division
U.S. Department of EducationOffice of Educational Research and Improvement NCES 95.690
3

U.S. Department of EducationRichard W. RileySecretary
Office of Educational Research and ImprovementSharon P. RobinsonAssistant Secretary
National Center for Education StatisticsEmerson J. ElliottCommissioner
National Center for Education Statistics
"The purpose of the Center shall be to collect, and analyze,and disseminate statistics and other data related toeducation in the United States and in othernations."Section 406(b) of the General EducationProvisions Act, as amended (20 U.S.C. 1221e-1).
March 1995
Contact:Lee M. Hoffman(202) 219-1621
For sale by the U.S. Government Printing OfficeSuperintendent of Documents, Mail Stop: SSOP, Washington, DC i(`402-9
ISBN 0-16. 045544-8
4
Acknowledgments
The first contributors to be recognized are the dropout coordinators from the 50 states,District of Columbia, and five outlying areas who have worked with the National Center forEducation Statistics over the last five years to develop, pilot test and put in place a standarddropout statistic. This was a mammoth undertaking, and one that was characterized by goodwill, professional excitement, and a genuine concern for improved information to help othereducators better manage services for schools and students. Many of these state professionalsare included in the list of current dropout coordinators who provided the 1991-92 dropout dataand the information for this report.
Marilyn McMillen and Robert Burton of NCES guided the development of the dropoutdefinition and dropout rate, and the analyses, over several years. They, along with MaryFrase of NCES, reviewed the paper in its early stages. Judy Burnes, Colorado Department ofEducation, led a timely state review of the statistic. The dropout statistic implementation wasconducted under the leadership of Paul Planchon, Assoc; ate Commissioner forElementary/Secondary Education Statistics.
The report would not have been prepared without the assistance of PinkertonComputer Consultants, Inc. staff members Valerie Martin, Vladimir Dragunsky and CarolRohr.
The report was reviewed by Susan Ahmed, Robert Burton, Mary Frase, MarilynMcMillen, Summer Whitener, and Shi Chang Wu, NCES; Janet Baldwin, American Councilon Education; Barbara Clements, Council of Chief State School Officers; and Cindy Prince,National Education Goals Panel. Their suggestions are greatly appreciated.
iii
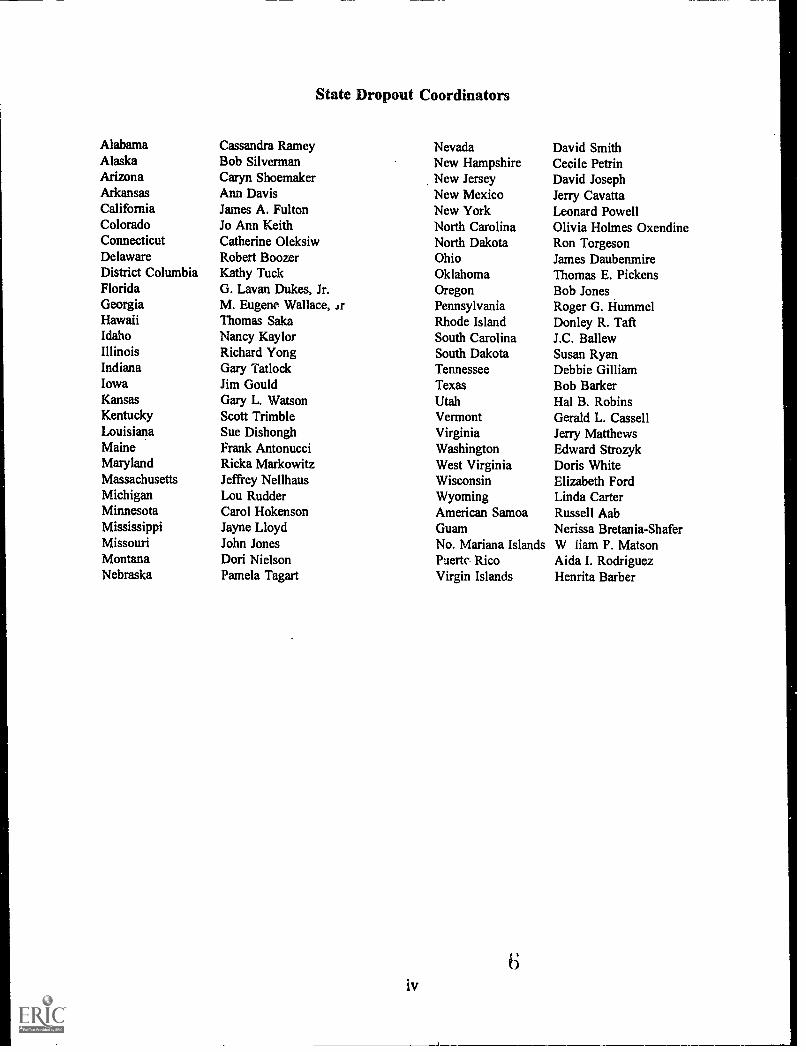
State Dropout Coordinators
Alabama Cassandra Ramey Nevada David SmithAlaska Bob Silverman New Hampshire Cecile PetrinArizona Caryn Shoemaker New Jersey David JosephArkansas Ann Davis New Mexico Jerry CavattaCalifornia James A. Fulton New York Leonard PowellColorado Jo Ann Keith North Carolina Olivia Holmes OxendineConnecticut Catherine Oleksiw North Dakota Ron TorgesonDelaware Robert Boozer Ohio James DaubenmireDistrict Columbia Kathy Tuck Oklahoma Thomas E. PickensFlorida G. Lavan Dukes, Jr. Oregon Bob JonesGeorgia M. Eugene Wallace, Jr Pennsylvania Roger G. HummelHawaii Thomas Salta Rhode Island Donley R. TaftIdaho Nancy Kay lor South Carolina J.C. BallewIllinois Richard Yong South Dakota Susan RyanIndiana Gary Tat lock Tennessee Debbie GilliamIowa Jim Gould Texas Bob BarkerKansas Gary L. Watson Utah Hal B. RobinsKentucky Scott Trimble Vermont Gerald L. CassellLouisiana Sue Dishongh Virginia Jerry MatthewsMaine Frank Antonucci Washington Edward StrozykMaryland Ricka Markowitz West Virginia Doris WhiteMassachusetts Jeffrey Nellhaus Wisconsin Elizabeth FordMichigan Lou Rudder Wyoming Linda CarterMinnesota Carol Hokenson American Samoa Russell AabMississippi Jayne Lloyd Guam Nerissa Bretania-ShaferMissouri John Jones No. Mariana Islands W liam F. MatsonMontana Dori Nielson Puerto Rico Aida I. RodriguezNebraska Pamela Tagart Virgin Islands Henrita Barber
iv

Contents
Acknowledgments iii
Executive Sun:lanai), ix
Part 1. State Dropout Data Collection Practices 1991-92 School Year 1
Introduction 1
Interest in Dropout Statistics 1
CCD Dropout Statistic 2Dropout Field Test 3
Initial 1991-92 Implementation 4
Survey of 1991-92 Practices 5
Collecting Versus Reporting States 6
Response Rate 7
State and CCD Definitions 9
Recapturing Stop-Outs 11
Other Education or Training 13
Twelfth Grade Leavers 16
Variations in Reporting Schedules 17
Summary: Effects of 1991-92 Variations 19
Part 2. Follow-up Survey on Plans to Change 23
Categorizing Re-enrolling Students 23
GED Program Enrollees 26
Enforcing Cut-off Dates 26
Summary of Possible Changes 26
Part 3. Analysis of 1991-92 Dropout Data 29
Standard and Nonstandard Data 29
Computing Dropout Rates 29
Quality of the 1991-92 Data 30
Comprehensiveness of Reporting 30
Effects of Summer and October 1 Misallocations 33
Adjusted and Unadjusted Rates 34
Comparing Adjusted and Unadjusted Rates 35
Districts with High Grade Below 12 37
Part 4. 199142 School Year Dropouts 41
v
Part 5. Recommendations 45
Step Toward Future Collections 45
Appendices:
Appendix A. Dropout Task Force Report 47
Recommendations of Dropout Statistic Review Task Force 48
Committee Charge 50
Background 50
Recommendations 50Impact of student movement on dropout rates 52
Other Recommendations 53Response to Dropout Statistic Review Tstsk Force Recommendations 53
Appendix B. Dropout Reporting Interview Questions 57
Appendix C Technical Note on Rate Estimates and Detailed Tables 61
vi

list of Tables
Table Page
1. States reporting dropout data, missing detail, prohibitions againstreporting detail, and whether state and Common Core of Datareports are the same: 1991-92 school year (all states) 8
2. Year and grade to which summer dropouts are attributed andclassification of students re-enrolling by end of year or beginningOf next year: 1991-92 school year (all states) 12
3. Dropout report enrollment cut-off, date enforcement, opportunity tocorrect reports, and status of transfers to other programs: 1991-92school year (all states) 14
4. Effect of state reporting variations on dropout count when compared toCCD standards: 1991-92 school year (all states) 20
5. States plans to change nonstandard CCD dropout reporting practices(all states) 24
6. Missing (M or 0) dropout counts among districts with any of grades7-12: 1991-92 school year (43 states reporting district-level dropoutdata) 31
7. Effect of attributing 0, 50, or 100 percent of summer dropouts tothe wrong grade 34
8. Effect of failing to remove October recaptures (estimated at25 percent) from dropout count 34
9. Number of districts and average ratio of unadjusted to adjusteddropout rates, by membership size category, grades 9-12 combined,in districts with membership: 1991-92 school year (43 states reportingdistrict-level dropout data) 36
10. Number of districts including grades 9-12 with absolute difference of0.005 or greater between adjusted and unadjusted dropout rates:1991-92 school year (43 states reporting district-level dropout data) 38
11. Number of districts including any of grades 7-12 by highest gradefor which membership is reported: 1991-92 school year (43 statesreporting district-level dropout data) 39
vii
9

Table Page
12. Numbers of dropouts and unadjusted dropout rates by grade:1991-92 school year (14 states reporting standard district -leveldropout data) 42
13. Sex and racial/ethnic status of combined grade 9-12 dropoutsreported as percent of all dropouts: 1991-92 school year(40 states reporting detailed district-level dropout data) 43
C-1. Estimated rates with 0, 50, and 100 percent of summer dropoutsaccounted to prior grade 63
C-2. Dropout rates with 0 and 25 percent of dropouts estimated tobe incorrectly reported October 1 returners. 63
C-3. Membership and numbers and unadjusted ratios of dropoutsby grade: 1991-92 school year (43 states reportingdistrict-level dropout data) 65
C-4. Number of districts and average adjusted and unadjusteddropout rates by membership size category, grades 9-12combined. in districts with membership: 1991-92 schoolyear (43 states reporting district-level dropout data) 66
C-5. Racial/ethnic status of dropouts reported as percent of alldropouts, by grvde: 1991-92 school year (43 states reportingdistrict-level dropout data) 67
C-6. Sex of dropouts reported as percent of all dropouts, bygrade: 1991-92 school year (43 states reportingdistrict-level dropout data) 68
List of Figures
Mg= Page
1. States reporting dropouts and adherence to. CCD standards 6
viii

Executive SummaryState Dropout Data Collection Practices: 1991-92 School Year
The 1991-92 school year was the first for which states reported school district leveldata on the numbers and types of dropouts in the Common Core of Data (CCD) AgencyUniverse Survey. The information included the numbers of male and female dropouts in fiveracial/ethnic categories for each grade, 7 through 12. There are a number of valid ways todefine "dropout." Put very simply, the CCD defined a student as a dropout if he or she hadbeen enrolled at any time during the previous school year and was not enrolled on October 1of the current school year.
Because 1991-92 was the introductory year of a standard definition and reportingprocedures for this complicated statistic, NCES asked state CCD Coordinators how successfulthey had been in meeting the requirements. Here are some of the major findings:
Across the 50 states and the District of Columbia, 43 states (including theDistrict of Columbia) reported dropout counts by school district. By the 1993-94 school year, this number should increase to 49. Four of the 43 reportingstates omitted racial/ethnic detail, sex, or dropout counts for grades 7 and 8.All but three states anticipate reporting these details by 1994-95.
Of these 43 states, 14 followed the CCD standards sufficiently closely thatNCES can publish their 1991-92 data A major problem was that some statesdid not remove from their dropout rolls students who had left during theprevious school year but returned by October 1 of the current school year.Under the most optimistic estimates, 44 states would comp!s, with thisrequirement by 1994-95; a more pessimistic assessment of ability toadopt CCD standards reduces this to 33 states.
The CCD definition attributes summer dropouts (students who complete oneschool year but fail to enroll in the next) to the school year and grade forwhich they fail to report. Thirty-one states followed this practice in 1991-92.
Other discrepancies from the CCD standard included failing to enforce a cut-offdate close to October 1 in deciding when a "no-show" student was a summerdropout (23 states) and failing to count as dropouts those students who leftsecondary education to enroll in an adult education GED program (10 states).
NCES compared two methods of computing a dropout rate, one using as itsdenominator student membership in the year for which dropouts were reported,and the other averaging membership across two years. There did not appear tobe any great differences between the two rates, except in districts withrelatively large numbers of dropouts (more than 10 percent of students), forwhich the unadjusted dropout rate was higher.
The purpose of this follow-up study was to identify cases in which state dropoutreports differed from the standard CCD definition and procedures. There was extensive
ix

variation in 1991-92, but dropout data rapidly are becoming more comparable. As anexample of states working cooperatively to produce a complex, uniform statistic through theiradministrative records systems, the dropout statistic appears to be working its way towardsuccess.

Past 1. State Dropout Data Collection Practices: 1991-92 School Year
Introduction
Students who leave high school without completing the education needed to preparethem for productive employment or further education have been a longstanding concern topolicy makers. Underneath the educational action and academic interest that this concern hasgenerated lies a simple, consistently observed fact: dropouts as a group fare less well thantheir peers who have completed 12 years of schooling.
hatesest in Dropout Statistics
In 1986 the National Center for Education Statistics (NCES) began work with theCouncil of Chief State School Officers to examine NCES' collection of elementary andsecondary education data reported from the administrative records of public schools andagencies. This collection was the four-part Common Core. of Data, or CCD, which consistsof a state-level collection of data about revenues and expenditures for public education,' andstate-, school district-, and school-level collections of other data such as numbers and types ofschools, education staff members, pupils, and graduates. One recommendation from thise. amination was that NCES add a dropout count to the CCD, with the caveat that stateswe Id have to adopt a nationally consistent definition of "dropout" in order for this newstatistic to be usefully comparable.'
The Hawkins-Stafford School Improvement Amendments of 1988 directed theCommissioner of Education Statistics to establish a federal-state cooperative educationstatistics system that would improve the quality of education data for policy making atnational, state and local levels. The same legislation required the Commissioner to report toCongress each year on the second Tuesday after Labor Day about the rate of school dropoutsand completions in the Nation (under new legislation, this report is no longer mandatory).
The interest in nationally uniform, state-comparable dropout statistics converged fromseveral sources, and NCES responded with a coordinated program of activities. Beginning inSeptember, 1989, NCES published a national dropout and completions report based oninformation from the October, 1988 Current Population Survey of the Bureau of the Censusand information from NCES' own longitudinal High School and Beyond Study.3 NCEScontinues this yearly report through the present. It provides a consistent picture of nationaland regional dropout rates over time, and applies a uniform definition of "dropout." However,neither the Current Population Survey nor any of NCES' longitudinal surveys employs a
'Public education" is used for prekindergarten through 12th grade throughout this paper unless otherwise noted.
'See F. Johnson, 1988, Dropout Statistics: An Update of State Definitions and Collection Practices, U.S.Department of Education, NCES.
'See M. Frase, 1989, Dropout Rates in the United States: 1988, U.S. Department of Education, NCES.
1 1.3

sample that is large enough to provide state-representative findings. As useful as the annualDropout Rates in the United States is for national purposes, it does not describe differencesamong states or school districts.
CCD Dropout Statistic
A second major activity was the development of a uniform dropout statistic intendedto be collected through the CCD, and to report the number of school dropouts from eachpublic school district in the 50 states, District of Columbia, and outlying areas of AmericanSamoa, the Commonwealth of the Northern Mariana Islands, Guam, Puerto Rico, and theVirgin Islands. During 1987 and 1988, staff from NCES worked with representatives fromstate and local education agencies and professional associations to agree upon a definition of"dropout" that could be adopted and implemented by all -totes. The definition upon whichNCES and the states agreed was the following:
A dropout is an individual who:(1) Was enrolled in school at some time during ,he previous
school year;(2) Was not enrolled at the beginning of the current school year;(3) Has not graduated from high school or completed a state- or
. district-approved educational program; and(4) Does not meet any of the following exclusionary conditions:
a) transfer to another public school district, privateschool, or state- or district-approved educationprogram;
b) temporary absence due to suspension or school-approved illness; or
c) death.
There are several key characteristics that distinguish this definition from others thatmay appear similar.
The dropout count is part of the CCD Agency Universe (school district) survey.As it is incorporated in the CCD, the dropout statistic:
is an "event" count of the number of students who havedropped out during a 365-day period from the first day ofschool (operationally set as October 1) to the daypreceding the beginning of the next school year(September 30);
I is computed on October 1 for students who have droppedout during the previous school year;
I considers students who are not accounted for on October1 (i.e., who are "status unknown") to be dropouts.
2 14

0 "Summer dropouts," or students who complete one school year but failto enroll for the next, are counted as dropouts from the year and gradefor which they fail to report. In effect, their failure to enroll treats themas October 1 (first day) dropouts.
The dropout count is based on the grade in which the student was or should beenrolled (including grades 7 through 12), rather than on the student's age.
"Dropping out" is conceptualized as "leaving school without completinga recognized secondary program." Thus, students who leave secondaryschool for activities such as enlisting in the military or enrolling in anadult education GED class are counted as dropouts, even though thesechoices could be productive ones. Students who leave school afterreaching the age beyond which school districts are required to provideservices, and who have not completed a recognized program (which caninclude a special education individualized education program) areconsidered dropouts.
Dropout counts are used to create an event dropout rate, that is, a rate whichshows the proportion of students who have dropped out of school during asingle school year. The CCD count of membership, or students enrolled onOctober 1 of the school year, is the basis, or denominator, of the dropout rate.
Dropout Field Test
Those who had participated in developing the definition recognized that a field testwas needed to determine whether school districts actually could collect the data as specified.There was also a secondary question of which membership count to use as the denominator.Theoretically, a count of students in membership at the end of the school year could bepreferable because it would assign students who transferred during the year to the schooldistrict that received them. However, the CCD only collects an October 1 membership count.The effect of using a beginning- or end-of-school-year membership count on the size of thedropout rate needed to be tested before deciding whether to add the burden of an extra, end-of-year membership count.
In the 1989-90 school year a sample of volunteering school districts from 26 states,the District of Columbia, and two outlying areas carried out a field test of the proposeddropout collection. A contract to assess the results of this field test was awarded to theAmerican Institutes for Research, whose researchers visited school sites, analyzed findings,and tracked a number of school leavers to determine whether districts could accuratelydistinguish dropouts from students who had left for other reasons. The overall findings ofthis assessment were that school districts generally reported accurate counts (if anything, they
3 15

were more likely to misclassify transfers as dropouts) and that there was no meaningfuldifference between rates calculated on the basis of fall or end of year membership counts.'
Issues resulting from field test. NCES introduced two changes at the conclusion of thefield test, and these changes in turn raised several issues. First, the definition that was fieldtested attributed summer dropouts to the year and grade in which they were enrolled. Thus, astudent completing the 8th grade in 1988-89 who did not re-enroll was counted as an 8thgrade dropout for 1988-89. Because a number of states said that this ran counter to localpractice, NCES changed the reporting directions to have such a student attributed to the gradeand year for which he or she did not report. In the example cited, the student (who hadsuccessfully completed the 8th grade) would be considered a 9th grade dropout for 1989-90.This change immediately affected several states that had established reporting and dataprocessing systems under the original rule; it later caused problems with some school districtsthat had difficulty in following the status of pupils across multiple years. (Some statesreported that their districts used automated student record systems that could carry only ayear's data.)
The second change introduced by NCES was in the denominator. To compensatesomewhat for student transfers during the year, NCES proposed to use as the dropout ratedenominator the average membership across two October counts. This would introduce apartial adjustment for a student who was enrolled in more than one district during the year(and whose "risk of dropping out" should conceivably be shared ac-oss both districts). Thischange placed no extra reporting burden on school districts, but dia raise questions about howcomparable the rate would be under various student transfer and migration conditions.
Initial 1991-92 Implementation
Accounting for every student who leaves grades 7 through 12, and reporting those whodrop out by sex and racial-ethnic status for each of more than 12,000 school districts, is not asimple procedure. NCES provided sample training materials and other resources through theNational Cooperative Education Statistics System in 1990 and 1991 to help states introducethe new dropout statistic. The dropout count was added to the CCD Agency Universe surveyin 1992-93, to report students who had dropped out in 1991-92 (including the summer, 1991dropouts). This first implementation of the statistic will be referred to as the 1991-92 reportthroughout this paper.
At the January, 1993 meeting of the National Forum on Education Statistics, arepresentative from the Arizona state education agency presented a list of criticisms of theCCD dropout statistic to the National Education Statistics Agenda Committee of the NationalForum on Education Statistics. The Forum requested that a task force be established toexamine the statistic and recommend whether or not NCES should revise the proposeddenominator for the dropout rate. This task force of 14 state education agency and NCES
4American Institutes for Research, 1992, National Dropout Statistics Field Test Evaluation, U.S. Department ofEducation, NCES.
4 16

staff persons met twice, conducting an extensive analysis of the dropout statistic, and makingseveral recommendations.'
The Task Force presented its report to the Forum, which in turn made severalrecommendations to NCES. One was that NCES provide improved instructions on how toapply the dropout statistic. Another was that NCES use the October 1 membership count,rather than the averaged membership, as a denominator for the dropout statistic. NCESagreed to distribute simplified instructions and to use both single October 1 and the averageddenominators in its publication of the 1991-92 data.
Finally, the Forum requested that NCES survey the states to determine how they hadapplied the requirements of the dropout definition and, therefore, how comparable the 1991-92data were from state to state. A condition of this survey was that it identify cases in whichstate law or policy required a dropout definition that differed from the NCES definition.
Survey of 1991-92 State Practices
Between August and December of 1993, an NCES staff person telephoned the CCDCoordinator in each state education agency, requesting the name of a contact who wasknowledgeable about the state's dropout collection and reporting system. Because they arenot reported in United States totals, the outlying areas were not interviewed. The identifiedcontact was then consulted via telephone, using the questions shown in Appendix B.6 (Not allaspects were reviewed with states that did not report a dropout count.) Each question, shownin italics, introduces the section of this report in which the findings are discussed. Thesection concludes with a summary table showing the potential impact of state practices on thecomparability of dropout data.
The questions identified variations from the NCES definition in terms of whatinformation was reported (missing detail) and under which conditions school leavers werecounted as dropouts (example, whether the distinction between GED adult education andsecondary alternative programs was maintained). The questions also addressed severalpotential problems state comparability raised by the Task Force. These included suchthings as whether a state couated students who left school but returned before the close ofthat school year (so-called "recaptures") as dropouts.
'Judy Humes of Colorado chaired this Task Force, and the group's report is reproduced and discussed in
Appendix A. The National Forum on Education Statistics comprises the Federal and state education agencies andprofessional education associations that implement the National Cooperative Education Statistics System.
*Not all aspects were discussed with those states that did not report dropout data. This report incorporatesresponses to the April 7, 1994 correspondence and to Dropout Coordinator comments on two earlier drafts of the
paper.
5

Collecting Venus Repotting States
As figure 1 depicts, not all states collected and reported dropout data (This paperdoes not include the outlying areas. The outlying areas that reported dropouts are publishedin other NCES reports.) Among the 50 states and the District of Columbia, 48 had dropoutcollections in 1991-92 and three did not. Of those with dropout collections, four stateselected not to report on the CCD. This left a total of 44 states reporting CCD dropout dataOne of those states reported a single total for dropouts from all grades; 29 did not follow theCCD standards closely enough to allow publication of their dattr, and 14 reported publishabledropout counts.
Soto 1.--Statto 'waling &folds and adhorenco to CCD standards
Slats (N-51)
With dropout °oast:Sono
(N°48)
RepoIng to CCD(N-44)
Without dropout WIWI=(N3)
(MT, NH, WA)
Not repordng to CCD
(Nal(A1C GA, HI, KY)
Stoto total (N-1) Dlotict level repodo(NY) (N-43)
Not AQllow CCD standani (Na28)Followed CCD standard (NO4) (AL, CO, CT, DE, FL, ID, IL, IN, IA,(AZ, AR, CA, DC, MA, MS, MO, KA, LA, ME, MD, MI, MN, NJ, NC,NE, NV, NM, CR, PA, RI, TX) ND OH, OK, SC, SO, TN, UT, VT,
14, Wl, WY)
6

Throughout this report, percentages are based on a total of 51: the 50 states and theDistrict of Columbia. Individual tables include states for whom the information is relevant.Thus, questions about reporting practices include all .48 states with a dropout collection nowor in the near future, even when these states did not report a dropout count in the 1992-93CCD. Tables describing 1991-92 data include the 14 states that reported analyzable numbers,or all 43 states with school district dropout data, depending on the topic.
Response Rate
Of the 50 states and the District of Columbia, seven did not report any dropoutstatistics for 1991-92 (table 1). In addition to these states, New York reported a single total
across all grades, and is considered a nonrespondent for analytical purposes. The 43 agenciesthat provided data represent 84: percent of the states. Forty of these 43 (78 percent of allstates) reported data at the level of detail requested, that is, by sex within racial/ethnic groupfor grades 7 through 12. Idaho and Michigan reported dropouts for only grades 9 through 12and did not provide the sex or racial/ethnic categories. Nevada reported all the requesteddetail, but did not include dropouts from grades 7 and 8.
Maryland, which is included as one of the fully reporting states, suppressedinformation for any category in which the student membership was less than 20. Thus, forexample, if a school district had only 15 male Asian students in the 8th grade, no dropoutswere reported for this group in that district. The District of Columbia did not allocate itsungraded dropouts to grades but reported them as a separate category. NCES7 distributedthese ungraded pupils across grades 7 through 12.
Nonresponding states.. Alaska had collected dropout data in accord with the nationaldefinition, but decided to withhold the information until NCES made a final decision aboutwhether the definition or rate would change in response to the Task Force recommendations.Georgia had changed student record software programs during the year, with dropoutinformation lost in the process; upon examining the results, the state questioned the dropoutresults and declined to forward them. Hawaii also mistrusted the data collected, in partbecause what the respondent termed "convoluted programming" had been used to derive thedata from existing systems, and in part because the data gave none of the sex or racial/ethnicdetail. Kentucky's dropout statistic was modelled after the CCD, but data were not submittedbecause the state coordinator did not feel the numbers complied sufficiently with the CCDrequirements. Montana delayed introducing a dropout collection because of the July, 1993Forum action but hopes to begin counting dropouts by 1993-94 (reporting in 1994-95). NewHampshire anticipates that it will be several S, Bars before a dropout collection is begun.Washington found its collection delayed by the state's change from an aggregated data system
to an individual record system, but intends to report dropouts for grades 9-12 by 1993-94, and
'The data were processed and edited by the U.S. Bureau of the Census under an interagency agreement with
NCES. Ungraded students were also prorated across the membership counts for grades 7 through 12 in all states
with ungraded students.
7i

Ube 1.- -Sates reporting dropout deb, mbsing detail, prohibitions against reporting detail, and whethor stab and CommonCore d Dela reports amens earns: 1901 -92 school year (all staters)
Stab
Stab State,reported CCDdropout dine
dale same
Completeness of collection:
Missing detailReporting
prohibitions
Alabama Yea YeeAlaska* No NoArizona Yea NoArkansas Yes YeaCatania Yes Yea
Colorado Yes NoCc mactiout Yea YesDelaware Yee NoDistrict of Columbia Yea YeaFlorida Yea No
Georgie No YeaHavair No YeeIdaho Partial NoIllinois Yea YeaIndiana Yea Yea
Iowa Yea YesKansas Yea YesKentucky No YeeLouisiana Yea YeaMaine Yea Yea
Maryland Ruth! YeaMassachusetts Yes NoMichigan Partial YeaMinnesota Yea YesMississippi Yea No
Missouri Yea YeaMontana No YesNebraska Year YeaNevada Partial YeaNew Hampshire No No
New Jersey Yea YeaNew Mexico Yea YesNow York Partial YeaNorth Carolina Yoe YeaNorth Dakota Yea Yes
Ohio You YesOklahoma Yee NoOregon Yea YeaPormsylvanis Yea YesRhode Island Yes No
South Carolina Yea NoSouth Dakota Yea YesTennessee Yea YeaTens Yea YesUtah Yes Yea
Velment Partial YeaVirginia Yea NoWorthington No --Went Ifirgina Yea NoWisconsin Yea YeaWyoming Yes Yee
No report
Under 10
No reportNo report
No ter 7-8, rare, sox
`to race, sex
Supposes email cello Denominator <20
No Ca 7-8, race, sox
No report
No GP 7-8No report
No &toll
No moo, sex
No report
SUMMARY Practico agrees with CCD:
Awes 38 30Dloageo 7 14
Partly, unclear 0 0No responsa 0 1
38 497 200 0
-- No responao.Steto collocted but did not roport 1991-92 dropout date.
SOURCE: U.S. Department of Education, National Cantor for Education Statistics, Common Coro of Data, 1992-83.
8 4i)

all grades 7-12 by 1994-95. Finally, New York, whose single dropout figure was not usablefor 1991-92, will report full detail for its 1992-93 dropouts.
If state plans proceed as intended, all states except Kentucky, New Hampshire, andpossibly Montana will provide dropout counts for 1993-94.
Missing or prohibited detail. State dropout contacts were asked:
Your 1992-93 CCD agency survey did not report(interviewer specifies). Is there a law or policy prohibiting youfrom reporting this detail? Why is it m issing?
Although some states bad reported anecdotally that their laws prohibited reportingstudents under 16 as dropouts, none indicated that these laws prevented them from reporting
any of the grades requested in the CCD. Florida is required to treat students in gradeskindergarten through 8 as habitual truants, and accordingly reports only dropouts 16 or older
(but for all requested grades) on the CCD. As noted earlier, Maryland follows state educationagency policy to suppress dropout counts for groups with a membership of fewer than 20
students.
Idaho has begun collecting dropout data by sex and race/ethnicity, and will be able to
report this detail for grades 9 through 12 by the 1994-95 school year; it is not clear whendropouts from grades 7-8 will be added. Kentucky will add racial/ethnic detail through itsdeveloping student record system and anticipates that this information will be fully available
within the next five years. Because Michigan law only requires a school dropout/retentionrate, the state coordinator did not feel the additional detail would be reported any time soon.Nevada is adding grades 7-8 to its dropout collection in 1994-95. New York stated that itssingle number would be replaced next year by counts for the requested grade levels and
detail. Finally, Vermont did not report race/ethnicity or sex and it is not clear when these
details will be added.
State and CCD Definitions
One possible outcome of state prohibitions against reporting certain detail was that
states might use definitions and procedures that differed from the CCD standard in producingtheir own state reports. While this would not affect state-to-state comparisons using CCDdata at the national level, it would require explanation in national reports to alert readers todifferences between a state's own reports and figures published from the CCD. State contact
persons were asked:
Do you use the same definition and procedures for the CCD dropout report asyou do for your state reports? If not, what are the differences?
Table 1 indicates whether the state dropout reports employed the same definition andprocedures as the CCD dropout statistic; 36 states did so (of these, six did not collect all
grades or racial/ethnic detail). The following paragraphs describe all of the states in which
921

the contact person responded "no" to this question. Some differences were also capturedunder more specific questions, and are repeated under those headings.
Alaska, South Carolina and Virginia adopted the original CCD definition into stateregulation, and now differ from the current definition by attributing summer dropouts to theprevious year. Arizona follows the CCD dropout definition but uses total cumulativeenrollment (not the October 1 headcount) in calculating dropout rate. Colorado collects dataon a July-June cycle, and does not remove students who return in the fall from its dropoutcount. Delaware and West Virginia also fail to remove these October returnees from thedropout roll, but will do so in the future. Idaho reports dropouts as a percent of the totalgrade 9-12 enrollment on the last day of school.
Massachusetts counts school leavers who re-enroll in the fall as dropouts for its statereport, but not for the CCD. Similarly, Mississippi reports summer dropouts for the CCD butnot for its state report. The New Hampshire collection will treat students who return at thebeginning of the school year as dropouts, and the state has not made provisions for adjustingthese counts to the CCD standard. Oklahoma's state report only includes dropouts who are 18or younger, while requesting that districts include these older dropouts for the CCD report.Rhode Island uses a July-June reporting period that differs slightly from the CCD.
Florida should be noted as a special case. Because both CCD and state dropoutreports are generated by the same student record system, the coordinator did not feel that thedefinitions differed. Although the state and CCD reports produced from this system are notthe same, they draw upcn the same group of students, with those dropouts under 16 years ofage excluded.
Treatment of Summer Dropouts
How did you report summer dropouts, that is, students who completed the1990-91 school year but did not show up for school at the beginning of the1991-92 school year? Were they dropouts for the year the completed or theyear in which they did not return? For site grade they completed or the gradein which they did not enroll?
Summer dropouts are students who complete one year (or are not absent enough to beconsidered dropouts) but who fail to enroll at the beginning of the next school year. TheCCD dropout definition required that a student who was not enrolled on October 1 be countedas a dropout from the school year and grade for which he or she failed to enroll. One of thecriticisms of the dropout statistic was about the treatment of summer dropouts: that theprocedure required districts to carry students on their books over three school years, as thefollowing example shows.
2210

In school year: A student who:1992-93 enrolled in, and completes, 8th grade1993-94 fails to enroll in 9th grade on October 1, with no
evidence of transfer to another school, is1994-95 reported as a 1993-94, 9th grade dropout on the
1994-95 CCD.
Seventeen states (33%) did not follow the CCD definition, but instead counted pupils
who failed to enroll in the fall as dropouts from the previous school year (table 2). Thirty-
one states reported summer dropouts as dropouts from the year in which they failed to enroll,
as requested. The question of how summer dropouts were reported was moot for three states
that did not have a CCD-compatible dropout collection.
All of the states reporting summer dropouts correctly were able to report summer
dropouts in their 1991-92 school year data. Sixteen (31 percent of all states) of the 17 states
that counted summer dropouts under the year they had completed also counted these students
as dropouts from the grade in which they were enrolled during that year. However, Indiana
included the summer dropouts in the count for the grade these students would have enrolledin had they registered for school in the fall,.
Effects of stumpier dropout classification. Counting students who fail to enroll in the
fall as dropouts from the prior, rather than the current, year would affect annual dropout totals
to the extent that there were sizable changes in the numbers of dropouts from one year to the
next. At the national level, ICES reports suggest gradual changes, not sharp differences, in
the numbers of young people dropping out of school from year to year. However, there aredifferences in dropout rates for grades. The CCD field test, for example, reported dropout
rates of less than 2 percent for grades 7 and 8, and over 5 percent for grades 9 through 12.
Counting students who have been promoted as dropouts from the earlier grade could distort
grade-level dropout rates without affecting the comparability of overall (multi-grade) dropoutcounts. The effects of this problem are estimated later in the discussion on 1991-92 data
quality.
Recapturing Stop-Outs
The CCD dropout definition counts as dropouts only those previously enrolled students
who are not enrolled on October 1. This definition involves recapturing students who have
been termed by some as "stop-outs," or temporary dropouts, and removing them from the
dropout roster. However, school district record keeping systems may break these stop-outs
into two different groups, with different reporting consequences for each:
a student who re-enrolls before the end of the school year in which thestudent dropped out; anda student who re-enrolls by October 1 of the following school year.
Education agency staff were asked how their states classified students in these two
situations. The results are shown in table 2.
112 3

Table 2. - -Year and wade to ?Mich UM= dropouts aeribulaci and effisalloalion of dude*reenrol lino IN and of yew or bestireVolm.1 rad wee leel 92 school year fan elates)
Summer dropouts atehuted to Returnees carded as dropoutsStets Prior ne Price wads End of year Nest year
Alabama YeeAlask* Yes Yes YeaArizonaArioussasCalifornia
Colorado Ye; YeaConnected Yes YeaDelawareDistrict of ColumbiaFlorida
Georgia*Plereed*IdahoiliboisIndiana Yea
YeaYea
YesYes
love Yea YeeKansasKentucky* Yes YesLOIAlliOrla Yea Ws YesMaine Yea Yea Yea
Yea
Yoo
Yea
Yes
Yes
YesYeeYes
YeaYoe
MarylandMassachusgsMichigan Yes YesMlnneeoMissbeippi
Meow!Montana*NebraskaNevadaNew Hampshire
New JerseyNew MesesoNew YorkNorth Carolina Yea YeeNorth Dakotas Yes Yee
Ohio Yes YeeOldahomaOregonPennsylvaniaRhode Island
South Carolina Yes YoeSouth DakotaTOIlitellOOTexasUtah
Vermont Yea YeaVirginia Yea Yesbihrshington* --West Virgin/1sWisconsinIftmlna
Yee
Yes
Yea
YesYea
YesYea
Yea
YeaVaries
_YeoYeaYea
SUMMARY Practice ages Wth CCD:
Acres 31 32 40 24Disagree 17 10 2 23
Party, unciser U 0 0 1No response 3 3 3 3
-- Not reporting.*Alaska, Georgie, Havail, and Kentucky collected but did not report dropout dabs htentona, NOW Kampshiro,and Washington did not collect dropout We.
SOURCE: U.S. Depart:nut of Education, National Cent for Education Stctica, Common Coro ofx, 1002 -93.
12 2 4 BEST COPY AVAILABLE

Etd of year re-enrollments. The question used to determine how these students were
categorized was:
How did you classify students who dropped out during 1991-92 but re-enrolled before the end of that school year?
Two states (Indiana and Kansas) count students who leave but re-enroll before the end
of the year as dropouts. In Kansas, districts have the option of counting such students asdropouts and the coordinator felt this was likely to happen if a returning student had failed
one or both semesters.
October 1 re-enrollments. The question asked of the state contact person was:
How did you classify students who dropped out and did not re-enroll bythe end of 1991-92, but who did re-enroll at the beginning of the1992-93 school year?
States were more likely to count as dropouts those students who did not return until
the beginning of the subsequent school year. This was the practice in 23 or 24 states (45 or
47 percent). The situation was ambiguous in Virginia, where a stop-out was counted as adropout unless he or she completed the missed course work in summer school.
Effects of counting 'clop- outs. " States that count returned stop-outs as dropoutslogically will have greater numbers, and higher rates, of dropouts than those states that adhere
to the CCD definition. The Dropout Statistic Review Task Force analyzed dropout data from
two states and one school district that were able to identify when (during or before the school
year) students dropped out. In one state, failure to "recapture" returning dropouts raised theoverall dropout rate from 8.3 percent to 11.1 percent. In the school district, counting these
returnees as dropouts raised the rate from 8.6 percent to 9.7 percent. These analyses do notconstitute a representative sample of states, but in the broader field test review, it was found
that in some relatively small or mid-sized school districts the number of dropouts reported by
the end of the school year was greater than the number reported after the summer was over --because the number of "stop-outs" who returned to school was greater than the number of
students deciding to drop out over the summer. These findings support anecdotal reports from
the states that the number of students who return to make one more attempt at school in the
fall is substantial enough that states that consider these students dropouts should not becompared with states that remove them from the dropout rolls.
Other Education or Training
Students who remain in an elementary-secondary program are not considered dropouts,
regardless of the content of that program. On the other hand, students who leave high school
and enter into an adult education or training program are to be reported as dropouts. State
contacts were asked whether they categorized students as dropouts or continuing in school
under several conditions. The results are displayed in table 3.
13 25

-.o
"
4,00
28
lull
/fir
si!!!
!WI
il[l fill,
-if
11! it
Ig
18.
a
-4.<
11
888
8
1,2 0 0
NO
N "
4
cDcp
::gt
Mil
411
Pill
114
OM
MO
Hill
d 88-c
- 8c-<
8-<8
18T a
3
zz izzi
00 0
o o 1
00000 00000 00000 l0000 00000 00000 00000 00000 00000
00000
0000 00-)00 'poop 00000 00000 00000 00 0-
0 -000
oz0000 00000 000zo I0000 ozooz z000z oozoo 00000 oozoo
00000 oozOO 0000z l0000 00000 00000 00000 00000 00000
1
1o o o oloo
00000 10000 foloo coolzo z0000 000zo 000zo
Pl
zzo o az° oz000 lozoo 'ciao° 2000 z op° zzzoo °zoo° zozzo
1
11 111

How did you report students who did not complete high school, butmoved from the regular school program to some other type of educationor training?
Transfer to an alternative prograns. Students who move to an alternative school orprogram run by the local schools are not dropouts. All states reported that they followed theCCD definition and treated these students as continuing their secondary education.
Transfer to adult education GED. Students who leave high school and then enroll inan adult education program preparing them for the test of General Education Development(GED) are to be counted as dropouts, regardless of what agency offers the program. Thirty-three states followed this definition (65 percent of all states), and counted these students asdropouts. However, 10 states (20%) counted them as contiLaing their secondary schooling.In Rhode Island, such a student was counted as continuing if he or she signed and adhered toa contract to attend GED classes, but was considered a dropout in the absence of this formalcommitment. In Arkansas, Colorado, Delaware, New York and North Carolina, transfers toadult education GED are tracked for the remainder of the school year, and reported asdropouts if they leave these programs during the year.' Wisconsin is reported as agreeingwith the CCD, but it should be noted that state law allows students to enroll in postsecondaryprograms and remain on the public school rolls as long as the school district confirms that thestudent continues in school.
Transfer to secondary Gam. There are some secondary school programs preparingstudents for the GED. Students in secondary GED programs are not counted as dropoutsunder the CCD definition. A total of 39 states (76 percent of all) complied with the CCDdefinition in this area. An additional eight states (16%) said that such programs are notavailable and the question is moot. Connecticut and Mississippi consider secondary GEDprogram students to be dropouts, in disagreement with the CCD definition. Connecticut willchange this with its 1992-93 school year data, while Mississippi continues to treat all GEDtraining as adult education.
Early admissions. Students who complete high school requirements and are grantedearly admission to postsecondary school before they receive a high school diploma should notbe counted as dropouts. This was the case in every state that had such early admissionsprograms. In no state would an early admissions student be counted as a dropout.
Job Corps enrollment. Job Corps is a federally-funded residential training programthat is aimed at young people who lack the education and employment skills needed tosucceed as adults. Some Job Corps programs offer a secondary education program that isrecognized, and may be sponsored, by the state or local school systems. Students transferringto these programs are not considered dropouts. However, other Job Corps programs do not
8It should be noted that the CCD reports GED diploma recipients 19 or younger as school completers. As ofSeptember, 1994, the American Council on Education approved pilot projects for admini:itering the GED tests toin-school youth in Alabama, Florida, Georgia, Hawaii, Tennessee, Texas, Virginia and Wisconsin. In all other cases,students must withdraw from school before they can take the GED tests.
15
offer a recognized secondary program, and students leaving high school to enter into thistraining are considered dropouts.
In 11 states (22%), no Job Corps enrollees are counted as dropouts, regardless ofwhether a secondary program is offered. All Job Corps students are considered dropouts in27 states (53 percent of all states). Five coordinators were not aware of any Job Corps sitesin their states and considered the question not applicable. Three other states -- Michigan,Mississippi, and Pennsylvania -- make the requested distinction, considering Job Corpstransfers as dropouts unless they enter a program known to offer a secondary component.Two respondents were not sure how Job Corps students were treated.
Effects of other program classification. All states report in agreement with the CCDdefinition when classifying students who are enrolled in secondary alternative programs andthose who have achieved early admissions to postsecondary school (not dropouts). The statesthat do not count students in adult education GED programs as dropouts would have lowerdropout rates than those states that comply with the CCD standard. On the other hand, thestates that count students in secondary GED programs as dropouts would expect higherdropout rates than other states.
The effect is less clear with Job Corps enrollments. States that do not count JobCorps trainees as dropouts would in theory have lower rates than states that do. However, ifa Job Corps program includes a state- or district-recognized secondary component,participating students should not be considered dropouts.
Twelfth Grade Leavers
It is possible for a student to complete grade 12 without meeting the requirements fora high school diploma. This can happen, for example, if the student does not pass amandatory proficiency examination. A student who leaves school under this condition shouldbe counted as a dropout. The CCD dropout instructions did not give specific directions forthis situation, so state coordinators were asked:
How do you classify students who complete the 12th grade and who leaveschool without receiving a diploma? As dropouts or completers?
In 17 states the respondent said this situation could not occur, and the question wasnot applicable. Twenty states (39%) said these students would be counted as dropouts, andeight states (16%) would count them as completers.9 Louisiana and Texas were not yet ableto say how such students would be reported. The decision is made by the local schooldistrict in Michigan, and in North Dakota the determination rests on local option decisionsabout the number of credits required for graduation.
'Some states offer an alternative credential, not a regular diploma, to students completing the course workrequired for a diploma, but v.ho do not meet other requirements.
162b

Effect of 12th grade leavers. States that do not have high school diplomarequirements beyond completing grade 12 would logically have fewer dropouts than statesthat do impose extra conditions. The same is true for states that count such 12th gradeleavers as completers, rather than dropouts. However, it is not anticipated that the numbers ofthese 12th grade leavers would be very large.
Variations in Reporting Schedules
States were asked, under the CCD dropout definition, to follow an October 1 -- September 30reporting year, and to count as a dropout any student who was not enrolled on October 1.Variations in how these data collection requirements were followed could lead to differencesin the numbers of dropouts reported in two ways: whether the October 1 cut-off date wasused, and whether school districts had the opportunity to correct their "as of October 1"numbers. The information in table 3 shows that there was considerable variation acrossstates.
Cut-off date. The CCD definition required that each school district determine onOctober 1 the dropout or other status of each student enrolled in the previous school year.State dropout contacts were asked:
The CCD set October 1, 1992 as the cut-off date for decidingwhether a student who had been enrolled in 1991-92 was adropout. Did you use October 1 or some other date as a cut-off?(Specify)
Any state that reported a cut-off date between September 24 and October 8, a week'slatitude around the CCD standard, was considered to be in agreement with the CCD'sprescribed October 1 date. This included specific calendar dates (example, October 1) anddates that would have to fall within the range (example, first Tuesday in October). Therewere 19 states that fell into this category, or 37 percent of the total.
Eleven states (22%) collected dropout counts as of the end of the school year. And,each of these 11 counted students who were not enrolled at the end of the year as dropouts,regardless of whether the students re-enrolled in the following autumn. The practice in thesestates confounded two different reporting discrepancies. Summer dropouts were given theentirety of the school year to enroll, while regular year dropouts who returned the nextOctober 1 were not removed from the dropout count. The states following this practice wereColorado, Illinois, Iowa, New Jersey, Oklahoma, South Dakota, Tennessee, Utah, Vermont,Wisconsin and Wyoming.
An additional 1, Aates had a specific cut-off date that did, or could, fall outside thetwo-week range around October 1. These dates ranged from as early as September 10 (NorthDakota) to as late as December 1 (Nevada). It is impossible to determine which states use acut-off before October 1, and which use a later date, since many states set the cut-off as agiven number of days after the start of school, which can vary by district. However, on thearbitrary assumption that school begins September 1, the following states would have cut-off

dates earlier than the CCD requirement: Florida, Hawaii, Minnesota, North Carolina, andNorth Dakota. Those whose cut-off date does (or could) fall after October 1 includeArkansas, California, the District of Columbia, Nevada, Ohio, South Carolina, Texas, andVirginia.
Four states did not fall into any of these categories. The cut-off date varied by schooldistrict in Alabama, Kansas and Pennsylvania (which has established a standard cut-off dateas of the 1993-94 school year). In West Virginia, dropout counts are collected and amendedeach month, with students who are not enrolled at the end of the year considered to bedropouts.
Enforcement of catt-off defies. The date on which enrollment requirements are enforcedis the final determinant of the cut-off date's impact on data comparability. Forty-six statesanswered the question:
Was a dropout's status changed if you determined that he or shehad actually enrolled shortly (say, within two weeks) after?
Of the 46 states that answered, 25 said that late enrollees were not permitted to beremoved from the dropout roster (49 percent of all states) and 16 responded that late enrolleeswould be removed from the dropout count (31%). An additional five states describedpractices that would have the same effect as varying the cut-off date. Iowa does not have afixed dropout date, South Dakota and Wyoming collect counts at the end of the year, and inWest Virginia, dropout status is updated monthly. The Texas respondent believed the practicevaried by district.
Effects of ad-off dates and enforcement. It is impossible to quantify what effectvariations from the October 1 cut-off date would have in various school districts because thefirst day of school varies. For example, "the second Monday in September" would berelatively "earlier" for a district opening after Labor Day than one opening in mid-August.However, it seems likely that in 19 states (those who have a late cut-off date or remove lateenrollees from the dropout count) the dropout count should be consistently deflated.
End-of-school-year counts produce two kinds of data problems, as noted earlier. Forany given year, the practice would reduce the number of summer dropouts, since those re-enrolling after October 1 would not be counted as dropouts. At the same time, the practicewould increase the number of regular year dropouts by failing to remove those students whodropped out during the year and re-enrolled by the next October 1. These errors presumablycancel one another out to some extent.
The five states observing a cut-off date earlier than October 1 could have highernumbers of dropouts, if they removed October re-enrollees from their dropout rosters, thanstates with later cut-off dates. Also, states that enforce their established dropout dates shouldhave higher dropout counts than states that allow some latitude in how the dates are applied.However, dropout counts are generally reported by school districts at the same time asmembership counts. This would argue that the membership count that serves as the
18

denominator for a dropout rate is increased or decreased in the opposite direction from thedropout count itself, increasing the extent to which the dropout rate is distorted.
Schedule for correcting reports. The CCD dropout reports are based on school districtreports that identify a student's status as of October 1. However, it can be well after October1 when a district reports to the state education agency, and even later when the data arereported on the CCD. The schedule inherent in the CCD dropout definition assumes thatcorrections can be made if, for example, a district later learns that a student whose status wasunknown on October 1 had actually transferred to another school system.
To find out if such corrections were possible, dropout contacts were asked:
If you did use a cut-off date (for deciding whether a student wasa dropout), did you literally freeze your records on that day, orcontinue to accept corrections?
Only eight state contacts said that records were "frozen" and could not be corrected(Alaska, Arizona, Arkansas, Nebraska, Nevada, New Jersey, New Mexico, and SouthCarolina). Other states had a range of practices. Some simply kept their records open untildata were published, while several had formal public review procedures before a file wasclosed. When respondents commented on this question, they generally noted that school
district corrections had been few.
Summary: Effects of 1991-92 Variations
The interviews discussed above were intended to determine the extent to which statesadhered to a standard CCD-sponsored definition and set of collection procedures in reportingdropouts. Since the standard definition was promoted to bring about comparable dropoutstatistics, discrepancies the inflated or deflated a state's dropout count relative to the CCDstandards are critical. The effects of the reported variations are summarized in table 4.
Overall, the 1991-92 dropout counts reported on the 1992-93 CCD show considerablevariation in how states applied the definition and collection procedures of the CCD. Twostates could have increased their counts, compared to those following the CCD procedures, byfailing to remove from the dropout rolls those students Voii0 returned before the end of the1991-92 school year. Some 23 states would have inflated their dropout reports by failing toremove those who had re-enrolled by October 1, 1992. And, two states increased theirnumbers of dropouts by counting transfers to secondary GED programs as dropouts.
Counting pupils who moved to adult education GED programs would have reduced thenumber of dropouts reported, and this was the case in 10 states. Nineteen states decreasedtheir counts by removing students who re-enrolled after October 1 from the dropout report.
Setting or enforcing a cut-off date other than October 1 could have increased thenumber of dropouts in two states that set a date earlier than October 1 and did not permit late
enrollments. It is difficult to interpret the outcome among states that followed a July -- June
19

mare ai. tam= or awire repormn vansoons on (sonata count when narnottreci to CCU atandardo: 1021 -82 cahoot year 9113 &Wee)
Mato
End of Nextyear year
returnees returnees
Erectiment Enrcenordcutca dale
dots entorosnradAda SecondaryGED , GED
traMterodeleaVM
Notaccas + vNaasMoonsMoneta ?CatesCoiorado + v ?Connecticut +Dahmer° + ?Distrtct of CsiumbiaFluids + +
GeorgiaHawaii + +Ickhe +119nots + vIndans + +
Iowa + v ?Kama v + vKentucky -- --Louisiana + ?Maine +
Nicrytendftszeshasoottolastigan vMinnesota + +Ditiosisaippt +
FiiirsowlMertens -- 7 -- -- -- -- `*NobresicaWeedsNow Hampshire -- -- -- -- -- -- --Now. Jeresy + vNew Maxie°New York ?North CorottneNorth Dakota
++
+?
?v
Ohio +Oklahoma + vOregonPannsylvanta VRhode tend
arolinaSouth Dakota + vTormentsTexas
+ vv ?
Utah + V
Vermont + vVITOT1:13 VWashington -- -- -- -- -- --Wont Virginfa + v ?Wiacoratn + v)tipp____,____ + V
SUMMARY - -Effect on count rctathro CCD sladucta:
Mora= (+)Deere:cos ()
Voris's. unknown
1
01
2301
08
18
2194
0106
200
0
4
+ Practicer produces mom dropout* than CCD standardPractice produce* fey= dropout* than CCD ctindard
v Chat of presets varks? Effect unlmown-- Not reported
SOURCE: U.S. Ow-Anent of Education. hiational Cant= for Education Stattatica. Common Coro of Dote Doti Pen Supptment*.
20
BEST COPY AVAILABLE 3 2

reporting schedule, because this practice would have had differential effects on the numbersof regular year and summer dropouts.
Of the 13 states with state dropout definitions that differ from the CCD, three (Florida,Massachusetts and Mississippi) consciously provide different reports for state and CCD uses(see table 1). In two of the states (Colorado and Massachusetts) the practices in placelogically would result in state dropout counts or rates greater than those on the CCD. InFlorida, Mississippi and Oklahoma the state reports logically would have lower numbers and
rates than the CCD, while Arizona's inflated denominator would not affect counts but wouldlower rates. The direction of the difference is not clear for Alaska, Idaho, Rhode Island,South Carolina, or Virginia.
While it is possible to identify aspects in which state dropout reports differ from oneanother, it is not equally clear what the quantitative effect of these differences are on dropoutcounts. Anecdotal reports from states suggest that the greatest threat to comparability iswhether students who re-enroll by October 1 of the year after which they have left school areconsidered dropouts. (Failing to remove from dropout counts those who return by the end ofthe school year is even more biasing, but limited to one or two states.) The decisions abouthow to classify returning students tend to be basic components of the state's dropout reportingsystem. In order to comply with the CCD requirement, non-standard states would have tomake systemic changes.
Attributing summer dropouts to the wrong school year and grade is another variationwhose correction would require major changes in dropout reporting systems. Misclassifyingthese dropouts may not distort the overall dropout count, but it can bias grade-by-grade
dropout rates.
Other sources of bias are more "superficial" in that they could probably be addressedby amending current reporting systems. These corrections include counting adult educationGED program participants as dropouts, changing the cut-off date to October 1 (or adjustingcurrent reports to reflect that date), and enforcing the established cut-off date.
21

PART 2. FOLLOW-UP SURVEY ON PLANS TO CHANGE
1992-93 was the first year in which states reported dropouts on the CCD, and thecollection included a major change ;the year to which summer dropouts were attributed) fromthe version that had been field tested. In early April, 1994, NCES wrote to 40 states that hadone or more serious differences from the CCD, asking the state to confirm this difference andindicate when it could be corrected. The "serious" differences were failure to remove end-of-year or October 1 returnees from the dropout count; misclassification of adult education orsecondary GED program participants; and not enforcing an October 1 cut-off date in decidingwhether a student was to be reported as a dropout. (Coordinators were not asked aboutattributing promoted summer dropouts to the wrong grade, which was later judged to be aserious data problem.) Thirty-nine states had answered by mid-October, and their responsesare shown in table 5.
Categorizing Re-enrolling Students
In reporting 1991-92 dropouts, two states did not remove from their dropout rollsstudents who dropped out in 1991-92, but returned before the end of the school year. Kansassaid it was corrected as of the 1992-93 school year, and Indiana said that while there were noplans to change this practice, the state would discuss the possibility.
Twenty-three states counted 1991-92 dropouts who were enrolled on October 1, 1992as dropouts. Five states have corrected this, or will do so within two years: Delaware,Kansas, Louisiana, Maine and West Virginia. Ten states can, or may consider ways to,change their data collection. These states are Colorado, Indiana, Iowa, Minnesota, Oklahoma,South Dakota, Utah, Vermont, Wisconsin, and Wyoming. The conditions affecting a possiblechange that these state respondents brought up included long-range changes to state legislationor board policy, adding a report item that would have district surveys "back out" Octoberreturnees, or waiting for NCES to settle on a standard definition and procedures.
Six respondents said that their states had no plans to change dropout collectionpractices, generally because they did not have the means to identify returning students fromone school year to the next, because their practices were set in state law, or they simply didnot feel motivated to do so. These states were Florida, Idaho, Illinois, Maryland, New Jersey,and Tennessee. It appears that Florida has the capability, through its student record system,to remove October 1 returning students from CCD dropout reports if the state chooses.Virginia intends to maintain its practice of removing only those returning dropouts who havecompleted their missed school work in summer school. Alabama and Ohio did not respond to
the letter.
Arizona, which appeared to agree with the CCD in 1992-93, wrote NCES stating thatin the future the state would count October 1 returnees as dropouts.
23
4

Table S.States plans ,to change nonstandard CCD dropout reporting practices (all states)
StateJune October Otherrecapture recapture Adult GED problems
Alabama
Arizona
Arkansas
California
Colorado
no response
will break out
track students
unresolved
perhaps; if NCES sets track students keep end of year countfirm practice
Connecticut working on change secondary GED - drop -working to correct
Delaware fixed - 1992-93 track students
District Columbia
Florida
Hawaii
no plan to change
Idaho no plan to change
Illinois no plan to change
Indiana possibly change- not possibly change - notplanned planned
Iowa legislated but mayconsider law change toOct 1
can report adult keep October 19 countGEDs separately
no plan to change no plans to change - lateno shown aren't dropouts
will fix keep early Septembercount
Kansas fix 1992-93 (1993- 94 fix 1992-93 (1993-94reports) reports)
Kentucky no response summer dropouts instate board regulationmay change, no plans
Louisiana fur by 1993-94
Maine fix 1994-95
Maryland no plan to change
no change - Boardrequirement
Michigan could partition outalternative prop.
fix; enforce date by1994-95
no change- latereturnees not drops
Minnesota could fix by 1994-95
Mississippi Secondary GED - countas drops
Nebraska keep end of Sep cut offdate
Nevada late cut-off, no response
New Jersey no plan to change no change - keep Lateenrollment
24
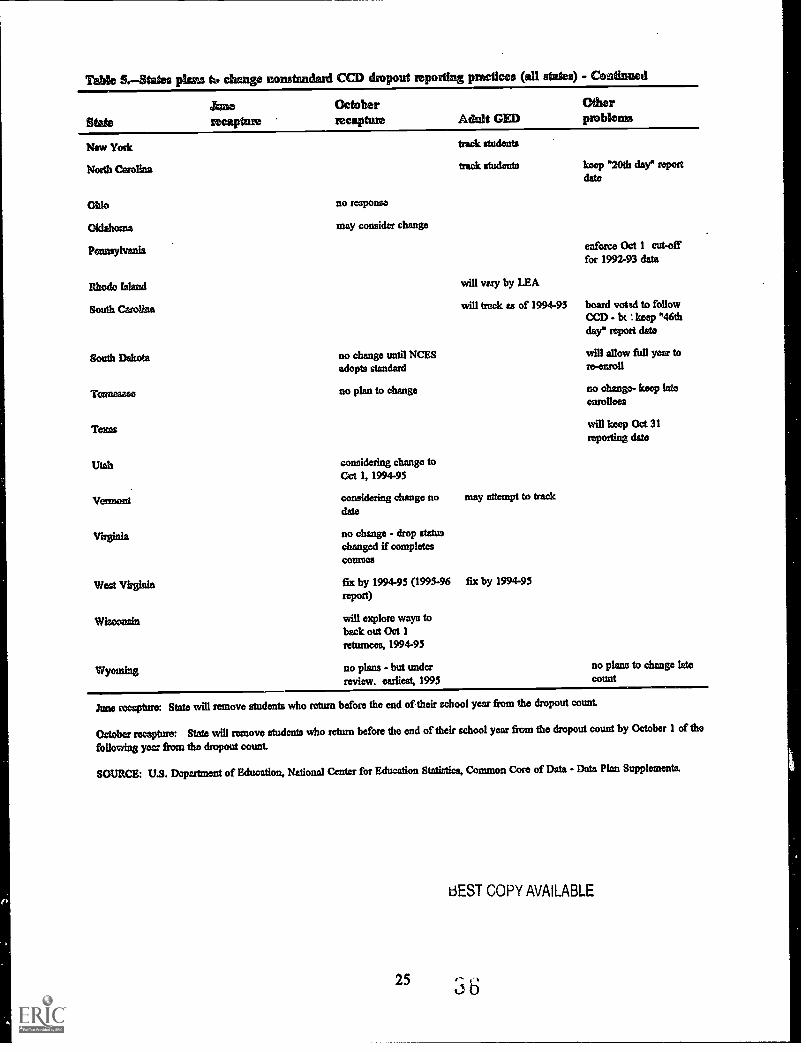
Table 5.-8tates phew to change nonstandatd ODD &void Reporting practices (all states) - Continued
StateJune Octobertecaptute weapon Adult GED
Otherpnoblenis
New York track students
North Carolina track students keep "20th day" reportdate
Ohio no response
Oklahoma may consider change
Pennsylvania enforce Oct 1 cut-offfor 1992-93 data
Rhoda Island will vary by LEA
South Carolina will track as of 1994-95 board voted to followCCD - be keep "46thday" report data
South Dakota no change until NCES will allow full year to
adopts standard re-enroll
Taineseee no plan to change no change- keep lateenrollees
Texas will keep Oct 31reporting date
Utah considering change toCot 1, 1994-95
Vannord considering change no may attempt to trackdate
Virginia no change - drop statuschanged if completescourses
West Virginia
Wisconsin
Wyoming
fix by 1994-95 (1995-96report)
will explore ways toback out Oct 1returnees, 1994-95
fix by 1994-95
no plans - but under no plans to change late
review. earliest, 1995 count
lune =sphinx State will remove students who return before the end of their school year from the dropout count.
October recapture: State will remove students who return before the end of their school year from the dropout count by October 1 of the
following year from the dropout count
SOURCE: U.S. Department of Education, National Center for Education Statistics, Common Core of Data - Data Plan Supplements.
25
TEST COPY AVAILABLE
s'l0b

GED Program Emu !lees
Of the two states that counted secondary program GED students as dropouts,Connecticut is working with its school districts to correct this practice, and it is not knownwhat Mississippi intends to do.
Tcn states did not count adult education GED students as dropouts in 1991-92. Ofthese, six states believe that they can change this practice or somehow identify such transfersand report them as dropouts: the District of Columbia, Hawaii, Minnesota, South Carolina,Vermont, and West Virginia. Florida and Louisiana do not intend to change their reportingpractices. The issue is unresolved in California, and it is not known what Kentucky intendsto do.
Enforcing Cut-off Dates
The question of whether to remove a late returner (a student enrolling after October 1)from the dropout rolls is confounded with the question of whether a state follows the October1 reporting date, particularly whether it follows a July-June or October-September reportingyear.
In general, the states that collect dropout counts at the end of the school year willcontinue to disagree with CCD reporting practices in two major ways. First, these states willallow students who completed the 'previous school year to enroll after October 1 withoutbeing counted as dropouts. Second, these states will consider students who did not completethe previous school year, but who are enrolled on October 1 of the current school year, asdropouts for the previous school year. States are also unwilling to change reporting dates atthe beginning of the school year to conform with the October 1 requirement. Some echo theargument made by South Carolina, that reporting on the 46th day of the school year isactually more uniform than setting a calendar date, because districts vary in when they openschools. Others argue that their collection date is set by law or board policy, or that the dateis used for a number of other statistics, and that change would be difficult (and ofquestionable value).
Summary of Possible Changes
Under the most optimistic assumptions, the CCD dropout statistic would be fairlyconsistent across states by the 1994-95 reporting year. All but two states (Montana and NewHampshire) would be reporting an annual dropout count by that time, and all but three of thereporting 49 would report dropouts broken out by sex and racial/ethnic status.
All reporting states would remove students from their dropout counts if these schoolleavers re-enrolled by the end of the year in which they dropped out. Only seven stateswould fail to remove from their reports dropouts who re-enrolled by October 1 of thefollowing school year. The number of these states possibly could be reduced by the growthof individual student record systems that would make it possible to track students acrossschool years and school districts.
26 57

A more pessimistic evaluation would still have 48 states reporting in the near future,with 47 of them providing the full detail requested. However, two states would still countend-of-year returnees as dropouts and 18 would fail to remove October 1 returnees from theirdropout reports (the optimistic assessment above assumes that 11 of these 18 could make sucha change). One state would consider secondary program GED students as dropouts, while sixstates would not consider students in adult education GED classes to be dropouts.
27 38

Part 3. Analysis of 1991-92 Dropout Data
Although the dropout counts from the 43 states reporting district-level data for the1991-92 school year did not consistently follow CCD standards, the information collected inthis first year is useful. This section explores the completeness of reporting from participatingstates and the differences between adjusted and unadjusted dropout rates. A brief discussionof the numbers and types of dropouts reported for 1991-92 concludes the section.
Standard and Nonstandanl Data
The dropout data reported on the 1992-93 CCD Agency Universe for school year1991-92 should have included two types of dropouts:
O Regular year dropouts, who were enrolled in 1991-92, dropped out during thatyear, and were not enrolled on October 1, 1992; and
Summer dropouts, who completed the 1990-91 school year but were not enrolled
on October 1, 1991.
Twenty-four states incorrectly counted as dropouts those students who returned by theend of the 1991-92 school year, Students who re-enrolled by October 1, 1992. An additionalfive states attributed summer dropouts to the wrong year. These were the two departuresfrom the CCD definition judged most likely to have biased the size of the dropout count.'Because of this, NCES is publishing dropout counts and rates from only the 14 "standard"
states.
A small number of districts reported dropouts, but no students in membership. Thesedistricts are omitted from the analyses, where appropriate. This omission accounts for somedifferences in the total number of districts in some tables.
Computing Dropout Rates
Rates are the proportion of a given group that is dropouts. That is, a dropout late forgrade 8 is the number of grade 8 students dropping out divided by the grade 8 membership.Membership is the count of students on the school's rolls on October 1 of the school year.Unless otherwise noted, rates are based on October 1, 1991-92 membership alone.
Membership is based on the 1991-92 CCD School Universe. The grade-levelmembership counts used in this analysis were reported on the CCD School Universe survey.District membership counts were calculated by summing membership for the grade(s) ofinterest across all schools associated with a district. The state membership totals shown in
'These are the major, but not the only, conditions affecting data comparability. Failing to enforce a cut-off date
close to October 1, and failing to count adult education GED transfers as dropouts would also bias the total count.
this paper are the sum of the district totals thus computed, and may differ from the numbersiii the 1991-92 CCD State Aggregate report.
Ungraded students. The "ungraded" dropouts reported by the District of Columbiawere apportioned across grades 7 through 12. For all analyses except those comparingdifferent methods of computing the dropout rate, ungraded students were distributed across thegrade 7 through 12 membership counts in all districts reporting ungraded students. Thenumber of ungraded students in each district was prorated across all of the grades in thedistrict on the basis of the number of students in each grade.
Rates. School district dropout rates are the ratios of dropouts to membership for thegroup of interest (example, grade 9). State dropout rates are based on state iotals for dropoutsand students in membership, and are not the average of district rates. Similarly, total rates fora group of states are based on the sum of dropouts divided by the sum of membership, notthe average of the state rates.
Quality of the 1991-92 Data
The first year's dropout reports provided a valuable opportunity to explore severalpotential threats to data quality. The first of these was completeness of reporting -- was thereinternal evidence that school districts were systematically failing to report dropouts? Thesecond issue was the quantitative effect of failing to adhere to the CCD definition.
Comprehensiveness of Reporting
Only school districts enrolling students in one or more of grades 7 through 12 canhave dropouts. Across the 42 states and the District of Columbia reporting 1991-92 dropoutsat the school district level, a total of 12,109 districts reported students in membership in anyof grades 7 through 12 in 1991-92 (table 6). This group included 86 percent of the 14,169school districts with any pupils in membership in these states during that year. All districtsincluded students in the potential dropout grades in the District of Columbia, Kansas,Maryland and Nevada. The smallest proportions of districts with potential dropouts werefound in Vermont (39%), Maine (65%) and Massachusetts (66%).
Districts with no dropouts. A total of 3,259 of the 12,109 districts, or 27 percent, didnot report any 1991-92 dropouts. This figure included 3,097 districts reporting "0" dropoutsand 162 districts for which no numeric count was given -- the number of dropouts was leftblank or somehow coded as missing data. Because the number of districts with missing

Table O. -- Missing OA or 0) dropout vaunts among districts with any of grader) 7-12: 1991-92 school year (49 steles Reporting
district-love! dropout dated
Total Potentiallydistricts reporting
Non-
missha
Total 14,169 12,109 162
Alabama 130 129 0
Arizona 247 203 1
Arkansas 340 322 0
California 1,087 OD 0
Colorado 193 179 0
Connecticut 179 154 0
Delaware 22 19 0District of Columbia 1 1 0
Florida 74 70 0
Idaho 114 113 6
lilt nais 1,000 937 0Indium 328 301 10
Iowa 471 405 1
Kansas 304 304 0
Louisiana 71 70 4
Maine 327 211 0
Maryland 24 24 0
Massachusetts 433 203 oMichigan 819 550 28
Minnesota 510 381 0
Mississippi 182 157 0
Missouri 539 633 0
Nebraska 848 555 0
Novada 18 18 2
Now Jersey 020 498 0
New Mexico 38 92 4
North Carolina 135 131 0
North Dakota 317 241 0
Ohio 789 611 0
Oklahoma 508 558 0
Oregon 308 272 2
Pennsylvania 613 513 13
Rhode Island 37 35 0
South Carolina 108 94 3
South Dakota 218 187 0
Tennessee 140 132 0
Texas 1,048 1,024 0
Utah 47 40 0
Vermont 345 134 7iVirginia 181 133 3
West Virginia 57 58 1
Wisconsin 427 428 10
Wyoming 58 49 0
NanroccarOng 0Grade 7-12 Distsicts Non -
Nan- total High with any reporting
roportng Restrict membership grade of grades 0 or
0 districts lass than 200 7 ar 8 9-12 missing
3,097 3,009 2,590 2,019 9 6 2 1,133
4 3 0 0 129 4
53 se 47 51 103 3
27 ea 7 0 320 27
639 510 360 403 443 41
83 85 34 0 170 23
se 32 25 28 123 4
0 0 0 19 0
O 0 0 1 0
2 0 2 0 70 2
8 6 6 0 108 7
402 397 281 375 531 27
O 0 o 300 9
77 77 eo 38 382 40
53 83 38 0 303 53
0 0 0 70 4
103 103 94 91 118 12
O 0 0 24 0
42 37 23 31 255 11
32 32 17 0 528 34
84 71 se 20 338 04
1 0 0 0
124 124 118 82
334 351 354 247
0 -- 0 0
247 247 174 203
132
1e314
188 1
130
16014
97720
03
9772
69
157450308
17272
1
42117
1
39
12 0 92 17
0 0 131 2
152 40 201 128
4 0 610 14
183 114 437 54
94 60 181 18
2 2 511 18
2 2 33 00 0 93 2
62 10 173 58
0 0 4 6 123 2
202 202 169 51 972 151
4 4 2 0 40 4
1 1 1 0 85 8
0 0 0 131 1
0 0 0 58 1
111 111 60 44 330 76
8 0 6 1 47 5
- - Not applicslio.
SOURCE U.S. Department of Education, NationalGent= for BlItPX6041 Steeko, Common Coro of Data.
HEST COPY AVAILABLE
31 41
dropout counts was considerably smaller than the number for which "0" dropouts werereported, more attention was paid to these zero-dropout districts.
District.; reporting 0 dropouts. It is possible that dropout codes of "M" for districtsthat are unlikely to serve students directly reflect a reporting problem rather than truly missingdata. However, reports of 0 dropout for regular school districts are positive statements thatstudents were served, and none dropped out.
Thirty-one of the states reporting dropouts in 1991-92 had one or more regular schooldistricts that reported "0" dropouts. This ranged from a single regular school district inVermont to more than half of the regular districts with grade 7-12 students in California,Nebraska, and North Dakota.
Three plausible reasons for a district to report 0 dropouts could be explored readilythrough other information on the CCD. These were school district type, size, and the gradesserved (table 6).
School district' type. Some types of school districts, such as supervisory unions andregional service agencies, are unlikely to provide direct services to students but may reportmembership figures on the CCD that reflect students under their aegis who are served bysome other agency. Other types of agencies, such as state-operated residential schools, maybe unlikely to have students dropping out of school. Most of the districts reporting "0"dropouts were regular school districts; table 6 shows that 3,009 of the 3,097 districts with 0dropouts were in this category." However, none of the school districts with no dropouts inFlorida, Mississippi and North Carolina were regular school districts.
District size and dropout's. Small districts would be less likely to have dropouts thanlarger districts. Some 2,399 of the 3,097 districts (77%) reporting no dropouts had acumulative membership of fewer than 200 students across grades 7 through 12. All of thedistricts with no dropouts fell into this small size category in Florida, Idaho, Rhode Island,Vermont and Wyoming. The greatest numbers of these small districts were found inCalifornia (350 of the 539 districts), Illinois (261 of 402), Nebraska (354 of 364), New Jersey(174 of 247), North Dakota (152 of 166), Oklahoma (163 of 168), and Texas (169 of 202).
Grade span and dropouts. Table 6 shows that a total of 2,019 districts reporting nodropouts (65%) ended with grade 7 or 8. More than half the districts reporting no dropoutswere in this category in Arizona, California, Connecticut, Illinois, Maine, Massachusetts,Missouri, Nebraska, New Jersey, Oklahoma, Oregon, Rhode Island, and Tennessee.
Idaho, Michigan and Nevada had reported that they excluded dropouts for grades 7and 8 from the CCD. Among states that did not explicitly exclude grade 7 and 8 dropouts,the lack of dropouts from districts ending in these grades could have been related to one oftwo reasons. The first is that dropout rates are much lower in grades 7 and 8, in whichstudents are likely to be younger than the age at which state law allows them to leave school.
IlThis includes the CCD categories of Type 1 (local school district) and Type 2 (local school district componentof a supervisory union).
32
42

The second possible cause is that districts may not have reported these younger school leavers
as dropouts, considering them instead as truancy problems even in states that do not mandatethis classification. Regardless of whether these - or other factors were in operation, theanalysis suggests that any under-reporting that took place was most likely to have biased thestatistics for grades 7 and 8.
Compideness of grade 9-12 data. The most familiar event dropout rate is that which
includes grades 9 through 12, the high school years. As table 6 illustrates, there were 9,802districts that included any of these grades. Of these, 1,133 (12%) reported no dropouts. Thenumber of grade 9-12 districts reporting 0 dropouts reported ranged from no cases inDelaware, the District of Columbia, Maryland, and Rhode Island to more than 100 districts inNebraska, North Dakota, and Texas.
Effects of Summer and October 1 IVEsallocations
Dropout data were not considered acceptable if states allocated summer dropouts to the
wrong school year and grade, or retained October 1 returnees ("recaptured" students) in thedropout count. Although the 1991-92 dropout collection did not collect information to testthe effects of these discrepancies, the 1989 field test of the dropout collection had collectedseparate counts of regular year and summer dropouts. This gave grade specific estimates ofthe proportion of dropouts who left during the summer.
Misall ocating summer dropout& The field test did not use a representative sample ofschool districts, but its findings can give a rough idea of how much dropout rates could bedistorted by attributing summer dropouts to the wrong grade. The estimates shown below arebased on the 1991-92 dropout rates for the 14 states that reported acceptable dropout dataRemember that if summer dropouts were attributed to the wrong year, only those who werepromoted and failed to re-enroll would be attributed to the wrong grade: a student who didnot return after failing the ninth grade in 1991-92 would still be counted as a ninth gradedropout, albeit for the wrong year. When dropouts are attributed to the wrong grade, theappropriate grade loses a portion of its summer dropouts to the previous grade and picks up aportion of the summer dropouts from the next grade. Using the field test findings on theproportion of dropouts who left in the summer, the estimates show what would happen if 100percent or 50 percent of the summer dropouts were accounted to the prior grade.'
' ee Appendix C for calculations of the effects of misaPooating summer dropouts and October recaptures. The
denominators for these calculations did not include ungraded students, and may therefore differ slightly from rates
shown °lumber°.
33
43
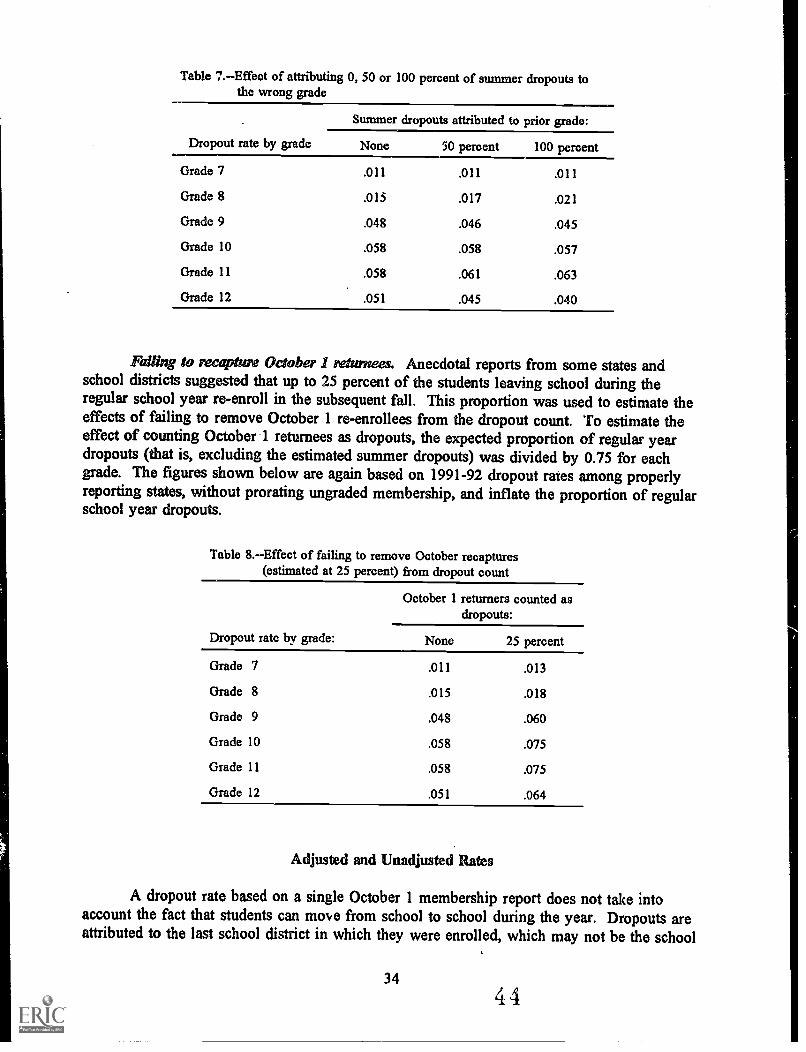
Table 7.Effect of attributing 0, 50 or 100 percent of summer dropouts tothe wrong grade
Summer dropouts attributed to prior grade:
Dropout rate by grade None 50 percent 100 percent
Grade 7 .011 .011 .011
Grade 8 .015 .017 .021
Grade 9 .048 .046 .045
Grade 10 .058 .058 .057
Grade 11 .058 .061 .063
Grade 12 .051 .045 .040
Failing to recapture October 1 returnees. Anecdotal reports from some states andschool districts suggested that up to 25 percent of the students leaving school during theregular school year re-enroll in the subsequent fall. This proportion was used to estimate theeffects of failing to remove October 1 re-enrollees from the dropout count. To estimate theeffect of counting October 1 returnees as dropouts, the expected proportion of regular yeardropouts (that is, excluding the estimated summer dropouts) was divided by 0.75 for eachgrade. The figures shown below are again based on 1991-92 dropout rates among properlyreporting states, without prorating ungraded membership, and inflate the proportion of regularschool year dropouts.
Table 8.--Effect of failing to remove October recaptures(estimated at 25 percent) from dropout count
October 1 returners counted asdropouts:
Dropout rate by grade: None 25 percent
Grade 7 .011 .013
Grade 8 .015 .018
Grade 9 .048 .060
Grade 10 .058 .075
Grade 11 .058 .075
Grade 12 .051 .064
Adjusted and Unadjusted Rates
A dropout rate based on a single October 1 membership report does not take intoaccount the fact that students can move from school to school during the year. Dropouts areattributed to the last school district in which they were enrolled, which may not be the school
34
44
district in whose membership count (and dropout denominator) they appear. A technicallyperfect dropout rate would report both dropouts and students in membership in something like"full time equivalents" -- with a student who enrolls in mid-year counting as one-half of astudent in the district's membership, and a dropout who spent three months in one district andsix months in another shown as one-third and two-thirds of a dropout in the respective
districts.
This degree of precision is beyond the scope of the CCD. LACES proposed analternate rate, however, that adjusted somewhat for net loss or gain in student membershipthrough transfers into or out of the district. This rate was based on the average ofmembership across two grades from one year to the next. In a sense, the rate treated a grade
as a cohort of students over time, averaging the grade 7 membership in October 1991 with
grade 8 membership in 1992. This "adjusted" rate would not be as accurate as oneapportioning students and dropouts over all of the districts in which they enrolled, but it was
feasible to implement with CCD data."
The major problem in using the adjusted rate is the requirement that the districtinclude both the grade of interest and the subsequent grade. For example,in a district endingwith grade 8 it is possible to calculate an adjusted rate for grade 7, but not for grade 8.Grade 12, in the absence of additional information, must rely on an estimate to produce theadjusted rate since it is not known how many of last year's grade 12 students are repeating the
grade this year, and should logically be added to the number of graduates to create the "nextyear" membership for grade 12.
Because there was an anticipated trade-off between the added precision and thelogistical difficulties in using the adjusted dropout rate, it was compared with the unadjusted
rate (that is, based on a single October 1 membership count) in this first year of the dropout
collection. All 43 states reporting district level data were included in these analyses."
Comparing Adjusted and Unadjusted Rates
Table 9 shows the ratio of unadjusted to adjusted dropout rates by state, for alldistricts and for four categories of grade 9 through 12 membership size in 1991-92. This
includes all of the districts with any of grades 9 through 12, and the analysis was limited to
grades to these grades because reporting was generally more complete for them." A ratiogreater than 1.0 indicates that thr unadjusted rate is the larger of the two.
'See Appendix C for more discussion of how rates were calculated.
"The differences between standard and nonstandard states were not expected to systematically bias one rate or
the other. And, because of time constraints in data processing, the rate comparisons used membership counts that
excluded ungraded students.
'5A total of 8,614 districts included some of grades 9 through 12; 29 of those were excluded from this analysis
because they were missing a membership count for 1991-92 or 1992-93.
35
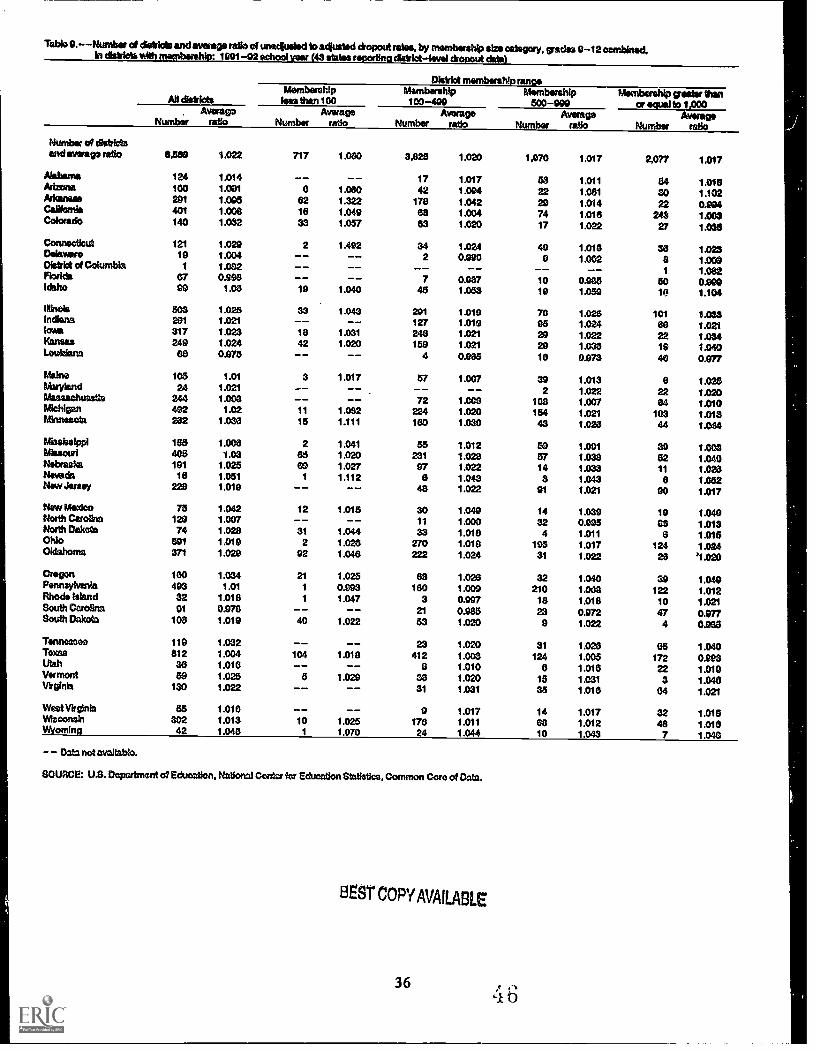
Table O.- -Number of &bids and average ratio */ unaellueled to aclusted dropout rates, by membership size category, grades 0-12 oambistad,In &ote nth membership: 1991-02 school year (43 states reporting district -Wei &must data)
AN districts
District membership rangeMembership
loss than 100Membership100-499
Membership500 -000
PAernbuship Ipardsr thanor equal* 1,000
AveragoNumber ratio
AverageNumber ratio
AverageNumber ratio
AverageNumber ratio
AverageNumber ratio
Number trA dittrictaand average ratio 4.530 1.022 717 too 3,826 1.020 1,070 1.017 2,077 1.017
Alabama 124 1.014 -- 17 1.017 53 1.011 84 1.015Arizona 100 1.001 0 1.060 42 1.004 22 1.081 30 1.102klauteas 291 1.006 62 1.322 178 1.042 20 1.014 22 0.994California 401 1.006 18 1.049 es 1.004 74 1.016 243 1.003Colorado 140 1.032 33 1.057 63 1.020 17 1.022 27 1.038
Connecticut 121 1.029 2 1.492 34 1.024 40 1.018 sa 1.023Defame 19 1.004 2 0.990 0 1.002 8 1.000District d Coiumbia 1 1.082 -- -- 1 1.082Florida 87 0.905 7 0.087 10 0.005 se 0.099Idaho 90 1.08 19 1.040 45 1.053 19 1.059 1p 1.104
Illinois 503 1.025 33 1.043 291 1.019 78 1.025 101 1.035Indiana 201 1.021 127 1.010 95 1.024 00 1.021Iowa 317 1.023 18 1.031 248 1.021 29 1.022 22 1.034Kansas 249 1.024 42 1.020 159 1.021 29 1.033 19 1.040Louiskuts 68 0.975 4 0.985 18 0.973 48 0.977
Maine 105 1.01 3 1.017 57 1.007 30 1.013 8 1.028Maryland 24 1.021 -- -- -- 2 1.022 22 1.020Distassachusetts 244 1.003 -- 72 1.009 103 1.007 84 1.010Michigan 492 1.02 11 1.082 224 1.020 154 1.021 103 1.019tanneesta 202 1.038 15 1.111 180 1.030 43 1.028 44 1.044
Mississippi 155 1.008 2 1.041 55 1.012 69 1.001 39 1.005Missouri 405 1.03 86 1.020 231 1.023 57 1.038 52 1.040Nebraska 191 1.025 09 1.027 97 1.022 14 1.033 11 1.026Nevada 18 1.051 1 1.112 8 1.043 3 1.043 8 1.062New Jersey 229 1.019 -- 48 1.022 91 1.021 90 1.017
Ns Mexico 73 1.042 12 1.015 30 1.049 14 1.039 19 1.040North Carolina -- -- 11 1.000 32 0.995 03 1.013North Dakota 74 1.028 31 1.044 33 1.018 4 1.011 0 1.018Ohio 501 1.019 2 1.020 270 1.018 195 1.017 124 1.024Oidahorna 371 1.029 92 1.046 222 1.024 31 1.022 28 4.020
Oregon 160 1.034 21 1.025 88 1.028 32 1.040 39 1.049Pennsylvesde 403 1.01 1 0.993 180 1.009 210 1.063 122 1.012Rhode Island 32 1.018 1 1.047 3 0.097 18 1.018 10 1.021South Carolina 91 0.978 -- 21 0.985 23 0.072 47 0.977South Daioota 108 1.019 40 1.022 53 1.020 9 1.022 4 0.985
Tennessee 119 1.032 23 1.020 31 1.026 65 1.040Texas 812 1.004 104 1.018 412 1.003 124 1.005 172 0.903Utah 38 1.018 8 1.010 0 1.018 22 1.019Vermont 59 1.025 5 1.029 36 1.020 15 1.031 3 1.040Virginia 130 1.022 31 1.031 35 1.018 04 1.021
West Virginb 65 1.010 9 1.017 14 1.017 32 1.0151Msoonsin 302 1.013 10 1.025 176 1.011 ea 1.012 48 1.010Wyoming 42 1.045 1 1.070 24 1.044 10 1.043 7 1.040
- - Dab not avaltalKo.
SOURCE: U.S. Department of Ectuostion, Nations! Cantor for Education Statistics, Common Coro of Data.
BEST COPY AVAILABLE
364 6

In theory, the unadjusted rate should be smaller than the adjusted rate (a ratio of lessthan 1.0) in states that experienced a net gain in students between 1991 and 1992. Inactuality, ratios of less than 1.0 predominated in only three states: Florida, Louisiana, and
South Carolina.
Across all districts and states, the unadjusted rate produced dropout rates about 0.02higher than the adjusted rate. Put into percentages, an adjusted dropout rate of 5.0 percentwould be matched by an unadjusted rate of 5.1 permit. However, the difference is higher inthe smallest school districts, where the unadjusted rate may be almost half again (Connecticut)
or one-third again (Arkansas) the size of the adjusted rate. Some reasons for this are thatpercentages in very small districts can be greatly influenced by changes of only a fewstudents, while some districts may have reconfigured their grade distributions between 1991and 1992. It appears also that some districts represented alternative programs for students atrisk of dropping from school, with open enrollment practices that make an October 1membership count almost meaningless.
Districts with rate differences. If the overall differences between the two methods ofcalculating dropout rate were small, there could still be substantial numbers of individual
districts for which the methods produced greatly disparate rates. Table 10 outlines the extentof difference between the two rates (adjusted and nonadjusted for grades 9-12), by state. Thetable shows the number of districts in each state for which the absolute difference between thetwo rates was 0.005. A difference of 0.005 (3.1 percent versus 3.6 or 2.6 percent, forexample) was considered questionably large.
A total of 8,648 districts including all of grades 9-12 reported one or more dropouts.Among these, 569 districts (7%) had differences of 0.005 or more between the adjusted andunadjusted rates. (None of these had a difference as great as .01.) In all but 14 cases, theunadjusted rate was larger. The only states without any districts exhibiting a difference of .05
or more between the two rates were Delaware, Louisiana, Utah and West Virginia.
A sample of the districts with differences of .005 or more between the adjusted andunadjusted rates were examined, and all appeared to fall within one of several conditions. Inthe first condition, the unadjusted rate was higher than the adjusted rate when a largeproportion of students (10 percent or more) dropped out. For example, "District A" reported55 dropouts from grades 9 through 12 in 1991-92; a 1991-92 membership of 274 students,and a 1992-93 membership of 243. The second condition was that in which a district'smembership size changed considerably. In "District B" the membership declined from 902 to24 students across those two years. It is not possible to determine from the data whichdistricts show reporting errors. However, some district names suggest that they are alternativeeducation agencies, for which high dropout rates and varying year-to-year enrollments could
be expected.
Districts with High Grade Below 12
Of the 12,109 districts including any of grades 7 through 12, a total of 2,350 (19%)ended in some grade below 12. The greatest number of such districts ended in grade 8. Astable 11 shows, it would not be possible to compute an adjusted dropout rate for grade 7 in
37

Table 10. Number of districts Including grades 9-12with absolute difference of 0.005 orgreater between adjusted and unadjusteddropout rates: 1991-92 school yaw(43 states reporting districtlevel dropoutdata)
Rata difference is 0.005 to 0.009Unadjusted0.005 and
greater thanadjusted
Unadjusted0.005 andless thenadjusted
Total 219 2
Alabama 0 0Arizona 31 0Arkansas 59 0California 11 2Colorado 5 0
Connecticut 3 0Delaware 0 0District of Columbia 0 0Rodda 0 0Idaho 18 0
Illinois 4 0Indiana 0 0Iowa 2 0Kansas 2 0Louisiana 0 0
Maine 0 0Maryland 1 0Massachusctts 1 0Michigan 15 0Minnesota 4 0
Mississippi 1 0Missouri 4 0Nebraska 3 0Nevada 0 0Now Jamey 7 0
New Mexico 8 0North Carolina 2 0North Dakota 5 0Ohio 3 0Oidahoma 12 0
Oregon 3 0Pennsylvania 1 0Rhode Island 3 0South Carolina 0 0South Dakota 2 0
Tennessoo 3 0Toxee 6 0Utah 0 0Vermont 0 0Virginia 0 0
West Virginia 0 0Wisconsin 1 0Wyoming 1 0
SOURCE: U.S. Department of Education, NationalCantor for Education Stack°, Common Coro of Data.
38
4 6

mig
colifpp
[WI
.1
0
Fee
Ili I
fis
1I
4E5-
aw
t&bic
:itscU Prci2 gdE4 HErg.(4
000 -.-.000
00200 Ot.004. 00000
000
000
000
E2 c, gS I)
h)
'4
23 CD g CD C)
gin a
C)
22 23 52 0C
C)
it
000-.4.
00000
N0 000
-.000*
0) 000-.
0-.000
00000
0000-,
00000
-.0000
-.0000
0000-,
000100
00000
00000
001,3-.0
000100
F
='--4
N0000
00000
CM C) C) C) 23
h) E3 0
0000-.
000100
00000
010000
00000
00+00
,Es
(588512g AMIn gati ERRy4
ii25i
2 S N ::gx
milg
EO=
9.x
co&W
ta=
0X

96 districts; for grade 8 in 2,211 districts; grade 9 in 22 districts; grade 10 in 6 districts; andgrade 11 in 15 districts. Relatively few students drop out of grades 7 and 8, so theseconditions would not limit the use of the adjusted dropout rate as much as the numbers imply.However, the difficulties are not evenly distributed across states: in Arizona, California,Illinois, Maine, New Jersey, and Vermont almost half of the school districts would not beable to use an adjusted dropout rate for every grade.
40

PART 4. 1991-92 Salm. YEAR DROPOUTS
Table 12 reports the number and unadjusted rates of dropouts for the 1991-92 schoolyear. Across the 14 states that treated October 1 returnees and summer dropouts in ageemetitwith the CCD standard, a total of 216,400 students dropped out of grades 9 through 12. Thehighest dropout rates across the high school grades were in Arizona (11.1%) and the Districtof Columbia (11.5%), while the lowest rates were in Massachusetts (3.2%) and Pennsylvania(3.7%).
Dropout rates varied by grade. The lowest rate was in grade 7 (less than 1 percent in8 of the 14 states), increasing somewhat in grade 8 (6 states with rates below 1 percent) andclimbing in grade 9 (the lowest state rate is 2.3 percent). In grade 10, some 10 states reportdropout rates of 5 percent or more. This was true for 11 states in grade 11 and 8 states ingrade 12.
Male &rad female dropouts. Among the 40 states reporting detail about dropouts, 56percent of the grade 9 through 12 dropouts were male and 44 percent were female (table 13).These proportions were similar across the states with Arkansas as an outlier with 68 percentof its dropouts being male.
Racial/elude group lutes. Table 13 displays the numbers of students in fiveracial/ethnic groups dropping out of grades 9 through 12 as a whole. Note that the ratesshown are the proportion of dropouts comprised by a single group, not the proportion of thatgroup who are dropouts. For example, 0.3 percent of Alabama's grade 9-12 dropouts wereAmerican Indians, 0.4 percent were Asian/Pacific Islanders, 61.2 percent were black, notHispanic, and so on. Within the 40 states providing detail, 1.8 percent of the grade 9-12dropouts were American Indians or Alaskan natives; 2.4 percent were Asians/PacificIslanders; 23.8 percent were black, not Hispanic; 21.2 percent were Hispanic; and 50.8percent were white, not Hispanic.
41t5 I

Tab
le 1
2. -
- N
umbe
rs 0
4 ct
opou
te a
nd u
nadj
uste
d dr
opou
t rat
es b
y gr
ado:
199
1-92
sch
ool y
ear
(14
stat
es r
epor
ting
stan
dard
dis
tric
t-lo
ve' d
ropo
ut d
ata)
Gra
de 7
Gra
de 8
Gra
de 9
Gra
de 1
0G
rade
11
Gra
ds 1
2O
racl
es 9
-12
Dro
pout
Rat
ioD
ropo
utR
atio
Dro
pout
Rat
ioD
ropo
utR
atio
Dro
pout
Rat
ioD
ropo
utR
atio
Dro
pout
Rat
io
Ariz
ona
1,02
00.
0321
1,61
40.
0340
8,01
10.
1005
4,56
40.
1037
4,15
50.
1080
4,85
40.
1353
18,5
840.
1105
Ark
ansa
s31
10.
0088
017
0.01
7789
70.
0264
1,30
80.
0411
1,51
60.
0513
1,20
80.
0458
4,98
90.
0406
Cal
iforn
ia4,
554
0.01
245,
550
0.01
5418
,714
0.04
1022
,007
0.05
8018
,534
0.03
5915
,637
0.05
8772
,892
0.05
27D
istr
ict o
f Col
umbi
a24
80.
0432
222
0.04
2340
50.
0949
733
0.12
7554
90.
1207
400
0.11
102,
177
0.11
52M
assa
chus
etts
110
0.00
1820
30.
0034
1,93
30.
0305
2,19
20.
0371
2,11
10.
0378
1,28
20.
0238
7,51
80.
0323
Mis
siss
ippi
689
0.01
6376
00.
0198
2,17
70.
0533
2,02
90.
0595
1,64
50.
0547
1,15
40.
0438
7,00
50.
0533
Mis
sour
i24
70.
0038
337
0.00
543,
562
0.05
204,
122
0.07
083,
794
0.07
002,
649
0.05
3514
,127
0.00
10N
ebra
ska
540.
0025
850.
0041
494
0.02
3373
10.
0375
823
0.04
2977
30.
0420
2,82
10.
0362
Nev
ada
----
----
601
0.03
8988
80.
0821
1,24
00.
0958
1,50
10.
1334
4,25
90.
0784
New
Mcs
dco
575
0.02
4884
00.
0288
1,76
10.
0715
1,84
50.
0837
1,53
30.
0704
1,09
40.
0850
0,23
30.
0753
Ore
gon
235
0.00
5029
90.
0079
1,44
50.
0371
1,03
10.
0533
2,31
30.
0692
2,55
00.
0841
8,24
00.
0593
Pen
nsyl
vani
a10
50.
0008
301
0.00
244,
391
0.03
224,
805
0.04
004,
731
0.04
183,
752
0.03
5017
,070
0.03
71R
hode
Isla
nd21
0.00
2043
0.00
4350
10.
0487
585
0.05
7544
10.
0508
309
0.03
751,
818
0.04
84T
exas
2,06
00.
0077
3,52
20.
0140
10,1
380.
0506
12,5
820.
0554
10,2
600.
0514
0,10
00.
0514
48,0
800.
0541
- -
Dat
a no
t ava
ilabl
e.
SO
UR
CE
U.S
. Dep
artm
ent o
f Edu
catio
n. N
atio
nal C
ente
r fo
r E
duca
tion
Sta
tistic
s, C
omm
on C
oro
of D
ata
J2

Table 13.- -Sox and racial/ethnic statue of combined grade 9-12 dropouts repotted es percent of alldropouts: 1991-92 school year (40 states reporting detailed district-level dropout data)
Grade 9-12 dropouts, percent who were:
Male
AmericanInclf.tn/ Black,
Alastsan Asian notFemale nave Pacific Hispanic Hispanic
White,not
Hispanic
Total 56.1 43.9 1.8 2.4 23.8 21.2 50.8
Alabama 56.7 43.3 0.9 0.4 61.2 0.3 97.8
Arizona 54.5 45.5 11.6 1.3 5.4 35.4 46.3
Arkansas 68.2 31.8 0.3 0.7 91.6 0.7 66.7California 54.6 45.4 1.0 7.1 13.7 50.7 27.4
Colorado 55.3 44.7 1.9 2.9 9.2 30.5 55.5
Connecticut 55.1 44.9 0.2 1.9 21.4 25.9 50.6
Delaware 57.7 42.3 0.3 1.6 40.3 5.5 52.3District of Columbia 51.3 48.7 0.1 1.5 91.4 5.7 1.3
Florida 58.9 41.1 0.2 0.9 33.1 16.6 49.2
Illinois 55.4 44.6 0.2 1.5 37.2 18.6 42.5
Indiana 56.0 44.0 0.2 0.2 18.1 2.8 80.7
Iowa 54.9 45.1 1.0 2.8 8.5 3.0 84.8
Kansas 56.0 44.0 1.8 1.7 12.8 9.1 74.6
Louisiana 54.1 45.9 0.8 1.6 58.9 1.5 37.3Maine 56.2 43.8 0.7 1.4 0.8 0.1 96.9
Maryland 57.2 42.8 0.2 1.4 55.8 2.4 40.2
Massachusetts 57.0 43.0 0.3 3.8 14.7 19.7 81.5
Minnesota 56.4 43.6 5.9 4.2 13.5 4.0 72.4
Mississippi 57.7 42.3 0.6 0.5 55.1 0.1 43.7
Missouri 55.7 44.3 0.2 0.8 24.3 0.8 73.9
Nebraska 54.8 45.2 3.9 2.0 9.9 7.4 76.9Nevada 52.8 47.2 2.7 3.6 11.1 18.3 64.3
New Jersey 55.4 44.6 0.5 2.5 31.1 25.1 40.8Now Mexico 53.8 46.2 12.1 0.9 2.7 50.5 33.8
North Carolina 57.7 42.3 3.2 0.5 36.1 0.8 69.3
North Dakota 39.4 40.6 35.1 1.0 0.3 1.8 61.9
Ohio 59.2 40.8 0.2 0.6 17.5 2.3 79.4
Oklahoma 53.3 46.7 12.0 0.8 10.4 4.2 72.9
Oregon 54.8 45.2 2.8 2.2 4.7 8.8 81.5
Pennsylvania 56.1 43.9 0.2 1.6 31.7 7.8 58.7
Rhode Island 60.6 39.4 0.1 2.7 9.7 15.4 72.1
South Carolina 60.2 39.8 0.3 0.1 46.8 0.4 52.4
South Dakota 53.6 46.4 45.1 0.3 0.9 1.1 52.6
Tennesseo 57.7 42.3 0.1 0.5 22.7 0.3 76.4
Texas 54.8 45.2 0.2 1.6 17.6 46.4 34.2
Utah 55.1 44.9 3.4 1.8 1.0 11.6 82.2
Virginia 58.9 41.1 0.4 2.5 33.9 4.3 58.9
West Virginia 56,2 43.8 0.1 0.1 3.4 0.1 e3.2
Wisconsin 59.3 40.7 2.1 1.3 32.9 7.3 56.4
Morning 55.3 44.7 7.3 0.5 1.5 12.3 78.4
SOURCE: U.S. Department of Education, National Connor for Education Statistics, Common Core of Data.
43
5 4

PART 5. RECOMMENDATIONS
The first year's dropout data are not completely comparable from state to state, butthey do provide an important statistic and they reflect the work of many states to support anationally uniform count. NCES will report data for those states that adhered to the CCDdefinition and reporting standards.
Steps Toward Future Collections
All but two or three states are expected to participate in the CCD dropout collectionby 1994-95. In anticipation of this, NCES will consider the following activities:
1. Establish a task force of states to determine how consistency can beachieved in reporting end-of-year and October 1 re-enrolling students(systemic biases). Particular attention should be paid to the role ofindividual student record systems, which can allow data to be recorded in avariety of ways while still producing reports consistent with the CCD. Theproblem of record systems that do not allow student information to becontinued across school years should also be examined.
2. Continue to work with states to achieve consistency in the year and gradeto which summer dropouts are attributed, how adult and secondaryeducation GED students are categorized, whether 12th grade completerswho do not graduate are dropouts, and how cut-off dates are implement: 1.These are considered "superficial" biases because their correction should notrequire systemic changes in a state's reporting system.
3. Poll states to determine the impact of counting students who move to adulteducation GED programs as transfers if the district tracks these students for theremainder of the school year, and reports those who drop out of the GED programin this time as dropouts.
4. Collect information from states that use individual record systems or havesome other means of providing detailed student information that canquantify the effects of the systemic and superficial biases described above.It may be possible to impute or statistically adjust nonstandard counts.
5. Report dropouts using an unadjusted rate. The differences between the adjustedand unadjusted rates do not outweigh the difficulties of the adjusted rate,particularly the problem of not being able to use it for all grades or for all districts.The unadjusted rate is simple to calculate and easy to explain.
Although this report has focused on differences among state reporting practices, anddifficulties in adopting the standard CCD definition, the accomplishments of this first yearshould not be overlooked. More than 9,000 school districts in 43 states put in place andreported a complex dropout statistic, one that enforced precise rules for determining whether a
J45

student was to be counted as a dropout and required tracking students across school districtsand school years. Almost all states anticipate that they will be reporting in agreement withthe standard definition by the 1994-95 school year. There is high likelihood that this valuablestatistic will be available to guide policy in the near future.

APPDIDIE A. DROPOUT TASK FORCE REPORT
47 57

RECOMMENDATIONS OF DROPOUT STATISTIC REVIEW TASK FORCE
Report to the National Forum on Education Statistics
July 26, 1993
48 58

Dr. Judy Burnes
Mr. Bob Burton
Dr. James Fulton
Dr. Lee Hoffman
Dr. John Jones
Mr. Robert Jones
Dr. Glynn Ligon
Dr. Robert Lockwood
Dr. Marilyn McMillen
Mr. Jeffrey Nel lhaus
Ms. Caryn Shoemaker
Dr. David Smith
Mr. Roger Stephan
Mr. Ed Strozyk
Dr. Kathy Tuck
National Foil= on Education StatisticsDropout Statistic Review Task Force, 1993
Colorado Department of Education Chair
National Center for Education Statistics
California Department of Education
National Center for Education Statistics
Missouri Department of Education
Oregon Department of Education
Evaluation Software Publishing, Inc.
Alabama Department of Education
National Center for Education Statistics
Massachusetts Department of Education
Arizona Department of Education
Nevada Department of Education
Alaska Department of Education
Washington Department of Education
District of Columbia Public Schools
49

Committee Charge
Review the NCES dropout formula and report to the Forum on this subject at the July26-28 meeting.
Background
At the January 1993 meeting of the National Forum on Education Statistics, CarynShoemaker of the Arizona Department of Education presented a paper raising variousconcerns about the dropout statistic proposed for use by NCES. In response, the Forumapproved a resolution calling upon the Steering Committee to establish a Task Force on thisissue which would report to the Forum at its July 26-28, 1993 meeting.
The Dropout Statistic Review Task Force was established with representatives fromten states, the District of Columbia, and NCES. Judy Burnes of Colorado served as chair forthe group. In addition, NCES contracted with Glynn Ligon of Evaluation Software Publishing,Inc. to conduct analyses and simulations of proposed solutions to the problems identified.
The Dropout Task Force met for the first time in Atlanta on April i::: 47, 1993. At thismeeting, issues and problems were discussed and a proposal developed to analyze threealternative definitions of dropouts (formula numerator) and six alto native definitions of themembership base (formula denominator). At its second meeting is Washington D.C. on June28-29, 1993, the Task Force reviewed the results of Dr. Ligon's work and developed thefollowing recommendations regarding the dropout statistic.
Recommendations
Numerator. The Task Force recommends that the following definition be used as thenumerator for the dropout formula.
A dropout is an individual who:
(1) (a) Was enrolled at the end of the previous school term, (e.g., 1990-91) or
(b) Was enrolled at any time during the current school term (e.g. 1991-92);
(2) Was not enrolled on October I of the following school term (e.g. October It 1992);
(3) Has nr t graduated from high school or completed a state or district-approvededucational program; and
(4) Does not meet any of the following exclusionary conditions:
(a) Transfer to another public school districts private school, or state- ordistrict-approved education program,
50Vii)
(b) Temporary absence due to suspension or school approved illness, or
(c) Death.
Both the current NCES definition and the proposed definition allow the current yeardropout count to be adjusted to exclude or delete students who returned and who are in schoolthe following October. The proposed definition differs from the current NCES definition inonly one respect: it allows the October adjustment for both students who drop out during thesummer preceding the current school year (summer dropouts) and for students who drop outduring the current school term (school year dropouts). In the original NCES definition, thefollowing October adjustment was allowed only for students who drop out during the currentschool year; it was not allowed for students who drop out during the summer preceding thecurrent school year. (This distinction was made by NUS in order to prevent the possibility ofa student missing an entire year and still not being called a dropout because he/she returnedthe following October.)
The major arguments in support of the Task Force proposal are:
The proposal allows for the retrieval of both summer and school year dropouts;i.e., it treats all dropouts the same way. Task Force members felt that this would
reduce data burden.
It continues the October adjustment process. (For states that have alreadyimplemented the NCES system, eliminating the adjustment process would result inincreased dropout rates which would create political problems in the state.)
It allows time for record transfer requests to clear before a student is declared a
dropout.
It does not call a student a dropout who has returned to school the following
October 1.
Denominator. The Task Force recommends that the following definition be used as
the denominator for the dropout formula.
NCES should base the COD dropout rate on the October 1, Fall 1 membershipcount for now; and should add to CCD the capacity to separate "no shows"(students who fail to enroll at the beginning of the current year term) fromregular term dropouts in order to include in the membership base those studentsexpected to enroll who failed to do go.
The proposed definition differs substantially from the current NCES definition in thatit makes no attempt to adjust for increasing and decreasing enrollment or migration. TheTask Force recommends that NCES add the capacity to separate summer and regUlar year
dropouts at the next redesign of the CCD.
51 6i
The major arguments in support of the Task Force proposal are:
The October 1 membership count is comparable. among states and contains aminimum amount of duplication between reporting entities.
The data for the membership base are already a part of the CCD system.
This count is easy to explain to the public.
None of the currently available alternatives adequately adjusts for the impact ofvarious types of mobility.
Impact of student movement on dropout rates
The Task Force spent a considerable amount of time discussing the impact of studentmovement on dropout rates. Three types of mobility were identified: (1) long-term increasingand decreasing enrollment; (2) children from migrant families, whose mobility is reasonablypredictable from year to year; and (3) other mobility, including that created by choiceprograms and the (largely urban) mobility or moving around that some referred to as"Brownian motion". The impact of this mobility is to inflate or deflate dropout rates in a waythat depends upon the specific characteristics of each particular situation. For example,dropout rates may be significantly inflated in high mobility situations where there are studentscounted (in the numerator) as dropouts who are not represented in membership (in thedenominator).
After examining several alternative methods for addressing mobility using existingdata, the Task Force finally decided that none of them was really adequate to deal with thisproblem. In attempting to adjust for one aspect of a situation, each alternative formulacreated problems for another situation. For example, some of the formulas attempt to dealwith mobility by adding the dropouts back into the denominator. While this approach mayhelp in some situations, it will also create distortion in other situations because some studentswill be counted more than once in the denominator. The Task Force also considered using acumulative enrollment count approach, which may provide the best method for dealing withmobility problems. However, for several states, this approach would impose a large increasein data burden. Therefore, this approach was not considered politically realistic at this time.
After considerable debate, the Task Force finally decided that no for .nula that relies onavailable data provides an adequate adjustment for mobility. Therefore, the Task Forcerecommendation is to use the fall membership count as the membership base for thedenominator.
Other Recommendations
1. Reporting 1991-92 Dropout Data. There was considerable confusion about the Octoberadjustment aspect of the NCES dropout definition during the 1991-92 reporting period.Therefore, the 1991-92 data will not be comparable by state.
The Task Force recommends that all published 1991-92 data be footnoted to indicatewhich states have provided data according to the definition.
2. Instructions.
The Task Force recommends that the Dropout Statistic Collector's Handbook be updatedto include a clear definition and examples of the dropout definition and clarification of themembership base to be used in calculating the dropout late.
3. The Future.
The Task Force recommends that, in the next CCD redesign, the inclusion of the dropoutstatistic be reconsidered in light of issues of accuracy, burden, ability to deal withmobility problems, and usefulness of the data.
The Task Force discussed whether the dropout statistic should be included in the CCD,particularly in light of the shift in standards-based education from grade-based systems toperformance-based systems, the increasing use of year-round schools, problems created byretention in grade, problems of obtaining out of state records requests, and the use of various
high school completion criteria and certificates/diplomas.
Response to Dropout Statistic Review Task Force Recommendations
In July, 1993 the Dropout Statistic Review Task Force presented a thoughtful set ofrecommendations about the CCD definition to the National Forum on Education Statistics.
This report was accepted and passed on to NCES. The preceding section illustrates thatCenter has acted on several of these, and is considering others.
Unadjusted rates. The Task Force recommended that NCES compute a dropout rateusing the October membership count of the dropout year as a denominator. The argument
was that a completely unadjusted rate would be easier to explain than the proposed
adjustment (the average of October membership counts over the dropout year and thereporting year, plus the dropouts), which could not compensate entirely for the effects of
student mobility.
NCES compared the rates for the first year's dropout data As the rates did not differsubstantially, only the unadjusted rate will be published in the future.
53 63

Two summess. The CCD dropout definition counts students who fail to enroll byOctober 1 as dropouts. This allows a student 365 days in which to drop out -- from October1 through the following September 30. The Dropout Statistic Review Task Forcerecommended that an additional summer be added to this 365 days, so that a student whodrops out during this first summer has until October of the following year -- operationally,366 days -- to return.
The change would equalize somewhat the opportunity to recapture summer versusregular year dropouts: in the current definition, those who drop out one day before October 1are just as much dropouts as those who drop out 360 days earlier. However, there are threeproblems in the proposed change. The first difficulty is concern that the dropout statisticwould be taken less seriously if a student were able to miss an entire year of school withoutbeing counted as a dropout; for example, completing the 1990-91 year and not re-enrollinguntil the fall of 1992. The second problem is that the current CCD dropout count is tied tothe membership count: both are conducted annually, and give a once-every-365-daysobservation. If the dropout determination took into account two summers, the reportingperiods for dropouts and students in membership would not be the same. Finally, it is likelythat tracking students over four reporting periods would be more difficult than following themacross three years, and could introduce additional reporting error.
Because of these problems, NCES will not change the dropout statistic's collectionyear, but will retain the October 1 -- September 30 year.
Separating summer dropouts. The Task Force recommended that NCES add to theCCD the capacity to report students who drop out during the school year separately fromthose who complete a year and fail to re-enroll in the next year. Thus it would be possible toadd these "no show" students to the membership for the year in which they were expected.
This change would ensure that students who complete a year of school but do notenroll again the following year were considered in the denominator for the year in which theyappeared as dropouts. However, separate summer and regular school year reporting are notan option under the existing CCD system, and would double the amount of informationdistricts are asked to report. More and more states are adopting individual student recordsystems from which statistical data can be abstracted for reporting purposes. NCESencourages the development of these individual record systems and the automation of staterecord keeping and reporting procedures. As such systems are established, it will be possibleto separate summer from regular year dropouts with little additional reporting burden on statesand school districts.
Footnoting 1991-92 difference& The Task Force recommended that NCES publishedreports footnote state differences in applying the dropout definition, particularly in thetreatment of October re-enrollments. NCES agrees that this is an important distinction, andreported only those states that followed the CCD standard in treating summer dropouts andend of year or next year returnees.
Instrudions. As recommended by the Task Force, NCES updated the instructionsincluded in the Dropout Statistic Collector's Handbook, soliciting comment from the CCD or
54 64

dropout coordinator in every state. These were made available to SEAs for distribution inMarch, 1994.
Beciewe decisions. The Task Force questioned whether the dropout statistic would berelevant in the future, as trends develop toward more year-round schools and standards-basedrather than grade-based systems. The Task Force also questioned whether problems such astracking out-of-state transcript requests, students who were retained in grade, and the varietyof high school completion credentials in different states would make the statistic moredifficult to collect than it is worth.
State participation in the dropout statistic does not suggest at this time that the statisticis of little value or too difficult to collect. However, the factors of usefulness, feasibility andburden will be considered in future approvals of the CCD.

APPENDIX B. DROPOUT REPORTING INTERVIEW QUESTIONS
57

State Date(s)Caller
State 1991-92 Dropout Statistic Telephone Interviews
Thank you for efforts to report dropout data on this year's CCD. It's a new and importantstatistic; we want to be sure we can document the uniformity of the count across states. Thisphone call is to confirm the data you reported, and the procedures that were used to defineand report dropouts.
Do you want to refer me to someone else in your agency for dropout reportinginformation?
name phone
I have seven general questions about how your state decided which students would bereported as dropouts. In some cases I will ask you to confirm information you gave earlier,so please be patient.
1) Your 1992-93 CCD agency survey did not report:
Is there a law or policy prohibiting you from reporting this detail?
Y N Why missing?
2) Do you use the same definition and procedures for the CCD dropout report as you do foryour state reports?
Y N (Differences; drop > how many days?)
3) How did you report summer dropouts, that is, students who completed the 1990-91 schoolyear but did not show up for school at the beginning of the 1991-92 school year?
i. Are these students counted as dropouts from the year they completed (1990-91) orthe year for _Y _N which they did not return (1991-92?)
58 6/

ii. Are these students counted as dropouts from the grade they completed in 1990-91or the grade Y N for which they did not return in 1991-92?
iii. What was the actual cut-off date used to determine that a student who did notreturn to school in the fall was a dropout? That is, a "no show" was a dropout if he or shewas not enrolled by:
(date).
iv. On the last point, was a dropout's status changed if you determined that he or shehad actually Y N enrolled shortly thereafter, say, two weeks after the cut-off date?
4) On the subject of students who dropped out during the regular school year:
i. How did you classify students who dropped out during 1991-92 but re-enrolledbefore the end of that school year?Dropout
Continuing
ii. In your report for the 1991-92,school year, how did you classify students whodropped out and did not return by the end of the 1991-92 school year but did re-enroll at thebeginning of the next school year?
Dropout 1991-92
Continuing
5) The CCD set October 1, 1992 as the cut-off date for deciding whether a student who hadbeen enrolled in 1991-92 was a dropout.
i. Did you use October 1, or some other date (specify), as a cut-off date?Oct 1
Other Date
ii. If you did use a cut-off date, did you literally freeze your records on that day, orcontinue to accept corrections? For example, how would you have reported a studentwho was missing with no further information on (cut-off date) if you got a transcriptrequest a month later that showed he had enrolled in another district at the beginningof the school year?
Freeze
Other:
59 6 6
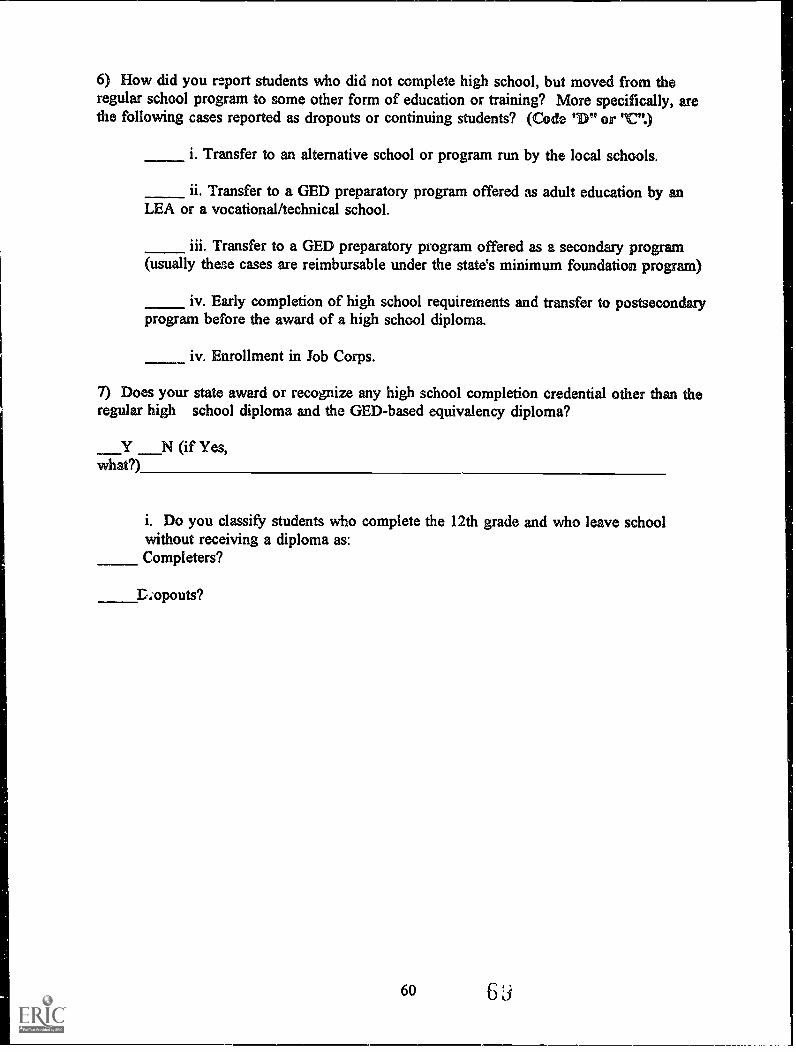
6) How did you report students who did not complete high school, but moved from theregular school program to some other form of education or training? More specifically, arethe following cases reported as dropouts or continuing students? (Code 'D" or Vt)
i. Transfer to an alternative school or program run by the local schools.
ii. Transfer to a GED preparatory program offered as adult education by anLEA or a vocational /technical school.
iii. Transfer to a GED preparatory program offered as a secondary program(usually these cases are reimbursable under the state's minimum foundation program)
iv. Early completion of high school requirements and transfer to postsecondaryprogram before the award of a high school diploma.
iv. Enrollment in Job Corps.
7) Does your state award or recognize any high school completion credential other than theregular high school diploma and the GED-based equivalency diploma?
Y N (if Yes,what?)
i. Do you classify students who complete the 12th grade and who leave schoolwithout receiving a diploma as:Completers?
D.opouts?
60 6

APPENDDC C. 111MMINICAL NOTE ON IRATE ESTIMATES AND DETAILED TABLES
61

Calculating Rates, and Estimating Effects of limpropoily ReportedSummer Dropouts and Students Re-onelling October 1
Calculating Adjusted Dropout Rates
The adjusted rate was calculated for each grade by averaging membership across twoyears and adding the dropouts to this average. The denominator of the adjusted rate was:
[Y1G1 membership + Y2G2 membership/2] + Y1G1 dropouts
where Y1 is the year of interest, G1 is the grade of interest, and Y2 and G2 are thesubsequent year and grade.
Summer Dropouts
Summer dropouts, students who completed one school year but did not re-enroll forthe subsequent year, were supposed to be counted as dropouts for the year and grade forwhich they failed to enroll. A number of states counted these students as dropouts from theyear and grade they had completed.
Misallocating summer dropouts who had been promoted to the next grade could biasgrade-level dropout rates. (Dropouts who were not promoted would not bias grade rates, butwould affect annual rates to the extent that these changed from one year to the next.) The1989 dropout field test had reported the number of students dropping out during the schoolyear and over the summer. Although this field test did not use a representative sample ofschool district, the proportions of summer dropouts reported in that study were consideredadequate to generate estimates of the bias in accounting summer dropouts to the wrong grade.The estimates presented here do not include ungraded students in the membership counts(denominators) for the rates.
Table C-1 computes dropout estimates for misallocating summer dropouts, using datafrom the 14 states that reported dropouts correctly. Thus the "0 Percent" column representsthe true dropout rate. The dropout rate for a grade was estimated by assuming that summerdropouts for a grade were attributed to the prior grade. Regular year dropouts were attributedto the grade reported. For example, the "100 Percent" rate for grade 7 is based on 54 percentof the reported grade 7 dropouts (the estimated proportion of dropouts who had left during theregular school year) and 41 percent of the dropouts for grade 8 (the estimated proportion ofgrade 8 dropouts who had failed to re-enroll after completing grade 7 in the previous year).This procedures backs the grade 8 summer dropouts into grade 7; and allocates the grade 7summer dropouts to grade 6 (with the result that they do not appear in the calculations). Thedenominator for the grade 7 rate is the grade 7 membership.
62

Table C-1.-Estimated rates with 0, 50, and 100 percent of summer dropouts accounted to prior grade
Rates, summer to prior grade:
Grade DropoutsProportion
School Year Membership 0% 50% 100%
7 10,938 0.54 1,021,570 1.1 1.1 1.1
8 14,201 0.59 971,087 1.5 1.7 2.1
9 56,121 0.79 1,169,217 4.8 4.6 4.5
10 60,305 0.87 1,033,006 5.8 5.8 5.7
11 53,654 0.89 925,569 5.8 6.1 6.3
12 46,324 0.78 908,138 5.1 4.5 4.0
October 1 Returners
Students who were enrolled on October 1 were not to be counted as dropoutsregardless of their status during the prior school year. Some states did not follow thisreporting practice, but instead counted as dropouts those regular school year dropouts who re-enrolled by October 1 of the next year. Anecdotal reports from SEA personnel working withdropout statistics suggested that up to 25 percent of dropouts may re-enroll at the beginningof the next school year. This proportion was applied to the proportions of regular yeardropouts shown in table C-1 in estimating the bias introduced when October 1 returners arecounted as dropouts. For example, the inflated grade 7 rate increases 54 percent of grade 7dropouts by 4/3 (those who dropped out during the regular year) and adds them to the 46percent assumed to be summer dropouts. The analysis used data from the 14 states reportingacceptably. Table C-2 shows the results.
Table C-2.--Dropout rates with 0 and 25 percent of dropouts estimated to be incorrectly reportedOctober 1 returners
Rates, returners reported incorrectly
Grade Dropouts Membership 0% 25%
7 10,938 1,021,570 1.1 1.3
8 14,201 971,087 1.5 1.8
9 56,121 1,169,217 4.8 6.0
10 60,305 1,033,006 5.8 7.5
11 53,654 925,569 5.8 7.5
12 46,324 908,138 5.1 6.4

Detail Tables on Dropout Counts and Rates
Table C-3 shows the number of students in membership and dropping out in 1991-92for each of grades 7 through 12, by state. Because of the variation in how states applied theCCD definition, dropout rates should not be compared between the 14 standard states andother states; or among the 29 nonstandard states.
Table C-4 shows the adjusted and unadjusted rates by 1991-92 membership size foreach state. This is the source of table 9, discussed in the text of the report.
64

Tab
le C
3.-
-Mam
ba/M
t, an
d nu
mbe
rs e
nd u
nadi
tate
d ra
tio*
of d
ropo
uts
by g
rade
: 101
-92
coh
ool y
ear
(43
stat
ea r
epor
ting
dIst
rid-le
val d
ropo
ut d
ata)
Gra
de 7
Mam
ba-
s*O
f0P
011
Gra
de a
Mon
tt:-
Rs/
tosh
ipD
ropo
ut
Gra
de 9
Mom
bor-
Rat
ioeh
IpM
oped
Ala
bam
aA
rtto
nsA
rkan
sas
Ca
Mor
itaC
olor
ado
Con
nact
but
DO
WN
=D
i arid
of C
olum
baF
lorid
aId
aho
Min
ot!
Indi
ans
10W
e
Kan
sas
Loui
sian
a
Mai
neM
aiyi
and
Maa
sach
ueet
tsM
kahl
gan
Min
neso
ta
Mis
siss
ippi
Mite
oud
Neb
rask
aN
evad
aN
eW J
enny
New
Max
imN
orth
Car
oitto
Nor
th D
akot
aO
hio
Old
ahom
a
Ore
gon
Pon
toyl
vant
aR
hoda
blo
ndS
outh
Car
dha
Sou
th D
akot
a
Tco
nnas
ece
Tom
oU
tah
Ven
nort
Virg
irda
Wed
Virg
inia
Witc
orai
n'M
orni
ng
00,7
0544
70.
0074
58,4
5488
40.
0157
50,7
721,
822
0.03
2147
,448
1,61
40.
0340
38,0
4831
10.
0080
34,7
6001
70.
0177
375,
055
4,05
40.
0124
360,
338
5650
0.01
6444
,981
118
0.00
2842
,481
184
0.00
43
35.0
5131
00.
1206
833
,444
340
0.01
02ai
m10
0.00
127,
523
200.
0039
6,70
024
80.
0432
6,24
922
20.
0423
144,
301
184
0.00
1313
4,01
473
80.
0055
18,5
71-,
--17
.625
--14
0,73
449
70.
0335
132.
146
831
0.00
6376
,577
128
0.00
1e74
,381
345
0.00
4837
,502
130.
0003
3016
438
0.00
1033
,700
580.
0017
32.2
8471
0.00
2264
,188
1,07
50.
0107
66,7
441,
364
0.02
40
16,2
900
0.00
0415
,882
160.
0010
65,3
1135
70.
0065
61,4
1252
90.
0103
151,
1155
110
0.00
1859
,580
203
0.00
3412
0,56
0--
--11
7,15
5--
--50
,700
295
0.00
5840
,573
373
0.00
77
42,1
8368
90.
0163
38,6
6370
80.
0198
65.4
4324
70.
0038
02,3
2633
70.
0054
21,2
8454
0.00
2520
,401
850.
0041
18,0
20--
--15
,237
--83
,140
370
0.00
4570
,256
377
0.00
48
23.2
2157
50.
0248
22,3
8064
00.
0250
84,4
0334
00.
0040
81,5
8124
30.
0118
0,26
03
0.00
030,
070
120.
0013
140,
042
887
0.00
6313
1,03
31,
100
0.00
8444
.521
352
0.00
7942
,912
407
0.01
00
39,3
1223
50.
0030
37,2
5322
00.
0079
128,
840
105
0000
012
3,34
730
10.
0024
10,6
1021
0.00
2010
,033
430.
0043
61,3
2810
70.
0021
47,2
0527
00.
0057
0,96
540
0.00
409,
521
440.
000
06,6
8367
00.
0102
62,0
6479
20.
0128
268,
602
2,00
00.
0077
251,
003
3,52
20.
0140
37,4
1745
0.00
1233
,822
040.
0025
4,05
110
0.00
324,
630
210.
0045
77,5
2740
10.
0052
78,9
0863
00.
0108
20,1
3702
0.00
2420
,308
217
0.00
02
00.7
5551
0.00
0860
,038
430,
0057
8,05
511
0.00
147,
457
240.
0032
61,6
244,
061
49,8
595,
011
33,9
2589
740
7,22
118
,714
44,4
881,
022
35,7
031,
770
8,09
236
06,
218
495
151,
373
6,95
817
,940
1,24
8
145.
287
6,20
000
,358
3,64
1537
,531
890
34,0
741,
189
64,7
072,
604
15,0
8435
1
57,0
143,
680
63,3
351,
933
128,
231
8,41
040
,781
1,30
7
40,8
7987
,304
21,2
3015
,451
85,3
45
2,17
73,
502
404
001
2,84
8
24,6
211,
781
90,4
275,
672
9,09
302
144,
003
4,98
244
,091
1,65
1
38,9
481,
446
138,
202
-:,3
9110
,728
501
54,7
981,
032
9,24
737
1
70,6
8723
4,94
435
,727
0,62
479
,047
27,2
8363
,740
7,44
8
3,41
716
,135
210
216
3,95
5
793
1,20
025
7
- -D
ata
not a
valta
blo.
SO
UR
CE
: US
. Dep
artm
art o
f Edu
catio
n, N
atio
nal G
arte
r fo
r E
duca
tion
Sta
tictIc
a, C
omm
on C
ora
of D
ela.
Gra
de 1
0G
rada
11
Gra
ds 1
2
Rat
ioM
arni
arr-
strip
Dro
pout
Rat
ioM
embe
r -
all
Dro
pout
Rat
ioM
embe
r -
Mt)
Dro
pod
Raf
io
Gra
des
0-12
Mar
nber
-
0.08
500.
1005
0.02
840.
0410
0.04
32
0.04
900.
0445
0.09
490.
0303
0.08
95
0.04
330.
0454
0.02
400.
0349
0.04
48
0.02
330.
0645
0.03
050.
0658
0.02
03
0.05
3320
529
0.02
330.
0389
0.03
34
0.07
160.
0027
0.00
900.
0344
0.03
74
0.03
710.
0322
0.04
370.
0353
0.04
01
0.04
040.
0568
0.00
600.
0325
0.04
97
0.02
010.
0188
0.03
45
49,7
2744
,023
31,7
9337
9,18
240
,706
32,2
327,
372
6,73
113
4,55
210
,099
133,
012
69,8
0934
,808
30,5
8852
,651
13,0
6747
,734
50,0
4510
9,78
647
,080
34,1
2458
.404
19,4
8114
,290
77,7
14
22,0
3577
,498
8,60
112
4,04
940
,057
30,2
6112
0,11
89,
831
43,8
530,
320
80,2
2022
7,24
033
,855
0,08
270
,729
24,7
2350
253
7,24
b
3,38
04,
504
1,30
822
,007
2,62
2
1,03
131
873
30.
723
1,79
2
8,46
73.
363
1,11
81.
508
2,39
4
438
2.65
42,
192
5,78
42,
361
2,82
04,
122
731
888
2,40
1
1,64
54,
850
179
4,91
11,
918
1,93
14,
005
565
1,56
343
6
3,65
112
,582 07
523
03,
301
1,10
41,
248
438
0.06
770.
1037
0.04
110.
0580
0.00
92
0.05
060.
0429
0.12
750.
0505
0.10
73
0.06
370.
0483
0.03
210.
0493
0.04
55
0.03
130.
0558
0.03
710.
0527
0.04
95
0.05
250.
0700
0.03
760.
0621
0.03
09
0.08
370.
0627
0.02
110.
0393
0.04
78
0.06
330.
0400
0.05
750.
0358
0.04
88
0.06
000.
0554
0.01
990.
0301
0.04
75
0.04
470.
0214
0.06
02
4023
82,
922
38,4
734,
156
22,5
501,
518
331,
650
18,5
3438
,285
3.24
3
00,4
201,
454
6,23
724
04,
333
540
1107
105,
101
15,1
721,
678
120,
055
8,02
165
.383
3,39
834
,088
1,45
320
,265
1,62
445
,007
2,22
1
13,4
2940
243
,548
2,08
856
,002
2.11
110
1,76
96,
620
48,0
352,
680
30,0
621,
845
54,1
793,
794
19.1
6382
313
,043
1,24
973
,935
2,43
5
19,3
001,
633
69,9
853,
491
8,20
518
711
8,21
25,
181
36,4
001,
802
33,4
522,
313
113,
094
4,73
18,
706
441
37,2
1306
08,
762
430
54,5
703,
251
109,
538
10,2
0030
,494
999
5,70
433
584
,199
2,69
8
23,4
431,
031
67,0
721,
027
6,78
044
2
0.08
320.
1080
0.05
130.
0559
0.00
47
0.04
780.
0398
0.12
070.
0445
0110
8
0.06
680.
0520
0.04
280.
0532
0.04
93
0.03
440.
0478
0.03
780.
0543
0.05
80
0.06
470.
0700
0.04
290.
0058
0.03
29
0,07
040.
0499
0.02
280.
0438
0.04
68
0.08
020.
0418
0.05
000.
0263
0.04
01
0.05
000.
0514
0.03
280.
0581
0.04
20
0.04
400.
0285
0.00
51
42,3
181,
701
35,8
724,
854
27,7
141,
268
285,
314
15,8
3733
,214
2.11
1
28,6
391.
078
5,05
018
1
3,60
240
009
,872
4,08
714
,348
1,64
2
109,
100
0203
01,0
262,
513
32,3
801,
281
20.0
331,
390
39,4
201,
433
13,0
2841
441
,348
2,19
353
,964
1.28
293
,305
3,33
344
,032
2,76
5
20,4
801,
154
42.5
272.
849
18,0
2377
311
,232
1,50
170
,982
1.92
3
10,8
201,
004
04,0
741,
889
7,87
918
2
112,
024
6,03
335
,878
1,20
2
30,3
102,
650
107,
206
3,76
28,
231
5013
34,8
2267
38,
827
310
49,0
713.
170
177,
194
9,10
020
169
1,26
06,
577
272
62,9
902.
312
22,0
7971
753
,909
2.90
66,
381
3340.
0402
0.13
530.
0453
0.05
870.
0636
0.03
760.
0304
0.11
100.
0407
0.10
75
0.05
780.
0412
0.03
390.
0534
0.03
64
0.03
180.
0530
0.02
300.03e7
0.00
25
0.04
380.
0535
0.04
200.
1334
0.02
71
0.08
500.
0295
0.02
310.
0520
0.03
37
0.08
410.
2350
0.03
760.
0165
0.03
50
0.06
300.
0514
0.04
480.
0488
0.03
07
0.03
250.
0539
0.05
23
is/to
Dro
pout
100,
907
12,0
5311
38,2
2718
,584
123,
012
4,98
01,
384,
347
72,8
9216
6,78
310
,098
127,
024
5,93
127
,531
1,10
518
,904
2,17
750
2,50
722
,007
64,1
578,
238
507,
514
29,0
7127
8,44
812
,922
138,
813
4,73
111
8,94
06,
009
201,
705
8,93
2
65,5
091,
665
160,
744
10,0
1323
2,43
07,
518
433,
081
23,0
5018
7,54
70,
092
131,
535
7,00
522
9,41
414
,127
77,9
002,
821
64,0
384,
239
307,
970
0,60
7
82,7
780,
233
301,
964
15,9
0833
,070
830
600,
218
20,2
0715
5,31
60,
431
138,
045
8,24
347
8,78
017
,679
37,4
031,
016
170,
506
5,04
335
,946
1,54
7
235,
437
13,4
0588
8,92
546
,080
120,
276
3,14
824
,047
1,00
027
7,56
512
,320
07,5
083,
645
232,
079
0,93
127
,063
1,46
9
Rel
lo
0.08
030.
1105
0.04
080.
0527
0.00
44
0.04
870.
0309
0.11
520.
0438
0.00
75
0.05
730.
0407
0.03
410.
0472
0.04
43
0.03
000.
0559
0.03
230.0632
0.04
85
0.05
330.
0818
0.03
820.
0784
0.03
12
0.07
530.
0527
0.01
870.
0410
0.04
14
0.05
930.
0371
0.04
840.
0200
0.04
30
0.05
7300
541
0.0245
0.04
410.
0444
0.03
740.
0300
0.05
27
BE
ST
CO
PY
AV
AIL
AB
LE
7

P
I
t
4
gifq 5 -t
6 1 MI
ill
000 00000 111
99
00000 00 00 00000 SP1
999 99999 99999 99999 9999 it Mg/ lliEl
g, Ii IMMO! TI--s gAlt 1-gs.
00 : I
g I
2 I
11 111
1
8 000 000 0
SI S1,it at! it
ilPPP 9 PPP PPP P
I
1 111 I glill i
009 99999 E1212 8 4
PPP 99900
8o 00A u+00A-.
000 00000
000°0 1112i
iiii; $i ii;
fir WV 11111
0 PPP Vig§8
000 Pkg8E ivzgest
81111
00000 zWak2
. 444
00000
i4-8i
00000
00000 42884 4440
0000 00
0000 18288 18O48
"
00 12. wI
0 tif 00 0 0 0.
1 8 8 1 1 1
O gp O 0 I
;7*1
;I I
11 1 I
I
00000
C) 0 0 CI 0 Olgli
0 0 0 0 $, Igth
1
lEsisEe sogEs Egslt Agel a-J.0 SOiltel
00000 00000 11111 It111 ili:1 11111 12:t1 ail 0 00 . 000 0 0 00 0. 000po
II lifil Mil
2g.mg gwgss tgg.s aves4 6sleps
00000 00000 00000 IZI ill!! 1!11/
000 ppopp 00000 00000 00000 Igl 12i2§ MI§ 11111
HA [FAH
00000 00000 00 00 00000 Mil 1119 11111 11111
ZoMiS 4.4808 aRosz So=88 tgnio b828i as-.12 %Eass
I1111 Elli! MEI 1!121 11in N1111 ail liE
000 99900 99999 09099 99999 00000 00000 "I

Ipni 4gIrtol'qt/c1 MN MN Mil iggli
041.-N0
11
001,01 0620.0 .Yrr-I4 .-040. doco:a 04144. 24010 .00teidei.i lid d.-: oati ddrzsig gd. 4 cdr.addy: gr:s4 6P:a
.-
iN
0
I 1,1i
00,4qN01 101.1 K.-000 aOtIO 00.-- I-00e r.rdo -g-10 ...
d"oe5g, l.v 0...6 gd, adtd 4gdgd gt i dgw
a ga g i .:
4.0r..0 ocaocil 00401,0 0.,01C4ino.drZa ,-.:,zdi :del.:.z .:.614 LA:"2: 2:-:: =1;2 4:5.1:!12 ;:l:
1101
.,.-01d.:6 . 2:;21 N01.-00dd .d ::7g2ifA :"") CAW- 22;2 ;Nig ;;:.,dd ad
1111Uni citootqttgd4t ar"MIA iiii
i Witi ini; MN nal; inNOOOP. *0001 ttOW.'''' e:):::Pg 0ggC742 ggeag :222- 2;21: ;2:dgdgg ddddi .-.:...Z
y- . .
a danan 00mr-1 cismodr. .0014! 1,07.-VNg?: gidtz-ti ;107.1tel qq- am; nt!
41g..-4.4 tgiggi 14.z.scsat
,..
0 0000,1d.d 4 "22:2: :!2;4'n :2.12; 212: 2,12 ;:.1
1111:1 :;:!: :;1 ;2:c.I° 2°,212 =In ;APO; 2202i 0 2:
41rain " 0"41 aanig ariglaig *gm gg.g
NWV0V Om-010 or.0.0 oaod410 Oddr:1 dad?..: oSd I dd d4d.z d-
fro n0.0a a100.-1 00wf .-c4014 coc- i4 n2; :i2g gd"g
0 ni"; 2g- 1
:!!!!_17:1 trgnc z::gic°4 2:122: :6.1°42 ;::
11111
000.0ddd00000 010010 *OVIDt. ;(010;;; 00P.10 01080
ddddi ddd.:d o ddriad "ol dr4 ddid dad
me urge) Win ran MA Wag n;liOilqq 0001a ol a .7IrogX 27SZ;!1 241: 2:ni :Pi: 2::
0141100)10010 Oorol Nsolg orsnolt, 0000 vov
pllgg d ggeog g.zgd go$d 51.zig 4p:-1
!),:1 gging ggrgg ge"j1g0104 0 Pt 0!
a-0
00000 egi 00-0. 0n.707 000.0 dam 010 do^dddd. dddid d adddg ;g id
ro
alvd"-0a4a4V g.-4c"-:4" 1 sPgc"aa" ; g"gGIi" t 4."a410 -10(611 I"iStIIg $4gag t q a " q"tgg
100.0.1rt
1
ag-:sq t1:4;Eil :nr0.1 oggil; $g:.1
Pli.q".al condo r.odq ,,11:941; 000000-0
glgtg, -85 W-6 g gN
y000.4. 00.01 01.00a ofqdly 00040 deloow 00aoo 00010dddd.z .dad i 0414 ddd dd
ro
decidda di di ddaaNW000 .-1001
111H /Ili 31 11111 Iligi a al i 11
2 8
CV al Ca 1 f 0 0 Ca 0 P. i CV 04 0 0 0 Ca V a 0 1 yr c) 0
odic dd4ad 4 gad 4d dg ddt:id .d

Table C6.- -Sox of dropouts reported as percont of all dropouts, by grads: 1991-92 school year (43 stake reporting district -loyal dropout data)
Grade 9 Grads 10 Grads 11 Grads 12 Graders 9-12Male Female
dropouts dropoutsMale Female
dropouts dropoutsMale Female
dropouts dropoutsMale Female
dropouts dropoutsMalo
dropouteFemaledropouts
Alabama 59.9 40.1 56.5 43.5 54.4 45.8 53.6 46.4 56.7 43.3Arizona 53.1 46.9 83.7 48.3 54.7 45.3 56.3 43.7 54.5 45.5
Arkansas 72.2 27.8 87.4 32.0 68.4 33.6 88.5 31.5 68.2 31.8
California 52.4 47.8 63.9 46.1 55.3 44.7 56.8 43.2 54.8 45.4Coloarado 52.5 47.5 55 45 58.2 43.8 56.8 43.2 55.3 44.7
Connecticut 53.8 40.2 54.7 45.3 54 48 59.4 40.6 65.1 44.0Delaware 81.2 38.8 67.8 42.4 53.7 43.3 51.8 48.4 57.7 42.3District of Columbia 51.3 48.7 51 49 66.2 44.8 48.3 53.8 51.3 48.7Florida 63.1 30.9 59.8 40.2 58.4 43.6 54.8 45.4 58.9 41.1
Who -- -- -- -- -- -- --Illinois 55.7 44.3 es 45 54.8 45.4 56.7 43.3 55.4 44.8Indana 59.8 40.2 57.1 42.9 53 47 53.2 46.8 se 44
Iowa 53.8 46.4 53 47 58.9 43.1 66 45 54.9 45.1
Kansas 57.7 42.3 58.6 43.4 53.9 48.1 50.2 43.8 56 44Louisiana 55.3 44.7 54 46 63.8 48.2 52.6 47.5 54.1 45.9
Maine 52.1 47.9 00.5 39.5 55 45 58.5 43.5 58.2 43.8
Maryland 59.8 40.2 59.6 40.4 56.2 43.8 50.7 49.3. 57.2 42.8Massachusetts 57.9 42.1 57.0 42.1 55 45 57.4 42.8 67 43
Michigan -- -- -- -- -- -- -- - -Minnesota 53.4 46.8 57.5 42.5 55.3 44.7 57.8 42.2 66.4 43.6
Missizsippl 60.8 39.2 58.8 43.2 55.3 44.7 58.8 43.2 57.7 42.3
Missouri 59.2 40.8 57.4 42.8 52.7 47.3 62.8 47.2 55.7 44.3Nebraska 60.5 39.5 53.4 48.6 50.8 49.2 56.7 43.3 54.8 45.2Novach 52.4 47.8 51 49 51.3 48.7 85.2 44.8 52.8 47.2New Jersey 64.5 45.5 55.6 44.4 54.5 45.5 67.7 42.3 55.4 44.8
New Meorkx) 53.5 46.5 63.4 48.8 84.1 45.9 54.5 45.5 53.8 46.2North Carolina 62 38 56.3 43.7 54 48 55.3 44.7 57.7 42.3
North Dakota 58.5 41.6 83.7 36.3 57.2 42.8 57.7 42.3 50.4 40.8Ohio 60.4 39.8 60.5 39.5 59.7 40.3 56.9 43.1 59.2 40.8Oklahoma 54 40 54.4 45.6 52 48 52.5 47.5 53.3 48.7
Oregon 48.8 51.2 53.5 48.5 64.9 45.1 59 41 54.8 45.2
Pennsylvmla 556 44.4 57.3 42.7 56 44 55.5 44.5 56.1 43.9Rhoda Island 63.5 36.5 61.1 38.9 52.1 37.9 53.1 40.9 80.6 39.4South Carolina 83.1 36.9 60.8 30.2 55.7 44.3 56.4 43.6 60.2 39.8South Dakota 50.0 49.1 53.9 4e.1 52.3 47.7 58.1 41.9 53.6 48.4
Tarmac:ace 81.4 38.6 68.4 41.6 55.4 43.6 54.1 45.9 57.7 42.3
Texas 58.5 43.5 55.8 44.2 53 47 52.5 47.5 54.8 45.2Utah 51.9 48.1 50.8 49.2 55.5 44.8 57.8 42.2 55.1 44.9Vermont -- -- - - -- --Virginia 01.1 38.9 58.9 41.1 59.1 40.9 55 45 58.9 41.1
Wost Virginia 82 38 56.3 43.7 54.3 45.7 52.3 47.7 56.2 43.8Wisconsin 57 43 60.8 39.2 58.2 41.8 60.2 39.8 59.3 40.7
Wyoming 49.8 50.2 58.5 41.5 54.1 45.9 56.9 43.1 55.3 44.7
--Data not available.
SOURCE: U.S. Deportment of Education, National Conte for Education Statistics, Common Coro of Data.
68
BEST COPY AVAILABLE

9
SBN 0-16-045544 8
780160
9 0 00 0
15445
S I

United SlatesDepartment of Education
Washington, DC 20208-5651
Official BusinessPenalty for Private Use, $300
:57;25 NCES-r4.5-690MICHAEL hTSF.NBERG
MECTOR, ERIC CLEARINGHfluSi.ON CRMA ', TFCHNOLOC,f
ACUSE UNIVERSIFy/4-206 CENTER FOR SCIENCE & -11-ECHRACUR NY 1321R-4100
BEST COPY AVAILABLE82
Postage and Fees PaidU.S. Department of Education
Permit No. G-17
Third Class