6th oxford summer school on neutron scattering (2011).pdf · 12th oxford summer school on ... n v...
TRANSCRIPT
0
Univerisity of Oxford, St. Anne’s College
Answer Book A) Single Crystal Diffraction 1 B) Coherent and Incoherent Scattering 5 C) Time-of-flight Powder Diffraction 8 D) Magnetic Scattering 13 E) Incoherent Inelastic Scattering 18 F) Coherent Inelastic Scattering 21 G) Disordered Materials Scattering 24 H) Polarized Neutrons 30 I) High Resolution Spectroscopy 36 The school is supported by:
12th Oxford Summer School on Neutron Scattering
http://www.oxfordneutronschool.org
2011
5th – 16th September 2011
1
A. Single-Crystal Diffraction
A1.
(i) From the relation h mnvn we get
(Å)=3.956/vn (km/sec).
Putting vn =2.20 km/sec gives =1.798 Å.
(ii) Similarly from E 1
2mnvn
2 we obtain E= 25.30 meV.
(iii) The X-ray energy is given by:
EX h hc
with the frequency of the X-rays and c the velocity of light.
Putting c 2.998x10⁸m / sec and 1.8x10
10m gives
E 6.88 kV
(iv) The velocity of a neutron with this energy is
vn 2E
mn
1 2
,
i.e. vn = 1148km/sec
We see then that thermal neutrons have both wavelengths suitable for
studying atomic structures in the 1-100Å range and energies suitable for
studying excitations (such as phonons or magnons) in the meV-eV range.
(Fast neutrons have too short a wavelength and are too energetic for
either purpose.)
A2
(i). The wavelength of the reflected beam is
2d111 sin
2
where d111 a0
3 2.85Å . Thus sin 1.8 5.7 and the scattering
angle is
2 36.7 º .
(ii). The wavelength spread is derived by differentiating Bragg's equation:
cot. .
Putting 0.2 gives
0.0105 , so that for 1.8 Å we
get
0.019Å
Note that this spread of wavelengths is much larger than the natural width
of characteristic X-ray lines, and so Bragg peaks obtained with neutrons
will not be as sharp as X-ray peaks.
3
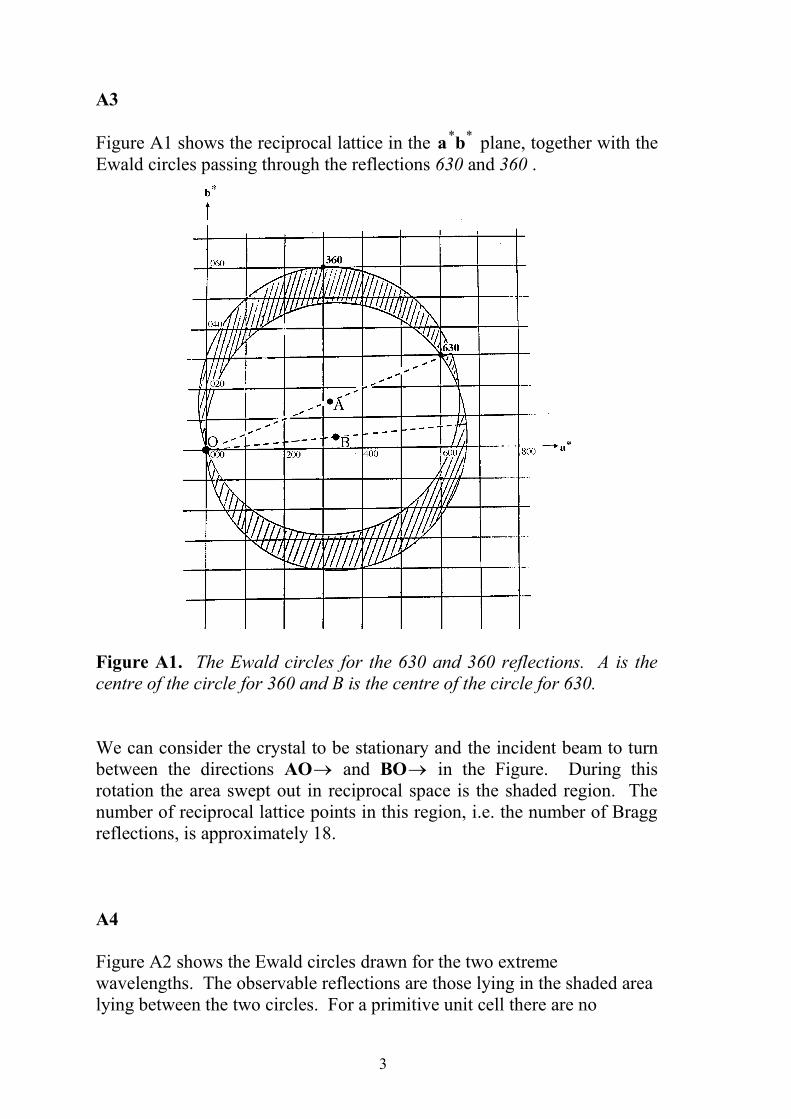
A3
Figure A1 shows the reciprocal lattice in the a*b
* plane, together with the
Ewald circles passing through the reflections 630 and 360 .
Figure A1. The Ewald circles for the 630 and 360 reflections. A is the
centre of the circle for 360 and B is the centre of the circle for 630.
We can consider the crystal to be stationary and the incident beam to turn
between the directions AO and BO in the Figure. During this
rotation the area swept out in reciprocal space is the shaded region. The
number of reciprocal lattice points in this region, i.e. the number of Bragg
reflections, is approximately 18.
A4
Figure A2 shows the Ewald circles drawn for the two extreme
wavelengths. The observable reflections are those lying in the shaded area
lying between the two circles. For a primitive unit cell there are no

4
systematically absent reflections, and so the number of possible reflections
is about sixty.
Figure A2. The Ewald construction showing the reflection circles for the
minimum wavelength (maximum radius) and the maximum wavelength
(minimum radius).
5
B. Coherence and Incoherence
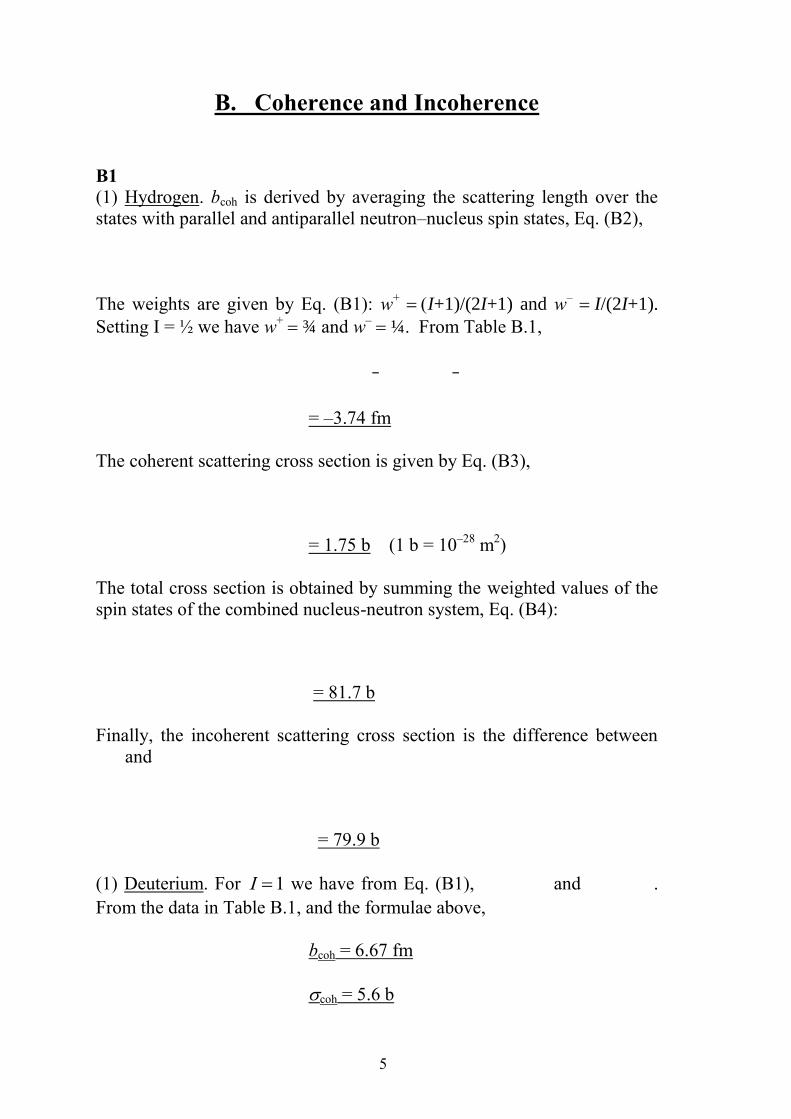
B1
(1) Hydrogen. bcoh is derived by averaging the scattering length over the
states with parallel and antiparallel neutron–nucleus spin states, Eq. (B2),
The weights are given by Eq. (B1): w+ I+1)/(2I+1) and w
– I/(2I+1).
Setting I = ½ we have w+ ¾ and w
– ¼. From Table B.1,
= –3.74 fm
The coherent scattering cross section is given by Eq. (B3),
= 1.75 b (1 b = 10–28
m2)
The total cross section is obtained by summing the weighted values of the
spin states of the combined nucleus-neutron system, Eq. (B4):
= 81.7 b
Finally, the incoherent scattering cross section is the difference between
and
= 79.9 b
(1) Deuterium. For I 1 we have from Eq. (B1), and .
From the data in Table B.1, and the formulae above,
bcoh = 6.67 fm
coh = 5.6 b
6
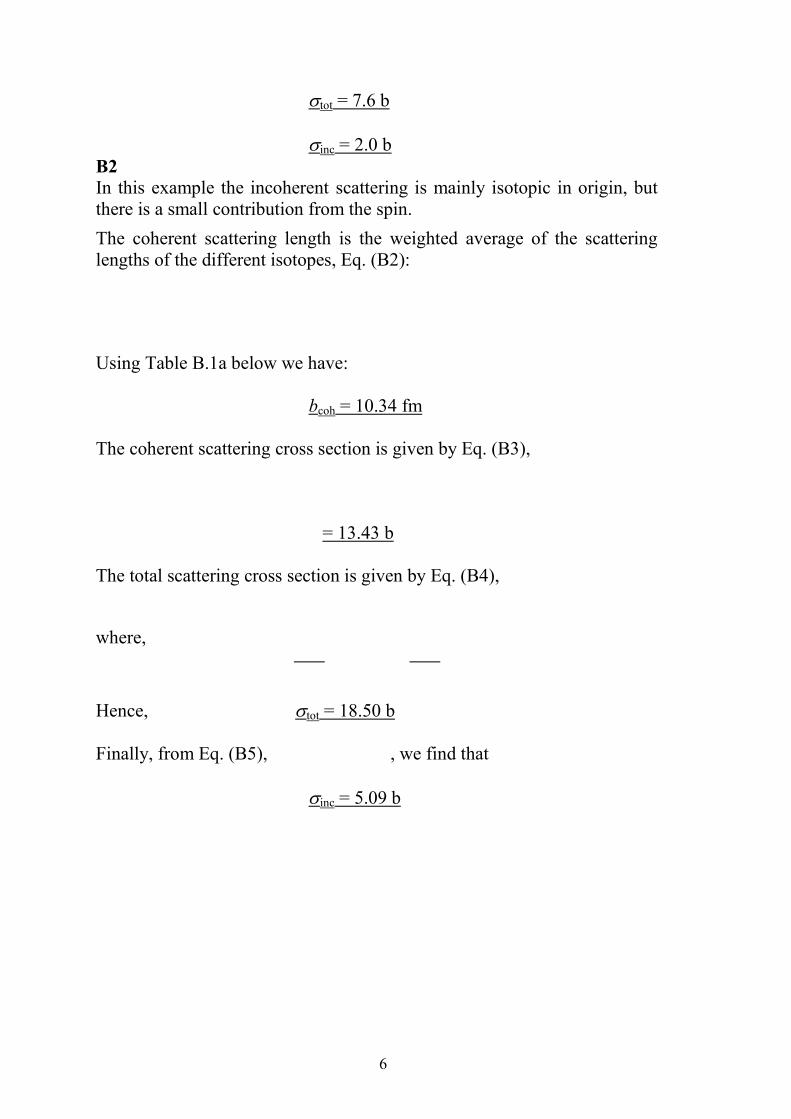
tot = 7.6 b
inc = 2.0 b
B2
In this example the incoherent scattering is mainly isotopic in origin, but
there is a small contribution from the spin.
The coherent scattering length is the weighted average of the scattering
lengths of the different isotopes, Eq. (B2):
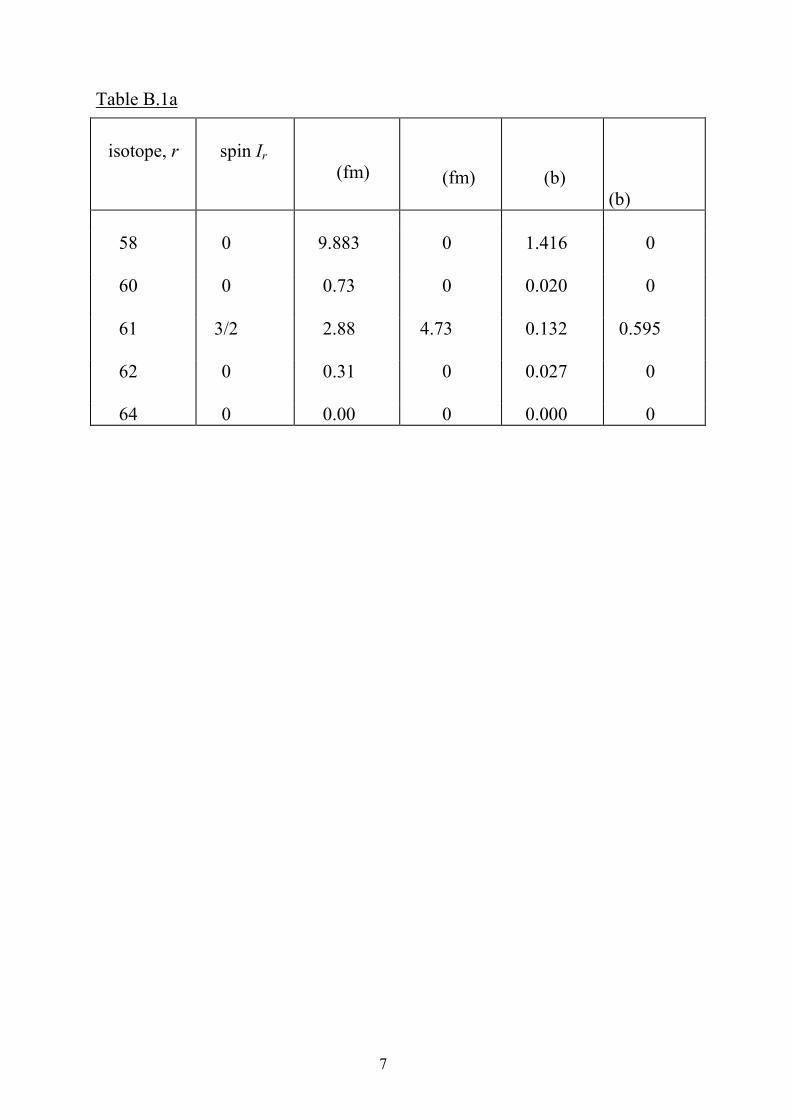
Using Table B.1a below we have:
bcoh = 10.34 fm
The coherent scattering cross section is given by Eq. (B3),
= 13.43 b
The total scattering cross section is given by Eq. (B4),
where,
Hence, tot = 18.50 b
Finally, from Eq. (B5), , we find that
inc = 5.09 b
7
Table B.1a
isotope, r
spin Ir
(fm)
(fm)
(b)
(b)
58 0 9.883 0 1.416
0
60 0 0.73 0 0.020
0
61 3/2 2.88 4.73 0.132
0.595
62 0 0.31 0 0.027
0
64 0 0.00 0 0.000 0
8
C. Time-of-Flight Powder Diffraction
C1.
(a) The expression
t
mn
h
L
follows from the relations
L vt
h
mnv
where v is the neutron velocity.
From the values of h and mn on page 2 we get
t(in secs) 252.8(in Å) x L(in metres) . (C1a)
(b) In Bragg scattering from lattice planes hkl of spacing dhkl the
wavelength of the scattered radiation is given by
2dhkl sin (C2a)
where 2 is the scattering angle.
Putting L100m into eqn. (C1a) and 85 into eqn. (C2a)
gives
t( secs) 5.036104
dhkl (Å)
(C3a)
Perovskite has a primitive cubic lattice, so that the first three Bragg
reflections (corresponding to the longest times-of-flight) are 100, 110 and
111. Also the d-spacing is related to the lattice constant a0 by

9
dhkl a0
h2 k 2 l2 ,
(C4a)
and so d100 3.84Å , d110 2.72Å and d111 2.22Å . Substituting
into eqn (C3a) we find that t100 194msec , t110 137msec and
t111 112msec .
(c) Combining eqns. (C3a) (C4a) gives:
t h2 k
2 l
2 1 2
.
(C5a)
C2.
(a) The Structure Factor Fhkl, or the amplitude of the scattering into the
hkl Bragg reflection by the atoms in one unit cell, is given by:
Fhkl b jj1
N
exp 2i hx j ky j lz j . (C6a)
Here bj is the scattering length of the jth nucleus in the cell, xj yj zj are its
fractional coordinates, and N is the total number of atoms in the cell.
In the diamond structure of silicon there is a basis of two silicon
atoms at
0,0,0 and ¼,¼,¼
and this basis is distributed at each of the face-centred-cubic lattice points:
0, 0, 0; ½, ½, 0; ½, 0, ½; 0, ½, ½
Hence N=8 and the fractional coordinates are
0, 0, 0; ½, ½, 0; ½, 0, ½; 0, ½, ½ for j=1 to 4
and
10
¼,¼,¼ + ( 0, 0, 0; ½, ½, 0; ½, 0, ½; 0, ½, ½) for j=5 to 8.
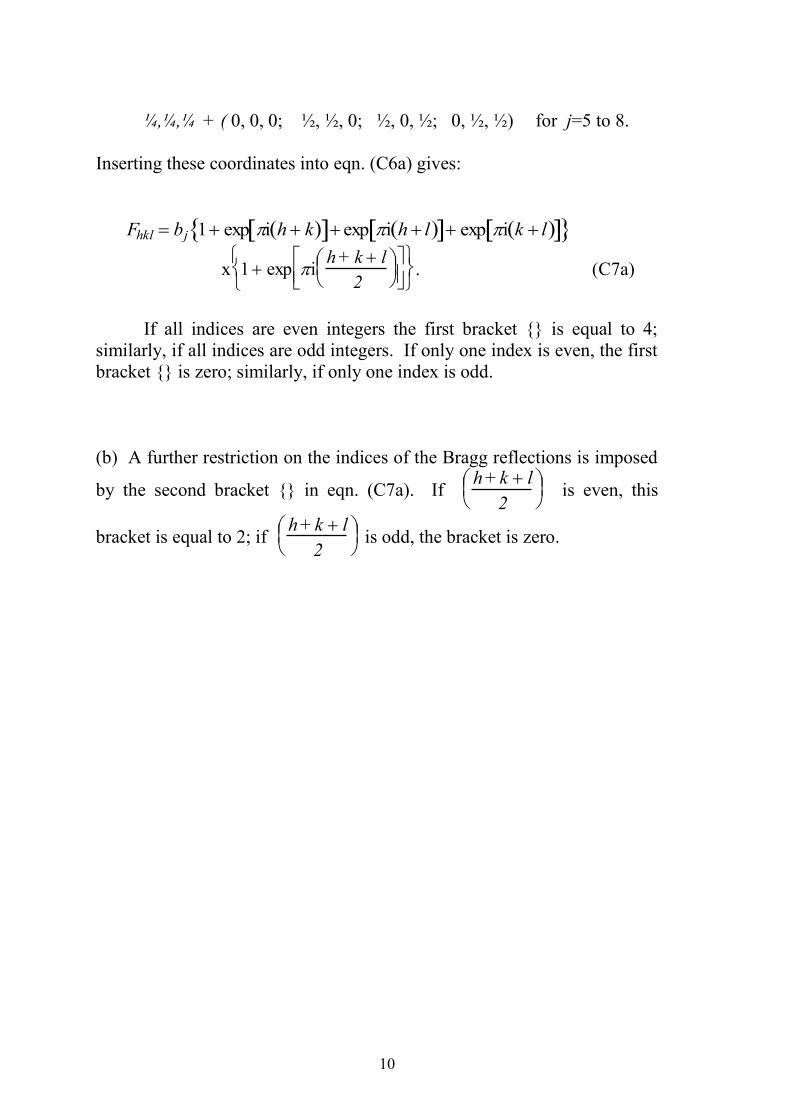
Inserting these coordinates into eqn. (C6a) gives:
Fhkl bj 1 exp i h k exp i h l exp i k l
x 1 exp ih + k l
2
. (C7a)
If all indices are even integers the first bracket {} is equal to 4;
similarly, if all indices are odd integers. If only one index is even, the first
bracket {} is zero; similarly, if only one index is odd.
(b) A further restriction on the indices of the Bragg reflections is imposed
by the second bracket {} in eqn. (C7a). If h +k l
2
is even, this
bracket is equal to 2; if h +k l
2
is odd, the bracket is zero.
11
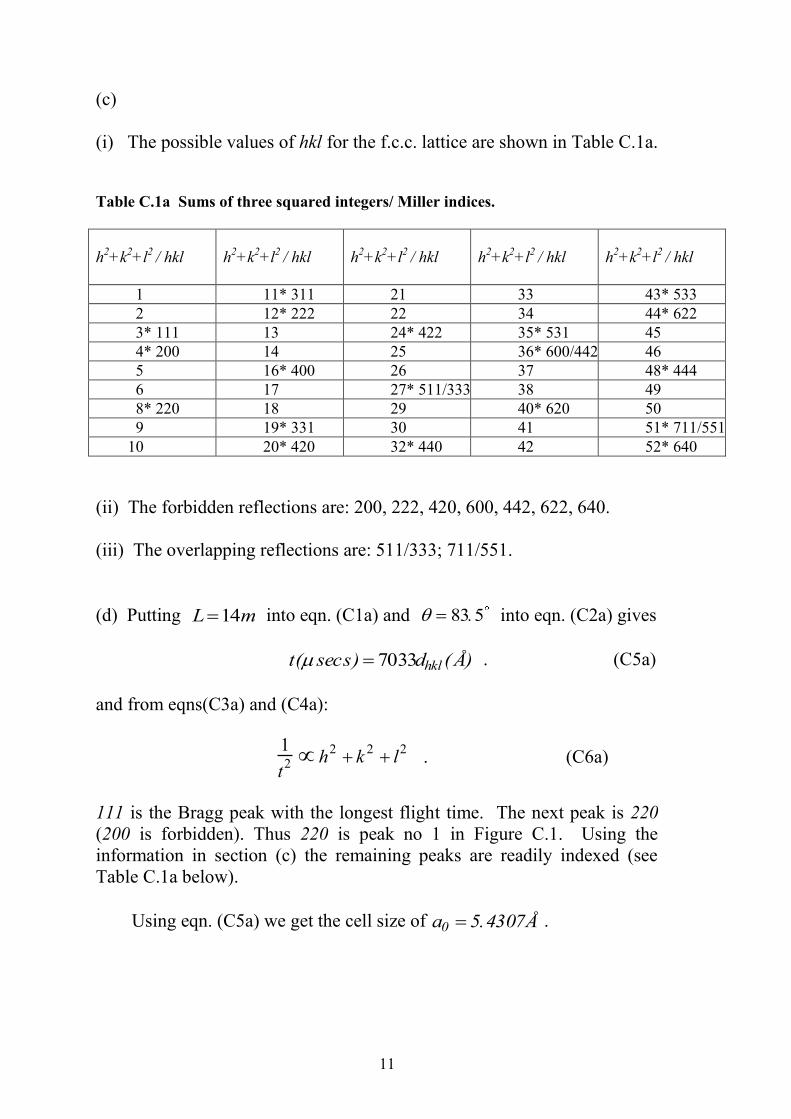
(c)
(i) The possible values of hkl for the f.c.c. lattice are shown in Table C.1a.
Table C.1a Sums of three squared integers/ Miller indices.
h2+k
2+l
2 / hkl
h2+k
2+l
2 / hkl
h2+k
2+l
2 / hkl
h2+k
2+l
2 / hkl
h2+k
2+l
2 / hkl
1 11* 311 21 33 43* 533
2 12* 222 22 34 44* 622
3* 111 13 24* 422 35* 531 45
4* 200 14 25 36* 600/442 46
5 16* 400 26 37 48* 444
6 17 27* 511/333 38 49
8* 220 18 29 40* 620 50
9 19* 331 30 41 51* 711/551
10 20* 420 32* 440 42 52* 640
(ii) The forbidden reflections are: 200, 222, 420, 600, 442, 622, 640.
(iii) The overlapping reflections are: 511/333; 711/551.
(d) Putting L14m into eqn. (C1a) and 83.5 into eqn. (C2a) gives
t( secs) 7033dhkl (Å) . (C5a)
and from eqns(C3a) and (C4a):
1
t2 h
2 k
2 l
2 . (C6a)
111 is the Bragg peak with the longest flight time. The next peak is 220
(200 is forbidden). Thus 220 is peak no 1 in Figure C.1. Using the
information in section (c) the remaining peaks are readily indexed (see
Table C.1a below).
Using eqn. (C5a) we get the cell size of a0 5.4307Å .

12
Table C.1a
peak
number
time of flight
secs
indices hkl
1 13 503 220
2 11 515 311
3 9 549 400
4 8 760 331
5 7 796 422
6 7 351 511/333
7 6 753 440
8 6 455 531
9 6 038 620
10 5 823 533
11
12
5 512
5 348
444
711/551

13
D. Magnetic Elastic Scattering
D1.
The equation for a Gaussian is:
f x 1
2 2exp
x 2
2 2
The Fourier transform of this Gaussian is:
F q exp 1
2q22
The convolution theorem is:
f (x) g(x) F(q) G(q)
Take two Gaussians, f(x) and g(x), with widths 1 and 2. The Fourier
transform of the convolution is:
f (x) g(x) exp 1
2q2 f
2
exp
1
2q2g
2
exp 1
2q2 f
2 g
2
This may now be inverse Fourier transformed to give:
f (x) g(x) 1 f (x) g(x)
1
2 f
2 g
2 exp
x 2
2 f
2 g
2
Hence, the convolution of two Gaussians gives a Gaussian, and its width is
given by
f
2 g
2

14
D2.1
The moments point along c and each atom is antiferromagnetically coupled to
its nearest neighbour, i.e. the magnetic unit cell is twice as large along a, b, and
c:
D2.2
The nuclear unit cell is primitive, thus Bragg peaks will appear at all the points
in h, k and l.
D2.3 The magnetic unit cell is twice as large as the nuclear in a, b and c, hence the
magnetic reciprocal lattice is half the size of the nuclear reciprocal lattice.
ab
c

15
D2.4
The magnetic structure factor is given by the Fourier transform of the moment
orientations and positions, i.e.
Fmag
hkl j
j1
N
exp 2i hx j ky j lz j
where N is the number of moments in the unit cell. There are 8:
Atom (x,y,z) Moment amplitude
1 (0, 0, 0) +1
2 (0.5, 0.5, 0) +1
3 (0.5, 0, 0.5) +1
4 (0, 0.5, 0.5) +1
5 (0.5, 0, 0) -1
6 (0, 0.5, 0) -1
7 (0, 0, 0.5) -1
8 (0.5, 0.5, 0.5) -1
Note that (x,y,z) are defined with respect to the magnetic unit cell, and the
amplitude is given in units of .
Substitute these values in to the equation, which becomes:
Fmag
hkl 1 exp i h k exp i h l exp i k l
exp ih exp ik exp il exp i h k l
Nuclear indices written in black, magnetic indices written in red
[010]
[110]
1 2–1–2
1
2Nuclear lattice point
Magnetic lattice point
–1
–2
1
2
3
4
2 3 4
1
–1–2–3–4
–1
–2
–3
–4

16
This equals zero for all h,k,l except when they are all odd!
The Bragg peak map therefore looks like:
This comes about because the magnetic unit cell has a higher symmetry than the
nuclear unit cell. It is, in fact, face-centred cubic with 4 moments in its basis.
The structure factor for all the visible lattice points is 8, however the
intensities of the Bragg peaks will not be all the same (despite them all having
the same structure factor). The direction of Q with respect to the moment
direction becomes important. Neutrons only ever see the perpendicular
component of the sublattice magnetization to Q, thus the intensity of the Bragg
peaks will be multiplied by sin2, where is the angle between Q and [001].
Furthermore, the intensity will be modulated by the magnetic form factor. This
will cause the intensity to decrease with increasing Q.
D2.5 The spin waves will be visible in both directions. However, the spin
waves in the classical picture take the form of fluctuations that are
perpendicular to the mean moment direction. Hence, if the moments are
oriented along c, the spin waves will take the form of fluctuations in the (a, b)
plane. Measurements along the [001] axis will therefore see the full
contribution from the spin waves as this direction is normal to the (a, b) plane,
as Q is always perpendicular to the moment contributions. Measurements along
the [110] axis will only have half this intensity as components of the spin waves
along [110] will not give any neutron scattering.
21
[001]
[110]
1 2–1–2
2Nuclear lattice point
Magnetic lattice point
–1
–2
1
3
4
2 3 4
1
–1–2–3–4
–1
–2
–3
–4

17
D2.6 If the sample has many domains, there will be no distinction between
moments lying along a, b, or c. Therefore the sin2 term will need to be
averaged over all possible orientations, i.e. the magnetic (511) and (333) peaks
(which have the same Q) will have the same intensity.
18
E. Incoherent Inelastic Scattering
(with a Pulsed Neutron Spectrometer)
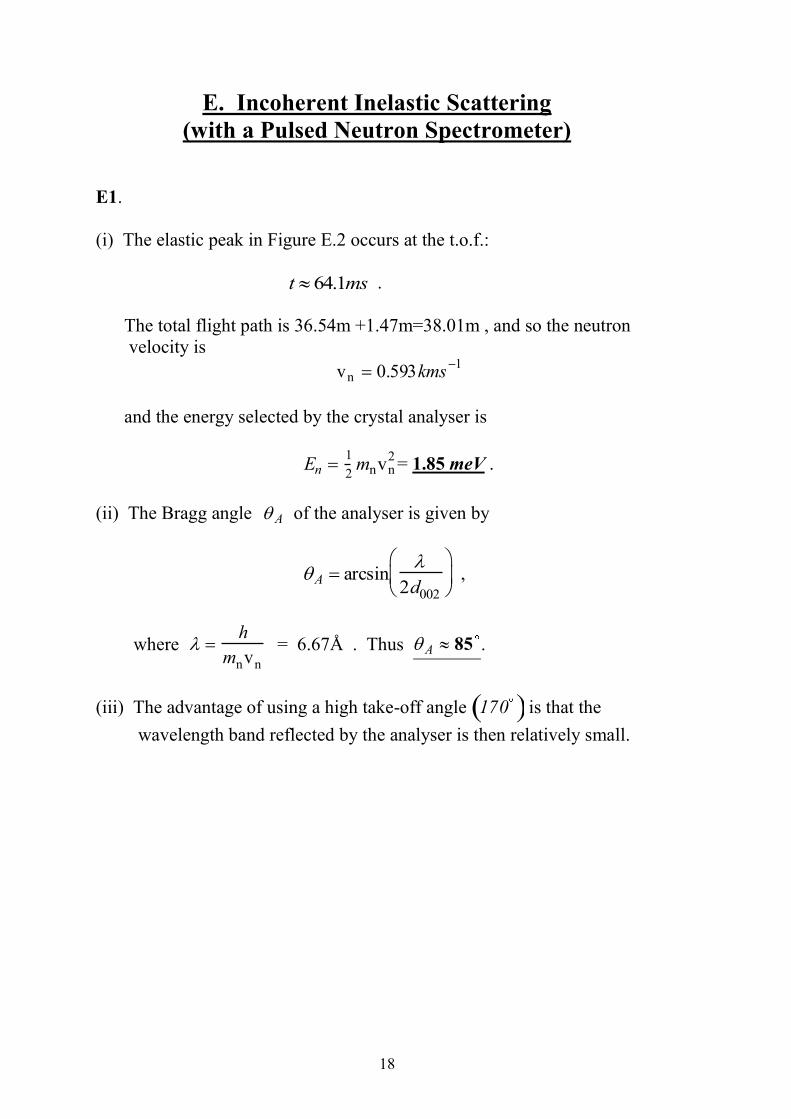
E1.
(i) The elastic peak in Figure E.2 occurs at the t.o.f.:
t 64.1ms .
The total flight path is 36.54m +1.47m=38.01m , and so the neutron
velocity is
vn 0.593kms1
and the energy selected by the crystal analyser is
En 1
2mnvn
2= 1.85 meV .
(ii) The Bragg angle A of the analyser is given by
A arcsin
2d002
,
where h
mnvn
= 6.67Å . Thus A 85 .
(iii) The advantage of using a high take-off angle 170 is that the
wavelength band reflected by the analyser is then relatively small.
19
E2.
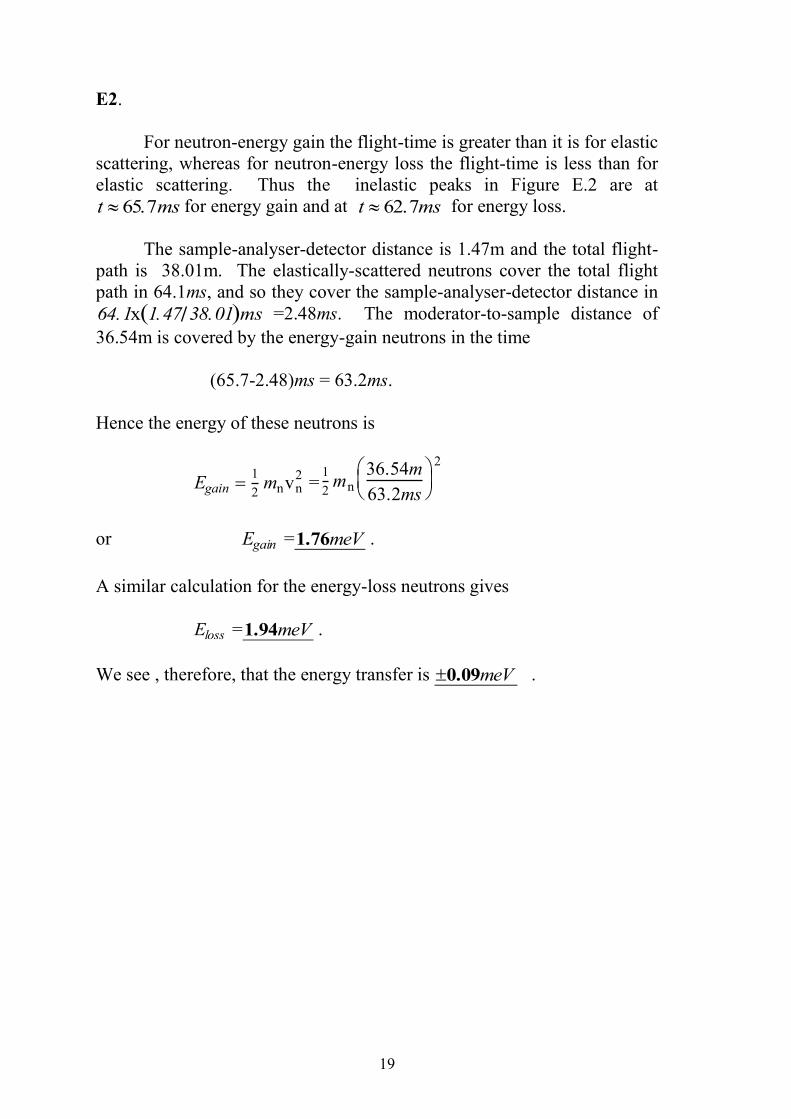
For neutron-energy gain the flight-time is greater than it is for elastic
scattering, whereas for neutron-energy loss the flight-time is less than for
elastic scattering. Thus the inelastic peaks in Figure E.2 are at
t 65.7ms for energy gain and at t 62.7ms for energy loss.
The sample-analyser-detector distance is 1.47m and the total flight-
path is 38.01m. The elastically-scattered neutrons cover the total flight
path in 64.1ms, and so they cover the sample-analyser-detector distance in
64.1x 1.47 38.01 ms =2.48ms. The moderator-to-sample distance of
36.54m is covered by the energy-gain neutrons in the time
(65.7-2.48)ms = 63.2ms.
Hence the energy of these neutrons is
Egain 1
2mnvn
2 =
1
2mn
36.54m
63.2ms
2
or Egain =1.76meV .
A similar calculation for the energy-loss neutrons gives
Eloss =1.94meV .
We see , therefore, that the energy transfer is 0.09meV .
20
E3
(i) The intensity is influenced by the Bose factor n(E) which gives the
number of phonons which exist at a given energy E and
temperature T :
n(E) 1
expE
kBT
1
.
For neutron-energy loss the intensity is proportional to [1 n(E )],
whereas for neutron-energy gain it is proportional to n(E) . At low
temperatures n(E) tends to zero and only scattering with neutron
energy loss ('down scattering') is possible. There is always a greater
possibility, at any temperature, that neutrons will be scattered with
energy loss.
21
F. Coherent Inelastic Scattering
(with a Three-Axis Spectrometer)
F1.
The allowed points have hkl indices, which are all odd or all even. See
Figure F1a.
F2.
The relation between neutron energy E and neutron wave number k is
E(meV) 2.072 k(Å1
) 2
.
Putting Eimin
3meV and Eimax
14meV gives
kimin
=1.203 Å1
and kimax
=2.600 Å1
..
We also have k 2 , so that kimin
corresponds to the maximum
wavelength imax
= 5.22 Å, and kimax
to the minimum wavelength imin
= 2.42 Å.
F3
(i) We have Q220 2 d220 8 2 a0 , so that Q220 = 3.20 Å.
Figure F1a shows the vectors k i, k f , and Q for the 220 reflection.
(ii) Putting ki k f into Q2 ki
2 k f
2 2kik f cos we get
2sin1
Q 2ki ,
and so =75.9 º.
(iii) In the case of elastic scattering the scattering angle is twice the
Bragg angle B.
22
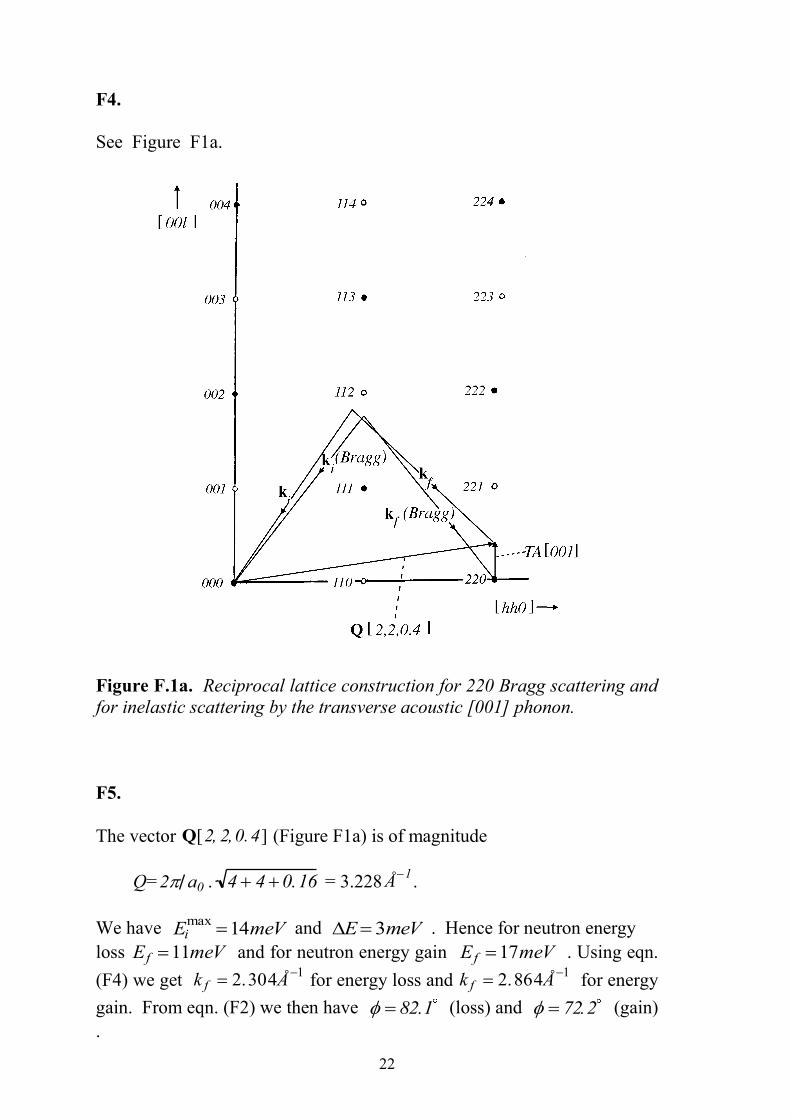
F4.
See Figure F1a.
Figure F.1a. Reciprocal lattice construction for 220 Bragg scattering and
for inelastic scattering by the transverse acoustic [001] phonon.
F5.
The vector Q[2, 2,0.4] (Figure F1a) is of magnitude
Q= 2 a0 . 4 4 0.16 = 3.228 Å1
.
We have Eimax
14meV and E3meV . Hence for neutron energy
loss Ef 11meV and for neutron energy gain Ef 17meV . Using eqn.
(F4) we get k f 2.304Å1
for energy loss and k f 2.864Å1
for energy
gain. From eqn. (F2) we then have 82.1 (loss) and 72.2 (gain)
.

23
F6.
The resolution is best for small k f , i.e. for energy loss. In Figure F.1* the
vectors k i and k f are drawn for this configuration.
F7.
(i) At 300K: n(E)=8.3 for energy gain and n(E) + 1 = 9.3 for energy loss.
At 0K: n(E)=0 for energy gain and n(E) + 1 = 1 for energy loss.
(ii) Thus it doesn't make much difference at 300K whether one works in
energy gain or in energy loss, but at low temperatures one must work
in energy loss.
F8.
No; not with this value of the incident wavelength. We have Q440 = 2Q220
=6.46Å1
, ki k f 4.904Å1
in energy loss , and ki k f 5.464Å1
in
energy gain. Hence ki k f Q and it is impossible to close the scattering
triangle (Figure F.2) in either case.

24
G. Disordered Materials Diffraction
G1.1 a) and c)
G1.1 b)
ε represents the depth of the potential. It controls how tightly adjacent atoms are
bound. represents the radius at which the hard core repulsive region goes to
zero. It represents roughly the distance of closest approach of two atoms.
G1.2 a)
G1.2b)

25
At low r, U(r) becomes very large, while g(r) goes to zero. At high r, U(r) goes
to zero, while g(r) goes to unity. In between the two functions are in rough
antiphase.
G1.2c) If ε were increased by a factor of 2, the height of the peak in g(r) at ~
3.8Å would grow from ~1.27 to ~1.54. If σ were increased by 20%, the main
peak would move out by 20%, but would remain the same height.
G1.3a) In the gas form g(r) decays monotonically to unity at large r. As the density
increases the height of the main peak increases and it becomes sharper as a
series of decaying oscillations occur towards larger r. All the peaks move to
smaller r with increasing density.
Based on a change of density of 0.02 to 0.035, one might expect the separation
of peaks to change by the cube root of the ratio of densities, namely
In fact the first peak moves from 3.18Å to 3.06Å, a fractional change of only
0.96, while the second peak moves from 6.39Å to 5.91Å, a fractional change of
0.92. In other words the peaks in g(r) do NOT represent the mean
separation of the atoms. This can be quite confusing!
G1.3b) Fundamentally as the material becomes more dense the direct interactions
between atoms 1 and 2 become increasingly affected by the presence of 3rd, 4th
, etc. atoms which increasingly surround them, and which increasingly confine
them in space. Within the pairwise additive approximation assumed here all the
atoms interact via known pairwise forces, but the result is many body
correlations which are difficult to predict accurately. A raft of theoretical
methods to do this approximately exist, but few if any of them work for the kind
of interatomic forces that are found in real materials. Hence in practice one has
little option but to use computer simulation to determine the effect of many-
body correlations in real materials. This problem affects crystals as much as it
affects liquids, but in a crystal one has a repeat lattice (which is itself a
consequence of many body correlations) which we can determine from the
position and height of the Bragg peaks. In any case the primary goal of interest
in crystallography is the single particle correlation function (the lattice),
not the higher order correlations. The single particle correlation function for a
liquid is uniform and contains no information. For a glass it is not uniform, but
contains no repeat distances.
G1.4a)
26
For density 0.02 the first minimum occurs at 4.95Å, giving a coordination
number of ~10 atoms. For density 0.035, the first minimum is at 4.47 Å with a
coordination number of 12.5. Clearly these numbers do not scale with density
change: coordination number varies less rapidly than the density.
G1.4b)
If instead we had used the same radius, 4.47 Å, then the coordination number at
density 0.02 is 7.23, a ratio of 0.58 compared to density 0.035, which is quite
close to the ratio of densities, 0.57. This illustrates again that peaks and dips in
g(r) do not correlate directly with the density, although they are obviously
related to it.
G1.5a)
The primary effect of changing the density on the structure factor is to increase
the amplitude of the oscillations. There is some movement of the peaks as well,
but fundamentally as the density increases they become sharper, and the
oscillations extend to large Q.
G1.5b) For density 0.02, the first peak in g(r) is at 3.18Å and the first peak in S(Q) is at
2.2Å-1. For density 0.035, the first peak in g(r) is at 3.06Å and the first peak in
S(Q) is at 2.35Å-1
, i.e. as the peaks in g(r) move in, those in S(Q) move out,
although the movement of the first peak in S(Q) is more related to the
movement of the 2nd and subsequent peaks in g(r) than it is to the first peak in
g(r).
G1.5c) It depends how we did it. If we increased σ at constant density, then the peaks
would move out, but also become markedly sharper as the packing fraction of
the liquid increased. If the density was reduced to compensate for the increase
(atoms occupying more space) then the peaks in S(Q) would move in, but
without increased amplitude.
G1.5d) Since the structure factor only exists if the density is finite, a zero density will
produce zero structure factor.
G2.1a) Atomic fractions are cZn = 1/3 = 0.333, cCl = 2/3 =0.667
G2.1b)
27
G2.1c) In essence the idea is that we measure F(Q) for three samples, namely one with
only 35
Cl isotope present, another with only 37
Cl isotope present, and a third
with a mixture of x parts 35
Cl and (1-x) parts of 37
Cl. For this third sample the
chlorine scattering length is
which means the weighting coefficient of the HClCl partial structure factor for
this sample is not a linear combination of the same coefficient for the other two
samples. This means the determinant of coefficients in the above formula for the
three samples is finite and the matrix of coefficients can be inverted. Hence the
three measurements can be used to extract the three partial structure factors, at
least in principle.
A basic assumption of the isotope substitution method is that the partial
structure factors do not change appreciably with isotopic composition of the
sample. This is an accurate assumption in most cases, but is less accurate when
hydrogen is replaced with deuterium, particularly at low temperatures and with
larger molecules, because in these cases quantum effects due to the different
masses can impact on both the structure and the phase diagram of the material
in question.
G2.1d) Remarkably few in practice. There have been attempts to perform isomorphic
substitution with X-rays, but these method tends to be shrouded in uncertainties
from knowing whether one atom can substitute for another without . Then there
has been the combination of neutrons, X-rays and electrons, but each technique
requires quite different sample containment, making comparisons of the three
results dubious. A more promising approach is the use of anomalous dispersion
of Xrays, whereby you vary the scattering length of one component near an
absorption edge. This method is quite promising, but requires highly stable
precision equipment to be performed satisfactorily, and to date has only be tried
on a handful of materials. It suffers also from poor counting statistics because of
the high degree of monochromatisation needed for the incident beam of X-rays.
Recently we have been exploring the use EXAFS to refine liquid and glass
structures, and this approach looks very promising indeed.
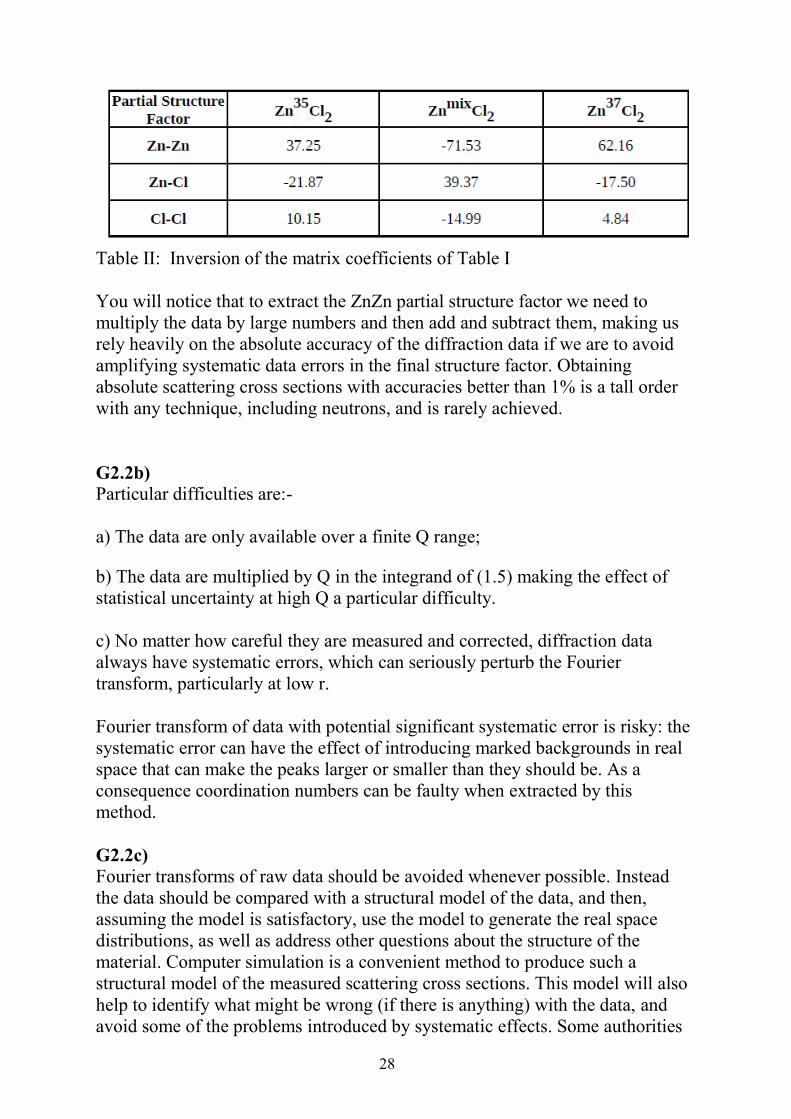
G2.2a) This is a very common problem in neutron scattering using isotopes: one or
more of the components makes only a small contribution to the scattering
pattern. In this case it is the ZnZn structure factor. Below is shown the inversion
of the weights matrix:-
28
Table II: Inversion of the matrix coefficients of Table I
You will notice that to extract the ZnZn partial structure factor we need to
multiply the data by large numbers and then add and subtract them, making us
rely heavily on the absolute accuracy of the diffraction data if we are to avoid
amplifying systematic data errors in the final structure factor. Obtaining
absolute scattering cross sections with accuracies better than 1% is a tall order
with any technique, including neutrons, and is rarely achieved.
G2.2b) Particular difficulties are:-
a) The data are only available over a finite Q range;
b) The data are multiplied by Q in the integrand of (1.5) making the effect of
statistical uncertainty at high Q a particular difficulty.
c) No matter how careful they are measured and corrected, diffraction data
always have systematic errors, which can seriously perturb the Fourier
transform, particularly at low r.
Fourier transform of data with potential significant systematic error is risky: the
systematic error can have the effect of introducing marked backgrounds in real
space that can make the peaks larger or smaller than they should be. As a
consequence coordination numbers can be faulty when extracted by this
method.
G2.2c) Fourier transforms of raw data should be avoided whenever possible. Instead
the data should be compared with a structural model of the data, and then,
assuming the model is satisfactory, use the model to generate the real space
distributions, as well as address other questions about the structure of the
material. Computer simulation is a convenient method to produce such a
structural model of the measured scattering cross sections. This model will also
help to identify what might be wrong (if there is anything) with the data, and
avoid some of the problems introduced by systematic effects. Some authorities
29
are reluctant to use computer simulation to achieve this, since it too can
introduce systematic bias in the interpretation of the data, and so instead invoke
a series of consistency checks on the data. These are used to identify and correct
particular problems with the data, but this can be a very time consuming process
which can take months to resolve. The net effect is the same however: in
computer simulation one is already applying a series of physical consistency
checks on the data, with the advantage that you have at the end a physical model
of the scattering system which is consistent with your scattering data. With
the other methods, you have corrected data, but you still have the problem of
trying to understand what they mean.
G2.3a) Figure G2.2 shows the running coordination number of this g(r). From this
graph we can read that at the first minimum, 3.4Å, the running coordiation
number is ~4.3 Cl about Zn. Since there are half the number Zn atoms
compared to Cl, the coordination number of Zn about Cl will be 2.2.
G2.3b) The first ZnCl peak is at 2.31Å, while the first ClCl distance is at 3.69Å. Using
the cosine rule, I estimate the Cl-Zn-Cl angle to be 106º, which is close to the
tetrahedral angle of 109.47º. This together with the coordination number of ~4
is a strong hint of likely tetrahedral local coordination in this liquid.
Taking this argument a bit further, one notices that the first ZnZn peak is at
3.93Å, while the second is at 6.81Å, giving a Zn-Zn-Zn angle of 120º,
suggesting also that at least the Zn packing is not simple, and probably maps
into the roughly tetrahedral packing of the Cl around Zn, with significant edge-
sharing of the tetrahedra.
G2.3c) Looking at the curves one is struck by the way the ZnCl oscillations are almost
exactly out of phase with the ZnZn and ClCl oscillations. This behaviour
strongly indicative of charge ordering, although it is not entirely clear that Zn
and Cl are fully ionic in this system.

30
H: Polarized Neutrons
H1. a) Flipping ratio: F = N+ / N- = 51402 / 1903 = 27 +/- 0.6
{error bar
dF dN
N
2
dNN
N
2
2
=> dF = 0.63}
Therefore, the polarization is: P = F – 1 / F + 1 = 0.929 +/- 0.002
{error bar
dP 2
(F 1)2
dF => dF = 0.002 }
b) Systematic errors in this measurement will largely arise from
background contributions from the instrumental environment. In order to
measure a reliable flipping ratio, the N+ and N- counts must be measured
with and without the sample in the beam. The flipping ratio is then given
by
F N
sample N
empty
N
sample N
empty
Other sources of systematic error will be different values of the polarizing
power of the polarizer and analyser, in addition to the finite flipping
efficiency of the flipper.
H2. a) The adiabacity parameter is given by
E L
B
The Larmor frequency,
L B, where the gyromagnetic ratio, is given
by the ratio of the neutron magnetic moment to its angular momentum (=
1
2)
Therefore:
L 2nB
1.83108 B rad s-1
with B given in T.
In this example, B = 3 mT and is constant in magnitude, => L = 5.49
105 rad s
-1
Now:
B d
dy.v
2
0.1.v 15.71v
Expressing v in terms of :
E h2
2mn2
mnv2
2 v
h
mn
3956
with v in m
s-1
and in Å.

31
So:
B 15.713956
2 31074 rad s
-1.
The adiabacity parameter is therefore: E = 17.7 and the field/flipper
design should successfully propagate the neutron polarization and flip the
spins without significant depolarization.
b) The design could be improved by either increasing the guide fields
(and the current in the Dabbs foil) or by lengthening the distance over
which the field rotates by 90.
H3. a) The number of neutrons transmitted through an absorbing material is:
n = n0 exp(-N t) where n0 is the initial number of neutrons, N is the
number density of atoms in the material, is the mean absorption cross-
section and t is the thickness of the material. So the numbers of + and –
neutrons transmitted is:
n n0 exp(N t) n0 exp(N 0t)exp(N pt)
n n0 exp(Nt) n0 exp(N 0t)exp( N p t)
Therefore the polarization is:
P n n
n n
exp(N pt) exp(N pt)
exp(N pt) exp(N pt) tanh(N pt)
The transmission of each spin state is:
T n
n0
exp(Nt)
Therefore the total transmission:
T T T
2 exp(N 0t)
exp(N pt) exp( N pt)
2 exp(N 0t)cosh( N pt)
b) The expression for the spin-dependent absorption of a nuclear spin filter
is
( )(1 )a NE P where, PN is the nuclear polarization and a(E) is the
energy dependent absorption cross-section. The constant is given by the
expressions:
I(12x) x
I 1, where x
I1/ 2
I 1/ 2 I1/ 2
.
Since 3He absorbs only through the I – ½ channel, we may put I+1/2 = 0,
and therefore:
= -1.
Therefore:
a (E) 1 PHe 0 p
So, equating the spin-independent and spin-dependent parts of the
expression, we get
32
0 a (E)
p 0PHe PHe p
0
Substituting this back into the general expressions for the spin-filter
polarization and transmission, we get:
P tanh( PHeN0t) and
T exp(N0t)cosh( PHeN 0t)
H4. The expression for the differential cross-section from a magnetised crystal,
with magnetisation direction
ˆ perpendicular to the scattering vector Q,
we have
d
d FN
2(Q) 2FN (Q)FM (Q) P ˆ FN
2(Q)
Therefore the expressions for n+ (
P ˆ 1) and n- (
P ˆ 1) are
n FN FM 2
n FN FM 2
Therefore, the polarization is:
P FN FM
2 FN FM
2
FN FM 2 FN FM
2
4FN FM
2FN
2 2FM
22FN FM
FN
2 FM
2
The minus sign indicates that the neutrons are polarized antiparallel to the
direction of magnetisation of the crystal.
H5. The first rule of thumb in magnetic polarized neutron scattering is that
spin-flipped neutrons will only be produced by components of the sample
magnetisation perpendicular to the neutron polarization direction. [This is
an extremely useful rule to bear in mind during all polarized neutron
experiments.] Therefore, if we are scattering neutrons from a fully
magnetised scatterer (i.e. a ferromagnet for example) – magnetised in the
direction of the neutron polarization (which is an experiment necessity),
then there will be no perpendicular components of the magnetisation, and
therefore no spin-flip scattering. We can therefore dispense with the
analysers, since the scattered beam remains fully polarized.
33
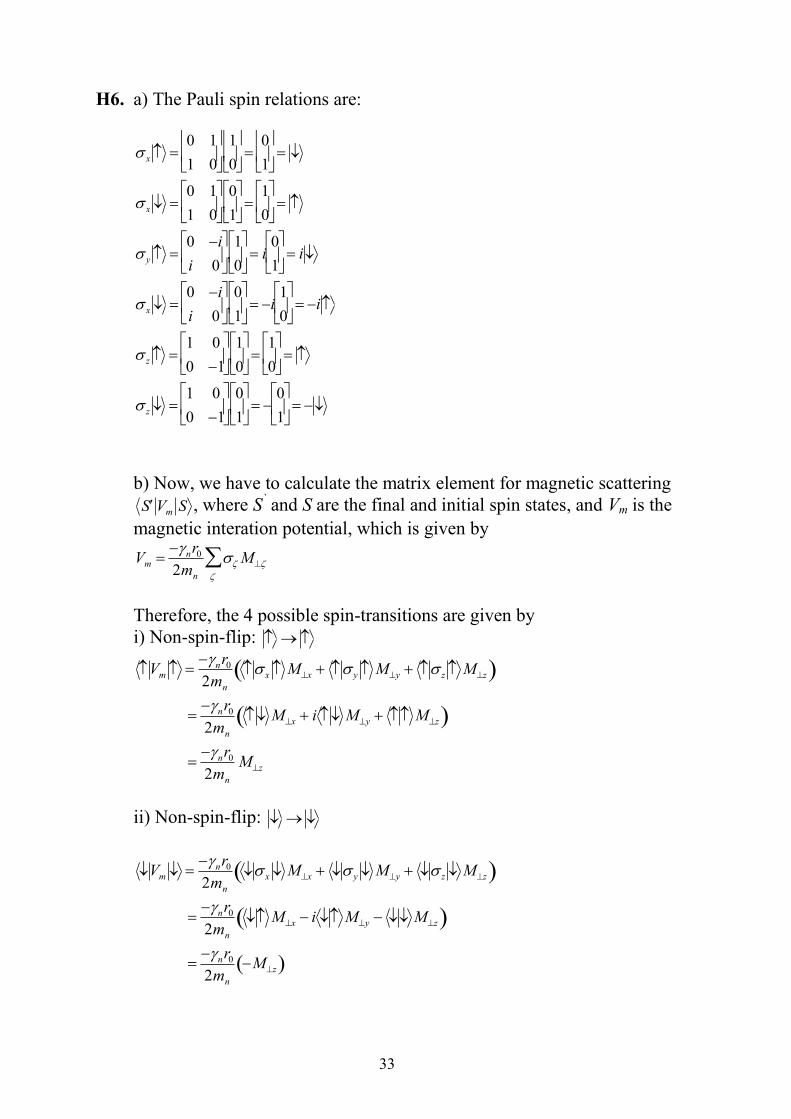
H6. a) The Pauli spin relations are:
x 0 1
1 0
.
1
0
0
1
x 0 1
1 0
.
0
1
1
0
y 0 i
i 0
.
1
0
i
0
1
i
x 0 i
i 0
.
0
1
i
1
0
i
z 1 0
0 1
.
1
0
1
0
z 1 0
0 1
.
0
1
0
1
b) Now, we have to calculate the matrix element for magnetic scattering
S Vm S , where S` and S are the final and initial spin states, and Vm is the
magnetic interation potential, which is given by
Vm nr0
2mn
M
Therefore, the 4 possible spin-transitions are given by
i) Non-spin-flip:
Vm nr0
2mn
x Mx y My z Mz
nr0
2mn
Mx i My Mz
nr0
2mn
Mz
ii) Non-spin-flip:
Vm nr0
2mn
x Mx y My z Mz
nr0
2mn
Mx i My Mz
nr0
2mn
Mz

34
iii) Spin-flip:
Vm nr0
2mn
x Mx y My z Mz
nr0
2mn
Mx i My Mz
nr0
2mn
Mx iMy
iv) Spin-flip:
Vm nr0
2mn
x Mx y My z Mz
nr0
2mn
Mx i My Mz
nr0
2mn
Mx iMy
These equations show that the magnetic non-spin-flip scattering is entirely
due to the component of the magnetisation parallel to the neutron
polarization direction,
Mz; and that the magnetic spin-flip scattering is
entirely due to the components of the magnetisation perpendicular to the
neutron polarization direction,
Mx and
My .
H7. From the previous question (which is a derivation of the magnetic part of
the Moon, Riste and Koehler equations) we have established that spin-flip
scattering arises solely from the components of the sample magnetisation
perpendicular to the neutron polarization.
Now, the definition of the neutron sensitive sample magnetisation is
M (Q) 2B ( ˆ Q ) ˆ Q where is the sample magnetisation (see, for
example, Squires, or previous lectures on magnetic scattering).
From this equation, we note that if the scattering vector is parallel to the
sample magnetisation, then the neutron sensitive magnetisation is zero.
Therefore, if the neutron polarization is parallel to the scattering vector, the
only components of the magnetisation that will scatter neutrons will be
perpendicular to the polarization, and will therefore flip the neutron spins.
35
H8. The advantage of the X-Y-Z difference method of magnetic scattering
separation over the method of measuring with the neutron polarization P ||
Q, is that the X-Y-Z method applies to a general multi-detector instrument.
The P || Q method only works for one scattering vector at a time.
A further advantage of X-Y-Z is that it is insensitive to background, since
the spin-flip background will be the same in Z, X and Y directions, and
will therefore cancel out.
36
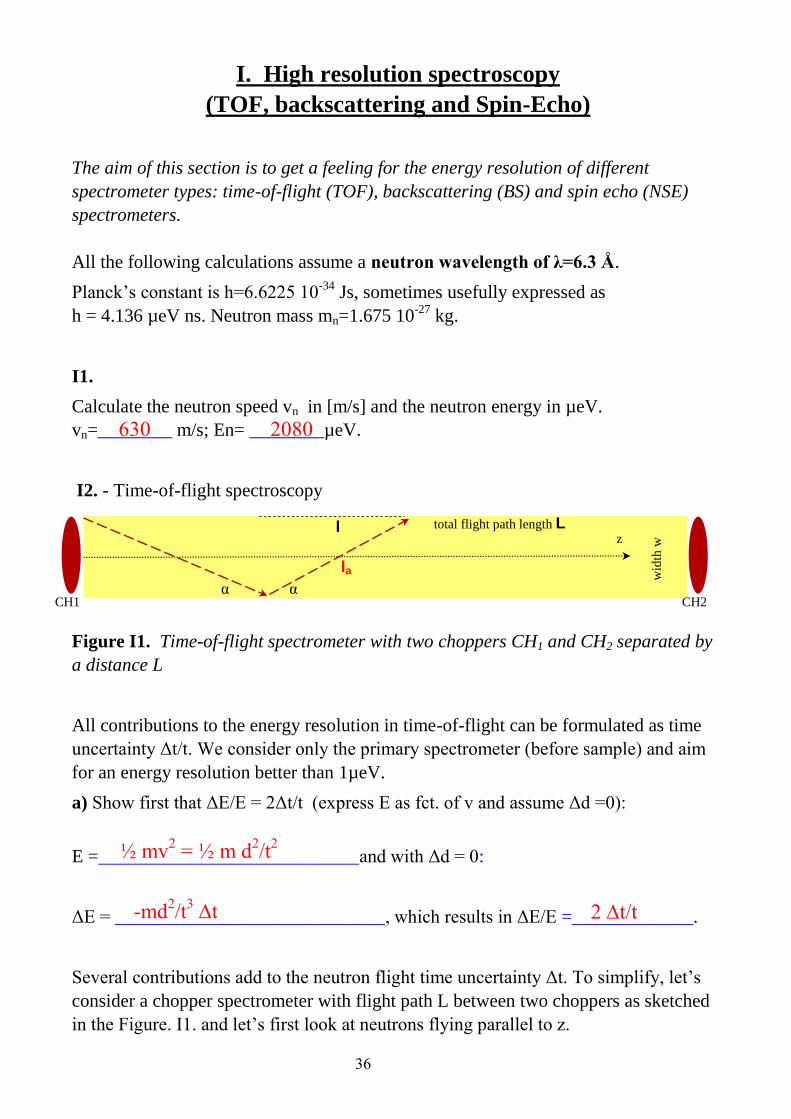
I. High resolution spectroscopy
(TOF, backscattering and Spin-Echo)
The aim of this section is to get a feeling for the energy resolution of different
spectrometer types: time-of-flight (TOF), backscattering (BS) and spin echo (NSE)
spectrometers.
All the following calculations assume a neutron wavelength of λ=6.3 Å.
Planck‟s constant is h=6.6225 10-34
Js, sometimes usefully expressed as
h = 4.136 µeV ns. Neutron mass mn=1.675 10-27
kg.
I1.
Calculate the neutron speed vn in [m/s] and the neutron energy in µeV.
vn=________ m/s; En= ________µeV.
I2. - Time-of-flight spectroscopy
Figure I1. Time-of-flight spectrometer with two choppers CH1 and CH2 separated by
a distance L
All contributions to the energy resolution in time-of-flight can be formulated as time
uncertainty Δt/t. We consider only the primary spectrometer (before sample) and aim
for an energy resolution better than 1µeV.
a) Show first that ΔE/E = 2Δt/t (express E as fct. of v and assume Δd =0):
E =____________________________and with Δd = 0:
ΔE = _____________________________, which results in ΔE/E =_____________.
Several contributions add to the neutron flight time uncertainty Δt. To simplify, let‟s
consider a chopper spectrometer with flight path L between two choppers as sketched
in the Figure. I1. and let‟s first look at neutrons flying parallel to z.
630 2080
½ mv2 = ½ m d
2/t
2
-md2/t
3 t 2 t/t
CH1 CH2 α
wid
th w
total flight path length L z
l
la
α
37
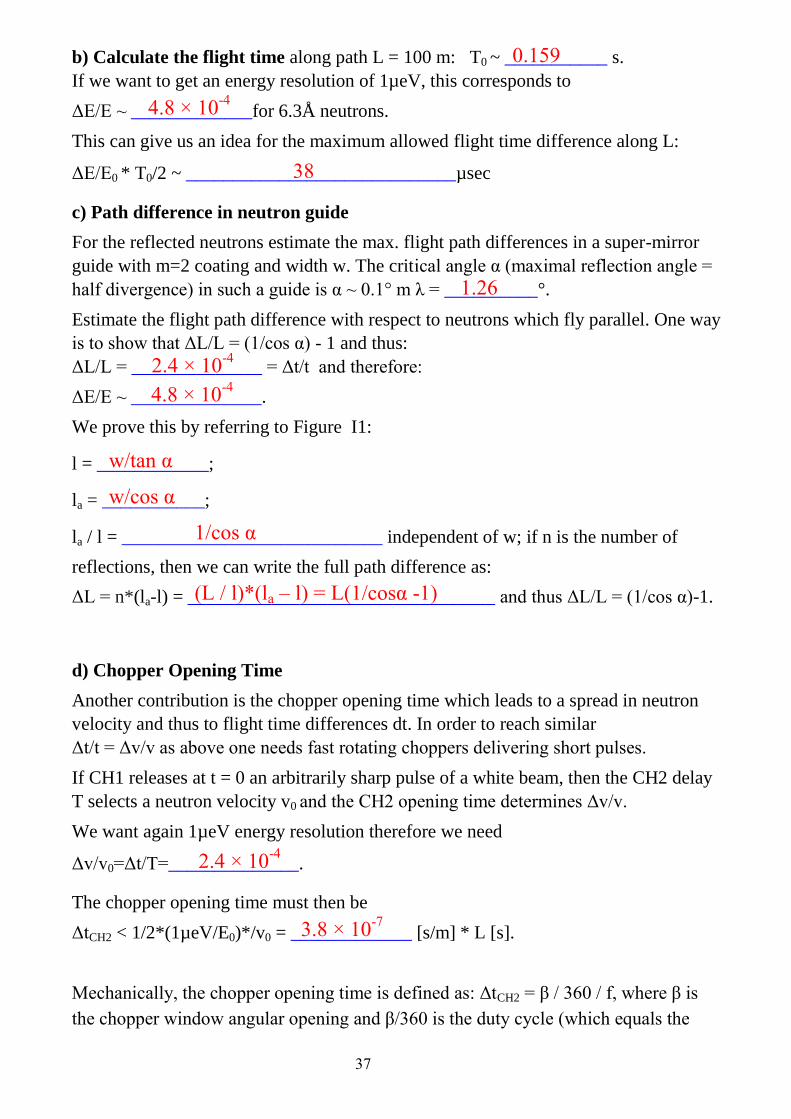
b) Calculate the flight time along path L = 100 m: T0 ~ ___________ s.
If we want to get an energy resolution of 1µeV, this corresponds to
ΔE/E ~ _____________for 6.3Å neutrons.
This can give us an idea for the maximum allowed flight time difference along L:
ΔE/E0 * T0/2 ~ _____________________________µsec
c) Path difference in neutron guide
For the reflected neutrons estimate the max. flight path differences in a super-mirror
guide with m=2 coating and width w. The critical angle α (maximal reflection angle =
half divergence) in such a guide is α ~ 0.1° m λ = __________°.
Estimate the flight path difference with respect to neutrons which fly parallel. One way
is to show that ΔL/L = (1/cos α) - 1 and thus:
ΔL/L = ______________ = Δt/t and therefore:
ΔE/E ~ ______________.
We prove this by referring to Figure I1:
l = ____________;
la = ___________;
la / l = ____________________________ independent of w; if n is the number of
reflections, then we can write the full path difference as:
ΔL = n*(la-l) = _________________________________ and thus ΔL/L = (1/cos α)-1.
d) Chopper Opening Time
Another contribution is the chopper opening time which leads to a spread in neutron
velocity and thus to flight time differences dt. In order to reach similar
Δt/t = Δv/v as above one needs fast rotating choppers delivering short pulses.
If CH1 releases at t = 0 an arbitrarily sharp pulse of a white beam, then the CH2 delay
T selects a neutron velocity v0 and the CH2 opening time determines Δv/v.
We want again 1µeV energy resolution therefore we need
Δv/v0=Δt/T=______________.
The chopper opening time must then be
ΔtCH2 < 1/2*(1µeV/E0)*/v0 = _____________ [s/m] * L [s].
Mechanically, the chopper opening time is defined as: ΔtCH2 = β / 360 / f, where β is
the chopper window angular opening and β/360 is the duty cycle (which equals the
0.159
4.8 × 10⁻⁴
38
1.26
2.4 × 10⁻⁴
4.8 × 10⁻⁴
w/tan α
w/cos α
1/cos α
(L / l)*(la – l) = L(1/cosα -1)
2.4 × 10⁻⁴
3.8 × 10⁻⁷
38
fraction of neutrons transmitted by the chopper). We see that this condition can be
achieved by increasing the flight path (or by decreasing vn), by increasing the chopper
frequency or by narrowing the chopper window (intensity loss).
Choosing a duty cycle of 0.01 one needs a very long flight path between CH1 and CH2
of L=100m and a high chopper frequency of ________Hz = __________ rpm to reach
1µeV energy resolution.
This condition becomes more restrictive if we consider the finite opening time of the
first chopper as well. Finally, we mention that all the contributions in the primary and
secondary spectrometer have to be added in quadrature:
Δt/t = sqrt[(Δt1/t1)2+(Δt2/t2)
2+.......]
Additional choppers are usually needed to avoid frame overlap and harmonics, which
reduces the intensity further. To achieve a 1µeV energy resolution by TOF is
technically demanding (choppers), expensive (guides) and low in flux. Thus TOF-
chopper-instruments have typically energy resolutions > 10 µeV. ex.: IN5 at 6.3Å has
roughly 40 µeV energy resolution.
Increasing λ helps but reduces the maximum Q. Calculate the elastic Q for 3Å, 6Å and
15Å neutrons, assuming a maximum scattering angle of 140°:
Q = _______________ = ______ Å-1
, _______ Å
-1 and ________. Å
-1
I2. - Backscattering spectroscopy
Reactor backscattering spectrometers are based on perfect crystal optics. High energy
resolution is achieved by choosing Bragg angles Θ as close as possible to 90°. Two
major terms determine then the energy resolution: the spread in lattice spacing Δd/d of
the monochromator and the angular deviation ε from backscattering direction (the
latter includes the beam divergence α if considered as ε = α/2).
Write down the Bragg equation (neglecting higher orders): ___________________ or
equivalently using k=2π/λ and τ = 2π/d (reciprocal lattice vector of the Bragg
reflection): _________________.
Deduce the wavelength resolution Δλ/λ by differentiating the Bragg equation:
Δλ =________________ + _________________ and thus
Δλ/λ = ____________ +_____________ , or equivalently:
Δk=________________ + _________________________ and thus
Δk/k= _____________ + _____________.
4π sinθ / λ
3.94
1.97
0.98
λ = 2d sinθ
k = τ / (2 sinθ)
2 sinθ.Δd
2d cosθ.Δθ
Δd / d cotθ.Δθ
Δτ / (2 sinθ) {τ / (2 sin
2 θ)}cosθ.Δθ
Δτ / τ
cotθ.Δθ
263
15790

39
The energy resolution is given by two terms. The first one, Δd/d =Δτ/τ , can be
calculated by dynamical scattering theory as Δτ/τ = h2/m 4 Fτ Nc, where Fτ is the
structure factor of the reflection used and Nc the number density of atoms in the unit
cell. The second one, the angular deviation, can for θ ≈ 90° be expanded in powers of
θ and contributes approximately as Δλ/λ ~ Δθ2/4 (Δθ in radians).
Calculate now the contribution to the energy resolution of both terms for a perfect
crystal Si(111) monochromator (6.271Å, but approximate by 6.3Å as above).
With Fτ=(111) and Nc for Si(111) the extinction contribution for Si(111) in backscattering
is Δd/d=1.86 10-5
and thus ΔE/E=______________ and ΔE=_______µeV.
Estimate the energy resolution contribution due to deviation from backscattering:
1) given by a sample diameter of 4 cm in 2 m distance from the analyser.
ΔE/E=_____________, ΔE=_______µeV
2) given by this sample at 1m distance:
ΔE/E=_____________, ΔE=_______µeV
3) given by a detector being placed near backscattering, a sample - analyser distance of
1m and the distance sample center - detector center = 10cm below the scattering plane;
the focus of the analyser sphere is placed in the middle between sample and detector:
ΔE/E= ____________. ΔE=_______µeV
These examples show that for small enough deviations from BS energy resolutions of
< 1µeV are easily achievable. Comparing this to TOF contributions above, it becomes
clear that for a spallation source backscattering instrument, which combines TOF in the
primary spectrometer with near-BS in the secondary spectrometer, it is very difficult to
achieve sub-µeV resolution. The SNS backscattering (BASIS) instrument with 80m
flight path has for example an energy resolution for Si(111) of 2.5 µeV.
I3. - Neutron spin-echo spectroscopy
In neutron spin echo one uses the neutron spin which undergoes precessions in a
magnetic field B. The precession angle φ after a path length L depends on the field
integral, given by φ =γ*B*L/vn (γ = gyromagnetic ratio of the neutron, vn=neutron
speed). For a polychromatic beam the precession angles of the neutron spins will be
very different depending on the neutron speed and thus a previously polarized beam
becomes depolarized. The trick is then to send the neutrons after the sample through a
field with opposite sign and with the same field integral. Therefore, for elastic
scattering, the precessions are “turned backwards”, again depending on the neutron
velocity, and the full polarization is recovered. This allows the use of a wide
3.46×10⁻⁵
0.07
5 × 10⁻⁵
0.1
2 × 10⁻⁵
0.42
1.25 × 10⁻³
2.6
40
wavelength band (range of incident neutron speeds) and therefore a high intensity
which is „decoupled‟ from the energy resolution.
In order to estimate a typically achievable energy resolution, we can calculate the
longest time which is easily accessible in NSE.
The NSE time is given by: tNSE= ħγ BL / (mn vn3) thus it is proportional to the largest
achievable field integral B*L, which we take as 0.25 [T*m].
Calculate the longest NSE time tNSE for λ=6.3Å neutrons (use vn calculated above),
knowing that γ = 1.832 108 [T
-1 s
-1] , ħ= 1.054*10
-34 J s; and mn= 1.675*10
-27 kg:
tNSE = __________ ns.
Convert this time into an energy by multiplying its reciprocal value with
h=4.136 µeV ns; we get: ENSE= ________ µeV.
For comparing measurements in time and in energy one often refers to Fourier-
transformation which relates e.g. the characteristic relaxation time τ of an exponential
relaxation in time to the width of a Lorentzian function in energy by τ = 1/ω. In spite of
the fact that the relaxation time is usually smaller than the longest NSE time,
converting the corresponding energy resolution by this relation gives:
E τ = ____________ µeV .
Because of τ < tNSE and also because energy spectrometers can usually resolve better
than the HWHM, the comparable resolution energy lies somewhere in between the two
values calculated.
Note that the longest NSE time depends on wavelength λ as tNSE _____. Thus the
resolution improves fast for increasing λ, but like calculated for the other spectrometers
above, the maximum Q is reduced.
11.7
0.35
0.056
λ3