6.7 wood · 2005-07-27 · 1994. ansi, “american national standards for wood products –...
TRANSCRIPT

6.7 WOOD by Staff, Forest Products Laboratory, USDA Forest Service. Prepared under the direction of David W. Green.
(Note: This section was written and compiled by U.S. government employees on official time. It is, therefore, in the public domain and not subject to copyright. )
REFERENCES Freas and Selbo. Fabrication and Design of Glued Laminated Wood Structural Members. U.S. Dept. Agr. Tech. Bull. no. 1069, 1954. Hunt and Garratt. “Wood Preservation.” McGraw-Hill. “Wood Handbook.” U.S. Dept. Agr. Handbook, “Design Properties of Round, Sawn and Laminated Preservatively Treated Construction Poles as Posts.” ASAE Eng. Practice EP 388.2. American Society of Agricultural Engineering Standards, AF&PA, “National Design Specification for Wood Construction,” American Forest & Paper Association. Washington, 1994. AITC. “Recommended Practice tor Protection of Structural Glued Laminated Timber during Transit, Storage and Erection,” AITC III. American Institute of Timber Construction, Englewood, CO. 1994, AITC. “Laminated Timber Design Guide.” American Institute of Timber Construction, Englewood, CO. 1994. AITC. “Timber Construction Manual.” Wiley, New York, 1994. ANSI, “American National Standards for Wood Products – Structural Glued Laminated Timber.” ANSI/AITC A190.1-1992. Amencan National Standards Institute. New York, 1992. ASTM, “Annual Book of Standards.” vol. 04.09, “Wood.” American Society for Testing and Materials, Philadelphia, PA. 1993: “Standard Terminology Relating to Wood.” ASTM D9; “Standard Practice for Establishing Structural Grades and Related Allowable Properties for Visually Graded Dimension Lumber.” ASTM D245; “Standard Definitions of Terms Relating to Veneer and Plywood.” ASTM D1038; “Standard Nomenclature of Domestic Hardwoods and Softwoods.” ASTM D1165; “Standard Practice lor Establishing Allowable Properties for Visually Graded Dimension Lumber from In-Grade Tests of Full Size Specimens.” ASTM D1990; “Standard Methods for Establishing Clear Wood Strength Values.” ASTM D2555; “Standad Practice for Evaluating Allowable Properties of Grades of Structural Lumber.” ASTM D2915; “Standard Test Methods for Mechanical Properties of Lumber and Wood Based Structural Material.” ASTM D4761; “Standard Test Method for Surface
Burning Characteristics of Building Materials.” ASTM E84; “Standard Test Methods for Fire Tests of Building Construction and Materials.” ASTM E119. ASTM. "Annual Book of Standards.” vol. 04.10. American Society for Testing and Materials. Philadelphia. PA. 1995: “Standard Method for Establishing De-sign Stresses for Round Timber Piles,” ASTM D2899; “Standard Practice for Establishing Stress Grades tor Structural Members Used in Log Buildings.” ASTM D3957; “Standard Practice for Establishing Stresses for Structural Glued Laminated Timber.” ASTM D3737; “Standard Specification for Evaluation of Structural Composite Lumber Products.” ASTM D5456. AWPA, “Book of Standards,” American Wood Preserver’s Association, Stubensville, MD, 1994 American Wood Systems. “Span tables for glulam timber.” APA-EWS, Tacoma WA, 1994. Cassens and Feist, Exterior Wood in the South– Selection. Applications, and Finishes, Gen. Tech. Rep. FPL-GTR-69. USDA Forest Service, Forest Products Laboratory, Madison, WI, 1991. Chudnoff, Tropical Timbers of the World. Agric. Handb. no. 607, 1984. Forest Products Laboratory, Wood Handbook: Wood as an Engineering Material, Agric. Handb., no. 72. rev., 1987. Green, Moisture Content and the Shrinkage of Lumber. Res. Pap. FPL-RP-489, USDA Forest Service, Forest Products Laboratory, Madison, WI, 1989. Green and Kretschmann, Moisture Content and the Properties of Clear Southern Pine, Res. Pap. FPL-RP-531, USDA Forest Service, Forest Products Laboratory, Madison, WI, 1995. James, Dielectric Properties of Wood and Hardboard: Variation with Temperature, Frequency, Moisture Content, and Grain Orientation. Res. Pap. FPL-RP-245, USDA Forest Service, Forest Products Laboratory, Madison, WI, 1975. James, Electric Moisture Meters for Wood, Gen. Tech. Rep. FPL-GTR-6, USDA Forest Service, Forest Products Laboratory, Madison. WI. 1988. MacLean, Thermal Conductivity of Wood, Heat, Piping Air Cond., 13. no. 6, 1941, pp. 380-391. NFPA, “Design Values for Wood Construction: A Supplement to the

PHYSICAL AND MECHANICAL PROPERTIES OF CLEAR WOOD 6-113
National Design Specifications,” National Forest Products Association, Washington, 1991, Ross and Pellerin, Nondestructive Testing for Assessing Wood Members in Structures: A Review, Gen. Tech. Rep. FPL-GTR-70, USDA Forest Service, Forest Products Laboratory, Madison, WI, 1994, TenWolde et al., “Thermal Properties of Wood and Wood Panel Products for Use in Buildings,” ORNL/Sub/87-21697/1, Oak Ridge National Laboratory, Oak Ridge, TN, 1988. Weatherwax and Stamm. The Coefficients of Thermal Expansion of Wood and Wood Products, Trans. ASME, 69, no. 44, 1947, pp. 421-432. Wilkes, Thermo-Physical Properties Data Base Activities at Owens-Corning Fiberglas, in “Thermal Performance of the Exterior Envelopes of Buildings,” ASHRAE SP 28. American Society of Heating, Refrigerating, and Air-Conditioning Engineers. Atlanta,1981.
COMPOSITION, STRUCTURE, AND NOMENCLATURE by David W. Green
Wood is a naturally formed organic material consisting essentially of elongated tubular elements called cells arranged in a parallel manner for the most part. These cells vary in dimensions and wall thickness with position in the tree, age, conditions of growth, and kind of tree. The walls of the cells are formed principally of chain molecules of cellulose, Polmerized from glucose residues and oriented as a partly crystalline material. These chains are aggregated in the cell wall at a variable angle, roughly parallel to the axis of the cell. The cells are cemented by an amorphous material called lignin. The complex structure of the gross wood approximates a rhombic system. The direction parallel to the grain and the axis of the stem is logitudinal (L), the two axes across the grain are radial (R) and tangential (T) with respect to the cylinder of the tree stem. This anisotropy and the molecular orientation account for the major differences in physical and mechanical properties with respect to direction which are present in wood.
Natural variability of any given physical measurement in wood approximates the normal probability curve. It is traceable to the differences in the growth of individual samples and at present cannot be controlled. For engineering purposes, statistical evaluation is employed for determination of safe working limits.
Lumber is classified as hardwood, which is produced by the broad-level trees (angiosperms), such as oak, maple, ash; and softwood, the product of coniferous trees (gymnosperms ), such as pines, larch, spruce, hemlock. the terms “hard” and “soft” have no relation to actual hardness of the wood. Sapwood is the living wood of pale color on the outside of the stem. Heartwood is the inner core of physiologically inactive wood in a tree and is usually darker in color, somewhat heavier, due to infiltrated material, and more decay-resistant than the sapwood. Other terms relating to wood, veneer, and plywood are defined in ASTM D9, D1038 and the “Wood Handbook.”
Standard nomenclature of lumber is based on commercial practice which groups woods of similar technical qualities but separate botanical identities under a single name. For listings of domestic hardwoods and softwoods see ASTM D1165 and the “Wood Handbook.”
The chemical composition of woody cell walls is generally about 40 to 50 percent cellulose, 15 to 35 percent lignin, less than 1 percent mineral, 20 to 35 percent hemicellulose, and the remainder extractable matter of a variety of sorts. Softwoods and hardwoods have about the same cellu losecontent.
PHYSICAL AND MECHANICAL PROPERTIES OF CLEAR WOOD by David Green, Robert White, Anton TenWolde, William Simpson, Joseph Muirphy, and Robert Ross
Moisture Relations Wood is a hygroscopic material which contains water in varying amounts, depending upon the relative humidity and temperature of the surrounding atmosphere. Equilibrium conditions are established as shown in Table 6.7.1. The standard reference condition for wood is oven-dry weight, which is determined by drying at 100 to 105°C until there is no significant change in weight.
Moisture content is the amount of water contained in the wood, usually expressed as a percentage of the mass of the oven-dry wood. Mois
ture can exist in wood as free water in the cell cavities, as well as water bound chemically within the intermolecular regions of the cell wall. The moisture content at which cell walls are completely saturated but at which no water exists in the cell cavities is called the fiber saturation point. Below the fiber saturation point, the cell wall shrinks as moisture is removed, and the physical and mechanical properties begin to change as a function of moisture content. Air-dry wood has a moisture content of 12 to 15 percent. Green wood is wood with a moisture content above the fiber saturation point. The moisture content of green wood typically ranges from 40 to 250 percent.
Dimensional Changes
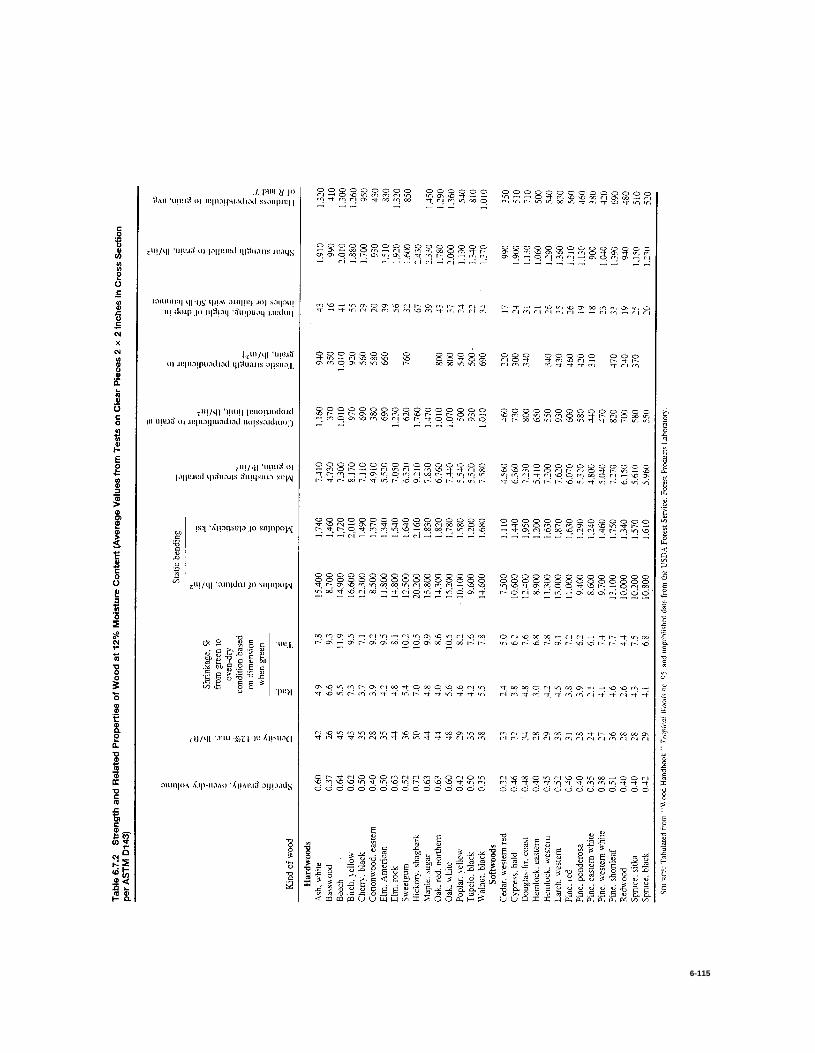
Shrinkage or swelling is a result of change in water content within the cell wall. Wood is dimensionally stable when the moisture content is above the fiber saturation point (about 28 percent for shrinkage estimates). Shrinkage is expressed as a percentage of the dimensional change based on the green wood size. Wood is an anisotropic material with respect to shrinkage. Logitudinal shrinkage (along the grain) ranges from 0.1 to 0.3 percent as the wood dries from green to oven-dry and is usually neglected. Wood shrinks most in the direction of the annual growth rings (tangential shrinkage) and about half as much across the rings (radial shrinkage). Average shrinkage values for a number of commercially important species are shown in Table 6.7.2. Shrinkage to any moisture condition can be estimated by assuming that the change is linear from green to oven-dry and that about half occurs in drying to 12 percent.
Swelling in polar liquids other than water is inversely related to the size of the molecule of the liquid. It has been shown that the tendency to hydrogen bonding on the dielectric constant is a close, direct indicator of the sewlling power of water-free organic liquids. In general, the strength values for wood swollen in any polar liquid are similar when there is equal swelling in the wood.
Swelling in aqueous solutions of sulfuric and phosphoric acids, zinc chloride, and sodium hydroxide above pH 8 may be as much as 25 percent greater in the transverse direction than in water. The transverse swelling may be accompanied by logitudinal shrinkage up to 5 per-cent. The swelling reflects a chemical change in the cell walls, and the accompanying strength changes are related to the degradation of the cellulose.
Dimensional stabilization of wood cannot be completely attained. Two or three coats of varnish, enamel, or synthetic lacquer may be 50 to 85 percent efficient in preventing short-term dimensional changes. Metal foil embedded in multiple coats of varnish may be 90 to 95 percent efficient in short-term cycling. The best long-term stabilization results from internal bulking of the cell wall by the use of materials such as phenolic resins polymerized in situ or water solutions of polyethylene glycol (PEG) on green wood. The presence of the bulking agents alters the properties of the treated wood. Phenol increases electrical resis tance, hardness, compression strength, weight, and decay resistance but lowers the impact strength. Polyethylene glycol maintains strength values at the green-wood level, reduces electric resistance, and can be finished only with polyurethane resins.
Mechanical Properties
Average mechanical properties determined from tests on clear, straight- grained wood at 12 percent moisture content are given in Table 6.7.2. Approximate standard devation(s) can be estimated from the followiong equation:
s = CX
where X = average value for species for specific gravity for modulus of elasticity for modulus of rupture
C for maximum crushing strength parallel to grain for compression strength perpendicular to grain for tensile strength perpendicular to grain for impact bending strength for shear strength parallel to grain

6-114
6-115

6-116 WOOD
Relatively few data are available on tensile strength parallel to the grain. The modulus of rupture is considered to be a conservative estimate for tensile strength.
Mechanical properties remain constant as long as the moisture con-tent is above the fiber saturation point. Below the fiber saturation point. properties generally increase with decreasing moisture content down to about 8 percent. Below about 8 percent moisture: content, some proper-ties, principally tensile strength parallel to the grain and shear strength. may decrease with further drying. An approximate adjustment for clear wood properties between about 8 percent moisture and green can be obtained by using an annual compound-interest type of formula:
where P1 is the known property at moisture content M1, P2 is the property to be calculated at moisture content M2, and C is the assumed percentage change in property per percentage change in moisture con-tent. Values of P1 at 12 percent moisture content are given in Table 6.7.2, and values of C are given in Table 6.7.3. For the purposes of property adjustment. green is assumed to be 23 percent moisture con-tent. The formula should not be used with redwood and cedars. A more accurate adjustment formula is given in “Wood Handbook.” Additional data and tests on green wood can be found in the “Wood Hand-book.” Data on foreign species are given in “Tropical Timbers of the World.”
Specific Gravity and Density
Specific gravity Gm of wood at a given moisture condition, m, is the ratio of the weight of the oven-dry wood Wo to the weight of water displaced by the sample at the given moisture condition wm.
Gm = Wo/wm
This definition is required because volume and weight we constant only under special conditions. The weight density of wood D (unit weight) at any given moisture content is the weight of oven-dry wood and the contained water divided by the volume of the piece at that same moisture content. Average values for specific gravity oven-dry and weight density at 12 percent moisture content are given in Table 6.7.2. Specific gravity of solid. dry wood substance based on helium displacement is 1.46. or about 91 lb/ft 3.
Conversion of weight density from one moisture condition to another can be accomplished by the following equation (“Standard Handbook for Mechanical Engineers.” 9th ed., McGraw-Hill).
100 + M2D2 = D1 100 + M1 + 0.0135 D1(M 2 - M1)
D1 is the weight density. lb/ft 3. which is known for some moisture condition M1 . D2 is desired weight density at a moisture content M2. Moisture contents M1 and M2 are expressed in percent.
Specific gravity and strength properties vary directly in an exponential relationship S = KGn. Table 6.7.3 gives values of K and the exponent n for various strength properties. The equation is based on more than 160 kinds of wood and yields estimated average values for wood in general. This relationship is the best general index to the quality of defect-free wood.
Load Direction and Relation to Grain of Wood
All strength properties vary with the orthotropic axes of the wood in a manner which is approximated by the Hankinson’s formula (“Wood Handbook”):
N = PQ P sin2 q + Q cos2 q
where N = allowable stress induced by a load acting at M angle to the grain direction. lb/in2: P = allowable stress parallel to the grain, lb/in2: Q = allowable stress perpendicular to the grain. lb/in2: and q = angle between direction of load and direction of grain.
The deviation of the grain from the long axis of the member to which the load is applied is known as the slope of grain and is determined by measuring the length of run in inches along the axis for a 1-in deviation of the grain from the axis. The effect of grain slope on the important strength properties is shown by Table 6.7.4.
Rheological Properties
Wood exhibits viscoelastic characteristics. When first loaded. a wood member deforms elastically. If the load is maintained. additional time-dependent deformation occurs. Because of this time-dependent relation. the rate of loading is an important factor to consider in the testing and use of wood. For example. the load required to produce failure in 1 s is approximately 10 percent higher than that obtained in a standard 5-min strength test. Impact and dynamic measures of elasticity of small specimens are about 10 percent higher than those for static measures. Impact strengths are also affected by this relationship. In the impact bending test. a 50-lb (23-kg) hammer is dropped upon a beam from increasing heights until complete rupture occurs. The maximum height. as shown in Table 6.7.2, is for comparative purposes only.
When solid material is strained, some mechanical energy is dissipated as heat. Internal friction is the term used to denote the mechanism that causes this energy dissipation. The internal friction of wood is a complex function of temperature and moisture content. Tho value of internal friction, expressed by logarithmic decrement. ranges from 0.1 for hot, moist wood to less than 0.02 for hot, dry wood. Cool wood. regardless of moisture content. has an intermediate value.
The term fatigue in engineering is defined as progressive damage that occurs in a material subjected to cyclic loading. Fatigue life is a term used to define the number of cycles sustained before failure. Re-searchers at the Forest Products Laboratory of the USDA Forest Service have found that small cantilever bending specimens subjected to fully reversed stresses. at 30 Hz with maximum stress equal to 30 percent of
Table 6.7.3 Functions Relating Mechanical Properties to Specific Gravity and Moisture Content of Clear, Straight-Grained Wood
Specific gravity -strength relation* Green wood Wood at 12% moisture content
Changefor 1% change
in moisture Property Softwood Hardwood Softwood Hardwood content. %
Static bendingModulus of elasticity (10 6 lb/in2 ) Modulus of rupture ( lb/in 2)
2.331G 0.76 2.02G 0.72 2.966 G 0.84 2.39G 0.70
15.889G 1.01 17.209G 1.16 24.763G 1.01 24.850 G 1.13 2.0 5
Maximum crushing strength parallel to grain 7.207G 0.94 7.111 G 1.11 13.592G 0.97 11.033G 0.89 6.5 (lb/in 2)
Shear parallel to grain (lb/in2 ) 1.585 G 0.73 2.576G1.24 2.414G 0.85 3.174G1.13 4.0 Compression perpendicular to grain at pro- 1.360 G 1.60 2.678G 2.48 2.393G 1.57 3.128G2.09 6.5
portionallimit (lb/in 2)Hardness perpendicular to grain (lb) 1.399 G1.41 3.721 G2.31 1.931G 1.50 3.438G2.10 3.0
* The properties and values should be read as equation,: e.g., modulus of rupture for geen wood of softwoods = 15.889G1.01 , where G represents the specific gravity of wood, based on the oven-dry weight and the volume at the moisture condition indicated.

PHYSICAL AND MECHANICAL PROPERTIES OF CLEAR WOOD 6-117
Table 6.7.4 Strength of Wood Members with Various Grain Slopes as Percentages of Straight-Grained Members
Impact bending;
drop height to failure
(50-lb hammer),
%
Maximum crushing strength parallel to grain,
%
Static bending
Modulus of rupture,
%
Modulus of elasticity,
% Maximum slope of grain in member
Straight-grained 100 100 100 100 1 in 25 96 97 95 100 1 in 20 93 96 90 100 1 in 15 89 94 81 100 1 in 10 81 89 62 99 1 in 5 55 67 36 93
SOURCE “Wood Handbook”
estimated static strength and at 12 percent moisture content and 75°F (24°C), have a fatigue life of approximately 30 million cycles.
Thermal Properties The coefficients of thermal expansion in wood vary with the structural axes. According to Weatherwax and Stamm (Trans, ASTME, 69, 1947, p. 421), the longitudinal coefficient for the temperature range + 150°C to – 50°C averages 3.39 × 10 6/°C and is independent of specific gravity. Across the grain, for an average specific gravity oven-dry of 0.46, the radial coefficient ar is 25.7 × 10 6/°C and the tangential af
is 34.8 × 10 6/°C. Both ar and af vary with specific gravity approximately to the first power. Thermal expansions are usually overshadowed by the larger dimensional changes due to moisture.
Thermal conductivity of wood varies principally with the direction of heat with respect to the grain. Approximate transverse conductivity can be calculated with a linear equation of the form
k = G(B + CM) + A
where G is specific gravity, based on oven-dry weight and volume at a given moisture content M percent, for specific gravities above 0.3, temperatures around 75°F (24°C), and moisture contents below 25 per-cent, the values of constants, A, B, and C are A = 0.129, B = 1.34, and C = 0.028 in English units, with k in Btu · in/(h · ft2 · °F) (TenWolde et al., 1988). Conductivity in watts per meter per kelvin is obtained by multiplying the result by 0.144. The effect of temperature on thermal conductivity is relatively minor and increases about 1 to 2 percent per 10°F (2 to 3 percent per 10°C). Longitudinal conductivity is considerably greater than transverse conductivity, but reported values vary widely. It has been reported as 1.5 to 2.8 times larger than transverse conductivity, with an average of about 1.8.
Specific heat of wood is virtually independent of specific gravity and varies principally with temperature and moisture content. Wilkes found that the approximate specific heat of dry wood can be calculated with
where a0 = 0.26 and a1 = 0.000513 for English units (specific heat in Btu per pound per degree Fahrenheit and temperature in degrees Fahrenheit) or a0 = 0.103 and a1 = 0.00387 for S1 units | specific heat in kJ/(kg · K) and temperature in kelvins |. The specific heat of moist wood can be derived from
where cp,w is the specific heat of water (1 Btu/lb · °F). or 4.186 kJ/ (kg · K), M is the moisture content (percent), and A is a correction factor, given by
with b1 = – 4.23 × 10 4, b2 = 3.12 × 10 5, and b3 = – 3.17 × 10 5 in English units, and b1 = – 0.06191, b2 = 2.36 × 10 4, and b3 =
- 1.33 × 10 –4 in SI units. These formulas are valid for wood below fiber saturation at temperatures between 45°F (7°C:) and 297°F (147°C). 7' is the temperature at which cp0 is desired.
The fuel value of wood depends primarily upon its dry density, moisture content, and chemical composition. Moisture in wood decreases the fuel value as a result of latent heat absorption of water vaporization. An approximate relation for the fuel value of moist wood (Btu per pound on wet weight basis)(2,326 Btu/lb = 1 J/kg) is
where HD is higher fuel value of dry wood, averaging 8,500 Btu/lb for hardwoods and 9,000 Btu/lb for conifers, and u is the moisture content in percent. The actual fuel value of moist wood in a furnace will be less since water vapor interferes with the combustion process and prevents the combustion of pyrolytic gases. (See Sec. 7 for fuel values and Sec. 4 for combustion.)
Wood undergoes thermal degradation to volatile gases and char when it is exposed to elevated temperature. When wood is directly exposed to the standard fire exposure of ASTM E 199, the char rate is generally considered to be 1½ in/h (38 mm/h). The temperature at the base of the char layer is approximately 550°F (300°C). Among other factors, the ignition of wood depends on the intensity and duration of exposure to elevated temperatures. Typical values for rapid ignition are 570 to 750°F (300 to 400°C). In terms of heat flux, a surface exposure to 1.1 Btu/ft2 (13 kW/m2 ) per second is considered sufficient to obtain piloted ignition. Recommended “maximum safe working temperatures” for wood exposed for prolonged periods range from 150 to 212°F (65 to 100°C). Flame spread values as determined by ASTM E 84 generally range from 65 to 200 for nominal 1-in- (25-mm-) thick lumber. Flame spread can be reduced by impregnating the wood with fire-retardant chemicals or applying a fire-retardant coating.
The reversible effect of temperature on the properties of wood is a function of the change in temperature, moisture content of the wood, duration of heating, and property being considered. In general, the mechanical properties of wood decrease when the wood is heated above normal temperatures until increase when it is cooled. The magnitude of the change is greater for green wood than for dry. When wood is frozen, the change in property is reversible; i.e., the property will return to the value at the initial temperature. At a constant moisture content and below about 150°F (65°C), mechanical properties are approximately linearly related to temperature. The change in property is also reversible if the wood is heated for a short time at temperatures below about 150°F. Table 6.7.5 lists the changes in properties at – 58°F ( – 50°C) and 122°F (50°C) relative to those at 68°F (20°C).
Permanent loss in properties occurs when wood is exposed to higher temperatures for prolonged periods and then is cooled and tested at normal temperatures. If the wood is tested at a higher temperature after prolonged exposure, the actual strength loss is the sum of the reversible and permanent losses in properties. Permanent losses are higher for

6-118 WOOD
Table 6.7.5 Approximate Middle-Trend Effects of Temperature on Mechanical Properties of Clear Wood at Various Moisture Conditions
Relative change in mechanical property
Moisture from 68°F, %
Property condition At – 58°F At + 122°F
Modulus of elasticity parallel to grain
Modulus of rupture
0 + 11 – 6 I2 + 17 – 7
> FSP* + 50 – <4 + 18 – 10
11-15 + 35 – 20 18-20 + 60 – 25
> FSP* + 110 – 25 Tensile strength parallel to grain 0–12 – – 4 Compressive strength parallel IO grain 0 + 20 – 10
12–45 + 50 – 25 > FSP* – – 25Shear strength parallel to grain
Compressive strength perpendicular to grain at 0-6 – proportional limit 210 –
– 20 – 35
* Moisture content higher than the fiber saturation point (FSP). TC = (TF – 32) 0.55.
heating in steam than in water, and higher when heated in water than when heated in air. Repeated exposure to elevated temperatures is assumed to have a cumulative effect on wood properties. For example. at a given temperature the property loss will he about the same after six exposures of 1 - year duration as it would be after a single exposure of 6 years. Figure 6.7.1 illustrates the effect of heating at 150°F (65°C) at 12 percent moisture content on the modulus of rupture relative to the strength at normal temperatures for two grades of spruce-pine-fir and clear southern pine. Over the 3-year period, there was little or no change in the modulus of elasticity.
Fig. 6.7.1 Permanent loss in bending strength at 12 percent moisture content. Specimens exposed at 150 F 165°C) and tested at 68°F (20°C). SPF = spruce/ pine/fir.
Electrical Properties
The important electrical properties of wood are conductivity (or resistivity ). dielectric constant and dielectric power factor (see James. 1988).
Resistivity approximately doubles for each 10°C decrease in temperature. As moisture content increases from zero to the fiber saturation point (FSP), the resistivity decreases by 1010 to 1013 times in an approximately linear relationship between the logarithm of each. The resistivity is about 1014 to 1016 W · m for oven-dry wood and 103 to 104 W · m for wood at FSP. As the moisture content increases up to complete saturation. the decrease in resistivity is a factor of only about 50. Wood species also affect resistivity (see James). and the resistivity perpendicular to the grain is about twice that parallel to the grain. Water-soluble
salts (some preservatives and fire-retardants) reduce resistivity by only a minor amount when the wood has 8 percent moisture content or less. but they have a much larger effect when moisture content exceeds 10 to I2 percent.
The dielectric constant of oven-dry wood ranges from about 2 to 5 at room temperature. and it decreases slowly with increasing frequency. The dielectric constant increases as either temperature or moisture con-tent increases. There is a negative interaction between moisture and frequency: At 20 Hz, the dielectric constant may range from about 4 for dry wood to 106 for wet wood: at 1 kHz, from 4 dry to 5,000 wet; and at 1 MHz, from about 3 dry to 100 wet. The dielectric constant is about 30 percent greater parallel to the grain than perpendicular to it.
The power factor of wood varies from about 0.01 for dry. low-density woods to as great as 0.95 for wet. high-density woods. It is usually greater parallel to the grain than perpendicular. The power factor is affected by complex interactions of frequency. moisture content. and temperature (James, 1975).
The change in electrical properties of wood with moisture content has led to the development of moisture meters for nondestructive estimation of moisture content. Resistance-type meters measure resistance be-tween two pins driven into the wood. Dielectric-type meters depend on the correlation between moisture content and either dielectric constant or power factor, and they require only contact with the wood surface, not penetration.
WoodinRelationtoSound
The transmission of sound and vibrational properties in wood are functions of the grain angle. The speed of sound transmission is described by the expression v = E/p, in which v is the speed of sound in wood, in/s, E is the dynamic Young's modulus. lb/in2, and p is the density of the wood, slugs/in3 (Ross and Pellerin, 1994). Various factors influence the speed of sound transmission; two of the most important factors are grain angle and the presence of degradation from decay. Hankinson's formula. cited previously. adequately describes the relationship between speed of sound transmission and grain angle. The dynamic modulus is about 10 percent higher than the static value and varies inversely with moisture changes by approximately 1.3 percent for each percentage change in moisture content.
Degradation from biological agents can significantly alter the speed at which sound travels in wood. Speed of sound transmission values are greatly reduced in severely degraded wood members. Sound transmission characteristics of wood products are used in one form of nondestructive testing to assess the performance characteristics of wood products. Because speed of sound transmission is a function of the extent of degradation from decay. this technique is used to estimate the extent of severe degradation in large timbers.

PROPERTIES OF LUMBER PRODUCTS 6-119
PROPERTIES OF LUMBER PRODUCTS by Russell Moody and David Green
Visually Graded Structural Lumber
Stress-graded structural lumber is produced under two systems: visual grading and machine grading. Visual structural grading is the oldest stress grading system. It is based on the premise that the mechanical properties of lumber differ from those of clear wood because many growth characteristics of lumber affect its properties; these characteristics can be seen and judged by eye (ASTM D245). The principal growth features affecting lumber properties are the size and location of knots, sloping grain, and density.
Grading rules for lumber nominally 2 × 4 in (standard 38 × 89 mm) thick ( dimension lumber ) are published by grading agencies (listing and addresses arc given in “National Design Specification,” American Forest & Paper Association, 1992 and later). For most species, allow-able properties are based on test results from full-size specimens graded by agency rules, sampled according to ASTM D2915, and tested according to ASTM D4761. Procedures for deriving allowable properties from these tests are given in ASTM D 1990. Allowable properties for visually graded hardwoods and a few softwoods are derived from clear-wood data following principles given in ASTM D2555. Derivation of the allowable strength properties accounts for within-species variability by starting with a nonparametric estimate of the 5th percentile of the data. Thus, 95 of 100 pieces would be expected to be stronger than the
assigned propetty. The allowable strength properties are based on an assumed normal duration of load of 10 years. Tables 6.7.6 and 6.7.7 show the grades and allowable properties for the four most commonly used species groupings sold in the United States. The allowable strength values in bending, tension, shear, and compression parallel to the grain can be multiplied by factors for other load durations. Some commonly used factors are 0.90 for permanent (50-year) loading, 1.15 for snow loads (2 months), and 1.6 for wind/earthquake loading (10 min). The most recent edition of “National Design Specification” should be consulted for updated property values and for property values for other species and size classifications.
Allowable properties are assigned to visually graded dimension lumber at two moisture content levels: green adn 19 percent maximum moisture content (assumed 15 percent average moisture content). Be-cause of the influence of knots and other growth characteristics on lumber properties, the effect of moisture content on lumber properties is generally less than its effect on clear wood. The CM factors of Table 6.7.8 are for adjusting the properties in Tables 6.7.6 adn 6.7.7 from 15 percent moisture content to green. the Annex of ASTM D1990 provides formulas that can be used to adjust lumber properties to any moisture content between green adn 10 percent. Below about 8 percent moisture content, some properties may decrease with decreasing values, and care should be exercised in these situations (Green adn Kretschmann, 1995).
Shrinkage in commercial lumber differs from that in clear wood pri-
Table 6.7.6 Base Design Values for Visually Graded Dimension Lumber* (Tabulated design values are for normal load duration and dry service conditions.)
Design values, (lb/in 2 )
Tension Shear compression Compression Modulus
Species and Size Bending parallel to grain
parallel to grain
perpendicular to grain
parallel to grain
of elasticity
Gradingrules
commercial grade classification, in Fb Ft Fv Fc 1 Fc E agency
Select Structural 1,000 1,000 95 625 1,700 1,900,000 No. 1 and better 2–4 thick 1,150 175 95 625 1,500 1,800,000 No. 1 1,000 675 95 625 1,450 1,700,000 No. 2 2 and wider 875 575 95 625 1,300 1,000,000 No. 3 500 325 95 625 750 1,400,000 WCLIB Stud 675 450 95 625 825 1,400,000 WWPA Construction 2 – 4 thick 1,000 650 95 625 1,600 1,500,000 Standard 550 375 95 625 1,350 1,400,000 Utility 2 – 4 wide 275 175 95 625 875 1,300,000
Hem-Fir
Select structural 1,400 900 75 405 1,500 1,600,000 No. 1 and better 2 – 4 thick 1,050 700 75 405 1,350 1,500,000 No. 1 950 000 75 405 1,300 1,500,000 No. 2 No.3 Stud
2 and wider 850 500 075
500 300 400
75 75 75
405 405 405
1,250 725 800
1,300,000 1,200,000 1,200,000
WCLIB WWPA
Construction 2 – 4 thick 075 575 75 405 1,500 1,300,000 Standard 550 325 75 405 1,300 1,200,000 Utility 2 – 4 wide 250 150 75 405 850 1,100,000
Spruce-Pine-Fir
Select structural 2 – 4 thick 1,250 675 70 425 1,400 1,500,000 No. 1 – No. 2 875 425 70 425 110 1,400,000 No. 3 2 and wider 500 250 70 425 625 1,200,000 Stud Construction 2-4 thick
675 975
325 475
70 70
425 425
675 1,350
1,200,000 1,300,000
NLGA
Standard Utility 2-4 wide
550 250
275 I25
70 70
42.5 425
1,100 725
1,200,000 1,100,000
* Lumber dimensions – Tabulated design values are applicable tgo lumber that will be used under dry conditions such as in most covered structures. For 2- to 4-in-thick lumber, the DRY dressed sizes shall be used regardless of the misture content at the time of manufacture or use. In calculating design values, the natural gain in strength and stiffness that occurs as lumber dries has been taken into consideration as well as the reduction in size that occurs when unseasoned lumber shrinks. The gain in load-carrying capacity due to increased strength and stiffness resulting from drying more than offsets the design effect of size reductions due to shrinkage. Size factor CF, repetitive-member factor Cr, flat-use factor Cfu, and wet-use factor CM are given in Table 6.7.8.
SOURCE: Table used by permission of the American Forest & Paper Association.

6-120 WOOD
Table 6.7.7 Design Values for Visually Graded Southern Pine Dimension Lumber* (Tabulated design values are for normal load duration and dry service conditions.)
Select structural
No. 1 nondense No. 2 dense No. 2 No. 3 nondense No. 3 Stud
Dense select structural Select Nondense No. 1 dense No. 1 No. 1 nondense No No. 2 No. 2 nondense No. 3
Dense select structural Select Nondense select structural No. 1 dense No. 1 No. 1 nondense No. 2 dense No. 2 No. 2 nondense No. 3
Dense select structural Select Nondense No. 1 dense No. 1 No. 1 nondense No. 2 dense No. 1 No. 2 nondense
Species and commercial grade
Dense select structural Select structural Nondense select structural No. 1 dense No. 1 No. 1 nondense No. 2 dense No. 2 NO. 2 nondense No. 3 Stud
Construction Standard Utility
Dense select structural
Nondense select structural No. 1 dense No. 1
structural select structural
2 dense
Size
2 – 4 thick
2 – 4 wide
classification, in
2 – 4 thick
4 wide
2–4 thick
5–6 wide
2 – 4 thick
8 wide
2–4 thick structural
10 wide
2 – 4 thick
12 wide structural
select structural
No. 3
Design values. lb/in2
Tension Shear Compression Compression Modulus parallel ofparallel parallel perpendicular
Bending to grain to grain to grain Fb Ft Fv Fc^
to grain elasticity Fc E
1,650 100 660 2,250 1,900,000 1,600 I00 565 2,100 1,800,000
2,000 1,100 100 660 2,000 1,800,000
825 90 656 1,650 1,600,000 775 90 480 1,600 1,400,000 475 90 565 975 1,400,000 500 90 565 975 1,400,000
1,100 625 100 565 1,800 1,500,000
300 175 90 565 975 1,300,000
1,500 90 660 2,150 1,900,000 2.550 1,400 90 565 2,000 1,800,000
1,200 90 480 1,850 1,700,000 950 90 660 900 1,800,000 900 90 565 1,750 1,700,000
1,500 800 90 480 1,600 1,600,000 1,150 775 90 660 1,750 1,700,000 1,250 725 90 565 1,600 1,600,000 1,150 675 90 480 1,500 1,400,000
750 425 90 565 925 1,400,000 775 425 90 565 925 1,400,000
2,450 1,350 90 660 2,050 1,900,000 2,300 1,300 90 565 1,900 1,800,000 2,100 1,100 90 480 1,750 1,700,000 1,650 875 90 660 1,800 1,800,000 1,500 825 90 565 1,650 1,700,000 1,350 725 90 480 1,550 1,600,000 1,400 675 90 660 1,700 1,700,000 1,200 650 90 565 1,550 1,600,000 1,100 600 90 480 1,450 1,400,000
700 400 90 565 875 1,400,000
2,050 1,100 90 565 1,850 1,800,000 1,850 950 90 480 1,750 1,700,000 1,450 775 90 660 1,750 1,800,000 1,300 725 90 565 1,600 1,700,000
1,200 625 90 660 1,650 1,700,000 1,050 575 90 565 1,500 1,600,000
950 550 90 480 1,400 1,400,000 600 325 90 565 850 1,400,000
2.050 1,100 90 660 1,950 1,900,000 1,900 1,050 90 565 1,800 1,800,000 1,750 900 90 480 1,700 1,700,000 1,350 725 90 660 1,700 1,800,000 1,250 675 90 565 1,600 1,700,000 1,150 600 90 480 1,500 1,600,000 1,150 575 90 660 1,600 1,700,000
975 550 90 565 1,450 1,600,000 900 525 90 480 1,350 1,400,000 575 325 90 565 825 1,400,000
3.050 2,850 2,650
1,850 1,700 1,700 1,500 1,350
850 875
1,350 100 480 1,950 1,700,000
1,050 100 565 1,850 1,700,000 900 100 480 1,700 1,600,000 875 90 660 1,050 1,700,000
625 350 90 565 1,500 1,300,000
2.700
2.350 1,750 1,650
2,150 1,200 90 660 2,000 1,900,000
1,200 650 90 480 1,500 1,600,000
Grading rules
agency
SPIB
* For size factor CF. appropriate size adjustment factors have already been incorporated in the tabulated design values for most thicknesses of southern pine dimension lumber. Far dimension lumber 4 in-thick, 8 in and wider, tabulated bending design values Fb shall be permitted to be multiplied by the size factor CF = 1.1. For dimension lumber wider than 12 in, tabulated bending, tension, and compression parallel-to-grain design values for 12-in-wide lumber shall be multiplied by the size factor CF = 0.9. Repetitive-member factor Cp. flat-use factor Cfu. and wet-service factor CM are given in Table 6.7.8.
SOURCE: Table used by permission of the American Forest & Paper Association.

PROPERTIES OF LUMBER PRODUCTS 6-121
Table Adjustment Factors
Size factor CF for Table 6.7.6 ( Douglas–Fir–Larch, Hem–Fir, Spruce–Pine–Fir)
Tabulated bending, tension, and compression parallel to grain design values for dimension lumber 2 to 4 inches thick shall be multiplied by the following size factors:
Fb
Thickness, in
Grades Width, in 2 & 3 Ft Fc
Select structural no. 1 and 2, 3, and 4 1.5 1.5 1.5 1.15 better no. 1, no. 2, no. 3 5 1.4 1.4 1.4 1.1
6 1.3 1.3 1.3 1.1 8 1.2 1.3 1.2 1.05
10 1.1 1.2 1.1 1.0 12 1.0 1.1 1.0 1.0
14 and wider 0.9 1.0 0.9 0.9
Stud 2, 3, and 4 1.1 1.1 1.1 1.05 5 and 6 1.0 1.0 1.0 1.0
Construction and standard 2, 3, and 4 1.0 1.0 1.0 1.0
Utility 4 1.0 1.0 1.0 1.0 2 and3 0.4 0.4 0.6
Repetitive-member factor Cr for Tables 6.7.6 and 6.7.7
Bending design values Fb for dimension lumber 2 to 4 in thick shall be multiplied by the repetitive factor Cr = 1.15, when such members are used as joists, truss chords, rafters, studs, planks, decking, or similar members which are in contact or spaced not more than 24 in on centers, are not less than 3 in number and are joined by floor, roof or other load-distributing elements adequate to support the design load.
Flat-use factor Cfu for Tables 6.76 and 6.7.7
Bending design values adjusted by size factors are based on edgewise use (load applied to narrow face). When dimension lumber is used flatwise (load applied to wide face), the bending design value Fb shall also be multiplied by the following flat-use factors:
Thickness, in
Width, in 2 and 3 4
2 and 3 1.0 4 1.1 1.0 5 1.1 1.05 6 1.15 1.05 8 1.15 1.05
10 and wider 1.2 1.1
Wet-use factor CM for Tables 6.7.6 and 6.7.7
When dimension lumber is used where moisture content will exceed 19 percent for an extended period, de-sign values shall be multiplied by the appropriate service factors from the following table:
Fb Ft Fv Fc^ Fc E
0.85* 1.0 0.97 0.67 0.8† 0.9
*When FbCF £ 1150 lb/in2 , CM 1.0 †WhenFcCF £ 750 lb/in2, CM 1.0 SOURCE: Used by permission of the American Forest & Paper Association.
marily because the grain in lumber is seldom oriented in purely radial and tangential directions. Approximate formulas used to estimate shrinkage of lumber for most species are
Sw = 6.031 – 0.215M St = 5.062 – 0.181M
where Sw is the shrinkage across the wide |8-in (203-mm)| face of the lumber in a 2 × 8 (standard 38 × 184 mm), St is the shrinkage across the narrow |2-in (51-mm)| face of the lumber, and M = moisture con-
tent (percent). As with clear wood, shrinkage is assumed to occur below a moisture content of 28 percent. Because extractives make wood less hygroscopic, less shrinkage is expected in redwood, western redcedar, and northern white cedar ( Green, 1989).
The effect of temperature on lumber properties appears to be similar to that on clear wood. For simplicity, “National Design Specification” uses conservative factirs to account for reversible reductions in prooerties as a result of heating to 150°F (65°C) or less (Table 6.7.9). No increase in properties is taken for temperatures colder than normal be-
Table 6.7.9 Temperature Factors Ct for Short-Term Exposure
In-service moisture conditions T £ 100°F 100°F < T £ 125°F 125°F < T £ 150°F
Ct
Design values
Ft, E Green or dry 1.0 0.9 0.9 Fb, Fv, Fc, and Fc ^ £ 19% green 1.0 0.8 0.7
1.0 0.7 0.5
SOURCE: Table used by permission of the American Forest & Paper Association.

6-122 WOOD
Table 6.7.10 Design Values for Mechanically Graded Dimension Lumber (Tabulated design values are for normal load duration and dry service conditions.)
Species and
Design values, lb/in2
Tension Compression commercial grade Size classification, in Bending parallel parallel MOE Grading rules agency
Machine-stress-rated lumber
900f-1.0E 1200f-1.2E
1350f-1.3E 1400f-1.2E 1450f-1.3E
1500f-1.3E 1500f-1.4E 1600f-1.4E 1650f-1.4E 1650f-1.5E 1650f-1.6E
1250f-1.4E
1800f-1.5E 1800f-1.6E 1950f-1.5E 1950f-1.7E 2000f-1.6E 2100f-1.8E
2250f-1.6E 2250f-1.9E 2400f-1.7E 2400f-1.8E 2400f-2.0E 2500f-2.2E
2550f-2.1E 2700f-2.0E 2700f-2.2E 2850f-2.3E 3000f-2.4E 3150f-2.5E 3300f-2.6E
900f-1.2E 1200f-1.5E 1350f-1.8E 1500f-1.8E 1800f-2.1E
2 and less in thickness
2 and wider
900 350 1,050 1,000,000 1,200 600 1,400 1,200,000 1,250 800 1,450 1,400,000 1,350 750 1,600 1,300,000 1,400 800 1,600 1,200,000 1,450
1,500 1,500 1,600 1,650 1,650 1,650
1,800 1,800 1,950 1,950 2,000 2,100
2,250 2,250 2,400 2,400 2,400 2,500
2,550
2,700
3,000 3,150 3,300
2,700
2,850
800
900 900 950
1,020 1,020 1,075
1,300 1,175 1,375 1,375 1,300 1,575
1,750 1,750 1,925 1,925 1,915 1,750
2,050 1,800 2,150 2,300 2,400 2,500 2,650
1,625
1,650 1,650 1,675 1,700 1,700 1,700
1,750 1,750 1,800 1,800 1,825 1,875
1,925 1,925 1,975 1,975 1,975 2,000
2,025 2,100 2,100 2,150 2,200 2,250 2,325
1,300,000
1,300,000 1,400,000 1,400,000 1,400,000 1,500,000 1,600,000
1,500,000 1,600,000 1,500,000 1,700,000 1,600,000 1,800,000
1,600,000 1,900,000 1,700,000 1,800,000 2,000,000 2,200,000
2,100,000 2,000,000 2,200,000 2,300,000 2,400,000 2,500,000 2,600,000
WCLIB NLGA, SPIB, WCLIB, WWPA WCLIB SPIB, WCLIB, WWPA SPIB NLGA, WCLIB, WWPA
SPIB NLGA, SPIB, WCLIB, WWPA SPIB SPIB NLGA, SPIB, WCLIB, WWPA WCLIB
SPIB NLGA, SPIB, WCLIB, WWPA SPIB NLGA, SPIB, WCLIB, WWPA SPIB NLGA, SPIB, WCLIB, WWPA
SPIB NLGA, SPIB, WCLIB, WWPA SPIB SPIB NLGA, SPIB, WCLIB, WWPA WCLIB
NLGA, SPIB, WWPA WCLIB NLGA, SPIB, WCLIB, WWPA SPIB, WWPA NLGA, SPIB SPIB SPIB
NLGA, WCLIB NLGA, WCLIB NLGA WCLIB NLGA, WCLIB
M-10 M-11 M-12 M-13 M-14 M-15 M-16 M-17 M-18 M-19 M-20 M-21 M-22 M-23 M-24 M-25 M-26 M-27
1,600 1,650 1,700 1,700 1,750 1,750 1,750 2,050 1,850 1,850 2,100 1,950 1,950 2,000 2,100 2,100 2,150 2,400
SPIB
2 and less in thickness
6 and wider
2 and less in thickness
2 and wider
900 1,200 1,350 1,500 1,800
350 600 750 900
1,175
1,050 1,400 1,600 1,650 1,750
1,200,000 1,500,000 1,800,000 1,800,000 2,100.000
1,400 1,550 1,600 1,600 1,800 1,800 1,800 1,950 2,000 2,000 2,000 2,300 2,350 2,400 2,700 2,750 2,800 3,000
800 850 850 950
1,000 1,100 1,300 1,300 1,200 1,300 1,600 1,400 1,500 1,900 1,800 2,000 1,800 2,000
Lumber dimensions: Tabulated design values are applicable to lumber that will be used under dry conditions such as in most covered structures. For 2- to 4-in-thick lumber, the dry dressed sizes shall be used regardless of the moisture content at the time of manufacture or use. In calculating design values, natural gain in strength and stiffness that occurs as lumber dries had been taken into consideration as well as reduction in size that occurs when unseasoned lumber shrinks. The gain in load-carrying capacity due to increased strength and stiffness resulting from drying more than offsets the design design of size reductions due to shrinkage. Shear parallel to grain F, and compression perpendicular to grain F : Design values for shear parallel to grain Fc^ and compression perpendicular to grain Fc, are identical to the design values given in Tables 6.7.6 and 6.7.7 for No. 2 visually graded lumber of the appropriate species. When the Fc or Fc^ values shown on the grade stamp differ from the values shown in the tables, the values shown on the grade stamp shall be used for design. Modulus of elasticity E and tension parallel to grain Ft: For any given bending design value Fb, the average modulus of elasticity E and tension parallel to grain F design value may vary depending upon species, timber source, or other variables. The E and Ft values included in the Fb and E grade designations are those usually associated with each Fb level. Grade stamps may show higher or lower values if machine rating indicates the assignment is appropriate. When the E or Ft values shown on a grade stamp differ from the values in Table 6.7.10 the values shown on the grade stamp shall be used for design. The tabulated Fb and F values associated with the designated Fb value shall be used for design.
SOURCE: Table used by permission of the American Forest & Paper Association.

cause in practice it is difficult to ensure that the wood temperature remains consistently low.
Mechanically Graded Structural Lumber
Machine-stress-rated (MSR) lumber and machine-evaluated lumber (MEL) are two types of mechanically graded lumber. The three basic components of both mechanical grading systems are (1) sorting and prediction of strength through machine-measured nondestructive determination of properties coupled with visual assessment of growth characteristics, (2) assignment of allowable properties based upon strength prediction, and (3) quality control to ensure that assigned properties are being obtained. Grade names for MEL lumber start with an M designation. Grade “names” for MSR lumber are a combination of the allowable bending stress and the average modulus of elasticity |e.g., 1650f-1.4E means an allowable bending stress of 1,650 lb/in2 (11.4 MPa) and modulus of elasticity of 1.4 × 10⁶ lb/in2 (9.7 GPa)|. Grades of mechanically graded lumber and their allowable properties are given in Table 6.7.10.
Structural Composite Lumber
Types of Structural Composite Lumber Structural composite lumber refers to several types of reconstituted products that have been developed to meet the demand for high-quality material for the manufacture of engineered wood products and structures. Two distinct types are commercially available: laminated veneer lumber (LVL) and parallel-strand lumber (PSL).
Laminated veneer lumber is manufactured from layers of veneer with the grain of all the layers parallel. This contrasts with plywood, which consists of adjacent layers with the grain perpendicular. Most manufacturers use sheets of 1/10 to 1/6-in- (2.5- to 4.2-mm-) thick veneer. These veneers are stacked up to the required thickness and may be laid end to end to the desired length with staggared end joints in the veneer. Water-proof adhesives are generally used to bond the veneer under pressure. The resulting product is a billet of lumber that may be up to 11/4 in (44 mm) thick, 4 ft (1.2 m) wide, and 80 ft (24.4 m) long. The billets are then ripped to the desired width and cut to the desired length. The common sizes of LVL closely resemble thoe of sawn dimension lumber.
Parallel-strand lumber is manufactured from strands or elongated flakes of wood. One North American product is made from veneer clipped to 1/2 in (13 mm) wide and up to 8 ft (2.4 m) long. Another product is made from elongated flakes and technology similar to that used to produce oriented strandboard. A third product is made from mats of interconnected strands crushed from small logs that are assembled into the desired configuration. All the products use waterproof adhesive that is cured under pressure. The size of the product is con-trolled during manufacture through adjustments in the amount of mate-rial and pressure applied. Parallel-strand lumber. is commonly available in the same sizes as structural timbers or lumber.
Properties of Structural Composite Lumber Standard design values have not been etablished for either LVL or PSL. Rather, standard procedures are available for developing these design values (ASTM D5456). Commonly, each manufacturer follows these procedures and submits supporting data to the appropriate regulatory authority to establish design properties for the product. Thus, design information for LVL and PSL varies among manufacturers and is given in their product literature. Generally the engineering design properties compare favorably with or exceed those of high-quality solid dimension lumber. Example design values accepted by U.S. building codes are given in Table 6.7.11.
GlulamTimber
Structural glued-laminated (glulam) timber is an engineered, stress-rated product of a timber laminating plant, consisting of two or more layers of wood glued together with the grain of all layers (or laminations) approximately parallel. Laminations are typically made of specially selected and prepared sawn lumber. Nominal 2-in (standard 38-mm) lumber is used for straight or slightly curved members, and nominal 1-in (standard 19-mm) lumber is used for other curved mem-
PROPERTIES OF LUMBER PRODUCTS 6-123
Table 6.7.11 Example Design Values for Structural Composite Lumber
Horizontal Bending stress Modulus of elasticity shear
Product lb/in2 MPa × 103 lb/in2 GPa lb/in2 MPa
LVL 2,800 19.2 2,000 13.8 190 1.31 PSL, type A 2,900 20.0 2,000 13.8 210 1.45 PSL, type B 1,500 10.3 1,200 8.3 150 1.03
bers. A national standard, ANSI A190.1, contains requirements for production, testing, and certification of the product in the United States.
Manufacture Straight members up to 140 ft (42 m) long and more than 7 ft (2.1 m) deep have been manufactured with size limitations generally resulting from transportaion constraints. Curved members have been used in domed structures spanning over 500 ft (152 m), such as the Tacoma Dome. Manufacturing and design standards cover many softwoods and hardwoods; Douglas-fir and southern pine are the most commonly used softwood species.
Design standards for glulam timber are based on either dry or wet use. Manufacturing standards for dry use, which is defined as use conditions resulting in a moisture content of 16 percent or less, permits manufacturing with nonwaterproof adhesives; however, nearly all manufacturers in North America use waterproof adhesives exclusively. For wet-use conditions, these waterproof adhesives are required. For wet-use conditions in which the moisture content is expected to exceed 20 percent, pressure preservative treatment is recommended (AWPA C28). Lumber can be pressure-treated with water-based preservatives prior to gluing, provided that special procedures are followed in the manufacture. For treatment after gluing, oil-based preservatives are generally recommended. Additional information on manufacture is provided in the “Wood Handbook.”
Glulam timber is generally manufactured at a moisture content below 16 percent. For most dry-use application, it is important to protect the glulam timber from increases in moisture content. End sealers, surface sealers, primer coats, and wrapping may be applied at the manufacturing plant to provide protection from changes in moisture content. Protection will depend upon the final use and finish of the timber.
Special precautions are necessary during handling, storage, and erection to prevent structural damage to glulam members. Padded or non-marring slings are recommended; cable slings or chokers should be avoided unless proper blocking protects the members. AITC 111 provides additional details on protection during transit, storage, and erection.
Design Glulam timbers beams are available in standard sizes with standardized design properties. The following standard widths are established to match the width of standard sizes of lumber, less an allow-able amount for finishing the edges of the manufactured beams:
3 or 31/8 in (76 or 79 mm) 5 or 51/8 in (127 or 130 mm) 63/4 in (171 mm) 81/2 or 83/4 in (216 or 222 mm) 101/2 or 101/4 in (267 or 273 mm)
Standard beam depths are common multiples of lamination thickness of either 13/8 or 11/2 in (35 or 38 mm). There are no standard beam lengths, although most uses with be on spans where the length is from 10 to 20 times the depth. Allowable spans for various loadings of the standard sizes of beams are available from either the American Institute of Timber Construction or American Wood Systems.
The design stresses for beams in bending for dry-use applications are standardized in multiples of 200 lb/in2 (1.4 MPa) within the range of 2,000 to 3,000 lb/in2 (13.8 to 20.7 MPa). Modulus of elasticity values associated with these design stresses in bending vary from 1.6 to 2.0 × 10⁶ lb/in2. A bending stress of 2,400 lb/in2 (16.5 MPa) and a modulus of elasticity of 1.8 × 10⁶ lb/in2 (12.4 GPa) are most commonly specified, and the designer needs to verify the availability of beams with higher

6-124 WOOD
Table 6.7.12 Design Stresses for Selected Species of Round Timbers for Building Construction
Type of timber
Design stress
Bending Compression Modulus of elasticity
and species lb/in2 MPa lb/in2 MPa × 106 lb/in2 GPa
Poles* Southern pine and Douglas-fir 2,100 14.5 1,000 6.9 Western redcedar 1,400 9.6 800 5.5
Piles† Southern pine 2,400 16.5 1,200 8.3 Douglas-fir 2,450 16.9 1,250 8.6 Red pine 1,900 13.1 900 6.2
1.5 10.3 0.9 6.2
1.5 10.3 1.5 10.3 1.3 8.8
* From “Timber Construction Manual” (AITC, 1994) † From “National Design Specification” (AF&PA, 1991)
values. Design properties must be adjusted for wet-use applications. Detailed information on other design properties for beams as well as design properties and procedures for arches and other uses are given in “National Design Specification” (AF&PA).
Round Timbers
Round timbers in the form of poles, piles, or construction logs represent some of the most efficient uses of forest products because of the mini-mum of processing required. Poles and piles are generally debarked or peeled. seasoned. graded. and treated with a preservative prior to use, Construction logs are often shaped to facilitate their use. See Table 6.7.12.
Poles The primary use of wood poles is to support utility and trans-mission lines. An additional use is for building construction. Each of these uses requires that the poles be pressure-treated with preservatives following the applicable AWPA standard (C1). For utility structures. pole length may vary from 30 to 125 ft (9.1 to 38.1 m). Poles for building construction rarely exceed 30 ft (9.1 m). Southern pines account for the highest percentage of poles used in the United States because of their favorable strength properties, excellent form, ease of treatment. and availability. Douglas-fir and western redcedar are used for longer lengths; other species are also included in the ANSI O5.1 standard (ANSI 1992) that forms the basis for most pole purchases in the United States.
Design procedures for the use of ANSI O5.1 poles in utility structures are described in the “National Electric Safety Code” (NESC). For building construction. design properties developed based on ASTM D2899 (see ASTM, 1995) are provided in “Timber Construction Manual” (AITC, 1994) or ASAE EP 388.
Piles Most piles used for foundations in the United States utilize either southern pine or Douglas-fir. Material requirements for timber piles are given in ASTM D25, and preservative treatment should follow the applicable AWPA standard (C1 or C3). Design stress and procedures are provided in “National Design Specifications.”
Construction Logs Log buildings continue to he a popular form of construction because nearly any available species of wood can be used. Logs are commonly peeled prior to fabrication into a variety of shapes. There are no standardized design properties for construction logs. and when they are required, log home suppliers may develop design proper-ties by following an ASTM standard ASTM D3957).
PROPERTIES OF STRUCTURAL PANEL PRODUCTS
by Roland Hernandez
Structural panel products are a family of wood products made by bonding veneer. strands. panicles. or fibers of wood into Hat sheets. The members of this family are (1) plywood. which consists of products made completely or in pan from wood veneer: (2) flakeboard, made from
strands. wafers. or flakes; (3) particleboard, made from particles: and (4) fiberboard and hardboard. made from wood fibers. Plywood and flakeboard make up a large percentage of the panels used in structural applications such as roof. wall. and floor sheathing: thus. only those two types will be described here.
Plywood
Plywood is the name given to a wood panel composed of relatively thin layers or plies of veneer with the wood grain of adjacent layers at right angles. The outside plies are called faces or face and back plies, the inner plies with grain parallel to that of the face and back are called cores or centers. and the plies with grain perpendicular to that of the face and back are called crossbands. In four-ply plywood, the two center plies are glued with the grain direction parallel to each ply, making one center layer. Total panel thickness is typically not less than 1/16 in (1.6 mm) nor more than 3 in (76 mm). Veneer plies may vary as to number. thickness. species, and grade. Stock plywood sheets usually measure 4 by 8 ft (1.2 by 2.4 m), with the 8-ft (2.4-m) dimension parallel to the grain of the face veneers.
The alteration of grain direction in adjacent plies provides plywood panels with dimensional stability across their width. It also results in fairly similar axial strength and stiffness properties in perpendicular directions within the panel plane. The laminated construction results in a dibtribution of defects and markedly reduces splitting (compared to solid wood) when the plywood is penetrated by fasteners.
Two general classes of plywood. covered by separate standards. are available: constructionand industrial plywoodandhardwood and decorative plywood. Construction and industrial plywood are covered by Product Standard PS 1-83, and hardwood and decorative plywood are covered by ANSI/HPVA HP-1-1994. Each standard recognizes different exposure durability classifications. which are primarily based on the moisture resistance of the glue used, but sometimes also address the grade of veneer used.
The exposure durability classifications for construction and industrial plywood specified in PS-1 are exterior, exposure 1, intermediate glue (exposure 2), and interior. Exterior plywood is bonded with exterior (waterproof) glue and is composed of C-grade or better veneers throughout. Exposure 1 plywood is bonded with exterior glue. but it may include D-grade veneers. Exposure 3 plywood is made with glue of intermediate resistance to moisture. Interior-type plywood may be bonded with interior. intermediate. or exterior (waterproof) glue. D-grade veneer is allowed on inner and back plies of certain, interior-type grades.
The exposure durability classifications for hardwood and decorative plywood specified in ANSI/HPVA HP-1-1994 are, in decreasing order of moisture resistance, as follows: technical (exterior), type I (exterior), type II (interior), and type III (interior). Hardwood and decorative ply-wood are not typically used in applications where structural performance is a prominent concern. Therefore, most of the remaining discus-

sion of plywood performance will concern construction and industrial plywood.
A very significant portion of the market for construction and industrial plywood is in residential construction. This market reality has resulted in the development of performance standards for sheathing and single-layer subfloor or underlayment for residential construction by the American Plywood Association (APA). Plywood panels conforming to these performance standards for sheathing are marked with grade stamps such as those shown in Fig. 6.7.2 (example grade stamps are shown for different agencies). As seen in this figure, the grade stamps must show (1) conformance to the plywood product standards; (2) recognition as a quality assurance agency by the National Evaluation Servvice (NES), which is affiliated with the Council of American Building Officials; (3) exposure durability classification; (4) thickness of panel; (5) span rating, 32/16, which refers to the maximum allowable roof support spacing of 32 in (813 mm) and maximum floor joist spaicing of 16 in (406 mm); (6) conformance to the performance-rated standard of the agency; (7) manufacturer’s name or mill number; and (8) grades of face and core veneers.
Fig. 6.7.2 Typical grade marks for (a) sheathing-grade plywood conforming to Product Standard PS 1-83 and (b) sheathing-grade structural-use panel conforming to Product Standard PS 2-92. (1) Conformance to indicated product standard, (2) recognition as a quality assurance agency, (3) exposure durability classification, (4) thickness, (5) span rating, (6) conformance to performance-rated product, (7) manufacturer’s name or mill number, and (8) grade of face and core veneers.
All hardwood plywood represented as conforming to American National Standard ANSI/HPVA-HP-1-1994 is identified by one of two methods—either marking each panel with the HPVA plywood grade stamp (Fig. 6.7.3) or including a written statement with this information with the order or shipment. The HPVA grade stamp shows (1) HPVA trademark, (2) standard that governs manufacture (3) HPVA Mill num-
PROPERTIES OF STRUCTURAL PANEL PRODUCTS 6-125
ber, (4) plywood bond-line type, (5) flame spread index class, (6) description of layup, (7) formaldehyde emission characteristics, (8) face species, and (9) veneer grade of face.
The span-rating system for plywood was established to simplifyspecification of plywood without resorting to specific structural engineering design. This system indicates performance without the need to refer to species group or panel thickness. It gives the allowable span when the face grain is placed across supports.
If design calculations are desired, a design guide is provided by APA-EWS in “Plywood Design Specifications” (PDS). The design guide contains tables of grade stamp references, section properties, and allowable stresses for plywood used in construction of buildings and
Fig. 6.7.3 Grade stamp for hardwood plywood conforming to ANSI/HPVA HP-1-1994. (1) Trademark of Hardwood Plywood wood Veneer Association, (2) standard that governs manufacture, ( 3 ) HPVA mill number, (4) plywood bond-line type, (5) flame spread index class, (6) layup description, (7) formaldehyde emission characteristics, (8) face species, and (9) veneer grade of face.
similar related structures. For example, given the grade stamp shown in Fig. 6.7.2, the grade stamp reference table in the PDS specifies that this particular plywood is made with veneer from species group 1, has section property information based on unsanded panels (Table 6.7.13), and is assigned allowable design stresses from the S-3 grade level (Table 6.7.14). Design information for grade stamps other than that shown in Fig. 6.7.2 is available in the PDS.
If calculations for the actual physical and mechanical properties of plywood are desired, formulas relating the properties of the particular wood species in the component plies to the laminated panel are provided in “Wood Handbook” (Forest Products Laboratory, 1987). These formulas could be applied to plywood of any species, provided the basic mechanical properties of the species were known. Note, how-ever, that the formulas yield predicted actual properties (not design values) of plywood made of defect-free veneers.
Table 6.7.13 Effective Section Properties for Plywood—Unsanded Panels*
Stress applied parallel to face grain Stress applied perpendicular to face grain
ts KS lb/Q KS lb/Q Effective I Effective Rolling I Effective Rolling
Nominal Approximate thickness A Moment section shear A Moment section shear thickness,
in weight,
lb/ft2
for shear, in
Area, in2/ft
of inertia, in4/ft
modulus, in3/ft
constant, in2/ft
Area, in2/ft
of inertia, in4/ft
modulus, in3/ft
constant, in2/ft
5/16-U 1.0 0.268 1.491 0.022 0.112 2.500 0.000 0.001 0.023 4.497 3/8-U 1.1 0.278 1.868 0.030 0.152 3.110 0.799 0.002 0.033 5.444 15/32 & 1/2-U 1.5 0.298 2.202 0.007 0.213 3.921 1.007 0.004 0.056 2.450 19/32 & 5/8-U 1.8 0.319 2.330 0.121 0.379 5.004 1.285 0.010 0.091 3.106 23/32 & 3/4-U 2.2 0.445 3.247 0.234 0.496 0.455 1.563 0.030 0.232 3.613 7/8-U 2.6 0.607 3.509 0.340 0.678 7.175 1.950 0.112 0.397 4.791 1-U 3.0 0.842 3.916 0.493 0.859 9.244 3.145 0.210 0.660 6.533 11/8-U 3.3 0.859 4.725 0.670 1.047 9.960 3.070 0.288 0.768 7.931
* 1 in = 25.4 mm; 1 ft = 0.3048 m; 1 lb/ft2 = 4.882 kg/m2.

6-126 WOOD
Table 6.7.14 Allowable Stresses for Construction and Industrial Plywood (Species Group 1)*
Grade stress level
Type of S-1 S-2 S-3 stress, lb/in2 Wet Dry Wet Dry Dry only
Fb and Ft 1,430 2,000 1,190 1,650 1,650 FcFv 155
970 190
1,640 155
900 190
1,540 160
Fs 63 75 63 75 — G Fc
70,000 210
90,000 340
70,000 210
90,000 340
82,000 340
E 1,500,000 1,800,000 1,500,000 1,800,000 1,800,000 * Stresses are based on normal duration of load and on common structural application where panels are 24 in
(610 mm) or greater in width For other use conditions, see PDS for modifications. Fb is extreme fiber stress in bending: Ft, tension in plane of plies; Fc, compression in plane of plies: Fv. shear through the thickness: Fs, rolling shear in plane of plies: G, modulus of rigidity; Fc, bearing on face; and E, modulus of elasticity in plane of plies. 1 lb/in2 = 6.894 kPa.
Structural Flakeboards
Structural flakeboards are wood panels made from specially produced flakes —typically from relatively low-density species, such as aspen or pine-andbonded with an extenor-type water-resistant adhesive. Two major types of flakeboards are recognized, oriented strandboard (OSB) and waferboard. OSB is a flakeboard product made from wood strands (long and narrow flakes) that are formed into a mat of three to five layers. The outer layers are aligned in the long panel direction. while the inner layers may be aligned at right angles to the outer layers or may be randomly aligned. In waferboard. a product made almost exclusively from aspen wafers (wide flakes), the flakes are not usually oriented in any direction. and they are bonded with an exterior-type resin. Because flakes are aligned in OSB. the bending properties (in the aligned direction) of this type of flakeboard are generally superior to those of wafer-board. For this reason. OSB is the predominant form of structural flake-board. Panels commonly range from 0.25 to 0.75 in (6 to 19 mm) thick and 4 by 8 ft (1 by 2 m) in surface dimension. However, thicknesses up to 1.125 in (28.58 mm) and surface dimensions up to 8 by 24 ft (2 by 7 m) are available by special order.
A substantial portion of the market for structural flakeboard is in residential construction. For this reason. structural flakeboards are usually marketed as conforming to a product standard for sheathing or single-layer subfloor or underlayment and are graded as a perfomancerated product (PRP-108) similar to that for construction plywood. The Voluntary Product Standard PS 2-92 is the performance standard for wood-based structural-use panels. which includes such products as ply-wood. composites. OSB. and waferboard. The PS 2-92 is not a replacement for PS 1-83, which contains necessary veneer grade and glue bond requirements as well as prescriptive layup provisions and includes many plywood grades not covered under PS 2-92.
Design capacities of the APA performance-rated products. which include OSB and waferboard. can be determined by using procedures outlined in the APA-EWS Technical Note N375A. In this reference. allowable design strength and stiffness properties, as well as nominal thicknesses and section properties. are specified based on the span rating of the panel. Additional adjustment factors based on panel grade and construction are also provided.
Because of the complex nature of structural flakeboards, formulas for determining actual strength and stiffness properties. as a function of the component material. are not available.
DURABILITY OF WOOD IN CONSTRUCTION
by Rodney De Groot and Robert White
Biological Challenge
In the natural ecosystem, wood residues are recycled into the nutrient web through the action of wood-degrading fungi, insects, and other
organisms. These same natural recyclers may pose a practical biologicalchallenge to wood used in construction under conditions where one or more of these microorganisms or insects can thrive. Under those conditions, wood that has natural durability or that has been treated with preservatives should be employed to ensure the integrity of the structure.
Termites are a recognized threat to wood in construction. but decay fungi are equally important. Wood-boring beetles can also be important in some regions of the United States and in certain species of wood products. Several types of marine organisms can attack wood used in brackish and salt waters. Because suppression of established infestations of any of the wood-destroying organisms in existing structures probably would require services of professional pest control specialists, methodologies for remedial treatments to existing structures will not be discussed further.
Role of Moisture
Three environmental components govern the development of wood-degrading organisms within terrestrial wood construcuon: moisture, oxygen supply, and temperature. Of these. moisture content of wood seems most directly influenced by design and construction practices. The oxygen supply is usually adequate except for materials submerged below water or deep within the soil. Temperature is largely a climatic function: within the global ecosystem. a variety of wood-degrading organisms have evolved to survive within the range of climates where trees grow. For these reasons, most of the following discussion will focus ,on relationships between wood moisture and potential for wood deterioration.
Soil provides a continuing source of moisture. Nondurable wood in contact with the ground will decay most rapidly at the groundline where the moisture from soil and the supply of oxygen within the wood sup-port growth of decay fungi. Deep within the soil, as well as in wood submerged under water, a limited supply of oxygen prevents growth of decay fungi. As the distance from groundline increases above ground. wood dries out and the moisture content becomes limiting for fungal growth. unless wood is wetted through exposure to rain or from water entrapped as a consequence of design and/or construction practices that expose wood to condensate from air conditioners, plumbing failures. etc. Wood absorbs water through exposed. cut ends about 11 times faster than through lateral surfaces. Consequently decay fungi. which require free water within the wood cells (above 20 to 25 percent moisture content) to survive, develop first at the joints in aboveground construction.
Naturally Durable Woods
The heartwood of old-growth trees of certain species, such as bald cypress. redwood, cedars. and several white oaks, is naturally resistant or very resistant to decay fungi. Heartwood of several other species.

such as Douglas-fir, longleaf pine, eastern white pine, and western larch, is moderately resistant to wood decay fungi. Similarly, these species are not a wood of choice for subterranean termites. A more complete listing of naturally durable woods is given in “Wood Hand-book.” These woods historically have been used to construct durable buildings, but some of these species are becoming less available as building materials. Consequently, other forms of protection are more frequently used in current construction. (See section on protection from decay).
Methods for Protecting Wood
Protection with Good Design The most important aspect to consider when one is protecting structural wood products is their design, Many wood structures are several hundred years old, and we can learn from the principles used in their design and construction. For example, in nearly all those old buildings, the wood has been kept dry by a barrier over the structure (roof plus overhang), by maintaining a separation between the ground and the wood elements (foundation), and by pre-venting accumulation of moisture in the structure (ventilation). Today’s engineered wood products will last for centuries if good design practices are used.
Protection from Weathering The combination of sunlight and other weathering agents will slowly remove the surface fibers of wood products. Thus removal of fibers can be greatly reduced by providing a wood finish; if the finish is properly maintained, the removal of fibers can be nearly eliminated. Information on wood finishes is available in Cassens and Feist, “Exterior Wood in the South.”
Protection from Decay As naturally durable woods become less available in the marketplace, greater reliance is being placed on preservative-treated wood. Wood that is treated with a pressure-impregnated chemical is used for most load-bearing applications. In non-load-bearing applications such as exterior millwork around windows and doors, wood is usually protected with water repellant preservative treatments that are applied by nonpressure processes. Standards for preservative treatment are published by the American Wood-Preservers’ Association, and detailed information on wood preservation is given in “Wood Handbook.”
An extremely low oxygen content in wood submerged below water will prevent growth of decay fungi, but other microorganisms can slowly colonize submerged wood over decades or centuries of expo-sure. Thus, properties of such woods need to be reconfirmed which old, submerged structures are retrofitted.
Protection from insects Subterranean termites, native to the U.S. mainland, establish a continuous connection with soil to maintain adequate moisture in wood that is being attacked above ground. One fundamental approach most often utilized in the protection of buildings from subterranean termites is to establish a physical or chemical barrier between soil and building. The function of that barrier is to bar access of termites to the building. The use of preservative-treated wood is relied upon to protect wood products such as poles, piling, and bridges that cannot be protected from exposure to termites via other mechanisms.
Formosan termites have the capacity touse sources of aboveground moisture without establishing a direct connection with the soil. Thus, where these termites occur, good designs and construction practices that eliminate sources of aboveground moisture are particularly important.
Dry-wood termites survive only in tropical or neotropical areas with sufficiently high relative humidity to elevate the wood moisture content to levels high enough to provide moisture for insect metabolism. Where these termites occur, use of naturally durable wood or preservative-treated wood warrants consideration.
Wood-destroying beetles may occur in wood members where the ambient moisture content is high enough for them to complete certain phases of their life cycle. Many beetles attack only certain species or groups of woods that may be used in specialty items such as joinery. Consequently, the first step in good construction practice is to use wood that is not preinfested at the time of construction. The next step is to
DURABILITY OF WOOD IN CONSTRUCTION 6-127
utilize designs and construction practices that will keep wood at low moisture content in use. Finally, chemical treatments may be needed for certain specific applications.
Protection from Fire In general, proper design for fire safety allows the use of untreated wood. When there is a need to reduce the potential for heat contribution or flame spread, fire-retardant treatments are avail-able. Although fire-retardant coatings or dip treatments are available, effective treatment often requires that the wood be pressure-impregnated with the fire-retardant chamicals. These chemicals include inorganic salts such as monoammonium and diammonium phosphate, ammonium sulfate, zinc chlorate, sodium tetraborate, and boric acid. Resin polymerized after impregnation into wood is used to obtain a leach-resistant treatment. Such amino resin systems are based on urea, melamine, dicyandiamide, and related compounds. An effective treatment can reduce the ASTM E84 flame spread to less than 25. When the external source of heat is removed, the flames from fire-retardant-treated wood will generally self-extinguish. Many fire-retardant treatments reduce the generation of combustible gases by lowering the thermal degradation temperature. Fire-retardant treatments may increase the hygroscopic properties of wood.
Protection from Marine Organisms Pressure treatment of native wood species with wood preservatives is required to protect wood used in marine or brackish waters from attack by marine borers.
Effect of Long-term Exposure
Long exposure of wood to the atmosphere also causes changes in the cellulose. A study by Kohara and Okamoto of sound old timbers of a soft-wood and hardwood of known ages from temple roof beams shows that the percentage of cellulose decreases steadily over a period up to 1,400 years while the lignin remains almost constant. These changes are reflected in strength losses (Fig. 6.7.4). Impact properties approximate a loss that is nearly linear witht he logarithm of time. Allowable working stresses for preservative-treated lumber usually need not be reduced to account for the effect of the teating process. Tests made by the USDA Forest service, Forest Products Laboratory, of preservative-treated
Fig. 6.7.4 Strength loss with age in hardwood (Zelkowa serrata). (From Sci. Rpts. Saikyo Univ., no. 7, 1955.)
lumber when undergoing bending, tension, and compression perpendicular to grain show reductions in mean extreme fiber stress from a few percent up to 25 percent, but few reductions in working stresses. Compression parallel to grain is affected less and modulus of elasticity very

6-128 NONMETALLIC MATERIALS
little. The effect on horizontal shear can be estimated by inspection for an increase in shakes and checks after treatment. AWPA Standards keep temperatures, heating periods, and pressures to a minimum for required penetration and retention, which precludes the need for adjustment in working stresses.
COMMERCIAL LUMBER STANDARDS
Standard abbreviations for lumber description and size standards for yard lumber are given in “Wood Handbook.”
Cross-sectional dimensions and section properties for beams, stringers, joists, and planks are given in the National Design Specification.
Standard patterns for finish lumber are shown in publications of the grading rules for the various lumber associations.
Information and specifications for construction and industrial plywood are given in Product Standard PS 1-83 and in ANSI/HPVA HP-1-1994 for hardwood and decorative plywood. Information and specifications for structural flakeboard are given in PS 2-92.

Marks’
Standard Handbook for Mechanical Engineers
Revised by a staff of specialists
EUGENEA. AVALLONE Editor
Consulting Engineer; Professor of MechanicalEngineering, Emeritus The City College of the City University of New York
THEODORE BAUMEISTER III Editor
Retired Consultant, InformationSystems Department E. I. du Pont de Nemours & Co.
Tenth Edition (1996)
McGRAW-HILL
New York San Francisco Washington, D.C. Auckland Bogotá Caracas Lisbon London Madrid Mexico City Milan Montreal New Delhi San Juan Singapore Sydney Tokyo Toronto