6. probabilistic and deterministic erosion/recession ... · probabilistic and deterministic...
TRANSCRIPT
WRL Technical Report 2017/09 FINAL October 2017 60
6. Probabilistic and Deterministic Erosion/Recession Hazard
Assessment
6.1 Risk Definitions
Risk is defined as likelihood (or probability) times consequence. Probability is generally
expressed in three formats:
Average Recurrence Interval (ARI);
Annual Exceedance Probability (AEP); and
Encounter Probability (EP) over the planning horizon.
The acceptable likelihood or acceptable risk for private dwellings is considered in several
documents, but well accepted or legislated values for coastal hazards are not presently available.
The Building Code of Australia lists the following acceptable design probabilities for freestanding
detached private houses:
Water entry into building: 100 year ARI (1% AEP);
Wind Load: 500 year ARI (0.2% AEP); and
Earthquake load: 500 year ARI (0.2% AEP).
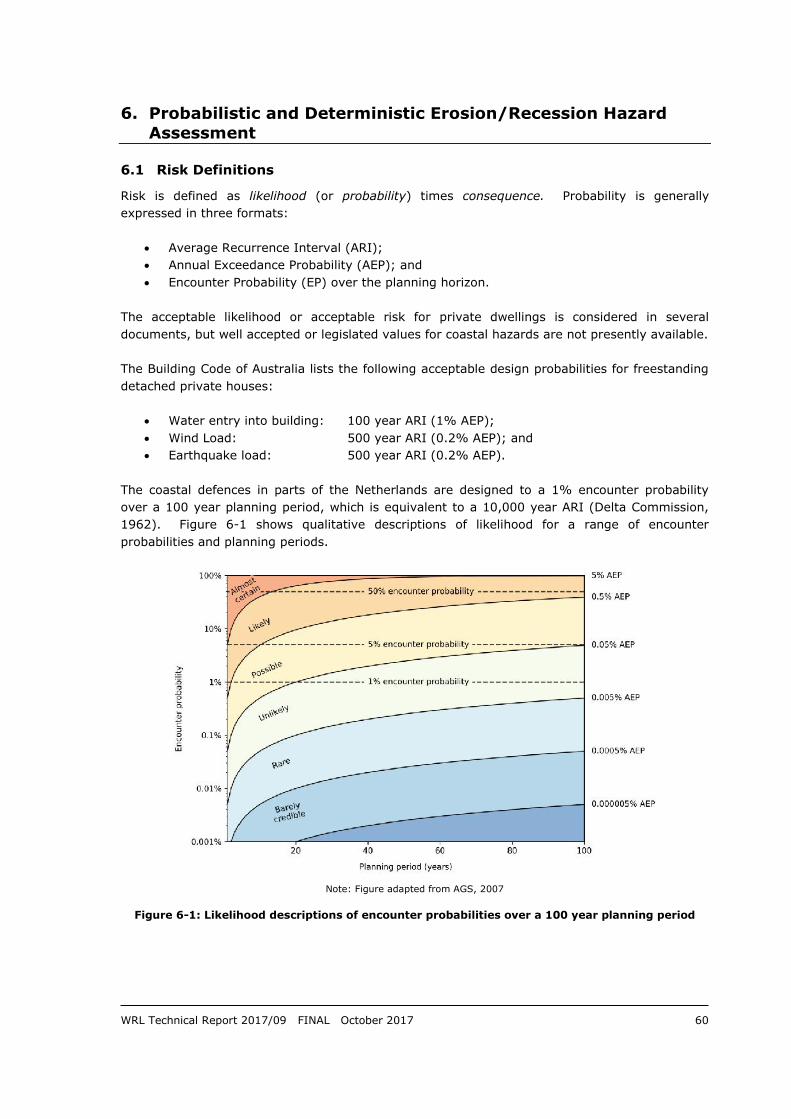
The coastal defences in parts of the Netherlands are designed to a 1% encounter probability
over a 100 year planning period, which is equivalent to a 10,000 year ARI (Delta Commission,
1962). Figure 6-1 shows qualitative descriptions of likelihood for a range of encounter
probabilities and planning periods.
Note: Figure adapted from AGS, 2007
Figure 6-1: Likelihood descriptions of encounter probabilities over a 100 year planning period

WRL Technical Report 2017/09 FINAL October 2017 61
6.2 Probabilistic versus Deterministic Assessment of Coastal Hazards
In a deterministic approach, each input variable is assigned a single value and a single estimate
(prediction) of shoreline movement is produced. This is usually a “design”, “100 year ARI”, “best
estimate” or “conservative” value. In a probabilistic approach, each independent input variable
is allowed to randomly vary over a range of values pre-defined through probability distribution
functions. This range covers both uncertainty and error in a heuristic manner. The process of
repeatedly combining these randomly sampled values is known as Monte-Carlo simulation.
Probabilities of storm demand are also included in this assessment by combining them randomly
with the recession probabilities in a further Monte-Carlo simulation. Note that by assuming that
the storm demand represents a deviation from the long term average trend, and by expressing
the combined probability as an AEP, the probability (AEP) of an eroded shoreline position each
year does not need to consider beach recovery on the assumption that recovery occurs within
one (1) year. The bounding still relies somewhat on engineering judgement and experience.
6.3 Erosion and Recession Hazards
The coastal erosion hazard lines in this study are based on the landward side of the Zone of
Reduced Foundation Capacity (ZRFC), a potentially unstable region behind the theoretical
erosion escarpment, as described by Nielsen et al., (1992; Figure 6-2). There are four (4) main
components forming the position of the hazard line. Numerous other sub-components may
aggregate to form these.
The four main components are:
Shoreline movement due to sediment budget differentials;
Sea level rise and the recession response to sea level rise (Bruun adjustment);
Storm erosion; and
Dune stability or zone of reduced foundation capacity (refer to Appendix G for details on
this aspect of the methodology).
Note: Figure modified from Nielsen et al., 1992
Figure 6-2: Zone of Reduced Foundation Capacity (ZRFC) hazard lines
WRL Technical Report 2017/09 FINAL October 2017 62
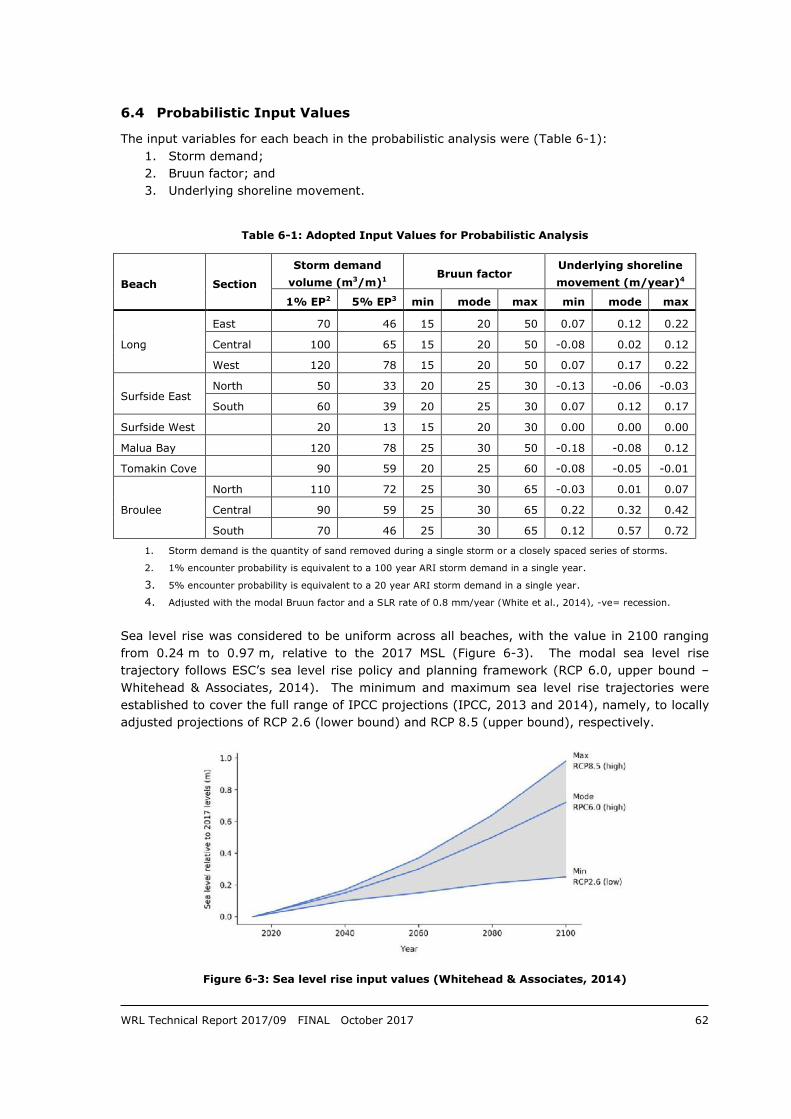
6.4 Probabilistic Input Values
The input variables for each beach in the probabilistic analysis were (Table 6-1):
1. Storm demand;
2. Bruun factor; and
3. Underlying shoreline movement.
Table 6-1: Adopted Input Values for Probabilistic Analysis
Beach Section
Storm demand
volume (m3/m)1 Bruun factor
Underlying shoreline
movement (m/year)4
1% EP2 5% EP3 min mode max min mode max
Long
East 70 46 15 20 50 0.07 0.12 0.22
Central 100 65 15 20 50 -0.08 0.02 0.12
West 120 78 15 20 50 0.07 0.17 0.22
Surfside East North 50 33 20 25 30 -0.13 -0.06 -0.03
South 60 39 20 25 30 0.07 0.12 0.17
Surfside West 20 13 15 20 30 0.00 0.00 0.00
Malua Bay 120 78 25 30 50 -0.18 -0.08 0.12
Tomakin Cove 90 59 20 25 60 -0.08 -0.05 -0.01
Broulee
North 110 72 25 30 65 -0.03 0.01 0.07
Central 90 59 25 30 65 0.22 0.32 0.42
South 70 46 25 30 65 0.12 0.57 0.72
1. Storm demand is the quantity of sand removed during a single storm or a closely spaced series of storms.
2. 1% encounter probability is equivalent to a 100 year ARI storm demand in a single year.
3. 5% encounter probability is equivalent to a 20 year ARI storm demand in a single year.
4. Adjusted with the modal Bruun factor and a SLR rate of 0.8 mm/year (White et al., 2014), -ve= recession.
Sea level rise was considered to be uniform across all beaches, with the value in 2100 ranging
from 0.24 m to 0.97 m, relative to the 2017 MSL (Figure 6-3). The modal sea level rise
trajectory follows ESC’s sea level rise policy and planning framework (RCP 6.0, upper bound –
Whitehead & Associates, 2014). The minimum and maximum sea level rise trajectories were
established to cover the full range of IPCC projections (IPCC, 2013 and 2014), namely, to locally
adjusted projections of RCP 2.6 (lower bound) and RCP 8.5 (upper bound), respectively.
Figure 6-3: Sea level rise input values (Whitehead & Associates, 2014)
WRL Technical Report 2017/09 FINAL October 2017 63
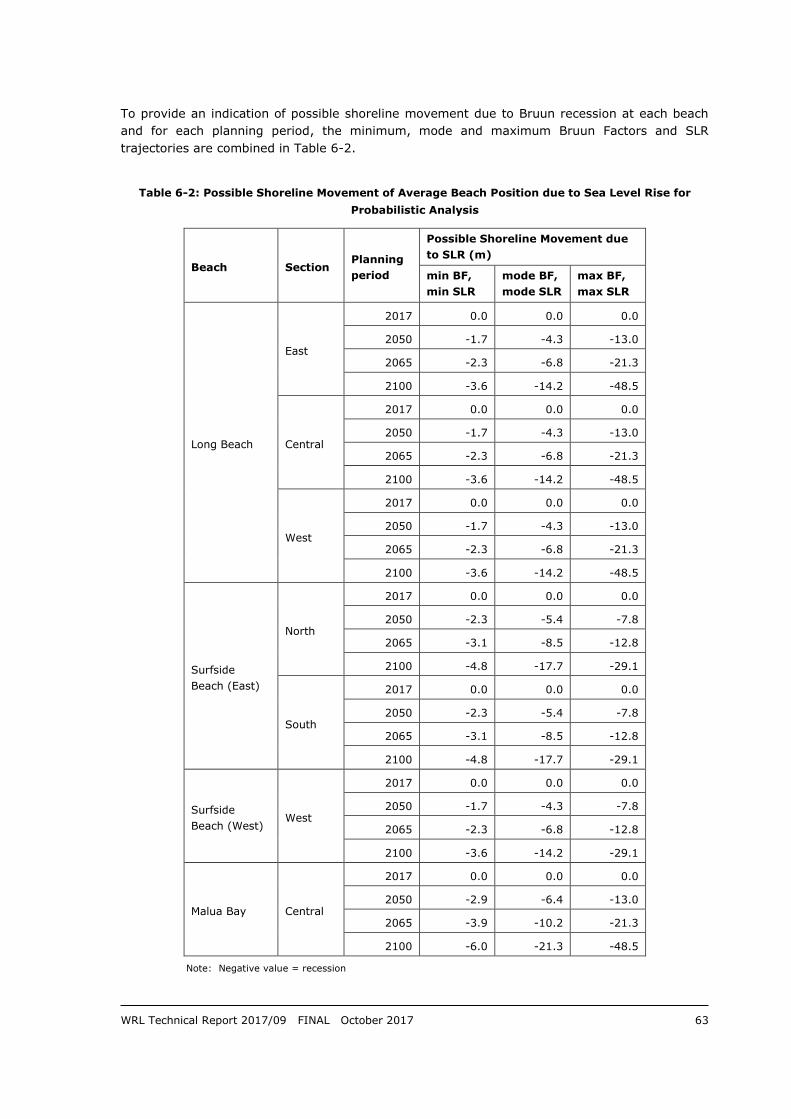
To provide an indication of possible shoreline movement due to Bruun recession at each beach
and for each planning period, the minimum, mode and maximum Bruun Factors and SLR
trajectories are combined in Table 6-2.
Table 6-2: Possible Shoreline Movement of Average Beach Position due to Sea Level Rise for
Probabilistic Analysis
Beach Section Planning
period
Possible Shoreline Movement due
to SLR (m)
min BF,
min SLR
mode BF,
mode SLR
max BF,
max SLR
Long Beach
East
2017 0.0 0.0 0.0
2050 -1.7 -4.3 -13.0
2065 -2.3 -6.8 -21.3
2100 -3.6 -14.2 -48.5
Central
2017 0.0 0.0 0.0
2050 -1.7 -4.3 -13.0
2065 -2.3 -6.8 -21.3
2100 -3.6 -14.2 -48.5
West
2017 0.0 0.0 0.0
2050 -1.7 -4.3 -13.0
2065 -2.3 -6.8 -21.3
2100 -3.6 -14.2 -48.5
Surfside
Beach (East)
North
2017 0.0 0.0 0.0
2050 -2.3 -5.4 -7.8
2065 -3.1 -8.5 -12.8
2100 -4.8 -17.7 -29.1
South
2017 0.0 0.0 0.0
2050 -2.3 -5.4 -7.8
2065 -3.1 -8.5 -12.8
2100 -4.8 -17.7 -29.1
Surfside
Beach (West) West
2017 0.0 0.0 0.0
2050 -1.7 -4.3 -7.8
2065 -2.3 -6.8 -12.8
2100 -3.6 -14.2 -29.1
Malua Bay Central
2017 0.0 0.0 0.0
2050 -2.9 -6.4 -13.0
2065 -3.9 -10.2 -21.3
2100 -6.0 -21.3 -48.5
Note: Negative value = recession
WRL Technical Report 2017/09 FINAL October 2017 64
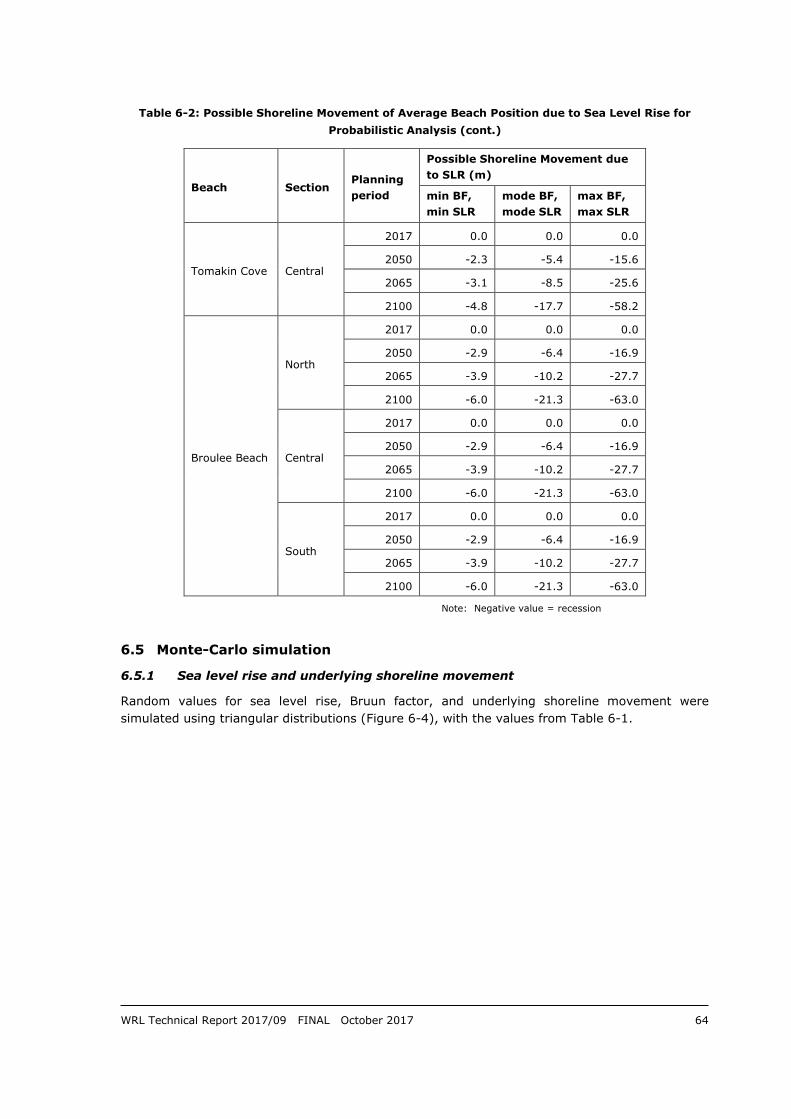
Table 6-2: Possible Shoreline Movement of Average Beach Position due to Sea Level Rise for
Probabilistic Analysis (cont.)
Beach Section Planning
period
Possible Shoreline Movement due
to SLR (m)
min BF,
min SLR
mode BF,
mode SLR
max BF,
max SLR
Tomakin Cove Central
2017 0.0 0.0 0.0
2050 -2.3 -5.4 -15.6
2065 -3.1 -8.5 -25.6
2100 -4.8 -17.7 -58.2
Broulee Beach
North
2017 0.0 0.0 0.0
2050 -2.9 -6.4 -16.9
2065 -3.9 -10.2 -27.7
2100 -6.0 -21.3 -63.0
Central
2017 0.0 0.0 0.0
2050 -2.9 -6.4 -16.9
2065 -3.9 -10.2 -27.7
2100 -6.0 -21.3 -63.0
South
2017 0.0 0.0 0.0
2050 -2.9 -6.4 -16.9
2065 -3.9 -10.2 -27.7
2100 -6.0 -21.3 -63.0
Note: Negative value = recession
6.5 Monte-Carlo simulation
6.5.1 Sea level rise and underlying shoreline movement
Random values for sea level rise, Bruun factor, and underlying shoreline movement were
simulated using triangular distributions (Figure 6-4), with the values from Table 6-1.

WRL Technical Report 2017/09 FINAL October 2017 65
Figure 6-4: Triangular probability density function of sea level rise in 2100
The values for these variables were combined to give a total shoreline movement for each
beach. Because the values were combined in a random order with 1,000,000 iterations, the
probability density function for the total shoreline movement resembles a Gaussian distribution,
rather than a triangular distribution (Figure 6-5). For example, this means that the larger sea
levels were only combined with the larger Bruun factors for a small number iterations.
Figure 6-5: Methodology for combining random values to estimate shoreline movement
A set of 1,000,000 Monte-Carlo simulations were completed by randomly combining a constant
Bruun factor, a discrete underlying shoreline movement rate, and a time-varying sea level rise
trajectory, to create 1,000,000 different possible time series (Figure 6-6).

WRL Technical Report 2017/09 FINAL October 2017 66
Note: Blue lines represent the shoreline trajectory for a single probabilistic model result.
Left panels only show the first 100 simulations to minimise clutter.
Figure 6-6: Simulated trajectories for sea level rise and underlying shoreline movement
6.5.2 Storm demand
Storm demand probabilities for each year were calculated using a uniform distribution of AEP
values along an interval between 0 and 1 (Figure 6-7).
Figure 6-7: Uniform distribution of AEP values for generating storm demand volumes

WRL Technical Report 2017/09 FINAL October 2017 67
The AEP values were converted to erosion volumes using the method described in Gordon
(1987), based on the individual reference 100 year ARI storm demand volume for each beach.
The Gordon method is only defined for 100 year ARI storm demand volumes between 140 m3/m
and 220 m3/m. Many of the beaches in this study are somewhat sheltered, and have lower storm
demand volumes. The defining equations Gordon (1987) were modified for these somewhat
sheltered beaches to ensure that the storm demand was always greater than zero (Figure 6-8,
Table 6-3).
Figure 6-8: Storm demand volumes for exposed beaches in NSW (after Gordon, 1987)
Table 6-3: Adopted Storm Demand Values for Probabilistic Analysis
Beach Section
Storm demand volume (m3/m)
10,000
year
ARI
1,000
year
ARI
100
year
ARI
20
year
ARI
10
year
ARI
1.4
year
ARI
1
year
ARI
0.01%
AEP
0.1%
AEP
1%
AEP
5%
AEP
9.5%
AEP
50%
AEP
63%
AEP
Long
East 139 105 70 46 36 6 1
Central 199 150 100 65 51 8 1
West 239 180 120 78 61 10 1
Surfside East North 99 75 50 33 26 5 1
South 119 90 60 39 31 5 1
Surfside West 39 30 20 13 11 2 1
Malua Bay 239 180 120 78 61 10 1
Tomakin Cove 179 135 90 59 46 8 1
Broulee
North 219 165 110 72 56 9 1
Central 179 135 90 59 46 8 1
South 139 105 70 46 36 6 1

WRL Technical Report 2017/09 FINAL October 2017 68
6.6 Erosion Hazard Lines
The storm demand volumes were converted to horizontal erosion distances to the back of the
ZRFC (Figure 6-2), based on the photogrammetry records for each beach profile. The storm
demand was calculated separately for each Monte-Carlo simulation, and was combined with sea
level rise, and underlying trend to calculate a receded shoreline position for each year. Each
beach was allowed to recover from any storm-driven erosion at the beginning of the year. The
most extreme erosion event was identified for all of the different planning periods in each
simulation, and the erosion hazard lines were calculated from these events, for each encounter
probability (Figure 6-9).
Note: Orange and red bars represent storm demand erosion for a single probabilistic simulation result.
Left panel only shows the first 100 simulations to minimise clutter.
Figure 6-9: Simulated storm demand superimposed on background shoreline movement
6.7 Sensitivity
A total of 1,000,000 runs were used for the Monte-Carlo simulation. The sensitivity of this
number of runs was tested, and the scatter in the simulated shoreline position was found to be
less than 1 m (Figure 6-10).
Note: Each dot shows unique simulation result for the same beach profile.
Figure 6-10: Sensitivity of Monte-Carlo simulation
WRL Technical Report 2017/09 FINAL October 2017 69
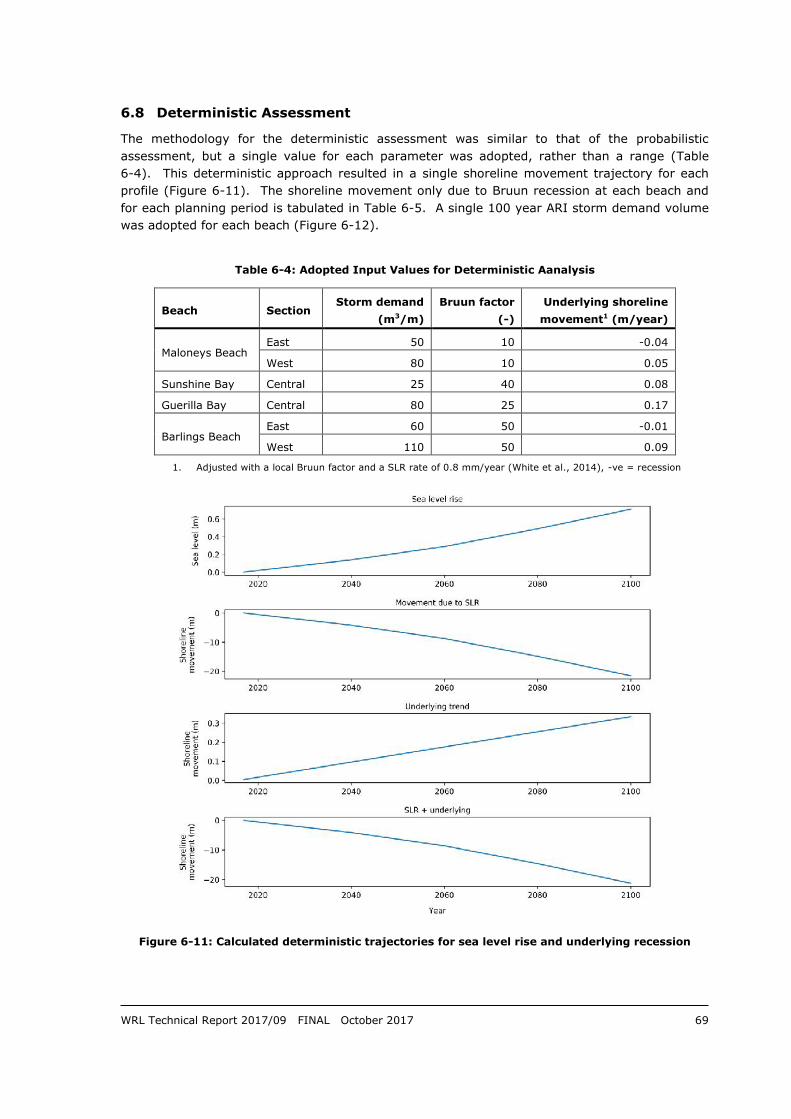
6.8 Deterministic Assessment
The methodology for the deterministic assessment was similar to that of the probabilistic
assessment, but a single value for each parameter was adopted, rather than a range (Table
6-4). This deterministic approach resulted in a single shoreline movement trajectory for each
profile (Figure 6-11). The shoreline movement only due to Bruun recession at each beach and
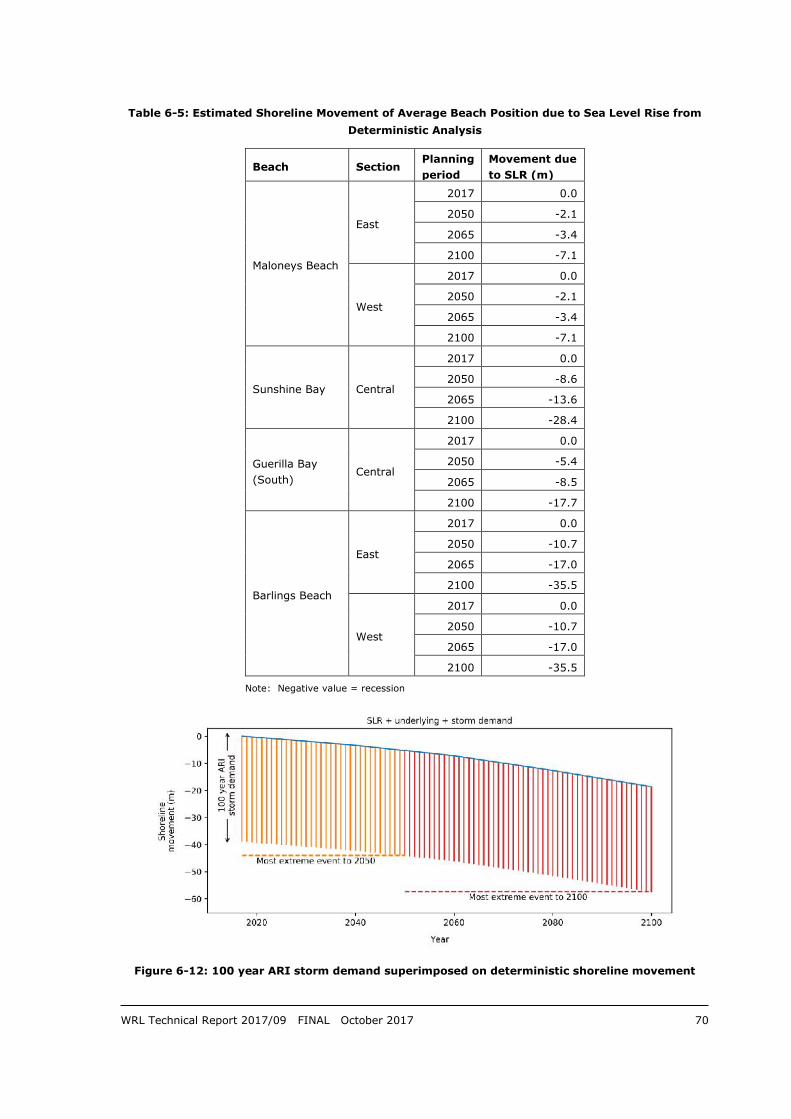
for each planning period is tabulated in Table 6-5. A single 100 year ARI storm demand volume
was adopted for each beach (Figure 6-12).
Table 6-4: Adopted Input Values for Deterministic Aanalysis
Beach Section Storm demand
(m3/m)
Bruun factor
(-)
Underlying shoreline
movement1 (m/year)
Maloneys Beach East 50 10 -0.04
West 80 10 0.05
Sunshine Bay Central 25 40 0.08
Guerilla Bay Central 80 25 0.17
Barlings Beach East 60 50 -0.01
West 110 50 0.09
1. Adjusted with a local Bruun factor and a SLR rate of 0.8 mm/year (White et al., 2014), -ve = recession
Figure 6-11: Calculated deterministic trajectories for sea level rise and underlying recession
WRL Technical Report 2017/09 FINAL October 2017 70
Table 6-5: Estimated Shoreline Movement of Average Beach Position due to Sea Level Rise from
Deterministic Analysis
Beach Section Planning
period
Movement due
to SLR (m)
Maloneys Beach
East
2017 0.0
2050 -2.1
2065 -3.4
2100 -7.1
West
2017 0.0
2050 -2.1
2065 -3.4
2100 -7.1
Sunshine Bay Central
2017 0.0
2050 -8.6
2065 -13.6
2100 -28.4
Guerilla Bay
(South) Central
2017 0.0
2050 -5.4
2065 -8.5
2100 -17.7
Barlings Beach
East
2017 0.0
2050 -10.7
2065 -17.0
2100 -35.5
West
2017 0.0
2050 -10.7
2065 -17.0
2100 -35.5
Note: Negative value = recession
Figure 6-12: 100 year ARI storm demand superimposed on deterministic shoreline movement
WRL Technical Report 2017/09 FINAL October 2017 71
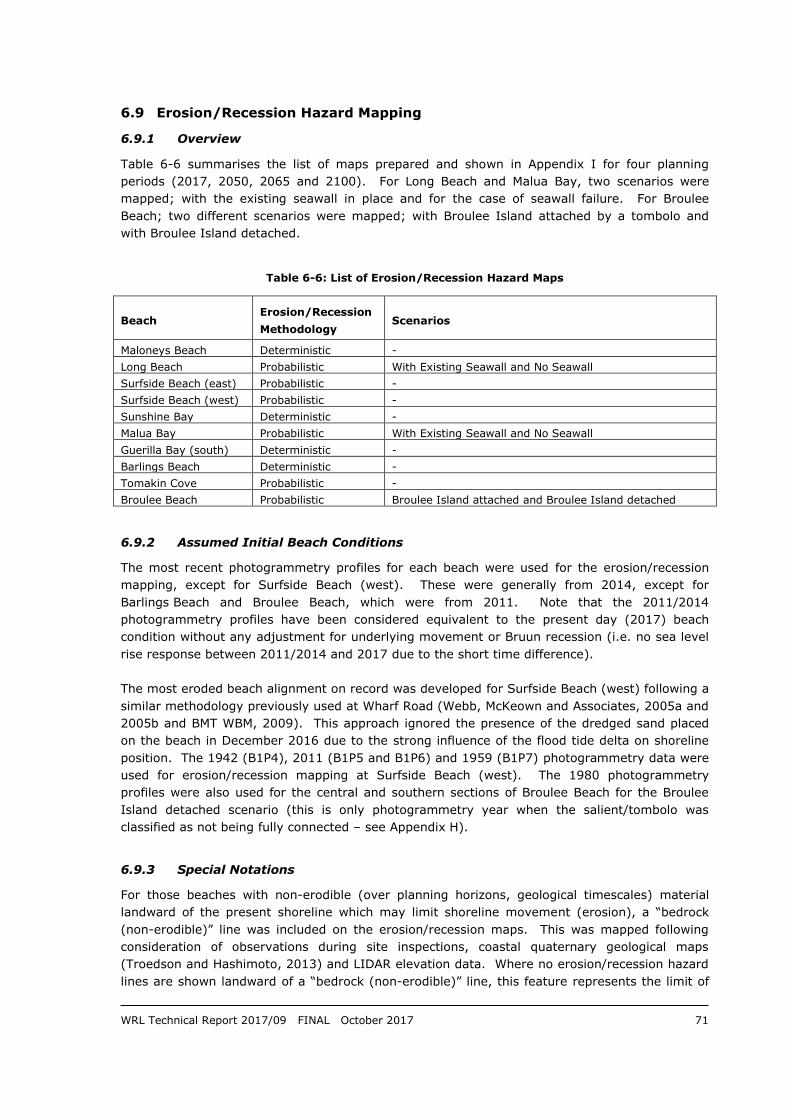
6.9 Erosion/Recession Hazard Mapping
6.9.1 Overview
Table 6-6 summarises the list of maps prepared and shown in Appendix I for four planning
periods (2017, 2050, 2065 and 2100). For Long Beach and Malua Bay, two scenarios were
mapped; with the existing seawall in place and for the case of seawall failure. For Broulee
Beach; two different scenarios were mapped; with Broulee Island attached by a tombolo and
with Broulee Island detached.
Table 6-6: List of Erosion/Recession Hazard Maps
Beach Erosion/Recession
Methodology Scenarios
Maloneys Beach Deterministic -
Long Beach Probabilistic With Existing Seawall and No Seawall
Surfside Beach (east) Probabilistic -
Surfside Beach (west) Probabilistic -
Sunshine Bay Deterministic -
Malua Bay Probabilistic With Existing Seawall and No Seawall
Guerilla Bay (south) Deterministic -
Barlings Beach Deterministic -
Tomakin Cove Probabilistic -
Broulee Beach Probabilistic Broulee Island attached and Broulee Island detached
6.9.2 Assumed Initial Beach Conditions
The most recent photogrammetry profiles for each beach were used for the erosion/recession
mapping, except for Surfside Beach (west). These were generally from 2014, except for
Barlings Beach and Broulee Beach, which were from 2011. Note that the 2011/2014
photogrammetry profiles have been considered equivalent to the present day (2017) beach
condition without any adjustment for underlying movement or Bruun recession (i.e. no sea level
rise response between 2011/2014 and 2017 due to the short time difference).
The most eroded beach alignment on record was developed for Surfside Beach (west) following a
similar methodology previously used at Wharf Road (Webb, McKeown and Associates, 2005a and
2005b and BMT WBM, 2009). This approach ignored the presence of the dredged sand placed
on the beach in December 2016 due to the strong influence of the flood tide delta on shoreline
position. The 1942 (B1P4), 2011 (B1P5 and B1P6) and 1959 (B1P7) photogrammetry data were
used for erosion/recession mapping at Surfside Beach (west). The 1980 photogrammetry
profiles were also used for the central and southern sections of Broulee Beach for the Broulee
Island detached scenario (this is only photogrammetry year when the salient/tombolo was
classified as not being fully connected – see Appendix H).
6.9.3 Special Notations
For those beaches with non-erodible (over planning horizons, geological timescales) material
landward of the present shoreline which may limit shoreline movement (erosion), a “bedrock
(non-erodible)” line was included on the erosion/recession maps. This was mapped following
consideration of observations during site inspections, coastal quaternary geological maps
(Troedson and Hashimoto, 2013) and LIDAR elevation data. Where no erosion/recession hazard
lines are shown landward of a “bedrock (non-erodible)” line, this feature represents the limit of
WRL Technical Report 2017/09 FINAL October 2017 72
erosion/recession (i.e. the cliff line is the erosion/recession hazard line). Areas landward of the
“bedrock (non-erodible)” line could be subject to coastal cliff or slope instability hazards, which
are beyond the scope of this study.”
For those beaches with a watercourse entrance (Table 6-6), a “watercourse instability region”
notation was included on the erosion/recession maps. This has been mapped qualitatively
following consideration of historical aerial photography (where available), photogrammetry
profiles adjacent to each watercourse entrance and any control points such as natural bedrock,
bridge abutments, box culverts and pipe outlets. These regions should be considered
representative of areas influenced by present day (2017) entrance dynamics. Assessment of the
estimated influence of climate change (i.e. sea level rise, altered hydrology or suspended
sediments) on entrance dynamics is outside the scope of works. In watercourse entrance
instability regions, the shoreline could potentially move landward of the erosion/recession hazard
lines due to lowering of the beach profile from entrance scouring and migration.
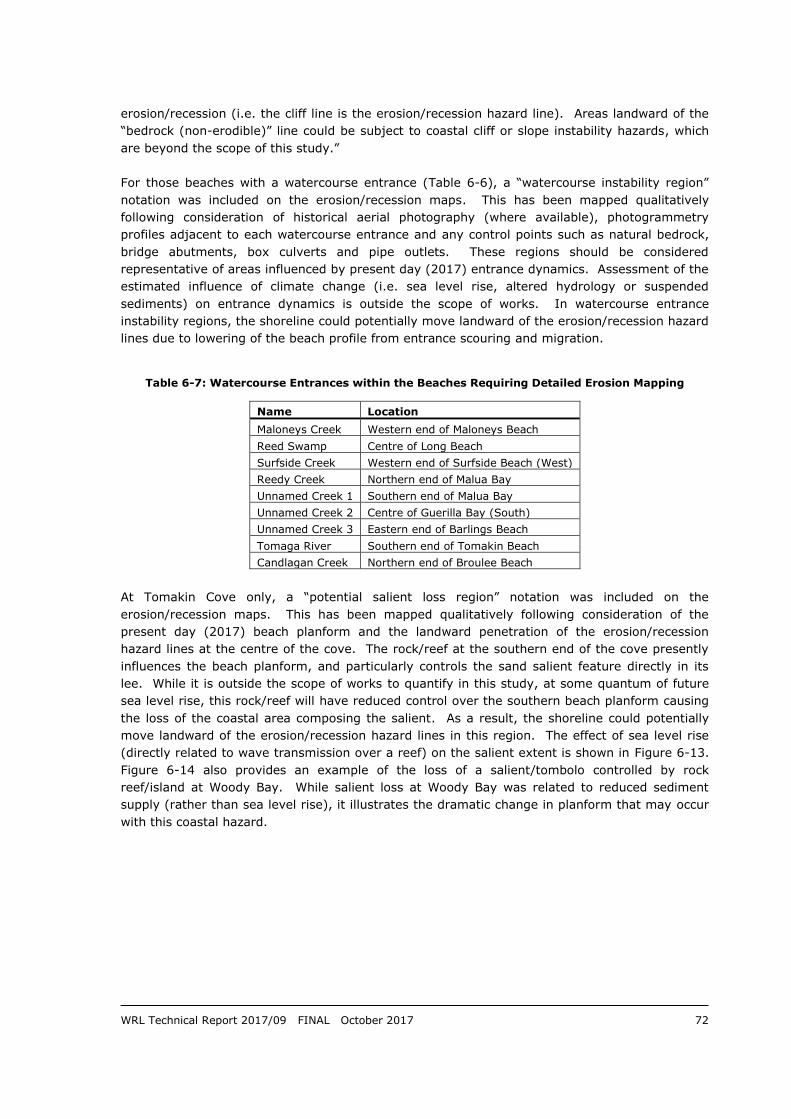
Table 6-7: Watercourse Entrances within the Beaches Requiring Detailed Erosion Mapping
Name Location
Maloneys Creek Western end of Maloneys Beach
Reed Swamp Centre of Long Beach
Surfside Creek Western end of Surfside Beach (West)
Reedy Creek Northern end of Malua Bay
Unnamed Creek 1 Southern end of Malua Bay
Unnamed Creek 2 Centre of Guerilla Bay (South)
Unnamed Creek 3 Eastern end of Barlings Beach
Tomaga River Southern end of Tomakin Beach
Candlagan Creek Northern end of Broulee Beach
At Tomakin Cove only, a “potential salient loss region” notation was included on the
erosion/recession maps. This has been mapped qualitatively following consideration of the
present day (2017) beach planform and the landward penetration of the erosion/recession
hazard lines at the centre of the cove. The rock/reef at the southern end of the cove presently
influences the beach planform, and particularly controls the sand salient feature directly in its
lee. While it is outside the scope of works to quantify in this study, at some quantum of future
sea level rise, this rock/reef will have reduced control over the southern beach planform causing
the loss of the coastal area composing the salient. As a result, the shoreline could potentially
move landward of the erosion/recession hazard lines in this region. The effect of sea level rise
(directly related to wave transmission over a reef) on the salient extent is shown in Figure 6-13.
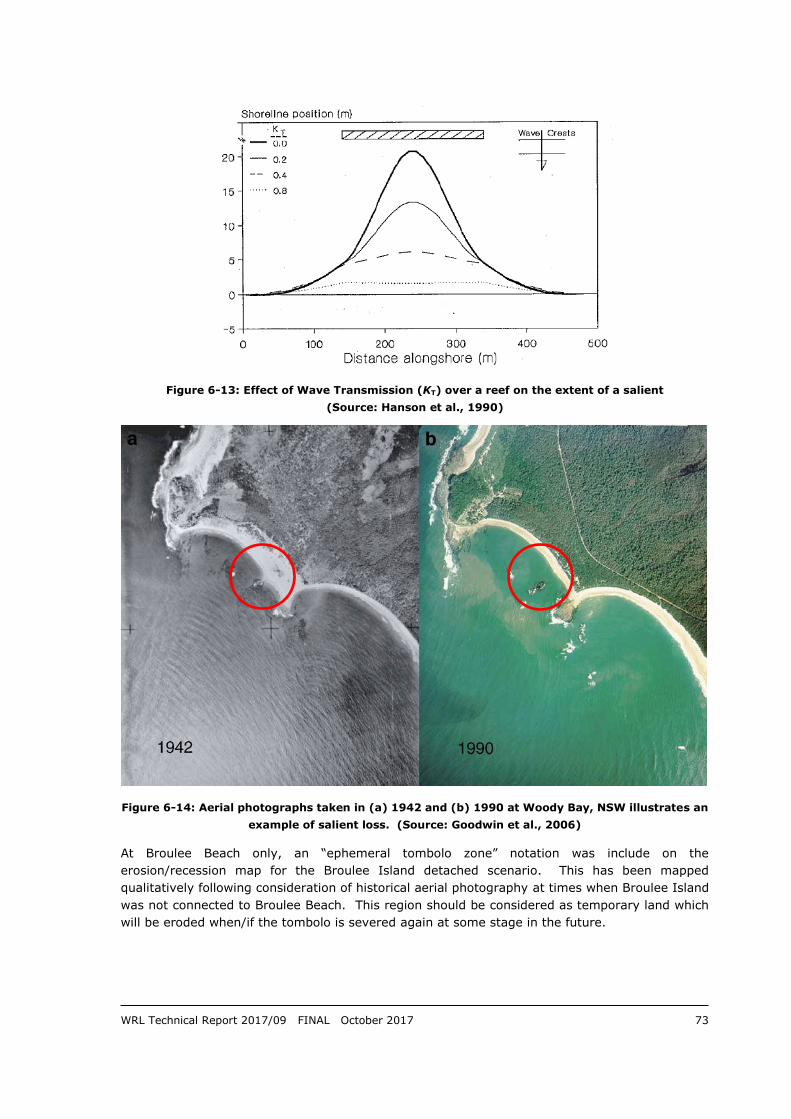
Figure 6-14 also provides an example of the loss of a salient/tombolo controlled by rock
reef/island at Woody Bay. While salient loss at Woody Bay was related to reduced sediment
supply (rather than sea level rise), it illustrates the dramatic change in planform that may occur
with this coastal hazard.
WRL Technical Report 2017/09 FINAL October 2017 73
Figure 6-13: Effect of Wave Transmission (KT) over a reef on the extent of a salient
(Source: Hanson et al., 1990)
Figure 6-14: Aerial photographs taken in (a) 1942 and (b) 1990 at Woody Bay, NSW illustrates an
example of salient loss. (Source: Goodwin et al., 2006)
At Broulee Beach only, an “ephemeral tombolo zone” notation was include on the
erosion/recession map for the Broulee Island detached scenario. This has been mapped
qualitatively following consideration of historical aerial photography at times when Broulee Island
was not connected to Broulee Beach. This region should be considered as temporary land which
will be eroded when/if the tombolo is severed again at some stage in the future.

WRL Technical Report 2017/09 FINAL October 2017 74
6.9.4 Zone of Slope Adjustment
While all erosion/recession hazard lines in Appendix I are based on the landward side of the
ZRFC, the distance from these lines to the seaward side of the ZRFC (the landward side of the
ZSA) is tabulated for every photogrammetry profile in Appendix J.