6. air quality · use of aermod procedures and data in accordance with epa’s assessment...
TRANSCRIPT
Works Approval Application
RO097400.WAA.23.04.2018 87
6. Air quality
6.1 Introduction
6.1.1 Purpose
The purpose of this Chapter is to provide an assessment of the potential air quality impacts due to future operations of AP’s proposed EfW plant (the Project) at Maryvale.
This report was prepared in accordance with the following legislation, policy and guidelines relevant for air quality impact assessment in Victoria (more details are provided in Section 6.2):
Victoria Government, Environment Protection Act (1970)
Victoria Government, State Environment Protection Policy (Air Quality Management), or ‘SEPP(AQM)’
Victoria Government, State Environment Protection Policy (Ambient Air Quality), or ‘SEPP(AAQ)’
Environment Protection Authority (EPA) Victoria Guidelines on the use of AERMOD (EPA, 2014a; EPA, 2014b)
EPA Victoria Guideline, Demonstrating Best Practice (EPA, 2013a)
EPA Victoria, Energy from Waste, Publication 1559 (EPA, 2013b)
EPA Victoria Recommended separation distances for Industrial Residual Air Emissions (IRAEs), Publication 1518 (EPA, 2013c)
EPA Victoria guideline 1559.1, Energy from Waste, (EPA, 2017).
Further technical details, including the Air Quality Impact Assessment, can be found in Appendix D: Air Quality.
6.1.2 Study area
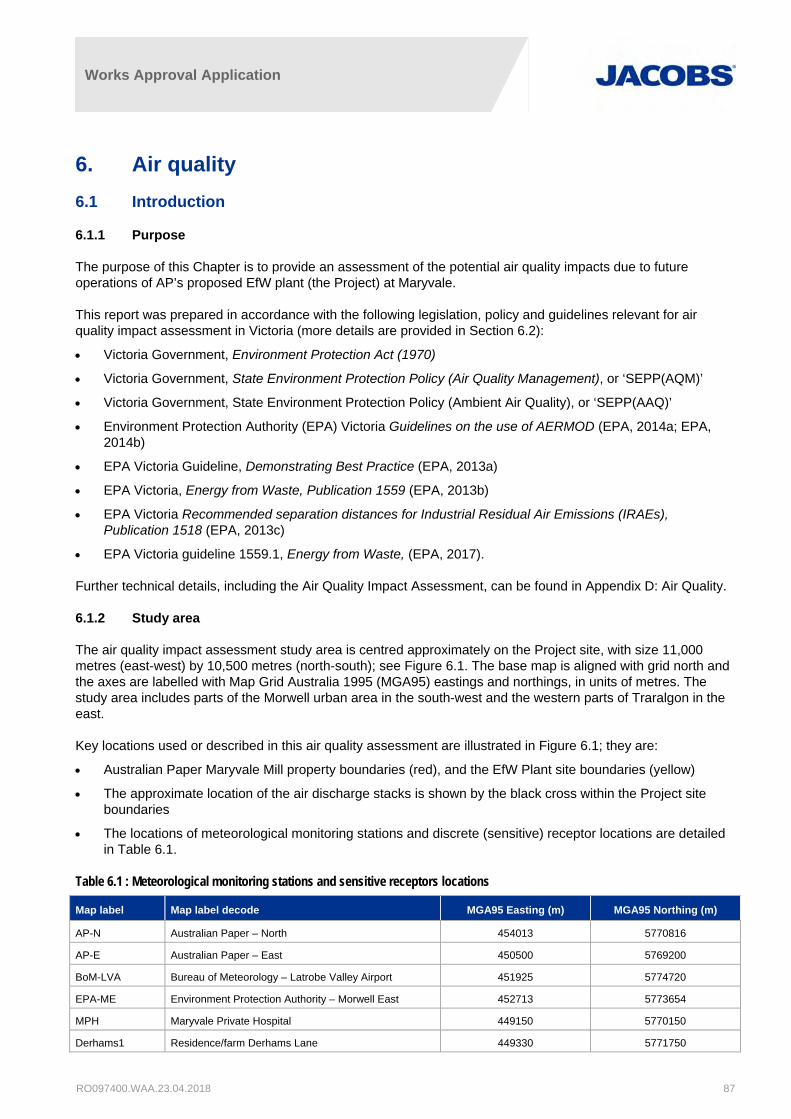
The air quality impact assessment study area is centred approximately on the Project site, with size 11,000 metres (east-west) by 10,500 metres (north-south); see Figure 6.1. The base map is aligned with grid north and the axes are labelled with Map Grid Australia 1995 (MGA95) eastings and northings, in units of metres. The study area includes parts of the Morwell urban area in the south-west and the western parts of Traralgon in the east.
Key locations used or described in this air quality assessment are illustrated in Figure 6.1; they are:
Australian Paper Maryvale Mill property boundaries (red), and the EfW Plant site boundaries (yellow)
The approximate location of the air discharge stacks is shown by the black cross within the Project site boundaries
The locations of meteorological monitoring stations and discrete (sensitive) receptor locations are detailed in Table 6.1.
Table 6.1 : Meteorological monitoring stations and sensitive receptors locations
Map label Map label decode MGA95 Easting (m) MGA95 Northing (m)
AP-N Australian Paper – North 454013 5770816
AP-E Australian Paper – East 450500 5769200
BoM-LVA Bureau of Meteorology – Latrobe Valley Airport 451925 5774720
EPA-ME Environment Protection Authority – Morwell East 452713 5773654
MPH Maryvale Private Hospital 449150 5770150
Derhams1 Residence/farm Derhams Lane 449330 5771750

Works Approval Application
RO097400.WAA.23.04.2018 88
Map label Map label decode MGA95 Easting (m) MGA95 Northing (m)
OldMelb Residence/farm Old Melbourne Rd. 448830 5771570
Paul Residence Paul St. 448930 5771130
Scrub1 Scrubby Lane 1 454550 5771850
Scrub2 Scrubby Lane 2 454890 5772470
Scrub3 Scrubby Lane 3 455070 5772990
Alex Alexanders Road 451200 5769950
GRCH Gippsland Rotary Centenary House 453760 5770130
Derhams2 Derhams Road 449925 5775075
Sawyers Sawyers Lane 451975 5776200
Littles Littles Lane 452960 5775780
Tyers Tyers Road 455400 5775380
Cem Cemetery 455915 5774295
Grid points 19.026 grid points analysed by the model
Model Domain
151 columns x 126 rows; 100 metre resolution; 15.0km
east-west x 12.5km north-south
Figure 6.1 : Air quality impact assessment study area
Works Approval Application
RO097400.WAA.23.04.2018 89
6.1.3 Project description
The proposed Project, comprises an EfW facility with all emissions to air to be emitted via a single stack with two or three flues with height approximately 95 metres above ground level, located on the existing AP Maryvale Mill site. The EfW Plant will have a nominal output of 70 megawatts (MW), with the combustion of waste via a moving-grate fired boiler, a 6MW ‘black-start’ diesel generator, and a 200 kiloWatt (kW) emergency shut-down generator.
The EfW tipping hall, which will receive waste by train and/or truck, will be entirely enclosed and operated under negative pressure – for this reason the expectation is there will be no significant fugitive odour and other air pollutant emissions from the site. Odorous molecules and hydrocarbons are expected to be destroyed in the EfW’s processes; i.e., foul air from the tipping hall will be used as combustion air in the EfW boiler.
6.1.4 Limitations
This air quality impact assessment was undertaken to support the AP EfW feasibility study. The assessment, undertaken in accordance with the procedures set out in the SEPP(AQM), was limited by the data and methods used for the air pollutant dispersion modelling, including: annual meteorological datasets created for use by the ‘AERMOD’ dispersion model; air pollutant emissions estimates; Project plans and elevations; and the methods for using AERMOD prescribed in EPA (2014a) and EPA (2014b).
To address these limitations, wherever possible conservative steps have been taken with the input data used in this assessment, but with a view to not overstating the impacts. The SEPP(AQM) and AERMOD guidelines require that tens of thousands of air dispersion modelling tests be undertaken to provide confidence that the potential for air quality impact in any location in a study area, is described and assessed.
This sub-section lists and describes the main limitations of the air quality impact assessment. The limitations are related to the quality of input data used in the AERMOD air dispersion model.
Air emissions estimates for EfW processes
Use of AERMOD procedures and data in accordance with EPA’s assessment procedures and data (EPA, 2014a; EPA, 2014b)
Quality of the meteorological data used as input to AERMOD – to a large extent this limitation is offset by the assessment’s use of five years (2012-2016) of hourly meteorological data incorporating observations from the Bureau of Meteorology Latrobe Valley Airport (BoM LVA) monitoring station, and one year (2016) of meteorological data incorporating hourly average wind speed and wind direction measured by Australian Paper North (AP-N) monitoring station.
6.2 Legislation, policy and guidelines
6.2.1 Overview
Legislation, policy and guidelines relevant to the air quality impact assessment for the Project are summarised in Table 6.2 below. Further details are given in subsequent sections of this section.
Table 6.2 : Legislation, policy and guidelines – air quality impact assessment
Legislation Applicability to Project
Environment Effects Act 1978 Provides for the assessment of actions that are capable of having significant environmental effects;
such actions should be referred to the Victorian Minister for Planning, who decides if an Environment
Effects Statement (EES) is required.
An EES Referral has been submitted to DELWP for the Project
State Environment Protection Policy
(Air Quality Management) –
Emissions
The Project in Maryvale is located within the Latrobe Valley Air Quality Control Region (LVAQCR) as
defined in Schedule F of the SEPP(AQM). The EPA regards the EfW plant as a new stationary
source, which must meet the emission limits in Schedule E of the SEPP(AQM)

Works Approval Application
RO097400.WAA.23.04.2018 90
Legislation Applicability to Project
State Environment Protection Policy
(Air Quality Management) –Ambient
Air Quality
The SEPP (AQM) ambient air quality standards are set out as ‘indicators’ (substances) and their
‘Design Criteria’, the latter being limits for Ground Level Concentrations (GLCs). The Project must
ensure Design Criteria are used in conjunction with the modelling procedures outlined in Schedule C
of SEPP(AQM)
EPA Energy from Waste guideline
(EPA, 2017),
The EPA states that proponents of EfW proposals which require a works approval or licence will be
expected to demonstrate that the siting, design, construction and operation of EfW facilities will
incorporate best practice measures for the protection of air environments as well as for energy
efficiency and greenhouse gas emissions management. It also must comply with SEPP(AQM) and
EU Industrial Emissions Directive 2010/75/EU (IED)
European Union Industrial
Emissions Directive 2010/75/EU
The EPA (2017) Energy from Waste Guideline requires emission discharges from EfW plants
developed and operated in Victoria to meet the Industrial Emissions Directive 2010/75/EU (IED)
emission limits under both steady and non-steady state operating conditions. These emission limits
specified for the EfW boiler exhaust gases are set out in Appendix 6 from the IED 2010/75/EU, Part
3 – Air emissions limit values for waste incineration plants
United States Environmental
Protection Agency (USEPA) Tier 4
exhaust emission standard
The emergency diesel generator has been specified to meet a United States Environmental
Protection Agency (USEPA) Tier 4 exhaust emission standard for non-road, compression-ignition
engines
EPA Requirements for Best Practice
Emission Control
Under the Environment Protection Act 1970 (the EP Act), State Environment Protection Policies
(SEPPs) set out what must be done to protect Victoria’s environment concerning potential impacts to
air, water and land, and the control of noise. Sources of emissions or discharges to the environment
must be managed in accordance with ‘best practice’
Industrial Residual Air Emissions
(IRAE 2013b)
Recommended separation distances for Industrial Residual Air Emissions (EPA, 2013b), sets out
separation distances for ‘unintended’ or non-routine emissions that can be intermittent or episodic
and may originate at or near ground level
6.2.1.1 State Environment Protection Policy (Air Quality Management) - Emission Standards
The Project is located within the Latrobe Valley Air Quality Control Region (AQCR).
The EPA regards the EfW plant as a new stationary source, which must meet the emission limits in Schedule E of the SEPP(AQM). A "stationary source" means a "source of emissions of wastes to air from commercial or industrial premises that is stationary during its normal operating mode".
The SEPP(AQM) air emission limits are listed in Schedule E of the SEPP(AQM); emission limits relevant to the EfW boiler; i.e., inside AQCRs, are listed in Table 6.3. These emission limits must be complied with unless EPA has specified conditions or approvals under which excess emissions from events such as commissioning, start-up or shut-down are permitted.
Table 6.3 : Project-relevant SEPP(AQM) Schedule E Emission Limits for Stationary Sources
Emissions source Waste; applicable source Emission limit (mg/Nm3) 1
Recip. Engine Particulate Matter (PM)
Boiler
Particulate Matter (PM) 250
Carbon Monoxide (CO) 2,500
Oxides of Nitrogen (NOX) – gas fuel 350
Oxides of Nitrogen (NOX) – solid fuel 500
Note 1. Gas volumes are expressed at 25oC and at an absolute pressure of one atmosphere (1013.25 hPa).
Note 2. CM is the measured NOx concentration (g/m3); O2 concentrations expressed volumetrically.
Note 3. Dilution of wastes to meet emission limits shall not be permitted except where noted.
Works Approval Application
RO097400.WAA.23.04.2018 91
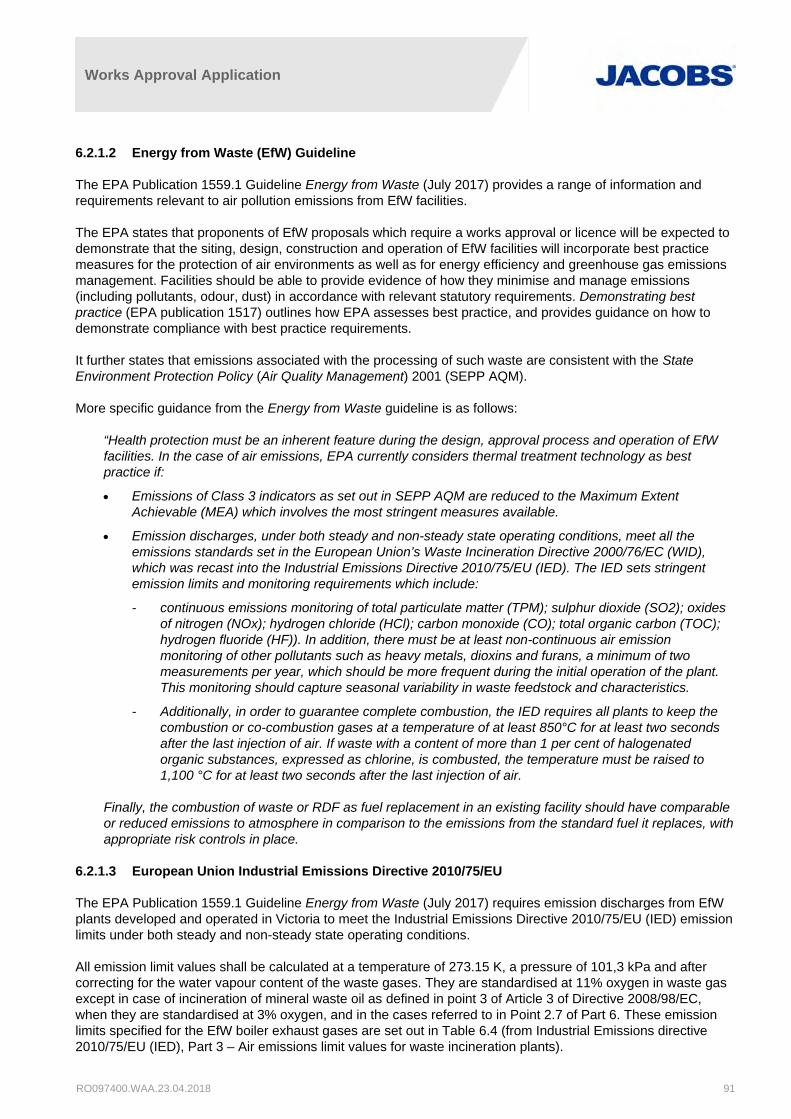
6.2.1.2 Energy from Waste (EfW) Guideline
The EPA Publication 1559.1 Guideline Energy from Waste (July 2017) provides a range of information and requirements relevant to air pollution emissions from EfW facilities.
The EPA states that proponents of EfW proposals which require a works approval or licence will be expected to demonstrate that the siting, design, construction and operation of EfW facilities will incorporate best practice measures for the protection of air environments as well as for energy efficiency and greenhouse gas emissions management. Facilities should be able to provide evidence of how they minimise and manage emissions (including pollutants, odour, dust) in accordance with relevant statutory requirements. Demonstrating best practice (EPA publication 1517) outlines how EPA assesses best practice, and provides guidance on how to demonstrate compliance with best practice requirements.
It further states that emissions associated with the processing of such waste are consistent with the State Environment Protection Policy (Air Quality Management) 2001 (SEPP AQM).
More specific guidance from the Energy from Waste guideline is as follows:
“Health protection must be an inherent feature during the design, approval process and operation of EfW facilities. In the case of air emissions, EPA currently considers thermal treatment technology as best practice if:
Emissions of Class 3 indicators as set out in SEPP AQM are reduced to the Maximum Extent Achievable (MEA) which involves the most stringent measures available.
Emission discharges, under both steady and non-steady state operating conditions, meet all the emissions standards set in the European Union’s Waste Incineration Directive 2000/76/EC (WID), which was recast into the Industrial Emissions Directive 2010/75/EU (IED). The IED sets stringent emission limits and monitoring requirements which include:
- continuous emissions monitoring of total particulate matter (TPM); sulphur dioxide (SO2); oxides of nitrogen (NOx); hydrogen chloride (HCl); carbon monoxide (CO); total organic carbon (TOC); hydrogen fluoride (HF)). In addition, there must be at least non-continuous air emission monitoring of other pollutants such as heavy metals, dioxins and furans, a minimum of two measurements per year, which should be more frequent during the initial operation of the plant. This monitoring should capture seasonal variability in waste feedstock and characteristics.
- Additionally, in order to guarantee complete combustion, the IED requires all plants to keep the combustion or co-combustion gases at a temperature of at least 850°C for at least two seconds after the last injection of air. If waste with a content of more than 1 per cent of halogenated organic substances, expressed as chlorine, is combusted, the temperature must be raised to 1,100 °C for at least two seconds after the last injection of air.
Finally, the combustion of waste or RDF as fuel replacement in an existing facility should have comparable or reduced emissions to atmosphere in comparison to the emissions from the standard fuel it replaces, with appropriate risk controls in place.
6.2.1.3 European Union Industrial Emissions Directive 2010/75/EU
The EPA Publication 1559.1 Guideline Energy from Waste (July 2017) requires emission discharges from EfW plants developed and operated in Victoria to meet the Industrial Emissions Directive 2010/75/EU (IED) emission limits under both steady and non-steady state operating conditions.
All emission limit values shall be calculated at a temperature of 273.15 K, a pressure of 101,3 kPa and after correcting for the water vapour content of the waste gases. They are standardised at 11% oxygen in waste gas except in case of incineration of mineral waste oil as defined in point 3 of Article 3 of Directive 2008/98/EC, when they are standardised at 3% oxygen, and in the cases referred to in Point 2.7 of Part 6. These emission limits specified for the EfW boiler exhaust gases are set out in Table 6.4 (from Industrial Emissions directive 2010/75/EU (IED), Part 3 – Air emissions limit values for waste incineration plants).

Works Approval Application
RO097400.WAA.23.04.2018 92
Table 6.4 : Industrial Emissions Directive 2010/75/EU (IED) Emission Limits
Pollutants Emission Limit
(mg/Nm3)
100th percentile
Emission Limit
(mg/Nm3)
97th percentile
Averaging time
Pollutants (general)
Total dust 10 24 hour
Total organic carbon (TOC) 10 24 hour
Hydrogen chloride (HCl) 10 24 hour
Hydrogen fluoride (HF) 1 24 hour
Sulphur dioxide (SO2) 50 24 hour
Oxides of nitrogen (NOx) as nitrogen dioxide (NO2) 200 24 hour
Carbon monoxide (CO) 50 24 hour
Total dust 30 10 0.5 hour
Total organic carbon (TOC) 20 10 0.5 hour
Hydrogen chloride (HCl) 60 10 0.5 hour
Hydrogen fluoride (HF) 4 2 0.5 hour
Sulphur dioxide 200 50 0.5 hour
Oxides of nitrogen (NOx) as nitrogen dioxide (NO2) 400 200 0.5 hour
Carbon monoxide (CO) 100 0.5 hour
Carbon monoxide (CO) 150 10-minute
Pollutants (heavy metals)
Cd + Tl 0.05 0.5 hours
Hg 0.05 0.5 hours
Sb+As+Pb+Cr+Co+Cu+Mn+Ni+V 0.5 0.5 hours
Pollutants (other toxic)
Dioxins / furans (D/Fs) 0.1 (ng/Nm3) 6 hours
Note: Cd = cadmium plus its compounds, Tl = thalium plus its compounds, Hg = mercury and its compounds, Sb = antimony and its
compounds, As = arsenic and its compounds, Pb = lead and its compounds, Cr = chromium and its compounds, Co = cobalt and its
compounds, Cu = copper and its compounds, Mn = manganese and its compounds, Ni = nickel and its compounds, V = vanadium and its
compounds
6.2.1.4 USEP Tier 4 emission standards (for Diesel Generator)
The emergency diesel generator has been specified to meet a USEPA Tier 4 emission standard (as set out in Table 6.5:
Non-road Compression-Ignition Engines: Exhaust Emission Standards.
Table 6.5 : USEPA Tier 4 Emission Standard (engines larger than 900 kW operating as generator set)
NMHC (g/kW-hr) NOx (g/kW-hr) PM (g/kW-h) CO (g/kW-hr)
0.19 0.67 0.03 3.5
Works Approval Application
RO097400.WAA.23.04.2018 93
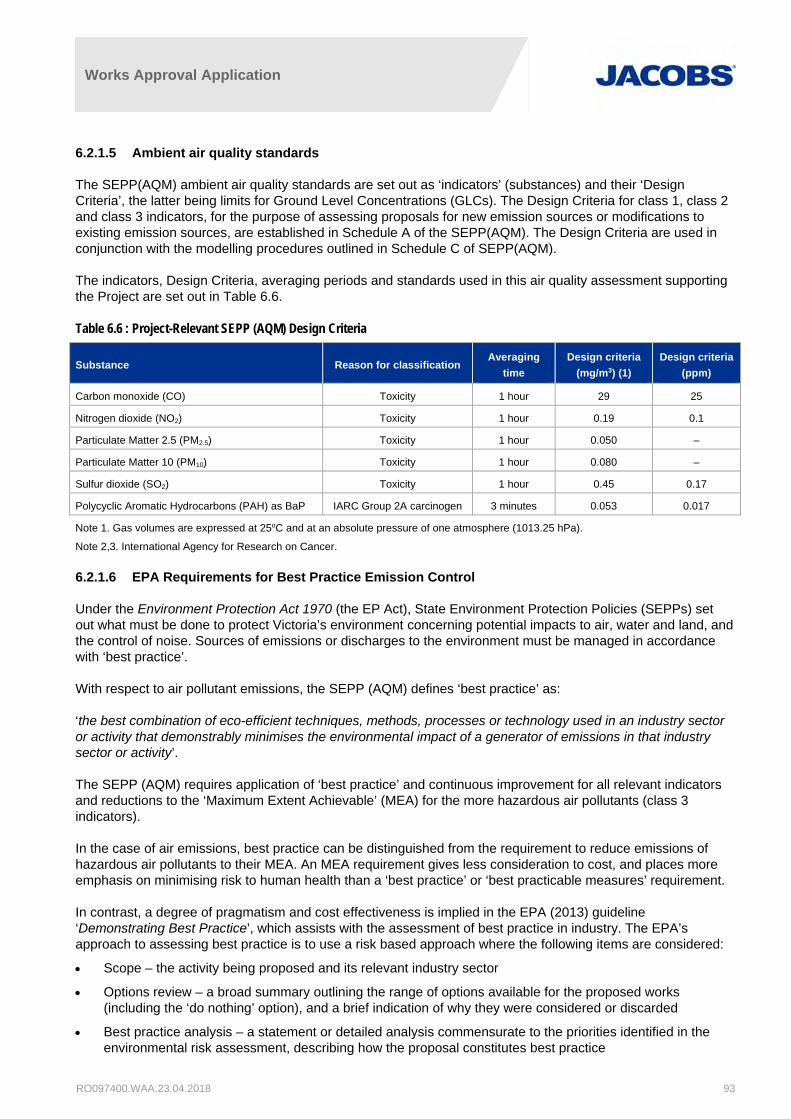
6.2.1.5 Ambient air quality standards
The SEPP(AQM) ambient air quality standards are set out as ‘indicators’ (substances) and their ‘Design Criteria’, the latter being limits for Ground Level Concentrations (GLCs). The Design Criteria for class 1, class 2 and class 3 indicators, for the purpose of assessing proposals for new emission sources or modifications to existing emission sources, are established in Schedule A of the SEPP(AQM). The Design Criteria are used in conjunction with the modelling procedures outlined in Schedule C of SEPP(AQM).
The indicators, Design Criteria, averaging periods and standards used in this air quality assessment supporting the Project are set out in Table 6.6.
Table 6.6 : Project-Relevant SEPP (AQM) Design Criteria
Substance Reason for classification Averaging
time
Design criteria
(mg/m3) (1)
Design criteria
(ppm)
Carbon monoxide (CO) Toxicity 1 hour 29 25
Nitrogen dioxide (NO2) Toxicity 1 hour 0.19 0.1
Particulate Matter 2.5 (PM2.5) Toxicity 1 hour 0.050 –
Particulate Matter 10 (PM10) Toxicity 1 hour 0.080 –
Sulfur dioxide (SO2) Toxicity 1 hour 0.45 0.17
Polycyclic Aromatic Hydrocarbons (PAH) as BaP IARC Group 2A carcinogen 3 minutes 0.053 0.017
Note 1. Gas volumes are expressed at 25oC and at an absolute pressure of one atmosphere (1013.25 hPa).
Note 2,3. International Agency for Research on Cancer.
6.2.1.6 EPA Requirements for Best Practice Emission Control
Under the Environment Protection Act 1970 (the EP Act), State Environment Protection Policies (SEPPs) set out what must be done to protect Victoria’s environment concerning potential impacts to air, water and land, and the control of noise. Sources of emissions or discharges to the environment must be managed in accordance with ‘best practice’.
With respect to air pollutant emissions, the SEPP (AQM) defines ‘best practice’ as:
‘the best combination of eco-efficient techniques, methods, processes or technology used in an industry sector or activity that demonstrably minimises the environmental impact of a generator of emissions in that industry sector or activity’.
The SEPP (AQM) requires application of ‘best practice’ and continuous improvement for all relevant indicators and reductions to the ‘Maximum Extent Achievable’ (MEA) for the more hazardous air pollutants (class 3 indicators).
In the case of air emissions, best practice can be distinguished from the requirement to reduce emissions of hazardous air pollutants to their MEA. An MEA requirement gives less consideration to cost, and places more emphasis on minimising risk to human health than a ‘best practice’ or ‘best practicable measures’ requirement.
In contrast, a degree of pragmatism and cost effectiveness is implied in the EPA (2013) guideline ‘Demonstrating Best Practice’, which assists with the assessment of best practice in industry. The EPA’s approach to assessing best practice is to use a risk based approach where the following items are considered:
Scope – the activity being proposed and its relevant industry sector
Options review – a broad summary outlining the range of options available for the proposed works (including the ‘do nothing’ option), and a brief indication of why they were considered or discarded
Best practice analysis – a statement or detailed analysis commensurate to the priorities identified in the environmental risk assessment, describing how the proposal constitutes best practice

Works Approval Application
RO097400.WAA.23.04.2018 94
Best practice assessment – having considered all available evidence, the assessment provides an integrated conclusion to the best practice analysis demonstrating the best combination of eco-efficient techniques, methods, processes or technology (as relevant) and summarising the justification of the preferred approach.
EPA (2013) outlines suggested evidence or analysis techniques that can be used to demonstrate an assessment of best practice for a Works Approval Application. Types of evidence include:
Literature review
Benchmarking
Application of the wastes hierarchy
Integration of economic, social and environmental considerations
Integrated environmental assessment.
Section 6.4.4 sets out an overview of air pollution emission controls to be applied to the project. Chapter 5: Environmental Best Practice provides more detailed information on best practice with regard to air quality.
6.2.1.7 Industrial Residual Air Emissions (IRAE)
The EPA Publication 1518 (March 2013) Recommended separation distances for Industrial Residual Air Emissions (IRAEs) sets out separation distances for ‘unintended’ or non-routine emissions that can be intermittent or episodic and may originate at or near ground level. The purpose of a separation distance is to avoid the potential consequences of IRAEs. An adequate separation distance should allow IRAEs to dissipate without adverse impacts on sensitive land uses.
The EfW plant is classified as a Waste Management – Advanced Resource Technology Facility, defined as:
Waste treatment facility for the immobilisation, thermal degradation, chemical conversion, biological oxidation (aerobic or anaerobic), incineration or gasification or other treatment of solid waste.
There is no set separation distance for such facilities and rather they are required to be assessed on a “case by case” basis. For the Maryvale Mill site, there is an “Urban Amenity Buffer” surrounding the site. This was implemented under amendment C87 (Part 2) of the Latrobe City Planning Scheme and gazetted on 12 Jan 2017 (specifically Clauses 21.04, 21.06 and 21.07 of the Municipal Strategic Statement were amended). This buffer is approximately 3kms from most of the nearest receptors.
The Maryvale Mill was first established in the 1930s and has, over time, seen residential townships, including Traralgon and Morwell, expand closer to it. This encroachment has occurred despite there being planning policies which should have operated to provide a five (5) kilometre separation distance or “buffer” between the Mill and sensitive (e.g. residential) development.
AP has already carried out considerable work at significant expense to reduce the extent of its potential off-site impacts. AP has undertaken detailed investigations to determine a site specific distance that was suitable as a buffer from new sensitive land uses. The buffer was designed to provide certainty for both the mill and local community into the future, by ensuring there would be no changes to the existing zoning and overlays directly surrounding the mill.
Works undertaken to determine an appropriate buffer include odour modelling studies, and community engagement as a part of the Traralgon Growth Areas Review (TGAR) and subsequent Amendment C87, over a 5-year period, culminating in its consideration by an independent planning panel. Given that the Urban Amenity Buffer is incorporated into the Latrobe Planning Scheme; AP considers this buffer appropriate for the EfW Plant also.

Works Approval Application
RO097400.WAA.23.04.2018 95
Figure 6.2 : Land subject to Amendment C87 Part 2

Works Approval Application
RO097400.WAA.23.04.2018 96
It is noted that the Energy from Waste (EfW) Guideline states that both steady and non-steady state operations must meet all the emissions standards set in the Industrial Emissions Directive 2010/75/EU (IED). Where non-routine operations have the same meaning as non-steady state operations these are assessed with respect to compliance with the IED.
All potential emission sources are outlined and discussed in Section 6.4.
6.3 Method – air quality impact assessment
This section sets out the air quality impact assessment methodology.
6.3.1 Air quality impact assessment of project operations
The air quality impact assessment methodology for the proposed EfW operations at Maryvale was based on the procedures set out in the State Environment Protection Policy (Air Quality Management), or ‘SEPP(AQM)’, and in the EPA Guidelines for use of the regulatory model AERMOD (EPA, 2014a; EPA, 2014b).
Key aspects of the methodology and data to be used in the assessment were discussed and agreed with EPA air quality specialists on 22nd November, 2017. This included use of the regulatory model AERMOD with a five-year dataset of hourly meteorological data for modelling in accordance with EPA (2014a) and EPA (2014b); see Section 6.3.7 (Stakeholder Engagement), and Section 6.5.2.11 (Local Dispersion Meteorology).
The assessment of the Project’s air emissions comprised these two main steps:
Modelling the transport and dispersion of air pollutant emissions from key sources identified for the Project
Comparisons of AERMOD predictions for Ground Level Concentrations (GLCs) for each pollutant with corresponding SEPP(AQM) Design Criteria, after existing (or ‘background’) air pollutant concentrations were added to the AERMOD results.
The key sources of air pollutant emissions identified for assessment and outlined in Section 6.4 are the:
EfW boiler stack
Diesel generator – 6 MW (start-up and peak electricity supply).
Other potential sources include an emergency diesel generator approx. 200-350 kW in size and fugitive odour emissions from the EfW plant. These sources are not-assessed qualitatively. In the case of emergency diesel generator, it would be used very infrequently and will be no bigger than a small truck engine with negligible impact. In the case of fugitive odours, the management of these through the design of the facility is discussed in Section 6.4 and Section 6.7.
Also discussed in Section 6.4 and Section 6.7 are any potential non-routine or Industrial Residual Air Emissions (IRAEs) and their mitigation and management.
A detailed air emissions inventory was developed for use in the dispersion modelling assessment, in consultation with Australian Paper.
The Project study area at Maryvale is located within the Latrobe Valley Air Quality Control Region (AQCR) (VG, 2001). EfW plant air emissions estimates were made with the emissions limits set out in the SEPP(AQM) for the Latrobe Valley AQCR and the Industrial Emissions Directive 2010/75/EU (IED).
Air emissions estimates were calculated for the stacks for use with AERMOD.
Works Approval Application
RO097400.WAA.23.04.2018 97
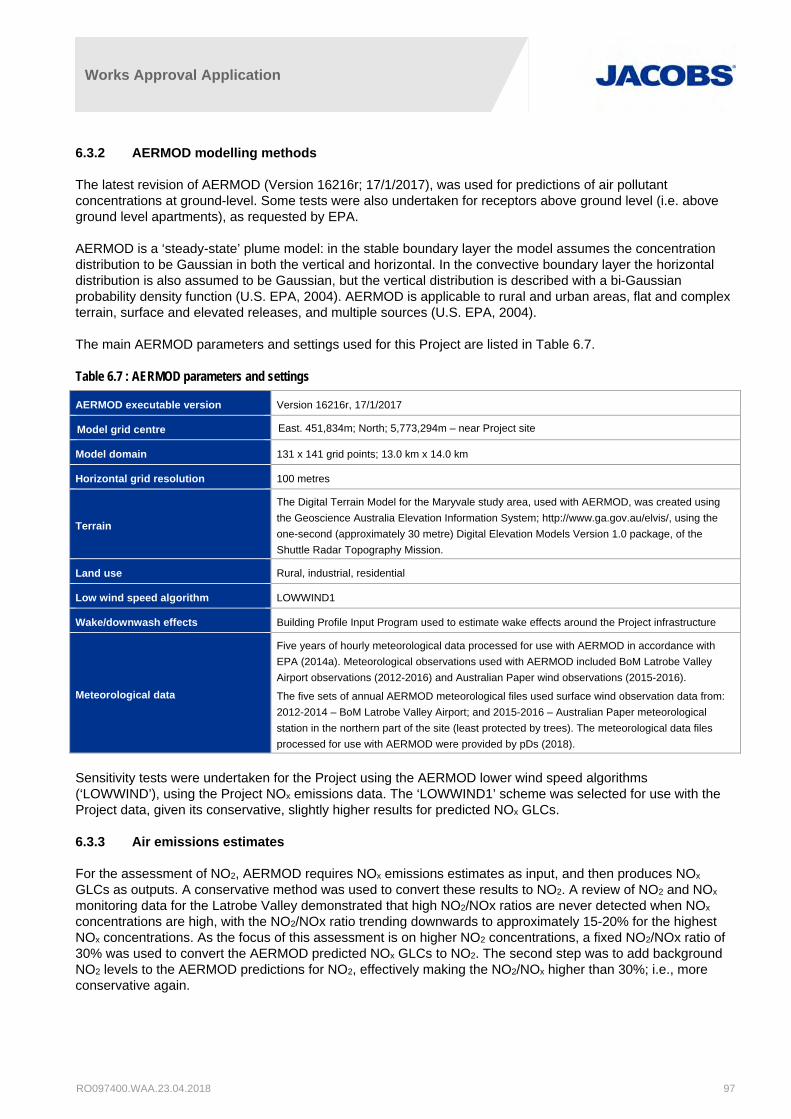
6.3.2 AERMOD modelling methods
The latest revision of AERMOD (Version 16216r; 17/1/2017), was used for predictions of air pollutant concentrations at ground-level. Some tests were also undertaken for receptors above ground level (i.e. above ground level apartments), as requested by EPA.
AERMOD is a ‘steady-state’ plume model: in the stable boundary layer the model assumes the concentration distribution to be Gaussian in both the vertical and horizontal. In the convective boundary layer the horizontal distribution is also assumed to be Gaussian, but the vertical distribution is described with a bi-Gaussian probability density function (U.S. EPA, 2004). AERMOD is applicable to rural and urban areas, flat and complex terrain, surface and elevated releases, and multiple sources (U.S. EPA, 2004).
The main AERMOD parameters and settings used for this Project are listed in Table 6.7.
Table 6.7 : AERMOD parameters and settings
AERMOD executable version Version 16216r, 17/1/2017
Model grid centre East. 451,834m; North; 5,773,294m – near Project site
Model domain 131 x 141 grid points; 13.0 km x 14.0 km
Horizontal grid resolution 100 metres
Terrain
The Digital Terrain Model for the Maryvale study area, used with AERMOD, was created using
the Geoscience Australia Elevation Information System; http://www.ga.gov.au/elvis/, using the
one-second (approximately 30 metre) Digital Elevation Models Version 1.0 package, of the
Shuttle Radar Topography Mission.
Land use Rural, industrial, residential
Low wind speed algorithm LOWWIND1
Wake/downwash effects Building Profile Input Program used to estimate wake effects around the Project infrastructure
Meteorological data
Five years of hourly meteorological data processed for use with AERMOD in accordance with
EPA (2014a). Meteorological observations used with AERMOD included BoM Latrobe Valley
Airport observations (2012-2016) and Australian Paper wind observations (2015-2016).
The five sets of annual AERMOD meteorological files used surface wind observation data from:
2012-2014 – BoM Latrobe Valley Airport; and 2015-2016 – Australian Paper meteorological
station in the northern part of the site (least protected by trees). The meteorological data files
processed for use with AERMOD were provided by pDs (2018).
Sensitivity tests were undertaken for the Project using the AERMOD lower wind speed algorithms (‘LOWWIND’), using the Project NOx emissions data. The ‘LOWWIND1’ scheme was selected for use with the Project data, given its conservative, slightly higher results for predicted NOx GLCs.
6.3.3 Air emissions estimates
For the assessment of NO2, AERMOD requires NOx emissions estimates as input, and then produces NOx GLCs as outputs. A conservative method was used to convert these results to NO2. A review of NO2 and NOx monitoring data for the Latrobe Valley demonstrated that high NO2/NOx ratios are never detected when NOx concentrations are high, with the NO2/NOx ratio trending downwards to approximately 15-20% for the highest NOx concentrations. As the focus of this assessment is on higher NO2 concentrations, a fixed NO2/NOx ratio of 30% was used to convert the AERMOD predicted NOx GLCs to NO2. The second step was to add background NO2 levels to the AERMOD predictions for NO2, effectively making the NO2/NOx higher than 30%; i.e., more conservative again.
Works Approval Application
RO097400.WAA.23.04.2018 98
The particulate emissions from the EfW stack were assumed to be all PM2.5. Primarily, this was because the efficiency of the particulate emissions controls for the EfW are expected to remove the majority of particles greater than PM2.5, from the emissions. Also, assessing all the particulate emissions as PM2.5 is a conservative measure in the assessment as the air quality standards for PM2.5 are stricter than for PM10.
For particulate emissions, the Ricardo-AEA report18 found that the average of the maximum concentration of PM2.5 emissions from sampled UK EfW plants was 0.019 mg/Nm3, representing between 2.7 and 3.6% of the total particulate matter emissions (PMtotal). The average concentration of PM2.5 emissions for the sampled UK EfW plants was found to be 0.012 mg/Nm3. It is considered that the figure of 0.019 mg/Nm3 is an appropriate emissions estimate to be used for the particulate matter modelling and it is also considered that the figure is reasonably conservative, given that the average concentration of PM2.5 emissions for the sampled UK EfW plants was 0.012 mg/Nm3.
Accordingly, this assessment used the following concentrations of PM 2.5 emissions as the basis for the particulate matter modelling predictions:
0.02 mg/Nm3, representing an average EfW plant’s PM2.5 emissions concentration that may be specified by the EPC contractors’ designs. This is considered an appropriate emissions estimate for an average UK EfW plant based on the average maximum concentration of PM 2.5 emissions (of 0.019 mg/Nm3) from sampled UK EfW plants, rounded to one significant figure.
30 mg/Nm3, representing the IED limit (for short-term averages) and the highest in-stack emissions concentration allowed for under the IED. The factor of safety modelling at the IED limit is intended to provide a conservative buffer for the AERMOD modelling, so that if the results show compliance with the 30 mg/Nm3, figure, it can be assumed that the proposed EfW Plant will comfortably comply with SEPP (AQM) and IED requirements at a possible in-stack emissions concentration of 0.02 mg/Nm3.
For the assessment of emissions of toxic elements, (primarily metals), the risk of air quality impact for each was determined by comparisons of air emission estimates with design criteria. The elements with a higher proportion of emissions rate compared to the SEPP (AQM) design criteria were the higher risk elements. If these elements were shown to be compliant with the SEPP (AQM) criteria, then other elements with lower proportions would also comply with SEPP (AQM).
The risk assessment results indicated that hexavalent chromium (Cr (VI)) and cadmium (Cd) should be the focus of further assessment; i.e., if these two substances passed their assessments it can be assumed that the other metals would also pass their assessments. Subsequently the AERMOD results showed that emissions of these two metals did not cause exceedances of design criteria. Additionally, even though mercury was determined as being low risk and much lower risk than Chromium VI and cadmium, it was assessed due to the recent public interest in potential mercury emissions from industrial sources in the Latrobe Valley. The emission rates for chromium and cadmium were determined through a review of operating UK EfW plant emission rates, using conservative (high) rates.
6.3.4 Hourly meteorological data
The assessment procedures set out in EPA (2014a) and EPA (2014b) require that five annual databases of meteorological data be used as input to AERMOD. In selecting a source of data for assessment, key meteorological data are surface wind speed and wind direction, which have large influences on the outcomes of air dispersion modelling.
In this assessment, surface wind monitoring data from two AP Maryvale monitoring stations (‘AP East’ and ‘AP North’) and the Bureau of Meteorology (BoM) monitoring station at Latrobe Valley Airport (LVA) (for locations see Figure 6.1), were analysed to determine the best data to use for the assessment.
18 Ricardo-AEA Ltd (Buckland, Thomas), Assessment of particulate emissions from energy-from-waste plant, National Atmospheric Emissions
Inventory, Report for DEFRA, 14/10/2015. https://uk-air.defra.gov.uk/assets/documents/reports/cat07/1511261133_AQ0726_PM_EfW_emissions_report_Issue1_Final_including_appendices.pdf , assessed

Works Approval Application
RO097400.WAA.23.04.2018 99
Parameters considered in the review were sheltering of the monitoring stations by forest, rising terrain, and other obstacles. Also important for selection were estimates of where EfW plume strikes may occur (by inspection of preliminary results from AERMOD) and the locations of key sensitive receptors. Ultimately it was decided to use meteorological data from two stations for input to the assessment: one of the AP stations (‘AP North’) and BoM LVA.
The annual meteorological datasets used in the assessment were:
AP North (Maryvale) 2016: this was the highest quality wind data from the two AP sites from a relatively unsheltered monitoring site; wind speeds were lower than at LVA.
BoM LVA 2012–2016: five years of meteorological data obtained from an unsheltered monitoring station on the airport, with the main, unsheltered part of the airport runways to the west of the monitoring station, in the direction of the prevailing winds; wind speeds higher than at AP North.
The longer term, high quality BoM dataset formed the largest part of the meteorological dataset used as input in the assessment. The AP North (Maryvale) data were considered important to use also, as the lower wind speeds measured there may have been more representative of the discrete receptor locations around the Project site (see Figure 6.2).
6.3.5 Background (air quality monitoring) data
The air pollutant concentrations due to the Project were added to the background air pollutant concentrations (determined by monitoring) to form the cumulative air quality impact assessment required by the SEPP(AQM). As discussed and agreed with the EPA, the background air pollutant concentrations were determined for this assessment from EPA monitoring data acquired in the Latrobe Valley over 2012-2016. Some notes about use of these monitoring data are provided in the following points:
The air quality monitoring data acquired over 2012-2016 from the EPA stations at Morwell East, Morwell South and Traralgon would have been affected by the following larger facilities in the vicinity of Maryvale and Morwell:
- Yallourn Power Station
- Morwell, Yallourn and Loy Yang open-cut brown coal mines
- Loy Yang A and Loy Yang B power stations
- Hazelwood Power Station; closed 31st March, 2017
- Morwell Power Station; closed 8th September, 2014, and the closely connected briquette factory; closed August 2014.
The 2012-2016 monitoring data used for this assessment would have been affected by emissions from the Hazelwood Power Station, which ceased operations on 31st March, 2017 (Engie, 2018). Hazelwood Power Station is located approximately 5km south to 5km south-west of Morwell. Therefore, the 2012-2016 monitoring data would overestimate current and future background air pollution levels, to some extent.
Similarly, the Morwell Power Station ceased operations on 8th September, 2014, and the adjacent briquette factory closed in August 2014 (EBAC, 2018), therefore emissions from these facilities may have affected the monitoring data used in this assessment, up to those closure dates.
Data files of background, hourly varying, air pollutant concentrations were created for input to AERMOD for this assessment, from the EPA monitoring data acquired at the Morwell East, Morwell South and Traralgon stations.
The EPA hourly average monitoring data for 2014, particularly for CO and PM2.5, were clearly affected by emissions from the Hazelwood Mine Fire that occurred in February-March, 2014; e.g., see Emmerson et al. (2016). As such the CO and NO2 assessment results using the 2014 monitoring data as background can be assumed to have overestimated the air quality impacts. In processing the input data files of background data to use with AERMOD, an attempt was made to eliminate the largest effects from the fire on the PM2.5 monitoring data used as input to the modelling; primarily this was by using mostly Traralgon data, which

Works Approval Application
RO097400.WAA.23.04.2018 100
was less affected than Morwell East and Morwell South. In addition, spikes in PM2.5 can be observed during periods from both controlled fuel reduction burns and bushfires.
6.3.6 Assumptions
Key assumptions of the air quality assessment were:
Emissions from the EfW tall stack and diesel generator would be continuous throughout a whole year. Note that the EfW stack, which exhausts the flue gases from the EfW boilers, will discharge on a 24/7, 365-day basis (excluding maintenance periods). However, the diesel generator would only operate (and hence discharge) for only 200-300 hours per year. Because it is not known when during a given year that the diesel generator would discharge, this assessment has assumed that the diesel generator operates on a 24/7, 365-day basis.
The combined effects of the Project emissions plus monitoring data represent the expected, cumulative air quality impacts.
6.3.7 Stakeholder engagement
Details of the air quality impact assessment methodology, and data to be used with AERMOD, were discussed and agreed with EPA air quality specialists Dr. Paul Torre and Mr. Jason Choi on 22nd November, 2017 (Jacobs, 2017). Further details of the agreements are given in Appendix D: Air Quality, however a summary of the key points of agreement were:
Emissions limits for the Project to be set by EPA Victoria’s Energy from Waste guideline (EPA, 2013a), and reference to be made to the emissions limits set out in Schedule E of the SEPP(AQM)
Assessment to be based on a single air emissions modelling scenario, comprising the Project’s single stack in isolation for the plant’s steady-state operation
- Emissions from the 6MW diesel generator were also included in the assessment.
Assessment to include detailed reviewed of proposed pollutant emission control systems and their performance with consideration of the waste fuels to be combusted and how these compare to the referenced European plants
Consideration of any non-steady-state emissions, for example start-up and shut-down operations. In the event the emissions profile of the EfW plant for these non-steady-state operations differed significantly and had the potential to result in higher impacts than steady-state operations, these were to be included in the modelling assessment
- Note: non-steady state emissions were not included in the modelling assessment.
Accidental or emergency emission releases considered in accordance with EPA (2013b), Recommended separation distances for Industrial Residual Air Emissions
Air quality impact assessment undertaken in accordance with the procedures set out in the SEPP(AQM).
Use of Victoria’s regulatory air dispersion model AERMOD in accordance with EPA (2014a) and EPA (2014b). The latest executable version of AERMOD, (v.16216r; 17 Jan 2017), to be used for the assessment in accordance with the EPA guidelines:
- EPA Victoria, Guidelines for Input Meteorological Data for AERMOD, Publication 1550, Revision 3, September 2014 (EPA, 2014a)
- EPA Victoria, Guidance Notes for Using AERMOD, Publication 1551, Revision 2, June 2014 (EPA, 2014b).
6.4 Air pollutant emissions
This section sets out the air emissions estimates for the project with specific reference to the key Project air emissions sources, being the EfW boiler, tipping hall odour and back-up generator.
Works Approval Application
RO097400.WAA.23.04.2018 101
6.4.1 EfW boiler air emissions
The Project is for a nominal 650,000 tonnes (+/- 10%) per annum EfW Plant with MSW expected to make up 80% of the plant feedstock and the remaining 20% of the waste is expected to come from C&I waste. The project will have two boilers providing steam to a single turbine capable of generating up to 70 MW of electricity. Each boiler will have a flue and these flues will be ducted in a common stack discharging at a height of 95 m AGL.
All flue gas emission controls to be adopted for the project have been selected based on an international Best Available Technology (BAT) review for waste incineration plants, and shall follow the guiding BAT principles of the European Commission Integrated Pollution Prevention and Control Reference Document on BAT for Waste Incineration, August 2006 (EC BREF). The range of best practise technologies included in the EC BREF were considered (refer to Section 6.7 for further details).
The 2017 draft update for the EC BREF19 was also considered in the evaluation where different for the 2006 version, to ensure the most up to date practice recommendations were considered in the assessment. This BAT assessment will likely be further refined by prospective EPC contractors in their tender stage and detailed designs.
The principal objectives of the flue gas treatment and emission control system selected for each grate combustion line were meeting the statutory compliance requirements of:
Victoria Government, State Environment Protection Policy (Air Quality Management), or ‘SEPP(AQM)’
Victoria Government, State Environment Protection Policy (Ambient Air Quality), or ‘SEPP(AAQ)’.
EPA Victoria Guideline, Demonstrating Best Practice (EPA, 2013a)
EPA Victoria, Energy from Waste, Publication 1559 (EPA, 2013b).
The EPA EfW Guideline requires compliance with these documents in all operating scenarios including steady and non-steady state, all transient, part load, and start up and shut down operating conditions and for the full range of waste specifications and boiler waste firing process conditions expected.
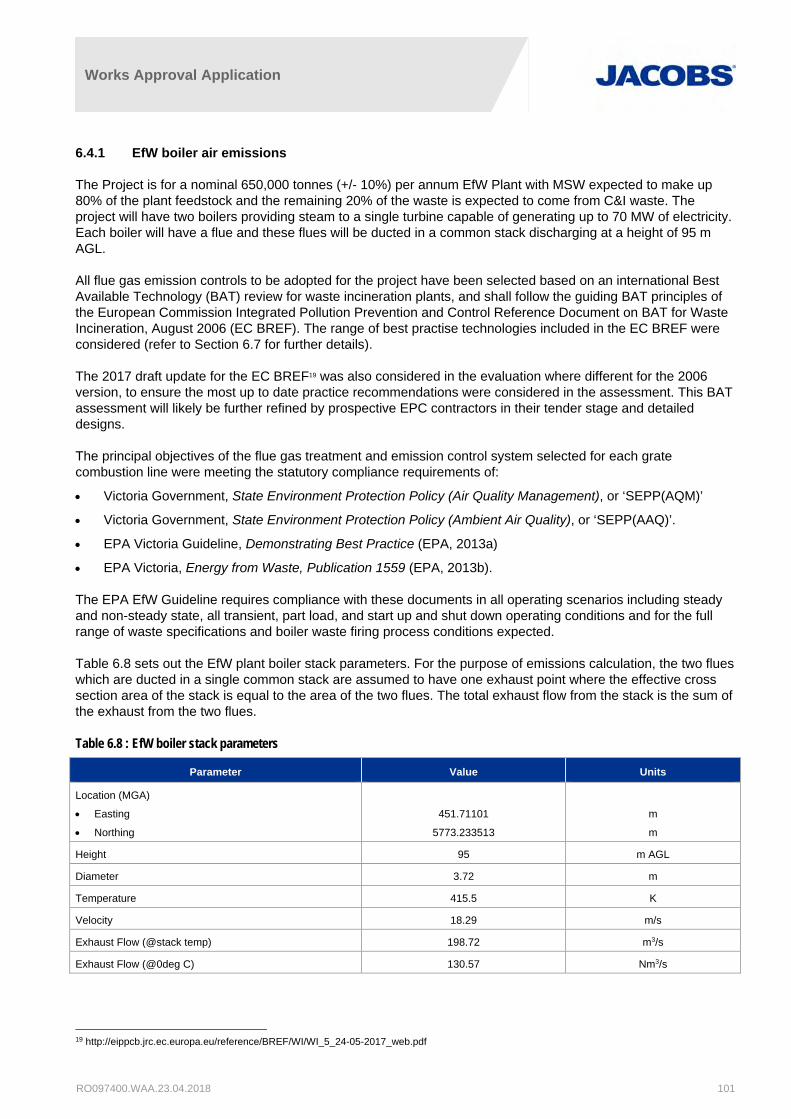
Table 6.8 sets out the EfW plant boiler stack parameters. For the purpose of emissions calculation, the two flues which are ducted in a single common stack are assumed to have one exhaust point where the effective cross section area of the stack is equal to the area of the two flues. The total exhaust flow from the stack is the sum of the exhaust from the two flues.
Table 6.8 : EfW boiler stack parameters
Parameter Value Units
Location (MGA)
Easting
Northing
451.71101
5773.233513
m
m
Height 95 m AGL
Diameter 3.72 m
Temperature 415.5 K
Velocity 18.29 m/s
Exhaust Flow (@stack temp) 198.72 m3/s
Exhaust Flow (@0deg C) 130.57 Nm3/s
19 http://eippcb.jrc.ec.europa.eu/reference/BREF/WI/WI_5_24-05-2017_web.pdf

Works Approval Application
RO097400.WAA.23.04.2018 102
Table 6.9 sets out boiler stack emissions for the EfW plant operating at 100% maximum continuous rating (MCR). The emissions are calculated using IED emission concentration, although industry best practice would suggest that for most operating regimes, emission concentrations would be lower than the IED limits which will be guaranteed by the EPC contractor. Section 6.7 provides an overview of expected emission concentrations compared to the IED limits. Using the IED limits for the basis of modelling is considered a robust approach as while average emissions are expected to be less than these limits by varying amounts depending on the pollutant under consideration, the SEPP(AQM) design ground level concentrations are generally for 3-minute and 1-hour maximum impacts, therefore modelling at the IED limits which are the absolute maximum (not to be exceeded) concentrations and will provide an assessment where consistent with the intent of the SEPP(AQM) criteria.
Table 6.9 : EfW Boiler Emissions
Pollutants (general) Emission Limit
(mg/Nm3)
100th percentile
Emission Limit
(mg/Nm3)
97th percentile
Model Averaging
time
Emission Rate
(g/s)
Pollutants - Industrial Emissions Directive 2010/75/EU (IED)
Pollutants (general)
Total dust 10 24 hour 1.31
Total organic carbon (TOC) 10 24 hour 1.31
Hydrogen chloride (HCl) 10 24 hour 1.31
Hydrogen fluoride (HF) 1 24 hour 0.13
Sulphur dioxide 50 24 hour 6.53
Oxides of nitrogen (NOx) as nitrogen dioxide (NO2) 200 24 hour 26.11
Carbon monoxide (CO) 50 24 hour 6.53
Total dust 30 10 0.5 hour 3.92
Total organic carbon (TOC) 20 10 0.5 hour 2.61
Hydrogen chloride (HCl) 60 10 0.5 hour 7.83
Hydrogen fluoride (HF) 4 2 0.5 hour 0.52
Sulphur dioxide 200 50 0.5 hour 26.11
Oxides of nitrogen (NOx) as nitrogen dioxide (NO2) 400 200 0.5 hour 52.23
Carbon monoxide (CO) 100 0.5 hour 13.06
Carbon monoxide (CO) 150 10-minute 19.59
Pollutants (heavy metals)
Cd + Tl 0.05 0.5 hours 0.0065
Hg 0.05 0.5 hours 0.0065
Sb+As+Pb+Cr+Co+Cu+Mn+Ni+V 0.5 0.5 hours 0.0653
Pollutants (other toxic)
Dioxins / furans (D/Fs) 0.1 (ng/m3) 6 hours 1.31x10⁻⁸
Pollutants - other
Ammonia (NH3) 30 1 hour 3.9171
Polycyclic Aromatic Hydrocarbons (PAHs) as
Benzo-a-Pyrene (BaP)
0.0133 1 hour 0.0017
In addition to the IED pollutants, a review of literature has suggested that ammonia (NH3) and polycyclic aromatic hydrocarbons (PAHs) as Benzo-a-Pyrene (BaP), are relevant for EfW plants. With respect to NH3, there can be some slippage through the SCNR used for NOX control. The EC BREF, 2006 suggests a well-
Works Approval Application
RO097400.WAA.23.04.2018 103
managed SNCR system should limit NH3 slip to less than 30 mg/Nm3. With respect to PAHs, where activated carbon is used for flue-gas post treatment, emission concentrations should be of the order of 0.0133 mg/Nm3.
Emissions on start-up have also been considered, as for many combustion processes (eg. gas turbines), emission can be higher during start-up periods. For the EfW plant boiler, the start-up fuel will be clean natural gas, ramping the boiler up to approximately 70% MCR when waste is introduced. All emission control systems described above would be functional during start-up with the above stated emission concentration limits being achieved. At 70% MCR, the exhaust flow would be approximately 62% of the flow at 100% MCR, which the emission rates calculated in Table 6.9 are based on. Consequently, emissions rates would be approximately 62% of the maximum emission rates at 100% MCR with exhaust temperature remain similar at approximately 415K. This would result in lower ambient air quality impacts compared with full load operations on waste fuel, the scenario upon which impacts are assessed.
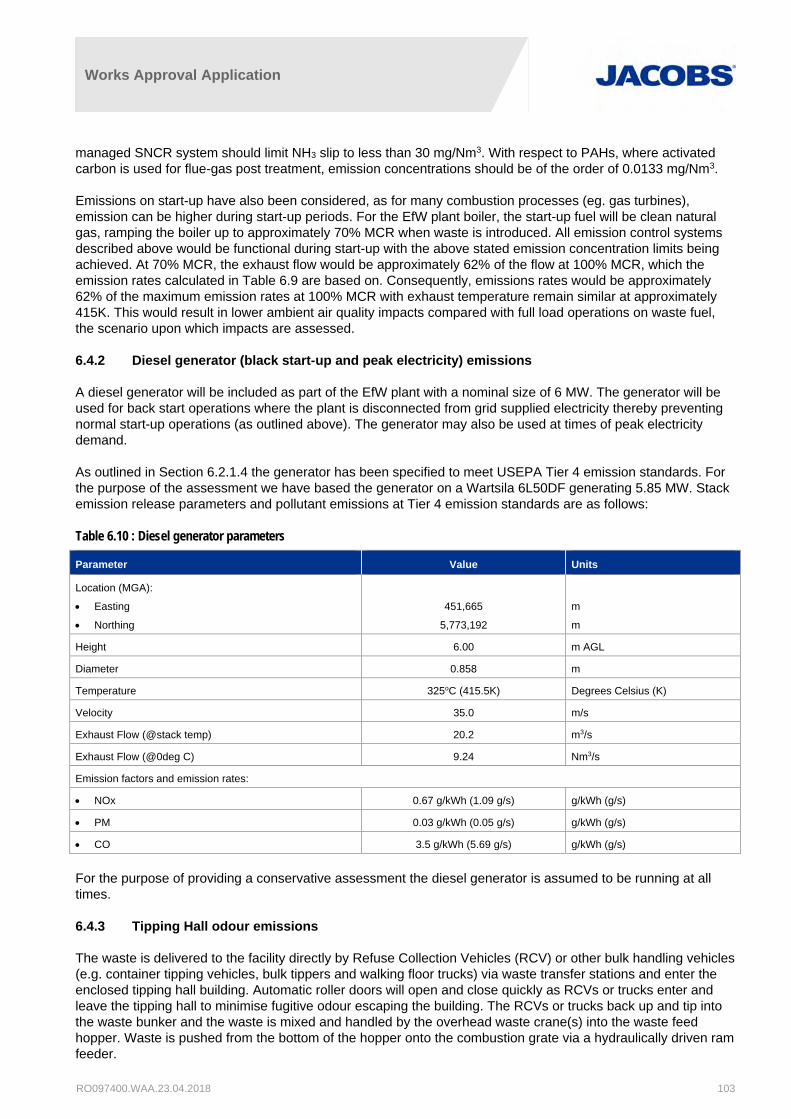
6.4.2 Diesel generator (black start-up and peak electricity) emissions
A diesel generator will be included as part of the EfW plant with a nominal size of 6 MW. The generator will be used for back start operations where the plant is disconnected from grid supplied electricity thereby preventing normal start-up operations (as outlined above). The generator may also be used at times of peak electricity demand.
As outlined in Section 6.2.1.4 the generator has been specified to meet USEPA Tier 4 emission standards. For the purpose of the assessment we have based the generator on a Wartsila 6L50DF generating 5.85 MW. Stack emission release parameters and pollutant emissions at Tier 4 emission standards are as follows:
Table 6.10 : Diesel generator parameters
Parameter Value Units
Location (MGA):
Easting
Northing
451,665
5,773,192
m
m
Height 6.00 m AGL
Diameter 0.858 m
Temperature 325oC (415.5K) Degrees Celsius (K)
Velocity 35.0 m/s
Exhaust Flow (@stack temp) 20.2 m3/s
Exhaust Flow (@0deg C) 9.24 Nm3/s
Emission factors and emission rates:
NOx 0.67 g/kWh (1.09 g/s) g/kWh (g/s)
PM 0.03 g/kWh (0.05 g/s) g/kWh (g/s)
CO 3.5 g/kWh (5.69 g/s) g/kWh (g/s)
For the purpose of providing a conservative assessment the diesel generator is assumed to be running at all times.
6.4.3 Tipping Hall odour emissions
The waste is delivered to the facility directly by Refuse Collection Vehicles (RCV) or other bulk handling vehicles (e.g. container tipping vehicles, bulk tippers and walking floor trucks) via waste transfer stations and enter the enclosed tipping hall building. Automatic roller doors will open and close quickly as RCVs or trucks enter and leave the tipping hall to minimise fugitive odour escaping the building. The RCVs or trucks back up and tip into the waste bunker and the waste is mixed and handled by the overhead waste crane(s) into the waste feed hopper. Waste is pushed from the bottom of the hopper onto the combustion grate via a hydraulically driven ram feeder.
Works Approval Application
RO097400.WAA.23.04.2018 104
Under grate supplied combustion air is drawn from within the tipping hall, normally with some form of air preheating to promote waste drying on the grate. This approach also maintains the tipping hall under negative air pressure, thus continuously controlling odour emissions from the tipping hall unloading and storage area whilst one or two of the boilers is operational.
In the unlikely event that both boilers were offline, odorous air would be contained within the enclosed tipping hall building with any odour release only occurring for short periods to maintain safe working conditions until the boilers are brought back on-line. For times when maintenance is conducted on the EfW plant and both boilers are offline, contingency measures will be put in place to manage the storage of waste within the bunker.
6.4.4 Existing Paper Mill emissions and impacts
The main sources of emissions of air pollutants from the existing Maryvale Mill are eight stacks, which are Licensed Discharge Points (EPA Licence 46547). Emissions limits are provided for the following substances, which are emitted in varying quantities (or not at all) from the eight stacks:
CO, NO2, SO2, total reduced sulfur compounds, oxides of sulfur (as SO2), chlorine gas, chlorine dioxide, and particles.
Emissions of the same substances assessed for the EfW Plant were CO, NO2, SO2, and particles (i.e. PM2.5 for EfW). As agreed with the EPA, the inclusion of emissions of these substances from the Mill were addressed in the EfW Plant assessment by including the hourly-varying, background levels of these pollutants in the assessment. As such the cumulative impact assessment methodology adopted for this Project included the existing emissions from the Mill.
With respect to existing Mill sources some of these include natural gas fired boilers for raising steam and electricity production. The EfW plant, in addition to producing electricity, will produce steam, offsetting and reducing the existing boiler emissions with key pollutants reduced being CO and NOX.
It is noted that air quality monitoring data shows there are low risks of air quality impacts from CO, NO2 and SO2, on the floor of the Latrobe Valley (see Appendix D). The air quality impacts from PM2.5 (and PM10) that occur on the valley floor are from sources located in the whole of the Latrobe Valley and beyond; i.e., not just the Mill.
6.5 Existing conditions
This section describes aspects of local meteorology important for the dispersion of air emissions, and existing, pre-project or ‘baseline’ levels of air pollutants expected to be emitted by the Project. For further details on existing conditions, see Appendix D: Air Quality
6.5.1 Latrobe Valley geographical setting
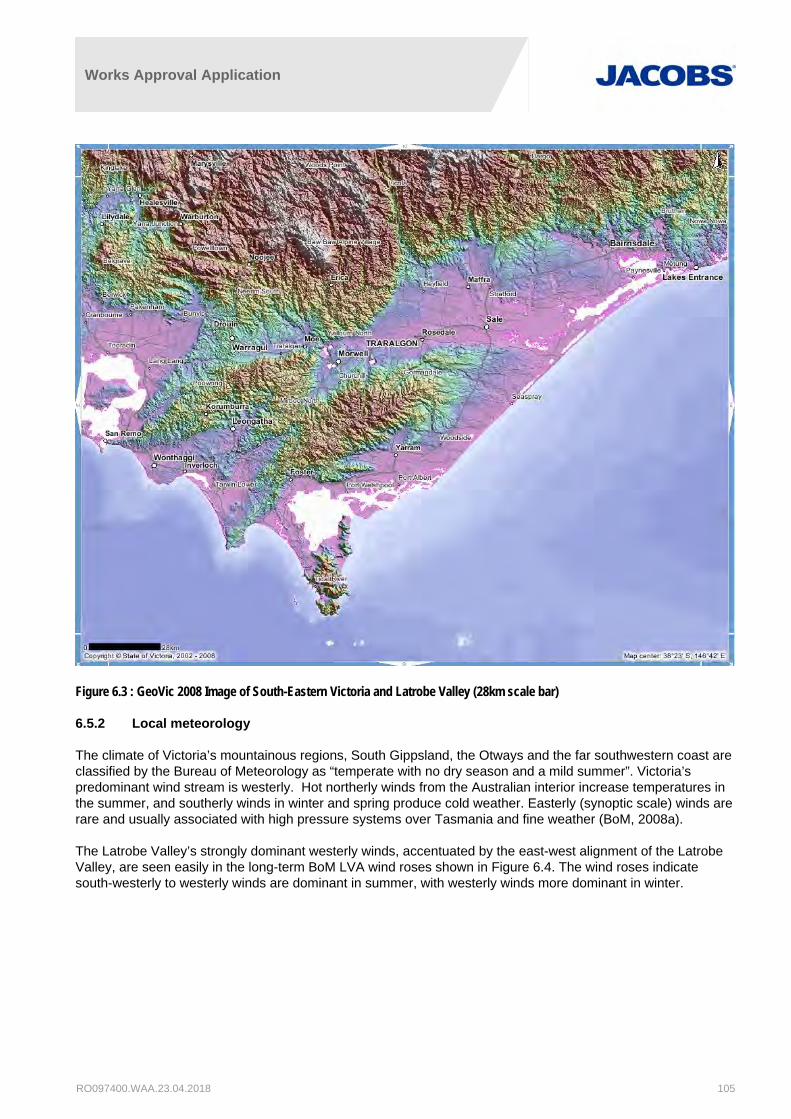
The physical geography of the Latrobe Valley has a significant influence on local meteorology and air quality. The Latrobe Valley comprises an open-ended valley. The Great Dividing Range provides a northern boundary to lower level winds in the valley, with mountains in this area ranging up to 2000 metres in height. The lower hills of the Strzelecki Ranges form a lower boundary to lower level winds in the south, with the higher hills there typically 600 metres in height. In contrast, the heights of the two Loy Yang power stations stacks are approximately 260 metres in height above ground level.
Works Approval Application
RO097400.WAA.23.04.2018 105
Figure 6.3 : GeoVic 2008 Image of South-Eastern Victoria and Latrobe Valley (28km scale bar)
6.5.2 Local meteorology
The climate of Victoria’s mountainous regions, South Gippsland, the Otways and the far southwestern coast are classified by the Bureau of Meteorology as “temperate with no dry season and a mild summer”. Victoria’s predominant wind stream is westerly. Hot northerly winds from the Australian interior increase temperatures in the summer, and southerly winds in winter and spring produce cold weather. Easterly (synoptic scale) winds are rare and usually associated with high pressure systems over Tasmania and fine weather (BoM, 2008a).
The Latrobe Valley’s strongly dominant westerly winds, accentuated by the east-west alignment of the Latrobe Valley, are seen easily in the long-term BoM LVA wind roses shown in Figure 6.4. The wind roses indicate south-westerly to westerly winds are dominant in summer, with westerly winds more dominant in winter.

Works Approval Application
RO097400.WAA.23.04.2018 106
BoM LVA summer (Jan. 3PM) wind rose 1984-2017 1037 observations; 1% calms
BoM LVA winter (July 3PM) wind rose 1984-2017 1029 observations; 4% calms
Figure 6.4 : BoM LVA 3PM Wind Roses for Summer (January) and Winter (July)
6.5.2.1 Local dispersion meteorology
Local meteorological conditions are important for determining the direction and dispersion of plumes of air pollutants in a study area. Among other variables used by AERMOD, key meteorological parameters are wind speed, wind direction, temperature, and mixing layer height. For the air quality impact assessment for this Project, five years of hourly meteorological data were required to be tested by modelling; i.e., approximately 44,000 hourly records.
Most of the meteorological data used for this assessment were collected from the automatic weather station at the BoM LVA monitoring station No. 085280, located on Latrobe Valley Airport approximately 3.3km south-east of the Project site. Hourly meteorological data for 2012-2017 were obtained from the BoM and processed into a form suitable for the AERMOD air dispersion model in accordance with the EPA (2014a) guideline (pDs, 2018); AERMOD meteorological files were provided covering the following annual meteorological scenarios (monitoring locations were provided in Figure 6.3).
2016 meteorology (1 year), using wind observations data from AP North
2012-2016 meteorology (5 years), using wind observations data from BoM LVA.
Annual wind roses for all six years of data used as input to AERMOD are provided in Figure 6.5 – clearly westerly winds are dominant in this narrow part of the Latrobe Valley. However, there is still a high degree of variability in the wind patterns, and the relatively low wind speeds overall indicate wind conditions could be conducive to air quality impacts at any time of the year. The annual average wind speeds measured at Maryvale
Works Approval Application
RO097400.WAA.23.04.2018 107
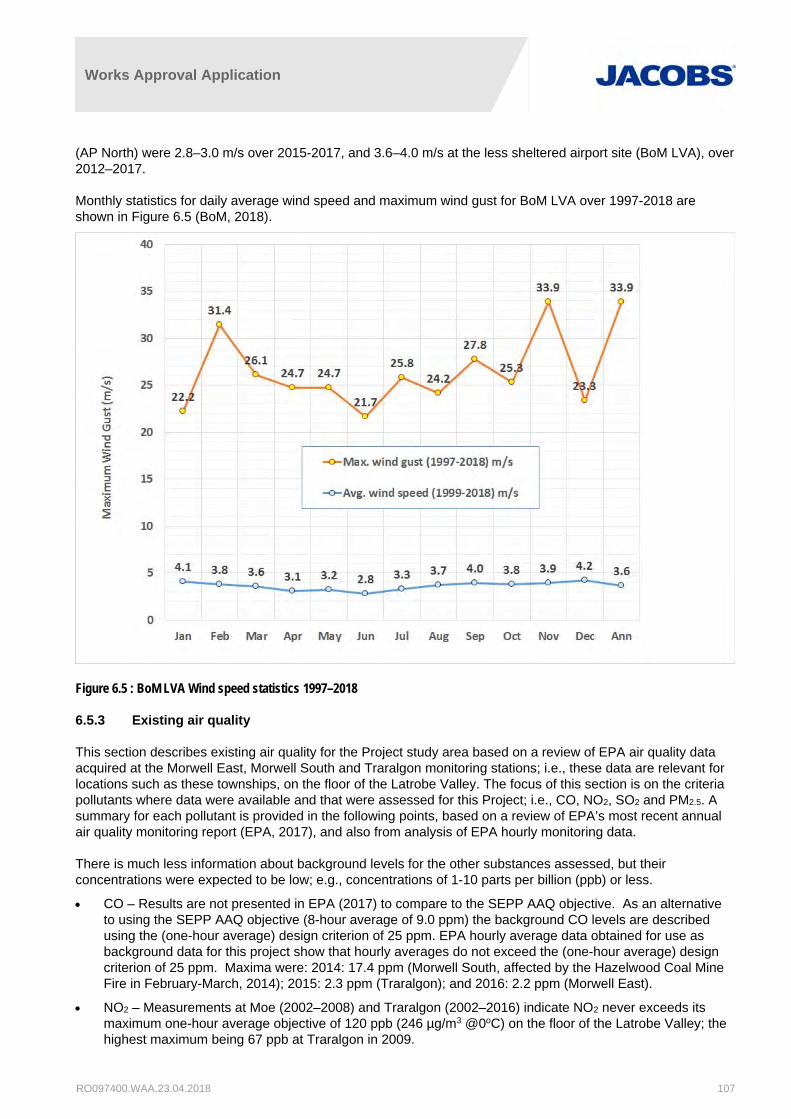
(AP North) were 2.8–3.0 m/s over 2015-2017, and 3.6–4.0 m/s at the less sheltered airport site (BoM LVA), over 2012–2017.
Monthly statistics for daily average wind speed and maximum wind gust for BoM LVA over 1997-2018 are shown in Figure 6.5 (BoM, 2018).
Figure 6.5 : BoM LVA Wind speed statistics 1997–2018
6.5.3 Existing air quality
This section describes existing air quality for the Project study area based on a review of EPA air quality data acquired at the Morwell East, Morwell South and Traralgon monitoring stations; i.e., these data are relevant for locations such as these townships, on the floor of the Latrobe Valley. The focus of this section is on the criteria pollutants where data were available and that were assessed for this Project; i.e., CO, NO2, SO2 and PM2.5. A summary for each pollutant is provided in the following points, based on a review of EPA’s most recent annual air quality monitoring report (EPA, 2017), and also from analysis of EPA hourly monitoring data.
There is much less information about background levels for the other substances assessed, but their concentrations were expected to be low; e.g., concentrations of 1-10 parts per billion (ppb) or less.
CO – Results are not presented in EPA (2017) to compare to the SEPP AAQ objective. As an alternative to using the SEPP AAQ objective (8-hour average of 9.0 ppm) the background CO levels are described using the (one-hour average) design criterion of 25 ppm. EPA hourly average data obtained for use as background data for this project show that hourly averages do not exceed the (one-hour average) design criterion of 25 ppm. Maxima were: 2014: 17.4 ppm (Morwell South, affected by the Hazelwood Coal Mine Fire in February-March, 2014); 2015: 2.3 ppm (Traralgon); and 2016: 2.2 ppm (Morwell East).
NO2 – Measurements at Moe (2002–2008) and Traralgon (2002–2016) indicate NO2 never exceeds its maximum one-hour average objective of 120 ppb (246 µg/m3 @0oC) on the floor of the Latrobe Valley; the highest maximum being 67 ppb at Traralgon in 2009.
Works Approval Application
RO097400.WAA.23.04.2018 108
SO2 – Measurements at Traralgon (2002–2016) indicate SO2 never exceeds its maximum one-hour average objective of 200 ppb (572 µg/m3 @0oC) on the floor of the Latrobe Valley. The maxima have come close to this standard in some years, the highest being 170 ppb at Traralgon in 2008. More typical annual maxima are less than 100 ppb.
PM2.5 – From analysis of the EPA hourly and 24-hourly averages (24-hourly average objective of 25 µg/m3):
- The 2014 PM2.5 concentrations were significantly affected by the Hazelwood Coal Mine Fire in February-March: maximum hourly averages were: 1349 µg/m3 (Morwell South); 328 µg/m3 (Morwell East); and 103 µg/m3 (Traralgon). After March, the hourly and 24-hourly averages were much lower; e.g., 90th percentile hourly average at Traralgon was 15 µg/m3.
- The 2015 PM2.5 concentrations were affected by prescribed burns in autumn-winter which led to one exceedance of the objective in 2015: maximum 24-hourly averages were: 18 µg/m3 (Morwell South); 25.0 µg/m3 (Morwell East); and 35.1 µg/m3 (Traralgon). The 90th percentile hourly average at Traralgon was 14 µg/m3.
- The 2016 PM2.5 concentrations were also affected by prescribed burns in autumn-winter which led to four exceedances of the objective in 2016: maximum 24-hourly averages were: 29 µg/m3 (Morwell South); 33 and 27.3 µg/m3 (Morwell East); and 25.7 µg/m3 (Traralgon). The 90th percentile hourly average at Traralgon was 15 µg/m3.
Ozone (O3) was not assessed for this Project – O3 is formed in the atmosphere over periods of hours from many sources, primarily from emissions from road vehicle traffic, and dispersed over large areas. As such the assessment of O3 is a task for regional air quality management. However, emissions of NOx and other pollutants from the Project are relevant for the formation of O3. In the Latrobe Valley, O3 rarely exceeds its maximum hourly average standard of 100 ppb; e.g., three exceedance days in 2006 (maximum 138 ppb), 1 day in 2009 (max. 104 ppb), but no exceedances from 2010 to 2016 (EPA, 2017).
The ‘Latrobe Valley 2016’ hourly average background data illustrated in the following figures are provided here as examples – the AERMOD modelling is based on hourly averages. The background data were used as input data for the AERMOD modelling assessments for the 2016 meteorological scenarios. These datasets were created by combining hourly data from Morwell East, Morwell South, and Traralgon, with the amounts used from each station depending on data availability and quality.

Works Approval Application
RO097400.WAA.23.04.2018 109
Figure 6.6 : Latrobe Valley 2016 hourly average CO (ppm) based on 2016 EPA monitoring data
Figure 6.7 : Latrobe Valley 2016 hourly average NO2 (µg/m3) based on 2016 EPA monitoring data
Works Approval Application
RO097400.WAA.23.04.2018 110
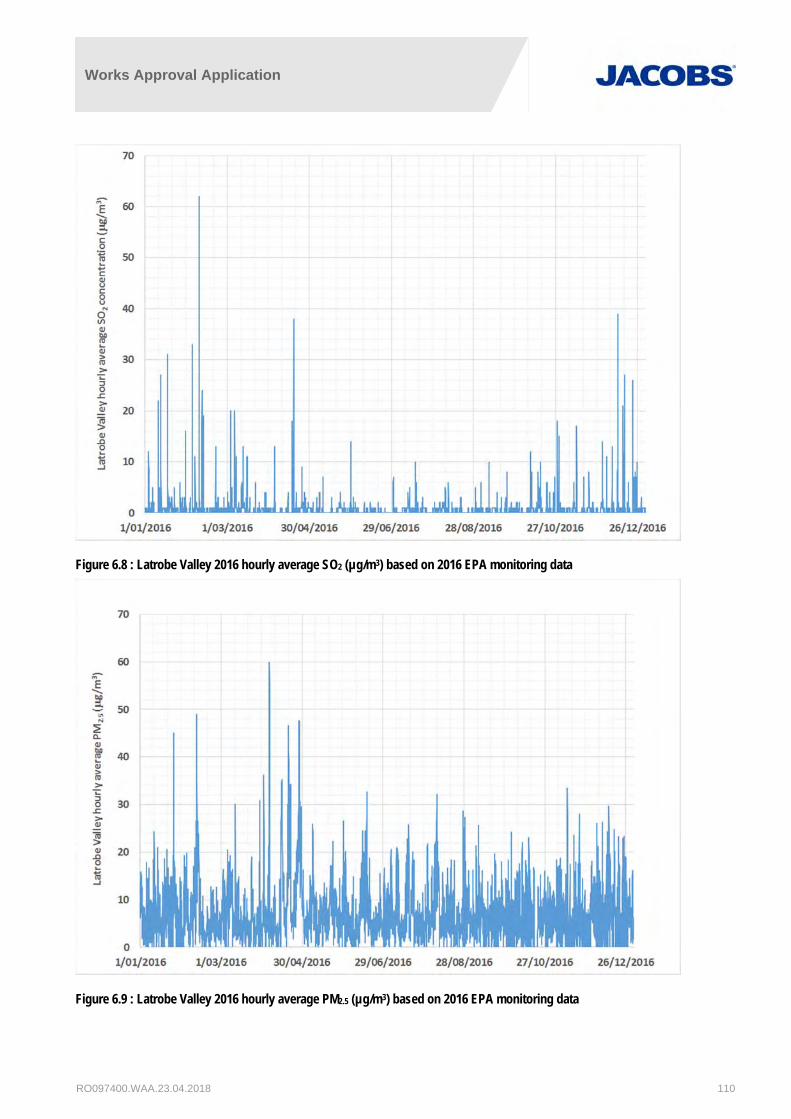
Figure 6.8 : Latrobe Valley 2016 hourly average SO2 (µg/m3) based on 2016 EPA monitoring data
Figure 6.9 : Latrobe Valley 2016 hourly average PM2.5 (µg/m3) based on 2016 EPA monitoring data
Works Approval Application
RO097400.WAA.23.04.2018 111
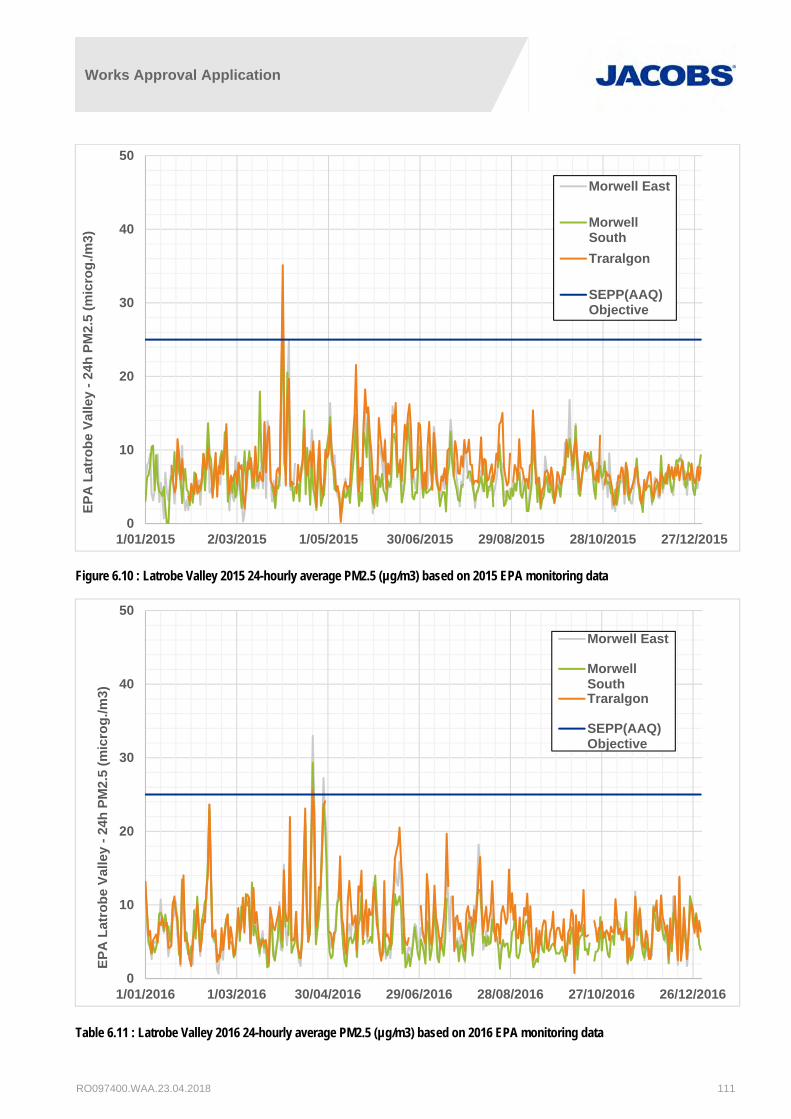
Figure 6.10 : Latrobe Valley 2015 24-hourly average PM2.5 (µg/m3) based on 2015 EPA monitoring data
Table 6.11 : Latrobe Valley 2016 24-hourly average PM2.5 (µg/m3) based on 2016 EPA monitoring data
0
10
20
30
40
50
1/01/2015 2/03/2015 1/05/2015 30/06/2015 29/08/2015 28/10/2015 27/12/2015
EP
A L
atro
be
Val
ley
-24
h P
M2.
5 (m
icro
g./m
3)
Morwell East
MorwellSouth
Traralgon
SEPP(AAQ)Objective
0
10
20
30
40
50
1/01/2016 1/03/2016 30/04/2016 29/06/2016 28/08/2016 27/10/2016 26/12/2016
EP
A L
atro
be
Val
ley
-24
h P
M2.
5 (m
icro
g./m
3)
Morwell East
MorwellSouthTraralgon
SEPP(AAQ)Objective

Works Approval Application
RO097400.WAA.23.04.2018 112
6.6 AERMOD results
6.6.1 Overview
This section provides the AERMOD results for each air pollutant assessed as contour plots of Ground Level Concentrations (GLCs), for direct comparisons with air quality standards (SEPP (AQM)). The results presented as contour plots in this section were from the 2016 annual meteorological scenario that used wind data from BoM Latrobe Valley Airport (LVA) – contour plot results for the other annual scenarios are provided in Appendix D.
There were minor differences between most of the results for each of the five annual meteorological datasets 2012-2016, although the 2014 CO and PM2.5 results were noticeably affected by the Hazelwood Mine Fire; for a summary of the air quality effects from this fire, see Emmerson et al. (2016).
The following sub-sections provide: AERMOD results presented as contour plots of GLCs; tables of statistical results for the AERMOD grid receptors for the five annual meteorological cases, 2012-2016. The results for the discrete receptors for all annual case studies are provided in Appendix D.
A summary of the AERMOD results presented in the following sub-sections for the 2016 meteorological case, and the corresponding Victoria air quality standards, is provided in the following points:
Criteria pollutants, 99.9 percentile one-hour averages:
- CO, NO2, and SO2, including hourly-varying background data where available.
PM2.5, including hourly-varying background data where available:
- 99.9 percentile one-hour average for comparisons with SEPP(AQM) design criterion.
- Maximum 24-hour average and annual average for comparisons with SEPP(AAQ) objectives.
HF, for comparisons with design criteria:
- 24h average, 7-day average and 90-day average (all maxima).
99.9th percentile 3-minute averages for other pollutants of varying toxicity:
- HCl, NH3, Dioxins and Furans (DF), PAHs as B(a)P, Cr(VI) and Cd.
6.6.2 AERMOD results for CO
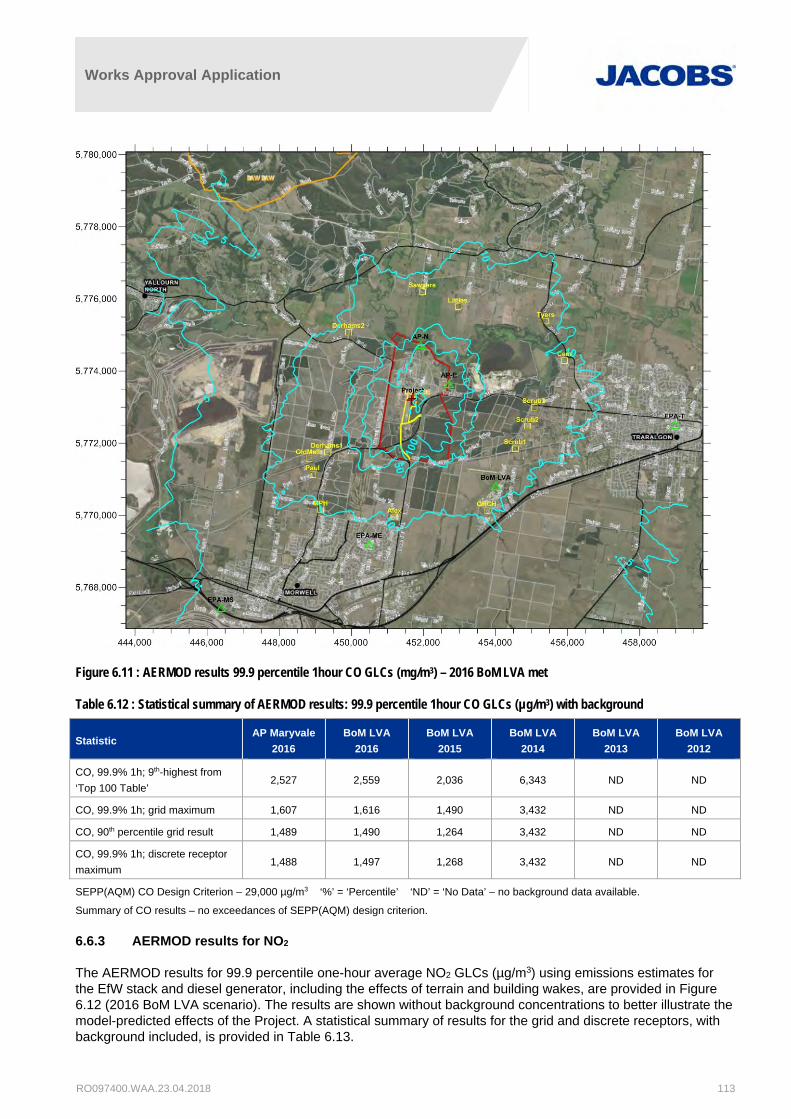
The AERMOD results for 99.9 percentile one-hour average CO GLCs (µg/m3) using emissions estimates for the EfW stack and diesel generator, including the effects of terrain and building wakes, are provided in Figure 6.11 (2016 BoM LVA wind data). The results are shown without background concentrations to better illustrate the model-predicted effects of the Project. A statistical summary of results for the grid and discrete receptors, with background included, is provided in Table 6.12.
Works Approval Application
RO097400.WAA.23.04.2018 113
Figure 6.11 : AERMOD results 99.9 percentile 1hour CO GLCs (mg/m3) – 2016 BoM LVA met
Table 6.12 : Statistical summary of AERMOD results: 99.9 percentile 1hour CO GLCs (µg/m3) with background
Statistic AP Maryvale
2016
BoM LVA
2016
BoM LVA
2015
BoM LVA
2014
BoM LVA
2013
BoM LVA
2012
CO, 99.9% 1h; 9th-highest from
‘Top 100 Table’ 2,527 2,559 2,036 6,343 ND ND
CO, 99.9% 1h; grid maximum 1,607 1,616 1,490 3,432 ND ND
CO, 90th percentile grid result 1,489 1,490 1,264 3,432 ND ND
CO, 99.9% 1h; discrete receptor
maximum 1,488 1,497 1,268 3,432 ND ND
SEPP(AQM) CO Design Criterion – 29,000 µg/m3 ‘%’ = ‘Percentile’ ‘ND’ = ‘No Data’ – no background data available.
Summary of CO results – no exceedances of SEPP(AQM) design criterion.
6.6.3 AERMOD results for NO2
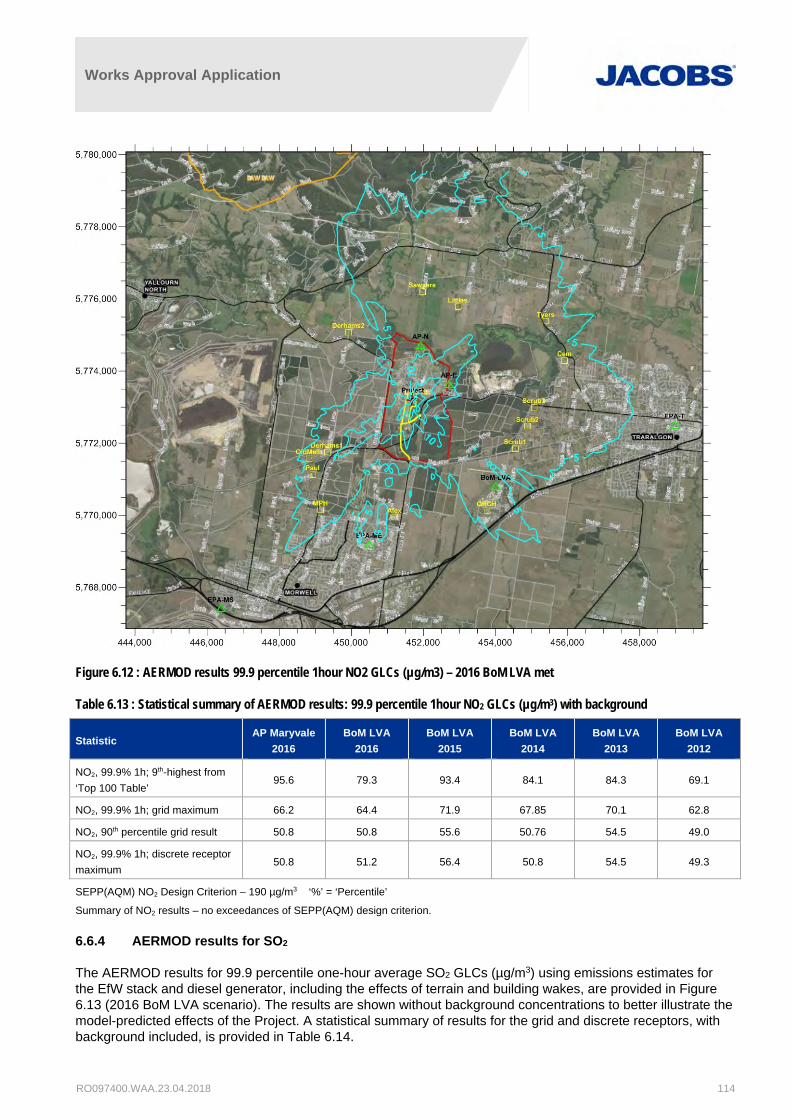
The AERMOD results for 99.9 percentile one-hour average NO2 GLCs (µg/m3) using emissions estimates for the EfW stack and diesel generator, including the effects of terrain and building wakes, are provided in Figure 6.12 (2016 BoM LVA scenario). The results are shown without background concentrations to better illustrate the model-predicted effects of the Project. A statistical summary of results for the grid and discrete receptors, with background included, is provided in Table 6.13.
Works Approval Application
RO097400.WAA.23.04.2018 114
Figure 6.12 : AERMOD results 99.9 percentile 1hour NO2 GLCs (µg/m3) – 2016 BoM LVA met
Table 6.13 : Statistical summary of AERMOD results: 99.9 percentile 1hour NO2 GLCs (µg/m3) with background
Statistic AP Maryvale
2016
BoM LVA
2016
BoM LVA
2015
BoM LVA
2014
BoM LVA
2013
BoM LVA
2012
NO2, 99.9% 1h; 9th-highest from
‘Top 100 Table’ 95.6 79.3 93.4 84.1 84.3 69.1
NO2, 99.9% 1h; grid maximum 66.2 64.4 71.9 67.85 70.1 62.8
NO2, 90th percentile grid result 50.8 50.8 55.6 50.76 54.5 49.0
NO2, 99.9% 1h; discrete receptor
maximum 50.8 51.2 56.4 50.8 54.5 49.3
SEPP(AQM) NO2 Design Criterion – 190 µg/m3 ‘%’ = ‘Percentile’
Summary of NO2 results – no exceedances of SEPP(AQM) design criterion.
6.6.4 AERMOD results for SO2
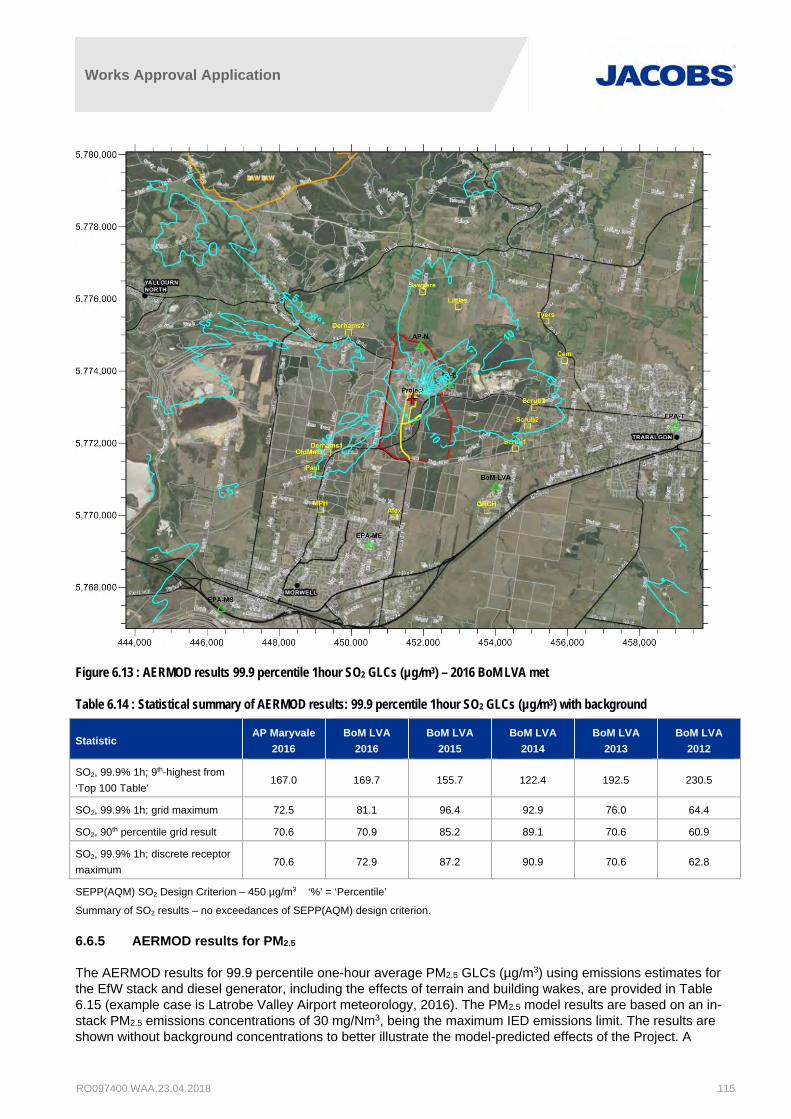
The AERMOD results for 99.9 percentile one-hour average SO2 GLCs (µg/m3) using emissions estimates for the EfW stack and diesel generator, including the effects of terrain and building wakes, are provided in Figure 6.13 (2016 BoM LVA scenario). The results are shown without background concentrations to better illustrate the model-predicted effects of the Project. A statistical summary of results for the grid and discrete receptors, with background included, is provided in Table 6.14.
Works Approval Application
RO097400.WAA.23.04.2018 115
Figure 6.13 : AERMOD results 99.9 percentile 1hour SO2 GLCs (µg/m3) – 2016 BoM LVA met
Table 6.14 : Statistical summary of AERMOD results: 99.9 percentile 1hour SO2 GLCs (µg/m3) with background
Statistic AP Maryvale
2016
BoM LVA
2016
BoM LVA
2015
BoM LVA
2014
BoM LVA
2013
BoM LVA
2012
SO2, 99.9% 1h; 9th-highest from
‘Top 100 Table’ 167.0 169.7 155.7 122.4 192.5 230.5
SO2, 99.9% 1h; grid maximum 72.5 81.1 96.4 92.9 76.0 64.4
SO2, 90th percentile grid result 70.6 70.9 85.2 89.1 70.6 60.9
SO2, 99.9% 1h; discrete receptor
maximum 70.6 72.9 87.2 90.9 70.6 62.8
SEPP(AQM) SO2 Design Criterion – 450 µg/m3 ‘%’ = ‘Percentile’
Summary of SO2 results – no exceedances of SEPP(AQM) design criterion.
6.6.5 AERMOD results for PM2.5
The AERMOD results for 99.9 percentile one-hour average PM2.5 GLCs (µg/m3) using emissions estimates for the EfW stack and diesel generator, including the effects of terrain and building wakes, are provided in Table 6.15 (example case is Latrobe Valley Airport meteorology, 2016). The PM2.5 model results are based on an in-stack PM2.5 emissions concentrations of 30 mg/Nm3, being the maximum IED emissions limit. The results are shown without background concentrations to better illustrate the model-predicted effects of the Project. A
Works Approval Application
RO097400.WAA.23.04.2018 116
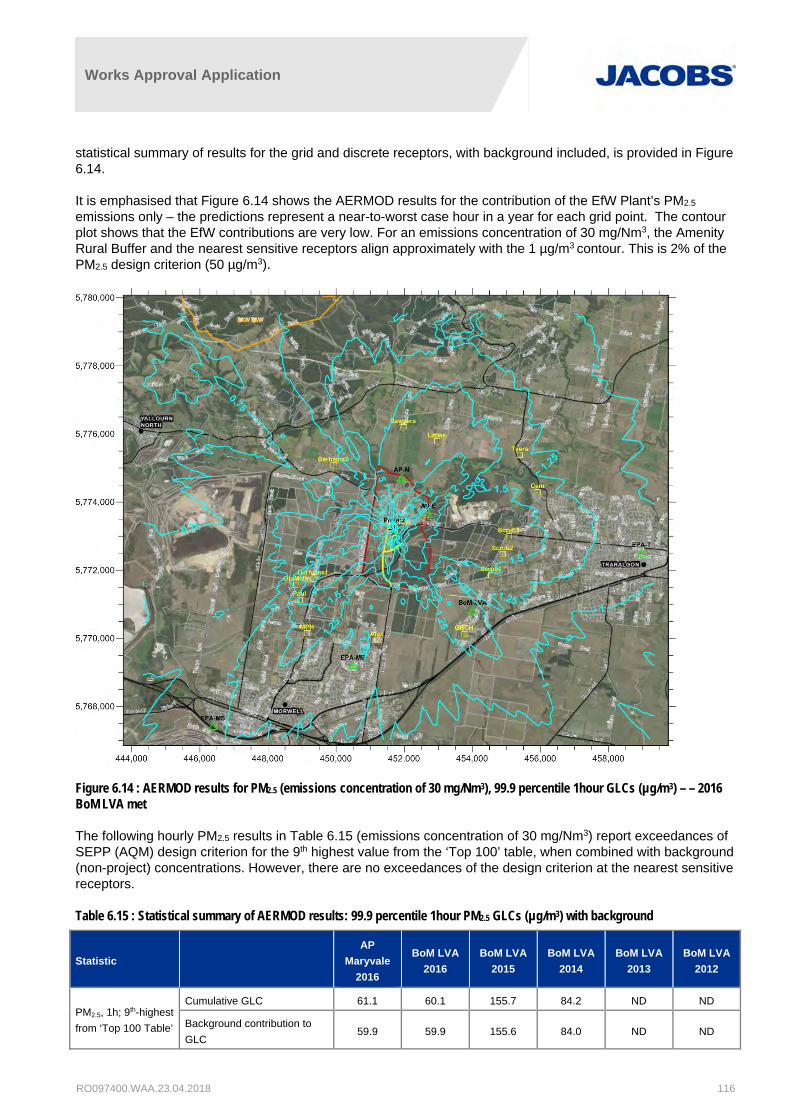
statistical summary of results for the grid and discrete receptors, with background included, is provided in Figure 6.14.
It is emphasised that Figure 6.14 shows the AERMOD results for the contribution of the EfW Plant’s PM2.5 emissions only – the predictions represent a near-to-worst case hour in a year for each grid point. The contour plot shows that the EfW contributions are very low. For an emissions concentration of 30 mg/Nm3, the Amenity Rural Buffer and the nearest sensitive receptors align approximately with the 1 µg/m3 contour. This is 2% of the PM2.5 design criterion (50 µg/m3).
Figure 6.14 : AERMOD results for PM2.5 (emissions concentration of 30 mg/Nm3), 99.9 percentile 1hour GLCs (µg/m3) – – 2016 BoM LVA met
The following hourly PM2.5 results in Table 6.15 (emissions concentration of 30 mg/Nm3) report exceedances of SEPP (AQM) design criterion for the 9th highest value from the ‘Top 100’ table, when combined with background (non-project) concentrations. However, there are no exceedances of the design criterion at the nearest sensitive receptors.
Table 6.15 : Statistical summary of AERMOD results: 99.9 percentile 1hour PM2.5 GLCs (µg/m3) with background
Statistic
AP
Maryvale
2016
BoM LVA
2016
BoM LVA
2015
BoM LVA
2014
BoM LVA
2013
BoM LVA
2012
PM2.5, 1h; 9th-highest
from ‘Top 100 Table’
Cumulative GLC 61.1 60.1 155.7 84.2 ND ND
Background contribution to
GLC 59.9 59.9 155.6 84.0 ND ND
Works Approval Application
RO097400.WAA.23.04.2018 117
Statistic
AP
Maryvale
2016
BoM LVA
2016
BoM LVA
2015
BoM LVA
2014
BoM LVA
2013
BoM LVA
2012
PM2.5, 99.9% 1h;
grid maximum
Maximum of 9th highest hours
for the 19,026 grid receptors 49.2 47.7 38.8 42.9 ND ND
PM2.5, 99.9% 1h;
discrete receptor
maximum
Maximum of 9th highest hours
for the 14 discrete (sensitive)
receptors
47.1 47.4 38.2 40.3 ND ND
SEPP(AQM) PM2.5 Design Criterion – 50 µg/m3 ‘%’ = ‘Percentile’ ‘ND’ = ‘No Data’ – no reliable background data available.
Summary of PM2.5 results – exceedances of SEPP(AQM) design criterion due to high background (existing) PM2.5 (see next section).
The modelling results show that there are exceedances of the design criterion for PM2.5, however these are due purely to the high background levels of PM2.5.
To further clarify the AERMOD results listed in Table 6.15, Table 6.16 below shows the statistical summary for the background levels of PM2.5 in the study area for each of the meteorological years; i.e. the existing background levels without the EfW Plant in operation. The statistical summary was produced by setting the EfW Plant emissions to zero in AERMOD.
It can be seen from the table (top row), that without the EfW Plant in operation there are already exceedances of the design criterion for PM2.5. These high background levels are nearly always due to poor regional air quality and in particular, smoke from controlled burns and bushfires (e.g., refer to Jacobs (2017); Jacobs (2018)). This is emphasised in the time series plots shown in Section 6.6 which show hourly variations in the background PM2.5 concentrations over the course of a year, in comparison with the much smaller predicted PM2.5 levels due to the EfW plant.
Table 6.16 : Statistical summary of AERMOD results for background PM2.5 levels (i.e. EfW Plant emissions of zero mg/Nm3): 99.9 percentile 1hour PM2.5 GLCs (µg/m3)
Statistic AP Maryvale
2016
BoM LVA
2016
BoM LVA
2015
BoM LVA
2014
BoM LVA
2013
BoM LVA
2012
PM2.5, 99.9% 1h; 9th-highest
from ‘Top 100 Table’ 59.9 59.9 155.6 84.0 ND ND
PM2.5, 99.9% 1h; grid maximum 47.1 47.1 37.6 40.3 ND ND
PM2.5, 99.9% 1h; discrete
receptor maximum 47.1 47.1 37.6 40.3 ND ND
SEPP(AQM) PM2.5 Design Criterion – 50 µg/m3 ‘%’ = ‘Percentile’ ‘ND’ = ‘No Data’ – no reliable background data available.
The model results can be further analysed to determine the contribution of the proposed EfW Plant PM2.5 emissions to the GLCs. The statistical summary in Table 6.17 below shows the contribution of the background PM2.5 and contribution of the EfW Plant PM2.5 emissions. It can be seen that the EfW Plant contribution to the cumulative GLCs are very low and that the primary influence on the GLCs are the background PM2.5 levels. For 3 out of the 4 meteorological year datasets, the background PM2.5 levels are above the design criterion (50 µg/m3) for at least 4 of the 9 highest hourly background readings.
Table 6.17 : Statistical summary of AERMOD results for background and EfW Plant emissions, PM2.5 levels (i.e. EfW Plant emissions of 30 mg/Nm3): 99.9 percentile 1hour PM2.5 GLCs (µg/m3)
Statistic Analysis AP Maryvale
2016
BoM LVA
2016
BoM LVA
2015
BoM LVA
2014*
BoM
LVA
2013
BoM
LVA
2012
PM2.5, 1h; 9th-
highest from
9th highest result any grid
receptor (19,026) 61.1 60.1 155.9 85.6 ND ND

Works Approval Application
RO097400.WAA.23.04.2018 118
Statistic Analysis AP Maryvale
2016
BoM LVA
2016
BoM LVA
2015
BoM LVA
2014*
BoM
LVA
2013
BoM
LVA
2012
‘Top 100 Table’ 9th highest for that hour, across
the 19,026 hours
Background contribution 59.9 59.9 155.6 84.0 ND ND
EfW contribution at point of
exceedence 1.2 0.2 0.3 1.6 ND ND
Nine highest hourly average
background (µg/m3)
59.9, 55.7,
55.0, 53.5,
49.0, 48.5,
47.7, 47.5,
47.1
59.9, 55.7,
55.0, 53.5,
49.0, 48.5,
47.7, 47.5,
47.1
155.6, 44.7,
43.1, 42.1,
41.2, 39.2,
38.6, 38.2,
37.6
Excluding
Mine Fire:
84.0, 63.4,
60.6, 55.4,
50.8, 45.0,
44.6, 40.7,
40.3
ND ND
PM2.5, 99.9%
1h; grid
maximum
(µg/m3)
Maximum of 9th highest hours for
19,026 grid receptors 49.2 47.7 38.8 42.9 ND ND
PM2.5, 99.9%
1h; discrete
receptor
maximum
Maximum of 9th highest hours for
14 discrete receptors 47.1 47.4 38.2 40.3 ND ND
*BoM monitoring estimates for 2014 background for period after Hazelwood Mine Fire only (after 13/3/2014, 10:00AM)
Although the modelling has been conducted at the maximum in-stack emissions concentration of 30mg/m3, studies of similar plants in Europe show it is likely that the EfW Plant will have a much lower in-stack PM2.5 emissions concentration. As outlined in Section 6.3.4, Ricardo-AEA (2015) found that the average of the maximum concentration of PM2.5 emissions from sampled UK EfW plants was 0.019 mg/Nm3. Accordingly, modelling was also conducted for an emissions concentration of 0.02 mg/Nm3 (0.019 mg/Nm3 rounded to one significant figure).
Figure 6.15 represents the AERMOD results for the contribution of the EfW Plant’s emissions to the 99.9 percentile one-hour average PM2.5 GLCs, for the more representative in-stack emissions concentration of 0.02mg/m3. The contour plot shows that the contribution to GLCs of the EfW Plant are very low – very much lower than the corresponding design criterion of 50 µg/m3.

Works Approval Application
RO097400.WAA.23.04.2018 119
Figure 6.15 : AERMOD results for PM2.5 (emissions concentration of 0.02 mg/Nm3), 99.9 percentile 1hour GLCs (µg/m3) – 2016 BoM LVA met.
The following hourly PM2.5 results in Table 6.18 (emissions concentration of 0.02 mg/Nm3) report exceedances of SEPP (AQM) design criterion (50 µg/m3) for the 9th highest value from the ‘Top 100’ table, when combined with background PM2.5 levels. However, there are no exceedances of the design criterion at the nearest sensitive (‘discrete’) receptors.
Table 6.18 : Statistical summary of AERMOD results for PM2.5 (emissions concentration of 0.02 mg/Nm3): 99.9 percentile 1hour PM2.5 GLCs (µg/m3) including background PM2.5.
Statistic AP Maryvale
2016
BoM LVA
2016
BoM LVA
2015
BoM LVA
2014
BoM LVA
2013
BoM LVA
2012
PM2.5, 99.9% 1h; 9th-highest from
‘Top 100 Table’ 61.1 60.1 155.7 84.1 ND ND
PM2.5, 99.9% 1h; grid maximum 49.2 47.7 38.4 42.9 ND ND
PM2.5, 90th percentile grid result 47.1 47.1 37.6 40.3 ND ND
PM2.5, 99.9% 1h; discrete receptor
maximum 47.1 47.1 37.6 40.3 ND ND
SEPP(AQM) PM2.5 Design Criterion – 50 µg/m3 ‘%’ = ‘Percentile’ ‘ND’ = ‘No Data’ – no reliable background data available.
From a comparison of Table 6.15 and Table 6.18, it can be clearly seen that the 9th highest results from the ‘Top 100 Table’ for an in-stack emissions concentration of 30mg/m3 and 0.02mg/m3 are very similar. This confirms

Works Approval Application
RO097400.WAA.23.04.2018 120
that the existing background PM2.5 levels dominate the overall PM2.5 levels (background combined with proposed EfW Plant).
6.6.6 AERMOD results for PM2.5 – discrete receptor time series
The purpose of this sub-section is to provide results for all the AERMOD-predicted hourly average PM2.5 concentrations for a key discrete receptor to demonstrate that the air quality effects due to the Project’s emissions are very small relative to high, existing (i.e. ‘background’) PM2.5 levels. This is the case for all the annual meteorological scenarios tested. The receptor identified from the modelling to be most affected by the Project’s emissions was Derhams Lane (receptor ‘Derham1’).
AERMOD results for hourly average PM2.5 are provided for 2015, 2016 and 2017; i.e., the only years for which there were sufficient amounts of reliable PM2.5 monitoring data available to estimate the hourly-varying background. The time series results are provided in the following sequence of plots.
The AERMOD results for hourly average PM2.5 for the Derhams Lane receptor (blue) using the 2016 LVA meteorological data are shown alongside the high background levels (yellow), in Figure 6.16.
Figure 6.16 : AERMOD results 1hour PM2.5 GLCs (blue) and PM2.5 monitoring data (yellow) – 2016 BoM LVA met.
The following time series graphs show similar AERMOD results of hourly average PM2.5 of EfW contribution at the Derhams Lane receptor alongside high background PM2.5 levels:
Figure 6.17, using the 2016 Maryvale meteorological data (AERMOD results for Derhams Lane in blue)
Figure 6.18, using the 2015 LVA meteorological data (AERMOD results for Derhams Lane in blue)
Figure 6.19 shows the EPA’s PM2.5 monitoring results for 2017. This graph illustrates that the shutdown of Hazelwood Power station in March 2017 had no noticeable effect on ambient PM2.5 concentrations.
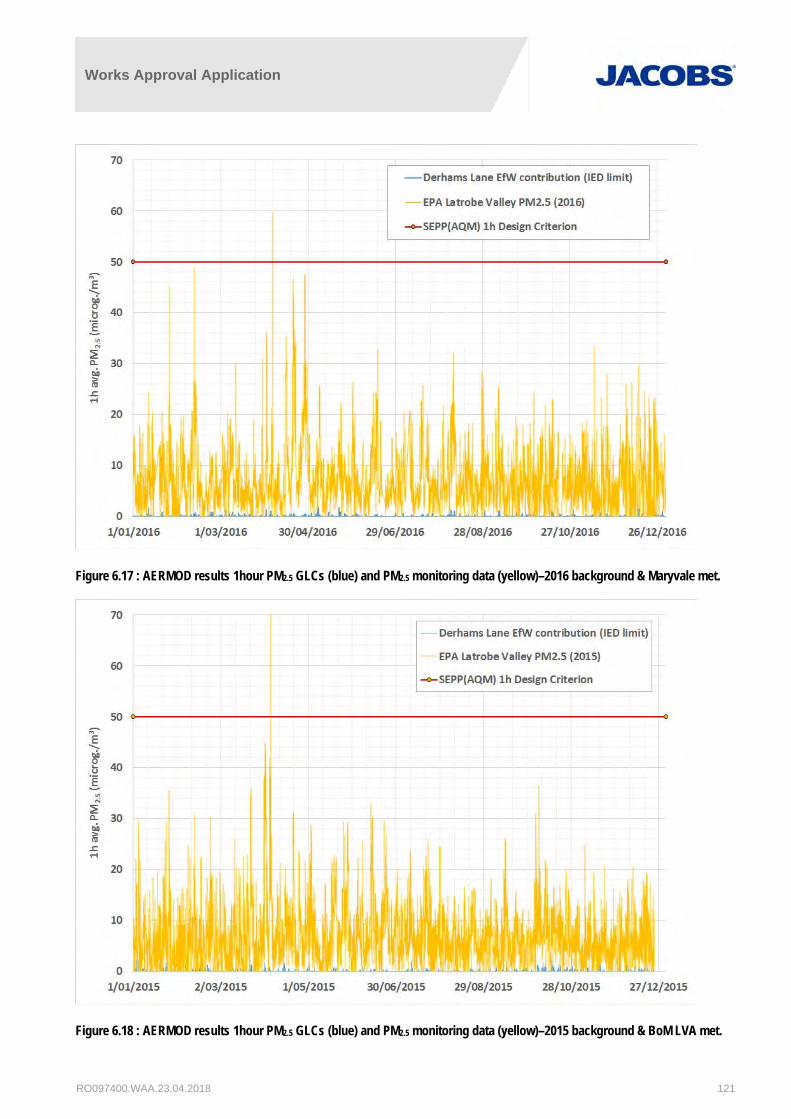
Works Approval Application
RO097400.WAA.23.04.2018 121
Figure 6.17 : AERMOD results 1hour PM2.5 GLCs (blue) and PM2.5 monitoring data (yellow)–2016 background & Maryvale met.
Figure 6.18 : AERMOD results 1hour PM2.5 GLCs (blue) and PM2.5 monitoring data (yellow)–2015 background & BoM LVA met.

Works Approval Application
RO097400.WAA.23.04.2018 122
Figure 6.19 : EPA PM2.5 monitoring data–2017 background only
The PM2.5 modelling results in Section 6.5 are based on an in-stack emissions concentration from the EfW Plant of 30 mg/Nm3, representing the IED limit for particle emissions. The model results shown in Figure 6.20 below were based on the more representative in-stack emissions concentration of 0.02 mg/Nm3 which can be considered to be conservative given that Ricardo-AEA (2015) states a minimum value of 0.005 mg/Nm3 and an average value of 0.012 mg/Nm3.

Works Approval Application
RO097400.WAA.23.04.2018 123
Figure 6.20 : AERMOD results 1hour PM2.5 GLCs (blue) and PM2.5 monitoring data (yellow)–2016 background & BoM LVA met, for more representative (lower) in-stack emissions concentration of 0.02 mg/m3.
6.6.7 AERMOD results for PM2.5 – comparisons with SEPP(AAQ) objectives
The purpose of this section is to provide the AERMOD results for comparisons with the SEPP(AAQ) objectives: maximum 24-hour average PM2.5 (25 µg/m3), and annual average PM2.5 (8 µg/m3).
The AERMOD results for maximum 24-hour average PM2.5 GLCs (µg/m3), using emissions estimates for the EfW stack and diesel generator, including the effects of terrain and building wakes, are provided in Figure 6.21. The results are shown without background concentrations to better illustrate the model-predicted effects of the Project. A statistical summary of results for the grid and discrete receptors, with background included, is provided in Table 6.19.

Works Approval Application
RO097400.WAA.23.04.2018 124
Figure 6.21 : AERMOD results maximum 24-hour PM2.5 GLCs (µg/m3) – 2016 BoM LVA met.
Table 6.19 : Statistical summary of AERMOD results: maximum 24hour PM2.5 GLCs (µg/m3) with background
Statistic AP Maryvale
2016
BoM LVA
2016
BoM LVA
2015
BoM LVA
2014
BoM LVA
2013
BoM LVA
2012
PM2.5, 99.9% 24h; grid maximum 34.5 33.7 32.9 23.9 ND ND
PM2.5, 90th percentile grid result 32.9 32.9 32.7 22.7 ND ND
PM2.5, 99.9% 24h; discrete
receptor maximum 33.0 32.9 32.7 22.8 ND ND
SEPP(AQM) PM2.5 Design Criterion – 25 µg/m3 ‘%’ = ‘Percentile’ ‘ND’ = ‘No Data’ – no reliable background data available.
Summary of PM2.5 results – exceedances of SEPP(AQM) design criterion due to high background PM2.5; see Section 6.6.5 .
The AERMOD results for annual average PM2.5 GLCs (µg/m3), using emissions estimates for the EfW stack and diesel generator, including the effects of terrain and building wakes, are provided in Figure 6.22. The results are shown without background concentrations to better illustrate the model-predicted effects of the Project. A statistical summary of results for the grid and discrete receptors, with background included, is provided in Table 6.20.

Works Approval Application
RO097400.WAA.23.04.2018 125
Figure 6.22 : AERMOD results annual average PM2.5 GLCs (µg/m3) – 2016 BoM LVA met.
Table 6.20 : Statistical summary of AERMOD results: annual average PM2.5 GLCs (µg/m3) with background
Statistic AP Maryvale
2016
BoM LVA
2016
BoM LVA
2015
BoM LVA
2014
BoM LVA
2013
BoM LVA
2012
PM2.5, annual average; grid
maximum 8.1 8.0 7.7 9.5 ND ND
PM2.5, annual average; grid result 7.2 7.2 6.9 8.8 ND ND
PM2.5, annual average; discrete
receptor maximum 7.3 7.2 6.9 8.8 ND ND
SEPP(AQM) PM2.5 Design Criterion – 8 µg/m3 ‘%’ = ‘Percentile’ ‘ND’ = ‘No Data’ – no reliable background data available.
Summary of PM2.5 results – exceedances of SEPP(AAQ) objective due to high background PM2.5; see Section 6.6.5.
6.6.8 AERMOD results for HF
The AERMOD results for maximum 24-hour average HF GLCs (µg/m3), using emissions estimates for the EfW stack and including the effects of terrain and building wakes, are provided in Figure 6.23. The results are shown without background, which was assumed to be zero. A statistical summary of the HF results for the grid and discrete receptors, for all HF design criteria, is provided in Table 6.21. In the Latrobe Valley, the main potential source of HF emissions originate from the combustion of brown coal for power generation. A literature review of HF in the background air was conducted which indicated that the background levels of were negligible. All the predicted HF GLCs were substantially less than the design criteria.
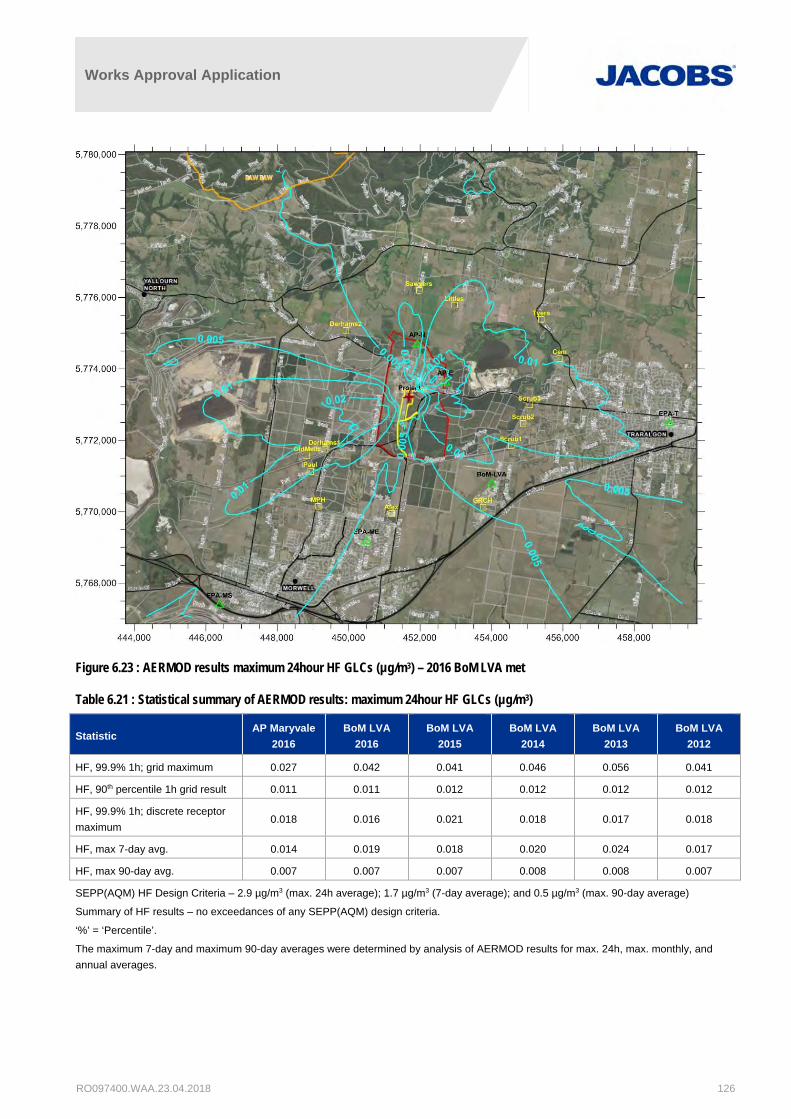
Works Approval Application
RO097400.WAA.23.04.2018 126
Figure 6.23 : AERMOD results maximum 24hour HF GLCs (µg/m3) – 2016 BoM LVA met
Table 6.21 : Statistical summary of AERMOD results: maximum 24hour HF GLCs (µg/m3)
Statistic AP Maryvale
2016
BoM LVA
2016
BoM LVA
2015
BoM LVA
2014
BoM LVA
2013
BoM LVA
2012
HF, 99.9% 1h; grid maximum 0.027 0.042 0.041 0.046 0.056 0.041
HF, 90th percentile 1h grid result 0.011 0.011 0.012 0.012 0.012 0.012
HF, 99.9% 1h; discrete receptor
maximum 0.018 0.016 0.021 0.018 0.017 0.018
HF, max 7-day avg. 0.014 0.019 0.018 0.020 0.024 0.017
HF, max 90-day avg. 0.007 0.007 0.007 0.008 0.008 0.007
SEPP(AQM) HF Design Criteria – 2.9 µg/m3 (max. 24h average); 1.7 µg/m3 (7-day average); and 0.5 µg/m3 (max. 90-day average)
Summary of HF results – no exceedances of any SEPP(AQM) design criteria.
‘%’ = ‘Percentile’.
The maximum 7-day and maximum 90-day averages were determined by analysis of AERMOD results for max. 24h, max. monthly, and
annual averages.
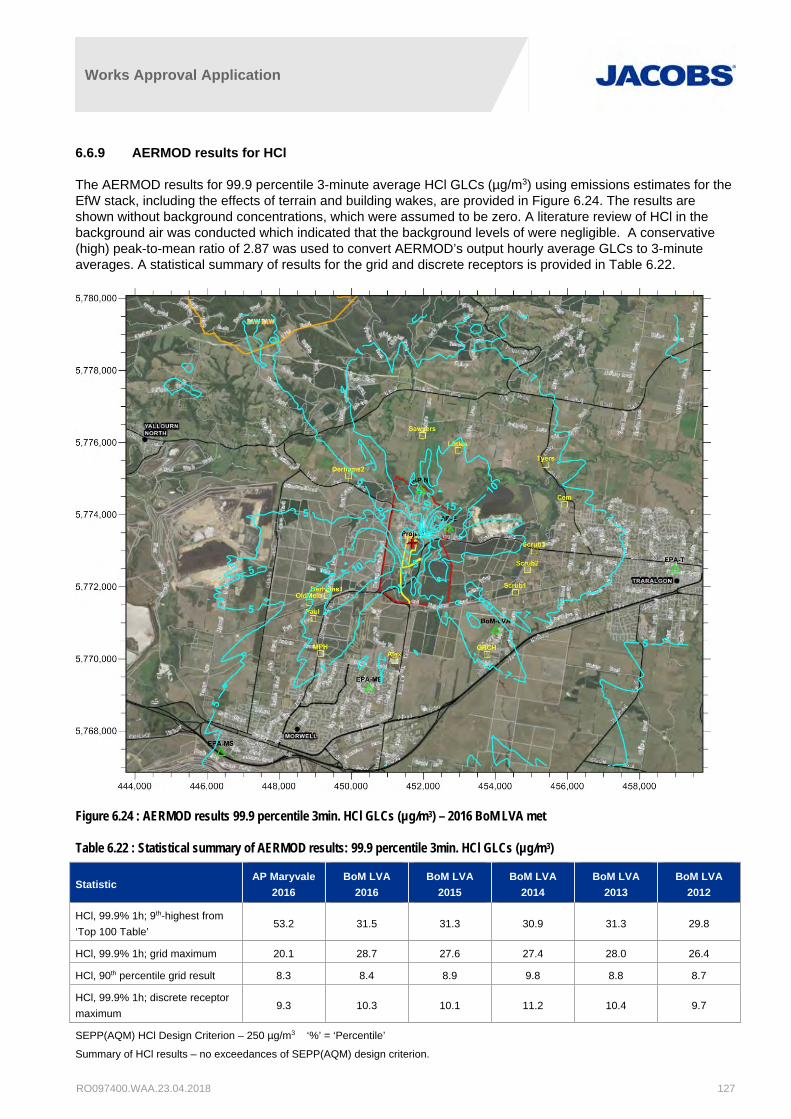
Works Approval Application
RO097400.WAA.23.04.2018 127
6.6.9 AERMOD results for HCl
The AERMOD results for 99.9 percentile 3-minute average HCl GLCs (µg/m3) using emissions estimates for the EfW stack, including the effects of terrain and building wakes, are provided in Figure 6.24. The results are shown without background concentrations, which were assumed to be zero. A literature review of HCl in the background air was conducted which indicated that the background levels of were negligible. A conservative (high) peak-to-mean ratio of 2.87 was used to convert AERMOD’s output hourly average GLCs to 3-minute averages. A statistical summary of results for the grid and discrete receptors is provided in Table 6.22.
Figure 6.24 : AERMOD results 99.9 percentile 3min. HCl GLCs (µg/m3) – 2016 BoM LVA met
Table 6.22 : Statistical summary of AERMOD results: 99.9 percentile 3min. HCl GLCs (µg/m3)
Statistic AP Maryvale
2016
BoM LVA
2016
BoM LVA
2015
BoM LVA
2014
BoM LVA
2013
BoM LVA
2012
HCl, 99.9% 1h; 9th-highest from
‘Top 100 Table’ 53.2 31.5 31.3 30.9 31.3 29.8
HCl, 99.9% 1h; grid maximum 20.1 28.7 27.6 27.4 28.0 26.4
HCl, 90th percentile grid result 8.3 8.4 8.9 9.8 8.8 8.7
HCl, 99.9% 1h; discrete receptor
maximum 9.3 10.3 10.1 11.2 10.4 9.7
SEPP(AQM) HCl Design Criterion – 250 µg/m3 ‘%’ = ‘Percentile’
Summary of HCl results – no exceedances of SEPP(AQM) design criterion.

Works Approval Application
RO097400.WAA.23.04.2018 128
6.6.10 AERMOD results for Hg
The AERMOD results for 99.9 percentile 3-minute average mercury (Hg) GLCs (µg/m3) using emissions estimates for the EfW stack, including the effects of terrain and building wakes, are provided in Figure 6.25. The results are shown without background concentrations, which were assumed to be zero. A literature review of Hg in the background air was conducted which indicated that the background levels of were negligible. A conservative (high) peak-to-mean ratio of 2.87 was used to convert AERMOD’s output hourly average GLCs to 3-minute averages. A statistical summary of results for the grid and discrete receptors is provided in Table 6.23.
Figure 6.25 : AERMOD results 99.9 percentile 3min. Hg GLCs (µg/m3) – 2016 BoM LVA met.
The following Hg results demonstrate no exceedances of SEPP(AQM) design criterion.
Table 6.23 : Statistical summary of AERMOD results: 99.9 percentile 3min. Hg GLCs (µg/m3)
Statistic AP Maryvale
2016
BoM LVA
2016
BoM LVA
2015
BoM LVA
2014
BoM LVA
2013
BoM LVA
2012
Hg, 99.9% 1h; 9th-highest from
‘Top 100 Table’
0.044 0.026 0.026 0.026 0.026 0.025
Hg, 99.9% 1h; grid maximum 0.017 0.024 0.023 0.023 0.023 0.022
Hg, 90th percentile grid result 0.007 0.007 0.007 0.008 0.007 0.007
Hg, 99.9% 1h; discrete receptor
maximum
0.008 0.009 0.008 0.009 0.009 0.008
SEPP(AQM) Hg Design Criterion (organic) – 0.33 µg/m3 ‘%’ = ‘Percentile’

Works Approval Application
RO097400.WAA.23.04.2018 129
6.6.11 Summary of AERMOD results for other substances
The AERMOD results for other substances, all with 3-minute average design criteria, were obtained by linearly scaling the HCl results from Section 6.6.9. This was possible given the background concentrations were zero for all other substances, and there was only a single source of emissions; i.e., the main stack (except for PAHs, for which the diesel generator emissions were insignificant). For all these cases a conservative (high) peak-to-mean ratio of 2.87 was used to convert AERMOD’s output hourly average GLCs to 3-minute averages.
A statistical summary of the AERMOD results for the other substances is provided in Table 6.24, for the six annual meteorological scenarios used for this assessment.
Table 6.24 : Statistical summary of AERMOD results for 99.9 percentile 3min. GLCs (µg/m3) – other substances
Substance & assessment AP Maryvale
2016
BoM LVA
2016
BoM LVA
2015
BoM LVA
2014
BoM LVA
2013
BoM LVA
2012
Ammonia: SEPP(AQM) NH3 Design Criterion – 600 µg/m3
Summary of NH3 results – all GLCs substantially less than the SEPP(AQM) design criterion – emission rate 3.92 g/sec.
NH3, 99.9% 1h; 9th-highest from
‘Top 100 Table’ 26.6 15.7 15.6 15.5 15.6 14.9
NH3, 99.9% 1h; grid maximum 10.0 14.4 13.8 13.7 14.0 13.2
NH3, 90th percentile grid result 4.2 4.2 4.4 4.9 4.4 4.3
NH3, 99.9% 1h; discrete receptor
maximum 4.6 5.1 5.1 5.6 5.2 4.8
Dioxins and Furans: SEPP(AQM) DF Design Criterion – 3.7E-06 µg/m3
Summary of DF results – all GLCs substantially less than the SEPP(AQM) design criterion – emission rate 1.31E-08 g/sec.
DF, 99.9% 1h; 9th-highest from
‘Top 100 Table’ 8.9E-08 5.2E-08 5.2E-08 5.2E-08 5.2E-08 5.0E-08
DF, 99.9% 1h; grid maximum 3.3E-08 4.8E-08 4.6E-08 4.6E-08 4.7E-08 4.4E-08
DF, 90th percentile grid result 1.4E-08 1.4E-08 1.5E-08 1.6E-08 1.5E-08 1.4E-08
DF, 99.9% 1h; discrete receptor
maximum 1.5E-08 1.7E-08 1.7E-08 1.9E-08 1.7E-08 1.6E-08
PAHs as B(a)P: SEPP(AQM) DF Design Criterion – 0.73 µg/m3
Summary of B(a)P results – all GLCs substantially less than the SEPP(AQM) design criterion – emission rate 1.74E-03 g/sec.
B(a)P, 99.9% 1h; 9th-highest from
‘Top 100 Table’ 0.012 0.007 0.007 0.007 0.007 0.007
B(a)P, 99.9% 1h; grid maximum 0.004 0.006 0.006 0.006 0.006 0.006
B(a)P, 90th percentile grid result 0.002 0.002 0.002 0.002 0.002 0.002
B(a)P, 99.9% 1h; discrete
receptor maximum 0.002 0.002 0.002 0.002 0.002 0.002
Hexavalent chromium (highest risk metal): SEPP(AQM) Cr(VI) Design Criterion – 0.17 µg/m3
Summary of Cr(VI)results – all GLCs less than the SEPP(AQM) design criterion – emission rate 0.02 g/sec.
Cr(VI), 99.9% 1h; 9th-highest from
‘Top 100 Table’ 0.136 0.080 0.080 0.079 0.080 0.076
Cr(VI), 99.9% 1h; grid maximum 0.051 0.073 0.070 0.070 0.071 0.067
Cr(VI), 90th percentile grid result 0.021 0.022 0.023 0.025 0.023 0.022
Cr(VI), 99.9% 1h; discrete
receptor maximum 0.024 0.026 0.026 0.029 0.026 0.025

Works Approval Application
RO097400.WAA.23.04.2018 130
Substance & assessment AP Maryvale
2016
BoM LVA
2016
BoM LVA
2015
BoM LVA
2014
BoM LVA
2013
BoM LVA
2012
Cadmium (2nd-highest risk metal): SEPP(AQM) Cd Design Criterion – 0.033 µg/m3
Summary of Cr(VI)results – all GLCs less than the SEPP(AQM) design criterion – emission rate 0.00391 g/sec.
Cd, 99.9% 1h; 9th-highest from
‘Top 100 Table’
0.027 0.016 0.016 0.015 0.016 0.015
Cd, 99.9% 1h; grid maximum 0.010 0.014 0.014 0.014 0.014 0.013
Cd, 90th percentile grid result 0.004 0.004 0.004 0.005 0.004 0.004
Cd, 99.9% 1h; discrete receptor
maximum
0.005 0.005 0.005 0.006 0.005 0.005
‘%’ = ‘Percentile’.
6.7 Management and mitigation
Key recommendations around management and mitigation of the Project are provided as follows:
1) Implementation of best practice and emissions controls to manage air emissions; e.g.
a) SEPP(AQM)
b) EPA (2017) – Demonstrating Best Practice guideline
2) Design the EfW Plant in accordance with the EPA Victoria EfW Guideline and the EU IED requirements
3) Installation of a range of pollution control equipment in the EfW Plant, including:
a) Flue gas recirculation for control of oxides of nitrogen generation in the furnace and for combustion control
b) Online flue gas oxygen measurement at the boiler economiser exit for controlling adequate furnace air supply for complete combustion with a design excess oxygen target of 6 vol % or greater at all times. Provision of a carbon monoxide analyser for combustion tuning optimisation shall also be considered on a merit basis in the design
c) Selective Non Catalytic Reduction (SNCR) using urea solution for oxides of nitrogen control in the upper zone of the furnace
d) Semi-dry or dry lime acid gas injection (preferably with a recirculation system for APC residues to the bag filter inlet duct or sorbent reactor vessel for increasing efficiency of reagent use and for the reduction of APC residue generation). The acid gas sorbent may be burnt lime or hydrated lime
e) Activated carbon injection prior to the bag filters in the flue gas duct or sorbent reactor system adjacent to the lime dosing point
f) A single stage of bag filters for fly ash particulate control and removal of all spent lime and activated carbon residues in a combined waste stream.
4) Australian Standard-compliant (NATA) and MCERTS (UK gas analyser accreditation scheme) certified air quality monitoring and linked to site emissions controls
a) Monitoring of the elemental composition of the in-stack pollutant concentrations to confirm that the proposed EfW operation will not cause significant air quality impacts at any sensitive receptors in Maryvale, Morwell and Traralgon.
5) Use of an environmental complaints register to monitor and manage any potential public impacts of air quality; e.g., odours, visible smoke, dust.
6.8 AERMOD results for elevated receptors
In accordance with the SEPP AQM, over 100 discrete receptors representing sensitive receptors such as schools and medical centres were identified by inspection of maps and vertical imagery of the Latrobe Valley.

Works Approval Application
RO097400.WAA.23.04.2018 131
These covered key residential areas on the valley floor e.g. Morwell, Traralgon, Moe, and Churchill, and included many other potential individual residential locations.
In addition, two elevated or ‘flagpole’ receptors were included to study air quality effects higher than the standard ground level receptors; e.g., higher up on multi-storey buildings, such as apartments. The elevated receptors were placed at the heights 1.8, 10 and 20 metres above ground level representing two multi-storey buildings identified in Traralgon.
The AERMOD results show the GLCs varied by less than 1 µg/m3 between heights of 1.8m and 20m; i.e., immaterial for the purposes of the air quality assessment.
Details of these elevated (‘flagpole’) receptors are listed below:
East. (m) North (m) Receptor Description
459,255 5,772,060 Traralgon Flagpole Receptor 1 EPA Office Traralgon
459,730 5,772,630 Traralgon Flagpole Receptor 2 ASIC Office Traralgon
6.9 Conclusion
An air quality impact assessment was undertaken for AP’s proposed EfW for its Maryvale site in accordance with the SEPP(AQM) and EPA guidelines for the use of the regulatory model, AERMOD (EPAV, 2014a; EPAV, 2014b). Details of the assessment methods were discussed and agreed with the EPA prior to commencing the works.
The application of best practice was considered in the assessment (EPAV, 2017). The potential air emissions were analysed and estimated following the EPA’s guidelines: Energy from waste (EPA, 2013a), and Recommended separation distances for industrial residual air emissions (EPA, 2013b).
Key components of the AERMOD modelling assessment methods were:
1) Use of AERMOD in accordance with EPA (2014b)
2) Creation of AERMOD meteorological data in accordance with EPA (2014a) including the use a five-year, dataset of hourly meteorological parameters.
Conservative measures taken in the assessment included:
Inclusion of already-closed industrial facilities into the background air quality data, such as Hazelwood Power Station, Morwell Power Station and the Energy Brix briquette factories;
Inclusion of the existing Australian Paper gas-fired boilers into the background air quality data – this is conservative because the purpose of the EfW Project is to reduce the use of these boilers;
Modelling the particulate matter 2.5 (PM2.5) as 100% of the entire mass fraction of total particulate matter being emitted from the EfW Plant at the maximum IED limit of 30 mg/Nm3. Modelling of PM2.5 was also performed using a more realistic figure of 0.02 mg/Nm3, which itself is still a conservative value given that the Ricardo-AEA report20 states this figure (0.02 mg/Nm3) is the average maximum emission from sampled UK EfW plants.
Adoption of a ‘low wind’ algorithm for calculating air pollutant dispersion specifically for lower wind speeds
Inclusion of wake and downwash effects associated with the EfW’s main proposed buildings and stacks
Conservative techniques used to estimate emissions of each of the substances.
20 Ricardo-AEA Ltd (Buckland, Thomas), Assessment of particulate emissions from energy-from-waste plant, National Atmospheric Emissions
Inventory, Report for DEFRA, 14/10/2015. https://uk-air.defra.gov.uk/assets/documents/reports/cat07/1511261133_AQ0726_PM_EfW_emissions_report_Issue1_Final_including_appendices.pdf , assessed
Works Approval Application
RO097400.WAA.23.04.2018 132
Higher risk air pollutants were identified from a review of the proposed EfW operations; they were: CO, NO2, SO2, PM2.5, HF, HCl, NH3, and PAHs as B(a)P. Highest risk metals were determined by quantitative risk assessments to represent a larger groups of elements; they were: Cr(VI) and Cd – mercury (Hg) was also modelled. Model results for most of the International Agency for Research on Cancer (IARC) Group 1 carcinogens (such as Cr(VI) and Cd) showed that the GLCs due to the EfW Plant are many times below the relevant SEPP Design Criterion.
This report set out emissions limits that must be complied with. With respect to IRAEs, there is no set separation distance for such facilities, rather they are required to be assessed on a “case by case” basis. For the existing Mill, there is an existing buffer zone in place within the Latrobe Planning Scheme (Amenity Rural Buffer), which is approximately 3km around the Mill. This is considered adequate for the EfW Plant.
The assessment concludes that the emissions to air from the proposed EfW Plant are essentially minimal, with no adverse air quality impacts anticipated – Table 6.1 shows the key emissions from the proposed EfW Plant and the compliance with SEPP (AQM). Emissions from the EfW Plant will meet all IED and SEPP (AQM) emission limits.
The AERMOD results for the EfW Plant’s operating scenario demonstrated there were no predicted exceedances of SEPP(AQM) Design Criteria for the 99.9th percentile, with the exception of PM2.5 when combined with background concentrations. AERMOD results demonstrate that there are no exceedances of the SEPP(AQM) design criteria for any hourly modelled substances at any of the discrete receptors.
The exceedances for PM2.5 are due to the existing high background levels of PM2.5, as demonstrated by the time-series plot analysis. The peak PM2.5 exceedances are highly likely associated with elevated smoke levels that have originated from bushfires, landholder burning off, forest regeneration burns and planned burning. Smoke is often persistent in the Latrobe Valley in autumn due to the stable atmospheric conditions at that time of year as demonstrated in the time series plots. The time-series plots show that the contribution of the EfW Plant to PM2.5 ground level concentrations is minimal in comparison to the high PM2.5 background levels.
The assessment showed that existing background PM2.5 levels are above the design criterion for some periods as shown in a time-series plot analysis. AERMOD modelling was also conducted on a scenario where there were zero EfW Plant PM2.5 emissions (i.e. only background) which showed exceedances of SEPP(AQM) Design Criteria. Additionally, AERMOD modelling was conducted using a high in-stack PM2.5 emissions concentration (30 mg/m3) and a representative in-stack PM2.5 emissions concentration (0.02 mg/m3). The difference in resultant GLCs between the 30 mg/m3 case, the 0.02 mg/m3 case and the zero emissions case was negligible providing further confirmation that the PM2.5 exceedances are due to the high background PM2.5 levels.
It should also be noted that the assessment included an evaluation of total particulate emissions (PMtotal) and these emissions from the EfW Plant, as measured at the stack, are compliant for the IED Limit of 30mg/Nm3.
The conclusion of the air quality modelling assessment is there is a low risk of air quality impact from the Project’s EfW emissions. Although the Project has only a very small effect on the high PM2.5 background levels, PM2.5 should be monitored to confirm the Project’s predicted compliance on PM2.5 levels.
6.10 References
AG (2009): Australian Government, NPI Volatile Organic Compound Definition and Information, Department of the Environment, Water, Heritage and the Arts, Version 2.7, September 2009.
AG (2017a): Australian Government, Air Pollutants, Department of the Environment and Energy, http://www.environment.gov.au/protection/air-quality/air-pollutants, accessed 26-Jul-17.
AG (2017b): Australian Government, Air toxics, Air quality fact sheet, Department of the Environment and Heritage, 2005, http://www.environment.gov.au/protection/publications/air-toxics, accessed 26-Jul-17.
BoM (2018): Bureau of Meteorology, Monthly Climate Statistics for Morwell (Latrobe Valley Airport), Station No.085280, BoM summary created 14th Feb., 2018.

Works Approval Application
RO097400.WAA.23.04.2018 133
Borgas, M.S., The mathematics of whiffs and pongs, Presented at Enviro2000 Odour Conference, Clean Air Society of Australia and New Zealand, Sydney, 9-13 April 2000.
CSIRO, CSIRO Division of Atmospheric Research, Research Report 1985–1988, Ed. P. Holper, Aspendale, Victoria, 1989.
DPI (2008): Department of Primary Industries, Minerals and Petroleum, Explore Victoria Online–GeoVic, from web page accessed in 18/6/2008.
EBAC (2018): Energy Brix Australia Corp., History of the Morwell Power Station and Briquette Works, http://ebacdemolition.com.au/about-history/, accessed 15-Feb-2018.
EC (2006): European Commission, Integrated Pollution Prevention and Control, Reference Document on the Best Available Techniques for Waste Incineration, August 2006.
Engie (2018): Engie, Hazelwood Rehabilitation Project, http://www.gdfsuezau.com/hazelwood-closure/Hazelwood-Rehabilitation-Project, accessed 15-Feb-2018.
EPA (2012): Environment Protection Authority Victoria, Tullamarine Landfill, Community air monitoring program, Final Report, Publication 1510, October 2012.
EPA (2013a): EPA Victoria, Guideline, Energy from Waste, Publication No.1559, December 2013.
EPA (2013b): EPA Victoria, Guideline, Recommended separation distances for Industrial Residual Air Emissions, Publication No.1518, March 2013.
EPA (2013c): EPA Victoria, AERMOD Guide Addendum – Equations and Calculations, December 2013.
EPA (2013d): EPA Victoria, AERMOD Guide Addendum – Input Data Formats, December 2013.
EPA (2013e): EPA Victoria, AERMOD Guide Addendum – Preparation of Terrain Files, December 2013.
EPA (2014a): Environment Protection Authority Victoria, Guidelines for Input Meteorological Data for AERMOD, Publication 1550, Revision 3, September 2014.
EPA (2014b): Environment Protection Authority Victoria, Guidance notes for using the regulatory AERMOD air pollution model, Publication 1551, Revision 2, June 2014.
EPA (2017): EPA Victoria, Guideline, Demonstrating Best Practice, Publication 1517.1, October 2017.
EPA (2018): EPA Victoria, Paper Australia Pty Ltd., Holder of Licence: 46547, Issued: 16/09/1996, Last Amended: 21/07/2017, Premises Address: Traralgon West Road, Maryvale Vic. 3840, EPA Interaction Portal Licences Search, https://portal.epa.vic.gov.au/irj/portal/anonymous?NavigationTarget=ROLES://portal_content/epa_content/epa_roles/epa.vic.gov.au.anonrole/epa.vic.gov.au.searchanon&trans_type=Z001, accessed 15-Feb-2018.
Hurley, P. J., W. L. Physick, A. K. Luhar, TAPM: a practical approach to prognostic meteorological and air pollution modelling, Environmental Modelling & Software 20, pp. 737-752, (2005a).
Jacobs (2017): Jacobs Group (Australia) Pty Ltd., Air Quality Impact Assessment, Memorandum, 29 November 2017.
Manins, P. C., Concomitant research from the Latrobe Valley Airshed Study, Aust. Met. Mag. 32, pp. 95-104, 2 June 1984.
NEPC (2011): National Environment Protection Council Service Corp., National Environment Protection (Air Toxics) Measure, Federal Register of Legislative Instruments F2011C00855, 16 September 2011.
Works Approval Application
RO097400.WAA.23.04.2018 134
pDs (2018): pDs Consultancy, Input Meteorological data files for AERMOD, Maryvale – VIC, 2018.
Physick, W. L. and D. J. Abbs, Flow and plume dispersion in a coastal valley, J. Appl. Met. 31, pp. 64-73, January 1992.
Physick, W. L. and D. J. Abbs, Modeling of summertime flow and dispersion in the coastal terrain of southeastern Australia, Monthly Weather Review 119, pp. 1014-1030, April 1991.
Reisen, F., G. Fisher, P. Torre, A. Marshall, M. Cope, K. Emmerson, I. Galbally, R. Gillett, M.D. Keywood, S. Molloy, and J. Powell, Analysis of Air Quality during the Hazelwood Mine Fire, CSIRO Oceans & Atmosphere, 6 November 2015; Revised May 2016.
Ricardo-AEA Ltd (Buckland, Thomas), Assessment of particulate emissions from energy-from-waste plant, National Atmospheric Emissions Inventory, Report for DEFRA, 14/10/2015.
USEPA (2004), U.S. Environmental Protection Agency, AERMOD: Description of Model Formulation, EPA-454/R-03-004, September 2004.
VG (1999), Victoria Government, State Environment Protection Policy (Ambient Air Quality), Victoria Government Gazette, SPECIAL No. S 19, 9 February 1999.
VG (2016), Victoria Government, State Environment Protection Policy (Ambient Air Quality), Victoria Government Gazette, G 30, 28 July 2016.
VG (2001), Victoria Government, State Environment Protection Policy (Air Quality Management), Victoria Government Gazette, SPECIAL No. S 240, 21 December 2001.