6-16-11 cyccs ac minutes final - maine cyccs ac minutes... ·...
TRANSCRIPT

1
Central York County Connections Study Advisory Committee Meeting June 16th, 2011 10 am-‐1 pm
Conant Chapel, Alfred Attendees: Kenneth Creed, YCCAC; Leo Reul, Lyman; Diane Robbins, Arundel; Donna DerKinderen, Arundel; Larry Torno, Lebanon; Don Allen, Wells Regional Transportation Center; Heidi Daly, Alfred Conservation Commission; Chris MacClinchy; Southern Maine Regional Planning; Hazen Carpenter, Mousam Way Trails; Jim Nimon, Sanford Regional Growth Council; Gerry Audibert, MaineDOT; Penny Vaillancourt, MaineDOT; Sara Devlin, Maine Turnpike Authority; Uri Avin, Parsons Brinckerhoff; Steve Rolle, Parsons Brinckerhoff; Kevin Hooper, Kevin Hooper Associates; Carol Morris, Morris Communications; Ben Ettelman, Morris Communications Meeting began at 10:02 am. Gerry Audibert: Thank you all for coming to this Advisory Committee Meeting for the Central York County Connections Study. I am Gerry Audibert from MaineDOT. Today we are going to see the results from the traffic modeling and I want to caution you all that the results of the traffic modeling are just one of the many factors we will examine before making study recommendations so please do not rush to judgment based on the data that we will share with you today. If at any time you folks have any questions or comments, please feel free to let us know. We take detailed minutes and record all of the discussion so please let us know what you think because we will take all comments into consideration moving forward. Carol Morris is going to come up and share the meeting agenda with you. Carol Morris: Welcome and thank for coming, the agenda for the meeting this morning is as follows:
• Welcome • Web Survey #2 • Phase II Strategies • Review Phase II MOEs • Results and Initial MOE Assessment • Next Steps/Next Meetings
You may have noticed that we did not send out any pre-‐materials before today’s meeting and that was purposeful. The material that we are going to share is complex and hard to understand without some explanation. We want to stress that the traffic results are the first piece of the puzzle and they do not paint the complete picture that we are putting together so please look at this data objectively, as Gerry says, do not jump to conclusions as to what the best solution might be.

2
Carol Morris presented the following slide showing Web Survey #2: “How do YOU define Best?”
Our most recent survey on the study website asked participants to rate between 1 and 5 (1 being least and 5 being most important) how they define what is the best measure of effectiveness for improving transportation connections within the study area. We had a great response. The first survey had about 35 respondents and for this survey we had 111 respondents. The results of the survey showed that while most people ranked all measures high, the one measure that didn’t rank as high as the rest was “to make the most of the existing system”. This leads us to believe that there is a sentiment within the area that people want the system to be fixed and that they want some improvements. The fact that all of the MOEs ranked highly reflects that the Advisory and Steering Committees did a good job pinpointing what people in the area are interested in and that we are in a good place to move forward. Now Steve Rolle is going to review the strategies that we went over in the last meeting. Steve Rolle: As Carol said, I want to do a quick review of the strategies that we shared with you at the last meeting and have since tested. We made some adjustments based on input from the Steering and Advisory committees and I will go over those with you. The following is an overview of the corridor strategies tested:
• 12 Strategies tested o 9 with regional focus connecting Central York County to I-‐95 and Route 1 o 3 investigate more localized improvements
• Organized by 3 Corridors o Biddeford o Kennebunk/Wells o North Berwick/Ogunquit
The following is an overview of the refinements that we made since the last meeting:

3
• Focused on the more aggressive options for upgrading existing corridors • Added connections to Route 1 • Added an additional Sanford-‐Biddeford Expressway strategy
Keep in mind that for Phase II, strategies are very conceptual and intended to cover a broad spectrum of improvement options. I will review each strategy individually to refresh our memories and to share these with any Advisory Committee members who were unable to make the meeting last month. The first corridor that we will focus on is the Biddeford Corridor:
• Strategy B1: Upgrade Rte 111 (Regional Strategy) o 4 Lanes east of Rte 224 o Minor capacity improvements to Rte 202 west of Rte 224 o Increase speed limit to 55 mph (except in town or at major crossroads)
• Strategy B2: Biddeford Connections (Local Strategy)
o New connections between Rte 111, Rte 1 and Waterboro Road
• Strategy B3: Upgrade Rte 111 with I-‐95 Access and Biddeford Connections (Regional Strategy)
o Combines elements of Strategies 1 and 2 o Create new, direct access to Maine Turnpike (I-‐95 exit 32), avoiding the
congested intersection at Rte 111/Biddeford Spur.
• Strategy B4: Sanford Southern Bypass (Local Strategy) o New highway linking Rte 202 (west of Sanford) to Rte 4 (east of Sanford)
• Strategy B5: Expressway (South) (Regional Strategy)
o Limited Access 4-‐lane Highway o Interchanges:
Sanford/Alfred: Rte 202 Kennebunk/Lyman: Rte 35, I-‐95 Arundel/Biddeford: I-‐95
o New connecting roadways: Arundel/Biddeford: Rte 1 Sanford: Rte 109, Rte 224
• Strategy B6: Expressway (North) (Regional Strategy)
o Limited Access 4-‐lane Highway o Interchanges:
Sanford: Rte 202, Rte 111 Alfred: Rte 202 Lyman: Rte 35 Biddeford: I-‐95/Rte 111

4
o New connecting roadways: Arundel/Biddeford: Rte 1
Carol Morris: This strategy was developed after the last set of meetings because at the last Steering Committee Meeting we had a member strongly advocate that we test this. We did so even though it is a very controversial alignment because this is the stage where we put everything on the table. Steve Rolle: Yes, during this phase we really wanted to look at a wide range of options to learn as much as we could about potential differences, so that is why we developed and tested this corridor. The following are the strategies that we tested for the Kennebunk/Wells Corridor:
• Strategy K1: New Rte 99/Rte35/Exit 25 Connector (Local Strategy) o More direct connection between Rte 99 and Rte 35 in Kennebunk o Improves access between Rte 99 and I-‐95 (exit 25)
• Strategy K2: Upgrade Rte 109 (Regional Strategy)
o 4 Lanes between Rte 4 and Rte 99 o Increase speed limit to 55 mph
Would require new alignment in developed areas of South Sanford and High Pine
o Passing lanes (one each direction) south of High Pine
• Strategy K3: Kennebunk Expressway o Limited Access 4-‐lane Expressway o Interchanges:
Sanford: Rte 202, Rte 99 Kennebunk/Wells: I-‐95/Rte 9A
o New connecting roadways: Kennebunk/ Wells: Rte 1 Sanford: Rte 109, Rte 224
The following are the strategies that we tested for the North Berwick/Ogunquit Corridor:
• Strategy NB1: Upgrade Rte 4 (Regional Strategy) o Increase speed limit to 55 mph (except approaching Rte 109) o Passing lanes (two each direction) o Rte 4 bypass around North Berwick town center
• Strategy NB2: Rte 4 – Ogunquit Connector (Regional Strategy)
o Upgrade Rte 4 (per Strategy NB1)

5
o New 2-‐lane at-‐grade highway to I-‐95 and Rte1 in Ogunquit
• Strategy NB3: Expressway (Regional Strategy) o Limited Access 4-‐lane Expressway o Interchanges:
Sanford: Rte 202, Rte 4 Wells/N Berwick: Rte 9A
o New connecting roadways: Ogunquit: Rte 1, Berwick Rd Sanford: Rte 109 (South Sanford)
So those are the 12 strategies that we tested. Steve Rolle presents a slide showing 2035 Modeled Daily Traffic: 2035 Baseline The first Measure of Effectiveness (MOE) that we are going to look at is projected traffic and highway capacity. One component of that is looking at how travel patterns change when we compare the volumes of the strategies that we tested against the traffic and highway volumes of the 2035 baseline condition, shown in the map on this slide. The baseline conditions map assumes no improvements at all within the study area, other than standard maintenance. In other words, it’s essentially today’s highway system with traffic projections for 2035, which are on average 29% higher than the current volume today based on population and job growth within the study area. So for example, Route 111, has projected traffic volumes of 20,000 to 26,000 vehicles a day, and similarly to today, traffic increases as you get closer to Biddeford. Carol Morris: How does that compare to today? Steve Rolle: Today the volume is about 16,000 to 22,000 vehicles per day so that is a roughly 20% increase in volume which is a big number for a 2 -‐lane roadway. Route 109 is projected to increase from 13,000 today to about 16,000 in 2035, and as much as 20,000 vehicles per day in South Sanford where there is a lot of commercial activity. Route 4 is 17,000; Route 9B increases from 14,000 or so today to 21,000 vehicles under the baseline conditions in 2035. The volume on the turnpike increases to 39,000 in one direction and 37,000 in the other, so we have projected about 76,000 total daily traffic on the Turnpike in 2035. Gerry Audibert: The 20% growth is not uniformly applied on each highway, correct? Steve Rolle: That is correct. There is more growth in some areas of corridors than others depending on the amount of growth that each community experiences.

6
Carol Morris: The various strategies we will show you could potentially change how that growth happens as well, because if you do a road improvement, you will find that more cars use that road, so there will be adjustments made as we move forward to account for that. Steve Rolle: Yes. As we go through the strategies, keep in mind that we’re looking at how traffic volumes are predicted to change from the baseline condition volumes. I want to remind everyone of the Measures of Effectiveness (MOEs) that we will use to analyze and compare the various strategies in Phase II of the study. We are still evaluating the full range of MOEs, but today we are going to focus on the following four:
MOE Measure
Projected Traffic and Highway Capacity
• Changes in corridor traffic volumes • Changes in screenline traffic volumes
Travel Times and Delay • Projected travel times between key origins and destinations • Average network speed and total VHT
Impact to Rural and Urban Character • Rural acreage potentially affected • Proximity to town centers and identified historic sites/districts
Environmental Constraints • Miles of wetlands and environmental features in corridor
Carol Morris: At the next meeting we will look at economic benefits and costs along with traffic safety and transit. After the next meeting we will complete Phase II of the study by taking some of these strategies off the table, depending upon how well they work based on the Phase II level of analysis. Then we will move into Phase III where we will have a smaller number of strategies that we can look at in more detail and the Steering and Advisory committees will help to develop another set of similar but more refined MOEs for Phase III. Steve Rolle: Phase III strategies may look different from the strategies that we have developed in Phase II, as we will likely learn some things that we didn’t know when we initially developed these. Phase III will also be when we pull in other aspects that we have talked about such as transit and access management and consider how all of those pieces work together. So the first measure that we are going to look at is Projected Traffic. We will compare modeled changes in daily traffic in the two following ways:
• Daily Traffic “Difference Plots”

7
o Maps where and by how much traffic changes relative to the 2035 baseline
• Traffic “Screenlines” o Shows total traffic volume on all routes crossing an imaginary line
Let’s look at the difference plots first and then move on to the screenline plots. The reason to also consider the screenline plots is because difference plots are good at highlighting changes to specific roads, but do not easily allow us to compare total traffic volume changes for all routes. As one corridor’s volume increases and two other corridors’ volume decreases, it’s difficult to understand the aggregate total of those shifts by looking at the difference of volumes alone. The screenlines are intended to capture directional travel between markets. Shown are the screen lines that we used for this analysis:
The red line is intended to capture travel from central York County to points east and the blue line is intended to capture travel between the Sanford region and points south. This analysis looks at the total volume of every road that crosses that imaginary line and this provides us with a better understanding of not only how the volume changes on each individual corridor but also how the volume changes on all of those corridors together. So let’s start by looking at the difference plots (the difference between the projected 2035 baseline volumes and the modeled traffic volumes for each strategy) for the following Biddeford Corridor strategies:
• B1: Upgrade Rte 111 • B3: Upgrade Rte 111 with I-‐95 and Biddeford Connections • B5: Expressway (southern alignment) • B6: Expressway (northern alignment)
8
Steve Rolle presents a slide with a map showing 2035 Modeled Change in Daily Traffic: Strategy B1 This slide shows the difference plot for Strategy B1, which is the upgrade of Route 111. The blue lines indicate the routes that would experience growth in traffic volume based on this particular strategy. The model forecasts that in the year 2035, this strategy would increase traffic volume on Route 111 between 6,000 and 8,700 vehicles per day. Corridors that experience a decrease in traffic volume from the 2035 baseline projections are shown as red on this map. The traffic volume on Route 99 decreases by 1,300 and the volume on Waterboro Road decreases by 1,900. Hazen Carpenter: If you increase Route 111 to that extent, you have to continue it to the New Hampshire line or you are dumping all of that traffic in Sanford. Steve Rolle: Yes, if you are increasing the amount of traffic heading towards Sanford you have to think about how that gets dealt with beyond the improvement limits, including local improvements. That is why we have looked at strategies such as a southern bypass of Sanford. As we move into Phase III there may be bits and pieces of different strategies that we put together to create hybrid strategies. Gerry Audibert: Would it be fair to say that the model is showing that there is a lot of traffic that is starting or ending in Sanford based on the population and employment projections rather than continuing west to New Hampshire? Steve Rolle: Yes, in this case we are not showing any notable increase in traffic to the west of Sanford. In the interest of simplifying the maps for viewing purposes I don’t show anything below 1,000 vehicles a day difference, so by notable I mean more than 1,000 additional trips daily. That is a fair statement though because this shows a significant increase in volume coming out of Sanford, but not as much so to the west of Sanford. Steve Rolle presents a slide with a map showing 2035 Modeled Change in Daily Traffic: Strategy B3 This slide shows the difference plot for Strategy B3, which is the same upgrade to Route 111, but with an added direct connection to the Maine Turnpike at Exit 32, as well as local connections to other major roadways in the area. We see similar results in that the improvements attract traffic to the corridor, demonstrating demand. The model forecasts that in the year 2035 this strategy would increase traffic volume on Route 111 between approximately 6,500 to 10,500 vehicles a day (compared to the 2035 baseline). The connector roads help limit increases in the most congested sections near Biddeford, however. About 8,000 vehicles per day use the connector to Waterboro Road, 8,800 use the new access connector to I-‐95 and about 4,700 use the connector to Route 1.

9
Diane Robbins: Knowing that hypothetically that there might be some major changes to the Exit-‐32 Interchange in this strategy, will the location of the casino change this, or vice versa? Carol Morris: Yes, if the casino happens, we would refine our recommendations working with the towns of Biddeford and Arundel as well as the transportation agencies. This is simply a way to test traffic flow. Diane Robbins: I am trying to figure out where this intersection is supposed to connect to the turnpike. Steve Rolle: The new connection would be at the existing Exit 32 interchange location, and we presumed it would connect to Route 111 about where the four lane section begins today at Biddeford Crossing. If we were to move this strategy forward we would need to study the specific location of the connection in greater detail. Regarding the Racino, our 2035 baseline and modeled projections do not assume that the casino has been built. Gerry Audibert: Correct, and the reason for that is that it has not been approved yet. Anything that is not currently planned we do not consider. If the racino is moved forward we may have to alter our study to account for that, or there may be a separate study, but we cannot make any assumptions regarding the racino simply because it has not been approved as of today. Hazen Carpenter: Another thing to consider is that the upgrades to the Spaulding Turnpike in Rochester has increased volume in this area and on Route 111. Steve Rolle: Those improvements are reflected in our model and assumed in our network assumptions for the 2035 baseline. Some of the growth in the 2035 baseline projections as well as our modeled projections may be due to those improvements on the Spaulding Turnpike. We will now look at the two expressway strategies for this corridor, and I want to caveat this by noting that you will notice that the blue lines on these maps are very wide. While it is true that the expressways do attract more traffic volume than the Route 111 upgrades did, keep in mind that these maps show the difference in traffic volume on the roads rather than total volume. In the case of the Expressways, these are brand new roads, so the difference in traffic volume is actually equal to the total volume carried. Steve Rolle presents a slide with a map showing 2035 Modeled Change in Daily Traffic: Strategy B5 This slide shows a map of the difference plot for strategy B5, which is the southern expressway. The model forecasts that this corridor would attract between 30,000 to

10
39,000 daily trips, depending on location. And you’ll note that it attracts a lot of vehicles from the surrounding corridors. Route 111 decreases by 13,000 vehicles per day on the central part of the corridor, and a bit less -‐ about 6,000 on the Biddeford end, where retail and commercial uses are going to continue to attract quite a bit of traffic. There is also a decrease in traffic volume of about 2,000 vehicles per day on Waterboro Road and approximately 5,000 on Route 99. Kevin Hooper: For those of you wondering how these shifts work, it is not always the case that if traffic decreases on Waterboro Road they are shifting to the new expressway. Most likely some vehicles are shifting from Route 111, which frees up Route 111 and reduces congestion and increases travel speed. So most likely some vehicles that would normally travel on Waterboro Road are actually shifting to Route 111 as vehicles that normally travel on Route 111 shift to the new expressway. The expressway is not attracting all vehicles from all corridors within this network. Steve Rolle: Right, this shows all of the changes network wide. It is also important to remember that while the model presumes the same number and location of people and jobs in 2035 for each of the strategies, it can reassign where trips are made. So for example, people may work or shop in a different location under each of the strategies, depending on their accessibility to jobs and shopping. This is a long-‐term shift that you would expect to see rather than an immediate impact. Chris MacClinchy: This doesn’t take into account tolls, correct? Steve Rolle: Yes, we looked at these without tolls, with the exception of connections to the existing turnpike. Diane Robbins: When I am looking at the B5 strategy, I’m assuming that this is going to be new construction. When you say expressway, will this connect to any of the local roads along the way? Steve Rolle: For the expressways, the only access points are at the interchanges (see the earlier strategy descriptions…interchanges are shown as yellow circles) Gerry Audibert: It is called a limited access highway so there would be no driveway or street connections other than the terminus points and the interchanges. Donna DerKinderen: So with this strategy you would dissect Arundel into two pieces? Steve Rolle: One of the issues with a limited access facility is that it wil divide land it passes through, except where underpasses or overpasses are provided.

11
Carol Morris: When we get to the environmental piece we will analyze the environmental and social impacts of the strategies. We are only looking at how they perform from a transportation perspective at this point. Steve Rolle presents a slide with a map showing 2035 Modeled Change in Daily Traffic: Strategy B5 This slide shows a map of the difference plot for Strategy B6, which is a limited access expressway that is north of Route 111. Interestingly, this route attracted less traffic through the central and eastern segments in Lyman, Arundel and Biddeford -‐ around 23,000 – which is less than for Strategy B5. I believe that is because it doesn’t directly access the larger concentrations of population and commercial activity in Sanford. It does, however, attract quite a few trips on the bypass section around Sanford (the segment of the expressway that loops around the northern part of Sanford and terminates at Route 202). That particular section attracts over 20,000 trips a day, but the traffic volumes drop significantly on the local roads in Sanford (by approximately 50% on Route 11a for example). This leads me to believe that people are using this as a quick way to get from one side of town to another so they are short distance trips. Steve Rolle presents a slide showing Screenline Comparisons for East-‐West Travelers (West of Biddeford) with the following bar graph:
The screenline comparisons capture all of the roads that pass across an imaginary line between Biddeford and central York County, so we can capture the total volume of traffic between those specific travel markets. All of the strategies are listed here across the bottom with the daily traffic on the vertical axis. The blue bars indicate traffic on Route 111, the red color is traffic using the new expressway options, and the green is traffic on all other local roads crossing this screenline. A couple of things of interest here. First of all, there is quite a bit of growth from 2010 current conditions to the 2035 baseline. The second point of interest is looking at how

12
the traffic on Route 111 varies by strategy. With the new expressways, Route 111 experiences significant decreases in vehicles per day, whereas the corridor upgrades attract additional trips. The third thing to note is that the expressway options, and to a lesser degree the upgrades, add more total traffic, as we have added additional capacity for east-‐west travel. Carol Morris asked the Advisory Committee if anything they have seen today surprised them. The Advisory Committee indicated they no. Steve Rolle: One thing that got my attention is that there is an approximately 29% growth by 2035 in total traffic volume from the 2010 current conditions. So we will need to plan for growth in traffic. Kevin Hooper: We have population increase of 25% and employment growth of roughly 30%. Diane Robbins: Has the current lack of employment been taken into consideration? Uri Avin: We projected employment growth to 2035 as part of the study; those numbers are included when we run this model. The 30% employment growth is reflected in the model and these numbers. Carol Morris: If you remember from Charlie Colgan’s presentation last time, you’ll recall that there is a stagnant period as the study area, as well as the rest of the country, climb out of the recession, but because we are looking at a 25-‐year period, Charlie is still projecting a reasonable amount of employment growth in the southern part of Maine. Hazen Carpenter: Going back to the B6 Strategy. It will help people get around Springvale, but the employment growth has historically been south of Sanford so I think the expressway loop should go south of Sanford to accentuate that job growth. Carol Morris: The thought of B6 was that ultimately that would link to New Hampshire and the Spaulding Turnpike based on growth in the New Hampshire markets. We will look at the economic part of this next time and while that road doesn’t seem to make sense now, we want to understand the potential economic benefits of the markets west of Sanford. Kevin Hooper: One thing that we have held constant here is where the population and employment growth is. The only thing that changes is where you go to work, where you shop, where the distribution of people is, but not where the homes and jobs are. In Phase III, we are going to have information on how much these Strategies will create or change jobs, where people live, whether there is more or less sprawl. Nothing we did here makes a change to the trips coming in from New Hampshire. For example, we did not put a shopping mall at the end of Route 202, even though there would be pressure

13
to have commercial development at the end of an expressway. There will be changes in land use patterns when a new road is built and those are not reflected, as there are too many variables to take into account to be accurate. The next phase of the study will look at some of those variables. Steve Rolle: That is one of the benefits of having a multi-‐phase study. In the traditional modeling process, this is where you stop; you keep where people live and employment constant. By having the additional phase we can use this information and the information we develop in the PRISM (economic) model to think about how land use might change to a degree. Heidi Daly: Do you take current zoning into account, such as South Sanford being very heavily zoned for industrial use? Access for trucks in that area would complement that zoning. Steve Rolle: Yes, zoning is considered in the baseline allocation of employment. So, South Sanford is one place where forecasted changes in industrial employment, jobs, would be placed. But recall that we are forecasting very little growth in manufacturing through 2035. We have recognized that some of these strategies DO and some DO NOT provide very good truck access to South Sanford, which is where a lot of that type of traffic is generated, so that is a point well taken. Steve Rolle presents a slide with a map showing 2035 Modeled Change in Daily Traffic: Strategy K2 This slide shows a map of the difference plot for Strategy K2, which is an upgrade of Route 109. This strategy attracts an additional 5,000 trips on Route 109 from the 2035 baseline. We see higher increases near the Southern Sanford section as well. Steve Rolle presents a slide with a map showing 2035 Modeled Change in Daily Traffic: Strategy K3 This slide shows a map of the difference plot for Strategy K3, which is a limited access expressway from Kennebunk to Sanford. This corridor was forecast to attract a lot of use, with about 32,000 vehicles a day. There is a small increase on either side of the turnpike as well which indicates that this strategy is being utilized by travelers heading to points both north and south of the Study Area. Hazen Carpenter: I have trouble seeing where you are going to put thirty-‐three thousand vehicles on this new highway, and I see that we have some reduction on Route 109, but where are the rest of these travelers going? Steve Rolle: This is the tricky thing when looking at difference plots, which show the change in traffic volume rather than total volume. In this case, the change in traffic on

14
the new roads is also the total volume on those roads, whereas the change on existing roads is showing only the increase in volume on those roadways. We will put together a second map with total traffic, which hopefully will help illustrate the traffic patterns more fully. Dianne Robbins: On many of the roads I see reductions, are they all shifting to the new expressway? Steve Rolle: Yes, that is part of what is happening. People are shifting their paths throughout the network. Again, this is a difference plot that shows the changes in volume and it’s safe to assume that much of the traffic has shifted to the new expressway. But, those shifts create opportunities for other corridors to attract users from other surrounding local roads as well, so not all of the traffic is shifting directly from each local road to the new expressway. Gerry Audibert: The total number of trips in the network is the same as the 2035 baseline condition but they have shifted their routes. The PRISM model will look at the economic impacts of the strategies and find where new jobs and homes will be. This exercise assumes no changes from our 2035 population and employment projections. In Phase III we will get into a lot more detail and these numbers will likely change. Steve Rolle: I did want to note that one interesting point about this strategy is how broadly it affects the entire network. Having an expressway in the middle of the Study Area clearly affects local roads throughout the area as we see decreases on local roads at the northern and southern ends of the Study Area. Steve Rolle presents a slide with a map showing 2035 Modeled Change in Daily Traffic: Strategy NB1 This slide shows a map of the difference plot for Strategy NB1, which is an upgrade of Route 4 with a bypass of North Berwick. This strategy attracts about 5,000 additional trips to Route 4. Most of the other increases that we see with this strategy seem to be local trips rather than regional trips. Around 17,000 people used the bypass around Berwick but that only decreased the traffic traveling through Berwick by about 4,000, so it’s not a one-‐to-‐one swap for trips. That indicates that there are some local trips using the bypass, and perhaps some other trips shifting over to the old Route 4 through town.. Steve Rolle presents a slide with a map showing 2035 Modeled Change in Daily Traffic: Strategy NB2 This slide shows a map of the difference plot for Strategy NB1, which is a new at grade highway from Ogunquit. This is a new direct highway connection that attracts 20,000-‐23,000 vehicles a day, and decreases traffic along some of the parallel routes. The most
15
interesting aspect of this strategy is the connection in Ogunquit to Route 1 where the model forecasts 33,000 daily trips on the segment between the turnpike and Route 1. That in turn decreases traffic on some other sections of Route 1 – especially to the north, but that is a considerable amount of traffic concentrated in that location. Carol Morris: It may be safe to say that there are a lot of businesses along Route 1 that would not perceive that as a benefit. Jim Nimon: These numbers are both directions correct? It could be half one-‐way and half the other. Steve Rolle: Yes it is a combination of both directions. Carol Morris: Do you know if there are any huge anomalies? Steve Rolle: Since it is a daily model it will be pretty close to 50/50. There were a couple of locations where there were some directional differences and we will continue to explore that. Kevin Hooper: What we had to do here with the strategies with interchanges at the Turnpike in Ogunquit, was make some adjustments and add tolls to areas so we were not attracting people who were using these interchanges simply to avoid paying the toll at the York Plaza. This affected the outcome of the model. Steve Rolle presents a slide with a map showing 2035 Modeled Change in Daily Traffic: Strategy NB3 Here is a map of the difference plot for Strategy NB1, which is the expressway option from Sanford to the turnpike with a connection at Route 9 and Route 4. This option provides very good access to the industrial and airport area of Sanford and gets a lot of use attracting around 28,000 vehicles in the South Sanford area, and about 15,000 north of that connection. That is an indicator of the utility in providing access to that area in Sanford, as some had suggested earlier. We see a drop in the parallel roads in the area as well. This strategy also resulted in a small increase in traffic on Route 4 up into Waterboro. Steve Rolle presents a slide showing Screenline Comparisons for North-‐South Traffic (South of Sanford) with the following bar graph:

16
Again, the screenline comparisons capture all of the roads that pass across an imaginary line so we can capture the total traffic volume between specific travel markets. In this case we are looking at the north-‐south market; Sanford/Alfred to Kennebunk/Wells/Ogunquit and points south (e.g. -‐ New Hampshire via Route 4 or the Maine Turnpike). All of the strategies are again listed across the bottom, with the height of the bars corresponding to daily traffic. The blue in this case is traffic on Route 4, the purple is the traffic on Route 109, the red represents traffic volume on the expressway options and the green is all other local roads. Strategies that increase capacity on Route 4 result in some increase in traffic along that route, and as expected, the expressway options generate the most total usage. Carol Morris: Do you want to talk about why all of the strategies that have new expressways increase total traffic volume for the study area? Steve Rolle: The new expressways create new paths that do not exist today. If there is an option that is shorter and quicker, it will attract more trips, more people. Uri Avin: Some of the volume could be new traffic coming from outside of the county correct? Steve Rolle: At this stage, we hold the number of trips generated outside of the county constant, but the model can account for how those trips change routes. Gerry Audibert: Are there minor changes to Turnpike traffic? Steve Rolle: NB3 is the one that has the greatest change in Turnpike volume. We will want to look at the segments of the ramps and get a better understanding of the fluctuations in volumes. There was a 2,700 vehicle decrease in the southbound direction. There are other segments that increase by a similar number.

17
Kevin Hooper: South of Kennebunk at the York Plaza it is hardly different at all, so this is just traffic getting to the Turnpike more directly. Carol Morris: By the way, what you are seeing here is a weekday during the summer, so keep that in mind. Steve Rolle: So now we are going to segue into the other traffic MOEs we are going to talk about today, which are travel time and delay. I’ll start with a quick note about ALL travel occurring in York County. Earlier we pointed out that the total number of miles traveled increased for all the strategies tested (though modestly). The total amount of time traveled decreases for all strategies, which indicates that the overall speed of the network has increased. Again, these decreases are very small when considering every trip occurring within the County, but more pronounced changes can been see by looking at travel times between specific destinations. Let’s start by looking at travel times for trips from Sanford to various specific destinations:
1. Sanford – The Maine Turnpike (north of Biddeford) 2. Sanford – Wells 3. Sanford – The Maine Turnpike (NH-‐ME Border) 4. Sanford – Dover, NH
Steve Rolle presents a slide showing the following bar graph representing travel times for Trip 1: Sanford – The Maine Turnpike (north of Biddeford)
So at the top is the existing travel time represented in black, the 2035 baseline is in gray, the Biddeford corridor strategies are shown in red, the Kennebunk corridor strategies in dark blue and the North Berwick corridor strategies are represented in teal. As you

18
would expect, the travel times for this trip decrease under any of the four Biddeford corridor strategies, with Strategy B5 having the shortest travel time of all of the strategies. In the 2035 baseline scenario, the estimated typical travel time for this trip would be 33 minutes and under the B5 strategy that gets reduced to 24 minutes; so a time savings of 9 minutes, so that’s a fairly substantial decrease. Chris MacClinchy: The starting point in Sanford is where? Steve Rolle: Right in the center of the downtown, near the Route 109/Route 202 intersection I believe. Steve Rolle presents a slide showing the following bar graph representing travel times for Trip 2: Sanford – Wells:
For the Sanford to Wells trip, the interesting things to note are that the two Kennebunk/Wells corridor improvements (dark blue) that we looked at did not reduce travel times. The upgrade to Route 109 attracted additional trips and did not improve speeds appreciably, and congestion from the additional traffic likely offsets what speed improvements were made. The Kennebunk expressway was very effective in getting to the Turnpike and Kennebunk, but not so much between Sanford and Wells, as travel times on Route 109 did not improve. The North Berwick improvements however did decrease travel times to Wells because so much traffic shifted down from Route 109 onto either Route 4 or the new corridors proposed under the North Berwick strategies. Steve Rolle presents a slide showing the following bar graph representing travel times for Trip 3: Sanford to the Maine Turnpike (ME-‐NH Border):

19
For the Sanford to the New Hampshire border trip via the Maine Turnpike, there was no change in travel time shown for any strategy except for the North Berwick expressway, which did result in a decreased travel time of 47 minutes from the 2035 baseline of 54 minutes. Steve Rolle presents a slide showing the following bar graph representing travel times for Trip 4: Sanford – Dover:
For the Sanford to Dover trip there was not much change in travel times for any of the strategies. Carol Morris: What is your assessment of these changes in travel times? Steve Rolle: A lot of it is open to interpretation. Certainly the improvements where you are reducing 6-‐7 minutes from a 20+ minute trip is noteworthy. In general, we are not looking at improvements that are long enough in length to yield very large decreases in travel times.
20
Uri Avin: The point is also that these are parts of longer trips that people are taking, so you are looking at a 7-‐10 minute savings on a trip such as Portland to Sanford, which is much longer than 40 minutes. Steve Rolle: The second set of trips that we looked at are regional through-‐trips. So these are trips starting somewhere outside of the Study Area and traveling through to another point beyond the opposite side of the Study Area. The two trips that we measured are:
1. Rochester, NH – The Maine Turnpike (north of Biddeford) 2. The Maine Turnpike (ME-‐NH Border) – The Maine Turnpike (north of Biddeford)
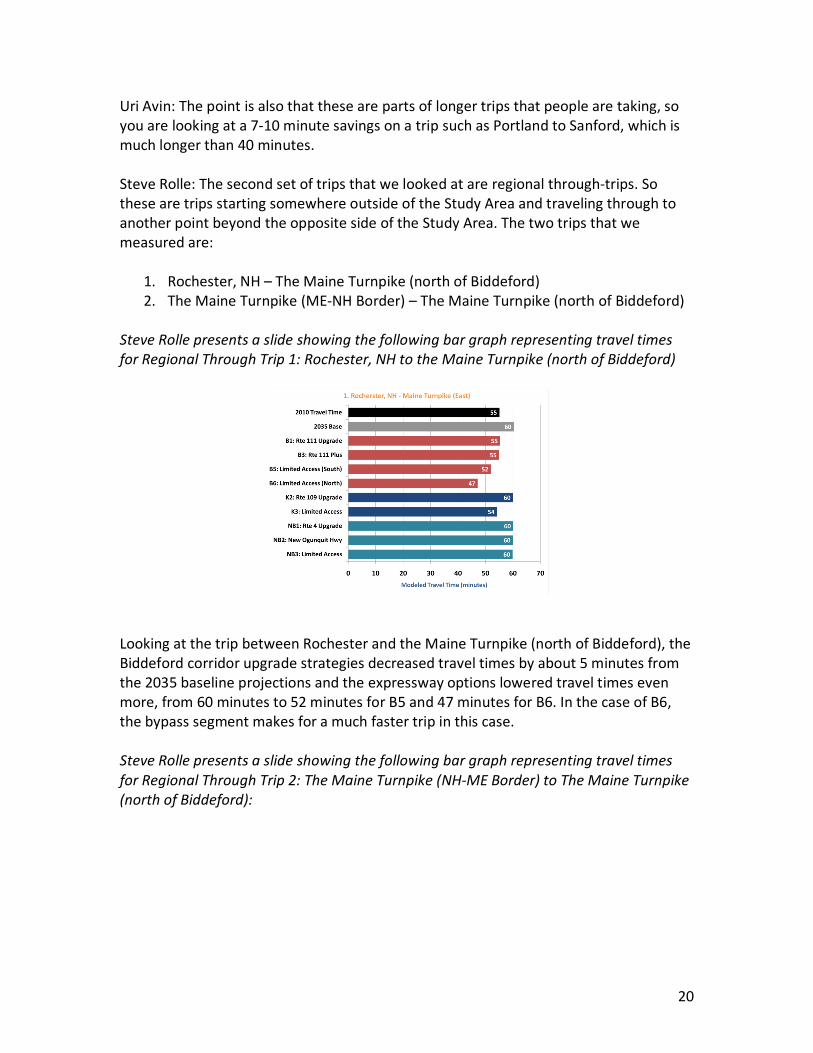
Steve Rolle presents a slide showing the following bar graph representing travel times for Regional Through Trip 1: Rochester, NH to the Maine Turnpike (north of Biddeford)
Looking at the trip between Rochester and the Maine Turnpike (north of Biddeford), the Biddeford corridor upgrade strategies decreased travel times by about 5 minutes from the 2035 baseline projections and the expressway options lowered travel times even more, from 60 minutes to 52 minutes for B5 and 47 minutes for B6. In the case of B6, the bypass segment makes for a much faster trip in this case. Steve Rolle presents a slide showing the following bar graph representing travel times for Regional Through Trip 2: The Maine Turnpike (NH-‐ME Border) to The Maine Turnpike (north of Biddeford):

21
Looking at the regional through-‐trip along I-‐95 from the New Hampshire border to north of Biddeford, the travel times essentially stayed the same, which is what we expected to see. Finally, we looked at three other trips to understand the effect of adding access to the turnpike at Ogunquit. We measured the VHT of the following three trips:
1. Ogunquit to the Maine Turnpike (north of Biddeford) 2. Ogunquit to the Maine Turnpike (NH-‐ME Border) 3. Ogunquit – Sanford
Steve Rolle presents a slide showing the following bar graph representing travel times from the Ogunquit Interchange: Trip 1: Ogunquit to the Maine Turnpike (north of Biddeford):
For the trip from Ogunquit to north of Biddeford on the Maine Turnpike, for the two options that add an interchange in Ogunquit, the estimated travel time is reduced to 18 minutes for Strategy NB2 and to 19 minutes for Strategy NB3. This reflects the ability to directly access the turnpike, rather than traveling on Route 1 to the next interchange.

22
Steve Rolle presents a slide showing the following bar graph representing travel times from the Ogunquit Interchange: Trip 1: Ogunquit to the Maine Turnpike (ME-‐NH Border):
Under the 2035 Baseline projections the trip from Ogunquit to the New Hampshire border on I-‐95 is about 40 minutes. When the interchange is added that drops to 28 minutes, which is a substantial decrease (down 12 minutes). Steve Rolle presents a slide showing the following bar graph representing travel times from the Ogunquit Interchange: Trip 1: Ogunquit to the Sanford:
The trip from Ogunquit to Sanford, which is a difficult trip to make today given the existing road network and lack of direct routes between the two towns, goes from a 43 minute trip under the 2035 baseline projections to a 31 minute trip under Strategy NB2 and 25 minutes under Strategy NB3. Hazen Carpenter: That is a substantial drop from Ogunquit to Sanford, is the baseline projection just to the Turnpike, or does it follow alternate routes to the same point?

23
Steve Rolle: It’s the same points, but the model chooses the fastest route. Chris MacClinchy: The Ogunquit trip north seems to be understated. During the summer peak time it is going to take more than 25 minutes to get from Ogunquit to the Turnpike entrance, let alone north of Biddeford. Steve Rolle: I think that is an accurate statement; one of the things that the regional travel models have a hard time replicating is the effect of heavily congested locations. We would have to look at that more closely if we move forward with any of these. The general message is that there is a notable drop in travel time for Ogunquit trips that access the Turnpike given the direct access. Uri Avin: So I am going to segue into the next set of MOEs that we are going to look at today that are not traffic related. First I wanted to share some of the overall findings from the traffic analysis:
• Total Vehicle Miles Traveled (VMT) for all of York County increases by 29% in 2035
• The various strategies increase VMT by as much as another 1.4% County-‐wide, but some specific corridors see traffic volumes increase by up to 25%
• Total Vehicle Hours Traveled (VHT) increases for by 37% in York County in 2035. • The various strategies decrease VHT by 1.9% County-‐wide at most, but some
corridors see markedly reduced travel times (to 50%). Uri Avin presents a slide showing a map of Rural Land Conflicts within the Study Area Now we are going to talk about two MOEs that have nothing to do with travel. The first is Urban and Rural Character. This is a very important MOE that many of the Steering and Advisory Committee members are very concerned about. We want to have a way to measure the impacts to Urban and Rural Character and the quality of the environment and landscape. It is important to remember that these alignments are completely speculative at this point but we want to have a way of understanding the rural land that could potentially be impacted by them, even at the conceptual level. The way that we will attempt to measure this MOE is by assessing the potential to adversely affect rural and urban character by examining the following components:
• Corridor width • Open fields and woodlands zoned for low density • Town centers, historic sites and historic districts
The assumption that we have made for the new roadways are quite wide as we have no idea exactly where they would potentially go. So in order to have an understanding of the potential inventory of impacts for these we looked at a width of a half a mile on either side of the center line, so a complete mile in width. For the existing roads we assumed 75-‐foot potential widths to examine on either side of the centerline. For the

24
new roads that are not expressways or highways, such as the Southern Sanford bypass, we assumed a width of 1,000 feet. Carol Morris: And this is for planning purposes. We would never use that much width. Uri Avin: Correct, this is for planning purposes so we can attempt to get a handle on what the potential rural impacts could be. Steve Rolle: We have to look at a very wide swath of land in order to understand what the potential impacts might be because we do not know specifically where the new facilities would be. The roadways themselves would not be nearly as wide as the “corridor” we’re considering to gauge potential for impacts. Uri Avin: So in this map of Rural Land Conflicts, the gray areas are the areas that are being counted. We are adding up to get a total to see what the potential effect on rural character could be. Diane Robbins: So you are only looking at the gray areas? Uri: Yes, those are areas that are not zoned for intense development, or intensely developed currently. Diane Robbins: I am questioning the Route 111 section. Uri Avin: On Route 111 itself, portions of that area are zoned for commercial. Diane Robbins: From the Lyman line to past Limerick Road in Arundel is all rural conservation. Uri Avin: We looked at the town zoning; if we missed something let us know so we can make sure to adjust our maps. Uri Avin presents a slide showing the following table of Rural Acreage Potentially Affected:

25
In this table we have the results of the acreage that we counted. This is the overall corridor acreage that is within the swaths that we allocated for each strategy. On the right we have tallied the number of acres that are low density and not designated for development. There is a big range, for example of the 13,000 acres for strategy B6, 9,200 acres fall within the rural character. That is a large percentage. As you would expect, the strategies that go through new undeveloped areas have the most potential impacts on rural character. We have a map that will summarize this information and rank the corridors based on which strategies are most impactful to rural character. Steve Rolle: Of the expressway corridors, Strategy K3 is much lower than the other options in terms of rural acreage affected, it is less than half as compared to the others. Uri Avin: It goes through some very sensitive environmental areas, so it becomes a balancing act. Donna DerKinderen: The rural areas are based off of zoning maps and comprehensive plans? Uri Avin: Yes Donna DerKinderen: I have a problem with the Lyman designation, even though it is designated as rural. In terms of Lyman’s current use, it is decidedly rural. If I lived in Lyman and owned property on Route 111, while it is zoned commercial, I would take great issue with not being included in the rural acreage affected column. Uri Avin: Yes I can understand that, but in 25 years time, if it is zoned commercial and the area experiences growth, that area might change. That land is zoned as commercial so it is not protected in the way that other rural land is protected, in areas in Arundel for example. Donna DerKinderen: The town may not protect it, but it is protected by the landowner.

26
Uri Avin: Right, but in 25 years that land may change hands. Donna DerKinderen: Arundel has Biddeford on one side, and what they decide to do will affect Arundel. Sanford, throughout this process wants economic development in its future. And depending on what happens with Route 111, that is going to affect Arundel, and Arundel is not going to benefit by any of these things, in fact we will be negatively impacted. That poses a problem for our town. It is unreasonable to expect the rural communities to bear the negative impacts of things that will positively impact other towns. Arundel will not be happy with some of these approaches, and we are feeling like a target even though I understand we are a ways from the final recommendations. Uri Avin: I understand the bigger problem. For the purpose of our analysis, the towns that have chosen to designate areas for more dense development over 25 years, we have to assume those are areas that are not protected. Future landowners may choose to develop that land. Donna DerKinderen: I am talking about protecting the assets that we have and the northwest part of town is the highly valued rural and historic area. Uri Avin: Yes, and there is no question that Strategy B5 would majorly impact the character of that area. Donna DerKinderen: Taking Route 111 and making it 4 lanes would be dangerous to our character as well. Carol Morris: Let’s take a step back; the reason we are here, and you are here, is to make sure that these discussions can take place. We know that we have extraordinarily different towns within this process with different goals; this is something that we have to work through. That is what regional planning gives us the opportunity to do. Uri Avin: When all of the MOEs have been measured, we will have to take a step back and look at the entire picture and weigh the impacts to the transportation system against other impacts. We will have to start valuing and weighting what is most important to their communities. We are just measuring impacts right now. Gerry Audibert: As Carol said, this also allows the communities to start talking to each other about disjointed land use. Maybe the communities along Route 111 agree that they don’t want to widen it and they all agree. As things start fleshing out, we will understand the impacts and in the end we may need to make changes. Uri Avin: Even if the land use isn’t changed, managing access management at the local level can make a major difference on the impacts.

27
Heidi Daly: If there is a piece of land that is a commercial zone but it is in a conservation easement, you cannot widen the road correct? Uri Avin: It depends on what the right of way is. In the next phase we need to know those specifics and whether there are properties that are under easements. Heidi Daly: I think there is one farm that is under easement. Leo Ruel: Lyman has a residential commercial zone, not a commercial zone. Uri Avin: Yes, and because it allows for more commercial, we assume that development could be more intense than outside that district. Diane Robbins: When you talk about commercial use in the Arundel or Lyman area it is not the same as commercial use on Route 1. There is no sewer, water or three phase power on the Route 111 corridor. When you look at the commercial use in Lyman, you are not talking about retail stores; you are talking about tractor stores and turf farms. When you talk about Route 111, all fields today are taken care of and are in agricultural use. We have to look at how we are going to maintain those fields and have the tractors going across the road. We have been so careful to protect this to make sure they are not impacting what happens on that road. You will get a lot of kickback if you take a half a mile swath of land. Carol Morris: We are using that half mile measure as a planning tool to inventory what the potential impacts will be for the purpose of comparing the strategies. There would never be that wide of an impact. Donna DerKinderen: I understand those numbers, but that could be confusing. Realistically from the centerline to the edge what would the distance be? Gerry Audibert: The right of way width would be 250 feet to 300 feet maximum. MaineDOT would own that land. That doesn’t mean you can’t continue to have a farm there, as there are limited access and access management techniques that we can utilize to protect local interests. Uri Avin: I will bring these issues to the Steering Committee to see what they think about this issue. Given that we don’t know where the alignments are, how do you understand the impact? This is our best effort to start to understand what the potential impacts could be. Steve Rolle: It is fair to say that the rural and urban character impact measure is the one that we have had the most difficulty wrestling with, because the strategy development is still at a conceptual, non-‐specific level.

28
Donna DerKinderen: Another piece of this is that as you increase the width of the highway, you are impacting or destroying homes along Route 111 because they are so close to the road. Uri Avin: In the next phase we will look at those impacts in greater detail. Heidi Daly: So you could seize that land though eminent domain? Gerry Audibert: If that was what was recommended to move forward, yes we could, if it is within the existing state right of way. Uri Avin presents a slide showing a map of Proximity to Town Centers and Historic Sites Uri Avin: We are also looking at measuring impacts to urban character as well. In this map you can see the designated historic sites. We have measured them and counted them. The final MOE that we will look at today is Environmental Constraints. We will measure this by assessing the impacts to wetlands and other natural features. The components that we will analyze are:
• Wetlands • Other regulated natural resources • Linear feet of alignment
We did an inventory of these resources in Phase I. What we did here is we took the actual centerline of these roads and measured how much of these resources we crossed. Uri Avin presents a slide showing a map of Environmental Constraints This is what the map looks like. In the background you can see distribution of environmental resources. If you look at the alignments of the strategies, the darker colors represent more environmental conflicts. Uri Avin presents a slide showing the following table of Wetlands and Regulated Natural Features:

29
This table shows each strategy’s impacts to natural resources and wetlands in miles. This gives you an idea of how each strategy compares based on environmental impacts to wetlands and regulated natural resources with a total on the right. This is the bottom line for this phase of the study. At the next meeting we will bring more economic data and hopefully be able to remove some of the strategies from the table. Leo Ruel: On Route 111, what does MaineDOT own? Gerry Audibert: I will get the specific numbers. This is still very broad at this point; we are just putting things into perspective. We are looking for ways to eliminating strategies that will not be sustainable or fundable and then we will do more detailed analysis. If the recommendation were for a new road there would be another study, which would be a NEPA study. We are a long way from that point though. Carol Morris: We still don’t have all of the analysis needed to make an educated decision. Any time you make a change there are impacts and this process is about weighting the benefits and the pros and the cons. Diane Robbins: For the next meeting, it would be good to know the right of way on Route 111 as it currently is. As we look into B5 and B6, I will want to know how the properties will be impacted. Carol Morris: We will do the best that we can, but this is a high-‐level study and we will be making recommendations that are very high level rather than having specific alignments and understanding specific property impacts. A NEPA study is when you figure out how a road is aligned and I need to remind everyone that just because the traffic data for the new roads is compelling does not mean that is the final factor. We have not looked at costs, or specific environmental impacts so we have a long way to go.

30
Diane Robbins: I understand that, but we need to have all the information so I can bring this back to my constituents. I need to know that, so we don’t have an uproar from people in Arundel. Carol Morris: We will do the best that we can to provide you all the data we have. Gerry Audibert: The Gorham Study has wrapped up Phase I and we did not look at property impacts. We will do that in subsequent studies if it is decided that we will put a new road in. In the Wiscasset study, that is a NEPA study and we identified specific properties that would be impacted. For that study we have an alignment and this is a feasibility study, which is in the very early phases of the process. Heidi Daly: What phase will you look at bike-‐pedestrian considerations? Carol Morris: In Phase III we will look at that, starting this fall. Steve Rolle: We have started looking at the range of options that we want to look at in that phase. Carol Morris: The next steps are as follows:
• Finalize Phase II MOE Evaluation • Costs and Economic Evaluation • Finalize other Phase II Documentation • Begin to develop recommendations for Phase III of the study • Identify additional data needs and MOEs for Phase III • Next Meeting Dates
Gerry Audibert: If anyone has any questions please feel free to contact Carol Morris or me. The best thing to do with your concerns is to put that in writing and we will put it online so everyone can see the answer. Carol Morris: Thank you for coming today and we will see you next time. Meeting adjourned at 1:03 pm.