5g-miedge · francesca cuomo mattia merluzzi [email protected]...
TRANSCRIPT

Deliverable Horizon2020 EUJ-01-2016 723171 5G-MiEdge D2.4
Date : August 2018 Public Deliverable
5G-MiEdge Page 1
5G-MiEdge Millimeter-wave Edge Cloud as an Enabler for 5G Ecosystem
EU Contract No. EUJ-01-2016-723171
Contractual date: M26
Actual date: M26
Authors: See list
Work package: D2.4 Method of site specific deployment of mmWave edge cloud
Security: Public
Nature: Report
Version: 1.0
Number of pages: 57
Abstract
This deliverable reports second year results of WP2, specifically the methods of site specific
deployment, optimization and prototyping of mmWave edge cloud.
Keywords
millimeter-wave, millimeter-wave access, millimeter-wave backhaul, edge cloud, mobile edge computing,
site specific deployment, backhaul mesh node, backhaul mesh architecture, backhaul mesh prototype
All rights reserved.

2
5G-MiEdge Page 2
The document is proprietary of the 5G-MiEdge consortium members. No copy or distribution, in
any form or by any means, is allowed without the prior written agreement of the owner of the
property rights.
This document reflects only the authors’ view. The European Community is not liable for any use
hat may be made of the information contained herein.
Authors
Fraunhofer Heinrich
Hertz Institute
Thomas Haustein
Konstantin Koslowski
CEA-LETI Antonio De Domenico
Nicola di Pietro
Sapienza University of
Rome
Sergio Barbarossa
Stefania Sardellitti
Francesca Cuomo
Mattia Merluzzi
Tokyo Institute of
Technology
Kei Sakaguchi
Khan Tran Gia
Makoto Nakamura
Panasonic Koji Takinami
Tomoya Urushihara
Deliverable Horizon2020 EUJ-01-2016 723171 5G-MiEdge D2.4
Date : August 2018 Public Deliverable
5G-MiEdge Page 3
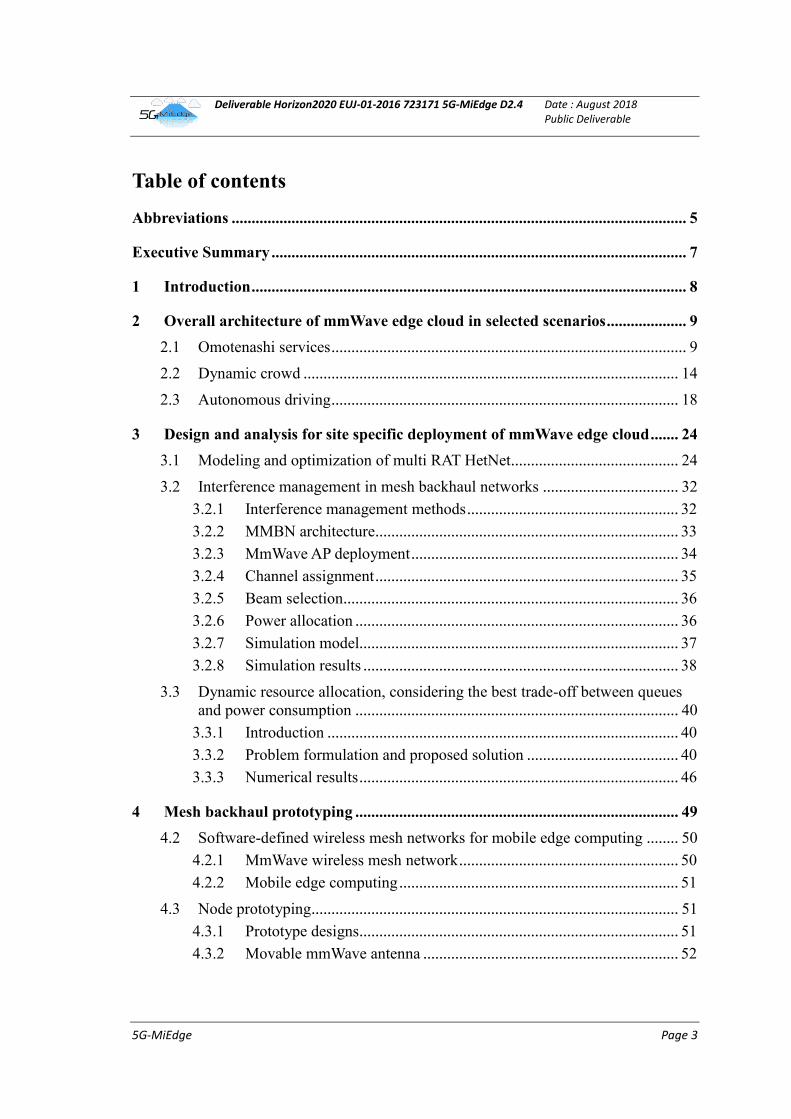
Table of contents
Abbreviations .................................................................................................................. 5
Executive Summary ........................................................................................................ 7
1 Introduction ............................................................................................................. 8
2 Overall architecture of mmWave edge cloud in selected scenarios .................... 9
2.1 Omotenashi services ......................................................................................... 9
2.2 Dynamic crowd .............................................................................................. 14
2.3 Autonomous driving ....................................................................................... 18
3 Design and analysis for site specific deployment of mmWave edge cloud ....... 24
3.1 Modeling and optimization of multi RAT HetNet.......................................... 24
3.2 Interference management in mesh backhaul networks .................................. 32
3.2.1 Interference management methods ..................................................... 32
3.2.2 MMBN architecture............................................................................ 33
3.2.3 MmWave AP deployment ................................................................... 34
3.2.4 Channel assignment ............................................................................ 35
3.2.5 Beam selection.................................................................................... 36
3.2.6 Power allocation ................................................................................. 36
3.2.7 Simulation model................................................................................ 37
3.2.8 Simulation results ............................................................................... 38
3.3 Dynamic resource allocation, considering the best trade-off between queues
and power consumption ................................................................................. 40
3.3.1 Introduction ........................................................................................ 40
3.3.2 Problem formulation and proposed solution ...................................... 40
3.3.3 Numerical results ................................................................................ 46
4 Mesh backhaul prototyping ................................................................................. 49
4.2 Software-defined wireless mesh networks for mobile edge computing ........ 50
4.2.1 MmWave wireless mesh network ....................................................... 50
4.2.2 Mobile edge computing ...................................................................... 51
4.3 Node prototyping ............................................................................................ 51
4.3.1 Prototype designs................................................................................ 51
4.3.2 Movable mmWave antenna ................................................................ 52

4
5G-MiEdge Page 4
4.3.3 Computation device ............................................................................ 52
4.3.4 Next steps ........................................................................................... 53
5 Summary (FHG, 1page) ....................................................................................... 54
6 References .............................................................................................................. 55

5
5G-MiEdge Page 5
Abbreviations
Acronym Description
AMF Access and Mobility management Function
AP Access Point
APC AP Controller
AS Application Server
BF Beam-Forming
BS Base Station
CAPEX Capital Expenditure
CDN Content Delivery Network
D2D Device-to-Device
EVM Error Vector Magnitude
HD High Definition
HetNet Heterogeneous Network
ISD Inter Site Distance
LiDAR Light Detection And Ranging
LoA Levels of Automation
LOS Line Of Sight
MEC Mobile edge cloud (computing)/ multi access edge computing
MEH Mobile Edge Host
mmWave Millimeter-wave
MBS Macro Base Station
MMBN Millimeter-wave Mesh Backhaul Network
MSF MEC Service Function
NLOS Non Line Of Sight
OBU On-Board Unit
OPEX Operating Expenditure
PPP Poisson Point Process
RAN Radio Access Network
RAT Radio Access Technology
RSSI Received Signal Strength Indicator
RSU Roadside Unit

6
5G-MiEdge Page 6
SBS Small cell Base Station
SDN Software Defined Network
SINR Signal to Interference plus Noise Ratio
SIR Signal to Interference Ratio
UE User Equipment/Entity
V2V Vehicle-to-Vehicle
V2X Vehicle-to-Everything
Deliverable Horizon2020 EUJ-01-2016 723171 5G-MiEdge D2.4
Date: August 2018
Public Deliverable
5G-MiEdge Page 7
Executive Summary
The EU-Japan funded research project 5G-MiEdge (Millimeter-wave Edge cloud as
an enabler for 5G ecosystem) envisions to design, develop and demonstrate an
innovative 5G architecture, which manages to smartly and smoothly combine
millimeter-wave (mmWave) access/backhauling with mobile edge cloud (computing)/
multi access edge computing (MEC). This deliverable belongs to WP2, which runs
from month 4 to 30 of the 36-month lifetime of the project.
WP2 is in charge of millimeter-wave edge cloud for 5G RAN deployment and works
in tight cooperation with WP1 and WP4. It builds upon architecture and scenarios from
WP1 and creates the foundation for WP4, focusing on the implementation of a proof-
of-concept testbed and system evaluation.
This deliverable begins with the deployment of mmWave edge cloud in specific
scenarios, including the deployment method of mmWave access points (APs) with
capabilities for caching/prefetching, computation and relaying. The following sections
present details on the optimization of deployed radio resources by using predicted
traffic load and adapting routes, channels and backhaul links.
The highlights of this deliverable are:
Overall architecture of mmWave edge cloud in selected scenarios in Section 2
Design and analysis for site specific deployment of mmWave edge cloud in
Section 3, split into:
o Modeling and optimization of multi radio access technology (RAT)
heterogeneous network (HetNet)
o Interference management in mesh backhaul networks
o Dynamic resource allocation, considering the best trade-off between
queues and power consumption
Mesh backhaul prototyping in Section 4

Deliverable Horizon2020 EUJ-01-2016 723171 5G-MiEdge D2.4
Date: August 2018
Public Deliverable
5G-MiEdge Page 8
1 Introduction
The EU-Japan funded research project 5G-MiEdge (Millimeter-wave Edge cloud as
an enabler for 5G ecosystem) envisions to design, develop and demonstrate an
innovative 5G architecture, which manages to smartly and smoothly combine
mmWave access/backhauling with MEC. This joint work focuses on mmWave edge
cloud, the architecture in selected scenarios, site-specific deployment and prototyping
of mesh backhaul nodes.
This deliverable is part of WP2, which runs from month 4 to 30 of the 36-month
lifetime of the project and is in charge of mmWave edge cloud for 5G radio access
network (RAN) deployments. The focus of the work is on site specific methods for
deployment of mmWave edge cloud.
This deliverable is split in five sections.
The first section is this introduction, followed by the overall architecture of mmWave
edge cloud in selected scenarios.
The second section gives an overview on three selected scenarios:
Omotenashi services
Dynamic crowd
Autonomous driving
Including the specific constraints for each scenario, that need to be carefully
considered in the deployment of the mmWave edge cloud network.
In the third section, the design and analysis for site specific deployment of mmWave
edge cloud are presented. This section is split into three parts, each focusing on an
important aspect of the site specific deployment. Section 3.1 shows modelling and
optimization of multi RAT heterogeneous networks, Section 3.2 focuses on
interference management in mesh backhaul networks, and Section 3.3 explains
dynamic resource allocation when considering the best trade-off between queues and
power consumption.
The fourth section details on prototyping of mesh backhaul nodes, considering the
previously explained constraints for the scenarios, running evaluations on the testbed
and working towards the final goal of this project: Verifying the developed ideas and
concepts in extensive field trials.
Finally, the deliverable is concluded with a summary of achievements and outlook for
future work in Section 5.

Deliverable Horizon2020 EUJ-01-2016 723171 5G-MiEdge D2.4
Date: August 2018
Public Deliverable
5G-MiEdge Page 9
2 Overall architecture of mmWave edge cloud in selected
scenarios
This section explains the system architecture, requirements and specific deployment
constraints of mmWave edge cloud networks for three carefully selected scenarios.
2.1 Omotenashi services
Figure 2.1-1 shows the system architecture of Omotenashi services. As reported in
D1.3, it consists of the non-3GPP MiEdge RAN (Wi-Fi) and the 3GPP network. User
Equipment (UE) are assumed to connect to the non-3GPP network, e.g. in the airport
facility scenario.
Before arrival at the airport, MEC service function (MSF) collects the user context
information (user location, user profile, subscriptions, etc.), as well as other context
such as content popularity, cached contents, etc. Based on these contexts, the content
and application data are pre-fetched from the application server (AS) to the mobile
edge host (MEH), which is located at the central management center.
Figure 2.1-1 is based on a private service scenario where the private operator owns the
non-3GPP network. The local MSF (L-MSF) takes over the role of MSF of the 3GPP
network to provide locally optimized services. The context information, which are
required to run the specific services, will be transferred from MSF to L-MSF.
L-MSF predicts mobility pattern at the airport, and relocates cashed
contents/application state among multiple MEHs for optimum use of distributed MEH
resources. For example, at the airport the user mobility is well predictable from the
entrance to the departure gate. In addition, the departure gate area is heavily crowded
only when the boarding time is approaching. Therefore, there will be available
resources in MEHs, which are located in less crowded area. L-MSF performs
optimization and resource allocations among MEHs via the Mp3 interface control
signaling.
Figure 2.1-1 System Architecture of Omotenashi service [D1.3]
ASDN
Central Management Center
WiGig Signage
MEH
AP
MEH
N6
UE
AP
MEH
mmWave link
Mp3
MSF
AMF
SMF
NEFNO1
NO2
NO3
3GPP
NL4
GW
NL2
UPF
MEHN1
NL2
L-MSF
M iEd g e RAN ( n on -3 GPP)

Deliverable Horizon2020 EUJ-01-2016 723171 5G-MiEdge D2.4
Date: August 2018
Public Deliverable
5G-MiEdge Page 10
In order to realize multi-Gbps throughput in densely populated area, content delivery
network and RAT must be integrated. In the following, key enablers for Omotenashi
services are described.
Edge cloud contents delivery network
Figure 2.1-2 shows the high-level architecture of the overall network that is taken into
consideration. The WiGig equipped digital signage (WiGig signage) employs 60 GHz
mmWave wireless connection based on WiGig/IEEE 802.11ad standard, which
provides multi-Gbps content delivery for user terminals. To avoid backhaul congestion
from the cloud to WiGig signages, the edge cloud content delivery network (edge cloud
CDN) is introduced. The edge cloud consists of local storages and WiGig signages,
which are located at the edge of the network. The content and application data are pre-
fetched to the local storages based on the user context information. Most of the pre-
fetching process can be done during low traffic periods, such as overnight.
Multi-user gigabit access
Assuming that multiple users download contents simultaneously, the content delivery
system could suffer from throughput degradation due to congestion at the WiGig
signage. To avoid this, the WiGig signage is equipped with multiple WiGig modules,
as illustrated in Figure 2.1-3. Each WiGig module adopts beam-forming (BF)
technology, which steers the antenna beam by using the phased array antenna. This
mitigates interference among WiGig links, thus enabling multi-Gbps throughput in the
multi-user environment.
W iGig
Ed g e Clo u d
Con ten ts D istr ib u tio n
Ba ck h a u lN etw o rk
W iGigSig n a g e
Loca l Sto ra g e
Figure 2.1-2 Edge cloud content delivery
network

Deliverable Horizon2020 EUJ-01-2016 723171 5G-MiEdge D2.4
Date: August 2018
Public Deliverable
5G-MiEdge Page 11
Figure 2.1-3 Multi-user Gigabit/s access technology
WiGig/Wi-Fi HetNet
Due to large path loss, the communication distance of WiGig is typically limited up to
about 10 m. To extend the area coverage, the WiGig/Wi-Fi heterogeneous network
(HetNet) is employed. Figure 2.1-4 shows the concept of WiGig/Wi-Fi HetNet where
authentication, connection management as well as browsing the content list are
executed via Wi-Fi, so to achieve a wider coverage. The WiGig connection is available
within the WiGig area for users to download the contents to their terminals with multi-
Gbps throughput.
Figure 2.1-4 WiGig/Wi-Fi HetNet
Figure 2.1-5 illustrates a block diagram of the WiGig signage. It consists of WiGig
modules, a Wi-Fi AP, a local storage and an AP controller (APC). The APC manages
the WiGig connections. While the user terminal is connected to Wi-Fi, the APC
periodically collects expected link quality via Wi-Fi for connection management
[Figure 2.1-5 (1)]. When the user terminal requests WiGig connection, the APC
connects the terminal to one of the WiGig modules, which provides the best link
quality [Figure 2.1-5 (2)]. When the user requests the content download from the
application, the user terminal starts downloading from the local storage via WiGig
[Figure 2.1-5 (3)].
W iGig
… W iGigM od u le
W iGig Area
Con n ect &Dow n loa d
W i-Fi
W iGig

Deliverable Horizon2020 EUJ-01-2016 723171 5G-MiEdge D2.4
Date: August 2018
Public Deliverable
5G-MiEdge Page 12
Application-centric WiGig/Wi-Fi cooperative connection management
In WiGig/Wi-Fi HetNet, the WiGig connection procedure directly affects user
experience. For example, if the user’s download request triggers WiGig connection
establishment, it introduces additional latency due to the connection establishment
procedure. To minimize the latency, an application-centric connection management
scheme is newly proposed [MTN17].
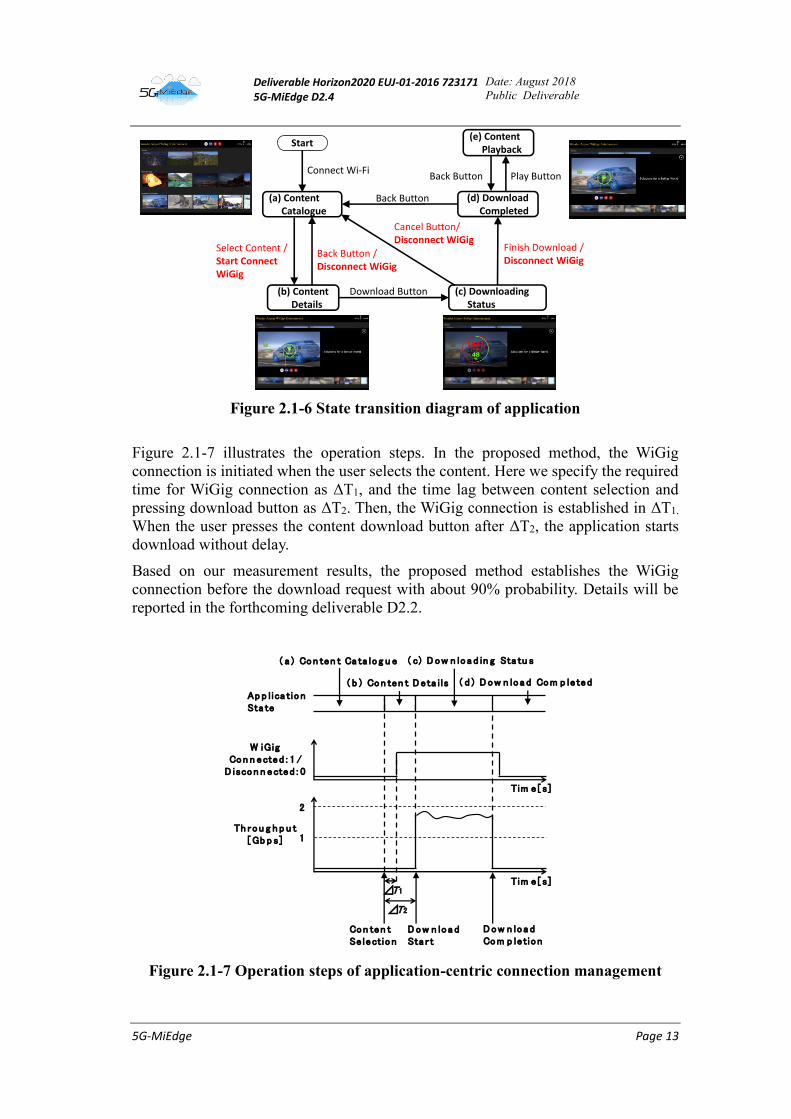
Figure 2.1-6 shows a state transition diagram of the download application on the user
terminal, which consists of (a) content catalogue, (b) content details, (c) downloading
status, (d) download completed and (e) content playback.
When the user launches the application, the user terminal connects to the WiGig
signage via Wi-Fi, and the (a) content catalogue, which consists of preview thumbnails,
is displayed. When the user selects one of the available contents, the application
transits to display (b) content details. At the same time, the user terminal starts
connecting to the WiGig module in the WiGig signage. If the user presses the
download button, the application displays the (c) downloading status, and content
downloading begins. When downloading has finished, the application transits to show
(d) download completed, and the WiGig link is automatically disconnected. The user
may then proceed to view the content in (e) content playback.
I n sid e o f th e W iGig Sig n a g e
W iGigM od u le
W i-FiAP …
APC
Sto ra g e
( 1 )( 2 )
( 3 )
( 1 )
Figure 2.1-5 Block diagram of WiGig signage
Deliverable Horizon2020 EUJ-01-2016 723171 5G-MiEdge D2.4
Date: August 2018
Public Deliverable
5G-MiEdge Page 13
Figure 2.1-6 State transition diagram of application
Figure 2.1-7 illustrates the operation steps. In the proposed method, the WiGig
connection is initiated when the user selects the content. Here we specify the required
time for WiGig connection as ΔT1, and the time lag between content selection and
pressing download button as ΔT2. Then, the WiGig connection is established in ΔT1.
When the user presses the content download button after ΔT2, the application starts
download without delay.
Based on our measurement results, the proposed method establishes the WiGig
connection before the download request with about 90% probability. Details will be
reported in the forthcoming deliverable D2.2.
Figure 2.1-7 Operation steps of application-centric connection management
(a) ContentCatalogue
(b) ContentDetails
(c) DownloadingStatus
(d) DownloadCompleted
Start
Connect Wi-Fi
Select Content /Start Connect WiGig
Back Button /Disconnect WiGig
Download Button
Finish Download /Disconnect WiGig
Cancel Button/Disconnect WiGig
Back Button
Play Button
(e) ContentPlayback
Back Button
Dow n loa dSta r t
Tim e[ s]
Th rou g h p u t[ Gb p s]
Con ten tSe lectio n
W iGigCon n ected : 1 /
D iscon n ected : 0
( a ) Con ten t Ca ta lo g u e
( b ) Con ten t Deta i ls
( c) Dow n lo a d in g Sta tu s
( d ) Dow n loa d Com p leted
⊿T1
⊿T2
Ap p l ica tio nSta te
Dow n lo a dCom p letio n
2
1
Tim e[ s]

Deliverable Horizon2020 EUJ-01-2016 723171 5G-MiEdge D2.4
Date: August 2018
Public Deliverable
5G-MiEdge Page 14
2.2 Dynamic crowd
This use case focuses on a medium outdoor area located in the metropolitan city center
where thousands of people may spend part of their daily life. The area is characterized
by several possible outdoor hotspots like bus stops, stations and recreation parks. Users
at such outdoor hotspots might download large volume contents, such as tourist and
shopping information, high definition 3D live broadcast of a game happening at a
stadium nearby, or upload and share through social networking sites (SNS) photos and
videos recently taken nearby. They can also download multi-language information, 3D
indoor maps, shopping promotion video clips, 4K/8K live videos etc. for better
shopping experience at the next destination nearby e.g. shopping departments around
the Shibuya station.
Figure 2.2-1 Dynamic crowd use case
The significant difference of these use case against the other ones is that the traffic
pattern changes dynamically throughout a day, in accordance to users’ activities, e.g.
changing from light to very busy traffic in specific hours of a day. In such a dynamic
environment, network densification with many number of mmWave APs overlaid on
the current LTE cells is effective to accommodate traffic in peak hours.
However, the huge number of the needed APs in this use case leads to the problem of
high capital expenditure (CAPEX) and operating expense (OPEX). One solution to
relax the problem is to use mmWave meshed network for the backhaul network of APs,
as depicted in Figure 2.2-1. By using the mmWave meshed network, the CAPEX can
be reduced by removing deployment cost of wired backhaul. Furthermore, the OPEX
can also be reduced by introducing dynamic ON/OFF and flexible path creation in the
backhaul network in accordance with the time variant and spatially non-uniform traffic
distributions. Such flexible control of the backhaul network is enabled by Software
Defined Network (SDN) technology using out-band control interface over the LTE.
Figure 2.2-2 shows the 5G-MiEdge architecture for the outdoor dynamic crowd where
the wireless backhaul meshed networks are compliant to the 3GPP architecture. The
3GPP network provides both control plane and data plane for both UE and mesh
wireless backhaul. About mesh wireless backhaul, since mesh relay is yet to be

Deliverable Horizon2020 EUJ-01-2016 723171 5G-MiEdge D2.4
Date: August 2018
Public Deliverable
5G-MiEdge Page 15
discussed in 3GPP for backhaul link, donor may be an anchor point of the relay
network. In this figure, the MSF collects the users’ context information (location, user
profiles, subscriptions etc.), as well as other content-related information, such as
content popularity, and data from the (mobile and fixed) MEHs to optimize the MEH
resource usage. The MSF also has a sub-function dedicated to controlling the local
mesh backhaul network. This sub-function collects context-information of the mesh
routers themselves e.g. location, radio link condition, link availability etc., to
dynamically construct the wireless backhaul, transferring data plane to the supported
UEs. Using these sub-functions and functions of MSF, data can be pre-fetched from
the AS to the MEH located at the small cell gateway.
Figure 2.2-2 System Architecture of ODC (3GPP case)
Figure 2.2-3 shows the signaling procedures. MSF collects the users’ context
information (location, user profiles, subscriptions), and other content-related
information (content popularity and data from the RAN’s MEH) to optimize the MEH
resource usage.

Deliverable Horizon2020 EUJ-01-2016 723171 5G-MiEdge D2.4
Date: August 2018
Public Deliverable
5G-MiEdge Page 16
Figure 2.2-3 Signalling of ODC (3GPP case)
In addition, MSF optimizes the mesh backhaul routes and informs the optimization
results to the donor. In the latter case, MSF similarly collects the users’ context
information and optimizes the (central and edge) MEHs resource usage. It also pre-
fetches data from the AS to the MEH.
Regarding the link budget of the mmWave backhaul links, it was concluded in the
MiWEBA project [MiWEBA D5.1] that from indoor and outdoor channel
measurements for 28 GHz - 100 GHz bands:
Rain/Oxygen seems to be no problem for inter site distance (ISD) < 200 meters
Path loss exponent might be similar as for lower frequency bands at line of
light (LOS) ~ 2.0, non-line of sight (NLOS) ~ 3.4-3.5, compared to free space
model
There is similar reflection loss as for lower frequency bands but much higher
diffraction loss
Blockage model is important and needs to be investigated further
Open issues are for example human body shadowing or reflections due to moving
vehicles or attenuation by dense vegetation in cities. More exploration is needed to
elaborate on whether mmWave systems are noise or interference limited.
In the MiWEBA project, FHG conducted supporting outdoor channel measurements
for the street canyon reference scenario. It implemented ray-tracing models for the
street canyon propagation scenarios accordingly and simulated them. A feedback loop
with Intel equipment was established to evaluate measurement and simulation data,
extract channel parameters for characterization of the channel, and verify and calibrate
the simulation data further. Analysis of this data proves the feasibility of mmWave
small cells but at the same time the high time variance of the propagation channel. This
high time variance is caused by movement of the UE itself as well as pedestrians and
cars moving by. These effects and strategies to establish stable connections using
electronically steerable antennas or BF antennas have also been investigated
[MiWEBA D5.2, D5.3, and D5.4].

Deliverable Horizon2020 EUJ-01-2016 723171 5G-MiEdge D2.4
Date: August 2018
Public Deliverable
5G-MiEdge Page 17
Orange did experimental measurements in order to develop models in the frequency
band 40 and 60 GHz for both indoor and outdoor environments as well. Focus was on
the development of path-loss models integrating rainfall effects, Oxygen absorption
and bandwidth impact. A similar conclusion that mmWave backhaul link of short
distance was not affected significantly by the effect of rain attenuation was also drawn.
Furthermore, KLAB also provided data that for 60GHz fronthaul link, the link length
to be supported under strong rain of 20mm/h with probability of 99.97% was 1500m
without FEC and 5000m with FEC, which is quite longer than the expected backhaul
link length of up to 100m [MiWEBA AR10.1] experience in the 5G-MiEdge project.

Deliverable Horizon2020 EUJ-01-2016 723171 5G-MiEdge D2.4
Date: August 2018
Public Deliverable
5G-MiEdge Page 18
2.3 Autonomous driving
Automated driving is considered as one of the three most important use cases of future
5G systems [5GPPPWP AV]. The 1st phase of 5G Vehicle-to-Vehicle (V2V) and
Vehicle-to-Everything (V2X) communications aims at driver assistance systems and
exchanges messages either directly between vehicles or via appropriate infrastructure
[TR22.885]. These messages are transmitted in case of an emergency or as so-called
awareness messages, which contain information such as location, speed and heading
direction. However, the 2nd phase of 5G V2X aims for automated driving applications,
where automated control software becomes primarily responsible for monitoring the
environment and the driving vehicles, referred to as Levels of Automation (LoA) in
the range 3 to 5 [SAE].
Target scenarios for automated driving considered in this project are complex urban
city environments as in Figure 2.3-1, where many invisible hidden objects exist behind
buildings and tracks as well as unexpected and unequipped bicycles and pedestrians.
In such a complex environment, it is likely that Roadside Units (RSU) are deployed to
monitor the latest traffic conditions by cameras and LiDAR (Light Detection And
Ranging) sensors. However, this information in the RSU are not fully utilized to assist
driving for safety purpose so far.
Figure 2.3-1 Automotive traffic scenarios in urban city environments
Automated driving systems require highly resolved and dynamic maps in order to
maneuver vehicles safely. Since the resolution of current maps used for car navigation
is definitely not sufficient, high resolution and real-time maps, also called dynamic
High Definition (HD) maps, become indispensable [SH16]. Figure 2.3-2 shows an
example of HD map generated with a LiDAR sensor, which is used to monitor the car
surroundings and display the same as a high-resolution and real-time point cloud. Even
though the final values depend on the resolution of the actual HD map, an estimation
of 1 Gbps appears reasonable as a typical data rate requirement for exchanging HD
map information via V2V/V2X links. Indeed, mmWave seems to be the most
convenient means to provide such high data rates for multiple V2V/V2X links
coexisting in the scenario [CVG16].

Deliverable Horizon2020 EUJ-01-2016 723171 5G-MiEdge D2.4
Date: August 2018
Public Deliverable
5G-MiEdge Page 19
Figure 2.3-2 HD map measured by LiDAR as a high-resolution point cloud
[SH16]
Cooperative perception of HD maps using extended sensors
In complex urban city scenarios, self (egocentric) perception based automated driving,
as in [Ang13], cannot work anymore due to many invisible hidden objects. Therefore,
automated vehicles require helps from sensors located at RSUs as electrical mirror in
addition to the sensors equipped in the surrounding vehicles. Cooperative perception
is realized by exchanging sensor data between vehicles and RSUs and is necessary in
order to widen or enhance the visibility area of HD maps [KQC15] [HFL15]. This
concept allows a more accurate localization of objects and more important, due to a
superior bird's eye view, prevents that objects remain not visible and undetected, due
to the ego-perspective of the sensors mounted on the vehicle. This external object
detection capability is particularly critical for a safe realization of automated driving
in complex urban scenarios. Figure 2.3-3 shows an example of cooperative perception
in an urban city scenario. A sensor located at a RSU on a traffic light in front and a
sensor located on vehicles in front are orchestrated and used for cooperative perception
to realize safe automated driving.

Deliverable Horizon2020 EUJ-01-2016 723171 5G-MiEdge D2.4
Date: August 2018
Public Deliverable
5G-MiEdge Page 20
Figure 2.3-3 Cooperative perception for automated driving
mmWave based V2V/V2X for extended sensors
Based on the results provided in [D1.1], the enhanced V2V/V2X communication
targeting at automated driving requires a data rate of 1Gbps per link, end-to-end
latency of less than 10 ms per link and a communication range of more than 150 m, in
order to put safe automated driving into practice by exchanging raw (or lightly
processed) sensor data. Such high requirements cannot be realized with current
technologies [TR22.885]. Hence, 3GPP initiated related work in Release 15 and
beyond, which is named eV2X (enhanced V2X) [TR22.886]. Consequently, the
utilization of mmWave and MEC technologies are becoming increasingly important
for the field of automated driving.
Figure 2.3-4 shows an example of a system diagram proposed in [KS17] [D1.1] for
mmWave based V2V/V2X in order to realize a real-time exchange of HD maps
between On-Board Units (OBUs) mounted in vehicles and RSUs. All communication
links between OBUs and RSUs are directly connected through proximity-based
services, namely Device-to-Device (D2D) communication, as specified in [TS23.303].
However, differently from standard D2D, this V2V/V2X system uses mmWave
channels to fulfill the requirements of 1 Gbps data rate and less than 10 ms latency.
The communication range of mmWave links can be extended to more than 150 m, if
highly directional antenna beams are used. One challenge in this system might be the
antenna beam alignment between OBUs and RSUs, however [VSB16] [CVG16] show
the feasibility of using mmWave in vehicular scenarios. The system coexists with the
conventional V2X system [TR22.885], which supports cloud-based services such as
traffic jam forecast and long-range traffic navigation.

Deliverable Horizon2020 EUJ-01-2016 723171 5G-MiEdge D2.4
Date: August 2018
Public Deliverable
5G-MiEdge Page 21
Figure 2.3-4 mmWave based V2V/V2X for cooperative perception
A block diagram of OBU and RSU is shown in Figure 2.3-5, where the difference
between the OBU and RSU is solely the automated driving unit. The OBU/RSU
receives the HD maps from surrounding OBU/RSUs via mmWave V2V/V2X links
and fuses them with its own HD sensor data in the HD map-processing unit. This
process corresponds to the cooperative perception. This combined HD map with its
widened visibility area is used for automated driving decisions and in addition is
transferred to neighboring OBU/RSUs. However, before transmitting the fused HD
map, the HD map processing unit selects the area of interest (or control resolution of
HD map area by area) dependent on the location of receiver OBU/RSUs to avoid
exponential increase of data rate. The OBU/RSU is a unification of mmWave and MEC,
since the HD map-processing unit is considered as MEC to compute cooperative
perception at the edge of the network.
Deliverable Horizon2020 EUJ-01-2016 723171 5G-MiEdge D2.4
Date: August 2018
Public Deliverable
5G-MiEdge Page 22
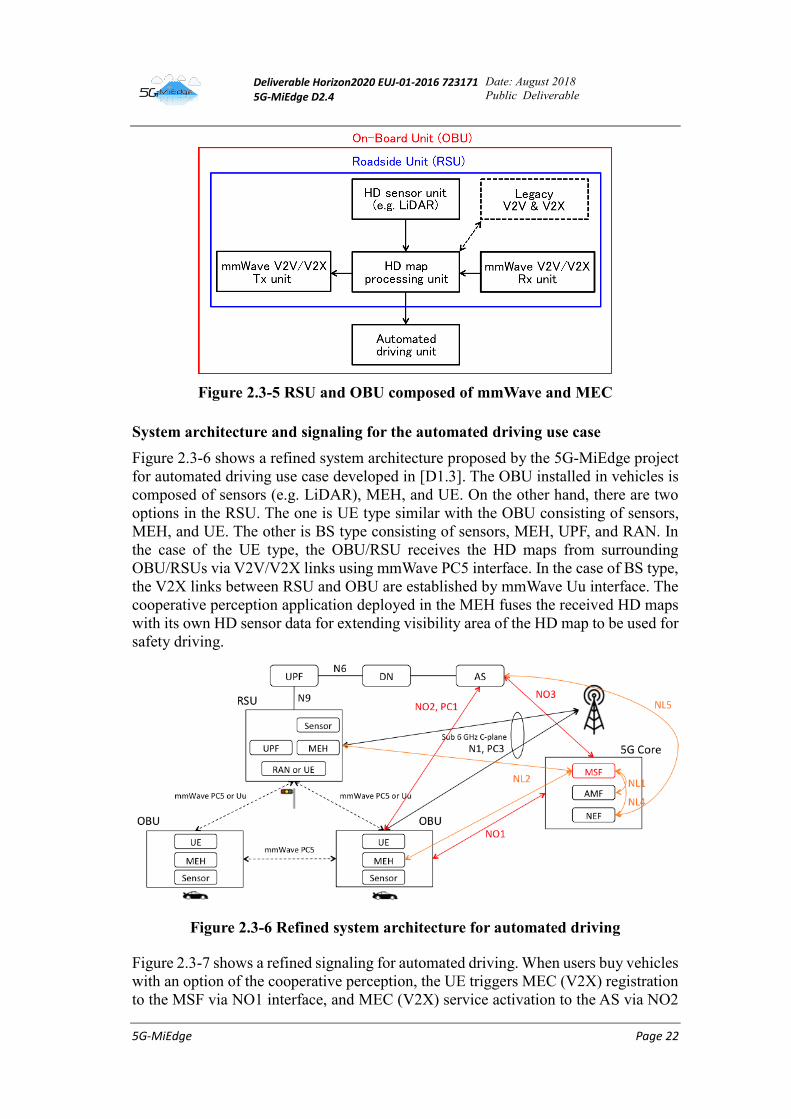
Figure 2.3-5 RSU and OBU composed of mmWave and MEC
System architecture and signaling for the automated driving use case
Figure 2.3-6 shows a refined system architecture proposed by the 5G-MiEdge project
for automated driving use case developed in [D1.3]. The OBU installed in vehicles is
composed of sensors (e.g. LiDAR), MEH, and UE. On the other hand, there are two
options in the RSU. The one is UE type similar with the OBU consisting of sensors,
MEH, and UE. The other is BS type consisting of sensors, MEH, UPF, and RAN. In
the case of the UE type, the OBU/RSU receives the HD maps from surrounding
OBU/RSUs via V2V/V2X links using mmWave PC5 interface. In the case of BS type,
the V2X links between RSU and OBU are established by mmWave Uu interface. The
cooperative perception application deployed in the MEH fuses the received HD maps
with its own HD sensor data for extending visibility area of the HD map to be used for
safety driving.
Figure 2.3-6 Refined system architecture for automated driving
Figure 2.3-7 shows a refined signaling for automated driving. When users buy vehicles
with an option of the cooperative perception, the UE triggers MEC (V2X) registration
to the MSF via NO1 interface, and MEC (V2X) service activation to the AS via NO2

Deliverable Horizon2020 EUJ-01-2016 723171 5G-MiEdge D2.4
Date: August 2018
Public Deliverable
5G-MiEdge Page 23
interface. Then the AS updates the service information managed in the MSF located in
the 5G core. The MSF allocates MEC resources in the MEHs via NL2 interface for the
cooperative perception application. In the case of BS type RSU, the AS deploys the
cooperative perception application to the RSU via N6 and N9 interfaces. In the case of
UE type RSU and the OBU, the cooperative perception application is deployed via Uu
from either macro BSs or the RSUs. In the case of isolated area without 5G network
operator, the cooperative perception application can also be deployed via PC5 interface
from other RSUs or OBUs as ad-hoc mode. During driving of vehicles, the ProSe
function [TR23.703], or Access and Mobility management Function (AMF), collects
context information, e.g. vehicle locations, service profiles, and subscriptions to
control the mmWave PC5 by using the PC3 interface over sub-6 GHz C-plane from
macro BSs for ensuring the cooperative perception service.
Figure 2.3-7 Refined signalling for automated driving

Deliverable Horizon2020 EUJ-01-2016 723171 5G-MiEdge D2.4
Date: August 2018
Public Deliverable
5G-MiEdge Page 24
3 Design and analysis for site specific deployment of
mmWave edge cloud
Site specific deployment of mmWave edge cloud systems needs careful planning and
evaluation of the used concepts and technologies. In this section we explain three key
design components:
Modeling and optimization of multi RAT HetNet
Interference management in mesh backhaul networks
Dynamic resource allocation, considering the best trade-off between queues
and power consumption
3.1 Modeling and optimization of multi RAT HetNet
Figure 3.1-1 multi RAT HetNet system model
In the previous deliverable D2.1 [D2.1], we have focused on the analysis of coverage
aspects for a heterogeneous network characterized by multiple RATs. We now take
into account cell loads to show how tier and RAT selection biases can improve the user
average throughput.
Past researches have characterized the load by using the average number of associated
users in a cell [Elshaer2016]; however, we have provided a more realistic
characterization by considering a dynamic traffic model. In addition, in contrast with
the literature, we have optimized the user throughput while considering signal-to-
interference-plus-noise ratio (SINR) outage constraints as well as overloading
constraints.
3.1.1.1 Cell load characterization
We consider a model in which users arrive in the system, download a file, and leave
the system. Any new download by the same user is considered as a new user. The
arrival process of the new users is Poisson distributed with an intensity λ
[users ·s−1·m−2] and these new users are uniformly distributed over the network area
A. The average file size is σ [bits/user]. When there are n users simultaneously served
by a BS, the available resources are equally shared between them in a Round Robin
fashion.

Deliverable Horizon2020 EUJ-01-2016 723171 5G-MiEdge D2.4
Date: August 2018
Public Deliverable
5G-MiEdge Page 25
According to our model of the traffic arrival process, the traffic density is given as
w = λ ⋅ σ [bits/s/m2]. For a single cell scenario, the load of the cell of area A can be modelled as
𝜌 = ∫𝑤
𝑅(𝑠)A
ds,
where R(s) is the physical data rate of a user located at s.
In case of Poisson-Voronoi cells, the average load is generally difficult to evaluate
because of the randomness in the shape and sizes of the cells. Furthermore, in a multi-
cell scenario, the load of a cell depends on the SINR characteristics of the cell, which
in turn, depends on the load of the other cells in the network.
We know from the ergodicity of the Poisson Point Process (PPP), that the fraction of
the BS of type tvr that are idle is equal to the fractional idle time of the typical BS of
same type. Here 𝑡 ∈ {𝑀, 𝑆}, 𝑣 ∈ {𝐿, 𝑁} and 𝑟 ∈ {𝑚, 𝜇} represent the tier (Macro base
station, MBS, and Small cell base station, SBS), visibility state (LOS, NLOS) and RAT
(mmWave, sub-6GHz) respectively. Accordingly, assuming that the load of the typical
BS of type tvr is given by �̅�𝑡𝑣𝑟. Then, the fraction of idle BS of type tvr is given by 1-
�̅�𝑡𝑣𝑟. We substitute this value for all tvr in the calculation of the load as
�̅�𝑡𝑣𝑟 = ∫𝑤𝐴𝑡𝑣𝑟
𝐵𝑟𝑙𝑜𝑔2(1 + 𝛾)𝑝𝑡𝑣𝑟(�̅� , 𝛾) 𝑑𝛾
𝐴
,
where the pdf of the SINR (𝑝𝑡𝑣𝑟(�̅� , 𝛾)) is a function of the average idle fraction
of the BS and �̅� is a vector of the fraction of idle BSs of all BS types, i.e., �̅�= [�̅�𝑡𝑣𝑟]
for all tvr. 𝐴𝑡𝑣𝑟 is the area of the typical cell of type tvr, and 𝐵𝑟 is the bandwidth of the
RAT r. This fixed-point equation is then solved in an iterative manner to obtain the actual load
of the BS of all the tiers (starting from zero load). Then, the SINR coverage probability
at a threshold γ with 1 - �̅�𝑡𝑣𝑟 fraction of BSs idle, given that the user is associated with
a sub-6GHz BS of tier t and visibility state v, is given by
P𝐶𝑡𝑣𝜇 (�̅�, γ) = ∫ exp ( −γ ⋅ σN,μ2 ⋅ x −∑𝐴𝑡′𝑣′ (𝛾, 𝑥, 𝜌𝑡′𝑣′𝜇 ))
t′v′
∞
0
fξtvμ1(x)dx
where,
𝐴𝑡′𝑣′(𝛾, 𝑥, 𝜌𝑡′𝑣′𝜇) = ∫𝛾𝑥
𝑦+𝛾𝑥
∞
𝑙𝑡′ Λ𝑡′𝑣′𝜇′ (𝑑𝑦, 𝜌𝑡′𝑣′𝜇), ∀ 𝑡
′ ∈ {𝑀, 𝑆}, 𝑣′ ∈ {𝐿, 𝑁}.
Additionally, 𝑙𝑡′= x if 𝑡′ = 𝑡, 𝑙𝑡′ = 𝑄𝑇 ⋅ 𝑥, when 𝑡 = 𝑀 and 𝑡′ = 𝑆 and 𝑙𝑡′ =𝑥
𝑄𝑇
when 𝑡 = 𝑆 𝑎𝑛𝑑 𝑡′ = 𝑀. Here QT is the tier selection bias and fξtvμ1(x) is the
distance distribution of the strongest BS of type tvr. σN,μ2 is the noise in the sub-6
GHz band.
The intensity measures Λtvr are obtained by modifying 𝜆𝑡𝑣𝑟 to 𝜆𝑡𝑣𝑟𝜌𝑡𝑣𝑟 to the
expressions for intensities in Eq. (2) in [Ghatak2018] for each BS type. The calculation
for the mmWave BS follows in the same way.
Deliverable Horizon2020 EUJ-01-2016 723171 5G-MiEdge D2.4
Date: August 2018
Public Deliverable
5G-MiEdge Page 26
It should be noted that in case of a Poisson distributed network, there exists a non-zero
fraction of unstable cells (𝜌 < 1), which cannot handle their load.
3.1.1.2 Analysis of the bound on overloading probabilities
In this section, we investigate the relation between the cell overloading probabilities
and the traffic density, based on the analytical bound derived in the Lemma 1
[Ghatak2018].
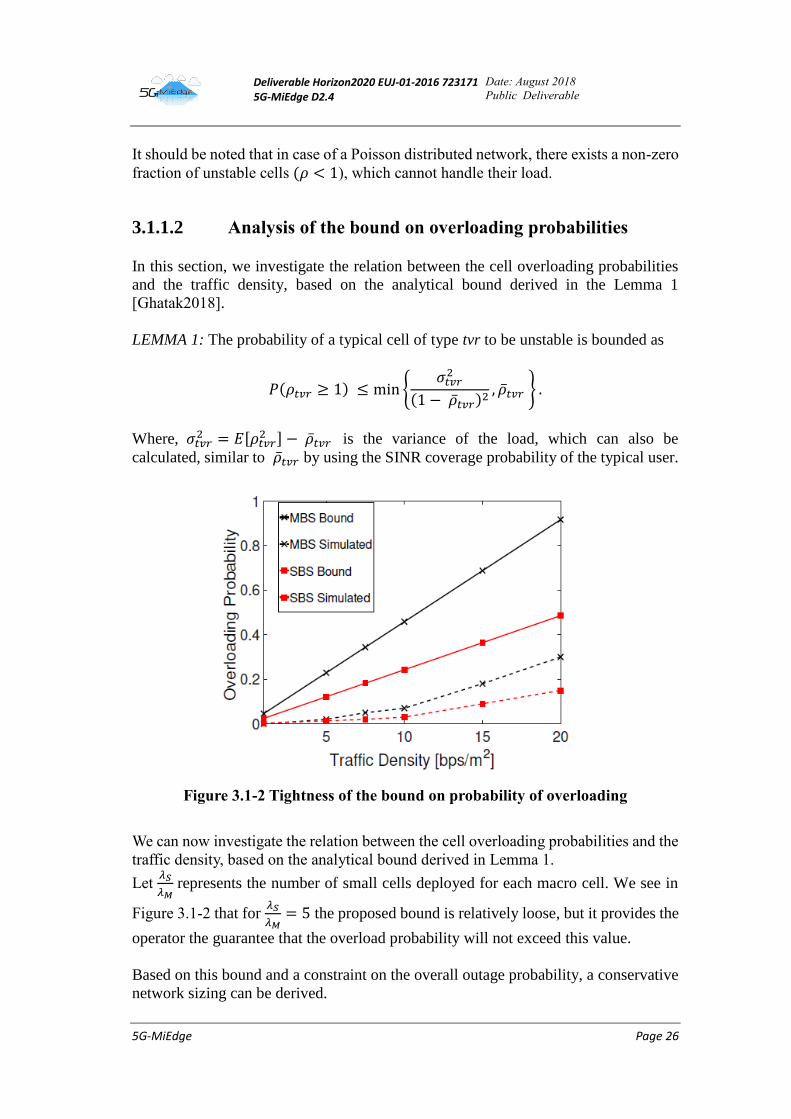
LEMMA 1: The probability of a typical cell of type tvr to be unstable is bounded as
𝑃(𝜌𝑡𝑣𝑟 ≥ 1) ≤ min {𝜎𝑡𝑣𝑟2
(1 − �̅�𝑡𝑣𝑟)2, �̅�𝑡𝑣𝑟 } .
Where, 𝜎𝑡𝑣𝑟2 = 𝐸[𝜌𝑡𝑣𝑟
2 ] − �̅�𝑡𝑣𝑟 is the variance of the load, which can also be
calculated, similar to �̅�𝑡𝑣𝑟 by using the SINR coverage probability of the typical user.
Figure 3.1-2 Tightness of the bound on probability of overloading
We can now investigate the relation between the cell overloading probabilities and the
traffic density, based on the analytical bound derived in Lemma 1.
Let 𝜆𝑆
𝜆𝑀 represents the number of small cells deployed for each macro cell. We see in
Figure 3.1-2 that for 𝜆𝑆
𝜆𝑀= 5 the proposed bound is relatively loose, but it provides the
operator the guarantee that the overload probability will not exceed this value.
Based on this bound and a constraint on the overall outage probability, a conservative
network sizing can be derived.
Deliverable Horizon2020 EUJ-01-2016 723171 5G-MiEdge D2.4
Date: August 2018
Public Deliverable
5G-MiEdge Page 27
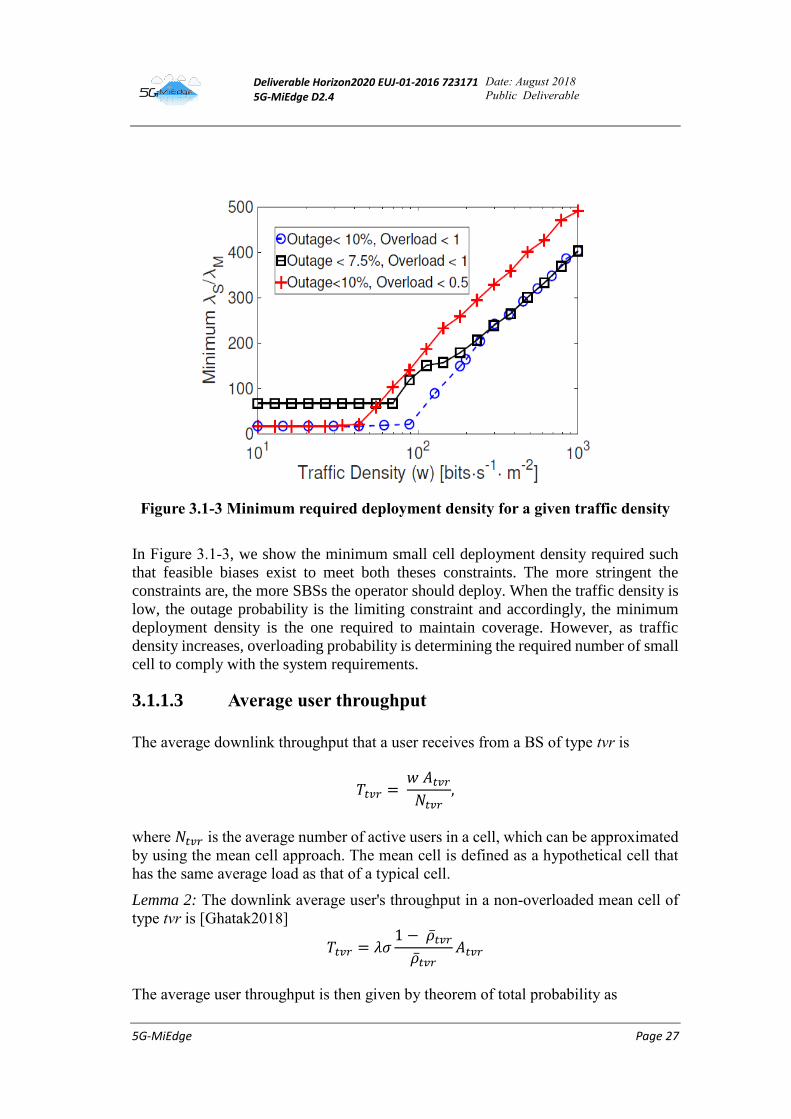
Figure 3.1-3 Minimum required deployment density for a given traffic density
In Figure 3.1-3, we show the minimum small cell deployment density required such
that feasible biases exist to meet both theses constraints. The more stringent the
constraints are, the more SBSs the operator should deploy. When the traffic density is
low, the outage probability is the limiting constraint and accordingly, the minimum
deployment density is the one required to maintain coverage. However, as traffic
density increases, overloading probability is determining the required number of small
cell to comply with the system requirements.
3.1.1.3 Average user throughput
The average downlink throughput that a user receives from a BS of type tvr is
𝑇𝑡𝑣𝑟 = 𝑤 𝐴𝑡𝑣𝑟𝑁𝑡𝑣𝑟
,
where 𝑁𝑡𝑣𝑟 is the average number of active users in a cell, which can be approximated
by using the mean cell approach. The mean cell is defined as a hypothetical cell that
has the same average load as that of a typical cell.
Lemma 2: The downlink average user's throughput in a non-overloaded mean cell of
type tvr is [Ghatak2018]
𝑇𝑡𝑣𝑟 = 𝜆𝜎1 − �̅�𝑡𝑣𝑟�̅�𝑡𝑣𝑟
𝐴𝑡𝑣𝑟
The average user throughput is then given by theorem of total probability as

Deliverable Horizon2020 EUJ-01-2016 723171 5G-MiEdge D2.4
Date: August 2018
Public Deliverable
5G-MiEdge Page 28
𝑇 = ∑ 𝑃𝑡𝑣𝑟𝑇𝑡𝑣𝑟𝑡𝑣𝑟 .
Due to the different operating bandwidths, the bias values that provide the optimal user
throughput may lead to weak SINR, which in turn increases the outage. Thus, to
guarantee the communication reliability, it is necessary to consider an SINR constraint
on the selection of the optimal biases. We define the outage probability with respect to
a SINR threshold 𝛾 as
𝑃𝑜,𝑡𝑣𝑟(𝛾𝑚𝑖𝑛) = 1 − 𝑃𝐶𝑡𝑣𝑟(𝛾𝑚𝑖𝑛).
Therefore, we introduce the notion of effective throughput, which measures the
throughput of the users, which are not in outage, as
𝑇𝑒𝑓𝑓(𝛾𝑚𝑖𝑛) = ∑𝑃𝑡𝑣𝑟𝑇𝑡𝑣𝑟𝑃𝐶𝑡𝑣𝑟(𝛾𝑚𝑖𝑛)
𝑡𝑣𝑟
In our work, we optimize 𝑄𝑇 and 𝑄𝑅 so as to maximize the average effective user
throughput 𝑇𝑒𝑓𝑓(𝛾𝑚𝑖𝑛) under the constraint of a maximum outage probability
𝑃𝑜,𝑡𝑣𝑟(𝛾𝑚𝑖𝑛) ≤ 𝑃0
for every BS type tvr.
3.1.1.4 Rate optimal choice of tier and RAT selection biases
In this section, we discuss optimal tier and RAT selection biases with respect to the
average effective throughput. To guarantee a good coverage, we impose a constraint
on the outage probability (from 7.5 to 12.5%).
Figure 3.1-4 Throughput optimal MBS association probabilities
Deliverable Horizon2020 EUJ-01-2016 723171 5G-MiEdge D2.4
Date: August 2018
Public Deliverable
5G-MiEdge Page 29
The MBS association probability corresponding to the optimal QT as a function of the
traffic density is shown in Figure 3.1-4. Depending on the ratio of densities, users are
offloaded from MBS to SBS (for low SBS densities) or vice-versa (for high SBS
densities).
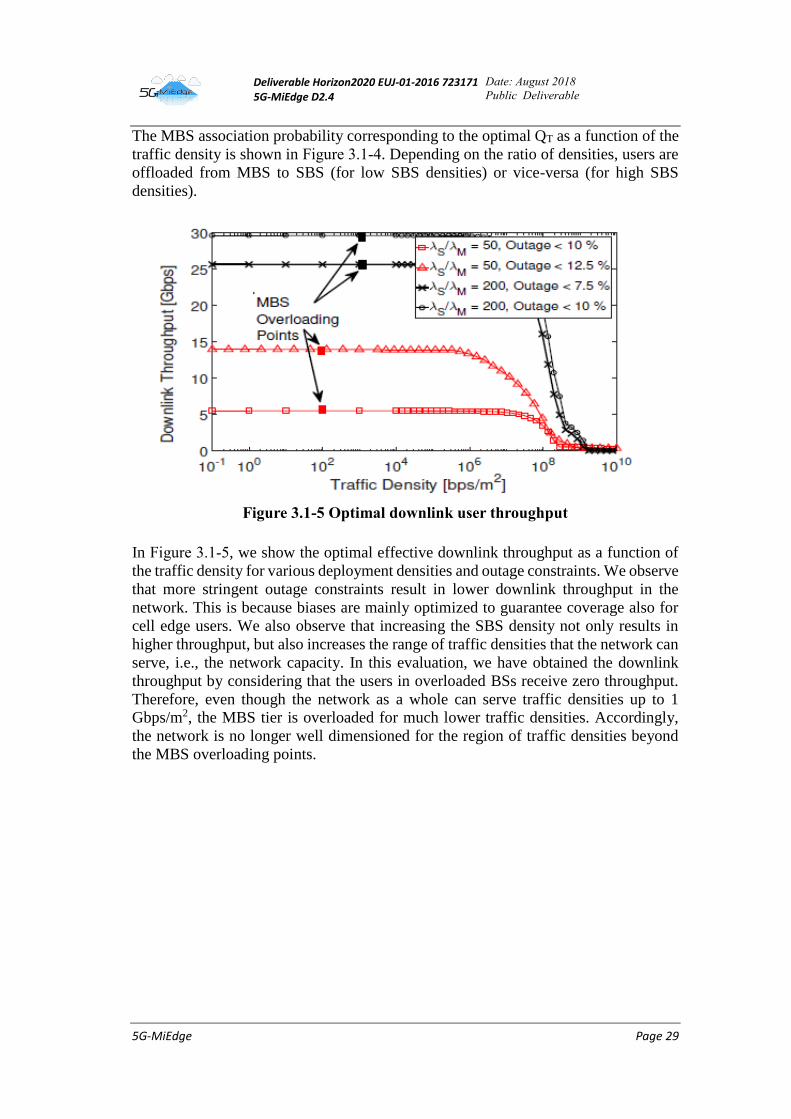
Figure 3.1-5 Optimal downlink user throughput
In Figure 3.1-5, we show the optimal effective downlink throughput as a function of
the traffic density for various deployment densities and outage constraints. We observe
that more stringent outage constraints result in lower downlink throughput in the
network. This is because biases are mainly optimized to guarantee coverage also for
cell edge users. We also observe that increasing the SBS density not only results in
higher throughput, but also increases the range of traffic densities that the network can
serve, i.e., the network capacity. In this evaluation, we have obtained the downlink
throughput by considering that the users in overloaded BSs receive zero throughput.
Therefore, even though the network as a whole can serve traffic densities up to 1
Gbps/m2, the MBS tier is overloaded for much lower traffic densities. Accordingly,
the network is no longer well dimensioned for the region of traffic densities beyond
the MBS overloading points.

Deliverable Horizon2020 EUJ-01-2016 723171 5G-MiEdge D2.4
Date: August 2018
Public Deliverable
5G-MiEdge Page 30
Figure 3.1-6 Optimal association probabilities for different outage probability
constraints
Furthermore, in Figure 3.1-6, we plot the optimum association probabilities as a
function of outage probability with λS
λM = 50 and traffic density of 200 bits/s/m2. We
see that for more stringent outage constraints, sub-6GHz service in SBSs becomes
necessary, in addition to mmWave service, to satisfy the QoS constraints of outage
and overloading simultaneously, thus justifying the interest of deploying dual band
SBSs.
Figure 3.1-7 Effective user throughput for λ_S/λ_M =200
As a conclusion, in dense SBS deployments (see Figure 3.1-7), the users do not suffer
from outage even in the case of high tier biases. In this case, QR should be high enough
Deliverable Horizon2020 EUJ-01-2016 723171 5G-MiEdge D2.4
Date: August 2018
Public Deliverable
5G-MiEdge Page 31
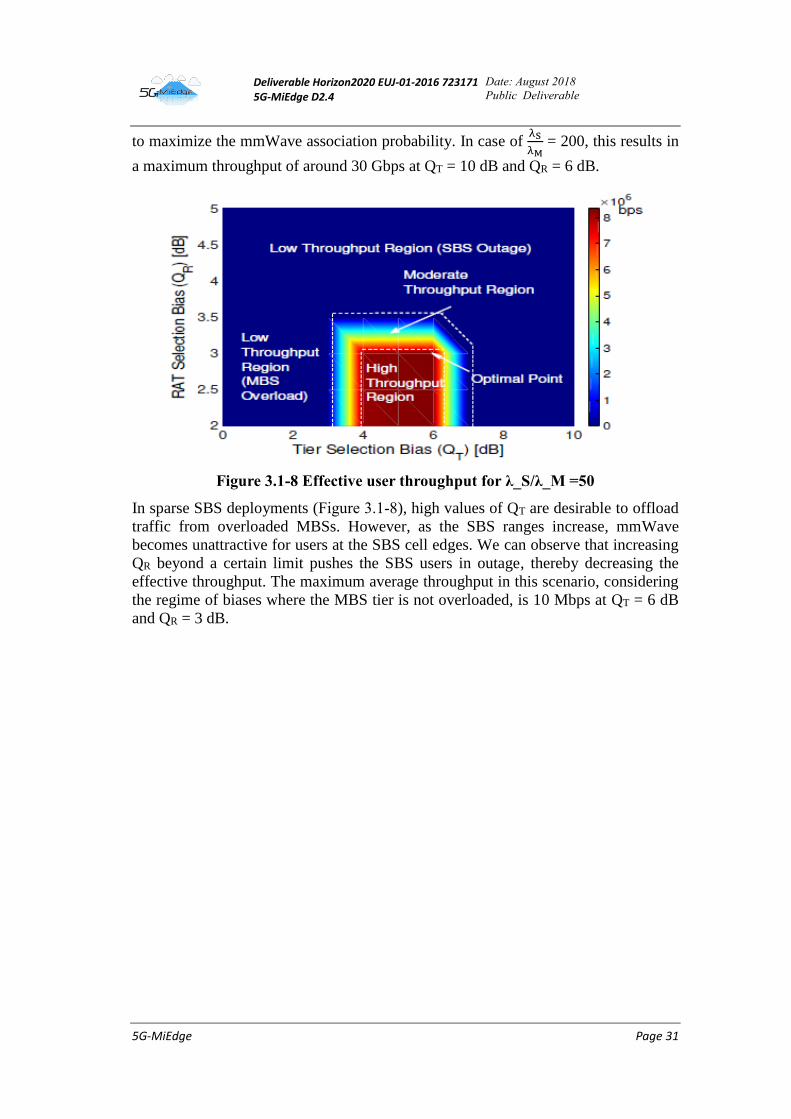
to maximize the mmWave association probability. In case of λS
λM = 200, this results in
a maximum throughput of around 30 Gbps at QT = 10 dB and QR = 6 dB.
Figure 3.1-8 Effective user throughput for λ_S/λ_M =50
In sparse SBS deployments (Figure 3.1-8), high values of QT are desirable to offload
traffic from overloaded MBSs. However, as the SBS ranges increase, mmWave
becomes unattractive for users at the SBS cell edges. We can observe that increasing
QR beyond a certain limit pushes the SBS users in outage, thereby decreasing the
effective throughput. The maximum average throughput in this scenario, considering
the regime of biases where the MBS tier is not overloaded, is 10 Mbps at QT = 6 dB
and QR = 3 dB.

Deliverable Horizon2020 EUJ-01-2016 723171 5G-MiEdge D2.4
Date: August 2018
Public Deliverable
5G-MiEdge Page 32
3.2 Interference management in mesh backhaul networks
3.2.1 Interference management methods
The mmWave overlay HetNet is an architecture that fits the requirements of enhanced
Mobile Broadband communication. Such architecture is composed of conventional
LTE macro cell BS covering a wide area, and many mmWave APs within the coverage
area. However, when all backhaul link apply wire connections, backhauling
connection cost becomes too high. Consequently, there is the need to look at other
more advanced kind of architectures, in order to reduce the installation costs.
The mmWave mesh backhaul networks (MMBNs) is one of those advanced
architectures that can cope with the varying traffic by connection flexibility. MMBN
assumes the existence of many links. In the real environment, interference often
happens, with the consequence that the maximum achievable system rates become
worse, due to the irregular building placement. We focus in this subsection therefore
on interference management for MMBN networks, e.g. new design rules for mmWave
APs deployment.
Optimization for interference management of MMBN, including node placement,
channel selection and beam steering, is an NP-hard problem, due to the large number
of involved unknown parameters. Therefore, we proposed a heuristic approach, which
can achieve reasonable performance via three steps i.e.
Mesh node deployment
Channel assignment
Best beam selection and power allocation
Figure 3.2-1 shows some of the most important interference management methods.
When mmWave APs are deployed linearly, antennas establishing links face each
other directly. Interference component is attenuated only as a function of distance
separation between links. Therefore, bad SINR performance is expected in this
scenario. However, when mmWave AP are deployed in zigzag as our proposal,
antennas establishing links do not face each other. Through this angular
manipulation, the largest interference component from the adjacent hop is
expected to be reduced.
We assume IEEE802.11ad standard for mmWave access and backhaul owing to
its available broadband. The band is divided into 4 channels. We assume access
and backhaul links use each 2 channels to avoid their mutual interference. For
backhauling channel allocation, the complexity of a full search will increase
exponentially against the total number of backhaul links that is not feasible for
dynamic network formation in practice. We propose a sub-optimal heuristic
approach to tackle the above issue. First, the channel allocation at the GW with
multiple sectors (interfaces) each connecting to different route is decided by an
exhaustive search to maximize the minimum SINR among the interfaces, knowing
that the interference component here is between different sectors of the GW.
Second, for each route departing from the GW, since interference from adjacent
hop has been reduced significantly owing to the zigzag deployment explained
above, there is no necessary to switch the channel by each hop.

Deliverable Horizon2020 EUJ-01-2016 723171 5G-MiEdge D2.4
Date: August 2018
Public Deliverable
5G-MiEdge Page 33
MmWave communication assumes LOS connection between mmWave APs via
beam-forming (BF). Beam steering functionality is therefore available in most of
mmWave devices. We employ such functionality as one of the methods to avoid
interference. Specifically, the networks select beams via wall reflection instead of
the normal direct beam when necessary to avoid explicit interference, at especially
intersection of roads where multiple routes overlap.
Multi-hop relay capacity is defined as the link with lowest data rate (or
equivalently lowest SINR) called the bottleneck. Such bottleneck can be
efficiently alleviated by applying proper power allocation at each hop, to
maximize the minimum SINR link along the target route.
Figure 3.2-1 Interference management methods
3.2.2 MMBN architecture
In this work, we assume that the network is composed of only one macro cell. LTE
macro cell BS originally plays both roles as U-plane supplying data to UEs and C-
plane controlling the communication quality. This work assumes C/U-splitting
architecture such that LTE macro cell which employs microwave band and has large
coverage is responsible for only the C-plane of the network e.g. association between
UE and AP, mesh backhaul construction between APs including channel allocation,
beam selection and power allocation. On the other hand, U-plane is offloaded to the
access interfaces of mmWave APs. MmWave GW is the only small cell BS (AP) with
high-speed wired backhaul working as the gateway for MMBN to the core network.
In other words, it plays a role as the U-plane source for all other mmWave APs. This
work assumes the GW with ideal wired backhaul has several sectors, which can
simultaneously connect to different interfaces of mmWave APs via multi-hop relay to
enable route multiplexing. Figure 3.2-2 depicts a typical MMBN architecture.

Deliverable Horizon2020 EUJ-01-2016 723171 5G-MiEdge D2.4
Date: August 2018
Public Deliverable
5G-MiEdge Page 34
Figure 3.2-2 MMBN architecture
3.2.3 MmWave AP deployment
We assume that MMBN is deployed at ground level as seen in Figure 3.2-3. MmWave
APs are assumed to be attached on street lampposts taking into account realistic
environments. The height of lampposts are set as 6m and the width of road with two
traffic lanes is about 6m.
Figure 3.2-3 Street model and deployment of mmWave APs
Received Signal Strength Indicator (RSSI) changes by not only deployment of
mmWave APs but also transceivers’ angular alignment, since BF is employed in
mmWave communication for compensating propagation loss. When mmWave APs are
deployed linearly, antennas establishing links face each other directly. Interference
component is attenuated only as a function of distance separation between links.
Therefore, bad SINR performance is expected in this scenario. However, when
mmWave AP are deployed as we propose in this paper (see Figure 3.2-3), antennas
establishing links do not face each other. Through this angular manipulation, the
largest interference component from the adjacent hop is expected to be reduced.
Therefore, mmWave APs are deployed not facing one another both vertically (at
4m/6m heights of lampposts successively) and horizontally (on each side of the road
respectively), as shown in Figure 3.2-3.
Owing to such zigzag deployment, nulls are almost steered to the adjacent hop to
reduce interference. This section explains this effect mathematically. Using antenna’s

Deliverable Horizon2020 EUJ-01-2016 723171 5G-MiEdge D2.4
Date: August 2018
Public Deliverable
5G-MiEdge Page 35
beam pattern as an approximation of a sinc function, the half-width is given by road
width, height of APs and distances among them as follows
𝑃r(𝜙) = |𝐸0′ |2 sinc2 (
𝑘𝐷𝐴2sin𝜙)
where 𝑃r is the antenna direction gain, |𝐸0′ | is the maximum complex amplitude, 𝑘 is
the wavenumber, 𝐷𝐴 is the antenna separation and 𝜙 denotes angle deviation from the
beam axis. We establish the following relationship, letting the half-power beam width
of azimuth direction and the first null direction be denoted as 𝜙−3dB and 𝜙α
respectively,
𝜙−3dB = 0.88𝜆
𝐷𝐴
𝜙α ≡1
0.88𝜙−3dB =
𝜆
𝐷𝐴
By substituting the road width of 6m and lamppost interval of 50m to the above
equation, we derive that the LOS beam will not interfere the adjacent hop if 𝜙−3dB ≤5deg is designed. In addition, the antenna direction gain can be approximated by the
following equation
𝐺 ≅4π
𝜃−3dB𝜙−3dB
where 𝜃−3dB is the elevation half-power beam width.
3.2.4 Channel assignment
This work utilizes the IEEE 802.11ad (WiGig) standard for mmWave access and
backhaul owing to its available broadband. The band is divided to 4 channels. This
work assumes access and backhaul links use each 2 channels to avoid their mutual
interference. For backhauling channel allocation, a full search will require 𝑁CH𝑁LINK
times of measurement, where 𝑁CH= 2 is the total number of channels available for
backhaul and 𝑁LINK is the total number of backhaul links. Since the search
exponentially increases against the number of links, it is not feasible for dynamic
network formation in practice. This work proposes a sub-optimal heuristic approach
to tackle the above issue. First, the channel allocation at the GW with multiple sectors
(interfaces) each connecting to different route is decided by an exhaustive search to
maximize the minimum SINR among the interfaces, knowing that the interference
component here is between different sectors of the GW. Second, for each route
departing from the GW, since interference from adjacent hops has been reduced
significantly owing to the zigzag deployment explained above, there is no necessary
to switch the channel by each hop. Against this conventional approach, this paper
proposes to switch the channel by every two hops as depicted in Figure 3.2-4.

Deliverable Horizon2020 EUJ-01-2016 723171 5G-MiEdge D2.4
Date: August 2018
Public Deliverable
5G-MiEdge Page 36
Figure 3.2-4 Street model and deployment of mmWave APs
3.2.5 Beam selection
MmWave communication assumes LOS connection between mmWave APs via BF.
Beam steering functionality is therefore available in most of mmWave devices. This
work employs such functionality as one of the methods to avoid interference in
MMBN. Specifically, the networks select beams via wall reflection instead of the
normal direct beam when necessary to avoid explicit interference.
For the sake of low complexity, such mechanism is only conducted at intersection of
roads. We store up to three candidates of strong azimuth beam directions beforehand
to realize real-time search. Elevation angle search is not necessary in this work due to
restricted height difference of antenna on the lampposts.
3.2.6 Power allocation
Multi-hop relay capacity is defined as the link with lowest data rate (or equivalently
lowest SINR), which is called the bottleneck. On the other hand, such bottleneck can
be efficiently alleviated by applying proper power allocation at each hop. Since this
paper assumes SDN-controlled MMBN by C-plane of the LTE macro cell, centralized
optimization of power allocation is possible at the macro BS based on link channel
condition feedbacks from mmWave APs. For each route of MMBN, we define the link
gain from the transmitter of the 𝑗th link to the receiver of the 𝑖th link as 𝑔𝑖𝑗 the SINR of
each link as 𝛾. The SINR 𝛾 can be calculated as the follows
𝛾(𝑖) =𝑔𝑖𝑖𝑝𝑖
𝑃n + ∑ 𝛿𝑖,𝑗𝑔𝑖𝑗𝑝𝑗𝑗≠𝑖=
𝑃𝑖𝑖𝑃n + ∑ 𝛿𝑖,𝑗𝑃𝑖𝑗𝑗≠𝑖
where 𝑝𝑖 denotes the transmit power of the the 𝑖th link, 𝑃𝑖𝑗 denotes the received power
observed at the receiver of the 𝑖th link from the transmitter of the 𝑗th link. 𝛿𝑖,𝑗 is the
Kronecker-Delta which has unit value if the two links use a same channel frequency
and zero otherwise. When the noise power 𝑃n is negligible compared to the
interference power ∑ 𝛿𝑖,𝑗𝑃𝑖𝑗𝑗≠𝑖 , which is the case of our MMBN, the SINR can be
approximated as the SIR (Signal-to-Interference-Ratio) 𝛾𝑖′. Ignoring the noise term,
the above equation can be rewritten as follows
∑𝑔𝑖𝑗
𝑔𝑖𝑖𝑝𝑗
𝑗≠𝑖
=𝑝𝑖𝛾𝑖′ = 𝜏𝑖𝑝𝑖

Deliverable Horizon2020 EUJ-01-2016 723171 5G-MiEdge D2.4
Date: August 2018
Public Deliverable
5G-MiEdge Page 37
where 𝜏𝑖 is the inverse of SIR, which can be interpreted as the Error Vector Magnitude
(EVM). Thus, the power allocation can be solved by the following optimization
problem,
find : 𝒑 ∈ ℝ𝑁Link
minimize : 𝜏
subject to : 𝑨𝒑 = 𝜏𝒑
0 < 𝑝𝑖 ≤ 𝑝max
where 𝒑 = [𝑝1, 𝑝2, … , 𝑝𝑁Link ]𝑇 ∈ ℝ𝑁Link is the power transmission vector, and 𝑨 ∈
ℝ𝑁Link×𝑁Link with 𝑎𝑖𝑗 =𝑔𝑖𝑗
𝑔𝑖𝑖 and 𝑎𝑖𝑖 = 0 is defined as the interference matrix. We can
calculate 𝜏 as the maximum eigenvalue 𝜆max of the matrix 𝑨.
𝜏 = 𝜆max(𝑨) = max{𝜆(𝑨)}
The optimal power allocation is therefore given via the corresponding eigenvector
taking into account the power constraint.
3.2.7 Simulation model
Performance evaluation of the proposed algorithm for MMBN is conducted via ray-
tracing simulation. The ray-tracing simulation model is explained in this section as
depicted in Figure 3.2-5. In this document, we assume MMBN are deployed in an
environment with intensive user distribution. Terrain model is made in reference to
Shibuya, a crowded station in Tokyo and mmWave APs are deployed approximately
every 50 m, based on lampposts placement. The conventional approach is defined as
linear deployment of mmWave APs (green points), while the proposed approach
applied zigzag deployment (red points).
Figure 3.2-5 Terrain model for simulation
Table 3.2-1 shows each used simulation parameter. These parameters refer to the IEEE
802.11ad standard. The number of paths and APs are set to 25 and 28, respectively.
Dielectric constant and conductivity of concrete are set in reference to mmWave. Beam
selection techniques in Section 3.2.5 are used at intersection areas marked by blue

Deliverable Horizon2020 EUJ-01-2016 723171 5G-MiEdge D2.4
Date: August 2018
Public Deliverable
5G-MiEdge Page 38
circle in Figure 3.2-5 in only case of applying route multiplexing as explained later in
Section 3.2.8.
Table 3.2-1 Simulation parameter
Parameter Value
Carrier freq. 60 GHz
Bandwidth 2 × 2.16 GHz
Link Down
Tx power 10 dBm
Antenna gain 32 dBi
Half width of azimuth 5 deg
Half width of elevation 5 deg
Propagation loss 20 log10(4𝜋𝑑 𝜆⁄ )
Dielectric constant 3.3
Conductivity 0.015 S m⁄
Noise power density −174 dBm/Hz
Noise factor 10 dB
We compute throughput of backhaul links by mapping MCS and the achieved SINR
𝛾𝑖 . Due to multi-hop relay, the performance of the network is evaluated at the
bottleneck link. We compare with the conventional approach with linear node
deployment and therefore channel switching per every two hops.
3.2.8 Simulation results
Scalabilities of the proposed mechanism are evaluated in two scenarios i.e. without
and with route multiplexing. In the former, route multiplexing is not applied and we
evaluated bottleneck link capacity when each multi-hop route is extended radially far
from the GW. In the latter case of with route multiplexing, certain APs are assumed to
be sink nodes, while the others only play the role of relay nodes. For each sink node,
we assume that source information from the GW are relayed to each sink node via two
route multiplexing. Numerical results are summarized in Figure 3.2-6, where the x-
axis shows the AP distance from GW and the y-axis shows the bottleneck capacity up
to that distance. The maximum achievable throughput of each link is upper bound by
6.76 Gbps according to the IEEE 802.11ad standard.
(a) Without route-multiplexing scenario
Figure 3.2-6 (a) shows that the conventional approach cannot reduce interference
effectively, because mmWave APs were deployed linearly. On the other hand, the
proposed approach can alleviate interference up to 250 m from mmWave GW. In
other words, the effect of the proposed interference mechanism was confirmed.
(b) With route-multiplexing scenario

Deliverable Horizon2020 EUJ-01-2016 723171 5G-MiEdge D2.4
Date: August 2018
Public Deliverable
5G-MiEdge Page 39
(a) Without route multiplexing
(b) With route multiplexing
Figure 3.2-6 Coverage-Throughput relationship
Since two-route multiplexing is considered in this scenario, the maximum throughput
becomes 13.5 Gbps, which doubles the upper bound in the case of single route. As
shown in Fig. Figure 3.2-6 (b), throughput achieved only about 10 Gbps in
conventional approach. That is due to intra-route and inter-route interference that could
not be tackled by the conventional scheme. On the other hand, throughput was about
13.5 Gbps in the proposed approach. The result again confirms the effectiveness of the
proposed mechanism for interference management in even multi-route multiplexing
scenario.

Deliverable Horizon2020 EUJ-01-2016 723171 5G-MiEdge D2.4
Date: August 2018
Public Deliverable
5G-MiEdge Page 40
3.3 Dynamic resource allocation, considering the best trade-off
between queues and power consumption
3.3.1 Introduction
In this section, we present an approach for dynamic resource allocation for
computation offloading, building on the tools of Stochastic Optimization [NEE10].
Computation offloading aims at transferring applications from the mobile devices to
the MEH to reduce the device power consumption and enable low latency execution
of computationally heavy tasks. Our previous approaches, such as [BAR17] and
[SMB18], are static and the optimization is performed for a given application and
system state, considering that the computation requests and the corresponding bits to
be transferred for the offloading are known in advance. This new study is useful for
those applications in which computation demands are generated continuously at the
mobile side, and the arrival probabilities of such requests are unknown. In this case,
the evolution of the system in terms of computation queues, radio channels, user’s
position etc. is taken into account in the optimization. It will be shown that a per-slot
optimization, based on this current state information, can achieve good performance
in terms of long-term average transmit power while stabilizing the computation queues.
A trade-off between power consumption and queue lengths (i.e. execution delay) is the
main goal of this investigation. The approach is based on the recent work [MAO17],
in which the authors aim at minimizing the long-term average weighted sum power
consumption of both the mobile device and the MEH, under the constraint of keeping
the computation queues stable. The power consumption is considered the one for
transmission plus the one for local execution. In particular, we suppose that tasks can
be split into an arbitrary number of subtasks, so that the execution is split into a local
execution (at the mobile side) and a remote execution (at the MEH). Then, in each time
slot, a decision is taken to split the application and to allocate radio and computation
resources for the execution.
3.3.2 Problem formulation and proposed solution
We consider a scenario with 𝐾 mobile users and 𝑁 AP’s and 𝑁 MEHs, each of them
associated to one pair AP-MEH. Each user can access a single AP to offload part of its
computation tasks through a certain AP to its associated MEH. The optimization,
which will be described further in this section, is performed in a per-slot fashion. In
time slot 𝑡, the association of a generic user 𝑘 to the pair AP-MEH 𝑛 is described by
the assignment variable 𝑎𝑘𝑛(𝑡) as follows
{𝑎𝑘𝑛(𝑡) = 1, if user 𝑘 is assigned to the pair AP − MEH 𝑛𝑎𝑘𝑛(𝑡) = 0, otherwise
For the communication part, we denote by ℎ𝑘𝑛(𝑡) the channel power gain between
user 𝑘 and AP 𝑛 , by 𝑝𝑘𝑛(𝑡) the transmit power used for the uplink transmission of
offloaded tasks, and by 𝛼𝑘𝑛(𝑡) the fraction of the bandwidth allocated to user 𝑘 during
time slot 𝑡. Then, the maximum transmission rate during time slot 𝑡 can be written as
𝑅𝑘𝑛(𝑡) = 𝛼𝑘𝑛(𝑡) 𝐵 log2 (1 +ℎ𝑘𝑛(𝑡)𝑝𝑘𝑛(𝑡)
𝛼𝑘𝑛(𝑡)𝑁0𝐵)

Deliverable Horizon2020 EUJ-01-2016 723171 5G-MiEdge D2.4
Date: August 2018
Public Deliverable
5G-MiEdge Page 41
where 𝑁0 is the noise power spectral density. As already mentioned, the execution is
split into a local and a remote execution. We also denote by 𝑓𝑘𝑙(𝑡) the local CPU cycle
frequency and by 𝐽𝑘 the number of bits per CPU cycle. Our aim is to minimize the
long-term average power consumption under constraints on the stability of the local
and remote computation queues. Given the computation split, for each user 𝑘 during
time slot 𝑡 , we consider a local queue backlog Q𝑘𝑙 (t) and a remote queue backlog
Q𝑘𝑟 (t), in bits. Then, we define the overall queue backlog for each user as
𝐐𝑘(𝑡) = (Q𝑘𝑙 (t), Q𝑘
𝑟 (t)) (1)
In each time slot, new tasks arrive. Some tasks are executed locally, while other tasks
are offloaded to the MEH. Then, the evolution of the local queue backlog can be
written as follows
Q𝑘𝑙 (t + 1) = max(Q𝑘
𝑙 (t) − Δ ⋅ 𝑓𝑘𝑙(𝑡) 𝐽𝑘 − Δ∑𝑎𝑘𝑛(𝑡)𝑅𝑘𝑛(𝑡)
𝑁
𝑛=1
, 0) + 𝐴𝑘(𝑡)
where 𝐴𝑘𝑛(𝑡) are the new arrivals, which arrive according to an unknown process, and
Δ is the slot duration. The queue backlog at the MEH side evolves as follows
Q𝑘𝑟 (t + 1) = max(Q𝑘
𝑟 (t) − Δ∑𝑎𝑘𝑛(𝑡)𝑓𝑘𝑛(𝑡)
𝑁
𝑛=1
, 0)
+ min(max(Q𝑘𝑟 (t) − Δ ⋅ 𝑓𝑘
𝑙(𝑡) 𝐽𝑘, 0), Δ∑𝑎𝑘𝑛(𝑡) 𝑅𝑘𝑛(𝑡)
𝑁
𝑛=1
)
where 𝑓𝑘𝑛(𝑡) is the CPU cycle frequency allocated by MEH 𝑛 to user 𝑘. Concerning
the power consumption of the mobile device, we consider it as the sum of the transmit
power 𝑝𝑘𝑛(𝑡) and the power consumption for local execution 𝑝𝑘𝑙 (𝑡) = 𝛾𝑘𝑓𝑘
𝑙(𝑡)3 ,
where 𝛾𝑘 is the effective switched capacitance of the CPU and 𝑓𝑘𝑙(𝑡) is the CPU cycles
frequency used in the 𝑡-th time slot. Our aim, is now to study an assignment strategy
coupled with a dynamic resource allocation to minimize the long-term power
consumption under queue stability constraints. More specifically, the problem can be
formulated as follows

Deliverable Horizon2020 EUJ-01-2016 723171 5G-MiEdge D2.4
Date: August 2018
Public Deliverable
5G-MiEdge Page 42
where 𝑃𝑘 is the maximum power budget of user 𝑘, 𝐹𝑘𝑙 is the maximum local CPU cycle
frequency, while 𝐹𝑛 is the maximum CPU cycle frequency of MEH 𝑛. Constraints
1) guarantees that the queues are mean rate stable
2) is relative to the feasible set of the transmit power
3) and 4) ensure that each user is allocated a portion of the bandwidth and that the
sum does not exceed the available bandwidth, respectively
5) ensures that each user gets a portion of the bandwidth of AP 𝑛 if and only if it is
associated to that AP
6) ensures that the local CPU cycle frequency is non negative and does not exceed its
maximum value, dictated by the device
7) forces the assignment variable to be binary
8) ensures that a user is associated to only one AP-MEH pair
9) ensures that the total number of CPU cycles performed in one slot by the MEH does
not exceed the maximum one, which is forced by its computation power. Note that we
are considering the case with a single core running tasks of all users. To solve this
problem, we build on Lyapunov optimization as in [MAO17], which leads to an
optimization strategy that solves a deterministic problem in each time slot. Indeed, our
approach is based on the Lyapunov function, which represents a scalar measure of the
queue congestion of the network (for more details, we referred to [NEE10]). In
particular, we will consider the minimization of the conditional Lyapunov drift, with a
penalty function used to control the power consumption.
Thus, given a system with 𝐾 users and current queue backlogs defined in (1), we can
define the Lyapunov function as

Deliverable Horizon2020 EUJ-01-2016 723171 5G-MiEdge D2.4
Date: August 2018
Public Deliverable
5G-MiEdge Page 43
𝐿(𝚯(𝑡)) =1
2∑[Q𝑘
𝑙 (𝑡)2 + Q𝑘𝑙 (t)2]
𝐾
𝑘=1
where
𝚯(𝐭) = (𝐐1(𝑡),… , 𝐐𝐾(𝑡))
We can now define the conditional Lyapunov drift as follows
Δ(𝚯(t)) ≜ 𝔼{𝐿(𝚯(t + 1)) − 𝐿(𝚯(t))|𝚯(t)}
where the expectation depends on the control policy, and is with respect to the random
channel states.
It can be shown that the Lyapunov drift has an upper bound that can be minimized in
each time slot, guaranteeing strong stability of the queues as far as the arrival rates are
within the capacity region. However, taking actions in this direction may result in an
unnecessary power consumption. Then, we now introduce a penalty function for the
power minimization plus queue stabilization. In particular, given the same queue
backlogs, we define the drift-plus-penalty function as follows
Δ𝑝(𝚯(t)) = Δ(𝚯(t)) + 𝑉 ⋅ 𝔼{𝑝(𝑡)|𝚯(t)}
where 𝑝(𝑡) is the power consumption and 𝑉 is a weighting parameter that represents
the trade-off between queue backlogs and power consumption. Due to Little’s law
[LIT61], this is equivalent to find a trade-off between power consumption and average
delay. In our particular case, it can be shown that Δ𝑝(𝚯(t)) is upper-bounded as
follows
where 𝐶 is a positive constant. Then, instead of minimizing the drift-plus-penalty
function in every time slot, we can minimize the upper bound, building on the
following result [NEE10]. Given a random variable 𝜔 with unknown distribution, a
control policy 𝜓 ∈ 𝛹𝜔 and a cost function 𝑐(𝜓, 𝜔), there is at least one action 𝜓𝜔min
that minimizes 𝑐(𝜓,𝜔) over all 𝜓 ∈ 𝛹𝜔 . Then, the control policy that minimizes
𝔼{𝑐(𝜓,𝜔)} is the one that observe 𝜔 and selects a minimizing action 𝜓𝜔min. Then,
problem can be solved by solving the following problem in each time slot

Deliverable Horizon2020 EUJ-01-2016 723171 5G-MiEdge D2.4
Date: August 2018
Public Deliverable
5G-MiEdge Page 44
where 𝜓(𝑡) = {{𝑝𝑘𝑛(𝑡)}𝑘,𝑛, {𝑓𝑘𝑙(𝑡)}
𝑘, {𝑓𝑘𝑛(𝑡)}𝑘,𝑛, {𝑎𝑘𝑛(𝑡)}𝑘,𝑛} , 𝛹𝜔(𝑡) is the feasible
set of control actions for problem 𝒫 , according to constraints 1) − 9) given the
random events 𝜔(𝑡) = {{𝐴𝑘(𝑡)}𝑘, {ℎ𝑘𝑛(𝑡)}𝑘,𝑛} . Since the problem including the
assignment is a mixed integer nonlinear programming (MINLP) problem, it is, in
general, NP-hard. To solve it, we use a low complexity algorithm based on matching
theory with transfers, showing to achieve good performance with respect to an SINR-
based association. Thus, we treat the assignment and the optimization problem
separately. First, we solve the assignment problem, and then we optimize resources in
each time slot for every set UE-AP-MEH. Before describing the proposed assignment
algorithm, it is useful to present the solution of problem 𝒫1 for a given AP, which can
be solved efficiently by splitting it into 3 sub-problems: local CPU cycle frequency
allocation, optimal bandwidth and power allocation, and remote optimal scheduling
[MAO17], [MDB18]. Denoting by 𝒮𝑛 the set of users associated to AP-MEH 𝑛, the
resource allocation is performed for each 𝒮𝑛, 𝑛 = 1,… ,𝑁.
3.3.2.1 First sub-problem: Optimal local CPU-cycle frequency allocation
For the optimal local CPU-cycle frequency allocation, it can be shown that the optimal
solution is the following
𝑓𝑘,opt𝑙 (𝑡) = min{𝐹𝑘
𝑙 , √𝑄𝑘𝑙 (𝑡) ⋅ Δ ⋅ 𝐽𝑘3𝛾𝑘𝑉
}, ∀ 𝑘 ∈ 𝒮𝑛
3.3.2.2 Second sub-problem: Optimal bandwidth and power allocation
Note that, as shown in [MAO17], only users with 𝑄𝑘𝑙 (𝑡) > 𝑄𝑘
𝑟(𝑡) will offload their
tasks. Intuitively, this happens because, if 𝑄𝑘𝑟(𝑡) ≥ 𝑄𝑘
𝑙 (𝑡), offloading tasks incurs in
transmit power consumption and greater execution delay. We denote by 𝒮′𝑛 the set of
users associated to AP-MEH 𝑛 during time slot 𝑡 , for which 𝑄𝑘𝑙 (𝑡) > 𝑄𝑘
𝑟(𝑡) . For
simplicity, in this scenario we consider the bandwidth as equally shared by all users so
that the bandwidth allocation for 𝒮𝑛 is given as follows
𝛼𝑘𝑛 = {
1
|𝒮′𝑛 |, if 𝑘 ∈ 𝒮′𝑛
0, 𝑜𝑡ℎ𝑒𝑟𝑤𝑖𝑠𝑒
Given the bandwidth allocation, the optimal power allocation is given as follows
𝑝𝑘𝑛(𝑡) =
{
min{𝛼𝑘𝑛𝐵max{
(𝑄𝑘𝑙 (𝑡) − 𝑄𝑘
𝑟(𝑡)) Δ
ln 2 ⋅ 𝑉−
𝑁0ℎ𝑘𝑛(𝑡)
, 0} , 𝑃𝑘 } , if 𝑘 ∈ 𝒮′𝑛
0, otherwise
3.3.2.3 Third sub-problem: Optimal scheduling
It can be shown that the optimal scheduling at the MEH is based on the following
solution: at each time slot, only one device will be scheduled and is the one with the
highest value 𝑄𝑘𝑟(𝑡) 𝐽𝑘 . Denoting by 𝑘𝑚𝑎𝑥 this device, we can write the optimal
scheduling as follows

Deliverable Horizon2020 EUJ-01-2016 723171 5G-MiEdge D2.4
Date: August 2018
Public Deliverable
5G-MiEdge Page 45
𝑓𝑘𝑛(𝑡) = {𝐹𝑛, if 𝑘 ∈ 𝒮𝑛 ∩ 𝑘 = 𝑘
𝑚𝑎𝑥
0, otherwise
Having described the optimal resource allocation strategy, we can now describe the
assignment process, which is based on the tools of Matching Theory [HAN17] (for
college admission), with a consequent coalitional game for college transfers. Matching
theory is a powerful tool to associate agents from to different sets with polynomial
complexity. In particular, the assignment problem is a many-to-one matching problem,
in which one agent from set (AP) can be associated to more than one agent from the
other set (UE). A typical example of this problem is the college admission process, in
which colleges accept a number of applicant students as far as they do not exceed the
maximum number, which is called quota in the context of matching theory. The aim is
to find a stable assignment. An assignment is called unstable if there are two applicants
𝛼 and 𝛽 who are assigned to colleges 𝐴 and 𝐵, respectively, although 𝛽 prefers 𝐴 to 𝐵
and 𝐴 prefers 𝛽 to 𝛼 [GAL62]. Gale and Shapley, in [GAL62], presented the Deferred
Acceptance algorithm for college admissions and stable marriages, which is proved to
converge to a stable matching in with polynomial complexity. The algorithm is based
on preference functions (utilities) of agents from both sets. For our algorithm, each
user builds a ranking of AP-MEH and vice versa. The application of matching theory
to wireless communications gained a lot of attention in the last years [HAN17]. In this
context, the main problem is the inter-dependence of preference functions, since
preferences a user are affected by preferences of other users, due to resource sharing.
As an example, the more users access an AP, the less radio resources are allocated to
each user. In this case, the problem of matching becomes complex and the deferred
acceptance algorithm is not sufficient to achieve good performance. For this reason,
we start building on the same strategy of [SAAD14] and [SMB18], in which the
assignment problem is split into two subgames: a deferred acceptance algorithm based
on potential preference function, and a transfer subgame in which users can request to
be transferred to improve their utilities. Then, the main task is to define the preference
functions used for the matching process. The first step is to perform the deferred
acceptance algorithm based on potential utilities. For this purpose, we use the expected
optimal value of objective function at each AP-MEH as preference functions. In
particular, during the first phase, users build their preferences assuming that all AP
accept all users as far as they do not exceed their maximum quota. Then, every user
computes the expected optimal value of the objective function of problem 𝒫1. More
specifically, let 𝐺𝑘𝑛∗ be the expected optimal value of the objective function of 𝒫1 for
user 𝑘 accessing the pair AP-MEH 𝑛. Then, each user ranks the pairs AP-MEH based
on the following utilities
𝑈𝑘𝑛 = −𝐺𝑘𝑛∗
Each AP builds its preference functions based on the highest SINR. Based on these
preference functions, the deferred acceptance algorithm is used to find the assignment.
The first phase leads to the creation of coalitions. A coalition 𝒞𝑛is the set of users
assigned to AP-MEH 𝑛, while the set of all coalitions is called partition. Since users
do not know preferences of other users, this solution can be unbalanced and can lead
to a situation in which many users are associated to a certain pair AP-MEH, thus
leading to shortage of resources. For this reason, a second phase in which users can
request to be transferred is performed. Indeed, with the assignment generated by the

Deliverable Horizon2020 EUJ-01-2016 723171 5G-MiEdge D2.4
Date: August 2018
Public Deliverable
5G-MiEdge Page 46
first phase, users have more information on which AP are more congested, and can
rebuild their expected utilities. Then, a user 𝑖 will request to be transferred if the
transfer improves its utility. We define the welfare of a coalition 𝒞𝑛, the sum of all
utilities of users in 𝒞𝑛
𝑊(𝒞𝑛) = ∑ 𝑈𝑘𝑛𝑘∈𝒞𝑛
Based on this definition, a transfer is accepted if and only if the following two
conditions hold:
1) The target AP-MEH 𝑛′ pair does not exceed its quota 𝑞𝑛′
2) The social welfare, defined as the sum of the welfares of the two coalitions, is
improved
The second condition can be formalized as follows
𝑊(𝒞𝑛\{𝑖}) +𝑊(𝒞𝑛′ ∪ {𝑖}) > 𝑊(𝒞𝑛) +𝑊(𝒞𝑛′)
This second subgame ends when there are no transfer requests or no more transfers are
accepted. This second phase, is proved to converge to a Nash stable partition, and its
output is the final assignment, denoted by 𝒮𝑛.
3.3.3 Numerical results
We now perform the assignment, coupled with resource allocation, in the scenario with
5 UE and 3 pairs AP-MEH, as depicted in Figure 3.3-1. With the blue arrows we show
the SNR-based association, by which every user is associated to its best mmWave AP
in terms of signal to noise ratio.
Figure 3.3-1 Scenario
We assume mmWave communications with path loss in dB between a generic user 𝑘
and AP 𝑛 given by

Deliverable Horizon2020 EUJ-01-2016 723171 5G-MiEdge D2.4
Date: August 2018
Public Deliverable
5G-MiEdge Page 47
where 𝑑𝑘𝑛 is the distance between the user and the AP, and 𝑑0 is the reference distance,
set to 5 m. We consider a MIMO system with 4 antennas at the UE side and 16 antennas
at the BS side, a bandwidth 𝐵 = 200 MHz, and a slot duration of 10 ms. A maximum
local and remote CPU cycle frequency of 109 and 3 × 10⁹ CPU cycles/s are assumed,
respectively. We run our evaluation over 5000 slots, averaging over the arrival
probabilities with 100 realizations. We show the performance of the proposed
matching algorithm when this is performed at each time slot, assuming a slot duration
of 10 ms. However, changing the association at every time slot means to transfer the
state of the application running in one MEH to another MEH, so it is a very complex
operation in real context. Then, to reduce the complexity, we show the performance
when the matching algorithm is used every 100, and 500 slots. Moreover, we compare
these results with the SNR-based association. The results are shown in terms of
average transmit power vs. the parameter 𝑉 and the average queue lengths vs. 𝑉. In
Figure 3.3-2 we show the average queue length vs. the parameter 𝑉. Note that, as 𝑉
increases, the average queue length increases as well, since it is more important to keep
the power consumption limited. Indeed, the drift-plus-penalty algorithm reaches the
optimal power consumption for high 𝑉. This can be seen in Figure 3.3-3, where the
average power consumption is plotted vs. 𝑉, showing its optimal values for the highest
values of 𝑉 . Note that, for such values, the long-term average power consumption
reaches the optimal value while stabilizing the queues. We can also note that using the
strategy of optimizing the association every 100 times slots achieve results close to the
ones in which the association is changed in each time slot. This suggest that this lower
complexity strategy can be used without degrading performance. Other strategies
achieve degraded but much better performance than the SNR-based association.
Figure 3.3-2 Average queue length power consumption vs. V

Deliverable Horizon2020 EUJ-01-2016 723171 5G-MiEdge D2.4
Date: August 2018
Public Deliverable
5G-MiEdge Page 48
Figure 3.3-3 Long-term average power cosnumption vs. V

Deliverable Horizon2020 EUJ-01-2016 723171 5G-MiEdge D2.4
Date: August 2018
Public Deliverable
5G-MiEdge Page 49
4 Mesh backhaul prototyping
The final goal of this project is to verify the developed ideas and concepts in large field
trials, based on the five scenarios we developed and constantly refined in the first
period of this project and concluded in our deliverable D1.3 [D1.3].
In the previous sections, we selected three of those scenarios and explained details on
the architecture and specifications, the following passage will briefly summarize the
requirements and conclude what features the mesh backhaul prototype nodes need to
provide.
Omotenashi services
This scenario requires high data rates in an area with dense deployment and many users.
We need to deploy a large number of nodes and have them create a reliable and fast
backhaul network. The nodes need to support caching and prefetching of content.
Dynamic crowd
In this scenario, a large number of users will move throughout the deployed network.
This requires flexible data rates, reconfiguration of routes and, if possible, even the
topology. Controlling power states of the nodes will further increase the efficiency of
the deployed network. Caching and prefetching are necessary, controlled by algorithms
predicting the movement of users.
Autonomous driving
Vehicles send large amounts of raw sensor data to the roadside units, where the data is
processed, added to the existing HD maps and distributed to all vehicles in the area.
This requires high data rates, very low latency and edge computing on the nodes.
Requirements on the nodes
When taking care of those requirements, the prototype nodes need:
Data rates of multiple Gbps
Latency below 1 ms
Range of over 200 m
Reduced interference in dense deployments
Multi-Access edge computing
Power saving
Central orchestration
For this, we are developing a testbed. It uses an architecture like the one shown in
Figure 3.3-1 and is based on two key technologies in this project, i.e. MmWave
communication and edge computing.
The testbed architecture consists of multiple nodes in a meshed topology. Each node
is equipped with several mmWave interfaces using BF arrays, and selected nodes
feature edge cloud functionality. A SDN controller, via OpenFlow over a separate
control channel, centrally orchestrates the whole system, incorporating the developed
concept of splitting control and user-plane.
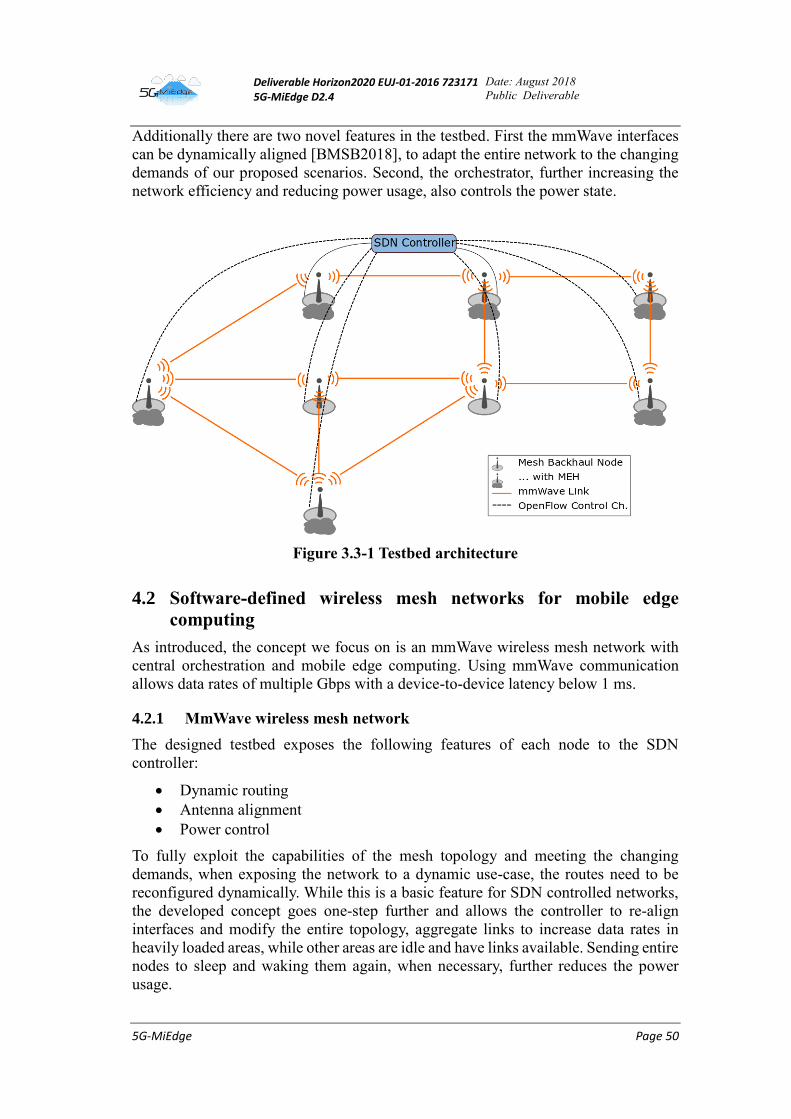
Deliverable Horizon2020 EUJ-01-2016 723171 5G-MiEdge D2.4
Date: August 2018
Public Deliverable
5G-MiEdge Page 50
Additionally there are two novel features in the testbed. First the mmWave interfaces
can be dynamically aligned [BMSB2018], to adapt the entire network to the changing
demands of our proposed scenarios. Second, the orchestrator, further increasing the
network efficiency and reducing power usage, also controls the power state.
Figure 3.3-1 Testbed architecture
4.2 Software-defined wireless mesh networks for mobile edge
computing
As introduced, the concept we focus on is an mmWave wireless mesh network with
central orchestration and mobile edge computing. Using mmWave communication
allows data rates of multiple Gbps with a device-to-device latency below 1 ms.
4.2.1 MmWave wireless mesh network
The designed testbed exposes the following features of each node to the SDN
controller:
Dynamic routing
Antenna alignment
Power control
To fully exploit the capabilities of the mesh topology and meeting the changing
demands, when exposing the network to a dynamic use-case, the routes need to be
reconfigured dynamically. While this is a basic feature for SDN controlled networks,
the developed concept goes one-step further and allows the controller to re-align
interfaces and modify the entire topology, aggregate links to increase data rates in
heavily loaded areas, while other areas are idle and have links available. Sending entire
nodes to sleep and waking them again, when necessary, further reduces the power
usage.

Deliverable Horizon2020 EUJ-01-2016 723171 5G-MiEdge D2.4
Date: August 2018
Public Deliverable
5G-MiEdge Page 51
4.2.2 Multi-Access edge computing
Our second 5G-MiEdge technology, multi-access edge computing, is used to
cache/pre-fetch content and execute tasks at the closest MEH. Caching/prefetching can
drastically reduce the load on the core network and increase the responsiveness for the
UE requesting content. Edge computing reduces the load on the UE while also offering
a very low latency in contrast to offloading tasks to computation centers.
In the designed testbed, there will be multiple MEHs available, so the SDN controller
can dynamically assign jobs to the different MEHs and migrate them from one to
another, when the MEHs are loaded or the UE moves through the area.
4.3 Node prototyping
In order to meet those demands, we designed prototypes of the mesh backhaul nodes.
The following sections will first present two different prototype designs and
specifications of the internal hardware components.
4.3.1 Prototype designs
A first design is displayed in Figure 4.3-1; it shows the rendering of a mesh backhaul
node that can be mounted on a pole. On the left side, a regular rendering is presented;
the rendering on the right side has transparent walls to allow a closer look on the
internal hardware components. This design consists of three compartments for
movable mmWave links that are stacked on top of each other. It offers great flexibility
for the node location, e.g. on streetlights or temporary posts for large area outdoor
installations. The first design does not yet include a computation device for edge cloud
functionality; it is a pure backhaul node.
Our second design, shown in Figure 4.3-2 shows an enhanced version, based on the
same initial design. Like in the last figure, there is a transparent rendering on the right
side and in addition to the two compartments for movable mmWave links, this node
has a dedicated compartment for a computation device. This design shows a wall-
Figure 4.3-1 Pole-mounted mesh backhaul node

Deliverable Horizon2020 EUJ-01-2016 723171 5G-MiEdge D2.4
Date: August 2018
Public Deliverable
5G-MiEdge Page 52
mounted node, which allows mounting on existing infrastructure, greatly increasing
the number of possible deployment locations.
4.3.2 Movable mmWave antenna
For the required link range, the used mmWave frontends need to be equipped with
reflect arrays. These arrays offer a reduced beam with of just 6°. This does not only
greatly reduce the interference on other nodes in the close vicinity, it also results in a
gain of 26 dBi, allowing a link range of over 200 meters.
With the reflect array and the narrow beam, the links need to be aligned towards the
target node. In the prototype, this is achieved with a mount that can be rotated by 360°
horizontally and 30° vertically. Allowing the mmWave link to be aligned to any other
station within the link range.
These prototypes are already being used in the testbeds in Berlin and Tokyo, preparing
for outdoor deployments and extensive field trials.
4.3.3 Computation device
As some of the nodes will act as mobile edge host, they need to be equipped with a
computation device. In real-world deployments, this device has to be very powerful
and equipped with a large storage.
For testbeds and evaluations, the constraints are a little less restrictive, therefore Intel
NUC devices were chosen. They offer a perfect compromise between size, power
usage and computation power, storage capabilities. The bottom compartment in Figure
4.3-2 is specifically designed for this device.
Figure 4.3-2 Wall-mounted mesh backhaul node

Deliverable Horizon2020 EUJ-01-2016 723171 5G-MiEdge D2.4
Date: August 2018
Public Deliverable
5G-MiEdge Page 53
4.3.4 Next steps
This section is all about planning and designing the backhaul nodes. Work package 4
will use this research and implement those designs, develop the testbed and evaluate
it on the selected scenarios.
This task is already running and the upcoming deliverable D4.2 will contain final
designs, details on implementation and evaluation results.

Deliverable Horizon2020 EUJ-01-2016 723171 5G-MiEdge D2.4
Date: August 2018
Public Deliverable
5G-MiEdge Page 54
5 Summary
This deliverable D2.4 belongs to WP2, which runs from month 4 to 30 of the 36-month
lifetime of 5G-MiEdge and is in charge of mmWave edge cloud for 5G RAN
deployments.
Up to now, WP2 has released two deliverables:
D2.1 Requirement and scenario definition for mmWave access, antennas and
area planning for mmWave edge cloud (June 2017)
D2.3 Design of mmWave antennas for 5G enabled stadium (June 2018)
In this deliverable, we have finalized our methods of site specific deployment of
mmWave edge cloud. First, we explained the specific requirements of three selected
scenarios:
Omotenashi services
Dynamic crowd
Autonomous driving
This includes all the constraints for the deployment of an mmWave mesh backhaul
network for future testing and performance evaluations on the designed scenarios.
Then the design and analysis for site specific deployment of mmWave edge cloud are
presented:
Modeling and optimization of multi RAT HetNet
Interference management in mesh backhaul networks
Dynamic resource allocation, considering the best trade-off between queues
and power consumption
The last section contains the concepts and designs for mesh backhaul prototyping,
taking care of all the carefully calculated requirements in the designed scenarios.
With the results from this deliverable, we developed a solid base for the WP4 task of
designing, implementing and deploying a 5G-MiEdge testbed. It will consist on a
centrally orchestrated mmWave mesh backhaul network, with C/U split and mmWave
access.
More details on mmWave access will be presented in the upcoming deliverable D2.2,
planned to be finalized in December 2018.

Deliverable Horizon2020 EUJ-01-2016 723171 5G-MiEdge D2.4
Date: August 2018
Public Deliverable
5G-MiEdge Page 55
6 References
[5GPPPWP AV] 5GPPP White Paper, “5G automotive vision,” Oct. 2015
[Ang13] A. D. Angelica, “Google’s self-driving car gathers nearly 1GB/sec,” May
2014. Available online: http://www.kurzweilai.net/googles-self-driving-car-
gathers-nearly-1-gbsec
[BAR17] S. Barbarossa, E. Ceci, M. Merluzzi and E. Calvanese-Strinati, "Enabling
effective Mobile Edge Computing using millimeterwave links," 2017 IEEE
International Conference on Communications Workshops (ICC Workshops),
Paris, 2017, pp. 367-372.
[BMSB2018] K. Koslowski et al, “SDN Orchestration to Optimize meshed Millimeter-
Wave Backhaul Networks for MEC enhanced eMBB use cases”, BMSB 2018
[CVG16] J. Choi, V. Va, N. Gonzalez-Prelcic, R. Daniels, C. R. Bhat, R. W. Heath,
“Millimeter-wave vehicular communication to support massive automotive
sensing,” IEEE Commun. Mag., vol. 54, no. 12, pp. 160-167, Dec. 2016.
(Same with CVG16)
[D1.1] 5G-MiEdge deliverable D1.1, “Use Cases and Scenario Definition”, Available
online at: http://5g-miedge.eu.
[D1.3] 5G-MiEdge Deliverable D1.3, “System Architecture and Requirements”,
Available online at: http://5g-miedge.eu.
[D2.1] 5G-MiEdge Deliverable D2.1, “Requirement and scenario definition for
mmWave access, antenna and area planning for mmWave edge cloud”,
Available online at: http://5g-miedge.eu.
[Elshaer2016] H. Elshaer, M. N. Kulkarni, F. Boccardi, J. G. Andrews, and M. Dohler,
“Downlink and uplink cell association with traditional macrocells and
millimeter wave small cells,” IEEE Trans. Wireless Commun., vol. 15, no. 9,
pp. 6244–6258, Sep. 2016.
[GAL62] D. Gale and L. S. Shapley, “College Admissions and the Stability of
Marriage”, Mathematical Association of America
[Ghatak2018] G. Ghatak, A. De Domenico, M. Coupechoux, Coverage Analysis and Load
Balancing in HetNets with mmWave Multi-RAT Small Cells, in IEEE
Transactions on Wireless Communications, vol. 17, no. 5, pp. 3154-3169,
May 2018. doi: 10.1109/TWC.2018.2807426
[HAN17] Zhu Han, Yunan Gu, and Walid Saad. 2017. Matching Theory for Wireless
Networks (1st ed.). Springer Publishing Company, Incorporated.
[HFL15] L. Hobert, A. Festag, I. Llatser, L. Altomare, F. Visintainer, A. Kovacs,
“Enhancements of V2X Communication in Support of Cooperative
Autonomous Driving,” IEEE Commun. Mag., vol.53, no.12, pp.64-70, Dec.
2015.
[KQC15] S.W. Kim, B. Qin, Z. J. Chong, X. Shen, W. Liu, M H. Ang, E. Frazzoli, D.
Rus, “Multivehcle cooperative driving using cooperative perception: design
and experimental validation,” IEEE Trans. Intel. Transpor. Systems, vol. 16,
no. 2, pp. 663-680, Apr. 2015.
[KS17] K. Sakaguchi et al., "Where, When, and How mmWave is Used in 5G and
Beyond," IEICE Trans. Electron., vol. E100–C, no. 10, pp. 790-808 Oct. 2017.
(Invited)

Deliverable Horizon2020 EUJ-01-2016 723171 5G-MiEdge D2.4
Date: August 2018
Public Deliverable
5G-MiEdge Page 56
[LIT61] Little J.D.C, "A proof of the queueing formula: L=λW,
Operations research, 9, pp. 383-387
[MAO17] Y. Mao, J. Zhang, S. H. Song and K. B. Letaief, "Stochastic Joint Radio and
Computational Resource Management for Multi-User Mobile-Edge
Computing Systems," in IEEE Transactions on Wireless Communications,
vol. 16, no. 9, pp. 5994-6009, Sept. 2017.
[MiWEBA
AR10.1]
The first annual report of MiWEBA, 2014.
[MiWEBA D5.1] Channel Modeling and Characterization
[MiWEBA D5.2] Development of highly-directional steerable mm-wave antennas concept
[MiWEBA D5.3] Highly-directional steerable mm-wave antennas prototype
[MiWEBA D5.4] Development of beam steering techniques for highly directional steerable
mm-wave antennas
[NEE10] M. J. Neely, “Stochastic network optimization with application to
communication and queueing systems”, Synth. Lect. on Comm. Netw.s, vol.
3, no. 1, pp. 1–211, 2010.
[SAAD14] W. Saad, Z. Han, R. Zheng, M. Debbah and H. V. Poor, "A college admissions
game for uplink user association in wireless small cell networks," IEEE
INFOCOM 2014 - IEEE Conference on Computer Communications, Toronto,
ON, 2014, pp. 1096-1104.
[SAE] SAE International, “Automated Driving Levels of Drigning Automation are
defined in New SAE International Standard J3016”
https://www.sae.org/misc/pdfs/automated_driving.pdf
[SH16] Heiko G. Seif, Xiaolong Hu, “Autonomous Driving in the iCity – HD Maps
as a Key Challenge of the Automotive Industry,” ELSEVIER, Engineering,
pp.159-162, June 2016.
[MTN17] M. Kobayashi, T. Urushihara, N. Shirakata, K. Takinami, "Cooperative
WiGig/Wi-Fi Multi-User Content Delivery System with Application-Centric
Connection Management", SmartCom 2017.
[SMB18] S. Sardellitti, M. Merluzzi, S. Barbarossa, “Optimal association of mobile
users to multi-access edge computing resources”, 2018 International
Conference on Communications (ICC), Kansas City, USA, 2018, pp. 1-6
[TR22.885] 3GPP TR22.885, Study on LTE support for vehicle to everything (V2X)
services, V14.0.0, Dec. 2015.
[TR22.886] 3GPP TR22.886, Study on enhancement of 3GPP support for 5G V2X
services, V15.0.0, Dec. 2016.
[TR23.703] 3GPP TR23.703 V12.0.0, “Study on architecture enhancements to support
Proximity-based Services (ProSe),” Feb. 2014.
[TS23.303] 3GPP TS23.303, Proximity-based services (ProSe); Stage 2

Deliverable Horizon2020 EUJ-01-2016 723171 5G-MiEdge D2.4
Date: August 2018
Public Deliverable
5G-MiEdge Page 57
[VSB16] V.Va, T. Shimizu, G. Bansal, and R. W. Heath Jr., “Millimeter Wave Vehicular
Communications: A Survey,” Foundations and Trends® in Networking,
vol.10, no.1, pp.1-113, June 2016.