52nd annual report 2010 - 2011 · annual report 2010 - 2011annualreport 2010 - 2011 the board has...
TRANSCRIPT

NESCO IT PARKNESCO IT PARK
BO
MB
AY
CONV
ENTIO
N
&EXH
IBIT
ION CENTRE
BO
MB
AY
CONV
ENTIO
N
&EXH
IBIT
ION CENTRE
IN
DABRAT
O
R
IN
DABRAT
O
R
52nd Annual Report
2010 - 2011

founder


NESCO IT PARK
IT BUILDING 3

Annual Report 2010 - 2011Annual Report 2010 - 2011
01
NOTICE
The 52nd annual general meeting of Nesco Limited will be held at the registered office of the Company at Nesco Complex, Western
Express Highway, Goregaon (E), Mumbai-400 063 on Friday, 12August 2011 at 3.30 p.m. to transact the following business:
To receive, consider and adopt the audited balance sheet as at 31 March 2011 and the profit and loss account for the year as
on that date together with the report of the Board of Directors and auditors thereon.
To declare dividend on equity shares.
To appoint a director in place of Mr. Mahendra K Chouhan who retires by rotation & being eligible offers himself for re-
appointment.
To appoint a director in place of Mr. Mohan P Parikh, who retires by rotation & being eligible offers himself for re-appointment.
To appointAuditors to hold office from the conclusion of this meeting until the conclusion of the next annual general meeting &
to fix their remuneration.
Nesco Complex,
W. E. Highway, Goregaon (East),
Mumbai 400 063
1. AMEMBER ENTITLED TOATTENDAND VOTEAT THE MEETING IS ENTITILED TOAPPOINTAPROXY TOATTENDAND
VOTE INSTEAD OF HIMSELFAND THE PROXY NEED NOT BEAMEMBER OF THE COMPANY.
2. The instrument of proxy, duly completed, should be lodged at the registered office of the Company not less than forty-eight
hours before the commencement of the annual general meeting.
3. The register of members and share transfer book of the Company will remain closed from 05 August 2011 to 12 August 2011
(both days inclusive).
4. All correspondence regarding shares of the Company should be addressed to the Company's Registrar and TransferAgents,
Sharex Dynamic (India) Pvt. Ltd. at Unit No. 1, Luthra Ind. Premises,Andheri Kurla Road, Safed Pool,
Andheri (East), Mumbai 400 072.
5. Members are requested to bring their copy of the annual report to the meeting.
ORDINARY BUSINESS:
1.
2.
3.
4.
5.
Mumbai, 27 May 2011 By order of the Board of Directors
Sumant Patel
Chairman & Managing Director
NOTES:
(Unit: Nesco Limited)

02
ANNEXURE TO THE NOTICE
Details of Directors seeking reappointment at the forthcoming Annual General Meeting pursuant to Clause 49 of the Listing
Agreement
Name of the Director
Date of birth
Date of appointment
Qualification
Directorship held in Indian publicCompanies as on 31.03.2011
Committee positions held in Indian publicCompanies as on 31.03.2011
Number of shares held in the Company
Mr. Mohan Parikh
10.05.1937
01.07.1998
B. A., LL. B., FCS
N. A.
N. A.
NIL
Mr. Mahendra K Chouhan
05.12.1955
19.04.2005
B Sc., MBA(Finance)
01
NIL
NIL
Annual Report 2010 - 2011Annual Report 2010 - 2011

03
Directors' Report
Financial Results :1.
Your Directors have pleasure in presenting their annual report with the audited statement of accounts for the year ended 31 March 2011.
Income
Profit before tax
Provision for tax
Net Profit
Balance brought forward
Amount available for appropriations
Appropriations:
i) Dividend
ii) Tax on Proposed Dividend
iii) Transfer to General Reserve
Surplus carried forward to Profit & Loss Account
2010 - 11
Rs.
1,448,689,517
1,001,168,289
315,000,000
686,242,602
5,000,000
691,242,602
35,229,980
5,851,347
632,836,771
5,000,000
2009 - 10
Rs.
1,198,196,927
787,277,164
225,000,000
550,084,657
5,000,000
554,767,877
10,568,994
1,755,510
537,443,373
5,000,000
2. Dividend:
Year in Retrospect:
Divisional Performance:
Bombay Convention & Exhibition Centre:
Nesco IT Park and Realty Division:
Your Directors are pleased to recommend a dividend of 25% (15% previous year) on the increased capital of 14,091,992
equity shares after issue of 1:1 bonus shares last year. This would involve a cash outflow of Rs.41,081,327 inclusive of
dividend tax.
It is our Company's policy to pay dividends which can be sustained in the years to come, while considering the Company's goal
to finance its expansion plans from internal funds as far as possible.
3.
During the year Company achieved a turnover of Rs.1,448,689,517 as compared to Rs.1,198,196,927 in previous year,
an increase of 21%. The PBT was Rs. 1,001,168,289 as compared to Rs. 787,277,164 in previous year, an increase of 27%.
Earnings per share amounted to Rs.49 on doubled equity capital after issue of bonus shares (previous year Rs.78). The
Company's reserves increased from Rs.1,574,900,517 to Rs.2,127,062,258.
During the year, the Company paid an amount of Rs. 372,643,007 by way of various taxes and duties.
a)
Bombay Convention & Exhibition Centre income was Rs.656,229,418 compared to Rs.540,429,225 in the previous year, an
increase of 21%.
Over 105 conventions & exhibitions were held in our Centre.
During the year, the Company spent Rs.48,528,217 (previous year Rs.42,869,185) on capital expenses, repairs,
modernization and upgradation of the four convention & exhibition centre halls covering an area of over 4,50,000 sq. ft.
b)
Income from IT Park and Realty Division increased from Rs.229,549,115 to Rs.516,168,392.
As regards IT Building no.3 admeasuring about 800,000 sq., construction work is completed and internal finishing work is
going on. So far the Company has incurred capital expenditure of Rs.788,942,710 on this project.
Annual Report 2010 - 2011Annual Report 2010 - 2011

04
c)
In the year under review, the Industrial Capital Goods segment did not pick up as was expected but in fact showed negative
growth in the country as many corporates deferred their plans for capital investment. Besides, several customers could not
take delivery of equipment ordered by them. As a result, income was Rs.168,210,331 as compared to Rs.248,305,826 in
previous year.
d)
Income from investments and other income was Rs.108,081,376 (previous year Rs.179,912,761). Due to economic slow
down in 2008-09, the interest rates had reduced significantly. As most of the Company's investments are in debt funds, the
income was lower, at Rs. 70,928,951 (previous year Rs. 103,043,900) even though the amount invested was higher.
Your Company had no debt as on 31 March 2011. Company's liquid resources (FDs, FMPs, MFs, cash & bank balances)
increased by 24% to Rs.1,687,436,427 from Rs.1,358,883,404. General reserves increased from Rs.1,574,900,517 to
Rs.2,136,765,184.
Your Company has neither accepted any deposits from the public during the year nor are any deposits outstanding for
repayment.
a. Bombay Convention & Exhibition Centre, the largest centre in India in the private sector, has become the most popular venue
for conventions & exhibitions, with all world leading organizers holding their events in our centre. Its space utilization is better
than world average. The Company is in the process of finalizing its expansion plans for which a world leading American
architect firm has been appointed. Our Company hopes to start construction of the first new convention & exhibition hall
before the end of this financial year. We expect our Convention & Exhibition Centre revenues to grow in 2011-12.
b. Nesco IT Park's third building is nearing completion: construction work is over, internal finishing is now in progress. Company
expects some revenues from IT building 3 in 2011-12 and full occupancy in 2012-13. A leading American architect firm has
been appointed for subsequent IT buildings, designs for IT building 4 are under finalization. We expect to start work on IT
building 4 by December 2011.
c. In a slowdown, capital goods are the first to be affected and last to pick up. This segment is now showing positive trend, inflow
of orders is increasing, the Company expects good growth in 2011-12 in its Indabrator Division.
d. Now that interest rates are going up, our Investment income is likely to be higher than previous year.
Your Company recognizes its role in health and safety, as well as its responsibility towards environment and society. Infactyour Company's goal are: no accidents, no harm to people and no damage to environment. The health and medical servicesare accessible to all employees through well equipped occupational health centers at all manufacturing facilities. Safety andsecurity of personnel, assets and environmental protection are also on top of the agenda of the Company at its manufacturingfacilities.
Indabrator - Industrial Capital Goods Group:
Income from Investments:
Finance:
4. Management Discussion andAnalysis:
5. Internal Control Systems:
6. Safety, Health and Environment:
Your Company has well laid out policies on financial reporting, asset management, adherence to Management policies and
also on promoting compliance of ethical and well defined standards. The Company also follows an exhaustive budgetary
control and standard costing system. Moreover, the management team regularly meets to monitor expectations and budgeted
results and scrutinizes reasons for deviations in order to take necessary corrective steps. TheAudit Committee which meets at
regular intervals also reviews the internal control systems with the Management and the InternalAuditors. The internal audit is
conducted at various locations of the Company and covers all the key areas. All audit observations and follow up actions are
discussed with the Management as also the StatutoryAuditors and theAudit Committee reviews them regularly.
Annual Report 2010 - 2011Annual Report 2010 - 2011

05
Annual Report 2010 - 2011Annual Report 2010 - 2011
Clean environment and sustainable development integrated with the business objective is the focus of operations of theCompany. The projects and activities are planned and designed with environment protection as an integral part to ensure asafe and clean environment for sustainable development.
:Mr. Mahendra K Chouhan and Mr. Mohan P Parikh retire by rotation at the ensuing annual general meeting and being eligibleoffer themselves for reappointment. The profile of the Directors to be reappointed at the annual general meeting is given in theannexure to the notice. There are no other changes in the Board of Directors of the Company.
Pursuant to Section 217 (2AA) of the Companies (Amendment) Act, 2000, your Directors confirm that to the best of theirknowledge and belief and according to the information and explanations available to them
(i) In the preparation of the annual accounts the applicable accounting standards have been followed.
ii) Appropriate accounting policies have been selected and supplied consistently and have made judgments that are reasonableand prudent so as to give a true and fair view of the state of affairs of the Company as at 31.03.2011 and of the profit of theCompany for the year ended on that date;
(iii) Proper and sufficient care has been taken for the maintenance of adequate accounting records in accordance with theprovisions of Companies Act, 1956, for safeguarding the assets of the Company and for preventing and detecting fraud andother irregularities.
(iv) The annual accounts have been prepared ongoing concern basis.
As required by Clause 49 of the listing agreement of stock exchange, a report on corporate governance and a certificate fromM/s. Shah & Co., Chartered Accountants confirming compliance with requirement of corporate governance are given in anannexure which forms part of this report
Nesco group continued to increase its activities in the rural social sector. In the education field, after setting up an Englishmedium school in a village, further assistance is being given to upgrade and expand this school. Proposal is underconsideration to impart training in entrepreneurship. Students from needy families are being given scholarships. In the healthfield, our Company assisted hospitals and health projects. Our CSR group monitors these activities.
7. Directors
8. Directors' Responsibility Statement:
9. Corporate Governance:
10. Corporate Social Responsibility:
For and on behalf of the Board of Directors
Sumant J. PatelMumbai, Chairman & Managing Director
11. Auditors:
12. Conversion of energy, technology absorption, foreign exchange earning and outgo:
13. Particulars of Employees :
14. Acknowledgment:
27 May 2011
Shah & Co., Chartered Accountants, retire as auditors of the Company on the conclusion of the ensuing Annual GeneralMeeting and being eligible offer themselves for reappointment. The members are requested to appoint auditors for the currentyear and fix their remuneration.
The Company is undertaking the necessary energy conservation activities in accordance with the provisions of Section 217(1)(e) of the Companies Act, 1956 read with Companies (Disclosure of particulars in the report of the Board of Directors) Rules1988.
As required under sub-section (2A) of Section 217 of the CompaniesAct, 1956 read with Companies (particular of employees)Rules, 1975, the name and other particulars are set out in the Schedule 13 note 11A(a)
The Directors thank for the support received from the shareholders, customers, vendors and bankers.The Directors also thank all members of the Nesco team for their valuable contribution.

06
Annual Report 2010 - 2011Annual Report 2010 - 2011
REPORT ON CORPORATE GOVERNANCE
Board of Directors:2.
1.
The Company's endeavour is to maximize shareholder value. Nesco is committed to adopt the best governance practices andits adherence in true spirit at all times. It has strong legacy of fair, transparent and ethical governance practices.
The Company has adopted a code of conduct which is applicable to all employees and is posted on the website of theCompany. The Company also has in place a code for preventing insider trading.
The Company is fully compliant with the requirements of the listing agreements and applicable corporate governance normsand is committed to ensuring compliance with all modifications within the prescribed time.
The present strength of the Board of Directors is eight. The Board comprises of the Managing, Joint Managing and Executive
Directors. There are five non executive, independent Directors.
The day to day management is conducted by the Managing Director of the Company subject to superintendence, control anddirection of the Board of Directors.
The details of composition of the Board and summary of other Directorships and Board Committee Memberships of each ofthe Directors as on 31 March 2011 are as follows:
Company's Philosophy on Corporate Governance:
No. of outsideDirectorship inPublic LimitedCompanies *
Membershipheld in
Committee ofDirectors #
Chairmanshipheld in
Committee ofDirectors ##
Name of the DirectorExecutive/Non Executive/
Independent /Alternate
Dr. Ram S. Tarneja Non Executive & Independent 11 06 03
Mr. Bharat V. Patel Non Executive & Independent 03 03 01
Mrs. Sudha S. Patel Promoter / Executive ---- ---- ----
Mr. Mohan Parikh Non Executive & Independent ---- ---- ----
Mr. K. S. Srinivasa Murty Non Executive & Independent ---- ---- ----
Mr. Krishna S Patel Promoter / Executive ---- ---- ----
Mr. Mahendra K. Chouhan Non Executive & Independent ---- ---- ----
Mr. Sumant J. Patel Promoter / Executive ---- ---- ----
* This excludes directorship held in private companies, foreign companies, companies formed under section 25 of the
CompaniesAct, 1956 and directorship held as an alternate director.
# Committee of Directors includes Audit Committee, Shareholders / Investors Grievance Committee and Remuneration
Committee of Directors only.
## This does not include Membership / Chairmanship in Committee of Directors of Nesco Limited

Annual Report 2010 - 2011Annual Report 2010 - 2011

Annual Report 2010 - 2011Annual Report 2010 - 2011

Annual Report 2010 - 2011Annual Report 2010 - 2011

Annual Report 2010 - 2011Annual Report 2010 - 2011
11
Annual Report 2010 - 2011Annual Report 2010 - 2011
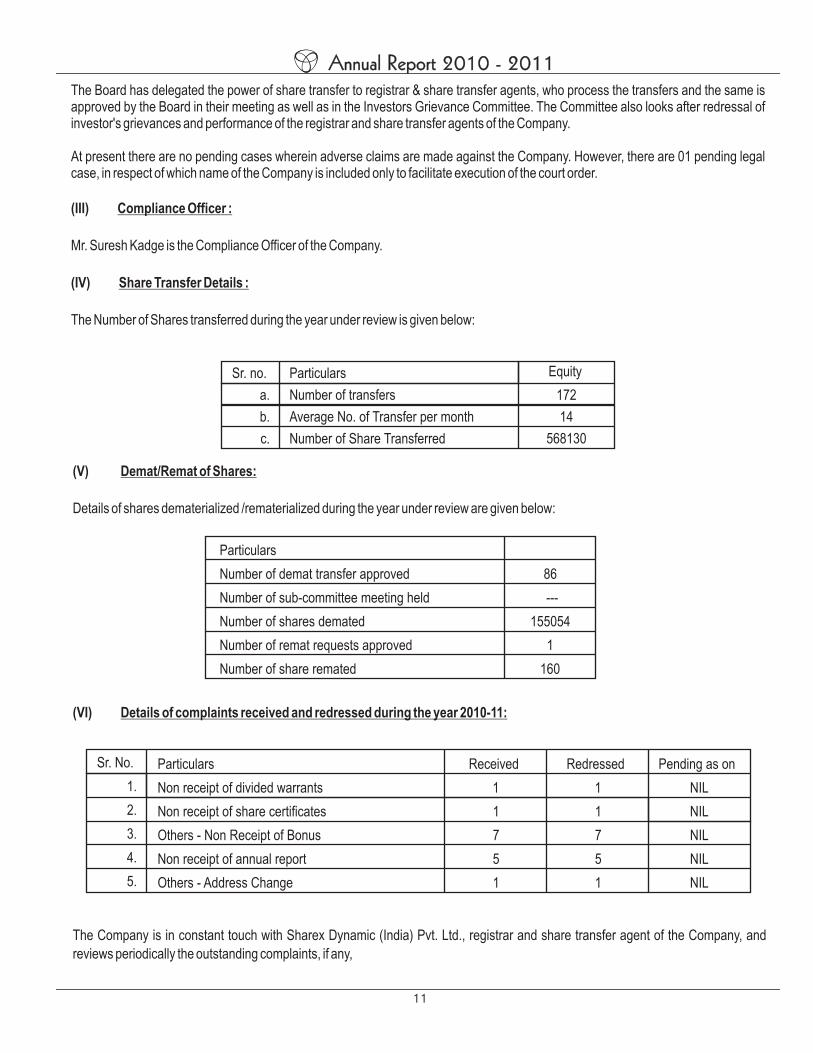
The Board has delegated the power of share transfer to registrar & share transfer agents, who process the transfers and the same isapproved by the Board in their meeting as well as in the Investors Grievance Committee. The Committee also looks after redressal ofinvestor's grievances and performance of the registrar and share transfer agents of the Company.
At present there are no pending cases wherein adverse claims are made against the Company. However, there are 01 pending legalcase, in respect of which name of the Company is included only to facilitate execution of the court order.
The Number of Shares transferred during the year under review is given below:
(III)
(IV)
Compliance Officer :
Share Transfer Details :
Mr. Suresh Kadge is the Compliance Officer of the Company.
(V)
(VI)
Demat/Remat of Shares:
Details of complaints received and redressed during the year 2010-11:
Details of shares dematerialized /rematerialized during the year under review are given below:
The Company is in constant touch with Sharex Dynamic (India) Pvt. Ltd., registrar and share transfer agent of the Company, and
reviews periodically the outstanding complaints, if any,
Particulars
Number of demat transfer approved 86
Number of sub-committee meeting held ---
Number of shares demated 155054
Number of remat requests approved 1
Number of share remated 160
Particulars ReceivedSr. No. Redressed Pending as on
Non receipt of divided warrants 1 11. NIL
NIL
NIL
NIL
NIL
Non receipt of share certificates 1 12.
Others - Non Receipt of Bonus 7 73.
Non receipt of annual report
Others - Address Change
5
1
5
1
4.
5.
Equity
172
14
568130
Sr. no. Particulars
a. Number of transfers
b. Average No. of Transfer per month
c. Number of Share Transferred

12
Annual Report 2010 - 2011Annual Report 2010 - 2011
4. General Body Meetings:
5. Disclosures :
Details of location, time and date of last threeAnnual General Meetings of the Company:
6. CEO/CFO Certification :
7. Means of Communication :
8. General Shareholders information :
The Chairman and Managing Director and Vice President have certified to the Board of Directors compliance in respect of all matters
specified in sub-clause V of the ListingAgreement.
The Company regularly intimates unaudited as well as audited financial results to the Stock Exchange as soon as these are taken on
record / approved. These financial results are published in dailies having wide circulation. The results are also displayed on the website
of the Company - www.nesco.in
There are no materially significant related party transactions i.e. transactions of the Company of a material nature, with its promoters,
the directors or the management, their subsidiaries or relatives, etc. that may have potential conflict with the interests of the Company at
large.
The Audit committee was briefed of the related party transactions undertaken by the Company in the ordinary course of the business,
material individual transactions which were not in the normal course of business and material individual transactions with related
parties or others which were not on arm's length basis together with the Management's justification for the same.
There are no penalties or strictures imposed on the Company by the Stock Exchange or SEBI or any statutory authorities for non
compliance by the Company or on any other matter related to capital markets, during last three years.
The 52 Annual General Meeting will be held onFriday, 12 August 2011 at 3.30 p.m. at NescoComplex, W. E. Highway, Goregaon (E), Mumbai400063
nd
Financial Calendar for 2011-2012
Financial Year:
1stApril, 2011 to 31st March, 2012
First Quarterly Result:
On or before 14thAugust 2011
Annual General Meeting
Financial Calendar
1.
2.
Year
2009-2010
2007-2008
2008-2009
AGM
51st
49th
50th
Location
Nesco Complex, W. E. Highway, Goregaon (E), Mumbai
Nesco Complex, W. E. Highway, Goregaon (E), Mumbai
Nesco Complex, W. E. Highway, Goregaon (E), Mumbai
Date
09.09.2010
05.09.2008
14.09.2009
Time
03.00 P.M.
02.30 P.M.
11.30 A.M.

13
Annual Report 2010 - 2011Annual Report 2010 - 2011
The Company hereby confirms that the Company has paid annual listing fees to both the exchanges and there is no outstandingpayment towards the exchanges as on date.
Monthly high and low prices of equity shares of the company quoted at Bombay Stock Exchange, Mumbai during the year2010-2011
8.1. Stock market data
April 2010
May 2010
June 2010
July 2010
August 2010
September 2010
October 2010
November 2010
December 2010
January 2011
February 2011
March 2011
1224.00
1357.85
1350.00
1554.90
699.00
650.00
669.80
630.00
597.00
552.50
507.80
520.00
1043.05
1040.00
1161.00
625.00
576.10
563.50
572.00
511.15
461.55
468.10
417.10
445.00
10 September, 2011
The Company's Equity shares are listed on :The Bombay Stock Exchange Limited (BSE), PhirozeJeejeebhoy Towers, Dalal Street, Mumbai 400001.
The National Stock Exchange of India Ltd.
5 Floor, Exchange Plaza,Bandra Kurla Complex, Bandra (East),Mumbai: 400051.
th
INE 317F01027
Dividend Payment Date
Listing on Stock Exchange:
Demat ISIN in NSDLand CDSLfor Equity Shares
4.
5.
6.
Second Quarterly Result:
On or before 15th November 2011
Third Quarterly Result:
On or before 15th February 2012
Fourth Quarterly Result:
On or before 15th May, 2012
Friday 05,August 2011 to Friday 12August, 2011(both days inclusive)
Date of Book Closure3.

14
Annual Report 2010 - 2011Annual Report 2010 - 2011
The above prices are depicted in the Chart given below:
Sharex Dynamic (India) Pvt Ltd.,
Unit No. 1, Luthra Industrial Premises,
Andheri Kurla Road, Safed Pool,
Andheri (East),
Mumbai-400 072
Tel :- 91 22 28515606/28515644
Fax : 91 22 28512885
Registrar and TransferAgent :
8.2 Share Transfer System
Company on receipt of share transfer/transmission/ request processes the same and returns the share certificate within a period of 15
to 20 days from the date of receipt.
Applications for transfer of shares held in physical form are received at the office of the Registrars and Share Transfer Agents of the
Company. All valid transfers are processed with 20 days from the date of receipt.
Company issued 1 : 1 bonus shares in July 2010
High 2010 - 11
Low 2010 - 11
0
200
400
600
800
1000
1200
1400
1600
Apr 10 May 10 June 10 July 10 Aug 10 Sept 10 Oct 10 Nov 10 Dec 10 Jan 11 Feb 11 Mar 11
1800
*
*

15
Annual Report 2010 - 2011Annual Report 2010 - 2011
8.3 Categories of shareholding as on 31 March 2011
Distribution of shareholding as on 31.03.2011 is as follows:
Others
Private corporate bodies
Indian public
NRIS / OCBS
Any other (foreign-companies) Clearing members
Sub-total
Grand total
3.
A.
B.
C.
D.
1239420
3408147
61199
2211
4710977
14091992
8.795
24.185
0.434
0.016
33.431
100
Share
TOTAL
UPTO TO 100
101 TO 200
201 TO 500
501 TO 1000
1001 TO 5000
5001 TO 10000
10001 TO 100000
100001 TO ABOVE
No of Holders
11535
1793
1443
772
607
47
42
16
16255
(%) Of Holders
70.96
11.03
8.88
4.75
3.73
0.29
0.26
0.1
100
Total Shares
368299
302846
499356
557408
1287498
338443
1340718
9397424
14091992
% Of SH/DB
2.61
2.15
3.54
3.96
9.14
2.4
9.51
66.69
100
Category
Promoter (s)
Promoter (s)
- Indian promoters
- Foreign promoters
Non-promoters holding
Institutional investors
Mutual funds and UTI
Banks, financial inst, insurance companies (central /
state govt. inst / non-government inst)
FII (s)
holding
Sub-total
Sub-total
1.
A
B
2.
A.
B.
C.
No. of shares held
—
—
8741556
40000
455388
144071
8741556
639459
% of shareholding
—
—
62.032
62.032
0.284
3.232
1.022
4.538

16
Annual Report 2010 - 2011Annual Report 2010 - 2011
8.4 Code of Conduct
8.5 SecretarialAudit
8.6 Plant Locations:
Anand Sojitra Road, Nadiad Khambat Road,Karamsad, VishnoliGujarat. Gujarat
Your Company has framed its own Code of Conduct though not statutorily required for the members of the Board of Directors and seniormanagement personnel of the Company. The same is available for viewing at the Company's website www.nesco.in
A qualified practicing Company Secretary carried out Secretarial Audit to reconcile the total admitted capital with National SecuritiesDepository Limited (NSDL) and Central Depository Services (India) Limited (CDSL) and the total issued capital. These audits confirmthat the total issued/paid-up capital of the Company is in agreement with the total number of the shares in physical form and the totalnumber of the dematerialized shares held with NSDLand CDSL. The same is also placed before the Board of Directors.
8.7 Investors Correspondence
Nesco Limited Sharex Dynamic (India) Pvt. Ltd., Secretarial Dept,
Nesco Complex Unit No.1, Luthra Industrial Premises, Nesco Limited,
W.E.Highway, Goregaon (E), Andheri Kurla Road, Safed Pool, Nesco Complex,
Mumbai 400 063 Andheri (East), Mumbai-400 072 W. E. Highway, Goregaon (E),
Phone: 022 - 66450123 Phone No. : 28515606/28515644 Mumbai 400 063
Fax : 022 - 66450101 E-mail: [email protected] Phone: 022 - 66450123
R & TAgent Any Query onAnnual Report:
Important Communication to Members
The Ministry of Corporate Affairs has taken a “Green Initiative in the Corporate Governance” by allowing paperless compliances by the
companies and has issued circulars stating that service of notice/ documents including Annual Report can be sent by e-mail to its
members. To support this green initiative of the Government in full measure, members who have not registered their e-mail addresses ,
so far, are requested to register their e-mail addresses, in respect of electronic holdings with the Depository through their concerned
Depository Participants. Members who hold shares in physical form are requested to notify there email id by writing letter and register
the same with Sharex Dynamic (I) Pvt Ltd, Share TransferAgent of Company.

17
Auditor's report on Compliance with the Corporate Governance under clause 49 of the listing agreement
For Shah & Co.,
CharteredAccountants
(Hemendra N. Shah)
Partner
Mumbai, 27 May 2011 Membership No. 8152
FRN. 109430W
To the Members of Nesco Limited
We have examined the compliance of conditions of corporate governance by Nesco Limited for the year ended on 31 March 2011 as
stipulated in clause 49 of the listing agreement of the company with the stock exchanges.
The compliance of conditions of the corporate governance is the responsibility of the management. Our examination was limited to
procedures and implementation thereof, adopted by the company, for ensuring the compliance of the conditions of the corporate
governance. It is neither an auditor nor an expression of opinion on the financial statements of the company.
In our opinion and to the best of our information and according to the explanations given to us, and the representations made by the
directors and the management, we certify that the company has complied with the conditions of the corporate governance as stipulated
in the above mentioned listing agreement.
We state that no investor grievances are pending for a period of exceeding one month, against the Company as per the records
maintained by the Shareholders/Investors Grievance Committee.
We further state that such compliance is neither an assurance as to the future viability of the company nor efficiency or effectiveness
with which the management has conducted the affairs of the company.
st
Annual Report 2010 - 2011Annual Report 2010 - 2011

18
SOURCES OF FUNDS
APPLICATION OF FUNDS:
1.
a) Share Capital
b) Reserves & Surplus
2.
(Refer Note No. 8 in schedule 11)
1.
a. Gross Block
b. Less: Depreciation
c. Net Block
d. Capital Work in Progress
2.
3.
a. Interest accrued on Investments
b. Inventories
c. Sundry Debtors
d. Other receivables
e. Cash & Bank Balances
f. Loans andAdvances
Less: Current Liabilities & Provision
Net CurrentAssets
Notes onAccounts :
Shareholders’Funds:
Deferred Tax liability
T O T A L :-
FixedAssets:
Investments
CurrentAssets,Loans &Advances
T O T A L :-
1
2
3
4
5
6
11
140,919,920
2,136,765,184
634,688,347
292,776,970
1,511,280
46,263,303
95,137,199
1,045,826
101,615,112
171,142,442
416,715,162
849,214,791
70,459,960
1,574,900,517
565,927,540
269,711,504
124,385
34,061,032
140,330,629
2,273,661
22,049,022
232,003,175
430,841,904
739,630,778
2,277,685,104
8,582,095
2,286,267,199
341,911,377
791,034,136
1,585,821,315
(432,499,629)
2,286,267,199
1,645,360,477
9,719,329
1,655,079,806
296,216,036
330,818,262
1,336,834,382
(308,788,874)
1,655,079,806
Schedule Rupees RupeesRupees Rupees
BALANCE SHEET AS AT MARCH 31, 2011
As at 31-03-2011 As at 31-03-2010
As per our report of even date
For Shah & Co.
CharteredAccountants
Hemendra N. Shah
Partner
Membership No.8152
FRN. 109430W
Mumbai, 27 May 2011
For and on behalf of the Board
Sumant Patel Chairman & Mg. Director
Dr. Ram S. Tarneja Director
Mahendra K. Chouhan Director
Sudha Patel Jt. Mg. Director
Mohan Parikh Director
Mumbai, 27 May 2011
Annual Report 2010 - 2011Annual Report 2010 - 2011

19
INCOME:
EXPENDITURE:
T O T A L :-
Sales, Services & Other Income
Manufacturing & Establishment Exps
Administrative, Selling & General Exps
Interest
Profit before Depreciation & Taxation
Depreciation
Less: Transferred from Revaluation Reserve
Profit for the year before Tax
Less: Provision for Current Tax
Provision for Deferred Tax
(Refer Note No. 8 in Schedule 11)
ProfitAfter Tax before Prior period items
Add/(Less) Prior period items (Net)
Profit after Prior period items
Less: Deferred Revenue Expenditure
written off
Net Profit for the year
Add: Balance brought forward from
previous year
Excess/(short) Provision of Income Tax
Profit available forAppropriation
Proposed dividend
Tax on Proposed Dividend
Transferred to General Reserve
Balance carried to Schedule
Earning per share basic and diluted
(Refer note no. 9 in schedule 11)
Notes onAccounts
Dividend on equity shares for the financial year2009-10 on increased capital of Rs.70,459,960for issue of 7045996 Bonus Shares @ Rs.1.50 perequity shares
Tax on Dividend
7
8
9
10
11
23,065,466
512,144
23,430,392
565,442
1,448,689,517
208,679,545210,718,799
5,569,562424,967,906
1,023,721,611
22,553,322
1,001,168,289315,000,000
(1,137,234)
687,305,523
(1,062,921)
686,242,602
691,242,602
35,229,980
5,851,347
632,836,7715,000,000
686,242,602-
5,000,000
-
10,568,994
1,755,510
49
1,198,196,927
194,395,527
180,854,070
12,805,216
388,054,813
810,142,114
22,864,950
787,277,164
225,000,000
2,366,047
559,911,117
-
559,911,117
9,826,460550,084,657
5,000,000
(316,780)
554,767,877
-
-
10,568,994
1,755,510
537,443,373
5,000,000
78
Schedule Rupees RupeesRupees Rupees
PROFIT & LOSS ACCOUNT FOR THE YEAR ENDED MARCH 31, 2011
As at 31-03-2011 As at 31-03-2010
As per our report of even date
For Shah & Co.
CharteredAccountants
Hemendra N. Shah
Partner
Membership No.8152
FRN. 109430W
Mumbai, 27 May 2011
Annual Report 2010 - 2011Annual Report 2010 - 2011
For and on behalf of the Board
Sumant Patel Chairman & Mg. Director
Dr. Ram S. Tarneja Director
Mahendra K. Chouhan Director
Sudha Patel Jt. Mg. Director
Mohan Parikh Director
Mumbai, 27 May 2011

20
SCHEDULES `1'TO `11' ANNEXED TO AND FORMING PART OF THE ACCOUNTS
FOR THE YEAR ENDED MARCH 31, 2011
Schedule 1 Rupees RupeesRupees Rupees
As at 31-03-2011 As at 31-03-2010
SHARE CAPITAL
Authorised:
T O T A L :-
Issued:
T O T A L :-
Subscribed & Called up :
T O T A L :-
250,000 11% Cumulative Redeemable
Preference shares of Rs.10/- each (Free of
Company’s tax; but subject to deduction
of tax at source)
14,750,000 Equity Shares of Rs.10/- each(Previous year 7,250,000 equity shares ofRs.10/- each)
14,092,182 Equity Shares of Rs.10/- each.(Previous year 70,46,186 equity shares ofRs.10/- each)
14,091,992 Equity Shares of Rs.10/- each, fullypaid up (Previous year 70,45,996 equityshares of Rs.10/- each)
147,500,000
150,000,000
140,921,820
140,919,920
140,921,820
140,919,920
2,500,000
72,500,000
2,500,000
75,000,000
70,461,860
70,461,860
70,459,960
70,459,960
Of the above shares:
247,770 and 980,088 equity shares had been issued for consideration other than cash in terms of the schemes of amalgamation of
erstwhile Shree Vrajesh Textile Mills Pvt.Ltd. and Indabrator Ltd. respectively with the Company. And 70,45,996 equity shares were
issued as bonus shares, by capitalisation of reserves of Rs. 70,459,960/- and share premium account Rs.500,000/-.
Annual Report 2010 - 2011Annual Report 2010 - 2011

21
SCHEDULES TO THE BALANCE SHEET
RESERVES AND SURPLUS
Capital Reserve
General Reserve
T O T A L :-
on revaluation of certain assets
as per last Balance Sheet
Less: Amount Transfered to Profit & Loss A/c
Preference Shares Redemption Reserve:
As per last Balance Sheet
Cash subsidy received from Govt. of Gujarat
As per last balance sheet
Less: Utilised for Bonus shares
Transferred from Profit &Loss Account
Profit & Loss Account
65,458,394
512,144
1,500,986,123
70,459,960
632,836,771
66,023,836
565,442
963,542,750
-
537,443,373
Schedule 2 Rupees RupeesRupees Rupees
As at 31-03-2011 As at 31-03-2010
956,000
2,500,000
5,000,000
64,946,250
2,063,362,934
2,136,765,184
65,458,394
956,000
2,500,000
1,500,986,123
5,000,000
1,574,900,517
Annual Report 2010 - 2011Annual Report 2010 - 2011

22
Annual Report 2010 - 2011Annual Report 2010 - 2011

23
Annual Report 2010 - 2011Annual Report 2010 - 2011
As at 31-03-2011 As at 31-03-2010
Schedule 4
Current Investments in Mutual Funds:
I. Fixed Maturity Plans
Birla Sun Life FMP - 12 M Series CE Growth (1000000)
(Previous Year Nil) Units of Rs.10/- Each 10,000,000 -
Birla Sun Life FMP - 12 M Series CI Growth (1000000)
(Previous Year Nil) Units of Rs.10/- Each 10,000,000 -
Birla Sun Life FMP - 12 M Series CL Growth (2000000)
(Previous Year Nil) Units of Rs.10/- Each 20,000,000 -
Birla Sun Life FMP - 12 M Series CM Growth (2000000)
(Previous Year Nil) Units of Rs.10/- Each 20,000,000 -
Birla Sun Life FMP - 12 M Series CF Growth (1000000)
(Previous Year Nil) Units of Rs.10/- Each 10,000,000 -
BNP Paribas Fixed Term Fund - 12 M Series 20 A Growth (2000000)
(Previous Year Nil) Units of Rs.10/- Each 20,000,000 -
DSP BlackRock FMP - 3 M Series 29 - Dividend (3000000)
(Previous Year Nil) Units of Rs.10/- Each 30,000,000 -
DWS Fixed Term Fund - 12 M Series 73 Growth (1000000)
(Previous Year Nil) Units of Rs.10/- Each 10,000,000 -
DWS Fixed Term Fund - 12 M Series 76 Growth (1000000)
(Previous Year Nil) Units of Rs.10/- Each 10,000,000 -
DWS Fixed Term Fund - 12 M Series 77 Growth (1000000)
(Previous Year Nil) Units of Rs.10/- Each 10,000,000 -
Fidelity FMP - 12 M Series 4 Plan E Growth (1000000)
(Previous Year Nil) Units of Rs.10/- Each 10,000,000 -
HDFC FMP 370 D Series XV September 2010 (2) Growth (2000000)
(Previous Year Nil) Units of Rs.10/- Each 20,000,000 -
HDFC Quarterly Interval Fund - Plan B Wholesale Div. (1997323.586)
(Previous Year Nil) Units of Rs.10.0134 Each 20,000,000 -
ICICI Prudential FMP Series 49 -1 Year Plan B Inst. Growth (Nil)
(Previous Year 5000000) Units of Rs.10/- Each - 50,000,000
ICICI Prudential FMP Series 49 -1 Year Plan A Inst. Growth (Nil)
(Previous Year 2000000) Units of Rs.10/- Each - 20,000,000
ICICI Prudential FMP Series 52 - 1 Year Plan C - Cumulative (2000000)
(Previous Year Nil) Units of Rs.10/- Each 20,000,000 -
ICICI Prudential FMP Series 53 - 1 Year Plan A - Cumulative (1000000)
(Previous Year Nil) Units of Rs.10/- Each 10,000,000 -
ICICI Prudential FMP Series 53 - 1 Year Plan E - Cumulative (2000000)
(Previous Year Nil) Units of Rs.10/- Each 20,000,000 -
ICICI Prudential FMP Series 54 - 1 Year Plan A - Cumulative (5000000)
(Previous Year Nil) Units of Rs.10/- Each 50,000,000 -

24
Annual Report 2010 - 2011Annual Report 2010 - 2011As at 31-03-2011 As at 31-03-2010
ICICI Prudential FMP Series 55 - 13 M Plan B - Cumulative (5100398)
(Previous Year Nil) Units of Rs.10/- Each 51,003,980 -
ICICI Prudential FMP Series 55 - 1 Year Plan A - Cumulative (4000000)
(Previous Year Nil) Units of Rs.10/- Each 40,000,000 -
ICICI Prudential FMP Series 54 - 1 Year Plan A - Cum (5027148)
(Previous Year Nil) Units of Rs.10/- Each 50,271,480 -
LIC Nomura MF Interval Fund Series 1- Annual Growth Plan (Nil)
(Previous Year 1000000) Units of Rs.10/- Each - 10,000,000
Reliance Dual Advant Fixed Tenure Fund-Plan B -3Yrs.-Div.(1000000)
(Previous Year Nil) Units of Rs.10/- Each 10,000,000 -
Reliance Dual Advant Fixed Tenure Fund-Plan I -2Yrs.-Grow.(1000000)
(Previous Year Nil) Units of Rs.10/- Each 10,000,000 -
Reliance Fixed Horizon Fund - XIX Series 9 - 1Yrs.- Grow.(1000000)
(Previous Year Nil) Units of Rs.10/- Each 10,000,000 -
Reliance Fixed Horizon Fund - XVII Series 1 - 1Yrs.- Grow.(2000000)
(Previous Year Nil) Units of Rs.10/- Each 20,000,000 -
Reliance Fixed Horizon Fund - XVII Series 2 - 1Yrs.- Grow.(2000000)
(Previous Year Nil) Units of Rs.10/- Each 20,000,000 -
Reliance Fixed Horizon Fund - XVII Series 6 - 1Yrs.- Grow.(2000000)
(Previous Year Nil) Units of Rs.10/- Each 20,000,000 -
Reliance Fixed Horizon Fund - XVII Series 7 - 15 M - Grow.(3000000)
(Previous Year Nil) Units of Rs.10/- Each 30,000,000 -
Reliance Fixed Horizon Fund - XVI Series 4 - 1Yrs. - Grow.(1000000)
(Previous Year Nil) Units of Rs.10/- Each 10,000,000 -
Reliance Fixed Horizon Fund - XVI Series 1 - 1Yrs. - Grow.(2000000)
(Previous Year Nil) Units of Rs.10/- Each 20,000,000 -
Reliance Fixed Horizon Fund - XVI Series 5 - 1Yrs. - Grow.(1000000)
(Previous Year Nil) Units of Rs.10/- Each 10,000,000 -
Reliance Fixed Horizon Fund - XVI Series 6 - 1Yrs. - Grow.(1000000)
(Previous Year Nil) Units of Rs.10/- Each 10,000,000 -
Religare FMP - Series IV - Plan F - 1 Yrs. - Growth (2000000)
(Previous Year Nil) Units of Rs.10/- Each 20,000,000 -
Religare FMP - Series VI - Plan C - 13 M - Growth (2000000)
(Previous Year Nil) Units of Rs.10/- Each 20,000,000 -
Religare FMP - Series VI - Plan D - 1 Yrs. - Growth (1000000)
(Previous Year Nil) Units of Rs.10/- Each 10,000,000 -
Religare FMP - Series V - Plan A - 1 Yrs. - Growth (2000000)
(Previous Year Nil) Units of Rs.10/- Each 20,000,000 -
Sundaram BNP Paribas FTP - Plan P (367 Days) - Ret Div (Nil)
(Previous Year 2000000) Units of Rs.10/- Each - 20,000,000
Sundaram Interval Fund Qly. Plan D - Inst. Dividend (1000000)
(Previous Year Nil) Units of Rs.10/- Each 10,000,000 -

25
Annual Report 2010 - 2011Annual Report 2010 - 2011As at 31-03-2011 As at 31-03-2010
Sundaram Fixed Term Plan - AO - 1 Yrs.- Growth (1000000)
(Previous Year Nil) Units of Rs.10/- Each 10,000,000 -
Sundaram Fixed Term Plan - AR - 1 Yrs.- Growth (1000000)
(Previous Year Nil) Units of Rs.10/- Each 10,000,000 -
Sundaram Fixed Term Plan - AY - 1 Yrs.- Growth (2000000)
(Previous Year Nil) Units of Rs.10/- Each 20,000,000 -
TATA FMP Series 25 Scheme - A - Retail Invest.Plan - G (2000000)
(Previous Year 2000000) Units of Rs.10/- Each 20,000,000 20,000,000
UTI Fixed Income Interval Fund- AIP Series- I - Dividend (Nil)
(Previous Year 2000000) Units of Rs.10/- Each - 20,000,000
UTI Fixed Income Interval Fund- AIP Series - I - Growth (Nil)
(Previous Year 837647.216) Units of Rs.10/- Each - 10,000,000
UTI Fixed Maturity Plan Yearly Series - Sept. 09 - Dividend (Nil)
(Previous Year 5000000) Units of Rs.10/- Each - 50,000,000
UTI Fixed Term Income Fund Series IX - I - 1Yr.-Growth (1105782.097)
(Previous Year Nil) Units of Rs.10/- Each 11,057,821 -
UTI Fixed Term Income Fund Series IX - I - 1Yr.-Growth (518461.595)
(Previous Year Nil) Units of Rs.10/- Each 5,184,616 -
UTI Fixed Term Income Fund Series IX - I - 1Yr.-Growth (518461.595)
(Previous Year Nil) Units of Rs.10/- Each 5,184,616 -
UTI Fixed Term Income Fund Series IX - I - 1Yr.-Growth (518461.595)
(Previous Year Nil) Units of Rs.10/- Each 5,184,616 -
UTI Fixed Term Income Fund Series IX - I - 1Yr.-Growth (518461.595)
(Previous Year Nil) Units of Rs.10/- Each 5,184,616 -
Total of FMPs 783,071,745 200,000,000
Birla Sunlife Income Fund - Plan C- Quarterly Div. (Nil)
(Previous Year 2147590.444) Units of Rs.10/- Each - 25,500,000
Birla Sunlife Dynamic Bond Fund - Retail - Monthly Div (1933347.942)
(Previous Year 1933347.942) Units of Rs.10/- Each 20,000,000 20,000,000
BNP Paribas Bond Fund - Inst. Growth Folio-328670 (3877414.478)
(Previous Year Nil) Units of Rs.10/- Each 40,000,000 -
BNP Paribas Bond Fund - Inst. Growth Folio-343483 (967632.687)
(Previous Year Nil) Units of Rs.10/- Each 10,000,000 -
BNP Paribas Bond Fund - Inst. Growth Folio-343484 (967632.687)
(Previous Year Nil) Units of Rs.10/- Each 10,000,000 -
HDFC Income Fund - Dividend (Nil)
(Previous Year 3783502.474) Units of Rs.10/- Each - 41,627,865
ICICI Prudential Income Fund-Div.Qrtly-Folio-3692700/76 (Nil)
(Previous Year 5440542.102) Units of Rs.10/- Each - 71,100,000
II. DEBT FUNDS
A. INCOME FUNDS

26
Annual Report 2010 - 2011Annual Report 2010 - 2011As at 31-03-2011 As at 31-03-2010
ICICI Prudential Income Fund-Div.Qrtly-Folio-876025/43 (Nil)
(Previous Year 844639.992) Units of Rs.10/- Each - 11,000,000
ICICI Pru Regular Savings Fund - Qly.Div.-Folio-4612185/10 (3961219.660)
(Previous Year Nil) Units of Rs.10/- Each 40,000,000 -
ICICI Pru Regular Savings Fund - Growth-Folio-4612185/10 (1000000)
(Previous Year Nil) Units of Rs.10/- Each 10,000,000 -
IDFC SSIF Medium Term Plan A - Monthly Divdend (2948692.746)
(Previous Year 2948692.746) Units of Rs.10/- Each 30,000,000 30,000,000
IDFC SSIF Short Term-Monthly Div - Folio No.1005367/17 (Nil)
(Previous Year 5723960.088) Units of Rs.10/- Each - 57,334,860
IDFC SSIF Short Term-Monthly Div.-Folio No.796554/30 (Nil)
(Previous Year 9882079.949) Units of Rs.10/- Each - 99,864,124
IDFC SSIF ST - Plan B - Monthly Divdend (Nil)
(Previous Year 3057668.226) Units of Rs.10/- Each - 30,700,000
Reliance Income Fund Retail Plan Monthly Dividend (Nil)
(Previous Year 4387116.621) Units of Rs.10/- Each - 45,550,000
Reliance Income Fund - Retail Plan - Qrtly Div. (Nil)
(Previous Year 1394151.466) Units of Rs.10/- Each - 20,200,000
Reliance Regular Savings Fund Debt -Growth (4145663.127)
(Previous Year 4145663.127) Units of Rs.10/- Each 50,000,000 50,000,000
Reliance Regular Savings Fund Debt -Qly. Inst. Div. (2463088.033)
(Previous Year 2463088.033) Units of Rs.10/- Each 30,000,000 30,000,000
Reliance Regular Savings Fund Debt -Inst. Growth (1199213.316)
(Previous Year 1199213.316) Units of Rs.10/- Each 15,000,000 15,000,000
Religare Medium Term Bond Fund - Qly. Div. (1989040.387)
(Previous Year Nil) Units of Rs.10/- Each 20,000,000 -
Total of Income Funds
Total of Liquid Funds
275,000,000 547,876,849
B. LIQUID FUNDS
C. SHORT TERM FUNDS
BNP Paribas Overnight Fund - IP - DDR (406547.175)
(Previous Year Nil) Units of Rs.10/- Each 4,066,691 -
Daiwa Liquid Fund - Inst. Plan - DDR (20397.271)
(Previous Year Nil) Units of Rs.10/- Each 20,407,871 -
BNP Paribas Short Term Income Fund - Inst. Mty. Div. (1986353.750)
(Previous Year Nil) Units of Rs.10/- Each 20,000,000 -
DWS Short Maturity Fund - Inst.- Weekly Div. (Nil)
(Previous Year 980040.382) Units of Rs.10/- Each - 10,214,456
24,474,562 -

27
Annual Report 2010 - 2011Annual Report 2010 - 2011As at 31-03-2011 As at 31-03-2010
HDFC Short Term Fund -Growth - Folio No.5966375/91 (Nil)
(Previous Year 908672.713) Units of Rs.10/- Each - 16,000,000
HDFC Short Term Fund Growth - Folio No.5968948/35 (Nil)
(Previous Year 2327720.310) Units of Rs.10/- Each - 41,000,000
HDFC Short Term Fund Div. - Folio No.5968948/35 (Nil)
(Previous Year 3069805.966) Units of Rs.10/- Each - 31,813,286
ICICI Prudential Short Term Plan DF - Reinvest (Nil)
(Previous Year 4059414.111) Units of Rs.10/- Each - 47,910,469
ICICI Prudential Ins. STIP -DF- Folio No.876025/43 (Nil)
(Previous Year 853125.413) Units of Rs.10/- Each - 10,267,010
ICICI Pru Short Term Fund-Inst.-DF-Folio No.4612185/10 (Nil)
(Previous Year 1698157.489) Units of Rs.10/- Each - 20,482,200
ICICI Prudential Short Term-Dividend - RE-4612183/16 (Nil)
(Previous Year 3592101.343) Units of Rs.10/- Each - 43,406,962
Reliance Short Term Fund - Dividend Payout (Nil)
(Previous Year 1881490.205) Units of Rs.10/- Each - 20,037,683
Reliance Short Term Fund - Retail Plan - Dividend Plan (Nil)
(Previous Year 7289095.050) Units of Rs.10/- Each - 77,500,000
Templeton India STIP - Weekly Dividend - Re-14237536 (29302.359)
(Previous Year 28098.467) Units of Rs.10/- Each 31,567,160 30,272,190
Templeton India STIP - Weekly Dividend - Re-16250082 (11133.131)
(Previous Year 10675.725) Units of Rs.10/- Each 11,963,179 11,471,168
Templeton India STIP - Weekly Dividend - Re-17191032 (32927.996)
(Previous Year 31575.148) Units of Rs.10/- Each 35,367,766 33,912,567
Templeton India STIP - Weekly Dividend - Re-17358608 (20038.702)
(Previous Year 19215.412) Units of Rs.10/- Each 21,523,872 20,638,294
Birla Sun Life Ultra Short Term Fund - IP - DDR (4073894.779)
(Previous Year Nil) Units of Rs.10/- Each 40,761,354 -
DWS Money Plus Fund - IP - Monthly - Div. (938323.966)
(Previous Year Nil) Units of Rs.10/- Each 10,000,000 -
DWS Money Plus Fund - IP - DDR (2976485.762)
(Previous Year Nil) Units of Rs.10/- Each 30,000,000 -
DWS Treasury Fund Cash - IP - DDR (1018221.110)
(Previous Year Nil) Units of Rs.10/- Each 10,232,817 -
DWS Treasury Fund Investment - IP - DDR (2023243.357)
(Previous Year Nil) Units of Rs.10/- Each 20,316,803 -
DWS Treasury Fund Investment - Regular Plan - DDR (1086373.255)
(Previous Year Nil) Units of Rs.10/- Each 11,104,907 -
Total of Short Term Funds 120,421,977 414,926,283
D - ULTRA SHORT TERM BOND FUNDS

28
Annual Report 2010 - 2011Annual Report 2010 - 2011As at 31-03-2011 As at 31-03-2010
DWS Ultra Short Term Fund Inst. - DDR (5040481.419)
(Previous Year Nil) Units of Rs.10/- Each 50,495,039 -
ICICI Prudential Flexible Income Plan Premium - DDR (698014.684)
(Previous Year Nil) Units of Rs.10/- Each 73,804,583 -
Templeton India Ultra Short Bond Fund - IP - DDR (1022125.428)
(Previous Year Nil) Units of Rs.10/- Each 10,232,600 -
UTI Treasury Advantage Fund - IP - DDR (20292.037)
(Previous Year Nil) Units of Rs.10/- Each 20,296,382 -
DSP BlackRock Balance Fund - Dividend (Nil)
(Previous Year 404058.791) Units of Rs.10/- Each - 10,000,000
HDFC Prudence Fund Div. - Folio-2147186/18 (372010.901)
(Previous Year 372010.901) Units of Rs.10/- Each 12,400,000 12,400,000
HDFC Prudence Fund Div. - Folio-5968948/35 (Nil)
(Previous Year 229380.345) Units of Rs.10/- Each - 7,000,000
Kotak Balance Fund - Dividend (255198.656)
(Previous Year 255198.656) Units of Rs.10/- Each 7,500,000 7,500,000
SBI Magnum Balance Fund - Dividend (222524.580)
(Previous Year 222524.580) Units of Rs.10/- Each 7,500,000 7,500,000
TATA Balance Fund - Dividend (Nil)
(Previous Year 148279.367) Units of Rs.10/- Each - 7,500,000
Kotak Income Plus Dividend (Nil)
(Previous Year 839047.479) Units of Rs.10/- Each - 9,000,000
Reliance MIP - Dividend Plan (884572.177)
(Previous Year 884572.177) Units of Rs.10/- Each 10,000,000 10,000,000
Total of Ultra Short Term Bonds
Total of Balance Funds
Total of M I P Funds
277,244,484 -
Total of Debt Funds 697,141,023 962,803,132
27,400,000 51,900,000
20,000,000 37,250,000
III. EQUITY FUNDS
A. BALANCE FUNDS
B. M I P FUNDS
Birla Sun Life MIP II - Savings 5 Plan - Monthly Div. (882293.257)
(Previous Year 882293.257) Units of Rs.10/- Each 10,000,000 10,000,000
ICICI Prudential Income Multiplier Fund (Nil)
(Previous Year 680886.226) Units of Rs.10/- Each - 8,250,000

29
Annual Report 2010 - 2011Annual Report 2010 - 2011As at 31-03-2011 As at 31-03-2010
C. EQUITY FUNDS
DSP BlackRock Equity Fund - Regular Plan - Dividend (Nil)
(Previous Year 153428.793) Units of Rs.10/- Each - 7,800,000
DSP BlackRock India TIGER Fund - Regular Plan - Div (435007.218)
(Previous Year 460243.174) Units of Rs.10/- Each 10,900,000 11,400,000
Franklin India Templeton Bluechip Fund Div. FNo -14237536 (83777.088)
(Previous Year 83777.088) Units of Rs.10/- Each 4,111,055 4,111,055
Franklin India Templeton Flexi Cap Fund Div. Folio-14237536 (203234.350)
(Previous Year 203234.350) Units of Rs.10/- Each 4,000,000 4,000,000
Franklin India Templeton Flexi Cap Fund Div. Folio-16299820 (71184.510)
(Previous Year 71184.510) Units of Rs.10/- Each 1,250,000 1,250,000
Franklin India Templeton Prima Fund Div. Folio - 14237536 (32225.678)
(Previous Year 32225.678) Units of Rs.10/- Each 2,207,946 2,207,946
HDFC Equity Fund - Dividend Folio - 2147186/18 (Nil)
(Previous Year 38776.222) Units of Rs.10/- Each - 2,000,000
HDFC Top 200 Fund - Dividend Folio - 3764039/41 (53424.446)
(Previous Year 53424.446) Units of Rs.10/- Each 2,750,000 2,750,000
HSBC Equity Fund - Dividend (79606.988)
(Previous Year 79606.988) Units of Rs.10/- Each 3,500,000 3,500,000
ICICI Prudential Infrastructure Fund Div. Folio-876025/43 (196793.250)
(Previous Year 188959.124) Units of Rs.10/- Each 3,600,954 3,506,474
J M Basic Fund - Dividend (83630.780)
(Previous Year 83630.780) Units of Rs.10/- Each 2,500,000 2,500,000
Reliance Banking Fund Dividend Plan - Div. (Nil)
(Previous Year 231152.029) Units of Rs.10/- Each - 7,000,000
Reliance Diversified Power Sector Fund - Div. (95107.046)
(Previous Year 95107.046) Units of Rs.10/- Each 5,000,000 5,000,000
Reliance Growth Fund Dividend (78033.174)
(Previous Year 78033.174) Units of Rs.10/- Each 5,000,000 5,000,000
Reliance Vision Fund Dividend (118215.901)
(Previous Year 118215.901) Units of Rs.10/- Each 6,500,000 6,500,000
Sundaram Select Midcap - Fund (Nil)
(Previous Year 309158.025) Units of Rs.10/- Each - 5,500,000
UTI Services Industries Fund - Dividend Plan - Payout (186361.202)
(Previous Year 186361.202) Units of Rs.10/- Each 6,556,634 6,556,634
Total of Equity Funds 57,876,589 80,582,109
Total of Equity Funds 105,276,589 169,732,109

IV - EQUITIES
A - EQUITY SHARES (QUOTED)
Nil (Previous Year 13,000) Equity Shares Of Rs.10/-
Each, Fully Paid Up of Phoenix Lamps Ltd - 1,605,323
( Formally known as Halonix Ltd)
Nil (Previous Year 7,299) Equity Shares Of Rs.10/-
Each, Fully Paid Up of Precision Wires India Ltd - 867,472
Nil (Previous Year 12,500) Equity Shares Of Rs.10/-
Each, Fully Paid Up of Sarla Performance Fibers Ltd - 1,494,388
370 (Previous Year 370 OF Rs.10/- each) Equity Shares
of Rs.2/- Each, Fully Paid Up of Larsen & Toubro Ltd 148 148
59 (Previous Year 59) Equity Shares Of Rs.10/-
Each, Fully Paid Up of Ultra Tech Cement Ltd 410 410
2250 (Previous Year 450) Equity Shares Of Rs.2/-
Each, Fully Paid Up of Greaves Cotton Ltd
(Previous was 450 Share @ Rs.10) 3,600 3,600
4,158 3,971,341
B. EQUITY SHARES (UNQUOTED)
50
250
2,500
225,000
227,800
Total of Equity Shares (Quoted & Unquoted) 231,958 4,199,141
V. GOVERNMENT SECURITIES (UNQUOTED)
100,000
5 Shares of The Karamsad Urban Co-op Bank of the face value of
Rs. 10/- each, fully paid up 50
7 Shares (Including 2 bonus Shares of Charotar Nagrik Sahakari Bank
Ltd. Of the face value of Rs. 50/- each fully paid up 250
5 SHARES OF CHAROTAR GAS SAHAKARI MANDALI OF THE FACE
VALUE OF RS. 500 EACH, FULLY PAID UP 2,500
2250 (Previous Year 2250) Equity Shares of face value of
Rs. 100 each of NSE Housing & Investment Pvt Ltd 225,000
227,800
10.Nos. 5 1/2 years Kisan Vikas Patra of the value of Rs. 10,000 each
pledge with BMC for connection (matured) 100,000
30
Annual Report 2010 - 2011Annual Report 2010 - 2011As at 31-03-2011 As at 31-03-2010

31
Annual Report 2010 - 2011Annual Report 2010 - 2011As at 31-03-2011 As at 31-03-2010
Aggregate Amount of :
(I) FMP 783,071,745
(II) DEBTS FUNDS
A. INCOME FUNDS 275,000,000
B. LIQUID FUNDS 24,474,562
C. SHORT TERM FUNDS 120,421,977
D. ULTRA SHORT TERM BOND FUNDS 277,244,484
697,141,023
(III) EQUITY FUNDS
A. BALANCE FUNDS 27,400,000
B. EQUITY FUNDS 57,876,589
C. MIP FUNDS 20,000,000
105,276,589
(IV) EQUITY SHARES
A. QUOTED 4,158
B. UNQUOTED 227,800
231,958
(V) GOVERNMENT SECURITIES (UNQUOTED) 100,000
Total of Investments 1,585,821,315
s 200,000,000
547,876,849
-
414,926,283
-
962,803,132
51,900,000
80,582,109
37,250,000
169,732,109
3,971,341
227,800
4,199,141
100,000
1,336,834,382
Note : Market Value of Quoted Investments is Rs.1,416,922/- (Previous year Rs.4,066,321/-) and Mutual Funds Investment is
Rs.1,586,140,989/- (Previous year Rs.1,310,321,373/-)

32
Annual Report 2010 - 2011Annual Report 2010 - 2011
Schedule 5 Rupees RupeesRupees Rupees
As at 31-03-2011 As at 31-03-2010
CURRENTASSETS, LOANS &ADVANCES:
A. CURRENTASSETS:
1,511,280
1,096,600
14,801,910
30,364,793 45,166,703
32,161,690
32,161,690
62,975,509 95,137,199
1,045,826
9,615
32,697,436
68,908,061 101,615,112
T O TAL : ‘A’ 245,572,720 198,838,729
B. LOANSANDADVANCES:
50,565,367
108,111,383
2,230,645
7,098,110
3,136,937
B 171,142,442 232,003,175
A. CURRENTASSETS 245,572,720 198,838,729
B. LOANANDADVANCES 171,142,442 232,003,175
1. Interest accrued on Investments 124,385
2. Stores and Spares (At lower of cost
or net realisable value -As per
inventory taken, valued & certified
by the Managing Director) 1,184,726
3. Stock-in-trade (As per inventory
taken, valued & certified by
the Managing Director):
a) Raw Materials (At lower of cost or net 9,718,573
realisable value)
b) Semi-finished goods (At cost) 23,157,733 32,876,306
4. Sundry debtors (Unsecured) (Subject to
reconciliation & confirmations)
Debts outstanding for a period
exceeding six months
a) Considered Good 29,250,478
b) Considered Doubtful not provided for - -
29,250,478
c) Other Debts:
Considered Good: 111,080,151 140,330,629
5 Other Receivables 2,273,661
6. Cash and Bank balances
a) Cash on hand 32,123
b) Bank balances With scheduled Banks
i) In CurrentAccounts 10,934,536
ii) In Fixed Deposits 11,082,363 22,049,022
(Unsecured, Considered good, unless
otherwise stated)
1. i) Advances recoverable in cash or
in kind or for value to be received 49,347,342
ii) Advances against Capital Expenditure 172,168,992
iii) Balance with Central Excise 1,480,130
2. Deposits with Public Bodies (Subject to confirmations) 7,102,610
3. Other deposits (subject to confirmations) 1,904,101
(Subject to reconciliation & confirmations)
T O TAL : ‘ ’
T O TAL : - 416,715,162 430,841,904

33
Annual Report 2010 - 2011Annual Report 2010 - 2011
Schedule 6 Rupees RupeesRupees Rupees
As at 31-03-2011 As at 31-03-2010
CURRENT LIABILITIES & PROVISIONS:
A) Current Liabilities
77,600,422
49,119,680
57,353,892
4,490,619
22,712,651
306,192,001
3,119,593
126,199,574
13,038,242
4,025,943
B) Provisions
f 6,229,847
35,229,980
5,851,347
9,542,000
1,401,000
T O T A L :- 849,214,791 739,630,778
SALES, SERVICES & OTHER INCOME:
A. Income From Convention & Exhibition
Centre, Information Technology Park &
Realty Division:
CONVENTION & EXHIBITION CENTRE
656,229,418
INFORMATION TECHNOLOGY PARK
411,623,694
REALTY DIVISION (including lease rent)
104,544,698
T O T A L :- 1,172,397,810
B. Industrial Capital Goods Division:
174,098,518
15,997,433
158,101,085
10,109,246
T O T A L :- 168,210,331
Sundry Creditors
(Subject to reconciliation & Confirmations)
(Refer note no. 5 in Schedule 11 ) 70,171,612
Other Liaibilities (Include Rs.21,115,506/- due to directors) 55,572,741
Advance against orders 38,085,424
Advance compensation from Licences 3,659,696
Advance from IT Park Licences 27,945,454
Advance from Convention & Exhibitions organizers 168,284,518
Security deposit from Exhibitors 3,119,593
Security deposit from I T Park Licences 28,198,595
Security deposit from Licences 113,131,982
Investor Education and protection fund
Unclaimed dividend 3,189,229
Provision or Tax (Net of Advance Tax and TDS) 78,379,430
Proposed Dividend 10,568,994
Tax on Proposed Dividend 1,755,510
Provision For Gratuity 9,075,000
Provision For Leave Encashment 1,385,000
Gross (TDS Rs.8,21,90,192/-) (P.Y Rs. 9,10,14,020/-) 540,429,225
Gross (TDS Rs.4,08,46,577/-) (P.Y. Rs. 1,40,74,310/-) 137,845,524
Gross (TDS Rs.65,49,079/-) (P.Y Rs. 2,06,48,880/-) 91,703,591
769,978,340
Sales of products 254,831,321
Less: Excise Duty 20,841,801
Net Sales 233,989,520
Engineering Fees, services & other charges 14,316,306
Gross (TDS Rs.122,264/-) (P.Y Rs. 1,18,394/-)
248,305,826
Provision for Compensation 127,108,000127,108,000
Schedule 7

34
Schedule 7 (contd...) Rupees RupeesRupees Rupees
As at 31-03-2011 As at 31-03-2010
Annual Report 2010 - 2011Annual Report 2010 - 2011
C. Income from Investments:
477,408
13,650,611
56,800,932
T O T A L :- 70,928,951
D. Other Income:
1,679,200
812,854
-
185,265
-
133,404
29,270,982
3,114,545
399,000
1,524,115
33,060
T O T A L :- 37,152,425
A. Income From Convention & Exhibition Centre,
IT Park & Realty 1,172,397,810
B. Industrial Capital Goods Division 168,210,331
C. Income from Investments 70,928,951
D. Other Income 37,152,425
T O T A L :- 1,448,689,517 1,198,196,927
MANUFACTURING & ESTABLISHMENT EXPENSES:
9,718,573
125,869,224
135,587,797
14,801,910 120,785,887
-
23,157,733
23,157,733
Profit on sale of Shares (LT) 2,281,921
Profit on sale of Shares (ST) - 466,844
Profit on redemption of Mutual Fund 43,734,430
Dividend Received 56,560,705
103,043,900
Interest Recd. (Gross) 897,805
Interest on Bank FD
(TDS Rs. 2,63,249/- PY Rs. 10,64,864/-) 8,848,831
Income Tax Refund 236,366
Sale of Casting, Scrap 2,238,286
Sundry creditors/liabilities written off 806,595
Miscellaneous Receipts 556,521
Other Income 11,643,623
Insurance Claim Received - 12,728
Profit on sale of Assets - 50,499,998
Brokerage received
(TDS Rs. 3,10,798/- PY Rs. Nil ) 200,655
Rent & Taxes received -
Bad Debts w/off Now Recovered 920,602
Exchange Gain 6,851
76,868,861
769,978,340
248,305,826
103,043,900
76,868,861
A. Materials consumed and (Increase)/
Decrease in Stock :
1. Raw Materials and Components consumed:
Opening Stock 12,271,422
Add : Purchases and Expenses 86,662,430
98,933,852
Less : Closing Stock 9,718,573 89,215,279
2. (Increase)/Decrease in Stocks:
Opening Stock:
Finished Goods -
Semi-finished Goods 39,129,998
39,129,998
Schedule 8

35
Annual Report 2010 - 2011Annual Report 2010 - 2011
Schedule 8 (contd...) Rupees RupeesRupees RupeesAs at 31-03-2011 As at 31-03-2010
Less : Closing Stock
Finished Goods -
Semi-finished Goods 23,157,733
15,972,265
B. Stores and Spares consumed 5,500,329
C. Power and Fuel 18,350,182
D. Erection & fabrication 20,764,054
E. Employees’ Remuneration & Benefits:
Salaries, Wages, Bonus and Allowances 38,519,044
Compensation for VRS 69,508
Contribution to Provident Fund
and Family Pension Fund (including PF and 2,545,870
Administrative charges)
Workmen and Staff Welfare Expenses 2,202,516
(including ESIC)
Gratuity 1,256,480 44,593,418
194,395,527
Printing, Stationery, Postage, Telephones
and Office & Other Administrative expenses 4,793,368
Rent 312,196
Rates, Taxes, Water charges & Service Tax 39,113,945
Advertisement, Sales Promotion and Subscription 2,339,171
Insurance (Net) 910,841
BMC Charges 628,556
Repairs and maintenance of :
Buildings & Property 42,869,185
Plant & Machinery -
Other Assets 662,276 43,531,461
Freight and Transport Charges 26,692
Export Expenses 28,876
Exchange Loss -
Motor Car Expenses 927,567
Travelling and Conveyance expenses 7,762,233
Directors Travelling Expenses 207,956
Office Expenses 315,021
Bank charges & Guarantee Commission Including
Processing Fees 2,118,758
-
30,364,793
(7,207,060)
3,210,872
18,847,716
24,497,221
40,324,027
37,677
2,509,841
3,886,318
1,787,046 48,544,909
T O T A L :- 208,679,545
ADMINISTRATIVE, SELLING & GENERAL EXPENSES
5,620,034
576,928
17,788,171
2,437,735
603,111
38,214,451
48,528,217
-
874,534 49,402,751
240
9,002
-
1,170,611
9,167,034
145,301
647,341
628,602
Schedule 9

36
Annual Report 2010 - 2011Annual Report 2010 - 2011
Schedule 9 (contd...) Rupees RupeesRupees RupeesAs at 31-03-2011 As at 31-03-2010
Auditor’s Remuneration:
500,000
115,000
5,000 620,000
15,807,087
15,505,000
Managerial Remuneration 29,222,580
454,525
515,750
622,939
5,200,991
7,193,272
4,848,895
3,123,368
525,000
387,373
280,707
T O T A L :- 210,718,799
Audit Fees 500,000
Certification work 115,000
Out of Pocket Expenses 5,000 620,000
Legal, professional and technical, Consultation Fees 9,541,057
Donations 18,614,707
29,222,580
(Refer Note No. 7 in Schedule 11)
Security Transaction Tax 177,870
Commission & Brokerage 754,011
Electricity Expenses 86,110
L D Charges 6,598,935
Sundry Balance written off 974,018
Bad Debts written off 6,739,741
Security Charges 3,361,633
Share Issue Expenses -
Custodian & Listing Fees 138,894
Miscellaneous expenses 1,007,873
180,854,070
INTEREST
5,403,678-
165,884
T O T A L :- 5,569,562
On Secured Loans From Banks 10,400,540On Unsecured Loans -On others 2,404,676
12,805,216
Schedule 10
Schedule 11
Notes forming part of the accounts for the year ended 31 March 2011.
1. Estimated amount of contracts remaining to be executed on capital
account and not provided for (previous year
602,715,387/-) against which an advance of
(previous year 442,384,347/-) has been paid.
2. Contingent liabilities not provided for in respect of (a) counter
guarantees given by the company to banks in respect of Indian bank
guarantees given by them on company's behalf
(previous year 44,214,879/-) (b) Foreign bank guarantees given by
bank on company's behalf (previous year Nil) (c)
Foreign Letter of Credit
st
` `
`
`
`
`
`
892,500,000/-
576,406,048/-
40,155,309/-
US $23,800.00
given by bank on company's behalf
(previous year Nil) (d) Property tax in dispute
(previous year 51,350,675/
US
$364,559.00 Nil
-).
` `
`
3. Income tax assessment is completed up to the assessment year2008-2009 The company does not expect any additional liability forthe pending assessments.
4. Sales tax assessment is completed for Maharashtra up to thefinancial year 2004-2005, and for Gujarat up to the financial year2006-2007. The company does not expect any additional liability forthe pending assessments.
5. (a) According to the information and explanations given by themanagement there are no dues to SSI units which are outstandingfor more than 30 days as on 31 March, 2011 including the interest ifany, thereon.
.
st

37
(b) The company is in process of identifying enterprises
covered under the Micro, Small and Medium Enterprises
Development Act, 2006. Accordingly, the disclosure in respect
of the amount payable to such micro, small and medium
enterprises as on 31 March, 2011 has not been given in the
financial statements. However, in the opinion of the
management, the impact of interest if any, that may be
payable in accordance with the provisions of the act is not
expected to be material.
st
Annual Report 2010 - 2011Annual Report 2010 - 2011
6. Provision for income tax is made after considering exemptions
and deductions available under the Income Tax Act, 1961, as
advised by tax consultants.
7.A. Determination of net profit in accordance with section 349 of the CompaniesAct, 1956.
Profit as per Profit & LossAccount 1,001,168,289
Add: Managerial remuneration & commission 28,992,580
Depreciation as per books 22,553,322
Prior period Income (net) - 51,545,902
Less: Deduction under sections 349 & 350
Depreciation under section 350 22,553,322
Prior period expenses (net) 1,062,921 23,616,243
Net profit in accordance with sections 198(1) and 349 of the Company’sAct. 1956
B. Managerial remuneration pursuant to the provisions of section 198, 269
and 309 of the Companies Act 1956.
2010-11 2009-10
a) Chairman & Managing Director
i) Salary (CMD has decided not to draw increased salary at
Rs.36,00,000/- approved by the Board)
ii) Perquisites 309,633 752,852
iii) FurnishingAllowance 690,367 56,726
iv) Commission (CMD has decided not to draw full commission of
Rs.30,872,938/- to which he is entitled as per terms but instead to draw
commission of Rs.22,617,403/- ) 22,617,403 24,193,898
26,017,403 27,403,476
b) Jt.Managing Director (Jt. M.D. has decided not to draw any commission as
against Rs.51,454,897/- to which she is entitled as per terms) - -
c) Executive Director
i) Salary 1,800,000 1,200,000
ii) Perquisites 329,301 405,904
iii) FurnishingAllowance 545,876 3,200
iv) Commission 300,000 -
2,975,177 1,609,104
Salary & perquisties to Chairman 26,017,403 27,403,476
Salary & perquisties to Executive Director 2,975,177 1,609,104
Other Directors Sitting Fees 230,000 210,000
1,029,097,948
29,222,580 29,222,580
2,400,000 2,400,000

38
Annual Report 2010 - 2011Annual Report 2010 - 2011
8 Pursuant to the Accounting Standard 22 Accounting for taxes onincome issued by the Institute of Chartered Accountants of India,
which is mandatory with effect from 1 April 2002, The deferred taxasset/liability has been reassessed in view of the various appeals,decisions and consequential effect on carry forward losses as wellas revision in tax rate applicable. Accordingly net liability as on
31.03.2011 is worked out to as computed below. Since
the company has a deferred tax liability balance of as
on 31.03.2010 in the balance sheet, has been creditedin the profit & loss account.
st
`
`
`
8,582,095/-9,719,329/-
1,137,234/-
.
The major components of Deferred Tax Assets and Liabilities as atare as follows:
31stMarch 2011
Deferred Tax Liability (Net) as on 01.04. 0
Deferred Tax Liability
Less: Deferred TaxAssetsAdjustments for the year
Depreciation as per Company’sActDepreciation as per Income TaxAct
Income Tax @ 33.99%
Add: Deferred Tax Liability -Income Tax @ 33.99% -
1 9,719,329
a) 22,553,322b) 19,207,531 3,345,791
1,137,234
(Net) as on 31.03.11 8,582,095
9. Earnings per share:
2009-2010
( )
a) Profit after tax and adjusting extra ordinary items
b) Number of equity shares outstanding
c) Face Value of each equity share ( .) 10
d) Basic and diluted earnings per share ( )
2010-2011( )
10
` `
`
`
686,242,60214,091,992
48.70
550,084,657
7,045,996
78.07
10. Related Party Disclosures:a) List of Related Parties and Relationships
Party Relation
A. NSE HousingAnd Investments Pvt. Ltd.
B. Chandler & Price (India) Pvt. Ltd.
C. JVP Industrial Training Institute
D. J V Patel Charitable Trust
E. Jethab ai V. Patel & Co.
F. Sudha Garments
G. i) Mr. Sumant J Patel
ii) Mrs. Sudha S Patel
iii) Mr. Krishna S Patel
Associate
Associate
Associate
Associate
h Associate
Associate
Key Management Personnel
Key Management Personnel
Key Management Personnel
10. b) Related Party Transactions :
Transactions NSE Housing &
Investments Pvt. Ltd
Rent income - - - - -
Lease rent paid - - - - -
Remuneration paid - - - - -
Perquisites paid - - - - -
Commission paid - - - - -
Chandler & Price (I) JVP Industrial J V Patel Jethabhai V Patel Key Management
Pvt. Ltd Training Institute Charitable Trust & Co Personnel
60,000
Credit balances as on
31.03.201 - - - -
Debit balances as on
31.03.2011 98,000 90,000 - -
26,472
4,200,000.00
1,875,177
22,917,403
1 791,215 72,361
49,422
10 c) Advances recoverable in cash or kind include 49,422/- due fromNSE Housing & Investment Pvt. Ltd. (Max. balance during the year
49,422/-), 98,000/- due from JVP Industrial Training Institute and90,000/- due from J V Patel Charitable Trust
11. Segment information for the year ended 31 March 2011:
`
` `
`
st
.
12. a) Disclosure required by Accounting Standard (AS 29)”Provisions, Contingent Liabilities and Contingent Assets” as on31.03.2011.
As on
31.03.2011
Particular
Closing balance as at 31-03-20
Closing balance as at 31-03-2010
As on
31.03.2010
i) :
Opening Balance as on 01-04-20 0
Add: Provision for the year
Less:
ii) Provision for :
Opening Balance as on 01-04-20 0
Add: Provision for the year
Less: Paid during the year
` `
i) Compensation :
Opening Balance as on 01-04-20 0
Add: Provision for the year - -
Less:
Provision for
1 127,108,000
Paid during the year - -
127,108,000
127,108,000
11 127,108,000Closing balance as at 31-03-20
i Provision for gratuity
1 9,109,000
1,256,480
Paid during the year 1.290,480
9,075,000
i leave encashment
1 1,429,000
344,508
388,508
1,385,000
9,075,000
1,787,046
1,320,046
11 9,542,000
1,385,000
417,209
401,209
1,401,000
Revenue by Industry Segment
Total
Net revenue from Operations
Segment profit before tax and Interest
Total Operating Profit Before Tax
Engineering Divisions
Less: Inter- Segment revenue -
Engineering Divisions
Bombay Exhibition Centre / Realty Division
Bombay Exhibition Centre / Realty Division
1,277,941,833
1,057,359,851
170,747,684
(50,622,000)
1,448,689,517
1,006,737,851
1,448,689,517
`

39
Annual Report 2010 - 2011Annual Report 2010 - 2011
12. b) Disclosure required by Accounting Standard (AS 15) “ActuarialValuation of Gratuity Liability” as on 31.03.2011
Discount rate 8.00%Rate of increase in compensation levels 6.00%
Projected benefit obligations (PBO)at the beginning of the yearInterest costService costBenefit paidActuarial (gain) loss on obligationsPBO at the end of the year
Fair value of plan assetsat the beginning of the year -Expected return on plan assets -ContributionsBenefit paidGain/(loss) on plan assets -Fair value of plan assetsat the end of the year -
2011I) Assumptions:
II) Table Showing Change in Benefit Obligation:
III) Tables of Fair Value of PlanAssets:
IV) The amounts to be recognized in Balance Sheet andIncome Statement and the relatedAnalysis:
V) Net Periodic Cost:
VI) Movements in the liability recognized in the Balance Sheet:
Present value of obligationFair value of plan assets -DifferenceUnrecognised actuarial gain (losses) -Unrecognised transitional liability -Liability recognised in balance sheet
Current service costInterest ostExpected return on plan assets -NetActuarial (gain) loss recognized in the yearExpenses recognized in the income statement
Opening net liabilityExpense as aboveContributions paidClosing net liability
9,075,000673,198636,670
(1,320,046)477,178
9,542,000
1,320,046(1,320,046)
9,542,000
9,542,000
9,542,000
636,670c 673,198
477,1781,787,046
9,075,0001,787,046
(1,320,046)9,542,000
12. c) Disclosure required by Accounting Standard (AS 15) “ActuarialValuation of Leave Encashment” as on 31.03.2011
Discount rate 8.00%Rate of increase in compensation levels 6.00%
2011I) Assumptions:
II) Table Showing Change in Benefit Obligation:Projected benefit obligations (PBO)at the beginning of the yearInterest costService costBenefit paidActuarial (gain) loss on obligationsPBO at the end of the year
1,385,00094,752
250,107(401,209)
72,3501,401,000
Fair value of plan assetsat the beginning of the year -Expected return on plan assets -Contributions
2011III) Tables of Fair Value of PlanAssets:
Benefit aidGain/(Loss) on plan assets -Fair value of plan assetsat the end of the year -
Present value of obligationFair value of plan assets -DifferenceUnrecognised actuarial gain (losses) -Unrecognised transitional liability -Liability recognised in balance sheet
Current service costInterest costExpected return on plan assets -NetActuarial (gain) loss recognized in the yearExpenses recognized in the income statement
Opening net liabilityExpense as aboveContributions paidClosing net liability
IV) The amounts to be recognized in Balance Sheet andIncome Statement and the relatedAnalysis:
V) Net Periodic Cost:
VI) Movements in the liability recognized in the Balance Sheet:
401,209p (401,209)
1,401,000
1,401,000
1,401,000
250,10794,752
72,350417,209
1,385,000417,209
(401,209)1,401,000
Additional information pursuant to the provision of paragraphs 3 and 4c of part IIof Schedule of the CompaniesAct, 1956.
Karamsad/Vishnoli Division13. Particulars in respect of goods manufactured:
Sr. Installed ActualNo. per annum Capacity er
Product Particulars Licence Capacityp Production
annumQty
AAs at 31.03.2011
Class of goods manufactured Engineering Division
Machines (Shot Blastingequipment)
Machines (Dust and FumeControl equipment)
Machines (Industrial Fans andBowlers)
Alloy Iron Casting/Steel ShotsAlloy Iron Casting (For captiveconsumption)
Pneumatic Power Hammers,Friction Drop Hammers
Opening stock (Qty in nos.)a) Shot Blasting machineb) Steel Shotsa) Pneumatic Hammerb) Friction Drop Hammer
200 Nos.
800 Nos.
800 Nos.
420 MT
120 Nos.
400 Nos.
1,200 Nos.
1,200 Nos.
1500 MT
120 Nos.
40 Nos.
36 Nos.
(42 Nos.)
(33 Nos.)
193 MT
NilNilNilNil

40
Annual Report 2010 - 2011Annual Report 2010 - 2011
Sr. Installed ActualNo. per annum Capacity er
Product Particulars Licence Capacityp Production
annumQty As at 31.03.2011
Closing stock (Qty in nos.)a) Shot Blasting machineb) Steel Shotsc) Pneumatic Hammerd) Friction Drop Hammer
NilNilNilNil
NOTES: Installed capacity has been certified by the Managing Director whichhas been accepted by the Auditors without verification being atechnical matter.
14. Particulars in respect of Sales and Material Consumed: Karamsad / VishnoliDivision
Sr.
No.
Particulars Qty 2010-11 2009-10
` `
SalesA .Machines (Qty in Nos.)B .Spares
Raw Materials,Components, Stores &Spares ConsumedSteel (Qty in M. Tones)Casting (Qty in M. Tones)Electric Motors (Qty inNos.)Bearings (Qty in Nos.)
Miscellaneous
Consumption (RawMaterial & Components)ImportedIndigenous
(Stores, Spares & Tools)ImportedIndigenous
76 Nos.
1,073 MT306 MT
481 Nos.
4,007 Nos.
-100.00%100.00%
-100.00%100.00%
90,892,71767,208,368
158,101,085
453.93174.4671.36
56.39
483.831,239.97
-1,207.861,207.86
-32.1132.11
( in lacs)`
76 Nos.
1129 MT
283 MT
448 Nos.
2999 Nos.
0.20%
99.80%
100.00%
-
100.00%
100.00%
179,777,510
54,212,010
233,989,520
436.32
161.62
66.04
40.16
243.02
947.16
1.82
890.34
892.16
-
55.00
55.00
( in lacs)`
A
B
C
15. 2009-10
A) Earning in Foreign exchange
ii) Other IncomeB) Value of Imports on CIF BASIS
i) Raw Materials (including Components) 181,812
ii)
C) Remittances or expenditure in foreignCurrency
i) Travelling 139,669
ii) Membership & Subscription 243,999
iii) Others
2010-11
- -
-
-
i) F.O.B. value of exports 173,753
` `
3,933,551
Capital Goods
iii) W.I.P.
45,951,469 -13,443,206 -
159,4981,589,727 -
16. Figures of the previous year have been re-arranged and re-groupedwherever necessary to confirm to the classification adopted for thecurrent year.
17. Figures in brackets related to previous year.
As per our report of evendateFor Shah & Co.
Hemendra N. ShahPartnerMembership No. 8152FRN 109430W
CharteredAccountants
Mumbai, 27 May 2011
For and on behalf of the Board
Sumant Patel
Dr. Ram S. TarnejaDirector
K Mahendra K. ChouhanDirector
Sudha PatelJt. Mg. Director
Mohan ParikhDirector
Chairman & Mg. Director
Mumbai, 27 May 2011
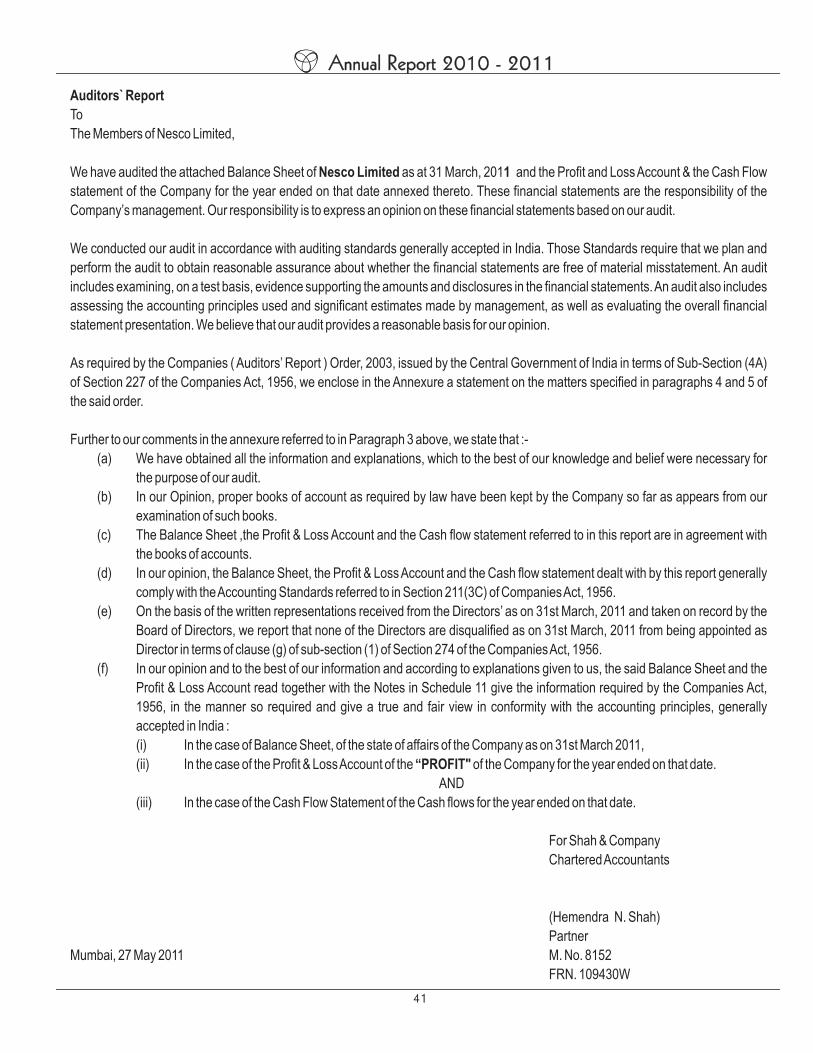
41
Annual Report 2010 - 2011Annual Report 2010 - 2011
Auditors` Report
Nesco Limited 1
“PROFIT"
To
The Members of Nesco Limited,
We have audited the attached Balance Sheet of as at 31 March, 201 and the Profit and LossAccount & the Cash Flow
statement of the Company for the year ended on that date annexed thereto. These financial statements are the responsibility of the
Company’s management. Our responsibility is to express an opinion on these financial statements based on our audit.
We conducted our audit in accordance with auditing standards generally accepted in India. Those Standards require that we plan and
perform the audit to obtain reasonable assurance about whether the financial statements are free of material misstatement. An audit
includes examining, on a test basis, evidence supporting the amounts and disclosures in the financial statements.An audit also includes
assessing the accounting principles used and significant estimates made by management, as well as evaluating the overall financial
statement presentation. We believe that our audit provides a reasonable basis for our opinion.
As required by the Companies ( Auditors’ Report ) Order, 2003, issued by the Central Government of India in terms of Sub-Section (4A)
of Section 227 of the Companies Act, 1956, we enclose in the Annexure a statement on the matters specified in paragraphs 4 and 5 of
the said order.
Further to our comments in the annexure referred to in Paragraph 3 above, we state that :-
(a) We have obtained all the information and explanations, which to the best of our knowledge and belief were necessary for
the purpose of our audit.
(b) In our Opinion, proper books of account as required by law have been kept by the Company so far as appears from our
examination of such books.
(c) The Balance Sheet ,the Profit & Loss Account and the Cash flow statement referred to in this report are in agreement with
the books of accounts.
(d) In our opinion, the Balance Sheet, the Profit & Loss Account and the Cash flow statement dealt with by this report generally
comply with theAccounting Standards referred to in Section 211(3C) of CompaniesAct, 1956.
(e) On the basis of the written representations received from the Directors’ as on and taken on record by the
Board of Directors, we report that none of the Directors are disqualified as on 31st March, 20 from being appointed as
Director in terms of clause (g) of sub-section (1) of Section 274 of the CompaniesAct, 1956.
(f) In our opinion and to the best of our information and according to explanations given to us, the said Balance Sheet and the
Profit & Loss Account read together with the Notes in Schedule 11 give the information required by the Companies Act,
1956, in the manner so required and give a true and fair view in conformity with the accounting principles, generally
accepted in India :
(i) In the case of Balance Sheet, of the state of affairs of the Company as on 31st March 2011,
(ii) In the case of the Profit & LossAccount of the of the Company for the year ended on that date.
AND
(iii) In the case of the Cash Flow Statement of the Cash flows for the year ended on that date.
For Shah & Company
CharteredAccountants
(Hemendra N. Shah)
31st March, 2011
11
Partner
Mumbai, 27 May 2011 M. No. 8152
FRN. 109430W
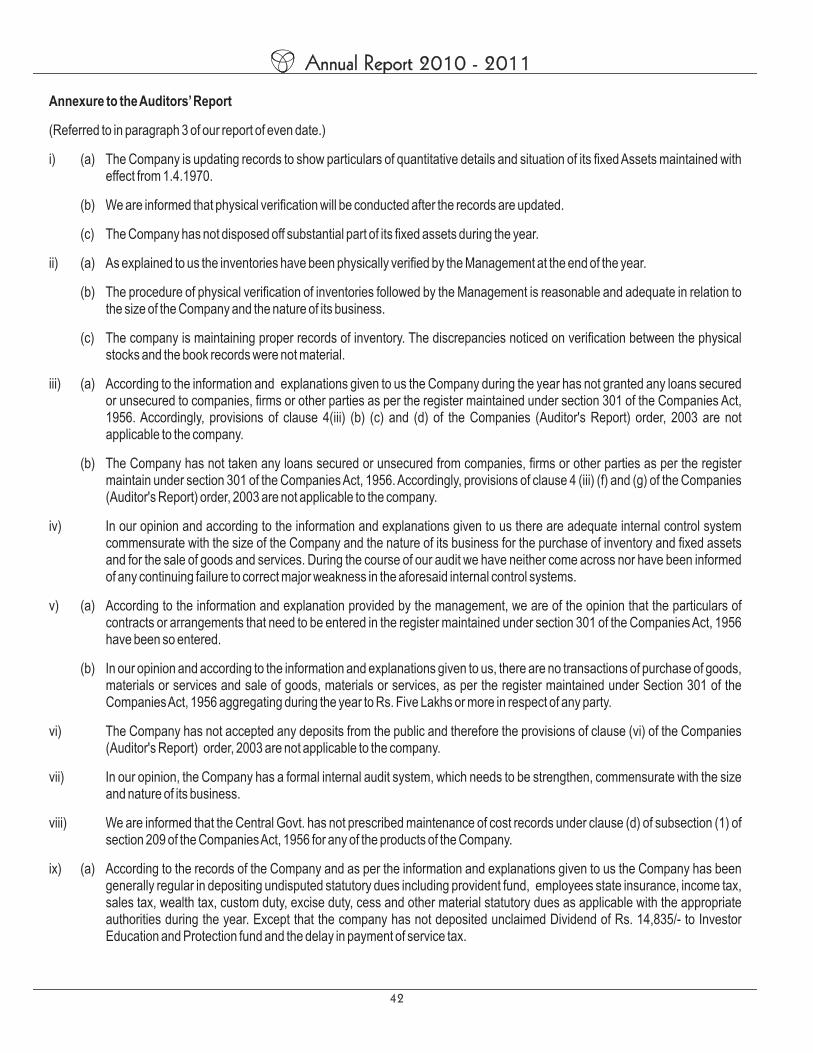
42
Annexure to theAuditors’Report
(Referred to in paragraph 3 of our report of even date.)
i) (a) The Company is updating records to show particulars of quantitative details and situation of its fixed Assets maintained witheffect from 1.4.1970.
(b) We are informed that physical verification will be conducted after the records are updated.
(c) The Company has not disposed off substantial part of its fixed assets during the year.
ii) (a) As explained to us the inventories have been physically verified by the Management at the end of the year.
(b) The procedure of physical verification of inventories followed by the Management is reasonable and adequate in relation tothe size of the Company and the nature of its business.
(c) The company is maintaining proper records of inventory. The discrepancies noticed on verification between the physicalstocks and the book records were not material.
iii) (a) According to the information and explanations given to us the Company during the year has not granted any loans securedor unsecured to companies, firms or other parties as per the register maintained under section 301 of the Companies Act,1956. Accordingly, provisions of clause 4(iii) (b) (c) and (d) of the Companies (Auditor's Report) order, 2003 are notapplicable to the company.
(b) The Company has not taken any loans secured or unsecured from companies, firms or other parties as per the registermaintain under section 301 of the CompaniesAct, 1956.Accordingly, provisions of clause 4 (iii) ( ) and ( ) off g the Companies(Auditor's Report) order, 2003 are not applicable to the company.
iv) In our opinion and according to the information and explanations given to us there are adequate internal control systemcommensurate with the size of the Company and the nature of its business for the purchase of inventory and fixed assetsand for the sale of goods and services. During the course of our audit we have neither come across nor have been informedof any continuing failure to correct major weakness in the aforesaid internal control systems.
v) (a) According to the information and explanation provided by the management, we are of the opinion that the particulars ofcontracts or arrangements that need to be entered in the register maintained under section 301 of the Companies Act, 1956have been so entered.
(b) In our opinion and according to the information and explanations given to us, there are no transactions of purchase of goods,materials or services and sale of goods, materials or services, as per the register maintained under Section 301 of theCompaniesAct, 1956 aggregating during the year to Rs. Five Lakhs or more in respect of any party.
vi) The Company has not accepted any deposits from the public and therefore the provisions of clause (vi) of the Companies(Auditor's Report) order, 2003 are not applicable to the company.
vii) In our opinion, the Company has a formal internal audit system, which needs to be strengthen, commensurate with the sizeand nature of its business.
viii) We are informed that the Central Govt. has not prescribed maintenance of cost records under clause (d) of subsection (1) ofsection 209 of the CompaniesAct, 1956 for any of the products of the Company.
ix) (a) According to the records of the Company and as per the information and explanations given to us the Company has beengenerally regular in depositing undisputed statutory dues including provident fund, employees state insurance, income tax,sales tax, wealth tax, custom duty, excise duty, cess and other material statutory dues as applicable with the appropriateauthorities during the year. Except that the company has not deposited unclaimed Dividend of Rs. 14,835/- to InvestorEducation and Protection fund and the delay in payment of service tax.
Annual Report 2010 - 2011Annual Report 2010 - 2011

43
(b) According to the information and explanation given to us, no undisputed amounts payable in respect of income tax, salestax, wealth tax, service tax, custom duty and excise duty were in arrears as at 31st March, 2011 for a period of more than sixmonths from the date they became payable.
(c) According to the information and explanations given to us by the management, there are no dues of income tax, sales tax,wealth tax, service tax, custom duty and excise duty which have not been deposited on account of any dispute.
x) The Company has no accumulated losses at the end of the financial year and has not incurred any cash losses in the currentyear and in the immediately preceeding financial year.
xi) According to the information and explanations given to us the Company has not defaulted in repayment of dues to banks.
xii) According to the information and explanations given to us, the Company has not granted any loans and advances on thebasis of security by way of pledge of shares, debentures and other securities.
xiii) The provisions of any special statute applicable to Chit fund, Nidhi or Mutual Benefit Fund / Societies are not applicable tothe Company.
xiv) According to the information and explanations given to us, the Company is not a dealer or trader in securities. The companyhas invested surplus funds in marketable securities and mutual funds, and has maintained proper records of thetransactions and contracts in respect of investments purchased and sold during the year and timely entries have been madetherein. The investments in marketable securities and mutual funds have been held by the company in its own name.
xv) According to the information and explanations given to us, the Company has not given any guarantees for loans taken byothers from banks or financial institutions.
xvi) The company has not obtained any term loans during the year.
xvii) According to the information and explanations given to us and on overall examination of the balance sheet of the Companythere are no funds raised on short term basis which have been used for long term investments.
xviii) The Company has not made any preferential allotment of shares to the parties and companies covered in the registermaintained under section 301 of the CompaniesAct, 1956.
xix) The Company has not issued any debentures during the year.
xx) The Company has not raised any money through a public issue during the year.
xxi) According to the information and explanations given to us by the management, no material fraud on or by the Company hasbeen noticed or reported during the year.
For Shah & Company
CharteredAccountants
(Hemendra N. Shah)
Partner
Mumbai, 27 May 2011 M. No. 8152
FRN. 109430W
Annual Report 2010 - 2011Annual Report 2010 - 2011

44
SIGNIFICANTACCOUNTING POLICIES1. GENERALThe Financial statements are generally prepared under the historical cost convention on an accrual basis and are in accordance with therequirements of the CompaniesAct, 1956.
2. REVENUE RECOGNITIONIncome & Expenditure are generally accounted on accrual basis.
3. FOREIGN CURRENCYTRANSACTIONSi) FixedAssets are translated into rupees at the rates prevailing on the date of purchase/acquisition.ii) Foreign currency liabilities for acquisition of fixed assets are stated at the rate prevailing on the date of purchase/acquisition.iii) Other transactions in foreign currencies are recorded at the exchange rate prevailing on the date of the transactions. Exchange
difference between the rates applicable on the date of transaction and the rate actually realized/paid are recognized asincome/expense in the Profit and LossAccount.
4. FIXEDASSETSAND DEPRECIATIONi) Fixed assets are shown at cost/revalued less accumulated depreciation.ii) Deferred revenue expenditure is written off over the period of activity to which the expenses relate.iii) Depreciation on plant & machinery and electrical installations has been provided on straight-line basis and on other assets on
written down value basis at the rates specified in Schedule XIV of the CompaniesAct, 1956.iv) Assets valuing ` 5,000/- or less has been depreciated at 100%.
5. INVESTMENTSLong Term Investments are stated at cost less provision for diminution in value other than temporary if any.
6. INVENTORIESi) Stores and spares are valued at cost.ii) Raw materials are valued at cost and components at estimated cost.iii) Finished goods are valued at cost or market value whichever is lower. Cost in case of semi finished and finished goods is determined
on the basis of cost of manufacturing. The cost includes material cost, labour cost and all other direct and indirect overheadsincluding interest.
7. RETIREMENT BENEFITSProvision for gratuity and leave encashment has been made as perAccounting Standard (15).
8. INCOMEIncome from
9. DEFERRED TAXES ON INCOMEDeferred tax is recognized for all timing differences being the difference between taxable income and accounting income that originate in oneperiod and are capable of reversal in one or more subsequent periods.
10. IMPAIRMENT OFASSETSThe Company reviews the carrying values of tangible and intangible assets for any possible impairment at each balance sheet date. Animpairment loss is recognized when the carrying amount of an asset exceeds its recoverable amount. In assessing the recoverable amount,the estimated future cash flows are discounted to their present value based on appropriate discount rates.
11. SEGMENTACCOUNTING POLICIESSegment accounting policies are in line with the accounting policies of the Company. However, the following specific accounting policies havebeen followed for segment reporting.
i) Segment revenue includes sales and other income directly identifiable with/allocable to the segment including inter-segmentrevenue.
ii) Expenses that are directly identifiable with/allocable to segments are considered for determining the segment result.
12. OTHERACCOUNTING POLICIESThese are considered with generally accepted accounting principles.
Realty division is considered on accrual basis. except in the case of rent of building at Worli under subsidised Housing Schemeon account of uncertainties of its recovery.
Annual Report 2010 - 2011Annual Report 2010 - 2011
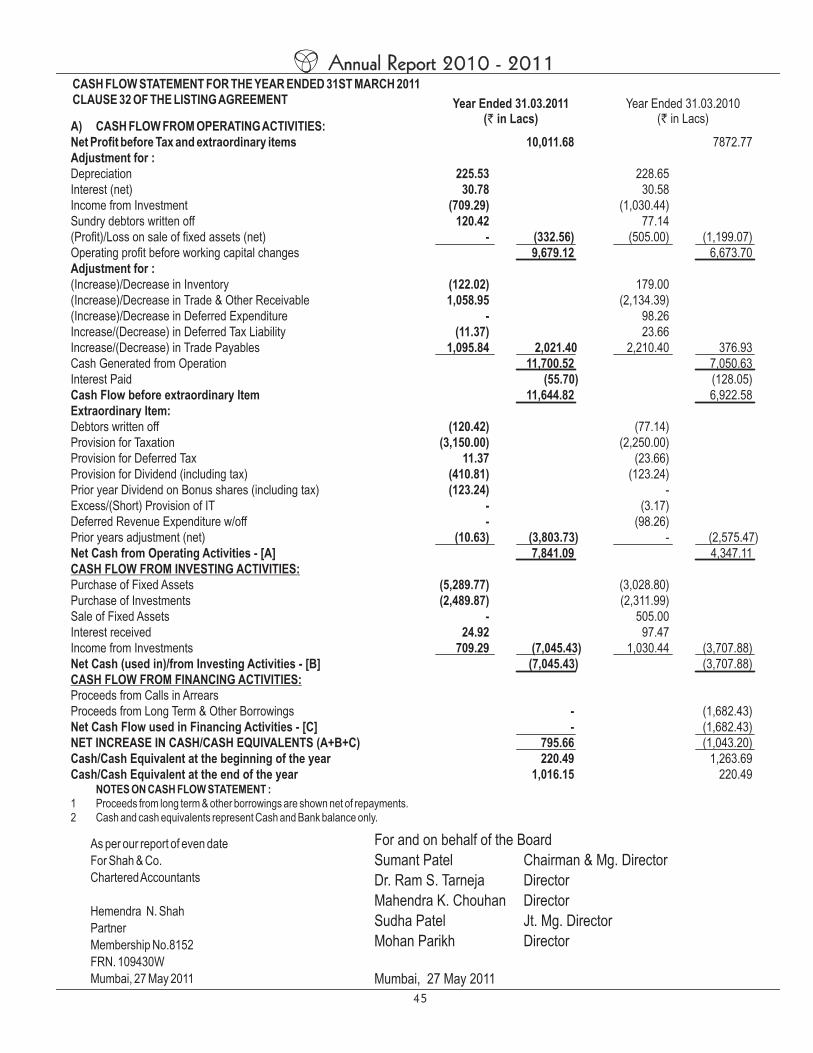
45
Annual Report 2010 - 2011Annual Report 2010 - 2011CASH FLOW STATEMENT FOR THE YEAR ENDED 31ST MARCH 2011CLAUSE 32 OF THE LISTINGAGREEMENT
A) CASH FLOW FROM OPERATINGACTIVITIES:Net Profit before Tax and extraordinary items 10,011.68Adjustment for :
225.5330.78
(709.29)120.42
- (332.56)9,679.12
Adjustment for :(122.02)1,058.95
-(11.37)
1,095.84 2,021.4011,700.52
(55.70)Cash Flow before extraordinary Item 11,644.82Extraordinary Item:
(120.42)(3,150.00)
11.37(410.81)(123.24)
--
(10.63) (3,803.73)Net Cash from Operating Activities - [A] 7,841.09
(5,289.77)(2,489.87)
-24.92
709.29 (7,045.43)Net Cash (used in)/from Investing Activities - [B] (7,045.43)
-Net Cash Flow used in Financing Activities - [C] -NET INCREASE IN CASH/CASH EQUIVALENTS (A+B+C) 795.66Cash/Cash Equivalent at the beginning of the year 220.49Cash/Cash Equivalent at the end of the year 1,016.15
7872.77
Depreciation 228.65
Interest (net) 30.58
Income from Investment (1,030.44)
Sundry debtors written off 77.14
(Profit)/Loss on sale of fixed assets (net) (505.00) (1,199.07)
Operating profit before working capital changes 6,673.70
(Increase)/Decrease in Inventory 179.00
(Increase)/Decrease in Trade & Other Receivable (2,134.39)
(Increase)/Decrease in Deferred Expenditure 98.26
Increase/(Decrease) in Deferred Tax Liability 23.66
Increase/(Decrease) in Trade Payables 2,210.40 376.93
Cash Generated from Operation 7,050.63
Interest Paid (128.05)
6,922.58
Debtors written off (77.14)
Provision for Taxation (2,250.00)
Provision for Deferred Tax (23.66)
Provision for Dividend (including tax) (123.24)
Prior year Dividend on Bonus shares (including tax) -
Excess/(Short) Provision of IT (3.17)
Deferred Revenue Expenditure w/off (98.26)
Prior years adjustment (net) - (2,575.47)
4,347.11
Purchase of Fixed Assets (3,028.80)
Purchase of Investments (2,311.99)
Sale of Fixed Assets 505.00
Interest received 97.47
Income from Investments 1,030.44 (3,707.88)
(3,707.88)
Proceeds from Calls in Arrears
Proceeds from Long Term & Other Borrowings (1,682.43)
(1,682.43)
(1,043.20)
1,263.69
220.49
CASH FLOW FROM INVESTING ACTIVITIES:
CASH FLOW FROM FINANCING ACTIVITIES:
1 Proceeds from long term & other borrowings are shown net of repayments.
2 Cash and cash equivalents represent Cash and Bank balance only.
NOTES ON CASH FLOW STATEMENT :
As per our report of even date
For Shah & Co.
CharteredAccountants
Hemendra N. Shah
Partner
Membership No.8152
Mumbai, 27 May 2011
FRN. 109430W
Year Ended 31.03.2011( in Lacs)`
Year Ended 31.03.2010( in Lacs)`
For and on behalf of the Board
Sumant Patel Chairman & Mg. Director
Dr. Ram S. Tarneja Director
Mahendra K. Chouhan Director
Sudha Patel Jt. Mg. Director
Mohan Parikh Director
Mumbai, 27 May 2011

46
Annual Report 2010 - 2011Annual Report 2010 - 2011Information pursuant to part IV of Schedule VI to CompaniesAct, 1956
Balance SheetAbstract and Company’s General Business Profile
I Registration details
II Capital raised during the year
III Position of Mobilisation and Deployment of Funds
Total Liabilities
Sources of Funds
Application of Funds
IV Performance of the Company
V Generic Names of Three Principal Products/Services of Company
Registration No. 4 8 8 6 State Code 1 1
Balance Sheet Date 3 1 - 0 3 - 1 1
Date Month Year
( In lacs)
Public Issue Right issue
N I L N I L
Bonus Issue Private Placement
7 0 4 5 9 9 6 N I L
( in Lacs)
2 2 8 6 2 . 6 7 TotalAssets
Paid up capital 1 4 0 9 . 2 0 Reserves & Surplus 2 1 3 6 7 . 6 5
Secured Loan N I L Unsecured Loan N I L
Deferred Tax Liability 8 5 . 8 2
Net FixedAssets 1 1 3 2 9 . 4 6 Investments 1 5 8 5 8 . 2 1
Net CurrentAssets ( 4 3 2 5 . 0 0 ) Misc. Expenditure N I L
Accumulated Loses N I L
(Rs. In Lacs)
Turnover (Including . Total Expenditure
+ - + -
Profit/Loss Before Tax 1 0 0 1 1 . 6 8 Profit/LossAfter Tax 6 8 6 2 . 4 3
Earning per Share in Rs. 4 8 . 7 0 Dividend Rate % 2 5
(as per monetary terms)
Item Code No. (HS Code) 8 4 6 2
Products Description E N G I N E E R I N G E Q U I P M E N T
Item Code No. (HS Code) 9 9 7 0
Products Description E X H I B I T I O N C E N T R E
Item Code No. (HS Code) 9 9 4 0
Products Description R E A L T Y
`
`
2 2 8 6 2 . 6 7
other income) 1 4 4 8 6 8 9 4 4 7 5 . 2 1
As per our report of even date
For Shah & Co.
CharteredAccountants
Hemendra N. Shah
Partner
Membership No.8152
Mumbai, May 27, 2011
FRN. 109430W
� �
For and on behalf of the Board
Sumant Patel Chairman & Mg. Director
Dr. Ram S. Tarneja Director
Mahendra K. Chouhan Director
Sudha Patel Jt. Mg. Director
Mohan Parikh Director
Mumbai, 27 May 2011

Annual Report 2010 - 2011Annual Report 2010 - 2011
Nesco LimitedRegd. Office : Nesco Complex, Western Express Highway, Goregaon (East), Mumbai - 400 063.
ATTENDANCE SLIPPLEASE COMPLETE THISATTENDANCE SLIPAND HAND IT OVERATTHE ENTRANCE OF THE MEETING HALL.Joint Shareholders may obtain additionalAttendance Slips on request.
NAME &ADDRESS OF THE SHAREHOLDER REGD. FOLIO/DPID & CLIENT ID. NO. .......................................
I hereby record my presence at the 52ndANNUALGENERALMEETING of the Company held on Friday,12thAugust, 2011 at 3.30 p.m.at Regd. Office situated at Nesco Complex, Western Express Highway, Goregaon East, Mumbai -400 063.
ANNUALGENERAL MEETING of the Company held on & at any adjournment
thereof. As witness my/our hand(s) this ............................................................................................................................
......................................................................................... day of ....................................... 2011.
Signed by the said ...............................................................
No instrument of proxy shall be valid unless in the case of an individual shareholder it is signed by him or by his attorney duly authorized
in writing, or in the case of joint holders, it is signed by the shareholder’s first named in the Register or his attorney duly authorized in
writing, or in the case of a Company it is executed under its common seal, if any, or signed by its attorney duly authorised in writing.
Provided that an instrument of proxy shall be sufficiently signed by any shareholder, who is, for any reason, unable to write his name, if
his mark is affixed thereto and attested by a Judge, Magistrate, Justice of Peace , Registrar or Sub-Registrar of Assurances, or other
Government Gazetted Office.
The proxy must be returned so as to reach the Registered Office of the Company not less than 48 hours before the time for holding the
aforesaid meeting. The Proxy need not be a member of the Company.
NO. OF SHARES HELD :
SIGNATURE OF THE SHAREHOLDER / PROXY ** Strike out whichever is not applicable.
I/We ................................................................................................................................................................................
of .............................................. being a member / members of Nesco Limited holding shares nos
.................................................. on the Register of the shareholders of the Company do hereby appoint
.................................................................. of ............................................ or failing him / her
.................................................................. of ........................................................... as my/our proxy to vote for me/us and
on my/our behalf at the
................................REGD. FOLIO/DPID & CLIENT ID. NO.
52nd Friday,12thAugust, 2011
Nesco LimitedRegd. Office : Nesco Complex, Western Express Highway, Goregaon (East), Mumbai - 400 063.
Affix aRevenueStamp
PROXY FORM


BOMBAY CONVENTION & CENTREEXHIBITIONBOMBAY CONVENTION & CENTREEXHIBITION

INDABRATOR
SURFACE PREPARATION SYSTEM FOR ROLL ETCHING
MANUFACTURED BY

Regd. Office & Sales Offices
Regd. Office :
Nesco Complex,
Western Express Highway,
Goregaon (E),
Mumbai 400 063.
New Delhi Office :
B - 1 - 102, 10th Floor,
Himalaya House,
Curzon Road,
New Delhi 110 001.
Chennai Office :
Fagun Mansion,
26, Commander-in-Cheif Road,
Chennai 600 015.
Kolkatta Office :
Benoy Bhavan,
27 - B, 5th Floor,
Camac Street,Kolkatta 700 016
Karmasad Plant :
Anand Sojitra Road,
Karamsad.
Vishnoli Plant :
Nadiad Khambat Road,
Vishnoli.

If undelivered please return to :
NESCO LIMITED
Nesco Complex,
Western Express Highway,
Goregaon (East)
Mumbai - 400 063.
BOOK - POST