5 why’s technique and cause and effect analysis
TRANSCRIPT

5 Why’s Technique and Cause and Effect Analysis
UWU/EAG/13/00UWU/EAG/13/0035

5 Why’s Technique History•Invented in the 1930’s by Toyota Founder Kiichiro Toyoda’s father Sakichi and made popular in the 1970s•by the Toyota Production System, the 5 Whys strategy involves looking at any problem and asking,
“Why?” and “What caused this problem?”

5 Why’s Technique
Definition• By asking the question "Why" you can separate the symptoms from the causes of a problem•Using the technique effectively will define the root cause and defining effective long term corrective actions

5 Why’s Technique
Why?
Why?
Why?
Why?
Why? Root Cause

5 Why’s TechniqueProcess of 5 Why
1. Write Down the Specific Problem2. Ask WHY the Problem happened and write down the Answer3. If the Answer is not the Root Cause, Ask WHY the Answer
happened and write down the new Answer4. Repeat Step 3 until the team agrees that the Root Cause has been
identified
◦ - May take more or less than 5 Whys◦ - Keep asking until you can no longer answer


5 Why’s TechniquePROBLEM STATEMENT: Pizza Delivered Cold
5 Why’s Technique Advantages of 5 why’s Technique 1.Simplicity: It is easy to use and requires no advanced mathematics or tools(simple tool)
2. Effectiveness: It truly helps to quickly separate symptoms from causes and identify the root cause of a problem(quick)3. Comprehensiveness: It aids in determining the relationships between various problem causes

5 Why’s TechniqueAdvantages of 5 why’s Technique ( Cont.)4. Flexibility: It works well alone and when combined with other quality improvement and troubleshooting techniques 6. Inexpensive: It is a guided, team focused exercise, There are no additional costs(team approach)
7. Easy to learn and Easy to use

5 Why’s Technique Disadvantages of 5 Whys Analysis•it is essentially a very simple tool •may not be suitable for complex problems • be confused with an in depth analytical tool • the more complicated a situation that 5 Whys Analysis will lead you the wrong way

Cause & Effect Analysis

Outline Introduction
Steps in Cause & Effect Analysis
Example
Advantages & Disadvantages

Introduction Cause & Effect Analysis
Founder : Professor Kaoru Ishikawa(1960s) Use to Identify Likely Causes of Problems Diagram-based technique Combines Brainstorming with Mind Mapping Originally developed as a quality control tool


Can use for, -Discover the root cause of a problem -Uncover bottlenecks in processes -Identify where and why a process isn't working

Known as,
Cause and Effect Diagrams
Fishbone Diagrams
Ishikawa Diagrams
Herringbone Diagrams
Fishikawa Diagrams

Steps in Cause & Effect Analysis
There are four steps to using the tool
1.Identify the problem
2.Work out the major factors involved
3.Identify possible causes
4. Analyze your diagram

Example Step 1: Identify the Problem Example:
Owner of a coffee shop identifies coffee made by his shop are not tasty
Bad Coffee
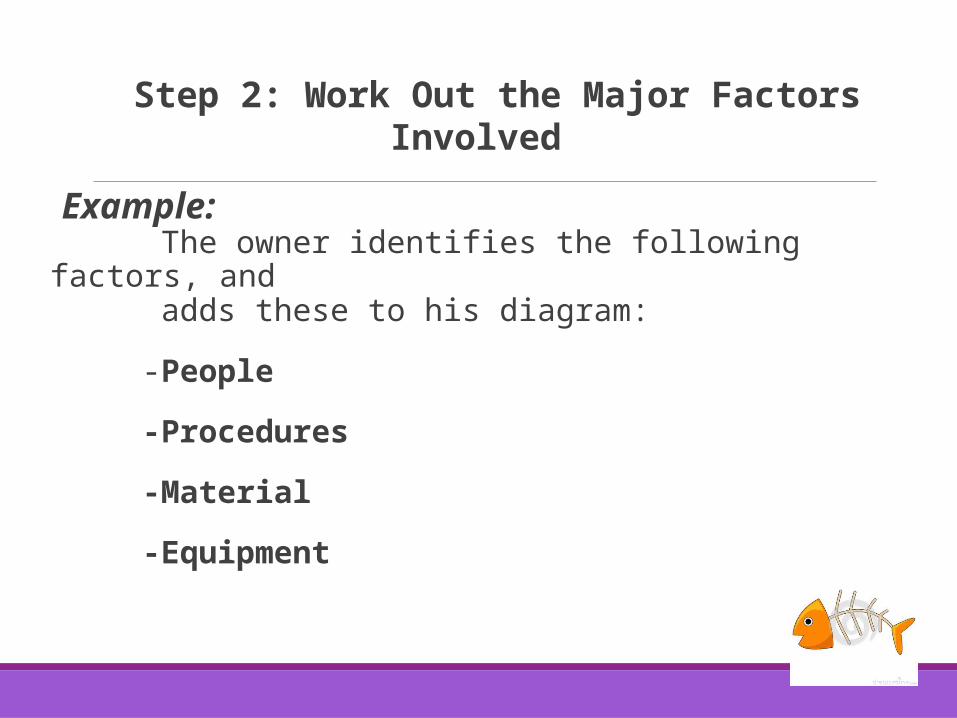
Step 2: Work Out the Major Factors Involved
Example: The owner identifies the following factors, and adds these to his diagram:
-People
-Procedures
-Material
-Equipment

People Procedures
Material Equipment
Bad Coffee

Step 3: Identify Possible Causes Example: For each of the factors he identified in step 2, the owner brainstorms possible causes of the problem, and adds these to his diagram

People Procedures
Material Equipment
Bad Coffee
No Training Wrong Fee
Too much coffee
Too much water
Too many grounds
Bad Cream
Bad Sugar Dirty Cups
Coffee not hot enough
Wrong size filter
Packet is wetOutdated
Warmer not working
No Training

Step 4: Analyze Your Diagram Example: The owner analyze his diagram & identify the solutions for the problem
- Giving training to workers
- Repairing & buying equipments
- Buying quality ingredients
- Paying relevant salaries for workers

Advantages & Disadvantages Advantages
• Helps to formulate theories about possible cause & effect relationships
• Shows subordinate relationships• Provides basis for experimental plan or data collection plan
• Shows areas of weakness• Easy to implement• Avoids overlooking any possible root causes

Disadvantages
• Main categories must be known in advanced• If category is left out, it limit the thinking• Many ideas & subcategories makes diagram complex• Sometimes difficult to determine subordinate relationships• Does not evaluate relative importance of ideas• Diagram can not substitute for numerical data

Thank you………!