5. materials and methods - shodhgangashodhganga.inflibnet.ac.in/bitstream/10603/35967/10/10_chapter...
TRANSCRIPT

Materials and Methods
47 | P a g e
5. MATERIALS AND METHODS
5.1 Materials Table 3. List of materials
S. No. Materials/Chemicals Manufacturer/Supplier
1 Artemether IPCA Laboratories, Mumbai, India
2 Curcumin Sami Laboratories, Bangalore, India
3 Simvastatin Ind Swift Pvt. Ltd, Chandigarh, India
4 Acetonitrile( HPLC grade) Sigma chemical Ltd., USA
5 0.5% Triethylamine Sigma chemical Ltd., USA
6 Ammonium acetate Rankem Ltd., Delhi, India
7 Isopropyl alcohol Rankem Ltd., Delhi, India
8 Capmul MCM Abitec, USA
9 Captex 8000 Abitec, USA
10 Captex 500 Abitec, USA
11 Captex 300 Abitec, USA
12 Glyceryl monostearate (Capmul GMS-50K) Abitec, USA
13 Plurol oleique CC 497 Gattefosse, Mumbai, India
14 Labrafac lipophile WL 1349 Gattefosse, Mumbai, India
15 Labrasol Gattefosse, Mumbai, India
16 Compritol 888 ATO (Glyceryl dibehenate) Gattefosse, Mumbai, India
17 Precirol ATO 5 (Glyceryle distearate) Gattefosse, Mumbai, India
18 Cremophor EL BASF, Mumbai, India
19 Medium chain triglyceride Lipoid GmbH, Ludwigshafen, Germany
20 Stearic acid S.D Fine chemicals Ltd. Mumbai, India
21 Tween 80 LR S.D Fine chemicals Ltd. Mumbai, India
22 Tween 20 LR S.D Fine chemicals Ltd., Mumbai, India
23 Ethanol S.D Fine chemicals Ltd., Mumbai, India
24 Potassium bromide (IR Grade) S.D Fine Chemicals Ltd., Mumbai, India
25 Lactose AR S.D Fine Chemicals Ltd., Mumbai, India
26 Sucrose AR S.D Fine Chemicals Ltd., Mumbai, India
27 Dextrose AR S.D Fine Chemicals Ltd., Mumbai, India
28 Orthophosphoric acid LR S.D Fine Chemicals Ltd., Mumbai, India
29 Sodium chloride AR S.D Fine Chemicals Ltd., Mumbai, India
30 Potassium chloride AR S.D Fine Chemicals Ltd., Mumbai, India
31 Polyethylene glycol 400 LR S.D Fine Chemicals Ltd., Mumbai, India
32 Polyethylene glycol 200 LR S.D Fine Chemicals Ltd., Mumbai, India
33 Calcium chloride AR Merck Pvt Ltd., Mumbai, India
34 Trimyristin Sigma Aldrich, Bangalore, India
35 Pluronic F68 (Polaxamer 188) Sigma Aldrich, Bangalore, India
36 Triton X 100 Sigma Aldrich, St Louis, USA
37 Dialysis bag (MWCO-12,000-14,000 g/mL) Himedia labs, Mumbai, India
38 Hydrochloric acid Fischer Chemicals Ltd., Mumbai, India
39 Dimethyl sulfoxide Qualigens, Fine Chemicals, Mumbai, India
40 Ethylene diamine tetraacetic acid Loba Chemie Pvt Ltd., Mumbai, India
41 Sodium lauryl sulphate Loba Chemie Pvt Ltd., Mumbai, India
42 Monosodium phosphate anhydrous Loba Chemie Pvt Ltd., Mumbai, India
43 Disodium phosphate anhydrous Loba Chemie Pvt Ltd., Mumbai, India

Materials and Methods
48 | P a g e
5.2 Equipments Table 4. List of equipments
5.3 Selection of drugs
The present parenteral therapy for management of CM consists of either quinine,
quinidine, ARM or ARS. Among these drugs, ARM was selected as a potent lipophilic
anti-malarial drug. Based on the literature survey, CUR was selected as an
immunomodulatory and anti-malarial agent for an adjunctive therapy. ARM is rapidly
acting drug whereas CUR has been found to exert sustained ant-malarial action in
animal studies. This is a prerequisite for the selection of drugs for an adjunctive therapy.
S. No. Equipment Manufacturer/Supplier
1 UV/Visible spectrophotometer UV-1700 series, Shimadzu, Japan
2 High performance liquid chromatography Shimadzu LC 2010A HT, Japan
3 Fourier transform infrared spectrophotometer Shimadzu, Japan
4 Differential Scanning Calorimeter DSC Q 200 TA Instruments, USA
5 Powder X-Ray Diffractometer Bruker AXS D8, USA
6 Zetasizer Malvern ZS 90, UK
7 Transmission electron microscope Topcon 002B, USA
8 Scanning electron microscope FEI Quanta 200F SEM/EDAX, UK
9 Franz diffusion cells Kovai Glass Works, Coimbatore, India
10 Dissolution apparatus Labindia, Mumbai, India
11 Deep freezer Labline Instruments, Kochi, India
12 Freeze dryer Christ alpha 2-4 LD plus, Germany
13 Brookfield DV II Ultra+Viscometer Brookfield Engineering Laboratories, Inc., USA
14 Electroconductometer (Conductivity meter 305) Systronic, Mumbai, India
15 Centrifuge Remi Instruments, Mumbai, India
16 Digital pH meter Eutech Instruments, Mumbai, India
17 Digital electronic balance Sartorius, Bangalore, India
18 Magnetic stirrer Remi Equipments, Mumbai
19 Blade stirrer with speed regulator Remi Instruments, Mumbai, India
20 Vortex mixer Yorco Instruments, Delhi, India
21 Sonicator Bandelin RK 100 H, Germany
22 Isothermal shaker IKA® KS 400I, Germany
23 Dissolution apparatus Electro lab, Mumbai, India
24 Water bath Scientec, Mumbai, India
25 Abbe’s Refractometer Bausch and Lomb Optical Company, NY, USA
26 Light microscope Olympus BX-51, Thornwood, USA
27 Laser scanning confocal microscope Carl Zeiss, NY, USA

Materials and Methods
49 | P a g e
5.4 Drug Profile
5.4.1 Artemether
Source and chemical nature: It is a methyl ether derivative of artemisinin isolated from
the Chinese anti-malarial plant, Artemisia annua; family: Asteraceae. Structurally, it is a
sesquiterpene lactone with an inner peroxide bridge which is responsible for its anti-
malarial activity. It is also known as DHA methyl ether and is relatively lipophilic drug.
Physico-chemical Properties
Molecular formula: C16H26O5
Molecular weight: 298.37g/mol
Melting point: 86-90°C
Occurrence: white crystalline powder
Log P: 3.02-3.48
pKa (strongest basic): -3.9
Solubility: ARM is practically insoluble in water; very soluble in dichloromethane,
dimethylsulfoxide and dimethyl formamide; freely soluble in ethyl acetate, methanol and
ethanol.
Pharmacokinetics: Although ARM is a potent antimalarial, poor bioavailability and
rapid clearance are observed with it in both human and animal models due to extensive
first pass metabolism. The absorption of ARM is increased when taken with food. In
healthy, normal volunteers, orally administered ARM is metabolized in the liver to its
active metabolite, DHA by cytochrome P450 enzymes (3A4, 3A5, 2C19 and 2B6) having
half life of ~1 h.
Half life: 3-5h
Protein binding: 95.4%
Bioavailability: low oral bioavailability (~40%)
Pharmacological properties: It possesses anti-malarial, anti-protozoal, anti-helminthic
and anti-cancer activities.
Toxicity: Animal studies on acute toxicity show that the LD50 of ARM in mice is
300mg/kg/day for oral and 50mg/kg/day for IM administration; in rats, the LD50 is a
single IM injection of 597mg/kg dose.
Stability: Due to the effect of endoperoxide linkage, ARM is quite unstable under heat
and it easily decomposes, most probably by the opening of the lactone ring. In addition,
it undergoes degradation in acidic conditions and is sensitive to light.

Materials and Methods
50 | P a g e
5.4.2 Curcumin
Source and chemical nature: It is a hydrophobic polyphenol isolated from the rhizomes
of turmeric (Curcuma longa L.) and related species (family: Zingiberaceae), has been used
traditionally as an Indian spice. It is a bis-α, β-unsaturated β-diketone.
Physico-chemical Properties
Molecular formula: C21H20O6
Molecular weight: 368.38g/mol
Melting point: 179-183°C
Occurrence: bright yellow crystalline solid
Log P: 2.85
pKa: 7.8, 8.5 and 9.0
Solubility: Sparingly soluble in water and ether; readily soluble in dimethylsulfoxide,
dimethyl formamide, glacial acetic acid, ethanol or acetone. The solubility of drug in
these solvents is ~1mg/mL, and in acetone it is ~20mg/mL.
Pharmacokinetics: CUR shows low systemic bioavailability after oral dosing, probably
due to rapid first-pass metabolism and some degree of intestinal pre-metabolism. Its
metabolism on the one hand involves, successive reductions, which transform CUR to
hexahydrocurcuminol and hexahydrocurcumin (probably through the intermediates
dihydrocurcumin and tetrahydrocurcumin), and, on the other hand, rapid molecular
modification by conjugation, mostly in the liver, to glucuronide, sulfate and glucuronide-
sulfate forms. Moreover, when given orally, 40% of the drug is excreted unchanged in the
feces. It also undergoes extensive enterohepatic recirculation, resulting in its rapid
elimination in bile and urine.
Half life: 1.39h
Protein binding: 60%
Bioavailability: low oral bioavailability (<0.1%)
Pharmacological properties: A large number of in vitro and in vivo studies in both
animals and humans have indicated that CUR exhibits promising pharmacological
activities including anti-oxidant, anti-inflammatory, anti-angiogenic, anti-spasmodic,
anti-microbial and anti-plasmodial activities.
Toxicity: Even at 8g/day, no toxicity is reported from humans and animals.
Stability: Under physiological conditions, CUR can exist in both an enol and a bis-keto
form, which coexist in equilibrium. In acidic and neutral solutions as well as in the solid
state, keto form predominates, and CUR acts as a potent donor of H-atoms. In contrast,

Materials and Methods
51 | P a g e
under alkaline conditions (≥pH 8), the enolic form predominates, and the phenolic part
of the molecule plays the principal role as an electron donor. In solution, it has been
demonstrated that 90% of CUR degrades to trans-6-(4’-hydroxy-3’-methoxyphenyl)-2,4-
dioxo-5-hexanal,vanillin, feruloylmethane, and ferulic acid within 30min. CUR is
similarly unstable at basic pH. Yellow CUR changes to dark red colour at alkaline pH
and under physiological conditions the λ max for CUR is observed at 420nm. Aqueous
solution of CUR should not be stored for more than 12h. It should be kept in a tightly
closed container, protected from light and stored in a cool place.
5.5 Analytical method development
Qualitative and quantitative analysis of ARM and CUR were developed using reverse
phase-high performance liquid chromatography (RP-HPLC).
5.5.1 Selection of detection wavelength
100µg/mL concentration (conc.) of ARM and CUR solutions was prepared separately in
acetonitrile (ACN). The solutions were scanned in the UV-Visible region of 200-800nm
and the spectrum was recorded using photodiode array (PDA).
5.5.2 Preparation of standard stock solutions
10mg of ARM and CUR working standards were accurately weighed and transferred
into a 10mL volumetric flask separately and dissolved in ACN and made up to the
volume with the same solvent to produce 1mg/mL (1000µg/mL) of ARM and CUR
stock solutions, respectively. Stock solutions were further diluted to 100µg/mL by taking
10mL of respective drug solution (1mg/mL) and diluting upto 100mL in volumetric
flask with ACN. These solutions were then stored in the refrigerator at 5oC±3oC until
further analysis.
5.5.3 Linearity and range of artemether
Linearity and range were analyzed by preparing calibration curves using different conc.
of the standard solution. Calibration curve was plotted using mean peak area (x) versus
the respective conc. (y) of standard drug solutions. Linearity for ARM was established
over the range of 2-25µg/mL using the weighted least square regression analysis. From
the stock solution (100µg/mL), aliquots of 0.2, 0.4, 0.5, 1.0, 1.5, 2.0 and 2.5mL were
pipetted out in 10mL volumetric flasks and made up to the volume with ACN to obtain
the conc. of 2-25µg/mL and analyzed at 209nm by RP-HPLC. Calibration curve data
was subjected to linear regression analysis to obtain intercept, slope and regression
equation. All measurements were made in triplicate and mean±S.D. was recorded.
Materials and Methods
52 | P a g e
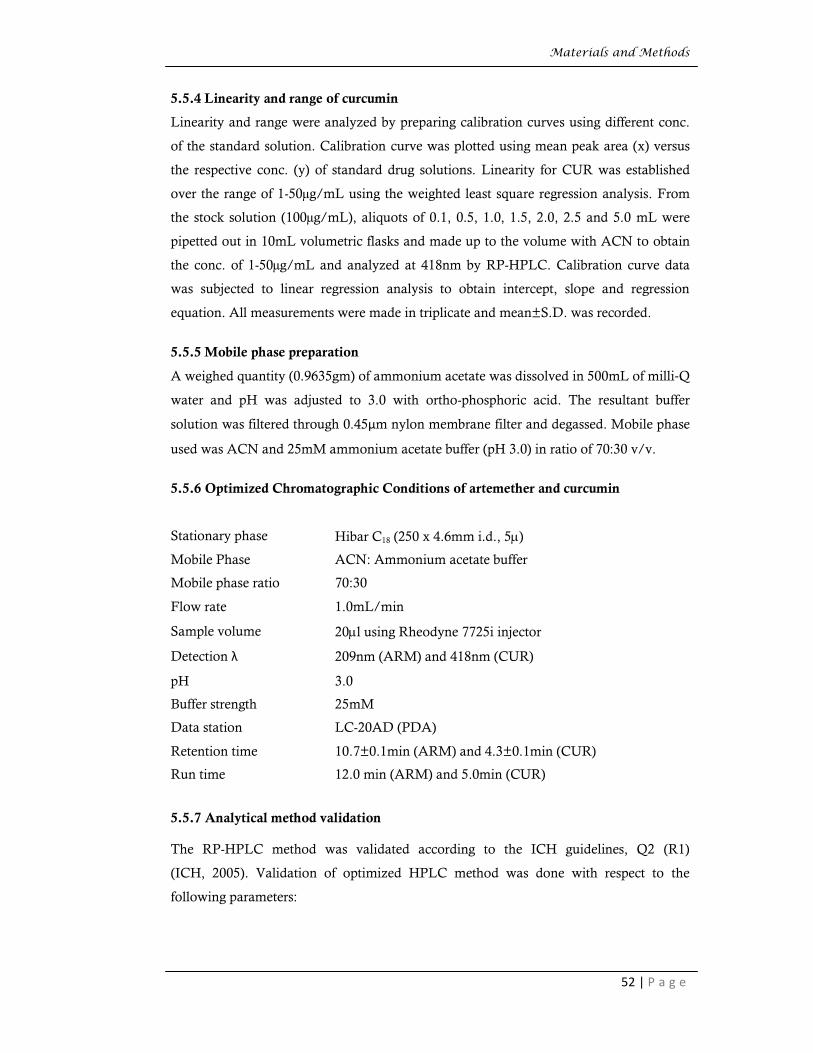
5.5.4 Linearity and range of curcumin
Linearity and range were analyzed by preparing calibration curves using different conc.
of the standard solution. Calibration curve was plotted using mean peak area (x) versus
the respective conc. (y) of standard drug solutions. Linearity for CUR was established
over the range of 1-50µg/mL using the weighted least square regression analysis. From
the stock solution (100µg/mL), aliquots of 0.1, 0.5, 1.0, 1.5, 2.0, 2.5 and 5.0 mL were
pipetted out in 10mL volumetric flasks and made up to the volume with ACN to obtain
the conc. of 1-50µg/mL and analyzed at 418nm by RP-HPLC. Calibration curve data
was subjected to linear regression analysis to obtain intercept, slope and regression
equation. All measurements were made in triplicate and mean±S.D. was recorded.
5.5.5 Mobile phase preparation
A weighed quantity (0.9635gm) of ammonium acetate was dissolved in 500mL of milli Q
water and pH was adjusted to 3.0 with ortho-phosphoric acid. The resultant buffer
solution was filtered through 0.45μm nylon membrane filter and degassed. Mobile phase
used was ACN and 25mM ammonium acetate buffer (pH 3.0) in ratio of 70:30 v/v.
5.5.6 Optimized Chromatographic Conditions of artemether and curcumin
5.5.7 Analytical method validation
The RP-HPLC method was validated according to the ICH guidelines, Q2 (R1)
(ICH, 2005). Validation of optimized HPLC method was done with respect to the
following parameters:
Stationary phase Hibar C18 (250 x 4.6mm i.d., 5m)
Mobile Phase ACN: Ammonium acetate buffer
Mobile phase ratio 70:30
Flow rate 1.0mL/min
Sample volume 20ml using Rheodyne 7725i injector
Detection λ 209nm (ARM) and 418nm (CUR)
pH 3.0
Buffer strength 25mM
Data station LC-20AD (PDA)
Retention time 10.7±0.1min (ARM) and 4.3±0.1min (CUR)
Run time 12.0 min (ARM) and 5.0min (CUR)

Materials and Methods
53 | P a g e
Specificity
Specificity is the ability of a method to discriminate between the intended analyte and
other components in the sample. A method is said to be specific when it produces a
response only for a single analyte in the presence of other interferences. The specificity of
the method is to analyze unequivocally the analyte in the presence of other endogenous
compounds (degradants, excipients, impurities). It was carried out by comparing the
standard retention time spectra and the sample retention time spectra.
Accuracy
Accuracy is expressed as the closeness of agreement of trueness. It was determined by
standard addition method. For this purpose, known quantities of ARM and CUR were
supplemented to the sample solution previously analyzed. The results of this solution
were compared with the true results. This experiment was carried out by analyzing
replicates (n=6) at 3 quality control (QC) levels. The mean, standard deviation (S.D.) and
percentage relative standard deviation (% R.S.D.) was calculated. Accuracy was
calculated by comparing the averaged measured conc. to the actual conc., and was
expressed in percentage nominal.
%Nominal = (Measured conc./Actual conc.) x 100
Precision
Precision was measured by interday (day to day precision, on 3 different days) and
intraday (repeatability on the same day) variations by analyzing 6 replicates over 3
different conc. of ARM (5.0, 10.0, 15.0µg/mL) and CUR (7.5, 15.0, 22.5µg/mL) at same
optimized chromatographic conditions. Precision was evaluated by calculating the
relative standard deviation (R.S.D.) of measured conc. at each sample based on linearity
plots. In all situations, R.S.D. values were <5%, which was considered to be acceptable.
%R.S.D. = (S.D./Mean) x 100
Limit of detection and quantitation
Limit of detection (LOD) and quantitation (LOQ) of the method were estimated by
injecting a series of dilute solutions with known conc. by visual observation and
signal-to-noise ratio.
LOD = 3.3 σ/s;
LOQ = 10 σ/s,
where, σ is the standard deviation of response and s is slope of the calibration curve

Materials and Methods
54 | P a g e
Robustness
Robustness of the method was studied by injecting the standard solutions with slight
variations in the optimized conditions ±4% in the ratio of ACN in mobile phase, ±0.1
mL of the flow rate and ±0.1 in the pH value.
5.6 Bioanalytical method development
Bioanalytical methods were developed for estimation of ARM and CUR in rat plasma by
RP-HPLC.
5.6.1 Preparation of standard stock solutions
10mg of ARM and CUR working standards were accurately weighed and transferred
into a 10mL volumetric flask separately and dissolved in ACN and made up to the
volume with the same solvent to produce a 1mg/mL (1000µg/mL) of ARM and CUR
stock solutions, respectively. Stock solutions were further diluted to 100µg/mL by taking
10mL of respective drug solution (1mg/mL) and diluting upto 100mL in volumetric flask
with ACN. These solutions were then stored in the refrigerator at -200C ± 20C until
further analysis.
5.6.2 Linearity and range for artemether
Seven point calibration curve was prepared by serial dilution of ARM stock solution
(100µg/mL) in the range of 1-15µg/mL. The concentrations were corrected for potency
and amount weighed. Calibration standards were prepared daily by spiking 0.2mL of
blank plasma with 200µL of the appropriate working solution resulting in conc. of 1, 2, 4,
5, 10, 12 and 15µg of ARM per mL plasma. 200µL of CUR was added as an internal
standard (IS) at conc. of 50ng/mL. To the resulting solution, 200µL of precipitating
agent (10% perchloric acid) was added. The mixture was vortexed for 5min and
centrifuged at 4000rpm for 10min. The supernatant layer was separated and analyzed. A
plot with the resulting peak area ratios of ARM to IS (response factor) was obtained
against the conc. QC samples viz. low quality control (LQC) 2µg/mL, medium quality
control (MQC) 10µg/mL and high quality control (HQC) 15µg/mL were prepared by
spiking 200µL aliquot of blank plasma with 200µL of spiking solution of drug as well as
the IS. All solutions were stored in the refrigerator at 5.0±3.0oC. The bulk spiked
calibration and QC samples were stored at -20oC until further analysis.
5.6.3 Linearity and range of curcumin
Seven point calibration curve was prepared by serial dilution of CUR stock solution
(100µg/mL) in the range of 50-2000ng/mL. The concentrations were corrected for
potency and amount weighed. Calibration standards were prepared daily by spiking
0.2mL of blank plasma with 200µL of the appropriate working solution resulting in conc.

Materials and Methods
55 | P a g e
of 50, 100, 125, 250, 500, 1000 and 2000ng of CUR per mL plasma. 200µL of simvastatin
was added as an internal standard (IS) at conc. of 500ng/mL. To the resulting solution,
200µL of precipitating agent (10% perchloric acid) was added. The mixture was vortexed
for 5min and centrifuged at 4000rpm for 10min. A plot with the resulting peak area ratios
of CUR to IS (response factor) was obtained against the conc. QC samples viz. LQC
75ng/mL, MQC 750ng/mL and HQC 1250ng/mL were prepared by spiking 200µL
aliquot of blank plasma with 200µL of spiking solution of drug as well as the IS. All
solutions were stored in the refrigerator at 5.0±3.0oC. The bulk spiked calibration and
QC samples were stored at -20oC until further analysis.
5.6.4 Preparation of blank plasma
Blank plasma (200µL) was transferred into 2.0mL centrifuge tube and 200µL of
precipitating agent (10% perchloric acid) were added. The resulting solution was
vortexed for 5min and centrifuged at 4000rpm for 10min. The supernatant layer was
separated and analyzed.
5.6.5 Mobile phase preparation
A weighed quantity (0.9635gm) of ammonium acetate was dissolved in 500mL of milli Q
water and the pH was adjusted to 3.0 with ortho-phosphoric acid. The resultant buffer
solution was filtered through 0.45μm nylon membrane filter and degassed. Mobile phase
used was ACN and 25mM ammonium acetate buffer (pH 3.0) in the ratio of 70:30 v/v.
5.6.6 Optimized Chromatographic Conditions for artemether and curcumin
Stationary phase Hibar C18 (250 x 4.6mm i.d., 5m)
Mobile Phase ACN: Ammonium acetate buffer
Mobile phase ratio 70:30
Flow rate 1.0mL/min
Sample volume 20ml using Rheodyne 7725 i injector
Detection λ 209nm (ARM) and 232nm (CUR)
Ph 3.0
Buffer strength 25mM
Data station LC-20AD (PDA)
Retention time of ARM and IS 14.43±0.1min and 4.88±0.1min
Retention time of CUR and IS 4.93±0.1min and 14.34±0.1min
Run time 16.0 min

Materials and Methods
56 | P a g e
5.6.7 Bioanalytical method validation
RP-HPLC method was validated according to the ICH guidelines, Q2 (R1) (ICH, 2005).
Validation of optimized HPLC method was done with respect to following parameters:
Specificity
Specificity is the ability of a method to discriminate between the intended analyte and
other components in the sample. A method is said to be specific when it produces a
response only for a single analyte in the presence of other interferences. The specificity of
the method is to analyze unequivocally the analyte in the presence of other endogenous
compounds (degradants, excipients, impurities). It was carried out by comparing the
standard retention time spectra and the sample retention time spectra.
Accuracy
It was determined by analyzing the percentage recovery of ARM and CUR in plasma
samples. For this purpose, known quantities of ARM and CUR were supplemented to
the blank plasma samples. This experiment was carried out by analyzing replicates (n=6)
at three QC levels (LQC, MQC and HQC). The mean, S.D. and % R.S.D. were
calculated. Accuracy was calculated by comparing the averaged measured conc. to the
actual conc., and was expressed in percentage recovery.
% Recovery = (Measured conc./Actual conc.) x 100
Precision
Precision was measured by inter-day (day to day precision, on 3 different days) and
intra-day (repeatability on the same day) variations by analyzing six replicates over three
QC levels of ARM (2, 10, 15µg/mL) and CUR (75, 750, 1250ng/mL) at same optimized
chromatographic conditions. Precision was evaluated by calculating R.S.D. of measured
conc. at each sample based on linearity plots. In all situations, R.S.D. values were <5%,
which was considered to be acceptable.
%R.S.D. = (S.D./Mean) x 100
Limit of detection and quantitation
LOD and LOQ of the method were estimated by injecting a series of dilute solutions
with known conc. by visual observation and signal-to-noise ratio.
LOD = 3.3 σ/s
LOQ = 10 σ/s
where, σ is the standard deviation of response and s is slope of the calibration curve

Materials and Methods
57 | P a g e
Stability in rat plasma
The stability of spiked samples of ARM and CUR was assessed at different storage
conditions viz. short-term (at room temperature over 4h), long-term (at -20oC for 30
days), and 2 freeze-thaw cycles by analyzing the replicates (n=6) at 3 QC levels.
5.7 Solubility studies
The solubility of drugs were determined in different oils, oil mixtures, surfactants and
co-surfactants separately by adding an excess amount of drugs (usually in increments of
1mg till the drug saturation was achieved) to 2mL of each excipients (Table 5) in 5mL
capacity stoppered vials, and mixed using a vortex mixer (Yorco Instruments, Delhi,
India) (Jain et al., 2013b). These vials were kept at 25±0.5oC in an isothermal shaker
(IKA® KS 4000i, Germany) for 72h to reach equilibrium. The equilibrated vials were
removed from the shaker and centrifuged at 4000rpm for 15min using centrifuge (Remi
Instruments, Mumbai, India). The supernatant was taken and filtered through a 0.45µ
membrane filter (Sartorius, Germany). The conc. of drugs was determined after suitable
dilution using HPLC (n=3).
Table 5. List of excipients used for solubility studies
Oils
Capmul MCM (MCM), Captex 8000 (CTX 8000), Captex 500 (CTX 500),
Captex 300 (CTX 300), Labrafac lipophile WL 1349 (Labrafac), Medium chain triglyceride (MCT)
Oil mixtures CTX 500+MCT(1:1), CTX 500+MCM(1:1), CTX 500+Labrafac (1:1)
Surfactants Cremophor EL (Crem EL), Labrasol, Tween 80 (T 80), Tween 20 (T 20)
Co-surfactants Polyethylene glycol 400 (PEG 400), Polyethylene glycol 200 (PEG 200), Ethanol, Plurol oleique CC 497 (PQ)
5.8 Partition coefficient studies
The partition coefficient (PC) of drugs was determined in various solid lipids viz. stearic
acid (SA), glyceryl monostearte (GMS), compritol 888 ATO (compritol), precirol ATO 5
(precirol) and trimyristin (TM) by isothermal shaker method as reported previously
(Sood et al., 2013). Ten mg of drug was dispersed in a blend of melted lipid (1g) and hot
phosphate buffer (PB) (1mL) pH 7.4, after which it was shaken for 30min over a hot
water bath shaker maintained at 70oC. Aqueous phase was then separated from lipid
after cooling by centrifugation at a speed of 10,000rpm for 20min. The clear supernatant
obtained was suitably diluted with ACN and drug content was estimated using HPLC
(n=3). PC was calculated as:
PC = (Ci - C)/C
where, Ci = initial amount of drug added (10mg)
C = conc. of drug in pH 7.4 PB

Materials and Methods
58 | P a g e
5.9 Solubility and solution state stability studies
Saturation solubility of both the drugs was performed in simulated nasal fluid (SNF) pH
6.4 containing 1% w/v sodium lauryl sulphate (SLS) at 25±1.0oC in isothermal shaker.
SNF consisted of monosodium phosphate anhydrous (447mg), disodium phosphate
anhydrous (210mg), sodium chloride (4.4g), potassium chloride (1.5g) and calcium
chloride dehydrate (368mg) dissolved and made upto 500mL with distilled water having
final pH of 6.4. The drug was added in increments of 1mg till the saturation was
achieved. Drug solubility was determined by HPLC at the end of 72h (n=3). For stability
studies, standard solutions of drug (5-25µg/mL) were prepared in SNF pH 6.4 containing
1% w/v SLS and stored at 37±0.5oC for 72h. The samples were assayed for drug content
using HPLC method at 0, 24, 48 and 72h (n=3).
5.10 Compatibility studies
Compatibility of drug and lipid was studied using Fourier transform infrared
spectroscopy (FTIR) and differential scanning calorimetry (DSC).
5.10.1 Procedure for FTIR
A physical mixture of drug and lipid (either alone or in combination) was prepared and
mixed with anhydrous potassium bromide (KBr) in 1:4 ratio. About 100mg of this
mixture was ground into fine powder using mortar and pestle followed by compression to
form a transparent KBr pellet using a Beckmann hydraulic press (Beckman Instruments
Inc., Fullerton, USA) set at 15 tons pressure. Each KBr pellet was scanned at 4mm/s at a
resolution of 2cm over a wave number region from 4000 to 400 cm-1 in a FTIR
spectrophotometer (Shimadzu, Japan). The FTIR spectrum of the physical mixture (1:1)
was compared with those of pure drug and lipid and infra red peak matching method was
done to detect any appearance or disappearance of peaks.
5.10.2 Procedure for DSC
DSC analysis was performed using DSC Q200 (TA Instruments, USA). The instrument
was calibrated for temperature and heat flow using high purity indium standard. Briefly,
about 5mg of samples were accurately weighed in non-hermetically sealed aluminum
pans and crimped. DSC thermograms covered the range from 20-100oC and 20-200oC for
ARM and CUR respectively, at a heating rate of 10oC/min under constant purging of
nitrogen at a flow rate of 50mL/min. An empty pan, sealed in the same way as that of
the sample, was used as a reference. DSC thermograms were analyzed for pure drug,
lipid and its physical mixture (1:1) using TA universal analysis software.

Materials and Methods
59 | P a g e
5.11 Purity analysis
The purity of ARM and CUR was analysed using DSC as per procedure described
earlier. The thermograms of the drugs were subjected to purity analysis using Vant Hoff’s
equation that measures the fraction melted as a function of temperature.
where, Ts = Sample temperature
To = Theoretical melting point for 100% pure crystalline compound
R = Gas constant
X = Total mole fraction impurity
F = Fraction melted at Ts
5.12 Formulation of NLCs
Drug (ARM and CUR) loaded NLC formulations were prepared by a microemulsion
method as reported earlier (Sood et al., 2013). The chosen solid lipid and liquid lipid
were melted at 70oC, to which drug was added under continuous stirring for 5min. Ten
mL of hydrophilic surfactant solution heated at same temperature was added to the
melted lipid as a continuous phase, with mechanical stirring for 15min. A clear warm
o/w ME was formed under stirring at a temperature above the melting point of the lipid
used. NLC dispersions were obtained by dispersing the warm o/w ME dropwise into an
ice cold distilled water (3-4oC) in a beaker under continuous stirring (triple blade stirrer)
for 3h at a ratio of 1:5 (ME:water, v/v). The dispersion was centrifuged at 10,000rpm for
20min and supernatant was discarded. The resulting NLC pellets were redispersed using
millipore water and centrifuged again. The procedure was repeated twice to remove both
free surfactant and free drug molecules and the resultant dispersion was finally
lyophilized. In a similar manner, blank NLC formulation was also prepared without
incorporating the drug to lipid matrix. Preparation of NLC using the aforementioned
method is illustrated in Fig.7.
F
1 )
H
T X R( - T T
2o
os
fD=

Materials and Methods
60 | P a g e
Fig.7. Representation of preparation of NLC using microemulsion technique
5.12.1 Study on the effect of formulation/ process variables
The effect of formulation/process variables such as stirring time, stirring speed, lipid
conc., type of surfactant, conc. of surfactant and ratio of internal phase to external phase
on the particle size (PS) and polydispersity index (PDI), several batches of blank lipid
nanoparticles (LNP) consisting of only solid lipid were prepared and evaluated. To
investigate the effect of formulation/process variables, each time one parameter was
varied, keeping the others as constant. From the results obtained, optimum level of
variables were selected and kept constant in the subsequent evaluations.
Effect of stirring time
Four different batches of LNP were prepared corresponding to 1, 2, 3 and 4h stirring
time, keeping the following parameters as constant,
Lipid conc. : 1% w/v
Stirring speed : 2000rpm
Surfactant conc. (Pluronic F 68) : 2% w/v
Internal:External phase ratio : 1:10
Effect of stirring speed
Four different batches of LNP were prepared corresponding to 1000, 1500, 2000 and
2500rpm stirring speed, keeping the following parameters as constant,
Lipid conc. : 1% w/v
Stirring time : 3h
Surfactant conc. (Pluronic F 68) : 2% w/v
Internal:External phase ratio : 1:10
Materials and Methods
61 | P a g e
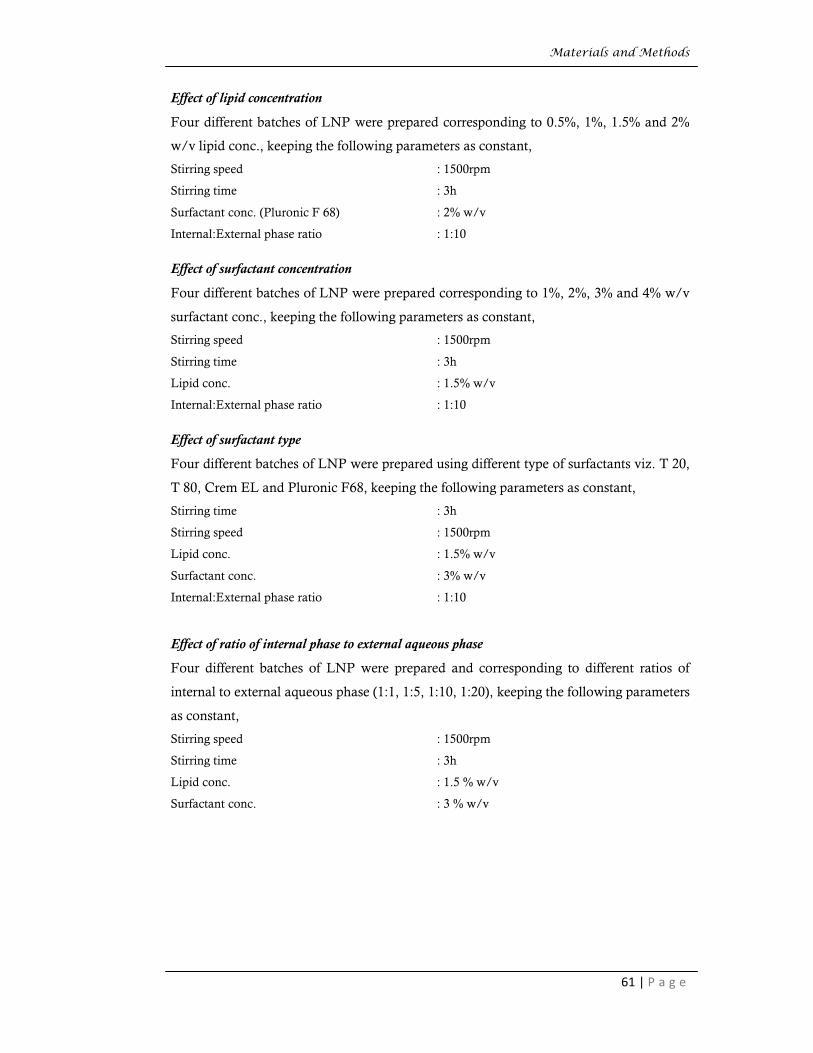
Effect of lipid concentration
Four different batches of LNP were prepared corresponding to 0.5%, 1%, 1.5% and 2%
w/v lipid conc., keeping the following parameters as constant,
Stirring speed : 1500rpm
Stirring time : 3h
Surfactant conc. (Pluronic F 68) : 2% w/v
Internal:External phase ratio : 1:10
Effect of surfactant concentration
Four different batches of LNP were prepared corresponding to 1%, 2%, 3% and 4% w/v
surfactant conc., keeping the following parameters as constant,
Stirring speed : 1500rpm
Stirring time : 3h
Lipid conc. : 1.5% w/v
Internal:External phase ratio : 1:10
Effect of surfactant type
Four different batches of LNP were prepared using different type of surfactants viz. T 20,
T 80, Crem EL and Pluronic F68, keeping the following parameters as constant,
Stirring time : 3h
Stirring speed : 1500rpm
Lipid conc. : 1.5% w/v
Surfactant conc. : 3% w/v
Internal:External phase ratio : 1:10
Effect of ratio of internal phase to external aqueous phase
Four different batches of LNP were prepared and corresponding to different ratios of
internal to external aqueous phase (1:1, 1:5, 1:10, 1:20), keeping the following parameters
as constant,
Stirring speed : 1500rpm
Stirring time : 3h
Lipid conc. : 1.5 % w/v
Surfactant conc. : 3 % w/v

Materials and Methods
62 | P a g e
5.12.2 Optimization of NLCs by central composite design
Based on number of factors and their level, CCD was used for formulation optimization
of ARM-NLC and CUR-NLC. CCD is one of the techniques of RSM for optimization of
pharmaceutical dosage forms and its rotatable characteristic enables it to identify
optimum responses around its center point without changing the predicting variance
(Zhang et al., 2010). The effect of 4 independent variables viz. conc. of lipid, liquid lipid
to total lipid ratio, drug to lipid ratio and surfactant conc. on dependent variable viz. PS,
drug loading (DL) and entrapment efficiency (EE) were studied at 5 different levels,
coded as –α, -1, 0, 1 and +α. The value for alpha (2) was intended to fulfil the rotatability
in the design. The coded and uncoded independent variables for both ARM-NLC and
CUR-NLC are given in Table 6. A total of 30 experiments with 6 centre points for
statistical assessment of the pure error sum of squares were carried out using Design
expert® software (Version 8.0.7.1, M/s Stat-Ease, Minneapolis, USA).
Table 6. Variables for central composite design
Independent factors Levels
Coded Uncoded -2 -1 0 1 2
A Lipid Conc. (%) 0.3 0.6 0.9 1.2 1.5
B Liquid lipid to total lipid ratio 0.05 0.13 0.20 0.28 0.35
C Drug to lipid ratio 0.05 0.08 0.10 0.13 0.15
D Surfactant Conc. (%) 1.0 1.5 2.0 2.5 3.0
5.12.3 Optimization of cryoprotectant concentration
Lyophilization of the NLC dispersions was carried out by using 2%, 3% and 5% (w/v) of
sucrose, lactose and dextrose as cryoprotectants. The NLC dispersions (10mL) were
frozen in aqueous cryoprotectant solution at -20oC for about 24h and then the samples
were transferred to the freeze-dryer (Christ, Alpha 2-4 LD plus, Germany) operated at -
40oC and pressure of 0.001bar for 72h to obtained the finely dispersed NLC powders for
further experiments. Lyophilized NLC were characterized for redispersibility, mean PS
and mean PDI by dynamic light scattering experiment before and after freeze-drying
procedure. The measurements were used to determine the Sf/Si ratio of lyophilized
NLC, where Sf and Si indicates mean PS after and before freeze-drying respectively. To
assess the redispersibility of lyophilized NLC, 50mg of product was redispersed in 1mL
of millipore water and visually assessed using following grading system:
Grade A: Readily redispersible (<15 sec, clear solution)
Grade B: Moderately redispersible (>15 sec, clear to translucent solution)
Grade C: Poorly redispersible ( does not redisperse, presence of large particles)

Materials and Methods
63 | P a g e
5.13 Formulation of NEs
5.13.1 Construction of pseudoternary phase diagrams
NEs were prepared using spontaneous nano-emulsification method and phase behaviour
was studied using pseudoternary phase diagrams. The phase diagrams containing oil,
surfactant, co-surfactant and double distilled water were developed using the aqueous
titration method (Fig. 8). (Shafiq et al., 2007). The selected oil phase was heated gently at
45-50oC for 5min. Surfactant and co-surfactant (smix) were mixed together in different
volume ratios (1:1, 1:2, 2:1, 3:1) and heated at same temperature. These smix ratios were
chosen to reflect the increasing conc. of co-surfactant with respect to surfactant and
increasing conc. of surfactant with respect to co-surfactant for the detailed study of the
phase diagrams for the formulation of NE. Mixture of oil and smix were prepared in
different volume ratios (1:1, 1:2, 1:3, 1:4, 2:1) in screw-cap glass tubes and were vortexed
(Yorco Instruments, Delhi) to form homogenous isotropic mixtures. Each mixture were
then slowly titrated with aqueous phase (double distilled water) and stirred at room
temperature to attain equilibrium. Aqueous phase was added with increment of 5µL
using micropipette at each interval to each oil-smix mixture under vortex mixing. The
calculation for the addition of aqueous phase was done by calculating the percentage of
each component of the NE present at each 5µL addition. After equilibrium, the samples
were visually observed for the following categories:
Fig.8. (a) Preparation of NE by aqueous titration method (b) Visual observation of clear
nanoemulsion (NE) and turbid/milky emulsion (E)
Transparent and easily flowable : o/w nanoemulsion (NE)
Milky or cloudy/phase separation : Emulsion (E)
Milky gel : Emulsion gel (EG)
Transparent gel : Nanoemulsion gel (NG)

Materials and Methods
64 | P a g e
Phase diagrams were constructed using Chemix Software Ver.3.50 (MN, USA). Oil,
surfactants and co-surfactant were grouped in 2 different combinations for phase studies
(Table 7). The percentage calculation for different oil: smix ratios are given in Table 8-12.
Physical state was plotted on a pseudo-three-component phase diagram with 3 axis
representing aqueous, oil and smix at a fixed volume ratio. For each smix ratio, a
separate phase diagram was constructed and only NE points were plotted (shaded area),
as for formulation development, only the NE area is of interest. Clear transparent and
isotropic samples were deemed to be within the NE region. From each phase diagram
constructed, optimized range of oil, surfactant and co-surfactant concentrations were
selected from the NE region to prepare the NE drug delivery system using DoE.
Table 7. Excipients grouped in different combinations
Group Oil Surfactant Co-surfactant
I MCM+CTX 500 Crem EL PEG 400
II MCM+CTX 500 T 20+ Crem EL PEG 400
Table 8. Percentage calculation of oil, smix and water for phase diagram (oil and smix ratio 1:1)
Oil (µL) Smix (µL) Water
(µL)
Water added at each interval
(µL) Total volume (µL) Oil (%) Smix (%) Water (%)
10 10 5 0 25 40.00 40.00 20.00
10 10 10 5 30 33.33 33.33 33.33
10 10 15 5 35 28.57 28.57 42.85
10 10 20 5 40 25.00 25.00 50.00
10 10 25 5 45 22.22 22.22 55.55
10 10 30 5 50 20.00 20.00 60.00
10 10 35 5 55 18.18 18.18 63.63
10 10 40 5 60 16.66 16.66 66.66
10 10 45 5 65 15.38 15.38 69.23
10 10 50 5 70 14.28 14.28 71.42
10 10 55 5 75 13.33 13.33 73.33
10 10 60 5 80 12.50 12.50 75.00
10 10 65 5 85 11.76 11.76 76.47
10 10 70 5 90 11.11 11.11 77.77
10 10 75 5 95 10.52 10.52 78.94
10 10 80 5 100 10.00 10.00 80.00
10 10 85 5 105 9.52 9.52 80.95
10 10 90 5 110 9.09 9.09 81.81
10 10 95 5 115 8.69 8.69 82.60
Table 9. Percentage calculation of oil, smix and water for phase diagram (oil and smix ratio 1:2)
Oil (µL) Smix (µL) Water
(µL)
Water added at each interval
(µL) Total volume (µL) Oil (%) Smix (%) Water (%)
10 20 5 0 35 28.57 57.14 14.28
10 20 10 5 40 25.00 50.00 25.00
10 20 15 5 45 22.22 44.44 33.33
10 20 20 5 50 20.00 40.00 40.00
10 20 25 5 55 18.18 36.36 45.45
10 20 30 5 60 16.66 33.33 50.00
10 20 35 5 65 15.38 30.76 53.84
10 20 40 5 70 14.28 28.57 57.14
10 20 45 5 75 13.33 26.66 60.00
10 20 50 5 80 12.50 25.00 62.50
10 20 55 5 85 11.76 23.52 64.70
10 20 60 5 90 11.11 22.22 66.66
10 20 65 5 95 10.52 21.05 68.42
10 20 70 5 100 10.00 20.00 70.00
10 20 75 5 105 9.52 19.04 71.42
10 20 80 5 110 9.09 18.18 72.72
10 20 85 5 115 8.69 17.39 73.91
10 20 90 5 120 8.33 16.66 75.00
10 20 95 5 125 8.00 16.00 76.00

Materials and Methods
65 | P a g e
Table 10. Percentage calculation of oil, smix and water for phase diagram (oil and smix ratio 1:3)
Oil (µL) Smix (µL) Water
(µL)
Water added at each interval
(µL) Total volume (µL) Oil (%) Smix (%) Water (%)
10 30 5 0 45 22.22 66.66 11.11
10 30 10 5 50 20.00 60.00 20.00
10 30 15 5 55 18.18 54.54 27.27
10 30 20 5 60 16.66 50.00 33.33
10 30 25 5 65 15.38 46.15 38.46
10 30 30 5 70 14.28 42.85 42.85
10 30 35 5 75 13.33 40.00 46.66
10 30 40 5 80 12.50 37.50 50.00
10 30 45 5 85 11.76 35.29 52.94
10 30 50 5 90 11.11 33.33 55.55
10 30 55 5 95 10.52 31.57 57.89
10 30 60 5 100 10.00 30.00 60.00
10 30 65 5 105 9.52 28.57 61.90
10 30 70 5 110 9.09 27.27 63.63
10 30 75 5 115 8.69 26.08 65.21
10 30 80 5 120 8.33 25.00 66.66
10 30 85 5 125 8.00 24.00 68.00
10 30 90 5 130 7.69 23.07 69.23
10 30 95 5 135 7.40 22.22 70.37
Table 11. Percentage calculation of oil, smix and water for phase diagram (oil and smix ratio 1:4)
Oil (µL) Smix (µL) Water
(µL)
Water added at each interval
(µL) Total volume (µL) Oil (%) Smix (%) Water (%)
10 40 5 0 55 18.18 72.72 9.09
10 40 10 5 60 16.66 66.66 16.66
10 40 15 5 65 15.38 61.53 23.07
10 40 20 5 70 14.28 57.14 28.57
10 40 25 5 75 13.33 53.33 33.33
10 40 30 5 80 12.50 50.00 37.50
10 40 35 5 85 11.76 47.05 41.17
10 40 40 5 90 11.11 44.44 44.44
10 40 45 5 95 10.52 42.10 47.36
10 40 50 5 100 10.00 40.00 50.00
10 40 55 5 105 9.52 38.09 52.38
10 40 60 5 110 9.09 36.36 54.54
10 40 65 5 115 8.69 34.78 56.52
10 40 70 5 120 8.33 33.33 58.33
10 40 75 5 125 8.00 32.00 60.00
10 40 80 5 130 7.69 30.76 61.53
10 40 85 5 135 7.40 29.62 62.96
10 40 90 5 140 7.14 28.57 64.28
10 40 95 5 145 6.89 27.58 65.51
Table 12. Percentage calculation of oil, smix and water for phase diagram (oil and smix ratio 2:1)
Oil (µL) Smix (µL) Water
(µL)
Water added at each interval
(µL) Total volume (µL) Oil (%) Smix (%) Water (%)
20 10 5 0 35 57.14 28.57 14.28
20 10 10 5 40 50.00 25.00 25.00
20 10 15 5 45 44.44 22.22 33.33
20 10 20 5 50 40.00 20.00 40.00
20 10 25 5 55 36.36 18.18 45.45
20 10 30 5 60 33.33 16.66 50.00
20 10 35 5 65 30.76 15.38 53.84
20 10 40 5 70 28.57 14.28 57.14
20 10 45 5 75 26.66 13.33 60.00
20 10 50 5 80 25.00 12.50 62.50
20 10 55 5 85 23.52 11.76 64.70
20 10 60 5 90 22.22 11.11 66.66
20 10 65 5 95 21.05 10.52 68.42
20 10 70 5 100 20.00 10.00 70.00
20 10 75 5 105 19.04 9.52 71.42
20 10 80 5 110 18.18 9.09 72.72
20 10 85 5 115 17.39 8.69 73.91
20 10 90 5 120 16.66 8.33 75.00
20 10 95 5 125 16.00 8.00 76.00

Materials and Methods
66 | P a g e
5.13.2 Optimization of NEs using Box-Behnken design
Based on initial screening, conc. of oil, surfactant and co-surfactant were optimized from
the NE region of pseudoternary phase diagrams. BBD was used statistically to optimize
the effect of 3 independent variables namely conc. of oil (%), surfactant (%) and
co-surfactant (%) and evaluate the main effects, interaction effects and quadratic effects
of these formulation ingredients on the dependent variables namely globule size (GS)
(nm) and zeta potential (ZP) (mV). Design-Expert® software (Version 8.0.7.1, M/s Stat-
Ease, Minneapolis, USA) was used to conduct the study. A total of 17 experiments with
5 centre points were designed by the software (in order to allow the estimation of pure
error) and experiments were run in random order. Table 13 shows the coded and
uncoded independent variables.
Table 13. Variables for Box-Behnken design
Independent factors Design level
Coded Uncoded -1 0 +1
A Conc. of Oil (%) 12.00 16.00 20.00
B Conc. of surfactant (%) 24.00 29.50 35.00
C Conc. of co-surfactant (%) 12.00 16.00 20.00
5.14 Evaluation
5.14.1 Particle size and zeta potential analysis
The mean PS/GS and ZP of NLCs and NEs were determined using a zetasizer ZS 90
(Malvern Instruments, UK). The mean PS/GS was measured based on photon
correlation spectroscopy technique that analyzes the fluctuations in dynamic light
scattering due to brownian motion of the particles. The mean diameter was obtained at
an angle of 90° in 10 mm diameter cells at 25°C. The ZP, reflecting the electric charge on
the particle surface, is a very useful way of evaluating the physical stability of any
colloidal system. It was determined based on an electrophoretic light scattering technique
(Jain et al., 2013a). All PS/GS and ZP measurements were carried out at 25oC using
disposable polystyrene cells and disposable plain folded capillary zeta cells, respectively,
after appropriate dilution of all samples with original dispersion medium. Three replicate
analyses was performed for each formulation, and data presented as mean±S.D.
5.14.2 Determination of entrapment efficiency and drug loading percentage
EE and DL percentage of lyophilized NLC were determined according to the procedure
described earlier (Sood et al., 2013). Weighed quantity of lyophilized drug loaded NLC
(10mg) were suspended in hydroalcholic solution (ethanol and water in 50:50) under
water bath 70oC for 30min. This ensures melting of NLC and release of entrapped drug

Materials and Methods
67 | P a g e
in media. The solution is allowed to cool at room temperature to preferentially
precipitate the lipid. The amount of drug in the supernatant after centrifugation
(10,000rpm for 30min) was determined by HPLC (n=3).
Drug entrapment efficiency (%) = Wdrug/ Wtotal x 100
Drug loading (%) = Wdrug/ Wlipid x 100
Wdrug; analyzed amount of drug in the supernatant,
Wtotal; total amount of drug used in formulation,
Wlipid; weight of lyophilized NLC formulation
5.14.3 Scanning electron microscopy
External surface morphology of lyophilized drug loaded NLC was recorded using
scanning electron microscopy (SEM) (FEI QUANTA 200 SEM/EDAX, UK) at 20kV as
an accelerating voltage (Sood et al., 2013). Weighed amount of samples (5-7mg) were
mounted on an aluminium stub with double sided adhesive tape. The tape was firmly
attached to the stub and lyophilized sample was scattered carefully over its surface. The
stub with the sample was then sputter coated with a thin layer of gold to make the sample
conductive. Processed sample was subjected to SEM analysis. The images were captured
under magnification of 10,000-15,000x and recorded.
5.14.4 Transmission electron microscopy
The shape and morphology of drug loaded NLC dispersion and drug loaded NE were
analyzed using transmission electron microscopy (TEM) (TOPCON 002B, USA) at an
accelerating voltage of 200kV (Jain et al., 2013b). Prior to the analysis, the samples were
diluted 100 times with double distilled water and a drop (5-10µL) was placed onto
carbon-coated 200-mesh copper grids to create a thin film. Before the film dried on the
grid, the samples were negatively stained with 2% w/v phosphotungstic acid by adding a
drop of the staining solution to the film for 30s; any excess droplets were drained off with
a filter paper. The grid was allowed to air-dry under room temperature. Digital
micrograph and soft imaging viewer software were used to capture the image of samples.
5.14.5 Differential Scanning Calorimetry
Crystalline behaviour of both drug and lipid was studied by DSC. Thermograms were
recorded for pure drug, lipid and lyophilized drug loaded NLC. DSC was carried out as
per the procedure described earlier. Degree of crystallinity of lyophilized drug loaded
NLC was calculated by comparing the enthalpy of NLC with enthalpy of bulk lipid
(Freitas and Müller, 1999). The melting enthalpy of bulk lipid was used as a reference
(100%) to calculate the percentage of crystallinity of NLC (Varshosaz et al., 2012).

Materials and Methods
68 | P a g e
where, ∆H freeze-dried NLC indicates enthalpy of freeze dried NLC
∆H bulk indicates enthalpy of bulk lipid.
5.14.6 Powder X-ray diffraction
Powder X-ray diffraction (PXRD) patterns were recorded for pure drug, lipid, physical
mixture (drug and lipid in 1:1) and lyophilized drug loaded NLC. PXRD pattern of
samples were collected using a Bruker AXS D8 Advance powder diffractometer, USA.
The samples were exposed to Cu Kα radiation generated at 40kV, 35mA and scanned
from 3o to 80o, 2θ at a step size of 0.020o and step time of 31.2s.
5.14.7 Fourier transform infrared spectroscopy
Solid state characterization of lyophilized drug loaded NLC formulation along with plain
drug and lipid were done using FTIR as per the procedure described earlier.
5.14.8 Thermodynamic stability tests
Optimized drug loaded NE formulation was subjected to different thermodynamic
stability tests (n=3) (Shafiq-un-nabi et al., 2007).
Centrifugation test: The samples were centrifuged at 3,500rpm for 30min.
Heating cooling cycle test: The samples were subjected to 6 cycles between refrigerator
temperature 4oC and 45oC with storage at each temperature for 48h.
Freeze thaw cycle test: The samples were subjected to 3 cycles between -21oC and +25oC
with storage at each temperature for 48h.
5.14.9 Drug content
The formulation was diluted to required conc. using ACN as solvent and drug content of
NE was estimated using HPLC method (Jain et al., 2013b). The drug content (n=3) was
calculated as:
Drug content (%) = Analyzed content/Theoretical content x 100
5.14.10 Refractive index and percent transmittance
The refractive index of the system was measured by an Abbe’s refractometer (Bausch and
Lomb optical company, NY, USA) by placing a drop of NE formulation onto the slide
(n=3) and it was compared to refractive index of distilled water. The percent
transmittance of the system was measured at 650nm using UV spectrophotometer
(Shimadzu, Japan) keeping distilled water as blank (n=3) (Ghosh et al., 2006).

Materials and Methods
69 | P a g e
5.14.11 Viscosity determination
The viscosity of the NE formulation (0.5g) was determined as such without dilution
using Brookfield DV-II ultra+viscometer (Brookfield Engineering Laboratories, Inc.,
Middleboro, MA, USA) with spindle # CPE 40 at 25±0.5ºC (n=3). The software used
for the calculations was Rheocalc V2.6. In the small volume adapter, the NE was filled
and the angular velocity was increased gradually from 10, 20, 50 and 100rpm. The
hierarchy of the angular velocity was reversed (Jain et al., 2013b).
5.14.12 Electroconductivity study
To determine the nature of the continuous phase and to detect the phase inversion
phenomenon, the electrical conductivity measurement of the NE formulation was carried
out by an electroconductometer (Conductivity meter 305, Systronic) by inserting the
probe in NE taken in a beaker (n=3) (Ghosh et al., 2006). The tested NE was prepared
with a 0.01N aqueous solution of sodium chloride (NaCl) instead of distilled water.
5.14.13 Determination of pH
The pH of the formulation was measured using digital pH meter (n=3) (Eutech
instruments, Mumbai).
5.14.14 In vitro Release Studies
The release of drug from developed formulations (NLC and NE) and solution was
performed in SNF pH 6.4 containing 1% SLS using the dialysis bag method (Sood et al.,
2013). For both the drugs, solution was prepared by dissolving 27.6mg/mL of ARM
(ARM-SOL) and 11.7mg/mL of CUR (CUR-SOL) in a mixture of 1mL ethanol and
2mL propylene glycol and finally volume was made to 10mL with distilled water
separately. Dialysis membrane having pore size of 2.4nm and molecular weight cut off
12,000-14,000 (Dialysis membrane-150, HiMedia, Mumbai, India) was used. The bags
were soaked in distilled water for 24h before use. Drug solution, lyophilized drug loaded
NLC and drug loaded NE were placed in dialysis bags separately and sealed at both the
ends. The bags were placed in baskets (USP Dissolution apparatus Type-I, Lab India,
Mumbai) and immersed in dissolution medium (SNF) maintained at 37±0.5oC and
stirred at 100rpm. The volume of dissolution medium for NLC and NE was 200mL and
500mL respectively. Aliquots of the samples were withdrawn from dissolution medium
at regular time intervals and same volume of fresh dissolution medium was replaced to
maintain a constant volume. The samples were analyzed for drug content by HPLC
(n=3). The drug release profile was constructed by plotting the cumulative percent drug
release versus time (h).

Materials and Methods
70 | P a g e
5.14.15 Ex vivo Permeation Studies on Nasal Mucosa
To investigate the permeation efficacy of drug from lyophilized NLC, NE and solution
across the freshly excised sheep nasal mucosa, ex vivo permeation studies were performed
using the Franz diffusion cell with surface area of 1.79cm2 and volume of 25mL (Kovai
Glass Works, Coimbatore, India) (Seju et al., 2011). The freshly excised sheep nasal
mucosa was collected from the slaughter house in PBS, pH 6.4. Excised superior nasal
membrane was cut to an appropriate size and thickness (0.2mm), made free from
adhered tissues and mounted between the donor and receptor compartment of the Franz
diffusion cell, with mucosal side facing the donor compartment. The mounted tissue was
allowed to stabilize and stirred under SNF pH 6.4 containing 1% SLS for 15min on a
magnetic stirrer. The diffusion cell was thermostated at 37±0.5oC. Solution from both the
compartments was removed after 15min, and the receptor compartment was freshly filled
with SNF. The mounting of nasal membrane was done on the rim of the receptor
compartment; the donor compartment of diffusion cell was placed over it and secured
with a clamp to avoid the leakage of diffusion media. Permeation studies of pure drug
solution, lyophilized drug loaded NLC reconstituted with SNF and drug loaded NE were
carried out by placing 1mL onto stabilized sheep nasal membrane on donor
compartment and continuously magnetic stirred at 600rpm. Aliquot (0.5mL) of media
were withdrawn from the receptor compartment at predetermined time intervals, filtered
through 0.45µm nylon filter paper and analyzed for drug content using HPLC. Each
removed sample was replaced immediately by an equal volume of fresh diffusion media
maintained at 37±0.5oC to maintain the constant volume at each time interval. Each
study was carried out for a period of 6h, during which the amount of drug permeated
across the sheep nasal mucosal membrane was determined at each sampling point using
HPLC (n=3). The permeation profile was constructed by plotting the amount of drug
permeated per unit skin surface area (µg/cm2) versus time (h). The steady state flux (Jss,
µg /cm2.h) was calculated from slope of the plot using linear regression analysis.
5.14.16 Release Kinetics
In vitro dissolution has been recognized as an important element in drug development.
Under certain conditions, it can be used as a surrogate for the assessment of
bioequivalence. Several theories/kinetic models describe the drug dissolution from
immediate and modified release dosage forms. There are several models to represent the
drug dissolution profiles where ft is the function of t (time) related to the amount of drug
dissolved from the pharmaceutical dosage system. To compare dissolution profiles

Materials and Methods
71 | P a g e
between two drug products, model dependent (curve fitting), statistic analysis and model
independent methods can be used (Costa and Lobo, 2001).
In order to elucidate mode and mechanism of drug release, the in vitro data was
transformed and interpreted at graphical interface constructed using various kinetic
models. Zero order release describes the drug dissolution of several types of modified
release pharmaceutical dosage forms, as in the case of transdermal systems, matrix
tablets with low soluble drugs, coated forms, osmotic systems etc., where the drug release
is independent of conc.
Qt = Qo + Kot
where, Qt is the amount of drug released in time t, Qo is the initial amount of the drug in
the solution and Ko is the zero order release constant
First order describes the release from system where release is conc. dependent e.g.
pharmaceutical dosage forms containing water soluble drugs in porous matrices.
log Qt = log Qo + K1 t /2.303
where Qt is the amount of drug released in time t, Q is the initial amount of drug in the
solution and K is the first s order release constant.
Higuchi described the release of drug from insoluble matrix as a square root of time
Qt = KH √t
where, Qt is the amount of drug released in time t, KH is Higuchi’s dissolution constant.
The following plots were made:
cumulative % drug release vs. time (zero order kinetic model);
log cumulative of % drug remaining vs. time (first order kinetic model) and
cumulative % drug release vs. square root of time (Higuchi model).
Mechanism of Drug release
Korsmeyer et al., (Korsmeyer et al., 1983) developed a simple, semi empirical model,
relating exponentially the drug release to the elapsed time (t)
ft = K tn
where K is a constant incorporating structural and geometrical characteristic of the drug
dosage form, n is the release exponent, ft is Mt / M∞ (fractional release of drug). Based on
‘n’ value, release can be Fickian, non-Fickian or zero order (Table 14). Depending on the
relative magnitude of the rate of polymer swelling to the rate of drug diffusion, various
release profiles may be possible. The situation where the polymer structural
rearrangement takes place rapidly in response to the swelling solvent as compared to the
rate of drug diffusion generally leads to Fickian diffusion, or the so-called first order
release, characterized by square root of time dependence in both the amount released
and the penetrating diffusion front position in slab geometry. In most systems, the

Materials and Methods
72 | P a g e
intermediate solution, which is often termed non-Fickian or anomalous diffusion, will
prevail whenever the rates of diffusion and polymer relaxation are comparable.
Table 14. Diffusional exponent and mechanism of diffusional release from various
non-swellable controlled release systems (Ritger and Peppas, 1987).
Diffusional exponent (n) Drug release mechanism
Thin film Cylindrical sample Spherical sample
0.50<n<1.0 0.45 0.43 Fickian diffusion
0.50<n<1.0 0.45<n<1.0 0.43<n<1.0 Anomalous
(Non-Fickian) transport
1.0 1.0 1.0 Zero-order release
5.15 Toxicity assessment
The toxicological assessment of the developed lipid based nano formulations (NLC and
NE) were carried out using in vitro cytotoxicity assay on SVG p12 cell line, in vitro
hemolytic toxicity on rat erythrocytes and nasal ciliotoxicity study on sheep nasal
mucosa stained with hematoxylin and eosin (H&E) stain to assess the safety of the
developed formulations to brain cells, blood and nasal epithelium respectively (n=3).
5.15.1 In vitro cytotoxicity assay on SVG p12 cell line
The toxicity studies of the blank and drug loaded formulations (NLC and NE) were
carried out in SVG p12 cells, a human brain cell line. The cells were maintained in
minimum essential medium (MEM), supplemented with 10% v/v fetal bovine serum,
penicillin (100 IU/mL), streptomycin (100μg/mL) and amphotericin B (5μg/mL) in a
humidified atmosphere of 5% CO2 at 37°C until confluent. The cells were then seeded in
multiwall culture plates and cytotoxicity assay was carried out using cell suspension,
containing 5000 cells seeded in each well of a 96 well microtiter plate (Nunc and
Tarsons) and incubated for 24h at 37°C. Cells were treated with 250-2000μg/mL.
Control cells were incubated without the test compound and with MEM. The microtiter
plates were incubated at 37°C in a humidified incubator with 5% CO2 for a period of 72h.
Morphological changes in the cells were inspected daily and observed for microscopically
detectable alterations, i.e., loss of monolayer, granulation and vaculation in the
cytoplasm. The cytopathic effect was observed. A plot of % growth inhibition versus
conc. was plotted to determine the IC50 value (conc. of the drug that produces 50%
inhibition of the cells) by SRB (Sulphorhodamine B) assay (Skehan et al., 1990).
5.15.2 In vitro hemolytic toxicity
Fresh blood from rats was collected in a vial containing ethylene diamine tera acetic acid
(EDTA) as an anticoagulant. Blood was centrifuged at 3000rpm for 20min to remove
Materials and Methods
73 | P a g e
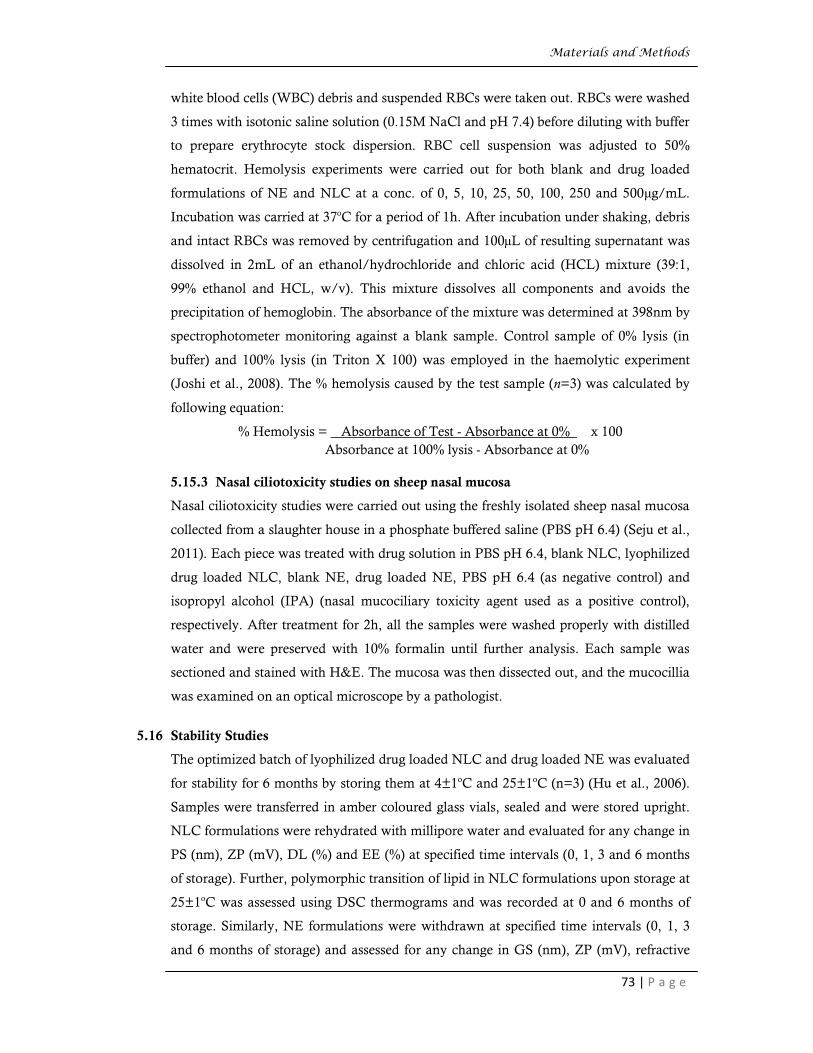
white blood cells (WBC) debris and suspended RBCs were taken out. RBCs were washed
3 times with isotonic saline solution (0.15M NaCl and pH 7.4) before diluting with buffer
to prepare erythrocyte stock dispersion. RBC cell suspension was adjusted to 50%
hematocrit. Hemolysis experiments were carried out for both blank and drug loaded
formulations of NE and NLC at a conc. of 0, 5, 10, 25, 50, 100, 250 and 500μg/mL.
Incubation was carried at 37oC for a period of 1h. After incubation under shaking, debris
and intact RBCs was removed by centrifugation and 100µL of resulting supernatant was
dissolved in 2mL of an ethanol/hydrochloride and chloric acid (HCL) mixture (39:1,
99% ethanol and HCL, w/v). This mixture dissolves all components and avoids the
precipitation of hemoglobin. The absorbance of the mixture was determined at 398nm by
spectrophotometer monitoring against a blank sample. Control sample of 0% lysis (in
buffer) and 100% lysis (in Triton X 100) was employed in the haemolytic experiment
(Joshi et al., 2008). The % hemolysis caused by the test sample (n=3) was calculated by
following equation:
% Hemolysis = Absorbance of Test - Absorbance at 0% x 100
Absorbance at 100% lysis - Absorbance at 0%
5.15.3 Nasal ciliotoxicity studies on sheep nasal mucosa
Nasal ciliotoxicity studies were carried out using the freshly isolated sheep nasal mucosa
collected from a slaughter house in a phosphate buffered saline (PBS pH 6.4) (Seju et al.,
2011). Each piece was treated with drug solution in PBS pH 6.4, blank NLC, lyophilized
drug loaded NLC, blank NE, drug loaded NE, PBS pH 6.4 (as negative control) and
isopropyl alcohol (IPA) (nasal mucociliary toxicity agent used as a positive control),
respectively. After treatment for 2h, all the samples were washed properly with distilled
water and were preserved with 10% formalin until further analysis. Each sample was
sectioned and stained with H&E. The mucosa was then dissected out, and the mucocillia
was examined on an optical microscope by a pathologist.
5.16 Stability Studies
The optimized batch of lyophilized drug loaded NLC and drug loaded NE was evaluated
for stability for 6 months by storing them at 4±1oC and 25±1oC (n=3) (Hu et al., 2006).
Samples were transferred in amber coloured glass vials, sealed and were stored upright.
NLC formulations were rehydrated with millipore water and evaluated for any change in
PS (nm), ZP (mV), DL (%) and EE (%) at specified time intervals (0, 1, 3 and 6 months
of storage). Further, polymorphic transition of lipid in NLC formulations upon storage at
25±1oC was assessed using DSC thermograms and was recorded at 0 and 6 months of
storage. Similarly, NE formulations were withdrawn at specified time intervals (0, 1, 3
and 6 months of storage) and assessed for any change in GS (nm), ZP (mV), refractive

Materials and Methods
74 | P a g e
index, drug content (%) viscosity (cP) and pH. The clarity and phase separation of the
NE formulations were determined by visual examination under light alternatively against
white and black backgrounds.
5.17 Pharmacokinetic and brain uptake studies
The animal experiments were carried out with the approval from institutional animal
ethical committee, J.S.S College of Pharmacy, Udhagamandalam, Tamil nadu, India
(Proposal number. JSSCP/IAEC/Ph.D/PH.Ceutics/04/2012-13). Pharmacokinetic and
brain uptake studies were carried out using male wistar rats as reported earlier for drug
solution and lyophilised drug loaded NLC formulation reconstituted with 1mL of
isotonic saline solution (Haque et al., 2012; Kumar et al., 2008). Rats were housed in
cages and had free access to standard laboratory diet (Lipton feed, Mumbai, India) and
water ad libitum. The animals were maintained at 22±1oC and 65±5% relative humidity
(R.H). Efficacy of IN route was compared with that of the IV route. Based on previously
published literature, the dose selected for ARM was 5mg/kg body weight (Aditya et al.,
2010) and 2.5mg/kg body weight for CUR (Chauhan et al., 2013). Grouping of animals
for ARM and CUR treated are shown in Table 15 and Table 16 respectively.
Table 15. Grouping of animals for pharmacokinetic studies for ARM formulation
Group Formulation Dose
I vehicle control
5 mg/kg
II ARM-NLC (IN) dispersed in isotonic saline solution
III ARM-SOL (IV into the tail vein)
IV ARM-SOL (IN)
Table 16. Grouping of animals for pharmacokinetic studies for CUR formulation
Group Formulation Dose
I vehicle control
2.5 mg/kg
II CUR-NLC (IN) dispersed in isotonic saline solution
III CUR-SOL (IV into the tail vein)
IV CUR-SOL (IN)
Before nasal administration, the rats were lightly anesthetized by exhaling diethyl ether.
IN administration was carried out with help of micropipette attached to low density
polyethylene tube having 0.1mm internal diameter. Animals (n=3) were sacrificed by
cervical dislocation and blood samples of ~0.25mL were collected by cardiac puncture at
the following time points: 0.25, 0.5, 0.75, 1, 2, 4 and 6h. Blood samples were placed into
tubes containing 0.3mL of EDTA and centrifuged at 3000rpm for 15min. After
centrifugation, the plasma obtained was stored at -20oC until analysis. Brain samples
were collected by cutting open the skull, rinsed with saline solution and blotted with filter

Materials and Methods
75 | P a g e
paper to remove the blood taint. Brain samples were homogenized in PBS (pH 7.4) to
determine the amount of drug in the brain tissue. The homogenate was centrifuged at
6000rpm for 15min at 4oC; supernatant was collected and frozen at -20oC until analysis.
Pharmacokinetic parameters like elimination rate constant (Ke), half life (t1/2) and area
under curve (AUC), Cmax (peak plasma conc.) and Tmax (time of peak plasma conc.) were
obtained directly from the plasma conc.-time profile and brain conc.-time profile. All the
data were expressed as the mean±S.E.M. (standard error mean). Further, drug targeting
efficiency (DTE%) that represents time average partitioning ratio and nose to brain direct
transport percentage (DTP%) was calculated as follows:
DTE% = (AUCbrain/AUCblood)IN / (AUCbrain/AUCblood)IV × 100
DTP% = BIN – Bx/ BIN × 100
where Bx = (BIV / PIV) x PIN, Bx is the brain AUC fraction contributed by systemic circulation through the BBB
following IN administration;
BIV is the AUC0-360 (brain) following IV administration; PIV is the AUC0-360 (blood) following IV administration; BIN is the AUC0-360 (brain) following IN administration; PIN is the AUC0-360 (blood) following IN administration
5.18 Pharmacodynamic studies
5.18.1 Animals, Parasites and Infection
The animal experiments were carried out with approval from University of Hyderabad,
Hyderabad, India. Four to five weeks old C57BL/6 female mice weighing 23-25g were
housed at University of Hyderabad animal housing facility. Mice were kept in autoclaved
plastic cages and autoclaved wheat husk was used as bedding. The animals were
maintained at a temperature of 22±1oC and 65±5% R.H, were fed a standard mouse diet
and provided with clean drinking water ad libitum throughout the studies. P. berghei
ANKA (PbA) strain was used for in vivo evaluation of anti-malarial activity. This strain
was examined and found to be free of contamination with Eperythrozoon coccoides. The
strain is known to provide the high mortality in mice, providing a good model to estimate
survival and anti-malarial efficacy in reducing parasitemia. It is sensitive to all currently
used anti-malarial drugs. PbA GFPcon 259cl2 cryovials were kept in the liquid nitrogen
at -196oC. All PRBCs were mixed with ice-cold parasite buffer (5mM Na2HPO4, 5mM
NaH2PO4, 0.9% NaCl) before giving infection. At first, the infection was given to three
‘source mice’. When any one of the source mice showed CM symptoms during the
course of infection, blood was collected from its tail vein and passaged IP to all
experimental mice so that each mouse received 104-106 parasites. Induction of infection
in experimental cerebral malaria (ECM) mice is presented in Fig.9.

Materials and Methods
76 | P a g e
Fig.9. Induction of CM in C57BL/6 mice
5.18.2 Parasitemia
Anti-malarial efficacy was assessed by the parasitemia level and the mean survival time
for upto 4 weeks following inoculation. The thin blood smears from tail caudal vein were
fixed in methanol for 10s and stained with 10% Giemsa solution (Sigma Aldrich) for
20min. Stained slide was examined for parasitemia under a light microscope with an oil
immersion objective of 100x magnification power, (Olympus BX-51). Parasitemia was
counted as % of PRBCs in total number of normal RBCs across three fields of the
microscope (Fig.10). Parasitemia is the quantitative content of parasites in the blood and
was counted daily in all experimental cerebral malaria (ECM) mice. Survival time in
days was recorded for all the groups. Giemsa-stained blood smears, the gold standard
technique for malaria diagnosis, routinely used to detect for and quantify parasites
present in the peripheral circulation in the infected mice (Barcia, 2007).
Fig.10. Determination of parasite count by Giemsa staining

Materials and Methods
77 | P a g e
5.18.3 Cerebral malaria prediction
Rescue treatment (drug regimen) was started only when the CM symptoms
commenced in mice. Rapid murine coma and behavioural scale (RMCBS) was
used for CM prediction as presented in Table 17. The RMCBS consists of 10
parameters, and each parameter is scored 0 to 2, with a 0 score correlating with the
lowest function and a 2 score, the highest. An animal can achieve an accumulative
score of 0 to 20. The mice that gave a score of <12 were given drugs accordingly
(Carroll et al., 2010).
Table 17. The Rapid Murine Coma and Behaviour Scale
Label Score Description
Coordination
Gait (0-2) (none-ataxic-normal)
Balance (0-2) (no body extension-extends front feet on wall- entire body lift)
Exploratory behavior
Motor performances (0-2) (none-2-3-corners explored in 90s- explores 4 corners in 15s)
Strength and Tone
Body Position (0-2) (on slide-hunched-full extension)
Limb Strength (0-2) (hypnotonic, no grasp-weak pull-back [front paw grasp only]-stong pull-back [active pull away, jerk away])
Reflexes and Self-Preservation
Touch Escape (0-2) (none-unilateral-instant and bilateral; in 3 attempts)
Pinna Reflex (0-2) (none-unilateral-instant and bilateral; in 3 attempts)
Toe Pinch (0-2) (none-unilateral-instant and bilateral; in 3 attempts)
Aggression (0-2) (none-bite attempt with tail cut-bite attempt prior to tail cut, in 5s)
Hygiene-Related Behaviour
Grooming (0-2) (ruffled, with swaths of hair out of place-dusty/piloerection-normal/clean with sheen)
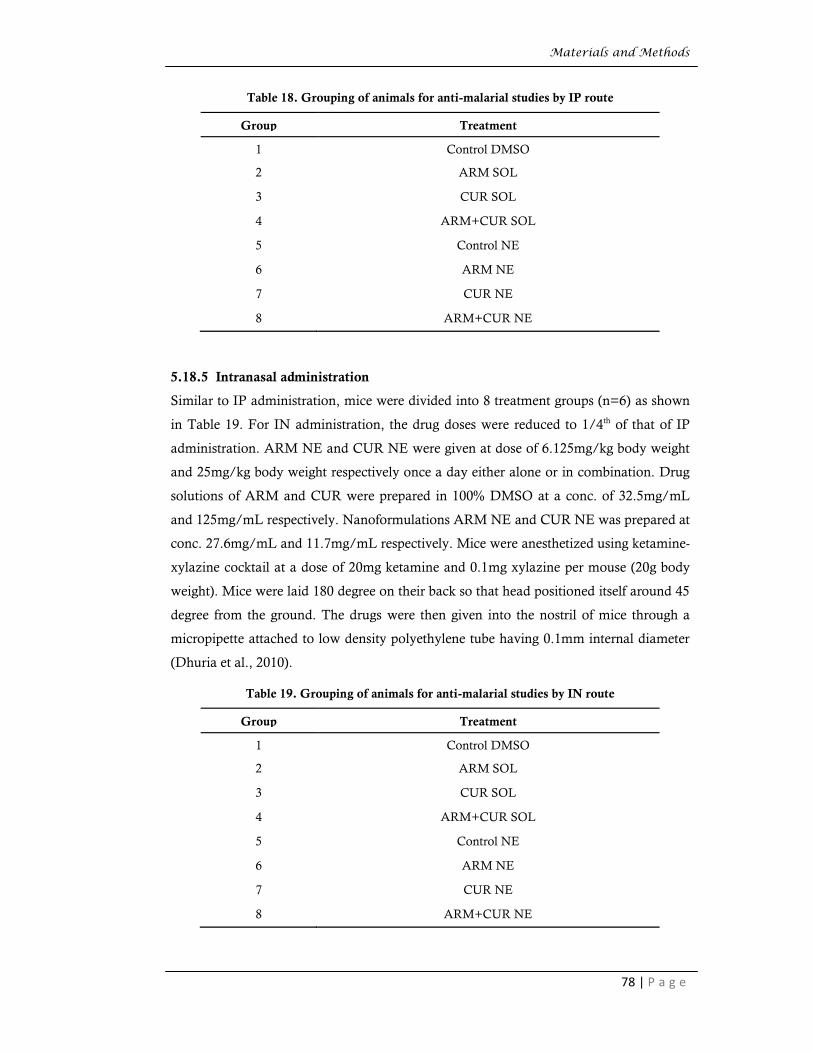
5.18.4 Intraperitoneal administration
Mice showing CM symptoms were divided into 8 treatment groups of 6 mice each as
shown in Table 18. The drug doses intended were ARM 25mg/kg body weight
(Clemmer et al., 2011) and CUR 100mg/kg body weight (Reddy et al., 2005) once a day
either alone or in combination for 5 consecutive days by IP route. The therapeutic dose
for both the drugs was selected based on the previously published reports. ARM and
CUR were dissolved in 100% DMSO at a conc. of 12.5mg/mL and 50mg/mL
respectively. Nanoformulations ARM NE and CUR NE were prepared at conc.
27.6mg/mL and 11.7mg/mL respectively.
Materials and Methods
78 | P a g e
Table 18. Grouping of animals for anti-malarial studies by IP route
Group Treatment
1 Control DMSO
2 ARM SOL
3 CUR SOL
4 ARM+CUR SOL
5 Control NE
6 ARM NE
7 CUR NE
8 ARM+CUR NE
5.18.5 Intranasal administration
Similar to IP administration, mice were divided into 8 treatment groups (n=6) as shown
in Table 19. For IN administration, the drug doses were reduced to 1/4th of that of IP
administration. ARM NE and CUR NE were given at dose of 6.125mg/kg body weight
and 25mg/kg body weight respectively once a day either alone or in combination. Drug
solutions of ARM and CUR were prepared in 100% DMSO at a conc. of 32.5mg/mL
and 125mg/mL respectively. Nanoformulations ARM NE and CUR NE was prepared at
conc. 27.6mg/mL and 11.7mg/mL respectively. Mice were anesthetized using ketamine-
xylazine cocktail at a dose of 20mg ketamine and 0.1mg xylazine per mouse (20g body
weight). Mice were laid 180 degree on their back so that head positioned itself around 45
degree from the ground. The drugs were then given into the nostril of mice through a
micropipette attached to low density polyethylene tube having 0.1mm internal diameter
(Dhuria et al., 2010).
Table 19. Grouping of animals for anti-malarial studies by IN route
Group Treatment
1 Control DMSO
2 ARM SOL
3 CUR SOL
4 ARM+CUR SOL
5 Control NE
6 ARM NE
7 CUR NE
8 ARM+CUR NE
Materials and Methods
79 | P a g e
5.18.6 Survivability and Histopathology
Mice were checked daily for survivability under various drug regimens. Autopsy was
done in mice that died of CM. Brain, spleen and liver were first washed in PBS pH 7.4
and fixed in 4% paraformaldehyde (pH 7.4) until further histopathological analysis. Each
section were stained with H and E and studied under a light microscope (Olympus BX-
51) at 400x magnification to examine the associated histopathological changes. For
detecting degenerating neurons, other deparaffinized brain sections were stained with
Fluoro-Jade®C (FJ-C) as explained elsewhere (Schmued and Hopkins, 2000). The
degenerating neuron densities were analyzed at 400x magnification using a laser
scanning confocal microscope (Carl-Zeiss).
5.18.7 Splenomegaly
Macroscopic observation of spleens from infected mice was carried out for drug loaded
NE (IP) and control group (IP). Infected spleens were excised upon death of mice,
photographed and checked for splenomegaly.
5.18.8 Statistical analysis
Pharmacokinetic and pharmacodynamic data was analyzed by two way analysis of
variance (ANOVA) followed by Tukey post test. Values were considered as significant
when P<0.05.