5, eun bong lee, md, phd6, hyun ah kim, md, phd7,8, chun ... · pdf filedisinhibition of the...
TRANSCRIPT
PAIN Publish Ahead of PrintDOI: 10.1097 . 000000000000j 0096pain./ Page 1 of 29
Disinhibition of the primary somatosensory cortex in patients with fibromyalgia
Manyoel Lim, PhD1,2, Meyke Roosink, PhD1,3, June Sic Kim, PhD 1,4, Dajung J. Kim, PhD1,9,
Hye Won Kim, MD5, Eun Bong Lee, MD, PhD6, Hyun Ah Kim, MD, PhD7,8, Chun Kee Chung,
MD, PhD1,2,9
1. MEG Center, Department of Neurosurgery, Seoul National University Hospital, Seoul, South
Korea. 2. Neuroscience Research Institute, Seoul National University Medical Research Center,
Seoul, South Korea 3. Department of Rehabilitation, Radboud University Medical Center,
Nijmegen, the Netherlands. 4. Sensory Organ Research Institute, Seoul National University
Medical Research Center, Seoul, South Korea. 5. Division of Rheumatology, Department of
Internal Medicine, Eulji University School of Medicine, Eulji General Hospital, Seoul, South
Korea. 6. Division of Rheumatology, Department of Internal Medicine, Seoul National
University College of Medicine, Seoul, South Korea. 7. Department of Internal Medicine,
Hallym University College of Medicine, Chuncheon, South Korea. 8. Division of Rheumatology,
Department of Internal Medicine, Hallym University Sacred Heart Hospital, Anyang, South
Korea. 9. Department of Brain and Cognitive Sciences, Seoul National University College of
Natural Sciences, Seoul, South Korea.
Correspondence to Chun Kee Chung, Department of Neurosurgery, Seoul National University
Hospital, 101 Daehak-ro, Jongno-gu, Seoul, 110-744, South Korea, Phone: +82-2-2072-2352,
Fax: +82-2-744-8459, Email: [email protected]
Number of pages: 37, Number of tables: 2, Number of figures: 4, Number of supplementary
tables: 2
Abstract
ACCEPTED
Copyright � 2015 by the International Association for the Study of Pain. Unauthorized reproduction of this article is prohibited.
Page 2 of 29
Fibromyalgia (FM) is a chronic widespread pain condition linked to central sensitization. Altered
excitability of sensorimotor cortex has been proposed as an underlying pathology of FM. This
study aimed to investigate intracortical excitability of the primary somatosensory cortex (S1) and
its potential role in clinical pain in patients with FM. Somatosensory evoked magnetic fields
were recorded in 17 right-handed females with FM and 21 age-, sex- and handedness-matched
healthy control subjects. Paired-pulse median nerve stimulation was delivered to the left and
right wrist. We assessed the peak-to-peak amplitudes of the N20m–P35m and peak amplitude of
each N20m and P35m component. Paired-pulse suppression (PPS) of the second response was
quantified as the ratio of the amplitudes of the second to the first response. Patients with FM
displayed significantly higher PPS ratio for the N20m–P35m in both hemispheres, indicating
reduced intracortical inhibition in the S1. Notably, PPS ratio for the P35m was higher in patients
with FM than in healthy controls, while no differences were apparent in PPS ratio for the N20m
in both hemispheres. PPS ratios for both the N20m-P35m and the P35m in the left hemisphere
were positively associated with the sensory pain on the short-form McGill Pain Questionnaire.
The present study demonstrated that intracortical inhibition in the S1 is compromised bilaterally
in patients with FM, and the extent of disinhibition can be closely associated with increased
clinical pain. Our results suggest that changes of intracortical inhibition of the S1 may contribute
to the pathophysiology of FM pain.
Keywords: Fibromyalgia, Magnetoencephalography, Primary somatosensory cortex,
Somatosensory evoked field, Paired-pulse suppressionACCEPTED
Copyright � 2015 by the International Association for the Study of Pain. Unauthorized reproduction of this article is prohibited.
Page 3 of 29
1. Introduction
Fibromyalgia (FM) is a chronic pain syndrome characterized by the widespread pain and
tenderness, often accompanied by fatigue, non-restorative sleep, and cognitive dysfunction
[37,56]. Centrally mediated augmentation of sensory and pain processing is a well-established
pathologic mechanism in FM [49,51,57]. It has been suggested that the augmented and ongoing
nociceptive input to the brain leads to cortical reorganization and maladaptive neuroplasticity
within the somatosensory and motor systems [25,34,35,41,44,50]. In a previous study using
transcranial magnetic stimulation (TMS) of the motor cortex, it showed that the patients with FM
had deficits in intracortical modulation possibly involving both γ-aminobutyric acid-releasing
(GABAergic) and glutamatergic mechanisms [41]. Recently, we found that FM patients showed
lower white matter integrity as measured by fractional anisotropy in the corpus callosum, the
structure that enables interhemispheric communication between the sensorimotor cortices [22].
However, intracortical inhibitory function in the somatosensory system of the patients with FM
has not been well understood so far.
The application of paired-pulse stimulation to a nerve trunk while recording
somatosensory evoked potential (SEP) or magnetic field is considered a suitable method for
investigating the intracortical inhibition in the somatosensory system [16,25,26,52]. The present
study aimed to investigate intracortical inhibition of the primary somatosensory cortex (S1), as
measured by paired-pulse suppression (PPS) ratio of the N20m–P35m response, in patients with
FM by utilizing paired-pulse median nerve stimulation and magnetoencephalography (MEG).
We hypothesized that intracortical inhibition of the S1 would be reduced in patients with FM, i.e.
that patients with FM would demonstrate higher PPS ratios than healthy control (HC) subjects,
ACCEPTED
Copyright � 2015 by the International Association for the Study of Pain. Unauthorized reproduction of this article is prohibited.
Page 4 of 29
and that the higher reductions of inhibition would be associated with increased clinical pain.
Also, since it has been suggested that the N20m and P35m components largely represent
excitatory and inhibitory postsynaptic potentials at S1, respectively [15,16,28,55], we further
examined PPS ratios separately for each of these components.
ACCEPTED
Copyright � 2015 by the International Association for the Study of Pain. Unauthorized reproduction of this article is prohibited.

Page 5 of 29
2. Patients and Methods
2.1. Participants
Nineteen right-handed female patients were recruited from the outpatient clinics of the
Rheumatology Departments of the Seoul National University Hospital (SNUH) and Hallym
University Sacred Heart Hospital. All examinations, except diagnosis and self-report
questionnaires, were conducted at SNUH to ensure consistency of the results. Eligibility criteria
for patients with FM were: 1) meeting the American College of Rheumatology 1990 criteria for
primary FM [56]; 2) having a duration of widespread pain at least 3 months, but less than 10
years; 3) experiencing the pain intensity of at least 40, on the 0 to 100 mm pain visual analogue
scale (VAS) over the past week; 4) aging between 30–60 years; and 5) willing to stop taking
medications known to influence the somatosensory system (e.g. analgesics, antidepressants, and
anticonvulsants) at least 3 days prior to the assessments. Patients were excluded if they had: 1)
secondary FM associated with inflammatory arthritis; 2) a medical history of axis 1 psychiatric
disorders (i.e., major depressive disorder, schizophrenia, substance abuse) or other disorders
affecting the central nervous system (i.e. cerebrovascular accident, multiple sclerosis,
Parkinson’s disease); 3) signs of peripheral neuropathy at the upper extremities (e.g. related to
trauma, polyneuropathy); 4) concomitant acute pain in the upper extremities (e.g. due to injury);
5) hearing loss or use of hearing aids; 6) pregnancy or breastfeeding; or 7) contradictions for
MEG (i.e. dental braces, permanent retainers) and/or magnetic resonance imaging (MRI) (i.e.
pacemakers, cochlear devices, surgical clips, metallic implants, orthopedic pins) assessments.
Age-, gender-, and handedness- matched 21 HC participants were recruited by local
advertisement. Exclusion criteria were same as for patients. The study protocol was approved by
the institutional review board at SNUH and Hallym University Sacred Heart Hospital and was
ACCEPTED
Copyright � 2015 by the International Association for the Study of Pain. Unauthorized reproduction of this article is prohibited.
Page 6 of 29
conducted in compliance with the Declaration of Helsinki. All participants provided written
informed consent.
2.2. Clinical assessments
For patients with FM, the disease duration (since the onset of wide-spread pain) and the number
of tender points (as assessed by the treating rheumatologist using manual palpation upon
inclusion) were registered. Additionally, the tender points count was (re-)assessed by a trained
rheumatologist from the SNUH (H.W.K) in both FM patients and healthy subjects using a hand-
held pressure algometer (Baseline Evaluation Instruments, Fabrication Enterprises, New York,
USA). The Edinburgh Handedness Inventory [45], Beck Depression Inventory (BDI) [2], Beck
Anxiety Inventory (BAI) [1], and the Fibromyalgia Impact Questionnaire (FIQ) [3] were
assessed. The pain intensity for current and average, and the medication intake were assessed.
Sensory and affective components of pain quality were assessed by the short-form McGill Pain
Questionnaire (SF-MPQ) [39]. Demographic and clinical characteristics of the participants are
presented in Table 1.
Table 1
2.3. Median nerve stimulation
The left and right median nerves were stimulated at the wrist with 0.2 msec of constant current
pulses using bipolar electrodes in separate sessions. Electrical stimulations were sequenced with
a STIM2 system (Neuroscan, El Paso, TX, USA) and delivered by using high voltage, constant
current stimulator (Digitimer DS7AH, Digitimer Ltd, Hertfordshire, England).
Before the recordings, sensory and motor threshold were determined individually by
ACCEPTED
Copyright � 2015 by the International Association for the Study of Pain. Unauthorized reproduction of this article is prohibited.
Page 7 of 29
manually increasing the stimulator current output in the increments of 0.2 mA and 0.3 mA,
respectively. We defined the sensory threshold as the lowest level of electrical stimulus intensity
that produces the subtle tactile sensation on the skin of the wrist. The motor threshold was
determined as the lowest level of stimulus intensity for eliciting a visible twitch of the abductor
pollicis brevis muscle. All thresholds were determined twice and then averaged. The stimulus
intensity was set to 130% of each subject's motor threshold during the recording [14], where all
participants did not feel any painful sensation. This was checked before and after MEG
recordings.
2.4. Experimental conditions
Single-pulse stimuli and paired-pulse stimuli with an inter-pulse interval of 100 msec were
presented alternatingly in one run [16]. The inter-stimulus interval between the single-pulse and
paired-pulse stimuli was 3 sec. The subjects were instructed not to pay attention to the stimulus
and to keep their gaze fixed on a cross, shown in the center of the display in front of them [16].
The order of the stimulation on the left and right median nerves at the wrist was randomized
across subjects. The researcher (M.L) monitored both hands’ positions and stimulus-induced
muscle twitches on-line via a video camera throughout the recordings.
2.5. MEG recordings
Neuromagnetic signals were recorded with a 306-channel whole-head neuromagnetometer
(VectorViewTM, Elekta Neuromag, Helsinki, Finland) comprised of 102 identical triple sensors
(two orthogonal planar gradiometers and one magnetometer) in a magnetically shielded room.
During the MEG recordings, the subjects sat comfortably under the helmet-shaped sensor array
ACCEPTED
Copyright � 2015 by the International Association for the Study of Pain. Unauthorized reproduction of this article is prohibited.
Page 8 of 29
and were asked to keep their heads as still as possible. The exact location of the head with
respect to the sensors was found by measuring the magnetic signals produced by electrical
currents delivered to four head position indicator coils placed at known sites on the scalp. The
location of head position indicator coils with respect to three anatomical landmarks, the nasion
and two preauricular points, were measured by using a three-dimensional digitizer (FASTRAK™,
Polhemus, Colchester, Vermont, USA), to allow alignment of the MEG and MRI coordinate
systems. The x-axis passed through the two preauricular points with the positive direction to the
right. The positive y-axis passed through the nasion, and the z-axis pointed upward. The high-
resolution, T1-weighted, MR images were obtained from all subjects, except for one HC subject
due to claustrophobia, using a Siemens 3T scanner (Siemens Magnetom TrioTim, Siemens,
Erlangen, Germany).
The MEG signals were bandpass filtered (0.1–300 Hz) and digitized at 1 kHz. To reduce
the environmental and biological noises, we applied the spatiotemporal signal space separation
method using MaxFilter software version 2.2.10 (Elekta Neuromag, Helsinki, Finland) [29,53].
2.6. Data analysis
The analysis period of 400 ms included a pre-stimulus baseline of 100 msec. Epochs with
amplitudes exceeding 3000 fT/cm for MEG channel or 150 µV for electrooculogram were
excluded from the average. At least 120 artifact-free epochs were averaged for each single-pulse
and first pulse of the paired-pulse. The data of 2 FM subjects were excluded from further
analyses for the following reasons: excessive rejections of epochs due to signals contaminated by
eye movements and the absence of MEG data with left median nerve stimulation.
After the paired-pulse stimulations with an inter-pulse interval of 100 msec, it was
ACCEPTED
Copyright � 2015 by the International Association for the Study of Pain. Unauthorized reproduction of this article is prohibited.

Page 9 of 29
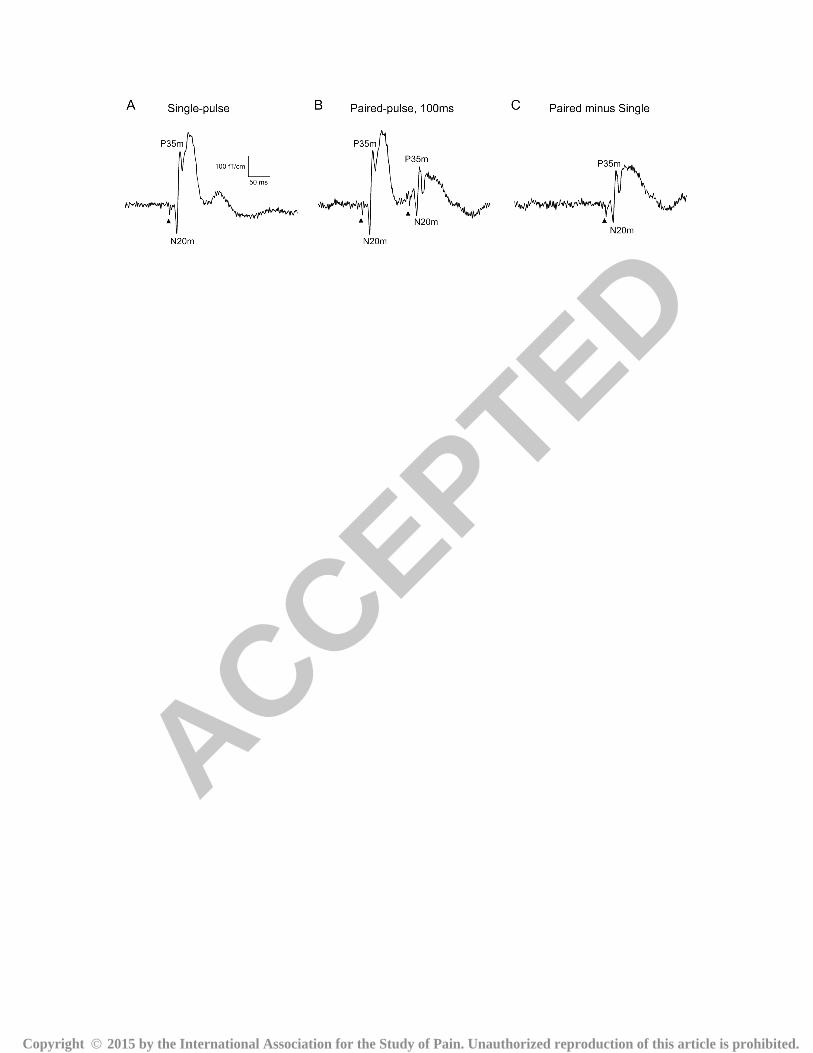
shown that the response to the second pulse rides on the response to the first pulse (see Fig. 1B).
Therefore, linear superposition effect was factored out, by subtracting the response to single-
pulse stimuli from the response to paired-pulse stimuli, to assess “true” paired-pulse interaction
(Fig. 1C) [13,14,25]. Based on these analysis procedures, the baseline corrected responses of
N20m and P35m were obtained (Fig. 1C) [16].
The sources of the measured evoked responses to single electrical stimuli were modeled
in the time domain as equivalent current dipoles (ECDs) [11]. This source analysis was
performed blind to group status. The equivalent current dipole (ECD), which best explains the
measured data, was determined at around 35 ms to obtain a S1 source with a high signal-to-noise
ratio [28] by a least-squares search using a subset of 24 gradiometers over contralateral parietal
areas. Those analyses led to the three-dimensional location, orientation, and strength of the ECD
in a spherical volume conductor model of the head. For the subject for which no brain MRI was
available, a sphere model was fitted to accurately digitized isotrak points [8] using MaxFilter
software version 2.2.10 (Elekta Neuromag, Helsinki, Finland). Source identification for this
subject was determined by considering coordinates, peak latencies, and orientations of the
modeled sources. Only ECD with goodness-of-fit over 90% were accepted for further analysis.
After identifying the single dipole, the entire analysis period and all channels were taken into
account in computing the time-varying single dipole model. The location and orientation of the
ECD were fixed. To validate the single-dipole model, measured MEG signals were compared to
the responses predicted by the model. The estimated ECD for single-pulse condition were
applied to the paired-pulse (Fig. 1B) and to the difference between paired-pulse and the single-
pulse conditions (Fig. 1C) [28].
Fig. 1
ACCEPTED
Copyright � 2015 by the International Association for the Study of Pain. Unauthorized reproduction of this article is prohibited.

Page 10 of 29
For each subject, we analyzed the peak-to-peak amplitudes of the N20m–P35m, and
peak amplitude of the each N20m and P35m component in response to the first pulse of the
paired-pulse stimulation (A1). The peak-to-peak amplitudes of the N20m–P35m, and the peak
amplitude of N20m and P35m components to the second pulse of the paired-pulse stimulation
were obtained in the source waveform of paired-pulse minus single-pulses conditions (A2s). The
PPS was then expressed as the ratio (A2s/A1) of the amplitudes of the second (A2s) to the first
(A1) responses (PPS ratio for N20m–P35m, N20m and P35m). The higher ratios are associated
with reduced PPS, while lower ratios are associated with stronger PPS.
Individual MRIs were spatially normalized in the Talairach coordinates using
BrainVoyager QX software (version 1.10; Brain Innovation, Maastricht, The Netherlands)
according to Lim et al. (2011) [27]. Source locations of the S1 responses in the head coordinates
were transformed into Talairach coordinates using Brain Electrical Source Analysis software
(version 5.1.8; MEGIS software, Munich, Germany). Twenty HC subjects whose MRI data were
available are included in deriving the source location in the Talairach coordinates.
2.7. Statistical analysis
The PPS ratios of S1 response were compared using repeated measure analysis of variance
(ANOVA) with hemisphere (contralateral to each hand) as within-subject factor and group (FM
and HC) as between-subject factor. Source locations of the S1 responses were compared in each
hemisphere separately by means of repeated measure ANOVA with coordinate (x, y and z) as
within-subject factor and group (FM and HC) as between-subject factor. The Mauchly's test of
sphericity was used to evaluate whether the sphericity assumption was violated. Our main
question is to what extent intracortical inhibition of the S1 explains the variance of clinical pain
ACCEPTED
Copyright � 2015 by the International Association for the Study of Pain. Unauthorized reproduction of this article is prohibited.
Page 11 of 29
in FM patients. Therefore, linear regression analysis was performed with the PPS ratio as an
independent variable, and the sensory and affective pain scores of the SF-MPQ and pain
intensity on a VAS (past week) as a dependent variable. P values of <0.016 (0.05/3) were
considered significant after Bonferroni correction. Since FM is a disorder with varying clinical
characteristics (e.g., depressive and anxiety symptoms), we’d like to determine if these
symptoms were reflected in our findings. Thus, the potential relationship between depressive or
anxiety symptoms of FM patients and the PPS ratio were tested using Pearson's correlation in an
exploratory fashion. P < 0.05 was taken as a prior significant threshold. We performed all
statistical analyses using the SPSS 13.0 software package (SPSS Inc., Chicago, IL, USA).
ACCEPTED
Copyright � 2015 by the International Association for the Study of Pain. Unauthorized reproduction of this article is prohibited.
Page 12 of 29
3. Results
All group data are presented as mean ± standard deviations.
3.1. Stimulus intensity
Electrical sensory threshold was not different between groups in both left (FM for 1.63 ± 0.40
mA and HC for 1.54 ± 0.34 mA, P = 0.453) and right hand (FM for 1.71 ± 0.45 mA and HC for
1.61 ± 0.31 mA, P = 0.464). The stimulus intensities set at 130% of motor threshold for median
nerve were not different between groups in both left (FM for 5.28 ± 1.20 mA and HC for 5.07 ±
1.17 mA, P = 0.590) and right hand (FM for 5.28 ± 1.20 mA and HC for 5.57 ± 1.20 mA, P =
0.455).
3.2. Paired-pulse suppression
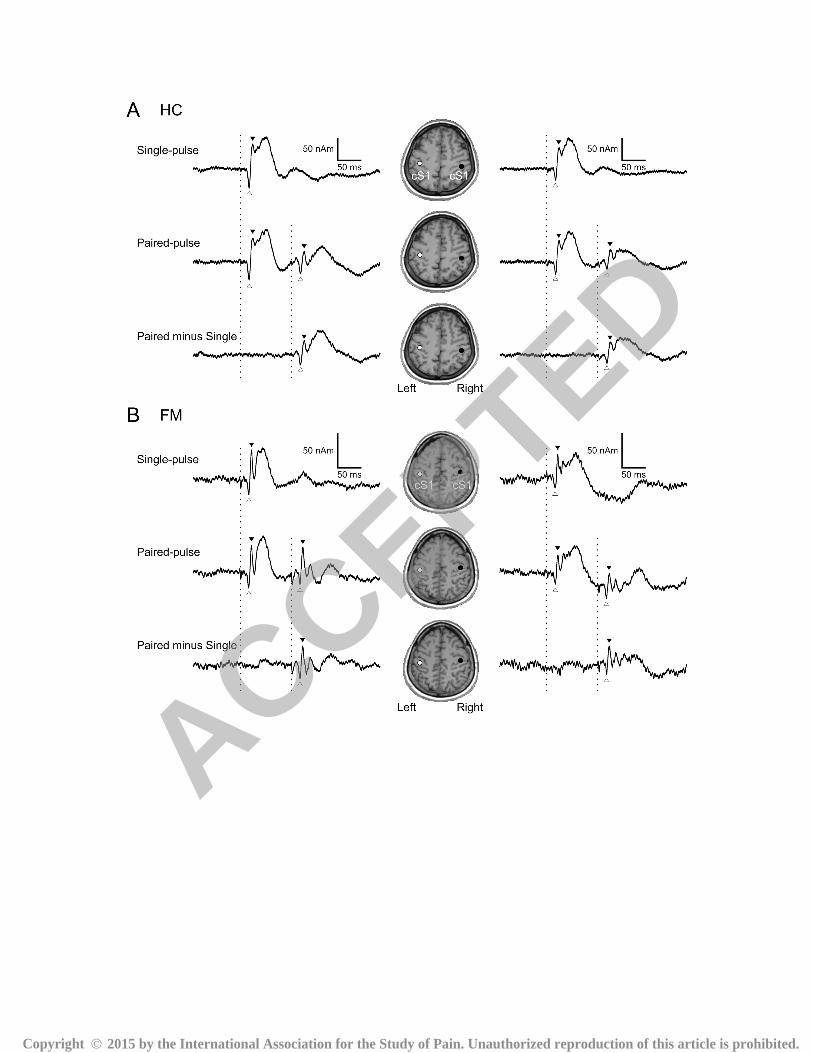
Fig. 2 shows the cortical responses to single-pulse and paired-pulse median nerve stimuli in one
representative HC and FM subject, respectively. The sources of the P35m response were located
in the posterior bank of the central sulcus, corresponding to area 3b of S1. In HC subject, the
amplitudes of the second response were markedly suppressed as compared to the first response in
both hemispheres (A). In this subject, N20m–P35m PPS ratios for the left and right hemisphere
were 0.578 and 0.617, respectively. In contrast, in patients with FM, amplitudes of the second
response were comparable to the first response in both hemispheres (B). In this subject, N20m–
P35m PPS ratios for left and right hemispheres were 0.773 and 0.983, respectively.
Fig. 2
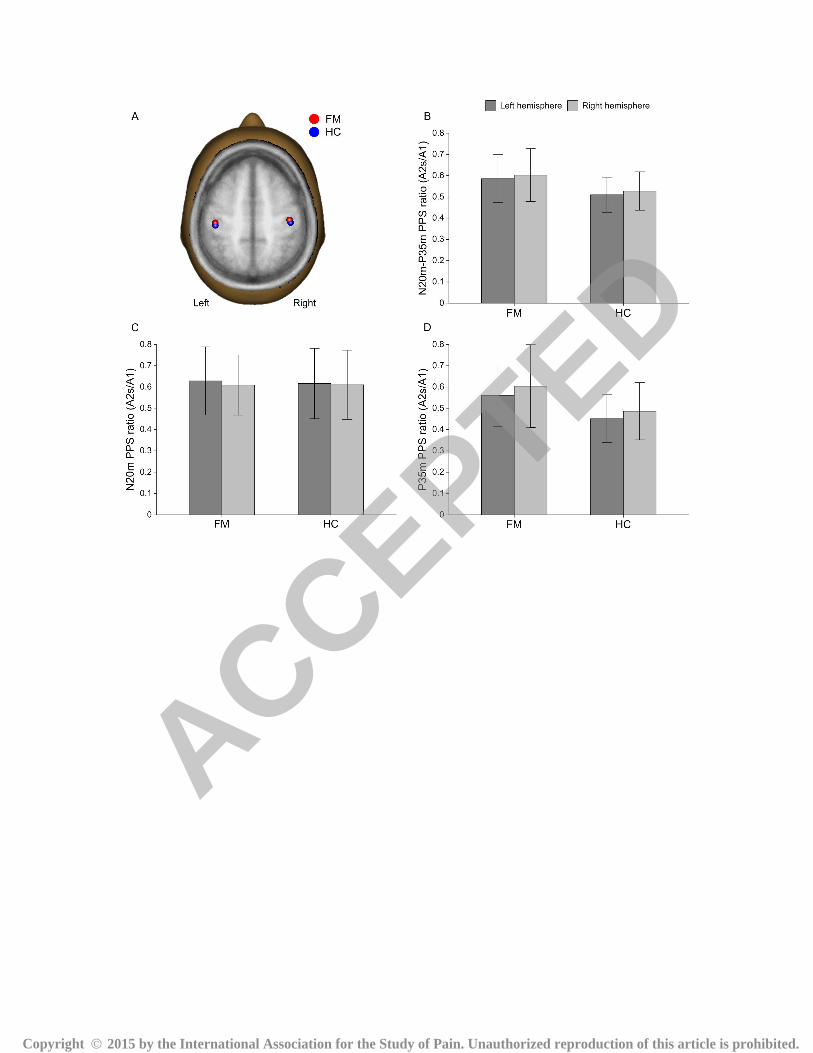
The mean source locations of S1 in each hemisphere were superimposed on the standard
brain (Fig. 3A). The results showed a main effect of coordinate (left, P < 0.001; right, P < 0.001,
respectively), whereas no main effect of group (left, P = 0.431; right, P = 0.565, respectively)
ACCEPTED
Copyright � 2015 by the International Association for the Study of Pain. Unauthorized reproduction of this article is prohibited.
Page 13 of 29
and no coordinate X group interaction effect (left, P = 0.595; right, P = 0.369, respectively) were
found both in the left and right hemispheres. In the FM group, the mean coordinates (mm) were x
= −42.2 ± 7.9, y = −21.4 ± 7.8, and z = 48.3 ± 5.7 for the left S1; x = 41.0 ± 6.8, y = −18.2 ± 7.6,
and z = 50.1 ± 6.2 for the right S1. In the HC group, the mean coordinates (mm) were x = −42.1
± 5.0, y = −24.2 ± 7.2, and z = 48.3 ± 5.3 for the left S1, and x = 42.2 ± 4.5, y = −21.3 ± 7.7, and
z = 50.3 ± 4.6 for the right S1. Fig. 3B shows the mean PPS ratios for the N20m–P35m in
patients with FM and HC subjects. A repeated measure ANOVA showed a significant main
effect of group (P = 0.009), indicating that the PPS ratios were higher in patients with FM than in
HC subjects. There was no significant main effect of hemisphere (P = 0.377), nor was there a
group X hemisphere interaction effect (P = 0.987). As such, the mean PPS ratio for the N20m–
P35m in both the left and the right hemispheres were higher in patients with FM than in HC
subjects (Table 2). Notably, there was a significant main effect of group (P = 0.009) for P35m
component with no main effect for the hemisphere (P = 0.124) and no significant group X
hemisphere interaction (P = 0.879) (Fig. 3D). In contrast, we did not find any significant effect
of group (P = 0.890), hemisphere (P = 0.698), or their interaction (P = 0.837) for N20m
component (Fig. 3C).
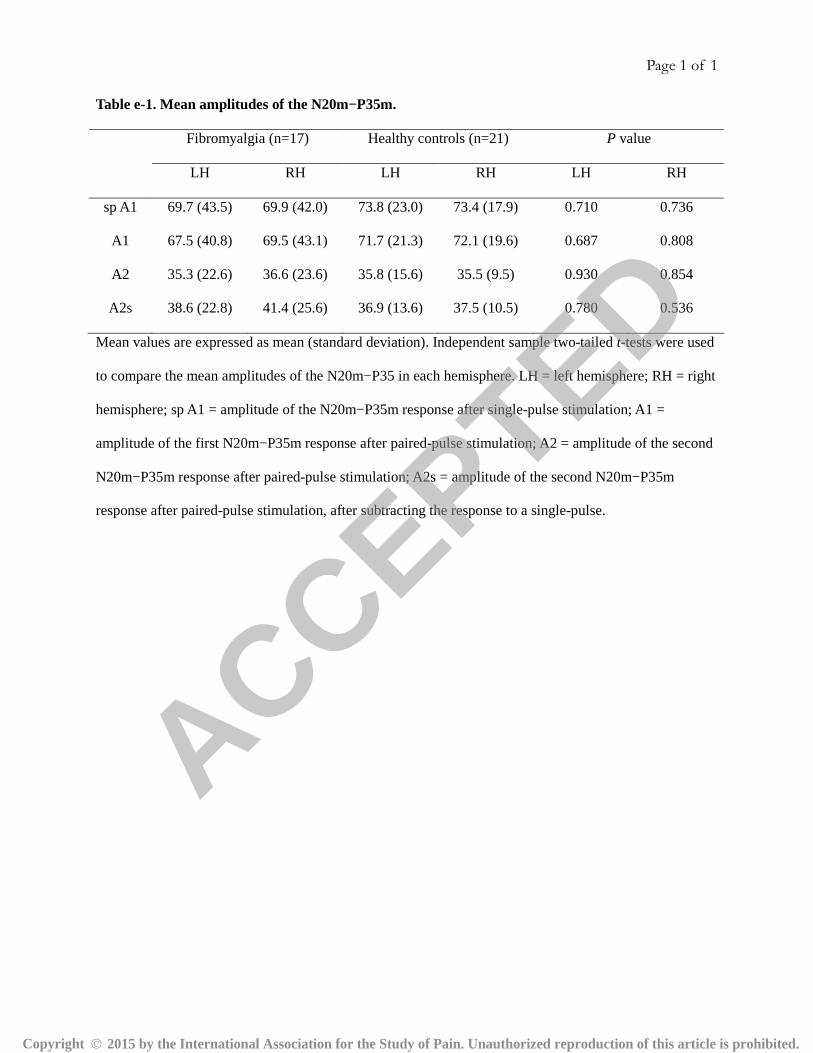
With regard to the N20m–P35m amplitude, there was no main effect of group (A1, P =
0.740; A2s, P = 0.639, respectively) or hemisphere (A1, P = 0.623; A2s, P = 0.301, respectively)
or any group X hemisphere interaction effect (A1, P = 0.756; A2s, P = 0.517, respectively) in
response to both the first pulse of the paired-pulse stimulation (A1) and second pulse of the
paired-pulse stimulation, after subtracting the response to a single-pulse (A2s) (Table e-1). With
regard to amplitude of the first P35m after paired-pulse stimulation (A1), no significant main
effect of group (P = 0.870) or hemisphere (P = 0.257) or any group X hemisphere interaction
ACCEPTED
Copyright � 2015 by the International Association for the Study of Pain. Unauthorized reproduction of this article is prohibited.
Page 14 of 29
effect (P = 0.732) were found. For amplitude of the second P35m after subtracting the response
to a single-pulse (A2s), ANOVA revealed a significant main effect of hemisphere (P = 0.040)
but no main effect of group (P = 0.426) or group X hemisphere interaction effect (P = 0.562).
Fig. 3
3.3. Correlation with symptom severity
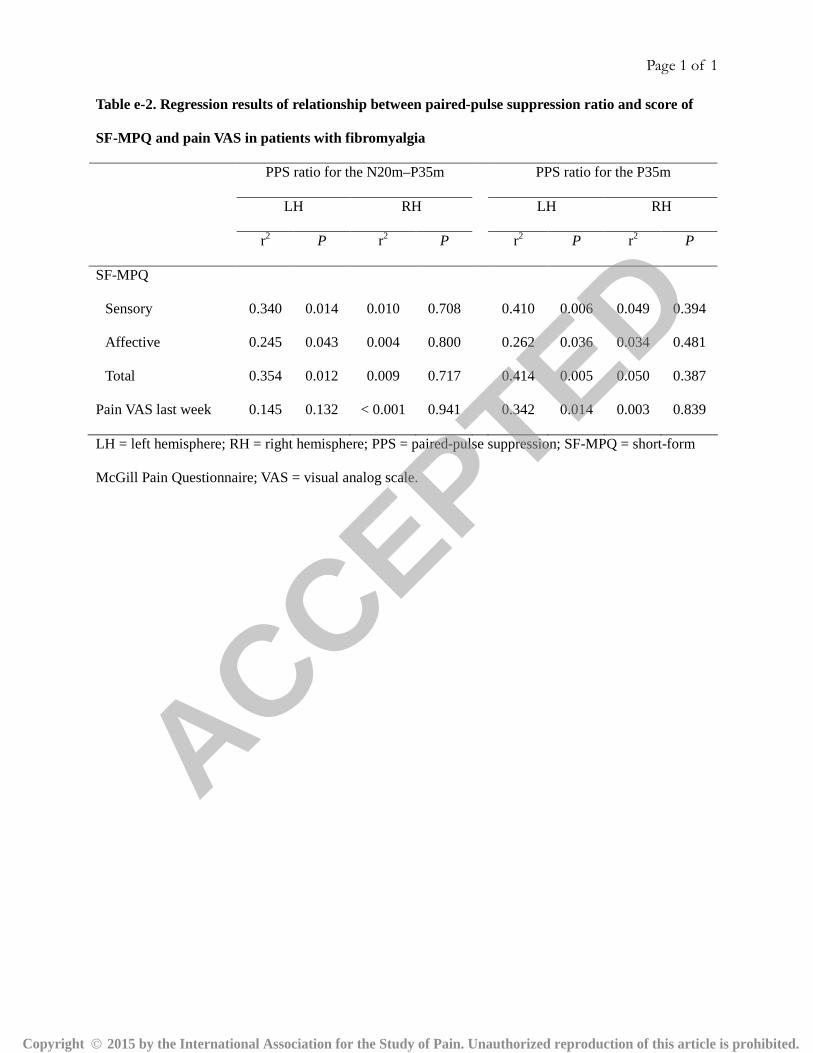
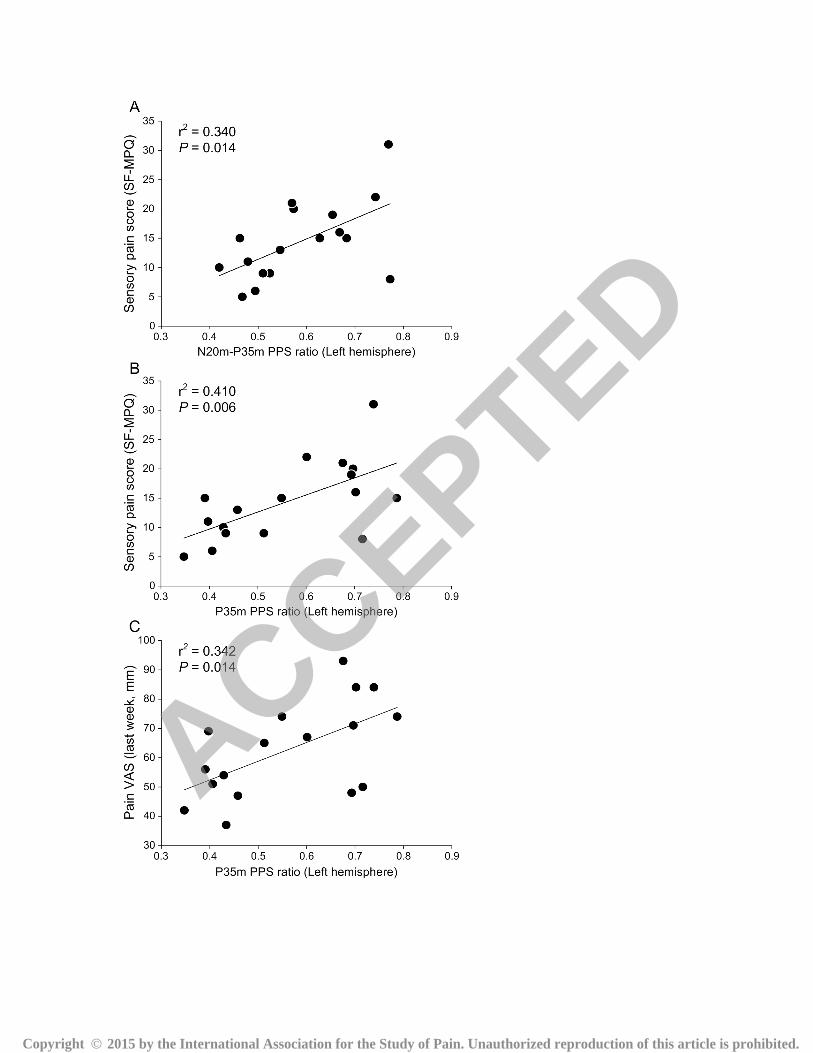
Fig. 4 shows the relationship between the PPS ratio and clinical pain intensity in FM patients.
After correcting for multiple comparisons, a higher PPS ratio for the N20m–P35m in the left
hemisphere was significantly associated with higher clinical pain ratings in the sensory (r2 =
0.340, P = 0.014), but not the affective (r2 = 0.262, P = 0.036) dimensions of pain (Fig. 4A,
Table e-2). Notably, a higher PPS ratio for the P35m was more closely associated with higher
clinical pain ratings in the sensory (r2 = 0.410, P = 0.006) dimension of pain (Fig. 4B). PPS ratio
for P35m component was also positively associated with average pain intensity over the last
week (r2 = 0.342, P = 0.014) (Fig. 4C). In our exploratory analysis, we did not find any
significant correlation between PPS ratios (N20m–P35m and P35) and BAI, and BDI scores in
FM patients (all Ps > 0.05).
Fig. 4
4. Discussion
The present study is the first to demonstrate that in patients with FM, intracortical inhibition in
the S1 is compromised bilaterally and the extent of disinhibition can be closely associated with
increased clinical pain.
The S1 has not received much attention compared to other brain regions involved in pain
modulation [17-21,30,48] as the pathophysiology of FM, which could be related to its well-
ACCEPTED
Copyright � 2015 by the International Association for the Study of Pain. Unauthorized reproduction of this article is prohibited.
Page 15 of 29
known role in early sensory discrimination. However, the pain-induced cortical reorganization
and maladaptive neuroplasticity in the S1 has been suggested to be involved in the development
and maintenance of chronic pain [25,35,44,50]. Reorganization of the somatotopic map within
S1 was closely related to clinical pain in other chronic pain disorders such as phantom limb pain
or complex regional pain syndrome (CRPS) [35,44]. In addition, a recent paired-pulse SEP study
by Lenz et al. showed higher PPS ratio in the hemispheres contralateral to both the affected and
unaffected hands in the patients with CRPS type I [25]. Previous FM studies have revealed
evidence of cortical reorganization of the S1 due to central sensitization associated with
persistent pain. Several electrophysiological and neuroimaging studies assessing brain activity
during painful stimulus in patients with FM showed widespread augmented activation in brain
regions including the S1 [4,7,33]. In addition, a recent resting-state functional MRI study
reported increased spectral power in the S1, indicating the high level of baseline neural activity
in FM patients [23]. FM has been also associated with structural reorganization, i.e. increased
white matter fractional anisotropy, in the bilateral postcentral gyri [32]. In the present study, we
observed a robust positive relationship between the reduced intracortical inhibition of the S1, and
the sensory pain score on the SF-MPQ. Thus, cortical reorganization appearing as reduced
intracortical inhibition of the S1 may be responsible for chronic pain in patients with FM.
Because intracortical inhibition is known to have an important role in determining the size of the
receptive field within S1 [12], reorganization of the somatotopic map measured by the distance
between cortical representations within the S1 in patients with FM needs to be addressed in
future studies. This cortical reorganization may explain the diffuse tenderness and widespread
pain [49], as well as disturbances in body perception, such as reduction in awareness of limb
positions and phantom swelling of the hands commonly reported by patients with FM [38].
ACCEPTED
Copyright � 2015 by the International Association for the Study of Pain. Unauthorized reproduction of this article is prohibited.
Page 16 of 29
The findings of disinhibition of the S1 in this study together with the changes in motor
cortex excitability [41] and pain reduction after repetitive TMS over the motor cortex in the
patients with FM [40,46] suggest that patients with FM exhibit altered excitability of the
sensorimotor system in relation to chronic pain and its improvement. It has been suggested that
the analgesic effects produced by motor cortex stimulation are related to the restoration of
defective intracortical inhibition [24]. An interesting question is whether the abnormal
intracortical inhibition in S1 would be reversed after repetitive TMS of the motor cortex.
So far, the mechanisms underlying PPS are not fully understood. Based on studies in
animals, both presynaptic and postsynaptic GABAergic inhibition have emerged as important
regulators of PPS [47,54]. In human subjects, paired-pulse SEP experiments have shown that
PPS is generated rostral to the brainstem nuclei, presumably in the cortex [13]. Moreover, after
the intravenous injection of the lorazepam, a GABAA receptor agonist, the amplitude of P35m
response was attenuated in the single-pulse condition and PPS of P35m component was
strengthened (marginally significant) [16]. They further observed that P35m response did not
recover in the 100 msec paired-pulse condition [16], which was similar to the behaviors of
inhibitory postsynaptic potentials in intracellular recording [5]. Thus, taken together, our results
of higher PPS ratio of the P35m component in FM patients compared to healthy subjects could
be related to reduction of GABA-mediated inhibitory function in the S1. Recent studies using in-
vivo magnetic resonance spectroscopy provided direct evidence of dysfunction of GABAergic
system in FM [6]. Patients with FM had lower GABA level within the right anterior insula. In
addition, GABA level within the right posterior insula was positively correlated with pressure
pain threshold, suggesting alterations of inhibitory neurotransmission in FM. Additional
assessments of GABA levels in the S1 might further contribute to the interpretation of our results.
ACCEPTED
Copyright � 2015 by the International Association for the Study of Pain. Unauthorized reproduction of this article is prohibited.
Page 17 of 29
No group differences in amplitudes of the S1 response to single-pulse or first pulse of
the paired-pulse stimuli are in line with results from a previous study that demonstrated no
difference in the amplitude of the P50 response to first tactile stimuli of paired stimuli between
FM patients and HCs [43]. In contrast, a recent MEG study by Maestu et al. reported that FM
patients showed an augmented S1 response to subjectively-matched painful pressure stimulation
on tender points [33]. They reasoned that enhanced responses in somatosensory and prefrontal
areas could reflect an increased sensitization or lack of inhibition. Differences found between
studies can be attributed two points; first, it might stem from the use of different stimulus sites
(tender vs. non-tender points) and properties (painful vs. nonpainful). Second, responses to
nonpainful sensory stimuli may not be augmented in early sensory cortices but may appear
augmented during later stages of sensory integration as suggested by recent functional MRI
study [31].
The experimental design of the present study was methodologically sound. First, the
inter-pulse interval of 100 msec has been shown to be sufficiently short to identify a significant
PPS in the S1 [10,16]. This was confirmed by our results, showing that the amplitude of the
N20m and P35 components was successfully suppressed by paired-pulse stimulation in HCs.
However, the higher PPS ratios in patients with FM were only found for P35m but not for N20m.
This might be explained by the relatively short recovery cycle of N20m component, which
reflects excitatory postsynaptic potentials [16,55]. Second, since the amplitudes of N20m and
P35m components is known not to be affected by an inter-stimulus interval of 3 sec [55],
preceding single-pulse stimuli would not affect the amplitude of the first S1 response to paired-
pulse stimuli. Third, a recent study in HC subjects demonstrated no significant difference in PPS
ratios when comparing different stimulus intensities (250% of the sensory threshold and 100%,
ACCEPTED
Copyright � 2015 by the International Association for the Study of Pain. Unauthorized reproduction of this article is prohibited.
Page 18 of 29
120%, and 140% of the motor threshold) [14]. Moreover, the stimulus intensity for the left and
right median nerves was not different between the groups in our study. Thus, it is unlikely that
the stimulus intensity might have affected between-group differences of PPS ratio. Lastly,
although the subjects were instructed not to pay attention to the stimulus, the fixed order of
stimuli could act as a possible confounder, in a way which affects anticipation of or attention to
the next stimulus. However, in previous somatosensory evoked field studies, the amplitude of the
S1 response was not changed by paying attention to the stimuli [9,36,42]. In addition, we
observed that the amplitude of the N20m–P35m was not different between the response to
single-pulse and that of the first pulse of the paired-pulse stimulation in both groups (Table e-1).
Thus, we consider it is highly unlikely that the fixed order of stimuli affected the response to
single-pulse or paired-pulse stimuli in individual subjects and altered the PPS ratio of the N20m–
P35m response.
The present findings should be interpreted with caution. Although we tried to negate
medication effects on cortical excitability by stopping all medications 3 days before the MEG
recording this may not have been enough to rule out a potential effect. Even so, Mhalla et al.
demonstrated that motor cortex excitability and intracortical modulation in patients with FM was
not different between patients with and without taking medications [41]. Therefore, medication
effects on cortical excitability in our study might be considered minimal as compared to disease
effects. In the clinical correlation analyses between PPS ratio and clinical pain, a significant
result was only found in the left hemisphere. We have no clear explanation for this finding at this
stage. We speculated that this could be due to a hemispheric imbalance of disinhibition, since
PPS ratio for the P35 component in the left and right hemispheres were correlated in the HC
subjects (r2 = 0.323, P = 0.007), but not in FM patients (r2 = 0.173, P = 0.096). Changes of the
ACCEPTED
Copyright � 2015 by the International Association for the Study of Pain. Unauthorized reproduction of this article is prohibited.
Page 19 of 29
PPS ratio (A2s/A1) can be influenced by the amplitude of the second response or by the
amplitude of the first response. In the present study, however, the amplitudes of N20m–P35m
and P35m in response to the first pulse of the paired stimuli (A1) and the second pulse of the
paired stimuli after subtracting the response to a single-pulse (A2s) were not different between
FM patients and HC subjects. Taken together, our results cannot determine which amplitudes
contribute to a reduced PPS ratio in patients with FM.
In summary, the present study demonstrated that intracortical inhibition in the S1 is
compromised bilaterally in patients with FM, and the extent of disinhibition can be closely
associated with increased clinical pain. Our results suggest that changes of intracortical
inhibition of the S1 may contribute to the pathophysiology of FM pain.
ACCEPTED
Copyright � 2015 by the International Association for the Study of Pain. Unauthorized reproduction of this article is prohibited.

Page 20 of 29
Acknowledgments
This study was supported by the Original Technology Research Program for Brain Science
through the National Research Foundation of Korea (NRF) funded by the Ministry of Education,
Science and Technology (NRF-2009-0094093). The authors have no conflict of interest to
declare.
ACCEPTED
Copyright � 2015 by the International Association for the Study of Pain. Unauthorized reproduction of this article is prohibited.
Page 21 of 29
References
[1] Beck AT, Epstein N, Brown G, Steer RA. An inventory for measuring clinical anxiety:
psychometric properties. J Consult Clin Psychol 1988;56:893-7.
[2] Beck AT, Ward CH, Mendelson M, Mock J, Erbaugh J. An inventory for measuring
depression. Arch Gen Psychiatry 1961;4:561-71.
[3] Burckhardt CS, Clark SR, Bennett RM. The fibromyalgia impact questionnaire: development
and validation. J Rheumatol 1991;18:728-33.
[4] Cook DB, Lange G, Ciccone DS, Liu WC, Steffener J, Natelson BH. Functional imaging of
pain in patients with primary fibromyalgia. J Rheumatol 2004;31:364-78.
[5] Deisz RA. GABA(B) receptor-mediated effects in human and rat neocortical neurones in
vitro. Neuropharmacology 1999;38:1755-66.
[6] Foerster BR, Petrou M, Edden RA, Sundgren PC, Schmidt-Wilcke T, Lowe SE, Harte SE,
Clauw DJ, Harris RE. Reduced insular gamma-aminobutyric acid in fibromyalgia.
Arthritis Rheum 2012;64:579-83.
[7] Gracely RH, Petzke F, Wolf JM, Clauw DJ. Functional magnetic resonance imaging evidence
of augmented pain processing in fibromyalgia. Arthritis Rheum 2002;46:1333-43.
[8] Gross J, Baillet S, Barnes GR, Henson RN, Hillebrand A, Jensen O, Jerbi K, Litvak V, Maess
B, Oostenveld R, Parkkonen L, Taylor JR, van Wassenhove V, Wibral M, Schoffelen JM.
Good practice for conducting and reporting MEG research. Neuroimage 2013;65:349-63.
[9] Hamada Y, Okita H, Suzuki R. Effect of interstimulus interval on attentional modulation of
cortical activities in human somatosensory areas. Clin Neurophysiol 2003;114:548-55.
[10] Hamada Y, Otsuka S, Okamoto T, Suzuki R. The profile of the recovery cycle in human
primary and secondary somatosensory cortex: a magnetoencephalography study. Clin
ACCEPTED
Copyright � 2015 by the International Association for the Study of Pain. Unauthorized reproduction of this article is prohibited.

Page 22 of 29
Neurophysiol 2002;113:1787-93.
[11] Hamalainen M, Hari R, Ilmoniemi RJ, Knuutila J, Lounasmaa OV.
Magnetoencephalography - theory, instrumentation, and applications to noninvasive
studies of the working human brain. Rev Mod Phys 1993;65:413-97.
[12] Hicks TP, Dykes RW. Receptive-field size for certain neurons in primary somatosensory
cortex is determined by GABA-mediated intracortical inhibition. Brain Res
1983;274:160-4.
[13] Hoffken O, Lenz M, Tegenthoff M, Schwenkreis P. Multichannel SEP-recording after paired
median nerve stimulation suggests origin of paired-pulse inhibition rostral of the
brainstem. Neurosci Lett 2010;468:308-11.
[14] Hoffken O, Tannwitz J, Lenz M, Sczesny-Kaiser M, Tegenthoff M, Schwenkreis P.
Influence of parameter settings on paired-pulse-suppression in somatosensory evoked
potentials: a systematic analysis. Clin Neurophysiol 2013;124:574-80.
[15] Huttunen J. In search of augmentation at human SI: Somatosensory cortical responses to
stimulus trains and their modulation by motor activity. Brain Res 2010;1331:74-9.
[16] Huttunen J, Pekkonen E, Kivisaari R, Autti T, Kahkonen S. Modulation of somatosensory
evoked fields from SI and SII by acute GABA A-agonism and paired-pulse stimulation.
Neuroimage 2008;40:427-34.
[17] Jensen KB, Kosek E, Petzke F, Carville S, Fransson P, Marcus H, Williams SC, Choy E,
Giesecke T, Mainguy Y, Gracely R, Ingvar M. Evidence of dysfunctional pain inhibition
in Fibromyalgia reflected in rACC during provoked pain. Pain 2009;144:95-100.
[18] Jensen KB, Kosek E, Wicksell R, Kemani M, Olsson G, Merle JV, Kadetoff D, Ingvar M.
Cognitive Behavioral Therapy increases pain-evoked activation of the prefrontal cortex in
ACCEPTED
Copyright � 2015 by the International Association for the Study of Pain. Unauthorized reproduction of this article is prohibited.
Page 23 of 29
patients with fibromyalgia. Pain 2012;153:1495-503.
[19] Jensen KB, Loitoile R, Kosek E, Petzke F, Carville S, Fransson P, Marcus H, Williams SC,
Choy E, Mainguy Y, Vitton O, Gracely RH, Gollub R, Ingvar M, Kong J. Patients with
fibromyalgia display less functional connectivity in the brain's pain inhibitory network.
Mol Pain 2012;8:32.
[20] Jensen KB, Srinivasan P, Spaeth R, Tan Y, Kosek E, Petzke F, Carville S, Fransson P,
Marcus H, Williams SC, Choy E, Vitton O, Gracely R, Ingvar M, Kong J. Overlapping
structural and functional brain changes in patients with long-term exposure to
fibromyalgia. Arthritis Rheum 2013;65:3293-303.
[21] Kamping S, Bomba IC, Kanske P, Diesch E, Flor H. Deficient modulation of pain by a
positive emotional context in fibromyalgia patients. Pain 2013;154:1846-55.
[22] Kim DJ, Lim M, Kim JS, Son KM, Kim HA, Chung CK. Altered white matter integrity in
corpus callosal area in fibromyalgia identified with tract-based spatial statistical analysis.
Arthritis Rheumatol 2014;66:3190-9.
[23] Kim JY, Kim SH, Seo J, Kim SH, Han SW, Nam EJ, Kim SK, Lee HJ, Lee SJ, Kim YT,
Chang Y. Increased power spectral density in resting-state pain-related brain networks in
fibromyalgia. Pain 2013;154:1792-7.
[24] Lefaucheur JP, Drouot X, Menard-Lefaucheur I, Keravel Y, Nguyen JP. Motor cortex rTMS
restores defective intracortical inhibition in chronic neuropathic pain. Neurology
2006;67:1568-74.
[25] Lenz M, Hoffken O, Stude P, Lissek S, Schwenkreis P, Reinersmann A, Frettloh J, Richter H,
Tegenthoff M, Maier C. Bilateral somatosensory cortex disinhibition in complex regional
pain syndrome type I. Neurology 2011;77:1096-101.
ACCEPTED
Copyright � 2015 by the International Association for the Study of Pain. Unauthorized reproduction of this article is prohibited.

Page 24 of 29
[26] Lenz M, Tegenthoff M, Kohlhaas K, Stude P, Hoffken O, Gatica Tossi MA, Kalisch T,
Kowalewski R, Dinse HR. Increased excitability of somatosensory cortex in aged
humans is associated with impaired tactile acuity. J Neurosci 2012;32:1811-6.
[27] Lim M, Kim JS, Chung CK. Oscillatory interaction between the hand area of human
primary motor cortex and finger muscles during steady-state isometric contraction. Clin
Neurophysiol 2011;122:2246-53.
[28] Lim M, Kim JS, Chung CK. Modulation of somatosensory evoked magnetic fields by
intensity of interfering stimuli in human somatosensory cortex: an MEG study.
Neuroimage 2012;61:660-9.
[29] Lim M, Kim JS, Kim M, Chung CK. Ascending beta oscillation from finger muscle to
sensorimotor cortex contributes to enhanced steady-state isometric contraction in humans.
Clin Neurophysiol 2014;125:2036-45.
[30] Loggia ML, Berna C, Kim J, Cahalan CM, Gollub RL, Wasan AD, Harris RE, Edwards RR,
Napadow V. Disrupted brain circuitry for pain-related reward/punishment in fibromyalgia.
Arthritis Rheumatol 2014;66:203-12.
[31] Lopez-Sola M, Pujol J, Wager TD, Garcia-Fontanals A, Blanco-Hinojo L, Garcia-Blanco S,
Poca-Dias V, Harrison BJ, Contreras-Rodriguez O, Monfort J, Garcia-Fructuoso F, Deus J.
Altered functional magnetic resonance imaging responses to nonpainful sensory
stimulation in fibromyalgia patients. Arthritis Rheumatol 2014;66:3200-9.
[32] Lutz J, Jager L, de Quervain D, Krauseneck T, Padberg F, Wichnalek M, Beyer A, Stahl R,
Zirngibl B, Morhard D, Reiser M, Schelling G. White and gray matter abnormalities in
the brain of patients with fibromyalgia: a diffusion-tensor and volumetric imaging study.
Arthritis Rheum 2008;58:3960-9.
ACCEPTED
Copyright � 2015 by the International Association for the Study of Pain. Unauthorized reproduction of this article is prohibited.
Page 25 of 29
[33] Maestu C, Cortes A, Vazquez JM, del Rio D, Gomez-Arguelles JM, del Pozo F, Nevado A.
Increased brain responses during subjectively-matched mechanical pain stimulation in
fibromyalgia patients as evidenced by MEG. Clin Neurophysiol 2013;124:752-60.
[34] Maihofner C, Baron R, DeCol R, Binder A, Birklein F, Deuschl G, Handwerker HO,
Schattschneider J. The motor system shows adaptive changes in complex regional pain
syndrome. Brain 2007;130:2671-87.
[35] Maihofner C, Handwerker HO, Neundorfer B, Birklein F. Cortical reorganization during
recovery from complex regional pain syndrome. Neurology 2004;63:693-701.
[36] Mauguiere F, Merlet I, Forss N, Vanni S, Jousmaki V, Adeleine P, Hari R. Activation of a
distributed somatosensory cortical network in the human brain: a dipole modelling study
of magnetic fields evoked by median nerve stimulation. Part II: Effects of stimulus rate,
attention and stimulus detection. Electroencephalogr Clin Neurophysiol 1997;104:290-5.
[37] McBeth J, Mulvey MR. Fibromyalgia: mechanisms and potential impact of the ACR 2010
classification criteria. Nat Rev Rheumatol 2012;8:108-16.
[38] McCabe CS, Cohen H, Hall J, Lewis J, Rodham K, Harris N. Somatosensory conflicts in
complex regional pain syndrome type 1 and fibromyalgia syndrome. Curr Rheumatol Rep
2009;11:461-5.
[39] Melzack R. The short-form McGill Pain Questionnaire. Pain 1987;30:191-7.
[40] Mhalla A, Baudic S, Ciampi de Andrade D, Gautron M, Perrot S, Teixeira MJ, Attal N,
Bouhassira D. Long-term maintenance of the analgesic effects of transcranial magnetic
stimulation in fibromyalgia. Pain 2011;152:1478-85.
[41] Mhalla A, de Andrade DC, Baudic S, Perrot S, Bouhassira D. Alteration of cortical
excitability in patients with fibromyalgia. Pain 2010;149:495-500.
ACCEPTED
Copyright � 2015 by the International Association for the Study of Pain. Unauthorized reproduction of this article is prohibited.
Page 26 of 29
[42] Mima T, Nagamine T, Nakamura K, Shibasaki H. Attention modulates both primary and
second somatosensory cortical activities in humans: a magnetoencephalographic study. J
Neurophysiol 1998;80:2215-21.
[43] Montoya P, Sitges C, Garcia-Herrera M, Rodriguez-Cotes A, Izquierdo R, Truyols M,
Collado D. Reduced brain habituation to somatosensory stimulation in patients with
fibromyalgia. Arthritis Rheum 2006;54:1995-2003.
[44] Moseley GL, Flor H. Targeting cortical representations in the treatment of chronic pain: a
review. Neurorehabil Neural Repair 2012;26:646-52.
[45] Oldfield RC. The assessment and analysis of handedness: the Edinburgh inventory.
Neuropsychologia 1971;9:97-113.
[46] Passard A, Attal N, Benadhira R, Brasseur L, Saba G, Sichere P, Perrot S, Januel D,
Bouhassira D. Effects of unilateral repetitive transcranial magnetic stimulation of the
motor cortex on chronic widespread pain in fibromyalgia. Brain 2007;130:2661-70.
[47] Porter JT, Nieves D. Presynaptic GABAB receptors modulate thalamic excitation of
inhibitory and excitatory neurons in the mouse barrel cortex. J Neurophysiol
2004;92:2762-70.
[48] Pujol J, Macia D, Garcia-Fontanals A, Blanco-Hinojo L, Lopez-Sola M, Garcia-Blanco S,
Poca-Dias V, Harrison BJ, Contreras-Rodriguez O, Monfort J, Garcia-Fructuoso F, Deus J.
The contribution of sensory system functional connectivity reduction to clinical pain in
fibromyalgia. Pain 2014;155:1492-503.
[49] Schmidt-Wilcke T, Clauw DJ. Fibromyalgia: From pathophysiology to therapy. Nat Rev
Rheumatol 2011;7:518-27.
[50] Seifert F, Maihofner C. Functional and structural imaging of pain-induced neuroplasticity.
ACCEPTED
Copyright � 2015 by the International Association for the Study of Pain. Unauthorized reproduction of this article is prohibited.
Page 27 of 29
Curr Opin Anaesthesiol 2011;24:515-23.
[51] Staud R, Rodriguez ME. Mechanisms of disease: pain in fibromyalgia syndrome. Nat Clin
Pract Rheumatol 2006;2:90-8.
[52] Stevenson CM, Wang F, Brookes MJ, Zumer JM, Francis ST, Morris PG. Paired pulse
depression in the somatosensory cortex: associations between MEG and BOLD fMRI.
Neuroimage 2012;59:2722-32.
[53] Taulu S, Simola J. Spatiotemporal signal space separation method for rejecting nearby
interference in MEG measurements. Phys Med Biol 2006;51:1759-68.
[54] Wehr M, Zador AM. Synaptic mechanisms of forward suppression in rat auditory cortex.
Neuron 2005;47:437-45.
[55] Wikstrom H, Huttunen J, Korvenoja A, Virtanen J, Salonen O, Aronen H, Ilmoniemi RJ.
Effects of interstimulus interval on somatosensory evoked magnetic fields (SEFs): a
hypothesis concerning SEF generation at the primary sensorimotor cortex.
Electroencephalogr Clin Neurophysiol 1996;100:479-87.
[56] Wolfe F, Smythe HA, Yunus MB, Bennett RM, Bombardier C, Goldenberg DL, Tugwell P,
Campbell SM, Abeles M, Clark P, et al. The American College of Rheumatology 1990
criteria for the classification of fibromyalgia. Report of the multicenter criteria committee.
Arthritis Rheum 1990;33:160-72.
[57] Woolf CJ. Central sensitization: implications for the diagnosis and treatment of pain. Pain
2011;152:S2-15.
ACCEPTED
Copyright � 2015 by the International Association for the Study of Pain. Unauthorized reproduction of this article is prohibited.
Page 28 of 29
Figure legends
Fig. 1. Somatosensory evoked field from one gradiometer channel over the contralateral
parietal area of the stimulated side (left) in a representative healthy subject.
The clear response deflections were found after single-pulse median nerve stimulation (A). The
earliest downward deflection peaking at 20 ms (N20m) and the following deflections of opposite
polarity peaking at 27 ms (P35m) were identified after the stimulus onset. After strong N20m and
P35m responses to the first pulse of the paired-pulse stimulation, clear but weaker N20m and
P35m responses to the second pulse of the paired-pulse stimulation was observed (B). The N20m
and P35m responses to the second pulse of the paired-pulse stimulation were shown, after
subtracting the response to a single-pulse from the paired-pulse stimulation (C). The black
triangle indicates stimulus onset.
Fig. 2. Cortical responses to single-pulse and paired-pulse median nerve stimuli applied to
left and right hands.
The location of the S1 source was superimposed on the brain MRI of a representative healthy
control (A) and fibromyalgia subjects (B). White and black circles indicate location of the
contralateral S1 response after right and left median nerve stimulation, respectively. Each left
and right source waveform was generated in the contralateral S1 after the right and left median
nerve stimulation, respectively. The vertical dotted lines indicate the stimulus onset. Open
triangles = N20m; Filled triangles = P35m; S1 = primary somatosensory cortex.
Fig. 3. The mean locations of the primary somatosensory cortex responses superimposed on
ACCEPTED
Copyright � 2015 by the International Association for the Study of Pain. Unauthorized reproduction of this article is prohibited.
Page 29 of 29
a standard brain (A) and paired-pulse suppression ratio for N20m–P35m (B), N20m (C)
and P35m (D) in fibromyalgia patients and healthy controls.
Red (fibromyalgia) and blue (healthy control) circles indicate location of the contralateral
primary somatosensory response to left and right median nerve stimulation. Error bars indicate
standard deviation. A1 = amplitude of the first response after paired-pulse stimulation; A2s =
amplitude of the second response after paired-pulse stimulation, after subtracting the response to
a single-pulse; PPS = paired-pulse suppression.
Fig. 4. Relationship between paired-pulse suppression ratio and clinical pain in patients
with fibromyalgia.
The sensory dimension of clinical pain was measured by the short-form McGill Pain
Questionnaire (SF-MPQ) (A and B). The average pain intensity over the last week was rated on a
visual analog scale (VAS) (C). PPS = paired-pulse suppression.
ACCEPTED
Copyright � 2015 by the International Association for the Study of Pain. Unauthorized reproduction of this article is prohibited.
Page 1 of 1
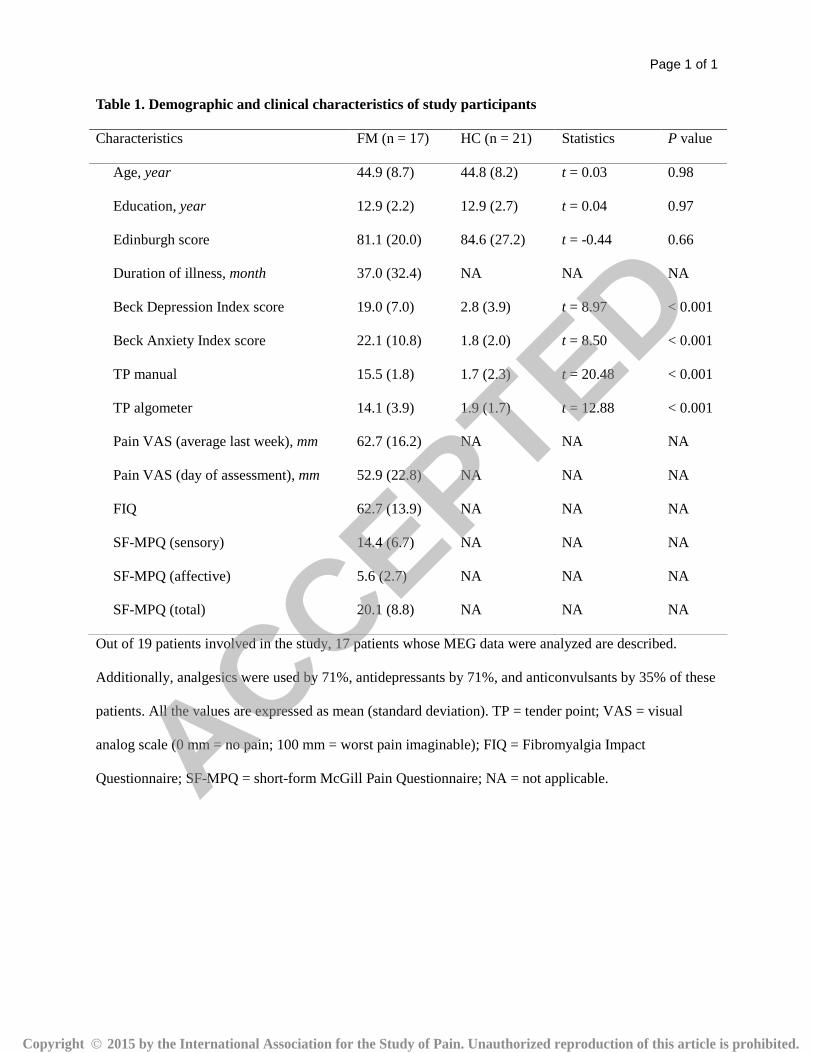
Table 1. Demographic and clinical characteristics of study participants
Characteristics FM (n = 17) HC (n = 21) Statistics P value
Age, year 44.9 (8.7) 44.8 (8.2) t = 0.03 0.98
Education, year 12.9 (2.2) 12.9 (2.7) t = 0.04 0.97
Edinburgh score 81.1 (20.0) 84.6 (27.2) t = -0.44 0.66
Duration of illness, month 37.0 (32.4) NA NA NA
Beck Depression Index score 19.0 (7.0) 2.8 (3.9) t = 8.97 < 0.001
Beck Anxiety Index score 22.1 (10.8) 1.8 (2.0) t = 8.50 < 0.001
TP manual 15.5 (1.8) 1.7 (2.3) t = 20.48 < 0.001
TP algometer 14.1 (3.9) 1.9 (1.7) t = 12.88 < 0.001
Pain VAS (average last week), mm 62.7 (16.2) NA NA NA
Pain VAS (day of assessment), mm 52.9 (22.8) NA NA NA
FIQ 62.7 (13.9) NA NA NA
SF-MPQ (sensory) 14.4 (6.7) NA NA NA
SF-MPQ (affective) 5.6 (2.7) NA NA NA
SF-MPQ (total) 20.1 (8.8) NA NA NA
Out of 19 patients involved in the study, 17 patients whose MEG data were analyzed are described.
Additionally, analgesics were used by 71%, antidepressants by 71%, and anticonvulsants by 35% of these
patients. All the values are expressed as mean (standard deviation). TP = tender point; VAS = visual
analog scale (0 mm = no pain; 100 mm = worst pain imaginable); FIQ = Fibromyalgia Impact
Questionnaire; SF-MPQ = short-form McGill Pain Questionnaire; NA = not applicable.
ACCEPTED
Copyright � 2015 by the International Association for the Study of Pain. Unauthorized reproduction of this article is prohibited.
Page 1 of 1
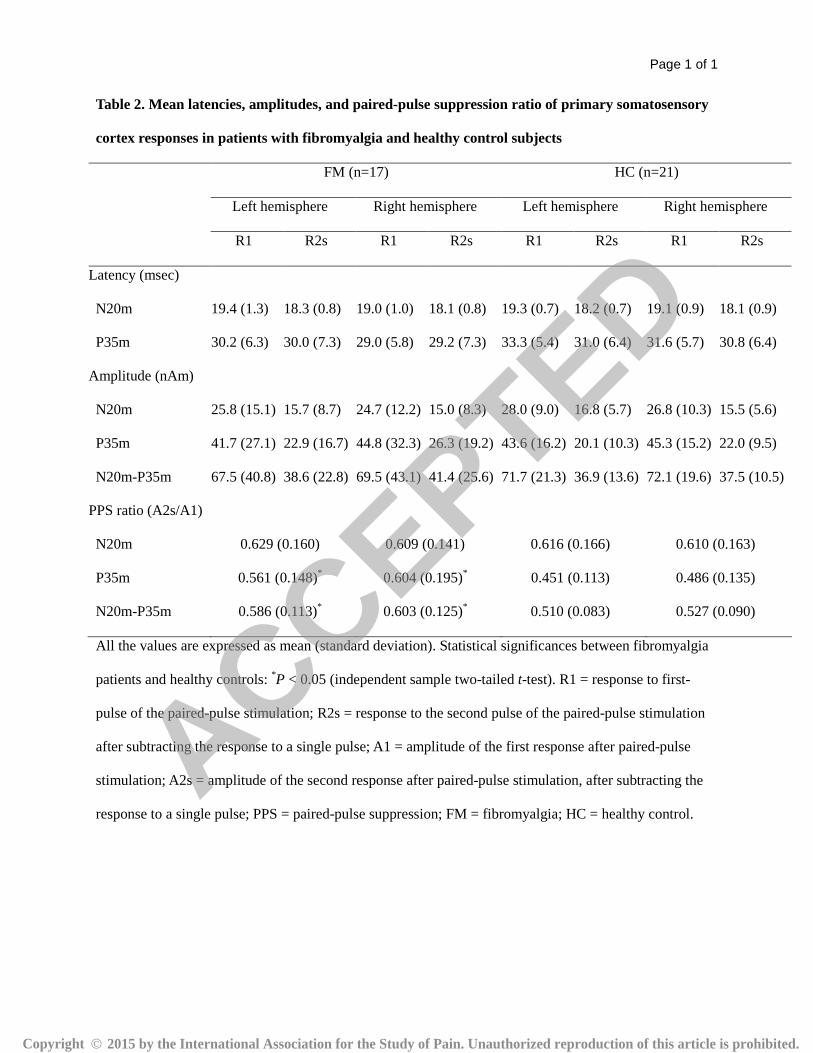
Table 2. Mean latencies, amplitudes, and paired-pulse suppression ratio of primary somatosensory
cortex responses in patients with fibromyalgia and healthy control subjects
FM (n=17) HC (n=21)
Left hemisphere Right hemisphere Left hemisphere Right hemisphere
R1 R2s R1 R2s R1 R2s R1 R2s
Latency (msec)
N20m 19.4 (1.3) 18.3 (0.8) 19.0 (1.0) 18.1 (0.8) 19.3 (0.7) 18.2 (0.7) 19.1 (0.9) 18.1 (0.9)
P35m 30.2 (6.3) 30.0 (7.3) 29.0 (5.8) 29.2 (7.3) 33.3 (5.4) 31.0 (6.4) 31.6 (5.7) 30.8 (6.4)
Amplitude (nAm)
N20m 25.8 (15.1) 15.7 (8.7) 24.7 (12.2) 15.0 (8.3) 28.0 (9.0) 16.8 (5.7) 26.8 (10.3) 15.5 (5.6)
P35m 41.7 (27.1) 22.9 (16.7) 44.8 (32.3) 26.3 (19.2) 43.6 (16.2) 20.1 (10.3) 45.3 (15.2) 22.0 (9.5)
N20m-P35m 67.5 (40.8) 38.6 (22.8) 69.5 (43.1) 41.4 (25.6) 71.7 (21.3) 36.9 (13.6) 72.1 (19.6) 37.5 (10.5)
PPS ratio (A2s/A1)
N20m 0.629 (0.160) 0.609 (0.141) 0.616 (0.166) 0.610 (0.163)
P35m 0.561 (0.148)* 0.604 (0.195)* 0.451 (0.113) 0.486 (0.135)
N20m-P35m 0.586 (0.113)* 0.603 (0.125)* 0.510 (0.083) 0.527 (0.090)
All the values are expressed as mean (standard deviation). Statistical significances between fibromyalgia
patients and healthy controls: *P < 0.05 (independent sample two-tailed t-test). R1 = response to first-
pulse of the paired-pulse stimulation; R2s = response to the second pulse of the paired-pulse stimulation
after subtracting the response to a single pulse; A1 = amplitude of the first response after paired-pulse
stimulation; A2s = amplitude of the second response after paired-pulse stimulation, after subtracting the
response to a single pulse; PPS = paired-pulse suppression; FM = fibromyalgia; HC = healthy control.
ACCEPTED
Copyright � 2015 by the International Association for the Study of Pain. Unauthorized reproduction of this article is prohibited.
Page 1 of 1
Table e-1. Mean amplitudes of the N20m−P35m.
Fibromyalgia (n=17) Healthy controls (n=21) P value
LH RH LH RH LH RH
sp A1 69.7 (43.5) 69.9 (42.0) 73.8 (23.0) 73.4 (17.9) 0.710 0.736
A1 67.5 (40.8) 69.5 (43.1) 71.7 (21.3) 72.1 (19.6) 0.687 0.808
A2 35.3 (22.6) 36.6 (23.6) 35.8 (15.6) 35.5 (9.5) 0.930 0.854
A2s 38.6 (22.8) 41.4 (25.6) 36.9 (13.6) 37.5 (10.5) 0.780 0.536
Mean values are expressed as mean (standard deviation). Independent sample two-tailed t-tests were used
to compare the mean amplitudes of the N20m−P35 in each hemisphere. LH = left hemisphere; RH = right
hemisphere; sp A1 = amplitude of the N20m−P35m response after single-pulse stimulation; A1 =
amplitude of the first N20m−P35m response after paired-pulse stimulation; A2 = amplitude of the second
N20m−P35m response after paired-pulse stimulation; A2s = amplitude of the second N20m−P35m
response after paired-pulse stimulation, after subtracting the response to a single-pulse.
ACCEPTED
Copyright � 2015 by the International Association for the Study of Pain. Unauthorized reproduction of this article is prohibited.
Page 1 of 1
Table e-2. Regression results of relationship between paired-pulse suppression ratio and score of
SF-MPQ and pain VAS in patients with fibromyalgia
PPS ratio for the N20m–P35m PPS ratio for the P35m
LH RH LH RH
r2 P r2 P
r2 P r2 P
SF-MPQ
Sensory 0.340 0.014 0.010 0.708 0.410 0.006 0.049 0.394
Affective 0.245 0.043 0.004 0.800 0.262 0.036 0.034 0.481
Total 0.354 0.012 0.009 0.717 0.414 0.005 0.050 0.387
Pain VAS last week 0.145 0.132 < 0.001 0.941 0.342 0.014 0.003 0.839
LH = left hemisphere; RH = right hemisphere; PPS = paired-pulse suppression; SF-MPQ = short-form
McGill Pain Questionnaire; VAS = visual analog scale.
ACCEPTED
Copyright � 2015 by the International Association for the Study of Pain. Unauthorized reproduction of this article is prohibited.
ACCEPTED
Copyright � 2015 by the International Association for the Study of Pain. Unauthorized reproduction of this article is prohibited.
ACCEPTED
Copyright � 2015 by the International Association for the Study of Pain. Unauthorized reproduction of this article is prohibited.
ACCEPTED
Copyright � 2015 by the International Association for the Study of Pain. Unauthorized reproduction of this article is prohibited.
ACCEPTED
Copyright � 2015 by the International Association for the Study of Pain. Unauthorized reproduction of this article is prohibited.