5-3 graphing proportional relationships warm up warm up lesson presentation lesson presentation...
TRANSCRIPT

5-3 Graphing Proportional Relationships
Warm UpWarm Up
Lesson PresentationLesson Presentation
Problem of the DayProblem of the Day
Lesson QuizzesLesson Quizzes
5-3 Graphing Proportional Relationships
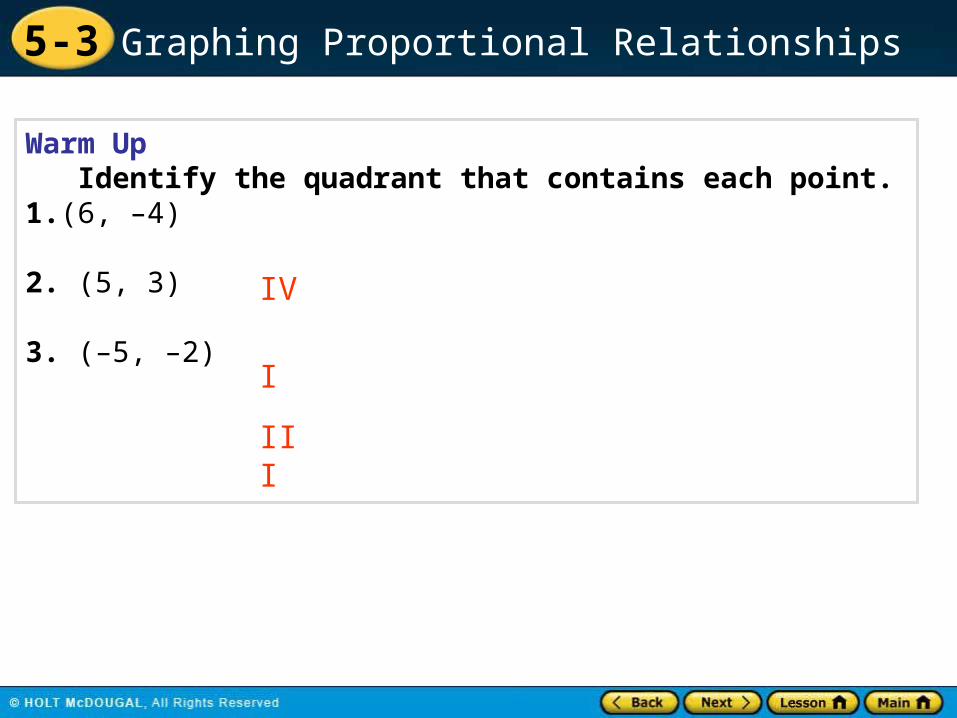
Warm Up Identify the quadrant that contains each point.1.(6, –4)
2. (5, 3)
3. (–5, –2)
IV
I
III
5-3 Graphing Proportional Relationships
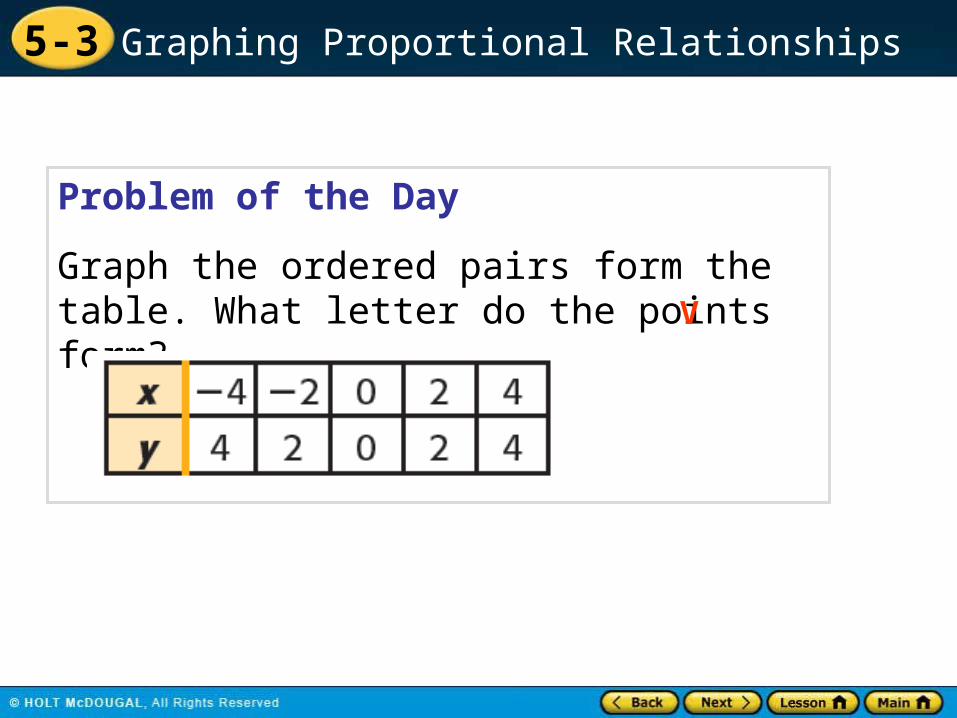
Problem of the Day
Graph the ordered pairs form the table. What letter do the points form? V
5-3 Graphing Proportional Relationships
MA.7.A.1.4 Graph proportional relationships…
Sunshine State Standards

5-3 Graphing Proportional Relationships
Vocabulary
linear equation
linear function

5-3 Graphing Proportional Relationships
The table shows how far a kayak travels down a river if the kayak is moving at a rate of 2 miles per hour.
y
02 4
2
4
6
x
Miles
Hours0
Notice for all ordered pairs in the table for every 1 hour increase in time, the miles traveled increases by 2. These ordered pairs are in proportion.
1 2
= = =2 4
3 6
3 8
If the ordered pairs are in proportion, then the data represents a proportional relationship. When you graph a proportional relationship, the result is a line that passes through the origin.
5-3 Graphing Proportional Relationships
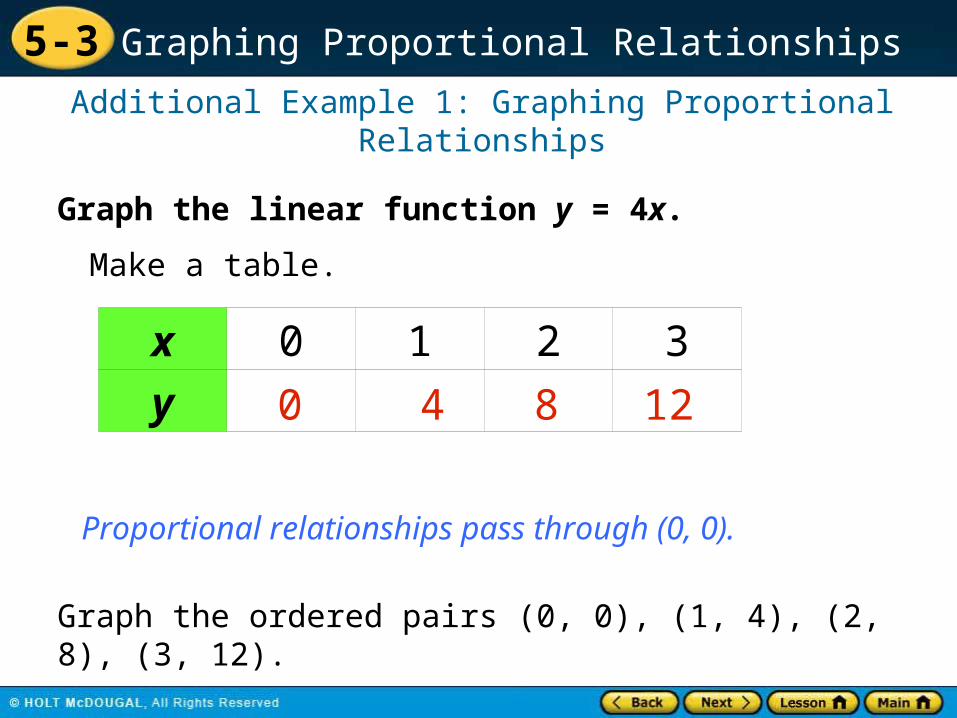
Graph the linear function y = 4x.
Additional Example 1: Graphing Proportional Relationships
x 0 1 2 3
y 0 4 8 12
Proportional relationships pass through (0, 0).
Graph the ordered pairs (0, 0), (1, 4), (2, 8), (3, 12).
Make a table.
5-3 Graphing Proportional Relationships
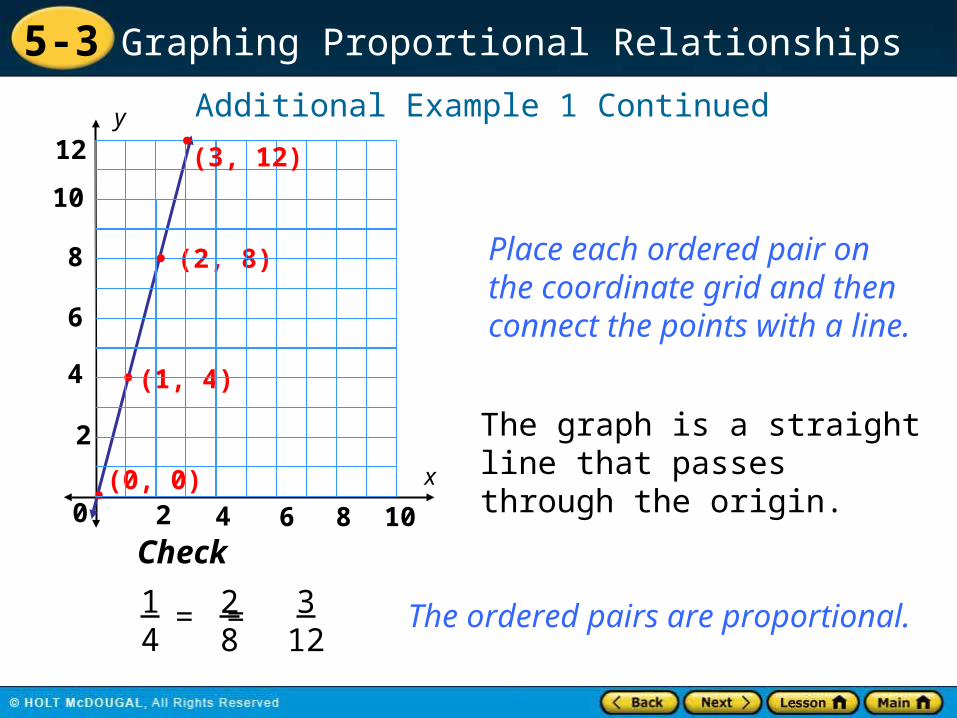
Additional Example 1 Continued
Place each ordered pair on the coordinate grid and then connect the points with a line.
y
4
8
6
2
(1, 4)
(2, 8)
(0, 0) x
The graph is a straight line that passes through the origin.
Check
1 4
= =2 8
3 12
The ordered pairs are proportional.
10
(3, 12)
2 4 6 8 10
12
0
5-3 Graphing Proportional Relationships
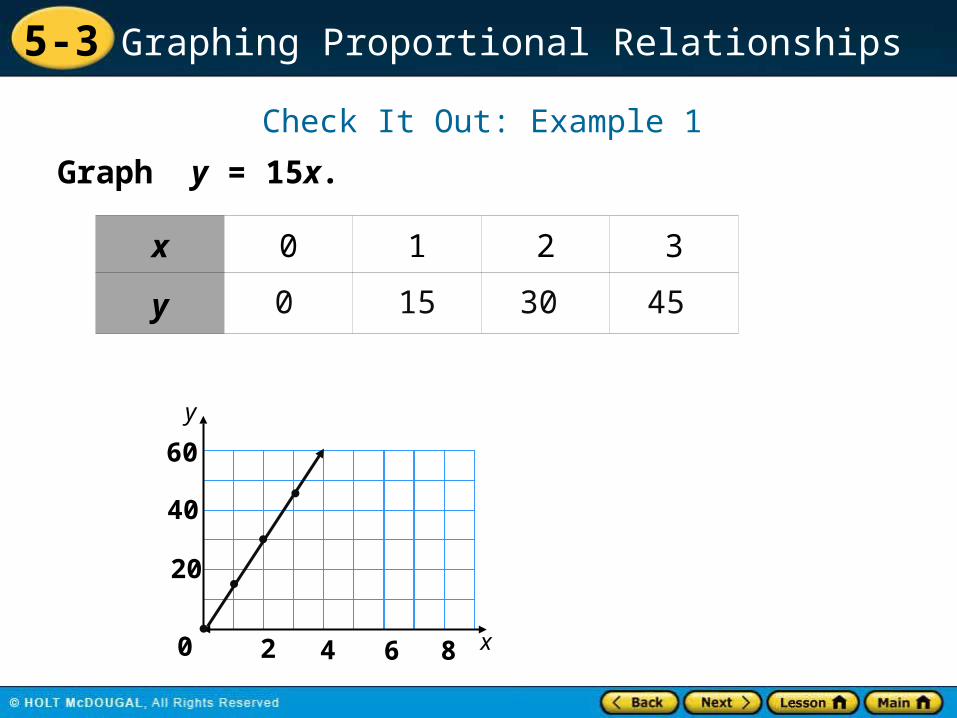
Graph y = 15x.
Check It Out: Example 1
x 0 1 2 3
y 0 15 30 45
y
40
20
x
60
2 4 6 8 0

5-3 Graphing Proportional Relationships
A linear equation is an equation whose graph is a line. The solutions of a linear equation are the points that make up its graph. Linear equations and linear graphs can be different representations of linear functions. A linear function is a function whose graph is a nonvertical line.

5-3 Graphing Proportional Relationships
Some relationships are linear but not proportional. If the ordered pairs in a linear function are not all proportional then it is not a proportional relationship. These non-proportional relationships do not pass through the origin on a graph.

5-3 Graphing Proportional Relationships
Tell whether the function is a proportional relationship. Then graph the function.
Additional Example 2: Identify Proportional Relationships
The ordered pairs are proportional and the graph passes through (0, 0). y = –2x is a proportional relationship.
x –1 0 1 2 3y 2 0 –2 –4 –6
–1 2
1 –2
= = = 2 –4
3 –6
Make a table.A. y = –2x

5-3 Graphing Proportional Relationships
Tell whether y = 10x – 1 is a proportional relationship. Then graph the function.
Check It Out: Example 2
x 0 1 2 3 4y
The ordered pairs are not proportional, and the graph does not pass through (0, 0). y = 10x –1 is not a proportional relationship.
–1 9 19 29 39

5-3 Graphing Proportional Relationships
The fastest-moving tectonic plates on Earth move apart at a rate of 15 centimeters per year. Write a linear function that describes the movement of the plates over time. Graph the relationship. Is this a proportional relationship? Justify your answer.
Additional Example 3: Earth Science Application
Let x represent the input, which is the time in years. Let y represent the output, which is the distance in centimeters the plates move apart.
distance in cm 15 cm/yr time in years=
y 15 x=
The function is y = 15x. Yes, the graph goes through the origin
5-3 Graphing Proportional Relationships
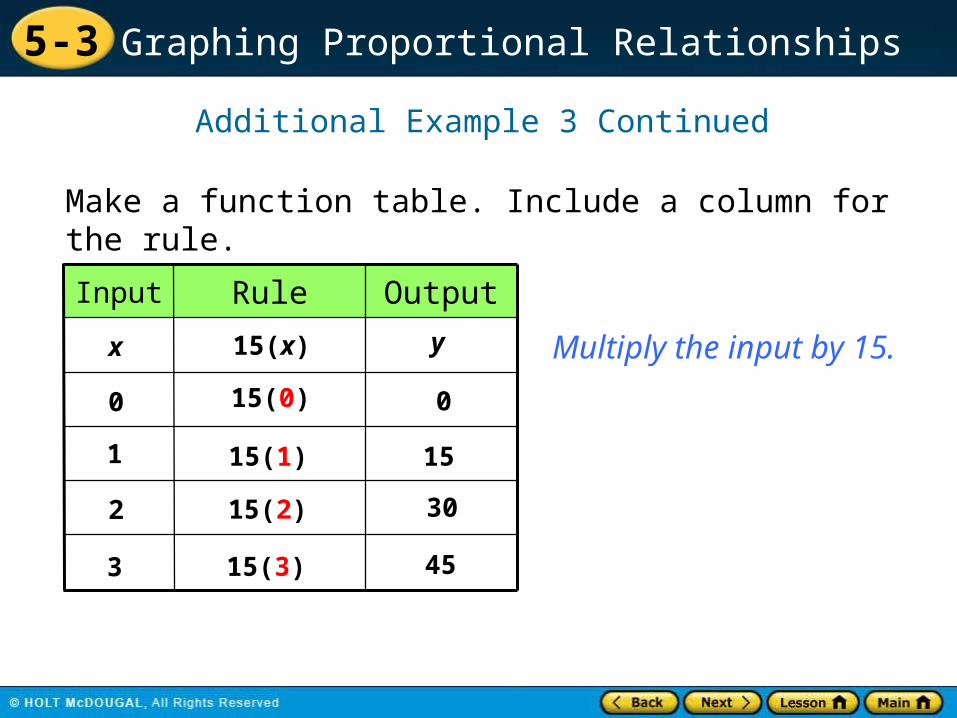
Additional Example 3 Continued
OutputRuleInput
15(x)x
0
1
2
15(0)
15(1)
15(2)
y
0
15
30
Multiply the input by 15.
Make a function table. Include a column for the rule.
3 15(3) 45

5-3 Graphing Proportional Relationships
Additional Example 3 ContinuedGraph the ordered pairs (0, 0), (1, 15), (2, 30), and (3, 45) from your table. Connect the points with a line.
x
y100
80
60
40
20
0 2 4 8 10 12
Cen
tim
ete
rs
Years
CheckUse the ordered pairs (1, 15), (2, 30), and (3, 45) to see if the relationship is proportional.
1 15
2 30
= = 3 45
The ordered pairs are proportional and the graph passes through (0, 0). y = 15x is a proportional relationship.

5-3 Graphing Proportional Relationships
Check It Out: Example 3
The outside temperature is increasing at the rate of 6 °F per hour. When Reid begins measuring the temperature, it is 52 °F. Write a linear function that describes the outside temperature over time. Graph the relationship. Is this a proportional relationship? Justify your answer.
y = 6x + 52, where x is thenumber of hours and y is the temperature.The ordered pairs are not proportional andthe graph does not pass through (0, 0).y = 6x + 52 is not a proportional relationship.

5-3 Graphing Proportional Relationships
Check it Out: Example 3 Continued
100
80
60
40
0 2 4 6 8
Tem
pera
ture
Hours

5-3 Graphing Proportional Relationships
Standard Lesson Quiz
Lesson Quizzes
Lesson Quiz for Student Response Systems

5-3 Graphing Proportional Relationships
Lesson Quiz: Part I
Tell whether each function is a proportional relationship. Then graph the function.
1. y = 3x – 4
2. y = –x
3. y = 2x
y = 3x – 4
y = –x
y = 2x
no
yes
yes

5-3 Graphing Proportional Relationships
Lesson Quiz: Part II
4. The temperature of a liquid is decreasing at a rate of 12 °F per hour. Susan begins measuring the liquid at 200 °F. Write a linear function that describes the change in temperature over time. Then make a graph to show the temperature over 5 hours.
y = 200 – 12x; no, the graph does not go through the origin.

5-3 Graphing Proportional Relationships
1. Tell whether the linear function y = 2x is a proportional relationship.
A. yes
B. no
Lesson Quiz for Student Response Systems

5-3 Graphing Proportional Relationships
2. Tell whether the graph of the given linear function is a proportional relationship.
A. yes
B. no
Lesson Quiz for Student Response Systems
5-3 Graphing Proportional Relationships
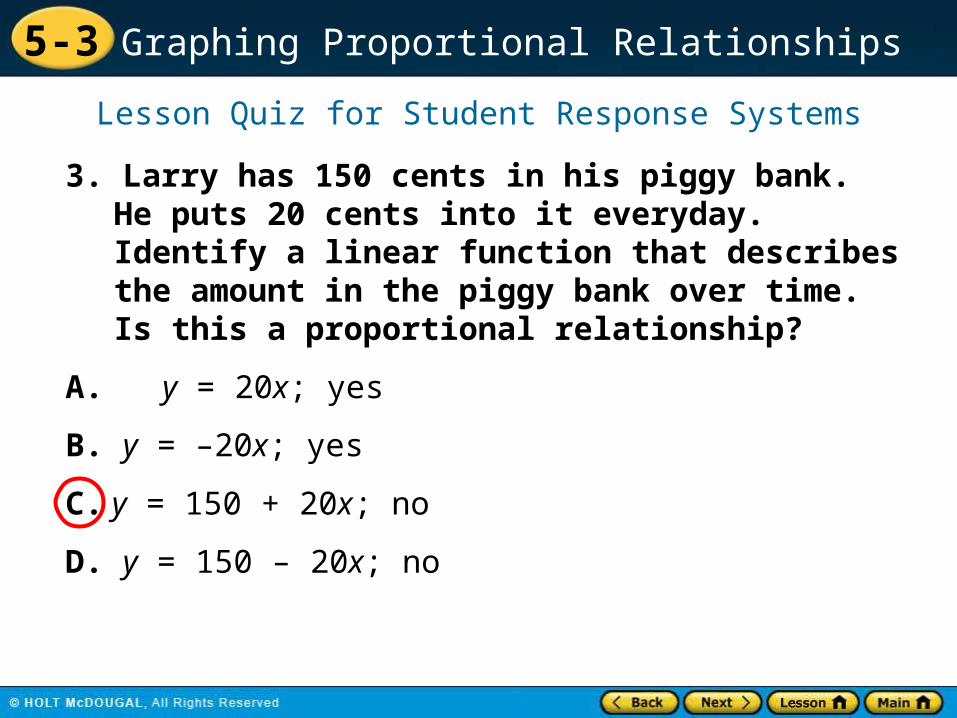
3. Larry has 150 cents in his piggy bank. He puts 20 cents into it everyday. Identify a linear function that describes the amount in the piggy bank over time. Is this a proportional relationship?
A. y = 20x; yes
B. y = –20x; yes
C. y = 150 + 20x; no
D. y = 150 – 20x; no
Lesson Quiz for Student Response Systems