5-2 interpreting graphs warm up warm up lesson presentation lesson presentation problem of the day...
TRANSCRIPT

5-2 Interpreting Graphs
Warm UpWarm Up
Lesson PresentationLesson Presentation
Problem of the DayProblem of the Day
Lesson QuizzesLesson Quizzes
5-2 Interpreting Graphs
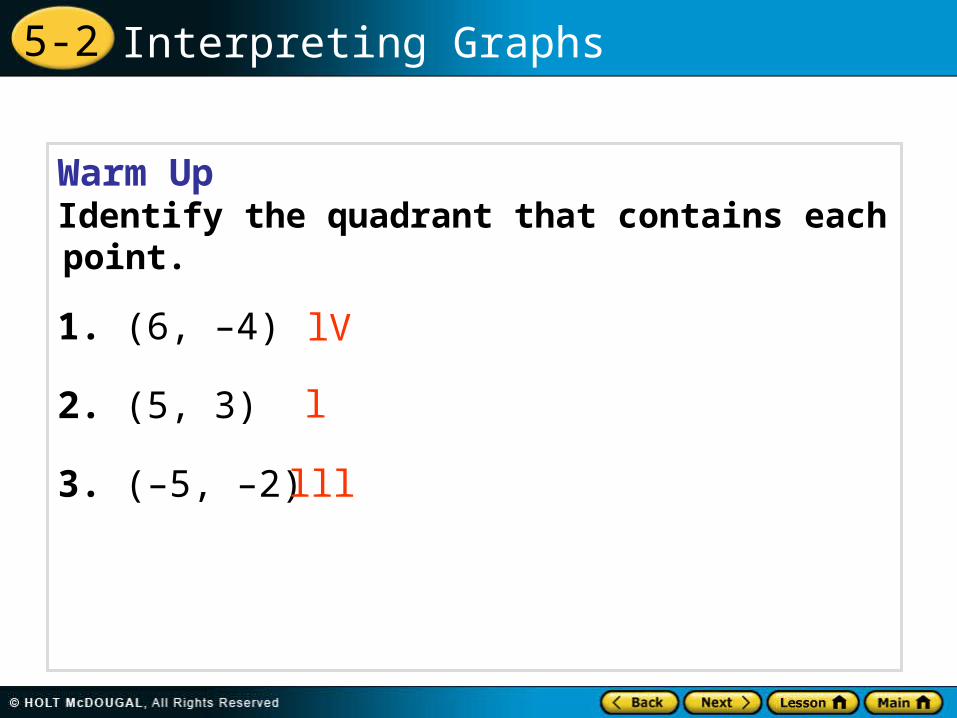
Warm UpIdentify the quadrant that contains each point.
1. (6, –4)
2. (5, 3)
3. (–5, –2)
lV
l
lll

5-2 Interpreting Graphs
Problem of the Day
Graph the ordered pairs from the table. What letter do the points form?
V
0
0
2
2
424y
424x
5-2 Interpreting Graphs
Learn to relate graphs to situations.
5-2 Interpreting Graphs
You can use a graph to show the relationship between speed and time, time and distance, or speed and distance.
5-2 Interpreting Graphs
Sp
eed
(m
i/h
r)
10
20
10 20 30 40 50
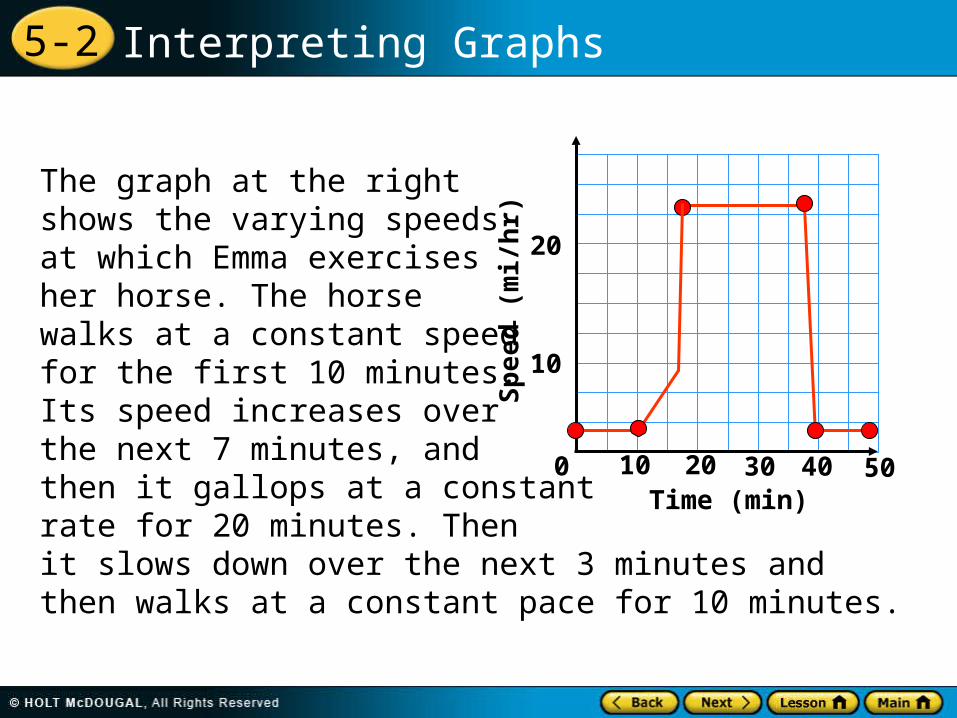
The graph at the right shows the varying speeds at which Emma exercises her horse. The horse walks at a constant speed for the first 10 minutes. Its speed increases over the next 7 minutes, and then it gallops at a constantrate for 20 minutes. Then it slows down over the next 3 minutes and then walks at a constant pace for 10 minutes.
Time (min)0
5-2 Interpreting Graphs
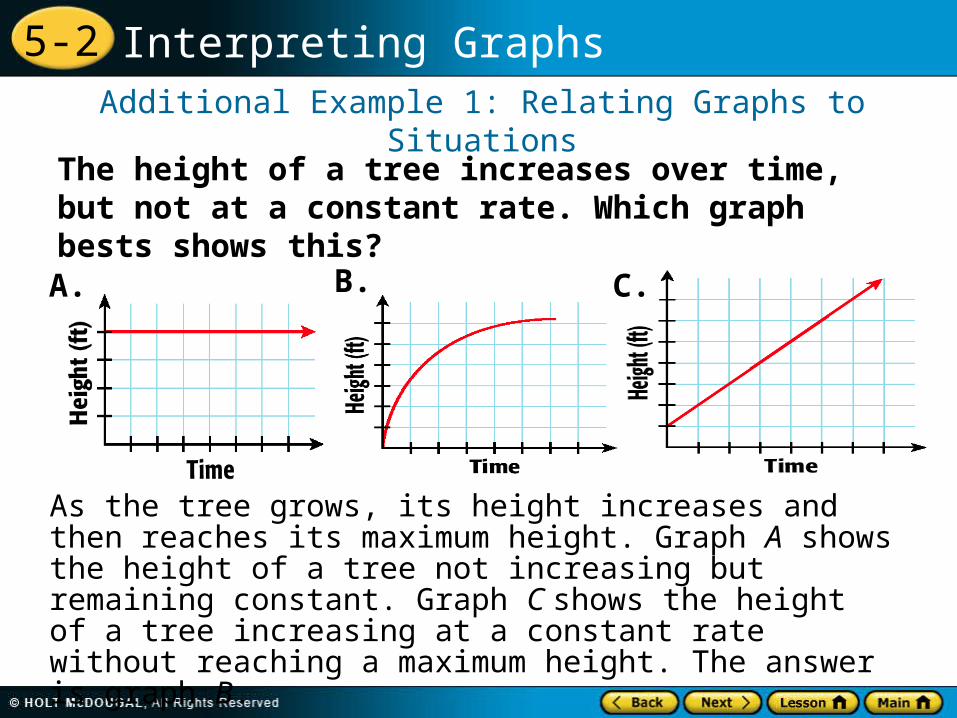
The height of a tree increases over time, but not at a constant rate. Which graph bests shows this?
Additional Example 1: Relating Graphs to Situations
As the tree grows, its height increases and then reaches its maximum height. Graph A shows the height of a tree not increasing but remaining constant. Graph C shows the height of a tree increasing at a constant rate without reaching a maximum height. The answer is graph B.
A. B. C.
5-2 Interpreting GraphsCheck It Out: Example 1
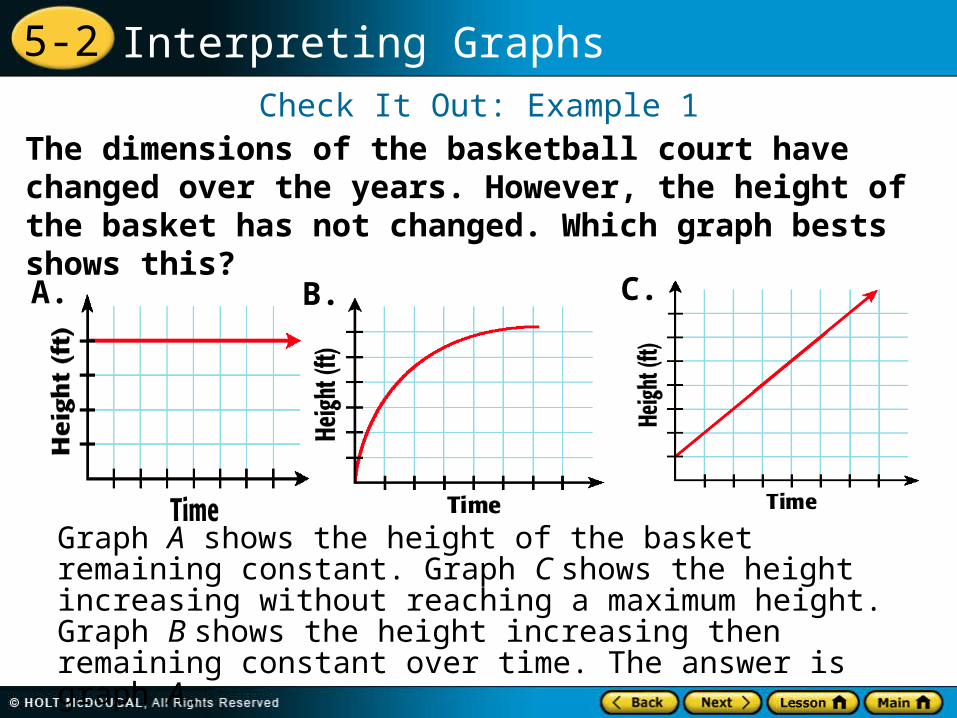
The dimensions of the basketball court have changed over the years. However, the height of the basket has not changed. Which graph bests shows this?
Graph A shows the height of the basket remaining constant. Graph C shows the height increasing without reaching a maximum height. Graph B shows the height increasing then remaining constant over time. The answer is graph A.
A. B. C.
5-2 Interpreting Graphs
Additional Example 2: Problem Solving Application
Jarod parked his car in the supermarket parking lot and walked 40 ft into the store and to the customer service counter, where he waited in line to pay his electric bill. Jarod then walked 60 ft to the back of the store to get 2 gallons of milk and walked 50 ft to the checkout near the front of the store to pay for them. After waiting his turn and paying for the milk, he walked back 50 ft to his car. Sketch a graph to show Jarod’s distance from his car over time. Use your graph to find the total distance traveled.
5-2 Interpreting Graphs
Additional Example 2 Continued
11 Understand the Problem
The answer will be the total distance that Jarod traveled.
List the important information:● Jarod walked from the parking lot directly to t the customer service counter and waited in t line.● Jarod then walked to the back of the store for t milk and then to the checkout at the front t and waited in line. ● Then Jarod returns to his car.
5-2 Interpreting Graphs
Additional Example 2 Continued
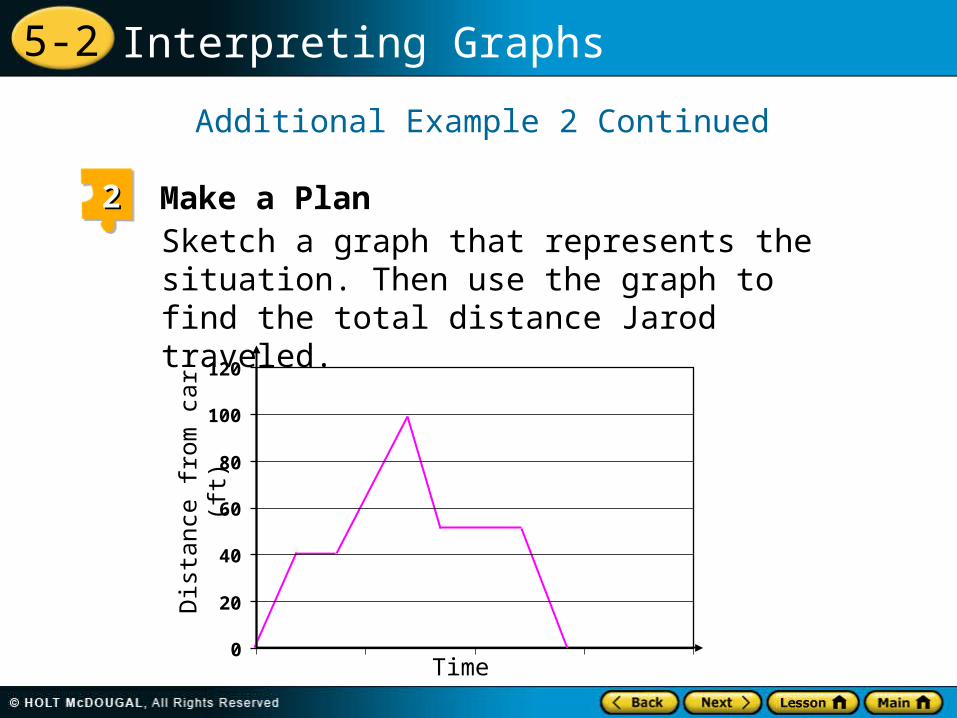
Sketch a graph that represents the situation. Then use the graph to find the total distance Jarod traveled.
22 Make a Plan
Time
Dis
tance
fro
m c
ar
(ft)
0
20
40
60
80
100
120
5-2 Interpreting Graphs
Additional Example 2 Continued
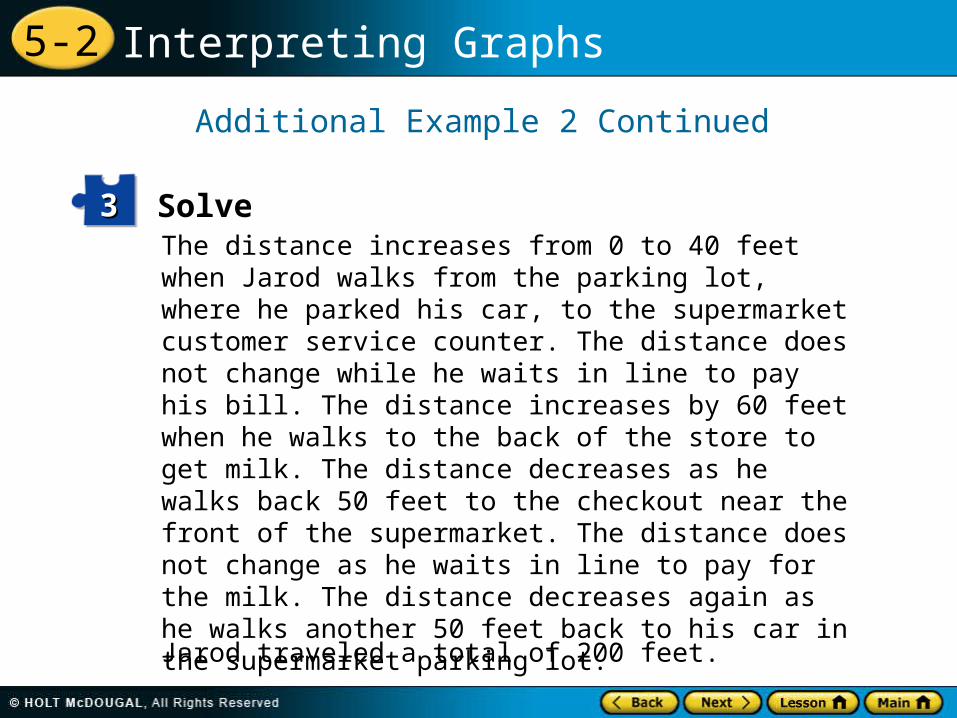
The distance increases from 0 to 40 feet when Jarod walks from the parking lot, where he parked his car, to the supermarket customer service counter. The distance does not change while he waits in line to pay his bill. The distance increases by 60 feet when he walks to the back of the store to get milk. The distance decreases as he walks back 50 feet to the checkout near the front of the supermarket. The distance does not change as he waits in line to pay for the milk. The distance decreases again as he walks another 50 feet back to his car in the supermarket parking lot.
Solve33
Jarod traveled a total of 200 feet.
5-2 Interpreting Graphs
Additional Example 2 Continued
Look Back44
Jarod walked from the supermarket parking lot to the back of the supermarket, approximately 100 feet. From the back of the supermarket he then returned to the parking lot, an additional 100 feet. The answer, 200 feet is reasonable since 100 plus 100 equals 200.
5-2 Interpreting Graphs
Check It Out: Example 2
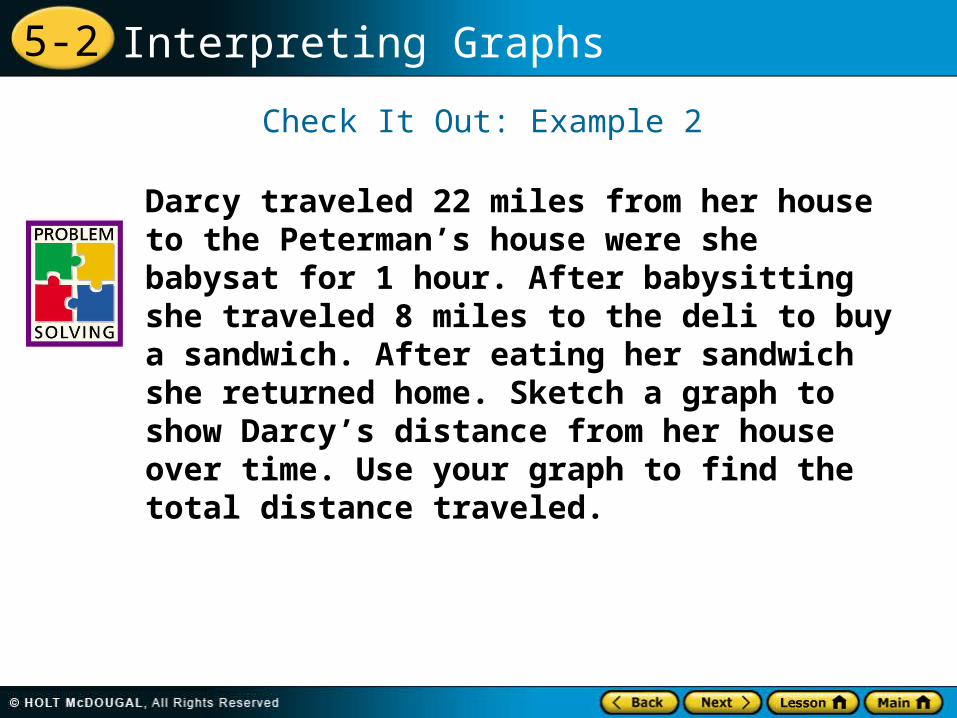
Darcy traveled 22 miles from her house to the Peterman’s house were she babysat for 1 hour. After babysitting she traveled 8 miles to the deli to buy a sandwich. After eating her sandwich she returned home. Sketch a graph to show Darcy’s distance from her house over time. Use your graph to find the total distance traveled.
5-2 Interpreting Graphs
Check It Out: Example 2 Continued
11 Understand the Problem
The answer will be the total distance that Darcy traveled.
List the important information:
• Darcy traveled from her house 22 miles directly to the Peterman’s house and babysat for 1 hour.
• Darcy then traveled 8 miles to the deli where she ate a sandwich.
• Darcy then traveled home.
5-2 Interpreting Graphs
Check It Out: Example 2 Continued
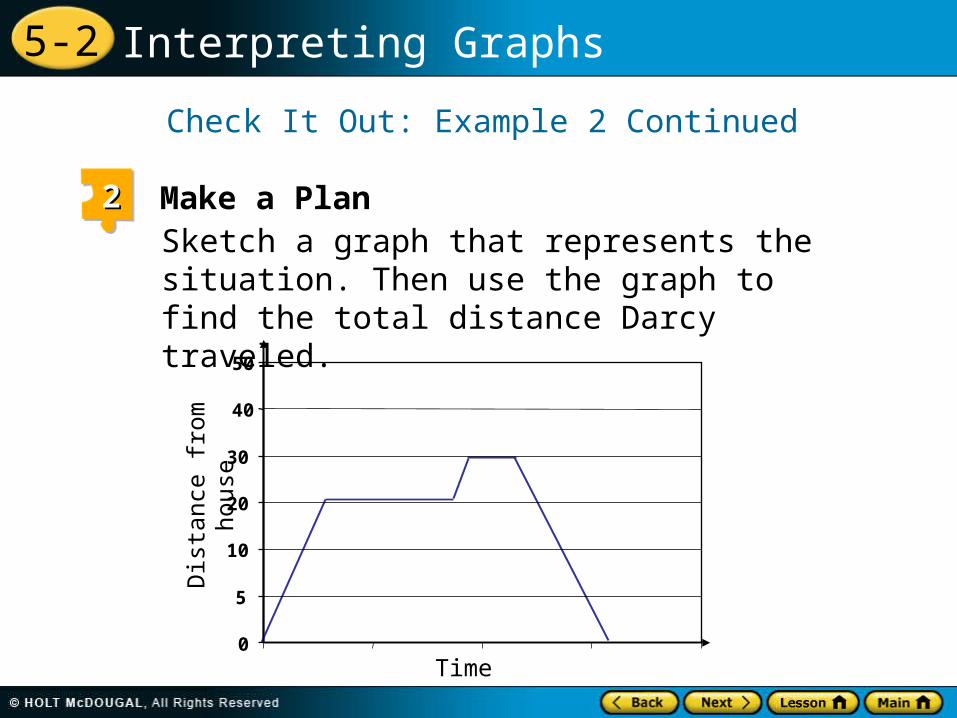
Sketch a graph that represents the situation. Then use the graph to find the total distance Darcy traveled.
22 Make a Plan
Time
Dis
tance
fro
m h
ou
se
0
5
10
20
30
40
50
5-2 Interpreting Graphs
Check It Out: Example 2 Continued
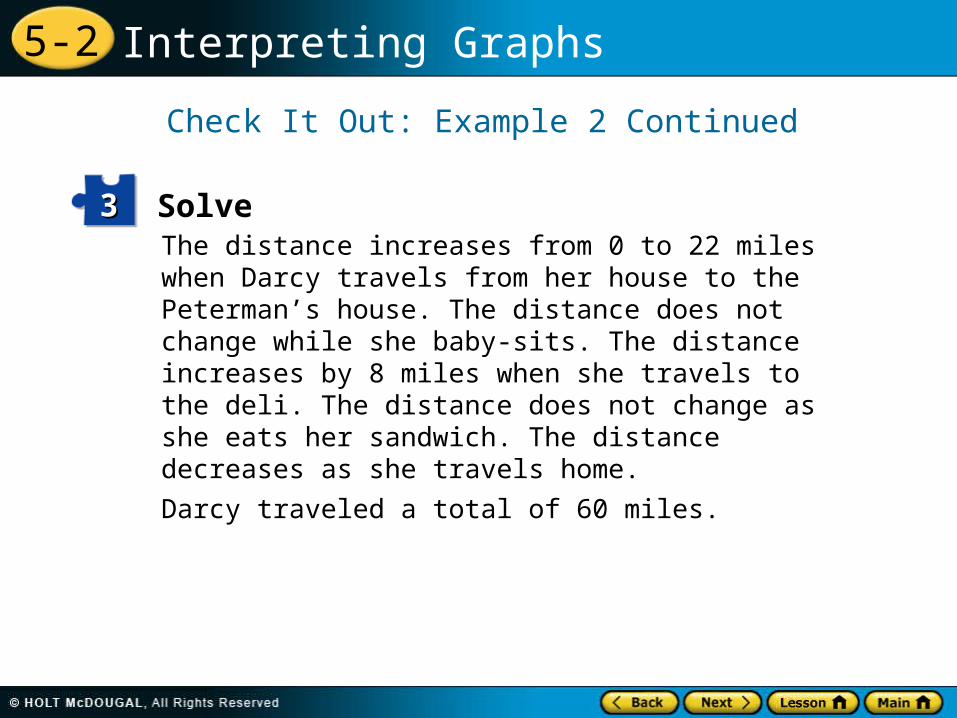
The distance increases from 0 to 22 miles when Darcy travels from her house to the Peterman’s house. The distance does not change while she baby-sits. The distance increases by 8 miles when she travels to the deli. The distance does not change as she eats her sandwich. The distance decreases as she travels home.
Solve33
Darcy traveled a total of 60 miles.
5-2 Interpreting Graphs
Check It Out: Example 2 Continued
Look Back44
The Peterman’s house is 22 miles from her house, so Darcy had to travel that distance twice just to go to their house and return. The answer, 60 miles, is reasonable since it is greater than 44 miles.
5-2 Interpreting Graphs
Standard Lesson Quiz
Lesson Quizzes
Lesson Quiz for Student Response Systems
5-2 Interpreting Graphs
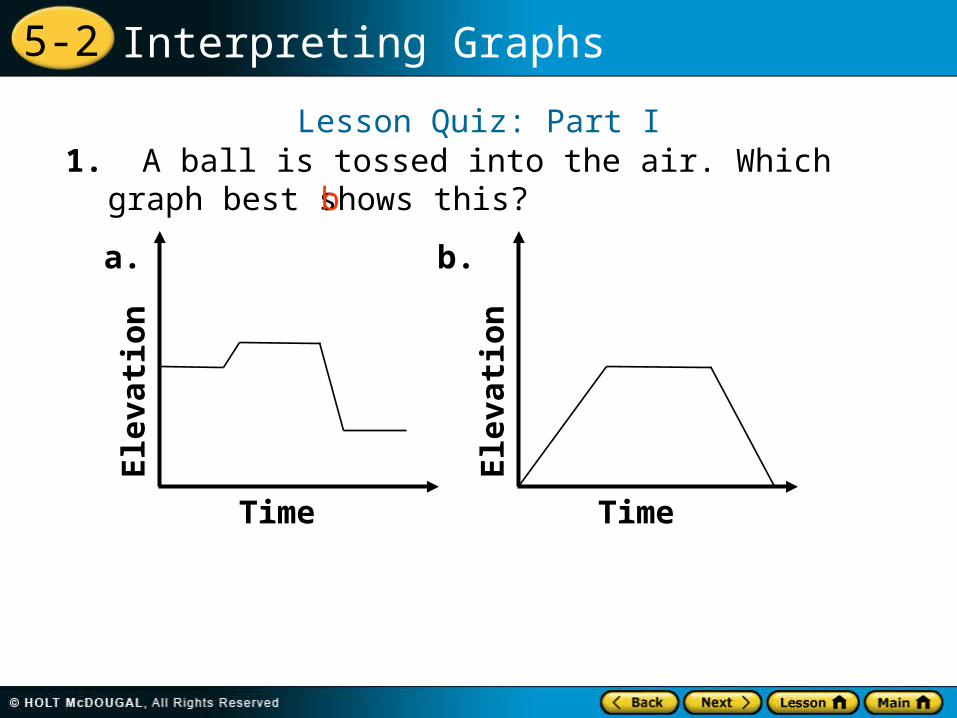
Lesson Quiz: Part I1. A ball is tossed into the air. Which graph best
shows this?
a. b.
b
Ele
vati
on
TimeEle
vati
on
Time
5-2 Interpreting Graphs
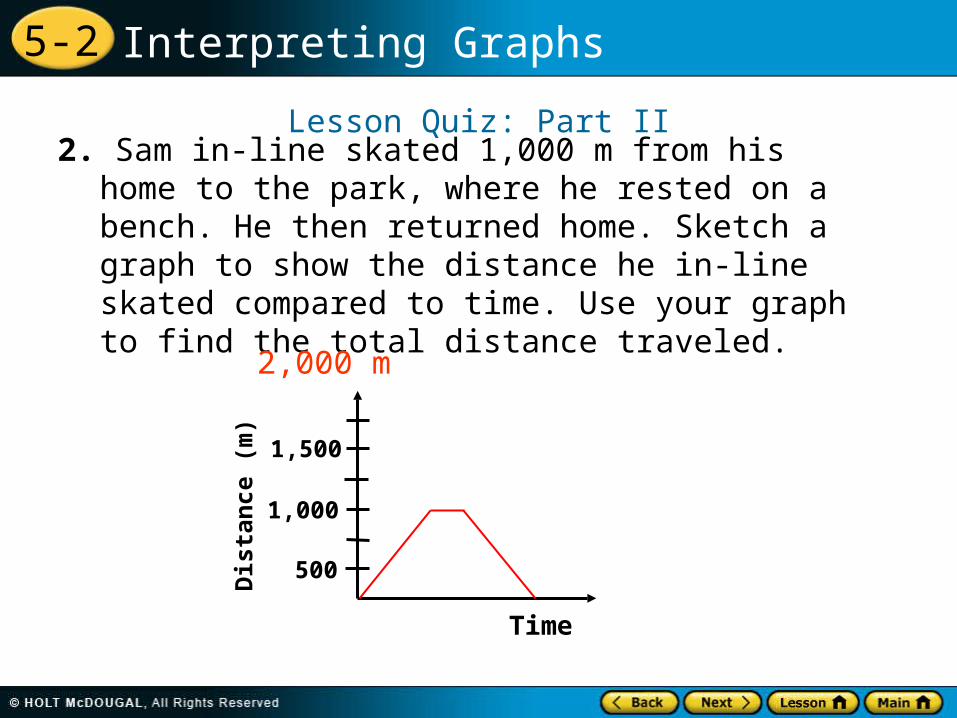
Lesson Quiz: Part II
2. Sam in-line skated 1,000 m from his home to the park, where he rested on a bench. He then returned home. Sketch a graph to show the distance he in-line skated compared to time. Use your graph to find the total distance traveled.
Dis
tan
ce (
m)
500
1,000
1,500
Time
2,000 m
5-2 Interpreting Graphs
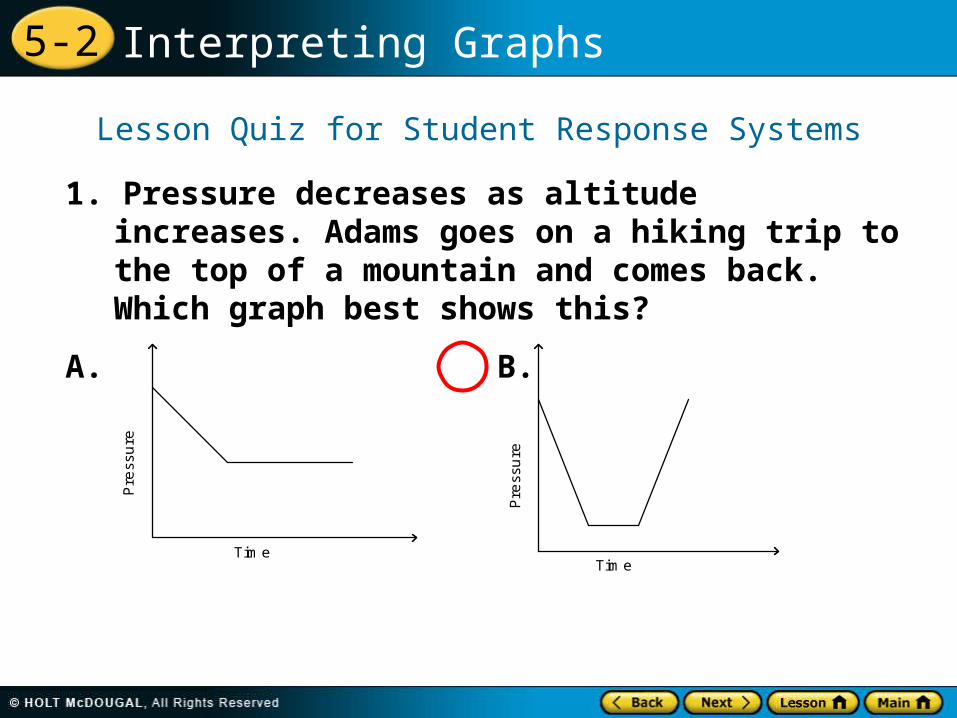
1. Pressure decreases as altitude increases. Adams goes on a hiking trip to the top of a mountain and comes back. Which graph best shows this?
A. B.
Lesson Quiz for Student Response Systems
Time
Pre
ssu
re
Time
Pre
ssu
re
5-2 Interpreting Graphs
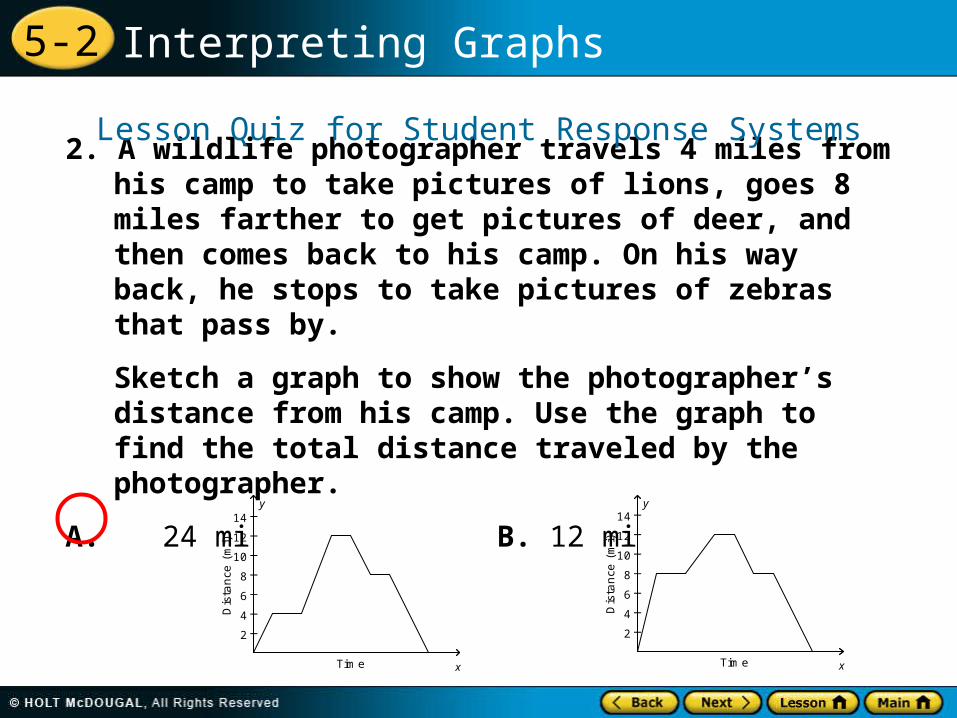
2. A wildlife photographer travels 4 miles from his camp to take pictures of lions, goes 8 miles farther to get pictures of deer, and then comes back to his camp. On his way back, he stops to take pictures of zebras that pass by.
Sketch a graph to show the photographer’s distance from his camp. Use the graph to find the total distance traveled by the photographer.
A. 24 mi B. 12 mi
Lesson Quiz for Student Response Systems
Time
Dis
tance
(m
i)
x
2
4
6
8
10
12
14y
Time
Dis
tance
(m
i)
x
2
4
6
8
10
12
14y