49000-02037 rev. b ss500-ss2000-ss3000 h2o & co2
TRANSCRIPT

SS500/SS2000/SS3000Gas Analyzers
Operator’s ManualH2O and/or CO2 in Natural Gas


Products of
11027 Arrow RouteRancho Cucamonga, CA 91730
Tel: 800.619.2861Fax: 909.948.4100
www.spectrasensors.com
Copyright © 2009 SpectraSensors, Inc. No part of this manual may be reproduced inwhole or in part without the express written permission of SpectraSensors, Inc.SpectraSensors reserves the right to change product design and specifications at anytime without prior notice.
SS500/SS2000/SS3000Gas Analyzers
Operator’s Manual
H2O and/or CO2 in Natural Gas
This manual applies to firmware version:v2.41

THIS PAGE INTENTIONALLY LEFT BLANK
SS500/SS2000/SS3000 Operator’s Manual i
TABLE OF CONTENTSTable of Contents . . . . . . . . . . . . . . . . . . . . . . . . . . . . . . . . . . . . . . . . . . . . i
List of Figures . . . . . . . . . . . . . . . . . . . . . . . . . . . . . . . . . . . . . . . . . . . . . . .v
List of Tables . . . . . . . . . . . . . . . . . . . . . . . . . . . . . . . . . . . . . . . . . . . . . . . vii
1: Introduction
Who Should Read This Manual . . . . . . . . . . . . . . . . . . . . . . . . . . . . . . . . . . . . 1-1How to Use This Manual. . . . . . . . . . . . . . . . . . . . . . . . . . . . . . . . . . . . . . . . . 1-1Special Symbols Used in This Manual . . . . . . . . . . . . . . . . . . . . . . . . . . . . . . . 1-2
General Warnings and Cautions . . . . . . . . . . . . . . . . . . . . . . . . . . . . . . . . . 1-2SpectraSensors Overview . . . . . . . . . . . . . . . . . . . . . . . . . . . . . . . . . . . . . . . 1-4About the Gas Analyzers . . . . . . . . . . . . . . . . . . . . . . . . . . . . . . . . . . . . . . . . 1-4Difference between the SS500, SS2000, and SS3000 . . . . . . . . . . . . . . . . . . . . 1-4How the Analyzers Work . . . . . . . . . . . . . . . . . . . . . . . . . . . . . . . . . . . . . . . . 1-4
2: Installation
What Should be Included in the Shipping Box . . . . . . . . . . . . . . . . . . . . . . . . . 2-1Inspecting the Analyzer and SCS . . . . . . . . . . . . . . . . . . . . . . . . . . . . . . . . . . 2-1Installing the Analyzer and SCS . . . . . . . . . . . . . . . . . . . . . . . . . . . . . . . . . . . 2-2Hardware and Tools for Installation. . . . . . . . . . . . . . . . . . . . . . . . . . . . . . . . . 2-2
Hardware . . . . . . . . . . . . . . . . . . . . . . . . . . . . . . . . . . . . . . . . . . . . . . . . 2-2Tools . . . . . . . . . . . . . . . . . . . . . . . . . . . . . . . . . . . . . . . . . . . . . . . . . . . 2-2
Mounting the Analyzer. . . . . . . . . . . . . . . . . . . . . . . . . . . . . . . . . . . . . . . . . . 2-3To mount the analyzer . . . . . . . . . . . . . . . . . . . . . . . . . . . . . . . . . . . . . . . 2-3
Connecting Electrical Power to the Analyzer . . . . . . . . . . . . . . . . . . . . . . . . . . . 2-3To connect electrical power to the analyzer. . . . . . . . . . . . . . . . . . . . . . . . . 2-4
Connecting the Output Signals . . . . . . . . . . . . . . . . . . . . . . . . . . . . . . . . . . . . 2-5To connect the output signals . . . . . . . . . . . . . . . . . . . . . . . . . . . . . . . . . 2-10
Changing the 4-20 mA Current Loop Mode. . . . . . . . . . . . . . . . . . . . . . . . . . . 2-11To change the 4-20 mA board from source to sink . . . . . . . . . . . . . . . . . . . 2-12
Connecting the Gas Lines. . . . . . . . . . . . . . . . . . . . . . . . . . . . . . . . . . . . . . . 2-13To connect the sample supply line . . . . . . . . . . . . . . . . . . . . . . . . . . . . . . 2-14To connect the sample return . . . . . . . . . . . . . . . . . . . . . . . . . . . . . . . . . 2-15
Conditioning the SCS Tubing . . . . . . . . . . . . . . . . . . . . . . . . . . . . . . . . . . . . 2-15
3: Sample Conditioning System (SCS)
About the SCS . . . . . . . . . . . . . . . . . . . . . . . . . . . . . . . . . . . . . . . . . . . . . . . 3-2Checking the SCS Installation. . . . . . . . . . . . . . . . . . . . . . . . . . . . . . . . . . . . . 3-3
To perform SCS installation checks . . . . . . . . . . . . . . . . . . . . . . . . . . . . . . 3-3Starting up the SCS . . . . . . . . . . . . . . . . . . . . . . . . . . . . . . . . . . . . . . . . . . . 3-4
To perform SCS installation checks . . . . . . . . . . . . . . . . . . . . . . . . . . . . . . 3-4Starting up the SCS . . . . . . . . . . . . . . . . . . . . . . . . . . . . . . . . . . . . . . . . . . . 3-4
To prepare for SCS startup . . . . . . . . . . . . . . . . . . . . . . . . . . . . . . . . . . . . 3-5To start up the field-pressure reducing station . . . . . . . . . . . . . . . . . . . . . . 3-5To start up the sample bypass stream on process sample. . . . . . . . . . . . . . . 3-6To start up the analyzer on process sample . . . . . . . . . . . . . . . . . . . . . . . . 3-6
Shutting Down the SCS . . . . . . . . . . . . . . . . . . . . . . . . . . . . . . . . . . . . . . . . 3-8To isolate the analyzer for short-term shutdown . . . . . . . . . . . . . . . . . . . . . 3-8To isolate the analyzer for long-term shutdown . . . . . . . . . . . . . . . . . . . . . . 3-9
Periodic SCS Maintenance . . . . . . . . . . . . . . . . . . . . . . . . . . . . . . . . . . . . . . 3-10
H2O and/or CO2 in Natural Gas
ii 49000-02037 rev. B 10-7-10
4: Operating the Analyzer
Powering Up the Analyzer . . . . . . . . . . . . . . . . . . . . . . . . . . . . . . . . . . . . . . . 4-1To power up the analyzer . . . . . . . . . . . . . . . . . . . . . . . . . . . . . . . . . . . . . 4-1
Powering Down the Analyzer . . . . . . . . . . . . . . . . . . . . . . . . . . . . . . . . . . . . . 4-2To power down the analyzer . . . . . . . . . . . . . . . . . . . . . . . . . . . . . . . . . . . 4-2
Operating the Analyzer from the Keypad . . . . . . . . . . . . . . . . . . . . . . . . . . . . . 4-2Modes Defined . . . . . . . . . . . . . . . . . . . . . . . . . . . . . . . . . . . . . . . . . . . . . . . 4-3
Mode 1: (Normal Mode) . . . . . . . . . . . . . . . . . . . . . . . . . . . . . . . . . . . . . . 4-4Mode 2: (Set Parameter Mode - Channel A) . . . . . . . . . . . . . . . . . . . . . . . . 4-4Mode 3: (Set Parameter Mode - Channel B) . . . . . . . . . . . . . . . . . . . . . . . . 4-5Mode 4: (System Diagnostic Parameters - Channel A) . . . . . . . . . . . . . . . . . 4-5Mode 5: (System Diagnostic Parameters - Channel B) . . . . . . . . . . . . . . . . . 4-6Mode 6: (Diagnostic Data Download) . . . . . . . . . . . . . . . . . . . . . . . . . . . . . 4-7Mode TEST: (System Test) . . . . . . . . . . . . . . . . . . . . . . . . . . . . . . . . . . . . 4-7
Changing Measurement and Control Parameters. . . . . . . . . . . . . . . . . . . . . . . . 4-8To change parameters in Mode 2 or Mode 3 . . . . . . . . . . . . . . . . . . . . . . . . 4-8
Measurement and Control Parameters Defined . . . . . . . . . . . . . . . . . . . . . . . . 4-10S Factor . . . . . . . . . . . . . . . . . . . . . . . . . . . . . . . . . . . . . . . . . . . . . . . . 4-10S Factor Offset . . . . . . . . . . . . . . . . . . . . . . . . . . . . . . . . . . . . . . . . . . . 4-10# Spectrum Average . . . . . . . . . . . . . . . . . . . . . . . . . . . . . . . . . . . . . . . 4-11Logger Rate . . . . . . . . . . . . . . . . . . . . . . . . . . . . . . . . . . . . . . . . . . . . . 4-11Peak Tracking . . . . . . . . . . . . . . . . . . . . . . . . . . . . . . . . . . . . . . . . . . . . 4-11Low Power Warning . . . . . . . . . . . . . . . . . . . . . . . . . . . . . . . . . . . . . . . . 4-124-20 mA Alarm Action . . . . . . . . . . . . . . . . . . . . . . . . . . . . . . . . . . . . . . 4-124-20 mA % Test . . . . . . . . . . . . . . . . . . . . . . . . . . . . . . . . . . . . . . . . . . 4-124 mA Value . . . . . . . . . . . . . . . . . . . . . . . . . . . . . . . . . . . . . . . . . . . . . . 4-1320 mA Value . . . . . . . . . . . . . . . . . . . . . . . . . . . . . . . . . . . . . . . . . . . . 4-13Temperature Unit . . . . . . . . . . . . . . . . . . . . . . . . . . . . . . . . . . . . . . . . . 4-13Pressure Unit. . . . . . . . . . . . . . . . . . . . . . . . . . . . . . . . . . . . . . . . . . . . . 4-14Concentration Unit . . . . . . . . . . . . . . . . . . . . . . . . . . . . . . . . . . . . . . . . 4-14Pipeline Pressure (if applicable) . . . . . . . . . . . . . . . . . . . . . . . . . . . . . . . . 4-14Modbus Address . . . . . . . . . . . . . . . . . . . . . . . . . . . . . . . . . . . . . . . . . . 4-15Modbus Mode . . . . . . . . . . . . . . . . . . . . . . . . . . . . . . . . . . . . . . . . . . . . 4-15User Analyzer ID . . . . . . . . . . . . . . . . . . . . . . . . . . . . . . . . . . . . . . . . . . 4-15User Sample ID . . . . . . . . . . . . . . . . . . . . . . . . . . . . . . . . . . . . . . . . . . 4-16User Component ID . . . . . . . . . . . . . . . . . . . . . . . . . . . . . . . . . . . . . . . . 4-16User Password. . . . . . . . . . . . . . . . . . . . . . . . . . . . . . . . . . . . . . . . . . . . 4-16
Adjusting Analyzer Reading to Match Specific Standard(s) . . . . . . . . . . . . . . . . 4-16To adjust the analyzer reading . . . . . . . . . . . . . . . . . . . . . . . . . . . . . . . . 4-17
Scaling and Calibrating the Current Loop Signal . . . . . . . . . . . . . . . . . . . . . . . 4-18To scale the current loop signal . . . . . . . . . . . . . . . . . . . . . . . . . . . . . . . . 4-18
Warnings . . . . . . . . . . . . . . . . . . . . . . . . . . . . . . . . . . . . . . . . . . . . . . . . . . 4-18Faults/Alarms . . . . . . . . . . . . . . . . . . . . . . . . . . . . . . . . . . . . . . . . . . . . . . . 4-19Validating the Analyzer . . . . . . . . . . . . . . . . . . . . . . . . . . . . . . . . . . . . . . . . 4-20
To validate manually (if applicable):. . . . . . . . . . . . . . . . . . . . . . . . . . . . . 4-20Calibrating the Analyzer. . . . . . . . . . . . . . . . . . . . . . . . . . . . . . . . . . . . . . . . 4-20
5: Serial Port Communications
Receiving Serial Data (RS-232 Output) . . . . . . . . . . . . . . . . . . . . . . . . . . . . . . 5-1To launch HyperTerminal . . . . . . . . . . . . . . . . . . . . . . . . . . . . . . . . . . . . . 5-1To capture and save data from the serial port . . . . . . . . . . . . . . . . . . . . . . . 5-4To read diagnostic data with HyperTerminal . . . . . . . . . . . . . . . . . . . . . . . . 5-4
Viewing Diagnostic Data with Microsoft Excel . . . . . . . . . . . . . . . . . . . . . . . . . . 5-5To import the data file into Excel . . . . . . . . . . . . . . . . . . . . . . . . . . . . . . . . 5-5
Modbus Communications Protocol . . . . . . . . . . . . . . . . . . . . . . . . . . . . . . . . . 5-10Framing/Protocol . . . . . . . . . . . . . . . . . . . . . . . . . . . . . . . . . . . . . . . . . . 5-12Functions . . . . . . . . . . . . . . . . . . . . . . . . . . . . . . . . . . . . . . . . . . . . . . . 5-12
Table of Contents
49000-02037 rev. B 10-7-10 iii
Addressing . . . . . . . . . . . . . . . . . . . . . . . . . . . . . . . . . . . . . . . . . . . . . . 5-12Reading/Writing in Daniel Modbus Mode . . . . . . . . . . . . . . . . . . . . . . . . . . 5-12Reading/Writing in Gould Modbus Mode . . . . . . . . . . . . . . . . . . . . . . . . . . 5-13Endianness . . . . . . . . . . . . . . . . . . . . . . . . . . . . . . . . . . . . . . . . . . . . . . 5-13To enable Modbus communications . . . . . . . . . . . . . . . . . . . . . . . . . . . . . 5-13
Modbus Accessible Parameter Definitions. . . . . . . . . . . . . . . . . . . . . . . 5-16
Appendix A: Troubleshooting
Gas Leaks . . . . . . . . . . . . . . . . . . . . . . . . . . . . . . . . . . . . . . . . . . . . . . . . . . A-1Contamination . . . . . . . . . . . . . . . . . . . . . . . . . . . . . . . . . . . . . . . . . . . . . . . A-1
To keep the sampling lines clean . . . . . . . . . . . . . . . . . . . . . . . . . . . . . . . . A-1Cleaning the Mirrors . . . . . . . . . . . . . . . . . . . . . . . . . . . . . . . . . . . . . . . . . . . A-2
Tools and Supplies . . . . . . . . . . . . . . . . . . . . . . . . . . . . . . . . . . . . . . . . . . A-2To clean the mirrors. . . . . . . . . . . . . . . . . . . . . . . . . . . . . . . . . . . . . . . . . A-3
Excessive Sampling Gas Temperatures and Pressures . . . . . . . . . . . . . . . . . . . . A-4Electrical Noise . . . . . . . . . . . . . . . . . . . . . . . . . . . . . . . . . . . . . . . . . . . . . . . A-4Peak Tracking Reset Procedure. . . . . . . . . . . . . . . . . . . . . . . . . . . . . . . . . . . . A-4
To check the PkDf and PkD1 values . . . . . . . . . . . . . . . . . . . . . . . . . . . . . . A-5To reset the Peak Tracking Function. . . . . . . . . . . . . . . . . . . . . . . . . . . . . . A-5
Instrument Problems. . . . . . . . . . . . . . . . . . . . . . . . . . . . . . . . . . . . . . . . . . . A-6Service Contact . . . . . . . . . . . . . . . . . . . . . . . . . . . . . . . . . . . . . . . . . . . . . . A-6Disclaimers . . . . . . . . . . . . . . . . . . . . . . . . . . . . . . . . . . . . . . . . . . . . . . . . . A-7Warranty . . . . . . . . . . . . . . . . . . . . . . . . . . . . . . . . . . . . . . . . . . . . . . . . . . . A-7
Appendix B: Specifications
Spare Parts . . . . . . . . . . . . . . . . . . . . . . . . . . . . . . . . . . . . . . . . . . . . . . . . B-14
Index . . . . . . . . . . . . . . . . . . . . . . . . . . . . . . . . . . . . . . . . . . . . . . . . . Index-1

H2O and/or CO2 in Natural Gas
iv 49000-02037 rev. B 10-7-10
THIS PAGE INTENTIONALLY LEFT BLANK
SS500/SS2000/SS3000 Operator’s Manual v
LIST OF FIGURESFigure 1–1: Schematic of a typical laser diode absorption spectrometer. 1-5Figure 1–2: Typical raw signal from a laser diode absorption spectrometer with and
without mirror contamination. 1-6Figure 1–3: Typical normalized absorption signal from a laser diode absorption
spectrometer. 1-7Figure 1–4: Typical normalized 2f signal where the species concentration is propor-
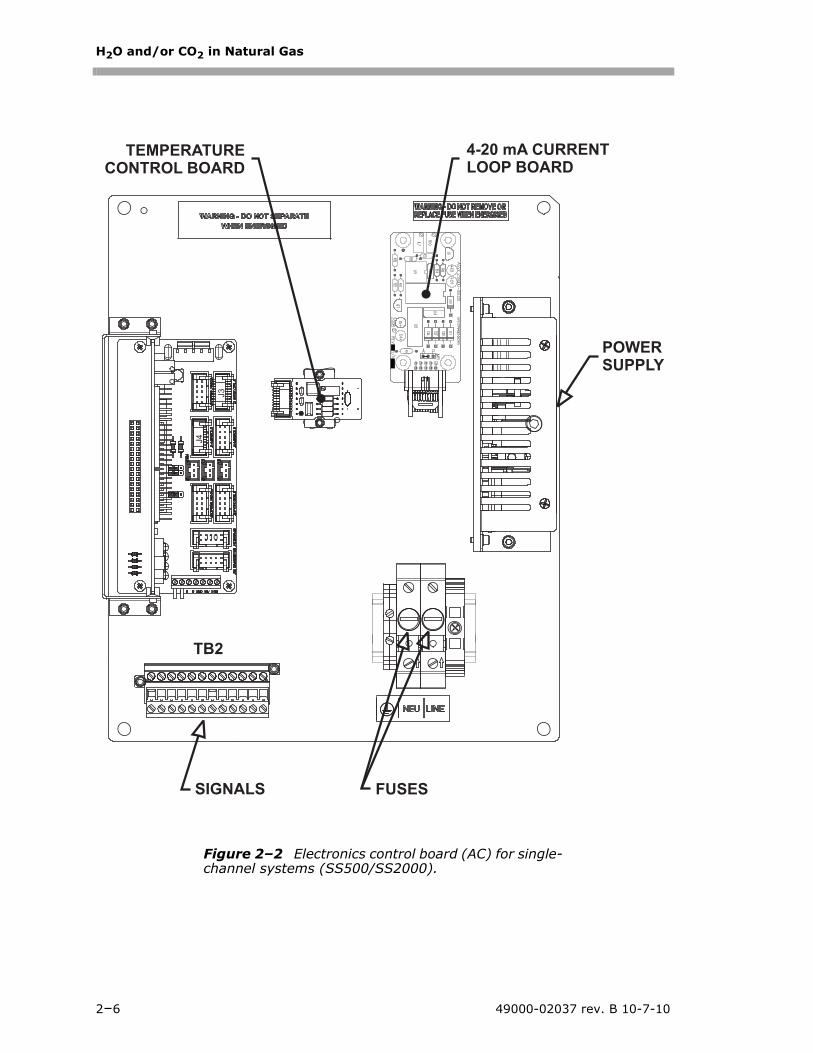
tional to the peak height. 1-7Figure 2–1: AC and DC connection terminal blocks in electronics enclosure. 2-5Figure 2–2: Electronics control board (AC) for single-channel systems
(SS500/SS2000). 2-6Figure 2–3: Electronics control board (DC) for single-channel systems
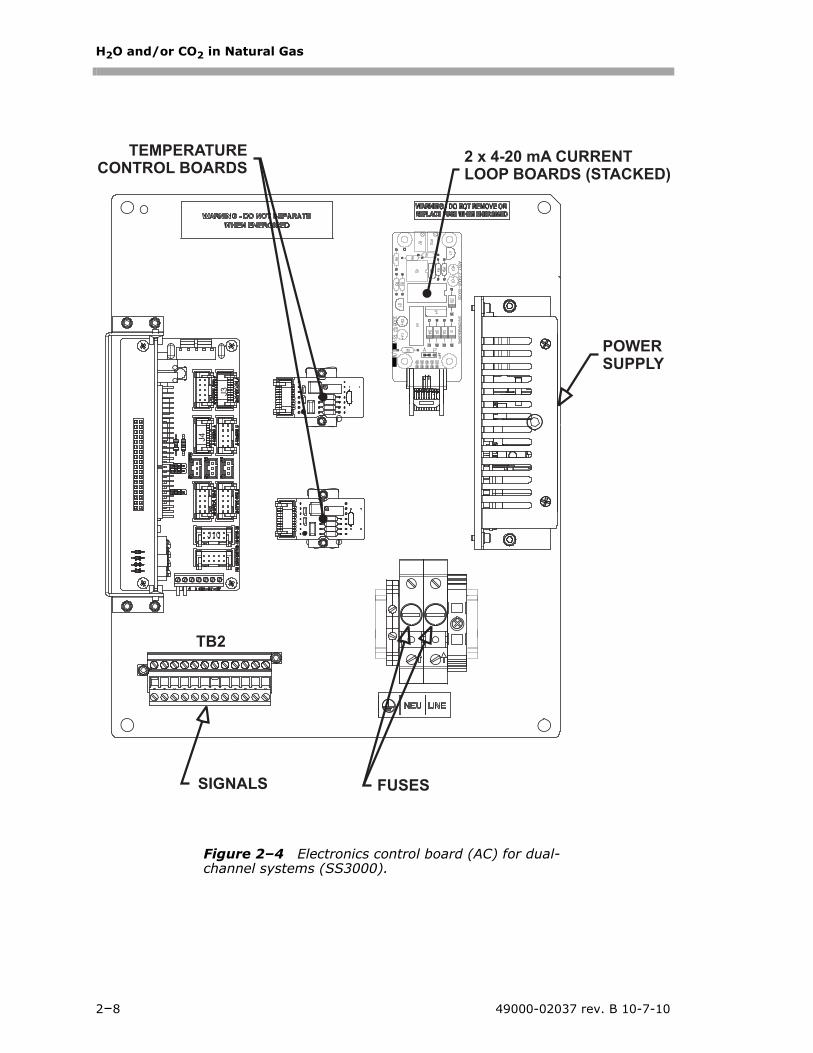
(SS500/SS2000). 2-7Figure 2–4: Electronics control board (AC) for dual-channel systems (SS3000). 2-8Figure 2–5: Electronics control board (DC) for dual-channel systems (SS3000).. 2-
9Figure 2–6: Mating terminal block (TB2) in electronics enclosure for connecting sig-
nal cables. 2-10Figure 2–7: 4-20 mA output board. 2-13Figure 3–1: Typical full-featured, single-channel SCS (SS500/SS2000). 3-2Figure 4–1: SS500/SS2000/SS3000 keypad. 4-3Figure 5–1: Connection Description window. 5-2Figure 5–2: Connect To window. 5-2Figure 5–3: COM Properties window. 5-3Figure 5–4: Hyperterminal window with streaming data. 5-3Figure 5–5: Sample diagnostic data output. 5-6Figure 5–6: Sample diagnostic data output (continued). 5-7Figure 5–7: a) Opening a data file in Excel. b) Setting data type in Text Import
Wizard. 5-8Figure 5–8: a) Setting Tab and Space as delimiters. b) Highlighting imported data
for plotting in Excel. 5-9Figure 5–9: Chart Wizard - Step 1 window. 5-10Figure 5–10: a) Data file plot in Excel. b) Format Data Series window. 5-11Figure B–1: SS500/SS2000 0.8-m cell (moisture) outline and mounting
dimensions. B-4Figure B–2: SS500/SS2000 0.1-m cell (carbon dioxide) outline and mounting
dimensions. B-5Figure B–3: Electrical schematic for SS500/SS2000. B-6Figure B–4: Drawing of typical full-featured single-channel SCS
(SS500/SS2000). B-7Figure B–5: SS3000 0.8-m/0.1-m cells (moisture/carbon dioxide) outline and
mounting dimensions. B-8Figure B–6: SS3000 0.8-m/0.8-m cells (moisture/moisture) outline and mounting
dimensions. B-9Figure B–7: Electrical schematic for SS3000. B-10Figure B–8: Drawing of typical full-featured dual-channel, dual-stream SCS

H2O and/or CO2 in Natural Gas
vi 49000-02037 rev. B 10-7-10
(SS3000). B-11Figure B–9: Drawing of typical full-featured dual-channel, single-stream SCS
(SS3000). B-12

SS500/SS2000/SS3000 Operator’s Manual vii
LIST OF TABLESTable 2–1: Output signal connections. 2-11Table 4–1: Measurement and control parameters. 4-9Table 5–1: Modbus register map . 5-15Table A–1: Potential instrument problems and solutions . A-8Table B–1: SS500 moisture in natural gas analyzer specifications. B-1Table B–2: SS2000 moisture in natural gas analyzer specifications. B-2Table B–3: SS2000 carbon dioxide in natural gas analyzer specifications. B-3Table B–4: SS3000 moisture and carbon dioxide in natural gas analyzer
specifications. B-13Table B–5: Replacement parts for SS500/SS2000/SS3000 H2O and/or CO2 in Nat-
ural Gas analyzers. B-14

H2O and/or CO2 in Natural Gas
viii 49000-02037 rev. B 10-7-10
THIS PAGE INTENTIONALLY LEFT BLANK

SS500/SS2000/SS3000 Operator’s Manual 1–1
1 - INTRODUCTIONSpectraSensors SS500/SS2000/SS3000 products are high-speed, diode-laser based extractive analyzers designed for extremely reliable monitoring of very low (trace) to standard concentrations of specific components in various background gases. In order to ensure that the analyzer performs as specified, it is important to pay close attention to the details of the installation and operation. This manual contains a comprehensive overview of the SS500/SS2000/SS3000 analyzer and step-by-step instructions on:
• Inspecting the Analyzer and SCS
• Installing the Analyzer and SCS
• Powering Up the Analyzer
• Operating the Analyzer
• Serial Port Communications
• Powering Down the Analyzer
• Troubleshooting
Who Should Read This ManualThis manual should be read and referenced by anyone installing, operating, or having contact with the analyzer.
How to Use This ManualTake a moment to familiarize yourself with this Operator’s Manual by reading the Table of Contents.
There are a number of options and accessories available for the SS500/SS2000/SS3000 analyzers. This manual has been written to address the most common options and accessories. Read each section in the manual carefully so you can quickly and easily install and operate the analyzer.
The manual includes images, tables, and charts that provide a visual understanding of the analyzer and its functions. Special symbols are also used to make you aware of potential hazards, important information, and valuable tips. Pay close attention to this information.
H2O and/or CO2 in Natural Gas
1–2 49000-02037 rev. B 10-7-10
Special Symbols Used in This ManualThis manual uses the following symbols to represent potential hazards, caution alerts, and important information associated with the analyzer. Every symbol has significant meaning that should be heeded.
General Warnings and CautionsFollowing are general warnings and cautions to observe when servicing the analyzer.
This icon denotes a warning statement. Warning statements indicate a potentially hazardous situation which, if not avoided, may result in serious injury or death.
Failure to follow all directions may result in fire.
Class IIIb radiation product. When open, avoid exposure to beam.
Failure to follow all directions may result in damage or malfunction of the analyzer.
Important information concerning the installation and operation of the analyzer.
Process samples may contain hazardous material in potentially flammable and/or toxic concentrations. Personnel should have a thorough knowledge and understanding of the physical properties of the sampler and prescribed safety precautions before operating the Sample Conditioning System.
Explosion hazard. Substitution of components may impair suitability for Class I, Div. 2.
Introduction
49000-02037 rev. B 10-7-10 1–3
Explosion hazard. Do not connect or disconnect equipment unless power has been switched off or the area is known to be non-hazardous.
Always disconnect the main power to the instrument before attempting any repair.
Read and understand all instructions before attempting to operate the instrument. Observe all caution notes and warning labels.
Class IIIb invisible laser radiation. When open, avoid exposure to beam. Conforms to provisions of US 21 CFR1040 10. Class I laser product. Refer servicing to the manufacturer’s qualified personnel.
Use a damp cloth to clean display and keypad to avoid static electric discharge.
Do not exceed 10 psig (0.7 barg) in sample cell. Damage to cell may result.
Do not hold or carry the analyzer by the measurement heads or sample cells. Doing so may result in optical misalignment affecting the performance of the sensor.
When selecting an analyzer, the total system design must be considered to ensure safe, trouble-free performance. Function, sizing, proper installation, operation, and maintenance are beyond the control of SpectraSensors and are the responsibilities of the system designer and user.
If equipment is used in a manner not specified by the manufacturer, the protection provided by the manufacturer may be impaired.

H2O and/or CO2 in Natural Gas
1–4 49000-02037 rev. B 10-7-10
SpectraSensors OverviewSpectraSensors, Inc. (SSI) is a leading manufacturer of state-of-the-art electro-optic gas analyzers for the industrial process, gas distribution and environmental monitoring markets. Headquartered in Houston, Texas, SSI was incorporated in 1999 as a spin-off of the NASA/Caltech Jet Propulsion Laboratory (JPL) with the purpose of commercializing space-proven measurement technologies initially developed at JPL.
About the Gas AnalyzersThe SS500/SS2000/SS3000 are tunable diode laser (TDL) absorption spectrometers operating in the near- (IR-A, 0.75–1.4 µm) to short-wavelength infrared (IR-B, 1.4–3 µm). Each compact sensor consists of a TDL light source, sample cell and detector specifically configured to enable high sensitivity measurement of a particular component in the presences of other gas phase constituents in the stream. The sensor is controlled by microprocessor-based electronics with embedded software that incorporates advanced operational and data processing algorithms.
An appropriate sample conditioning system may also be included with the system that has been specifically designed to deliver an optimum sample stream that is representative of the process stream at the time of sampling. Most SS500/SS2000/SS3000 analyzer systems are configured for use at extractive natural gas sampling stations.
Difference between the SS500, SS2000, and SS3000The SS500 and SS2000 are single-channel analyzers used predominantly for measuring H2O or CO2 in pipeline natural gas. The SS2000 is simply a higher resolution version of the SS500 (for performance specifications, see Table B–1 on page B–1, Table B–2 on page B–2, or Table B–3 on page B–3). The SS3000 is a dual-channel version of the SS2000 and is usually configured to measure H2O and/or CO2 in the same or separate pipeline natural gas sample streams (for performance specifications, see Table B–4 on page B–13).
How the Analyzers WorkThe SS500/SS2000/SS3000 analyzers employ tunable diode laser absorption spectroscopy (TDLAS) to detect the presence of trace substances in process gases. Absorption spectroscopy is a widely used technique for sensitive trace species detection. Because the measurement is made in the volume of the gas, the response is much faster, more accurate and significantly more reliable than traditional surface-based sensors that are subject to surface contamination.
In its simplest form, a diode laser absorption spectrometer typically consists of a sample cell with a mirror at one end and a mirror or window at the other
Introduction
49000-02037 rev. B 10-7-10 1–5
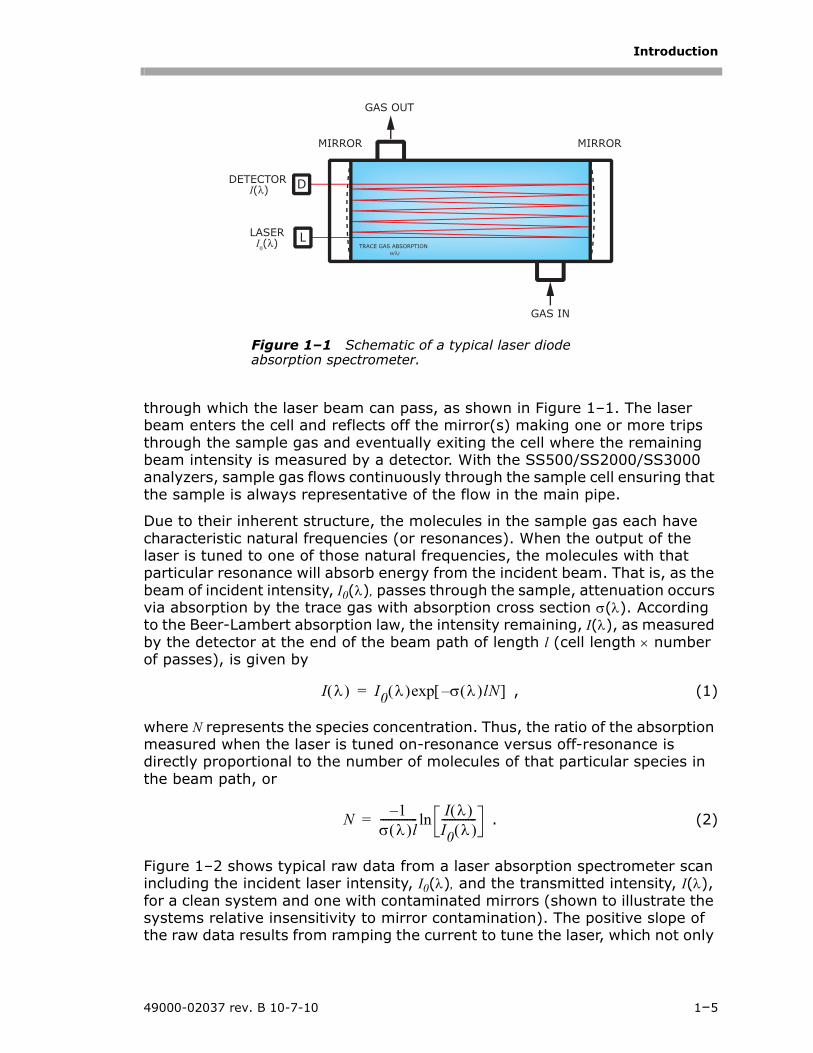
through which the laser beam can pass, as shown in Figure 1–1. The laser beam enters the cell and reflects off the mirror(s) making one or more trips through the sample gas and eventually exiting the cell where the remaining beam intensity is measured by a detector. With the SS500/SS2000/SS3000 analyzers, sample gas flows continuously through the sample cell ensuring that the sample is always representative of the flow in the main pipe.
Due to their inherent structure, the molecules in the sample gas each have characteristic natural frequencies (or resonances). When the output of the laser is tuned to one of those natural frequencies, the molecules with that particular resonance will absorb energy from the incident beam. That is, as the beam of incident intensity, I0(λ), passes through the sample, attenuation occurs via absorption by the trace gas with absorption cross section σ(λ). According to the Beer-Lambert absorption law, the intensity remaining, I(λ), as measured by the detector at the end of the beam path of length l (cell length × number of passes), is given by
, (1)
where N represents the species concentration. Thus, the ratio of the absorption measured when the laser is tuned on-resonance versus off-resonance is directly proportional to the number of molecules of that particular species in the beam path, or
. (2)
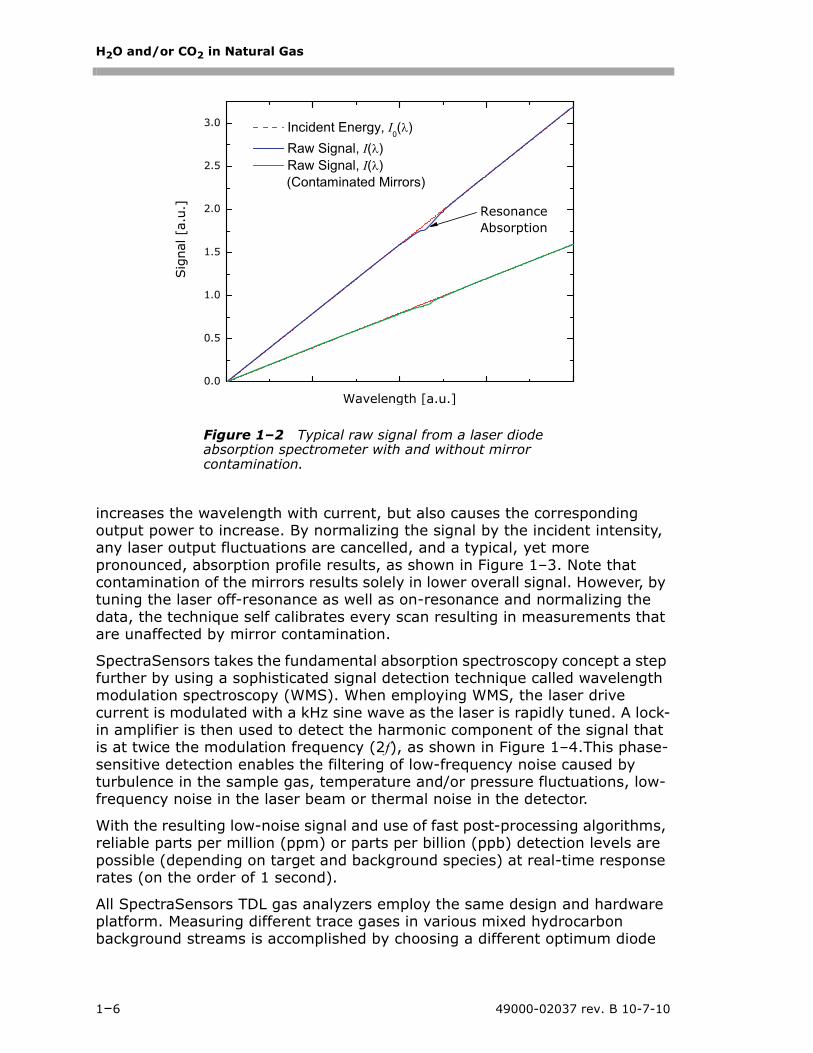
Figure 1–2 shows typical raw data from a laser absorption spectrometer scan including the incident laser intensity, I0(λ), and the transmitted intensity, I(λ), for a clean system and one with contaminated mirrors (shown to illustrate the systems relative insensitivity to mirror contamination). The positive slope of the raw data results from ramping the current to tune the laser, which not only
L
DDETECTOR
LASER
MIRROR MIRROR
I0(λ)
I(λ)
TRACE GAS ABSORPTIONα(λ)
GAS IN
GAS OUT
Figure 1–1 Schematic of a typical laser diode absorption spectrometer.
I λ( ) I0 λ( )exp σ λ( )lN–[ ]=
N 1–σ λ( )l-------------- I λ( )
I0 λ( )-------------ln=
H2O and/or CO2 in Natural Gas
1–6 49000-02037 rev. B 10-7-10
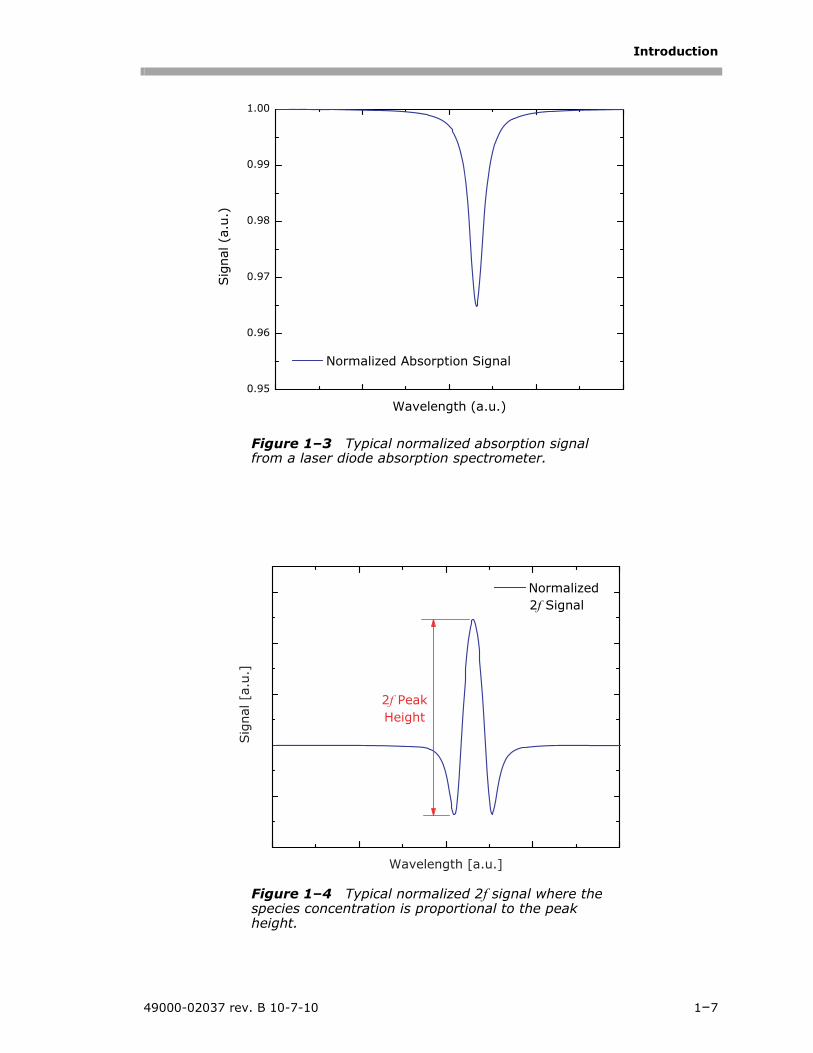
increases the wavelength with current, but also causes the corresponding output power to increase. By normalizing the signal by the incident intensity, any laser output fluctuations are cancelled, and a typical, yet more pronounced, absorption profile results, as shown in Figure 1–3. Note that contamination of the mirrors results solely in lower overall signal. However, by tuning the laser off-resonance as well as on-resonance and normalizing the data, the technique self calibrates every scan resulting in measurements that are unaffected by mirror contamination.
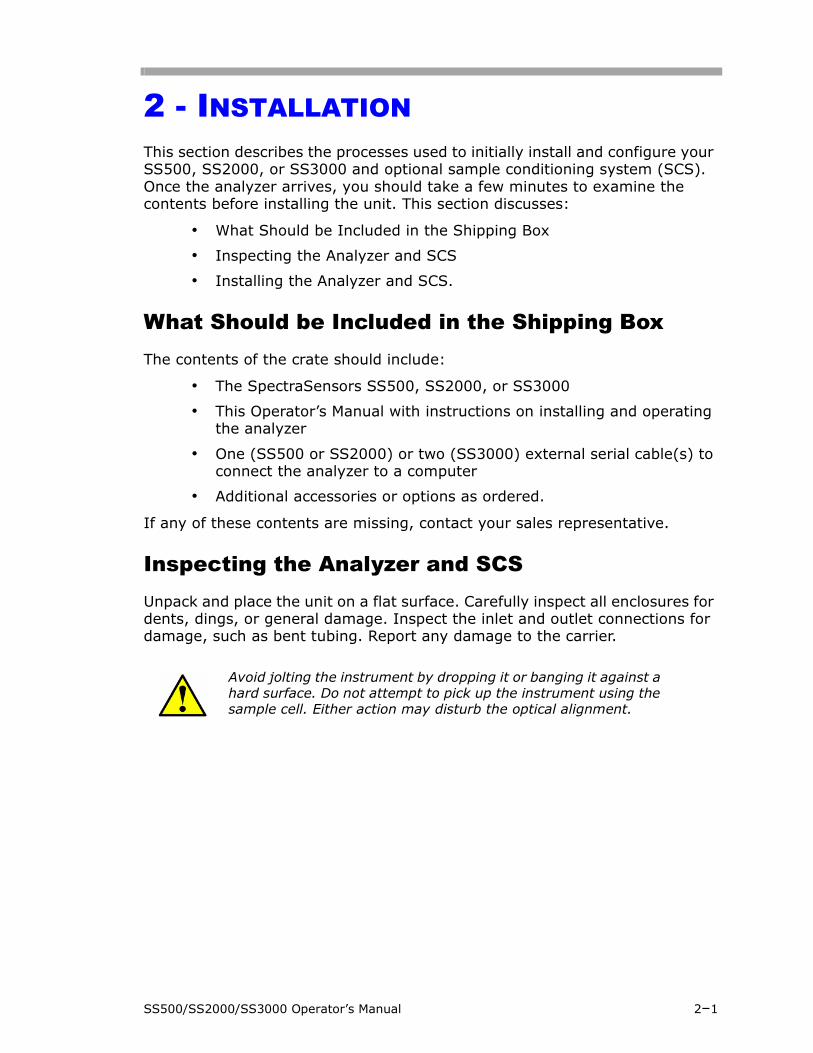
SpectraSensors takes the fundamental absorption spectroscopy concept a step further by using a sophisticated signal detection technique called wavelength modulation spectroscopy (WMS). When employing WMS, the laser drive current is modulated with a kHz sine wave as the laser is rapidly tuned. A lock-in amplifier is then used to detect the harmonic component of the signal that is at twice the modulation frequency (2f), as shown in Figure 1–4.This phase-sensitive detection enables the filtering of low-frequency noise caused by turbulence in the sample gas, temperature and/or pressure fluctuations, low-frequency noise in the laser beam or thermal noise in the detector.
With the resulting low-noise signal and use of fast post-processing algorithms, reliable parts per million (ppm) or parts per billion (ppb) detection levels are possible (depending on target and background species) at real-time response rates (on the order of 1 second).
All SpectraSensors TDL gas analyzers employ the same design and hardware platform. Measuring different trace gases in various mixed hydrocarbon background streams is accomplished by choosing a different optimum diode
Figure 1–2 Typical raw signal from a laser diode absorption spectrometer with and without mirror contamination.
Introduction
49000-02037 rev. B 10-7-10 1–7
Figure 1–3 Typical normalized absorption signal from a laser diode absorption spectrometer.
Figure 1–4 Typical normalized 2f signal where the species concentration is proportional to the peak height.

H2O and/or CO2 in Natural Gas
1–8 49000-02037 rev. B 10-7-10
laser wavelength between 700-3000nm which provides the least amount of sensitivity to background stream variations.
The SpectraSensors TDL analyzers are the most reliable gas analyzer platform with the lowest total cost of ownership. This is a result of using highly reliable optical telecommunications-type diode lasers, stainless steel hardware, and coated optical reflectors. The SpectraSensors analyzers also operate with the absence of any moving parts, tolerance to condensation of process liquids and accumulation of particulates from gas stream that eliminates requirements for field calibration and frequent maintenance.
SS500/SS2000/SS3000 Operator’s Manual 2–1
2 - INSTALLATION This section describes the processes used to initially install and configure your SS500, SS2000, or SS3000 and optional sample conditioning system (SCS). Once the analyzer arrives, you should take a few minutes to examine the contents before installing the unit. This section discusses:
• What Should be Included in the Shipping Box
• Inspecting the Analyzer and SCS
• Installing the Analyzer and SCS.
What Should be Included in the Shipping BoxThe contents of the crate should include:
• The SpectraSensors SS500, SS2000, or SS3000
• This Operator’s Manual with instructions on installing and operating the analyzer
• One (SS500 or SS2000) or two (SS3000) external serial cable(s) to connect the analyzer to a computer
• Additional accessories or options as ordered.
If any of these contents are missing, contact your sales representative.
Inspecting the Analyzer and SCSUnpack and place the unit on a flat surface. Carefully inspect all enclosures for dents, dings, or general damage. Inspect the inlet and outlet connections for damage, such as bent tubing. Report any damage to the carrier.
Avoid jolting the instrument by dropping it or banging it against a hard surface. Do not attempt to pick up the instrument using the sample cell. Either action may disturb the optical alignment.

H2O and/or CO2 in Natural Gas
2–2 49000-02037 rev. B 10-7-10
Installing the Analyzer and SCSInstalling the analyzer is relatively easy requiring only a few steps that, when carefully followed, will ensure proper mounting and connection. This section includes:
• Hardware and Tools for Installation
• Mounting the Analyzer
• Connecting Electrical Power to the Analyzer
• Connecting the Output Signals
• Connecting the Gas Lines
Hardware and Tools for InstallationDepending on the particular model, the configuration of accessories and options ordered, you may need the following hardware and tools to complete the installation process.
Hardware:• Membrane separator filter (if not included)
• Pressure regulator (if not included)
• 1/2” Unistrut® (or equivalent) bolts and spring nuts
• Stainless steel tubing (SpectraSensors recommends using 1/4” O.D. x0.035” wall thickness, seamless stainless steel tubing)
• 1/2” conduit hubs
• Conduit
• Source of plant nitrogen gas (4 SCFH) for purge unit(s), if applicable
• 1/4” lag bolts or 1/4” machine screws and nuts
Tools:• Hand drill and bits
• Tape measure
• Level
• Pencil
• Socket wrench set
• Screw driver
• Crescent wrench
• 9/16” open-end wrench
Installation
49000-02037 rev. B 10-7-10 2–3
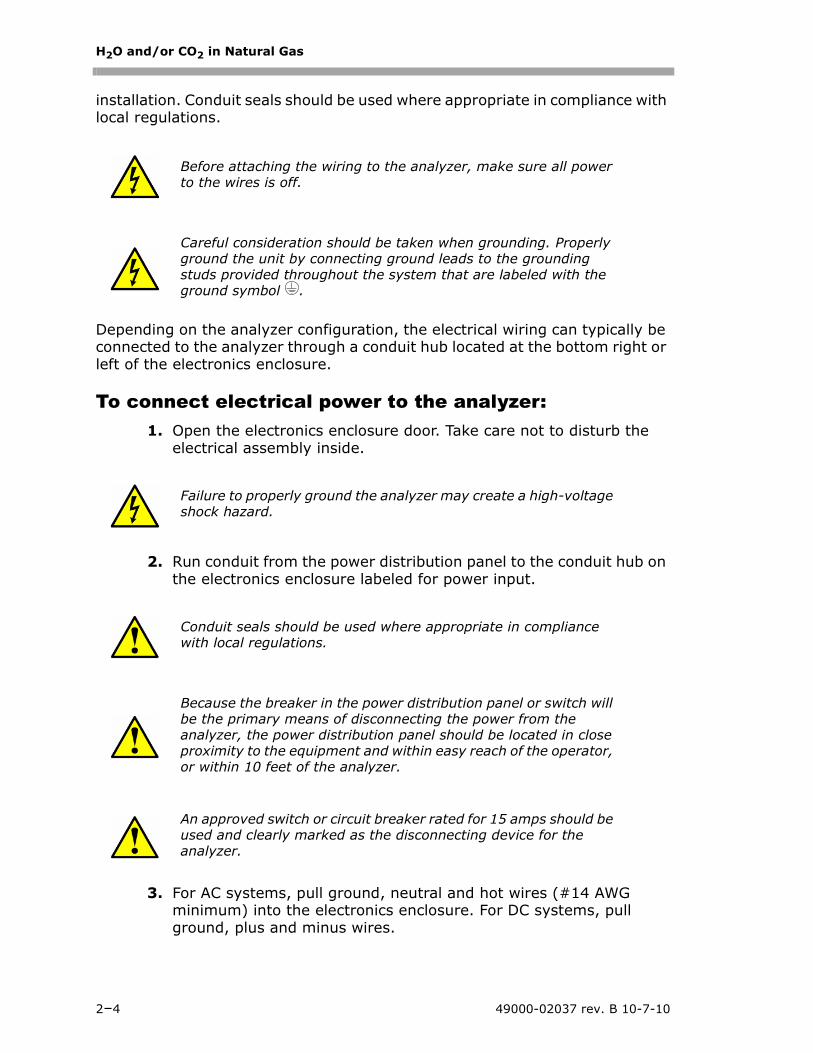
Mounting the AnalyzerThe SS500/SS2000/SS3000 analyzer is manufactured for wall or Unistrut® (or equivalent) metal framing installations. Depending on your application and configuration, the analyzer may come premounted on a SCS panel to be mounted on a wall or unistrut framing, or without a panel requiring mounting via the standard electronics enclosure tabs. Refer to the layout diagrams in Appendix B for detailed mounting dimensions.
To mount the analyzer:1. Select a suitable location to mount the analyzer. Choose a shaded
area or use an optional analyzer hood (or equivalent) to minimize sun exposure.
2. Locate the mounting holes on your unit.
3. For wall installations, mark the centers of the top mounting holes.
4. Drill the appropriate size holes for the screws you are using.
5. Hold the analyzer in place and fasten with the top screws.
6. Repeat for the bottom mounting holes.
Once all four screws are tightened the analyzer should be very secure and ready for the electrical connections.
Connecting Electrical Power to the AnalyzerThe analyzer will be configured for 100/240 VAC @ 50/60 Hz 1∅ input or optionally 9–16 VDC or 18–32 VDC input. Check the manufacturing data label or the terminal block labels to determine the power input requirements. All work must be performed by personnel qualified in electrical conduit
When mounting the analyzer, be sure not to position the instrument so that it is difficult to operate adjacent devices. Allow 3 feet of room in front of the analyzer and any switches.
It is critical to mount the analyzer so that the inlet and outlet lines reach the inlet and outlet connections on the chassis while still maintaining flexibility so that the sample lines are not under excessive stress.
SpectraSensors analyzers are designed for operation within the specified ambient temperature range of –4 °F to 122 °F (–20 °C to 50 °C). Intense sun exposure in some areas may cause the analyzer temperature to exceed the maximum.
H2O and/or CO2 in Natural Gas
2–4 49000-02037 rev. B 10-7-10
installation. Conduit seals should be used where appropriate in compliance with local regulations.
Depending on the analyzer configuration, the electrical wiring can typically be connected to the analyzer through a conduit hub located at the bottom right or left of the electronics enclosure.
To connect electrical power to the analyzer:1. Open the electronics enclosure door. Take care not to disturb the
electrical assembly inside.
2. Run conduit from the power distribution panel to the conduit hub on the electronics enclosure labeled for power input.
3. For AC systems, pull ground, neutral and hot wires (#14 AWG minimum) into the electronics enclosure. For DC systems, pull ground, plus and minus wires.
Before attaching the wiring to the analyzer, make sure all power to the wires is off.
Careful consideration should be taken when grounding. Properly ground the unit by connecting ground leads to the grounding studs provided throughout the system that are labeled with the ground symbol .
Failure to properly ground the analyzer may create a high-voltage shock hazard.
Conduit seals should be used where appropriate in compliance with local regulations.
Because the breaker in the power distribution panel or switch will be the primary means of disconnecting the power from the analyzer, the power distribution panel should be located in close proximity to the equipment and within easy reach of the operator, or within 10 feet of the analyzer.
An approved switch or circuit breaker rated for 15 amps should be used and clearly marked as the disconnecting device for the analyzer.

Installation
49000-02037 rev. B 10-7-10 2–5
4. Strip back the jacket and/or insulation of the wires just enough to connect to the power terminal block.
5. For AC systems, attach the neutral and hot wires to the power terminal block by connecting the neutral wire to the terminal marked “NEU,” the hot wire to the terminal marked “LINE,” as shown in Figure 2–1. For DC systems, connect the minus wire to the terminal marked “−,” and the positive wire to the terminal marked “+,” as shown in Figure 2–1.
6. Connect the ground wire to the ground terminal marked .
7. Close and tighten the electronics enclosure door.
Connecting the Output SignalsThe 4-20 mA current loop and serial output(s) are supplied from the mating terminal block (TB2) located inside the analyzer electronics enclosure as shown in Figure 2–2, Figure 2–3, Figure 2–4 or Figure 2–5. By default, the 4-20 mA current loop output is factory set to source current.
The 4-20 mA current loop output is factory set to source current. To change the 4-20 mA current loop output from source to sink, see “To change the 4-20 mA board from source to sink” on page 2-12.
LINENEU+
_
Figure 2–1 AC and DC connection terminal blocks in electronics enclosure.
AC TERMINALBLOCK
DC TERMINALBLOCK
H2O and/or CO2 in Natural Gas
2–6 49000-02037 rev. B 10-7-10
J4
J3
J10
SIGNALS
POWERSUPPLY
FUSES
4-20 mA CURRENTLOOP BOARD
TEMPERATURECONTROL BOARD
TB2
J1
Figure 2–2 Electronics control board (AC) for single-channel systems (SS500/SS2000).

Installation
49000-02037 rev. B 10-7-10 2–7
J4
J3
J10
SIGNALS
4-20 mA CURRENTLOOP BOARD
TEMPERATURECONTROL BOARD
TB2
POWERSUPPLY
FUSE
J1
Figure 2–3 Electronics control board (DC) for single-channel systems (SS500/SS2000).
H2O and/or CO2 in Natural Gas
2–8 49000-02037 rev. B 10-7-10
J4
J3
J10
SIGNALS
2 x 4-20 mA CURRENTLOOP BOARDS (STACKED)
TB2
TEMPERATURECONTROL BOARDS
FUSES
POWERSUPPLY
J1
Figure 2–4 Electronics control board (AC) for dual-channel systems (SS3000).

Installation
49000-02037 rev. B 10-7-10 2–9
J4
J3
J10
SIGNALS
2 x 4-20 mA CURRENTLOOP BOARDS (STACKED)
TB2
TEMPERATURECONTROL BOARDS
POWERSUPPLY
FUSE
J1
Figure 2–5 Electronics control board (DC) for dual-channel systems (SS3000)..
H2O and/or CO2 in Natural Gas
2–10 49000-02037 rev. B 10-7-10
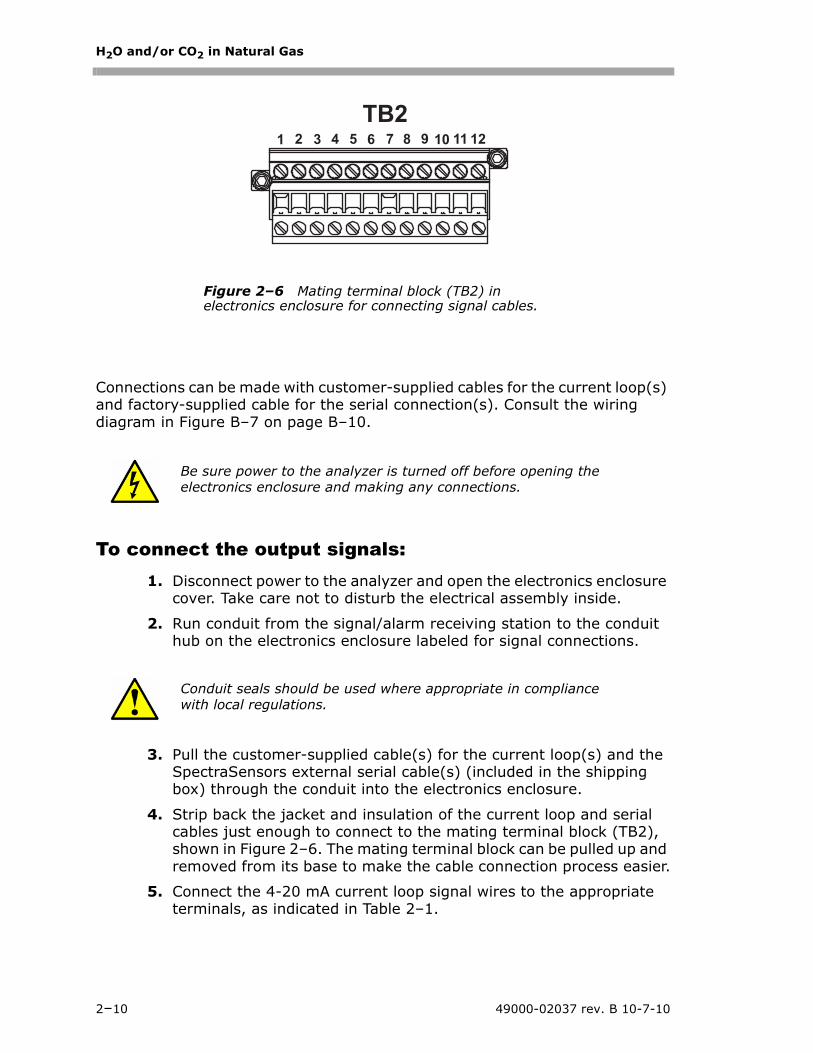
Connections can be made with customer-supplied cables for the current loop(s) and factory-supplied cable for the serial connection(s). Consult the wiring diagram in Figure B–7 on page B–10.
To connect the output signals:1. Disconnect power to the analyzer and open the electronics enclosure
cover. Take care not to disturb the electrical assembly inside.
2. Run conduit from the signal/alarm receiving station to the conduit hub on the electronics enclosure labeled for signal connections.
3. Pull the customer-supplied cable(s) for the current loop(s) and the SpectraSensors external serial cable(s) (included in the shipping box) through the conduit into the electronics enclosure.
4. Strip back the jacket and insulation of the current loop and serial cables just enough to connect to the mating terminal block (TB2), shown in Figure 2–6. The mating terminal block can be pulled up and removed from its base to make the cable connection process easier.
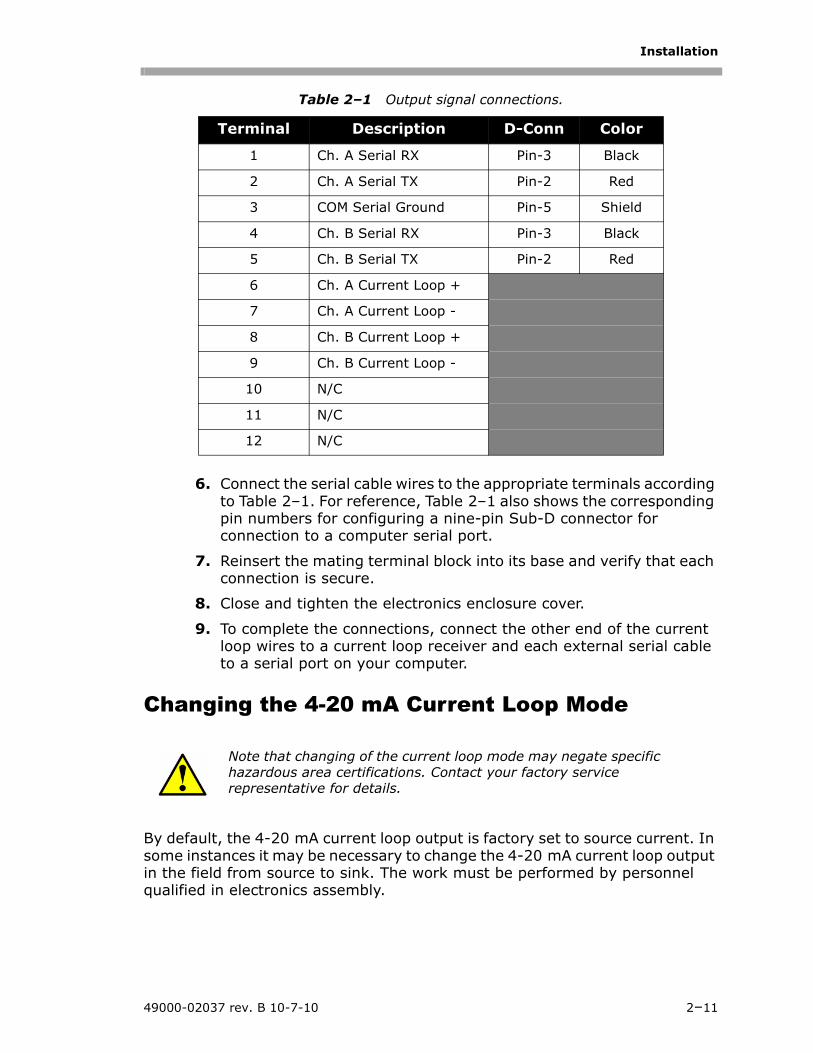
5. Connect the 4-20 mA current loop signal wires to the appropriate terminals, as indicated in Table 2–1.
Be sure power to the analyzer is turned off before opening the electronics enclosure and making any connections.
Conduit seals should be used where appropriate in compliance with local regulations.
TB21 2 3 5 7 8 9 10 11 1264
Figure 2–6 Mating terminal block (TB2) in electronics enclosure for connecting signal cables.
Installation
49000-02037 rev. B 10-7-10 2–11
6. Connect the serial cable wires to the appropriate terminals according to Table 2–1. For reference, Table 2–1 also shows the corresponding pin numbers for configuring a nine-pin Sub-D connector for connection to a computer serial port.
7. Reinsert the mating terminal block into its base and verify that each connection is secure.
8. Close and tighten the electronics enclosure cover.
9. To complete the connections, connect the other end of the current loop wires to a current loop receiver and each external serial cable to a serial port on your computer.
Changing the 4-20 mA Current Loop Mode
By default, the 4-20 mA current loop output is factory set to source current. In some instances it may be necessary to change the 4-20 mA current loop output in the field from source to sink. The work must be performed by personnel qualified in electronics assembly.
Table 2–1 Output signal connections.
Terminal Description D-Conn Color
1 Ch. A Serial RX Pin-3 Black
2 Ch. A Serial TX Pin-2 Red
3 COM Serial Ground Pin-5 Shield
4 Ch. B Serial RX Pin-3 Black
5 Ch. B Serial TX Pin-2 Red
6 Ch. A Current Loop +
7 Ch. A Current Loop -
8 Ch. B Current Loop +
9 Ch. B Current Loop -
10 N/C
11 N/C
12 N/C
Note that changing of the current loop mode may negate specific hazardous area certifications. Contact your factory service representative for details.

H2O and/or CO2 in Natural Gas
2–12 49000-02037 rev. B 10-7-10
To change the 4-20 mA board from source to sink:1. Disconnect power to the analyzer and open the electronics enclosure
cover. Take care not to disturb the electrical assembly inside.
2. Locate the 4-20 mA board(s) in the center of the electronics enclosure, as shown in Figure 2–2, Figure 2–3, Figure 2–4 or Figure 2–5.
3. Unscrew the four mounting screws.
4. Disconnect the 10-pin (J1) connector from the 4-20 mA board and remove the board from the back panel.
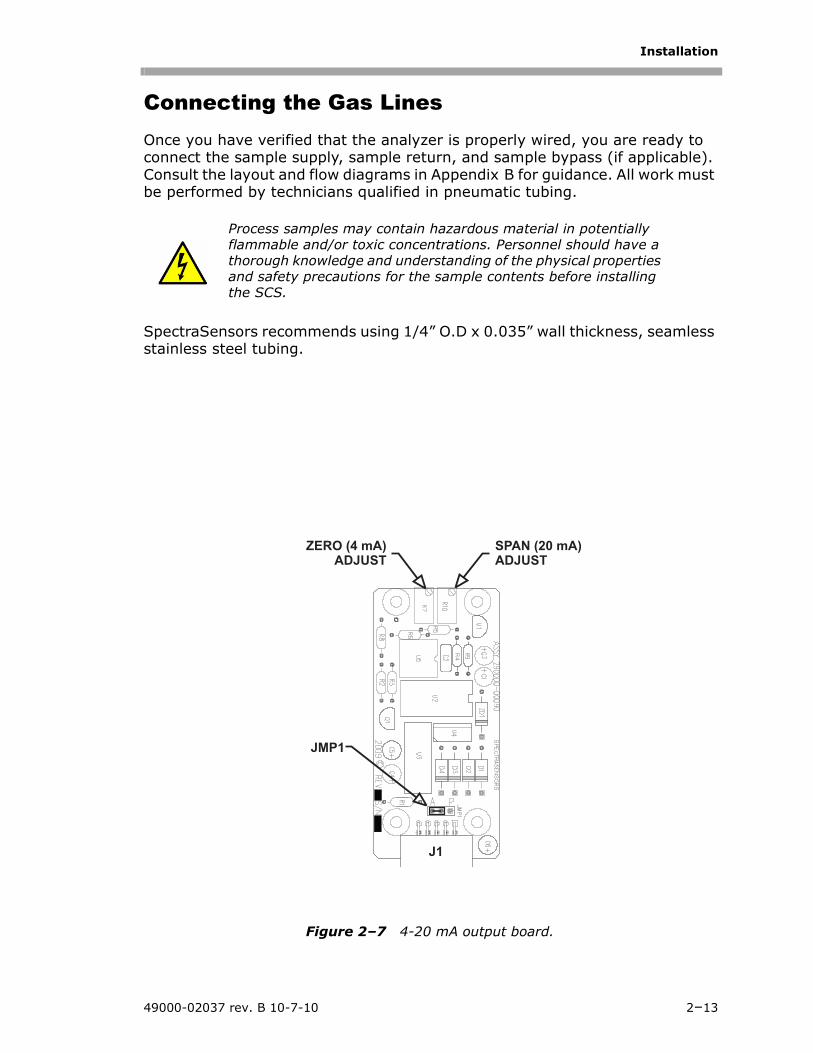
5. Desolder the jumper (JMP1), shown in Figure 2–7, connecting the center hole to point “A.”
6. Clean the jumper (JMP1) area with solvent to remove residual flux, etc.
7. For 4-20 mA sink, carefully re-solder the jumper to connect the center hole with point “P.”
8. Repeat as necessary, steps 3-7, for any remaining 4-20 mA boards.
9. Reinstall the board(s) on the panel and connect the 10-pin (J1) connector(s).
10. Reconnect power to the analyzer. Confirm the 4 mA (min.) and 20 mA (max.) points (see “To scale the current loop signal” on page 4-18).
11. Close and tighten the electronics enclosure cover.
Installation
49000-02037 rev. B 10-7-10 2–13
Connecting the Gas LinesOnce you have verified that the analyzer is properly wired, you are ready to connect the sample supply, sample return, and sample bypass (if applicable). Consult the layout and flow diagrams in Appendix B for guidance. All work must be performed by technicians qualified in pneumatic tubing.
SpectraSensors recommends using 1/4” O.D x 0.035” wall thickness, seamless stainless steel tubing.
Process samples may contain hazardous material in potentially flammable and/or toxic concentrations. Personnel should have a thorough knowledge and understanding of the physical properties and safety precautions for the sample contents before installing the SCS.
ZERO (4 mA)ADJUST
SPAN (20 mA)ADJUST
JMP1
J1
Figure 2–7 4-20 mA output board.
H2O and/or CO2 in Natural Gas
2–14 49000-02037 rev. B 10-7-10
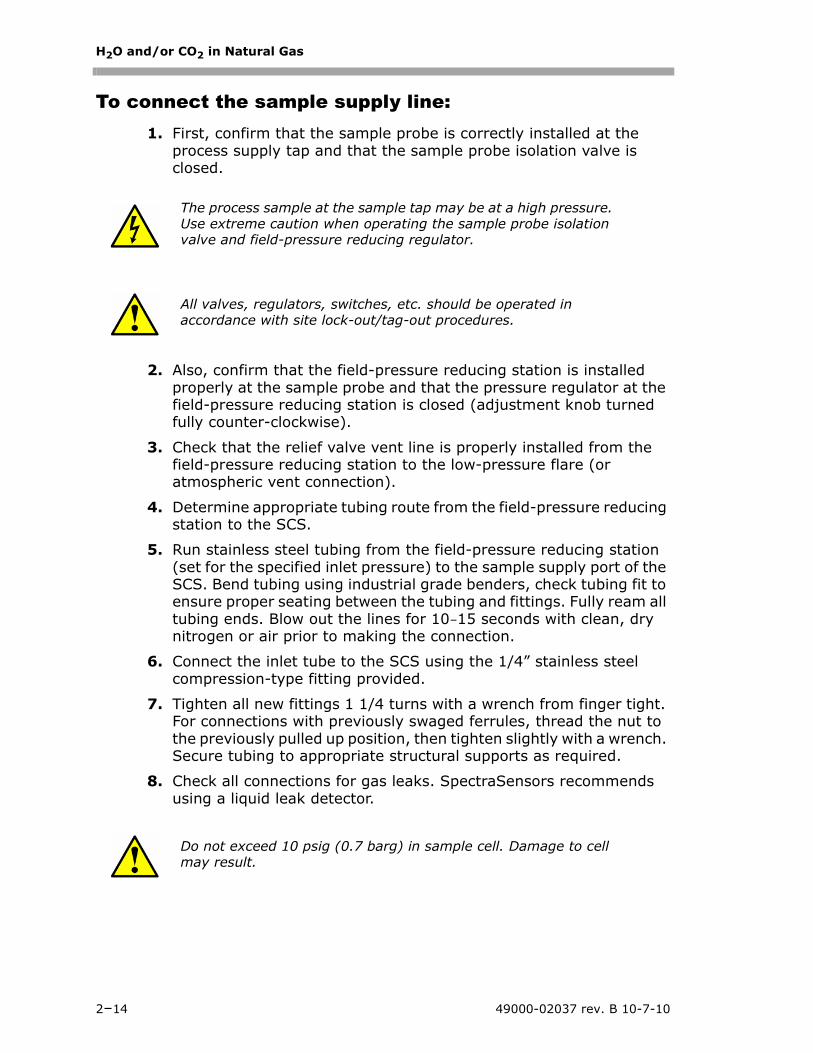
To connect the sample supply line:1. First, confirm that the sample probe is correctly installed at the
process supply tap and that the sample probe isolation valve is closed.
2. Also, confirm that the field-pressure reducing station is installed properly at the sample probe and that the pressure regulator at the field-pressure reducing station is closed (adjustment knob turned fully counter-clockwise).
3. Check that the relief valve vent line is properly installed from the field-pressure reducing station to the low-pressure flare (or atmospheric vent connection).
4. Determine appropriate tubing route from the field-pressure reducing station to the SCS.
5. Run stainless steel tubing from the field-pressure reducing station (set for the specified inlet pressure) to the sample supply port of the SCS. Bend tubing using industrial grade benders, check tubing fit to ensure proper seating between the tubing and fittings. Fully ream all tubing ends. Blow out the lines for 10–15 seconds with clean, dry nitrogen or air prior to making the connection.
6. Connect the inlet tube to the SCS using the 1/4” stainless steel compression-type fitting provided.
7. Tighten all new fittings 1 1/4 turns with a wrench from finger tight. For connections with previously swaged ferrules, thread the nut to the previously pulled up position, then tighten slightly with a wrench. Secure tubing to appropriate structural supports as required.
8. Check all connections for gas leaks. SpectraSensors recommends using a liquid leak detector.
The process sample at the sample tap may be at a high pressure. Use extreme caution when operating the sample probe isolation valve and field-pressure reducing regulator.
All valves, regulators, switches, etc. should be operated in accordance with site lock-out/tag-out procedures.
Do not exceed 10 psig (0.7 barg) in sample cell. Damage to cell may result.
Installation
49000-02037 rev. B 10-7-10 2–15
To connect the sample return:1. Confirm that the low-pressure flare or atmospheric vent header
shut-off valve is closed.
2. Determine appropriate tubing route from the SCS to the low-pressure flare or atmospheric vent header.
3. Run stainless steel tubing from the sample return port to the low-pressure flare or atmospheric vent header connection. Bend tubing using industrial grade benders, check tubing fit to ensure proper seating between the tubing and fittings. Fully ream all tubing ends. Blow out the lines for 10–15 seconds with clean, dry nitrogen or air prior to making the connection.
4. Connect the sample return tube to the SCS using the 1/4” stainless steel compression-type fitting provided.
5. Tighten all new fittings 1 1/4 turns with a wrench from finger tight. For connections with previously swaged ferrules, thread the nut to the previously pulled up position, then tighten slightly with a wrench. Secure tubing to appropriate structural supports as required.
6. Check all connections for gas leaks. SpectraSensors recommends using a liquid leak detector.
7. Be sure to vent the bypass return port and pressure relief vent port (if applicable) in a similar fashion when the unit is in use.
Conditioning the SCS TubingNewly installed systems invariably have some trace contaminants and/or are intended for measuring trace amounts of gas constituents that tend to cling to system walls resulting in erroneous readings if the constituents are not in equilibrium with the system walls. Therefore, once the analyzer and SCS are completely connected, the entire system (i.e., from the sample source valve to the vent or return) should be conditioned by flowing sample gas through the system for up to 12 hours (or until reading stabilizes) after the system is powered up and before actual readings are taken. Progress of the system conditioning can be monitored via the gas concentration readings. Once the gas constituents have reached equilibrium with the system walls, the readings should stabilize.
All valves, regulators, switches, etc. should be operated in accordance with site lock-out/tag-out procedures.
Do not exceed 10 psig (0.7 barg) in sample cell. Damage to cell may result.

H2O and/or CO2 in Natural Gas
2–16 49000-02037 rev. B 10-7-10
THIS PAGE INTENTIONALLY LEFT BLANK
SS500/SS2000/SS3000 Operator’s Manual 3–1
3 - SAMPLE CONDITIONING SYSTEM (SCS)
SS500/SS2000/SS3000 systems may be ordered with an optional integral Sample Conditioning System (SCS). Each SCS has been specifically designed to deliver a sample stream to the analyzer that is representative of the process stream at the time of sampling. To ensure the integrity of the sample stream and its analysis, care must be taken to install and operate the SCS properly. Therefore, any personnel intending to operate or service the analyzer and SCS should have a thorough understanding of the process application and the design of the analyzer and SCS.
Most problems experienced with sample systems tend to result from operating the system differently than intended. In some cases, the actual process conditions may be different than originally specified (e.g. flow rates, presence of contaminants, particulates, or condensables that may only exist under upset conditions). By establishing understanding of the application and the design of the system, most issues can be avoided altogether or easily diagnosed and corrected ensuring successful normal operation.
If there are any remaining questions concerning the design, operation, or maintenance of the SCS, contact your factory service representative.
Personnel should have a thorough understanding of the operation of the SS500/SS2000/SS3000 Analyzer and the procedures presented here before operating the sample conditioning system.
The process sample at the sample tap may be at a high pressure. A field-pressure reducing regulator is located at the sample tap to reduce the sample pressure and enable operation of the sample conditioning system at a low pressure. Use extreme caution when operating the sample probe isolation valve and field-pressure reducing regulator.
The process sample at the sample tap may be at a high pressure. Make sure that the field-pressure reducing regulator is equipped with an appropriate pressure relief valvle.
Process samples may contain hazardous material in potentially flammable and/or toxic concentrations. Personnel should have a thorough knowledge and understanding of the physical properties and safety precautions for the sample contents before operating the SCS.

H2O and/or CO2 in Natural Gas
3–2 49000-02037 rev. B 10-7-10
About the SCS
For a typical full-featured SCS, as shown in Figure 3–1, sample gas enters the sample conditioning unit [at the specified supply pressure set by a customer-supplied upstream regulator] via the sample supply port, passes through a shut-off valve, pressure regulator [set at 10 psig (0.7 barg)] that maintains constant pressure in the measurement cell, and membrane separator where any liquid in the stream is removed. Liquid removed by the membrane separator passes through the bypass loop and collects in a coalescing filter. A continuous flow (set to the specified level by a metering valve and flowmeter) not only flushes the liquid from the membrane separator but also maintains flow through the sample lines which reduces sample variation.
The system drawings and schematics used in this manual are for illustration purposes only. Always refer to your particular as-built drawings for your specific system configuration and specifications.
BYPASS FLOWMETER
SAMPLE/BYPASS
RETURN
SAMPLE FLOWMETER
PRESSURE REGULATOR
MEMBRANE SEPARATOR
LIQUID TRAP
GRAB SAMPLE
PORT
SAMPLE METERING
VALVE
BYPASS METERING
VALVE
GRAB SAMPLE
SHUT-OFF VALVE
SAMPLE SUPPLY
SHUT-OFF VALVE
SAMPLE SUPPLY
PORT
Figure 3–1 Typical full-featured, single-channel SCS (SS500/SS2000).

Sample Conditioning System (SCS)
49000-02037 rev. B 10-7-10 3–3
The flow exiting the bypass loop is combined with the flow exiting the measurement cell and sent out the sample return port to be vented to a safe location.
Checking the SCS InstallationBefore operating the system for the first time, a careful check of the installation of the entire SCS from the sample probe to the flare/vent is recommended.
To perform SCS installation checks:1. Confirm that the sample probe is correctly installed at the process
supply tap and that the sample probe isolation valve is closed.
2. Confirm that the field-pressure reducing station is installed properly at the sample probe and that the pressure regulator at the field-pressure reducing station is closed (adjustment knob turned fully counterclockwise).
3. Confirm that the relief valve vent line is properly installed from the field-pressure reducing station to the low-pressure flare (or atmospheric) connection.
4. If applicable, confirm that the sample probe and field-pressure reducing station are properly traced and insulated without any exposed surfaces.
5. If applicable, confirm that the field run electric-traced sample transport tubing is installed correctly (no exposed tubing or pockets), terminated properly at each end, and that each line has been purged clean and pressure tested.
6. Confirm that all valves are closed.
7. Confirm that the AC power is available to the electrically traced sample tubing (if applicable) and analyzer but that the local switches are off.
8. Confirm that the field analog and alarm signal wiring is interconnected properly (see “To connect the output signals” on page 2-10).
9. Confirm that the low-pressure flare or atmospheric vent is properly connected, if applicable.
10. Confirm that the analyzer house atmospheric vent is properly installed, if applicable.
11. Confirm that all sample system tubing has been thoroughly leak checked.
H2O and/or CO2 in Natural Gas
3–4 49000-02037 rev. B 10-7-10
Starting up the SCSAfter the SCS installation has been thoroughly checked, you are ready to begin preparing for initial SCS startup.
To perform SCS installation checks:1. Confirm that the sample probe is correctly installed at the supply tap
and that the sample probe isolation valve is closed.
2. Confirm that the field-pressure reducing station is installed properly at the sample probe and that the pressure regulator at the field-pressure reducing station is closed (adjustment knob turned fully counterclockwise).
3. Confirm that the relief valve at the field-pressure reducing station has been set to the specified setpoint. The relief valve is located on the pressure reducing regulator at the process sample tap.
4. Confirm that the relief valve vent line is properly installed from the field-pressure reducing station to the low-pressure flare (or atmospheric) connection.
5. Confirm that all valves are closed.
6. Confirm that the AC power is available to the analyzer but that the local switch is off.
7. Confirm that the field analog and alarm signal wiring is connected properly (see “To connect the output signals” on page 2-10).
8. Confirm that the low-pressure flare or atmospheric vent is properly connected.
9. Confirm that the analyzer house atmospheric vent is properly installed, if applicable.
10. Confirm that all sample system tubing has been thoroughly leak checked.
Starting up the SCSAfter the SCS installation has been thoroughly checked, you are ready to begin preparing for initial SCS startup.
Although the relief valve may have been preset, the setpoint must be confirmed prior to operation of the sample system. To confirm or reset the relief valve, it must be removed from the pressure reducing regulator and connected to an adjustable pressure source (refer to the manufacturer's instructions for details on setting the relief valve). After the relief valve is re-installed, all connections must be leak checked.
Sample Conditioning System (SCS)
49000-02037 rev. B 10-7-10 3–5
To prepare for SCS startup:1. If applicable, apply AC power to the electric-traced sample transport
tubing at the tracer control system.
2. If applicable, confirm that the sample supply line electric tracer temperature controller at the tracer control system is set to the temperature specified.
3. If applicable, confirm proper heating of the sample supply tubing.
4. Confirm that all sample system shut-off valves are closed.
5. Confirm that the sample bypass and analyzer flowmeter metering valves are closed (adjustment knobs turned clockwise). Do not over-tighten the metering valves or damage could occur.
To start up the field-pressure reducing station:
1. Confirm that the sample probe isolation valve is closed.
2. Confirm that the pressure regulator at the field-pressure reducing station is closed (adjustment knob turned fully counterclockwise).
3. Open the low-pressure flare or atmospheric vent header shut-off valve for the relief valve vent from the field-pressure reducing station.
4. Slowly open the sample probe process shut-off valve at the sample supply tap.
If applicable, personnel should have a thorough understanding of the operation of the tracer power supply and control system before operating the SCS.
The process sample at the sample tap may be at a high pressure. Use extreme caution when operating the sample probe isolation valve and field-pressure reducing regulator.
The low-pressure flare or atmospheric vent header shut-off valve must be “car-sealed” open and tagged as a relief valve vent so that this valve will not be closed unless the SCS is not in operation.
H2O and/or CO2 in Natural Gas
3–6 49000-02037 rev. B 10-7-10
5. Slowly open the pressure regulator at the field-pressure reducing station (adjustment knob turned clockwise) and set the pressure regulator to the specified pressure.
To start up the sample bypass stream on process sample:
1. Open the sample supply port shut-off valve.
2. Confirm the sample supply pressure.
3. Open the low-pressure flare or atmospheric vent header shut-off valve for the combined sample bypass and measurement cell effluent from the SCS.
4. Open the bypass flowmeter metering valve to establish sample flow from the sample probe and set the metering valve to the specified value.
5. Confirm that the sample supply pressure under flowing conditions is approximately set to the specified pressure.
To start up the analyzer on process sample:1. Open the sample metering valve to approximately the specified flow.
2. If required, adjust the pressure regulator at the field-pressure reducing station to the specified setpoint.
The pressure reducing regulator is designed to provide “bubble-tight” shut off when the pressure setpoint has been reached. However, if “bubble tight” shut off does not occur when the downstream sample line is isolated, the pressure at the outlet of the regulator will slowly increase until the pressure setpoint of the relief valve is reached and the excess pressure is vented by the relief valve. Although this situation is not intended, it does not cause a significant problem and startup of the SCS can continue without maintenance performed on the pressure regulator.
Although the exact supply pressure setpoint is not critical, the pressure at the sample system should be within 5 psig of the specified supply pressure setpoint. There may be a difference between the pressure readings at the sample tap and inside the SCS due to the pressure drop in the sample transport line under flowing conditions. If the pressure at the SCS under flowing conditions is not sufficiently close to the specified setpoint, it will be necessary to readjust the pressure regulator setpoint at the field-pressure reducing station to provide the required supply pressure with the specified sample bypass flow.
Sample Conditioning System (SCS)
49000-02037 rev. B 10-7-10 3–7
3. Adjust the sample metering valve to the specified flow.
4. Confirm the sample flow and pressure setpoints and readjust the metering valves and pressure regulator at the field-pressure reducing station to the specified setpoints, if necessary.
5. Confirm the sample bypass flow and readjust the bypass metering valve to the specified setpoint, if necessary. The SCS is now operating with the process sample.
6. Power up the analyzer according to the procedure given in “To power up the analyzer” on page 4-1.
The adjustment setpoints of the analyzer metering valves and pressure regulator at the field-pressure reducing station will be interactive and may require readjustment multiple times until the final setpoints are obtained.
The analyzer system has been designed for the sample flow rate specified. A lower than specified sample flow rate may adversely affect analyzer performance. If you are unable to attain the specified sample flow rate, contact your factory sales representative.
Personnel should have a thorough understanding of the operation of the SS500/SS2000/SS3000 analyzer before operating the SCS.

H2O and/or CO2 in Natural Gas
3–8 49000-02037 rev. B 10-7-10
Shutting Down the SCS
To isolate the analyzer for short-term shutdown:The analyzer can be isolated from the process sample tap for short-term shutdown or maintenance of the analyzer without requiring the shutdown of the field-pressure reducing station.
1. Close the sample supply shut-off valve.
Process samples may contain hazardous material in potentially flammable and/or toxic concentrations. Personnel should have a thorough knowledge and understanding of the physical properties and safety precautions for the sample contents before operating the SCS.
The process sample at the sample tap is at a high pressure. A pressure reducing regulator is located at the sample tap to reduce the sample pressure and enable operation of the SCS at a low pressure. Use extreme caution when operating the sample probe isolation valve and field-pressure reducing regulator.
Process samples may contain hazardous material in potentially flammable and/or toxic concentrations. Personnel should have a thorough knowledge and understanding of the physical properties and safety precautions for the sample contents before operating the SCS.
Although the pressure reducing regulator at the process sample tap is designed for “bubble-tight” shut off, this condition may not occur after the system has been in operation for an extended period. Isolation of the SCS from the field-pressure regulator will discontinue sample flow and may cause the pressure at the outlet of the field-pressure regulator to slowly increase if “bubble-tight” shut off of the pressure regulator does not occur. The slow pressure increase will continue until the pressure setpoint of the relief valve is reached and the excess pressure is vented by the relief valve. Although this situation is not intended, it does not cause a significant problem if the SCS is only isolated for a short period. Only a small amount of process sample will be vented when the relief valve opens because the pressure regulator will continue to act as a flow restriction.
All valves, regulators, switches, etc. should be operated in accordance with site lock-out/tag-out procedures.
Sample Conditioning System (SCS)
49000-02037 rev. B 10-7-10 3–9
2. Allow the sample to flow until all residual gas has dissipated from the lines as indicated by no flow on the sample and sample bypass flowmeters.
3. Close the low-pressure flare or atmospheric vent header shut-off valve for the combined sample bypass and measurement cell effluent from the SCS.
4. Turn off power to the analyzer.
To isolate the analyzer for long-term shutdown:If the analyzer is to be out of service for an extended period, the analyzer must be isolated at the process sample tap.
1. Open (or confirm open) the low-pressure flare (or atmospheric vent) header shut-off valve for the effluent from the SCS.
2. Confirm flow in the sample bypass flowmeter (the actual flow is not critical).
3. Close the sample probe process shut-off valve at the sample supply process tap.
4. Allow pressure in the field-pressure reducing regulator to dissipate until only a low residual pressure is indicated on the pressure gauge at the field station.
If the system will not be out of service for an extended period, it is advised that power remain applied to the sample transport line electric tracer, if applicable.
The process sample at the sample tap may be at a high pressure. A pressure reducing regulator is located at the sample tap to reduce the sample pressure and allow operation of the SCS at a low pressure. Use extreme caution when operating the sample probe isolation valve and field-pressure reducing regulator.
The sample transport line must be vented to the low-pressure flare (or atmospheric vent) header through the bypass flowmeter to avoid pressure surges. The procedure given in the following steps can be followed regardless of whether or not the SCS has been isolated from the process tap as described in the previous section.
All valves, regulators, switches, etc. should be operated in accordance with site lock-out/tag-out procedures.
H2O and/or CO2 in Natural Gas
3–10 49000-02037 rev. B 10-7-10
5. Close the field-pressure reducing regulator (adjustment knob turned fully counterclockwise).
6. Close the sample supply shut-off valve.
7. Close the sample bypass flowmeter metering valve (adjustment knob turned clockwise). Do not over-tighten the metering valve or damage could occur.
8. Close the sample flowmeter metering valve (adjustment knob turned clockwise). Do not over-tighten the metering valve or damage could occur.
9. Close the low-pressure flare (or atmospheric vent) header shut-off valve for the relief valve vent from the field-pressure regulator.
10. Close the low-pressure flare or atmospheric vent header shut-off valve for the sample bypass and measurement cell effluent from the SCS.
11. Turn off power to the analyzer.
12. Turn off the AC power to the sample tracer, if applicable, at the power distribution panel.
Periodic SCS Maintenance
The status of the SCS should be checked regularly to confirm proper operation (pressures, flows, etc.) and detect potential problems or failures before damage occurs. If maintenance is required, isolate the part of the system to be serviced by following the appropriate procedure under “Shutting Down the SCS” on page 3-8.
All coalescing filter elements should be checked periodically for loading. Obstruction of a filter element can be observed by a decreasing supply pressure or bypass flow. After observation for some time, a regular schedule can be determined for replacement of filter elements.
Although some liquid may carry over during normal operation, a coalescing filter at the sample supply port of the SCS should prevent any liquid proceeding
Although power could be shut off to the sample supply electric tracer, it is advisable to allow this line to remain heated unless the SCS is to be out of service for an extended period or maintenance is required on the line.
Due to the chemical properties of the process samples, care must be taken to repair or replace components with proper materials of construction. Maintenance personnel should have a thorough knowledge and understanding of the chemical characteristics of the process before performing maintenance on the SCS.
Sample Conditioning System (SCS)
49000-02037 rev. B 10-7-10 3–11
through the SCS. All coalescing filters should be checked regularly for liquid carry over.
If liquid is observed in a filter housing, the filter should be cleaned and the filter element replaced. In addition, the membrane in the membrane separator should also be checked and possibly replaced.
No other regularly scheduled maintenance should be required for the system.
Preventive and Demand SCS Maintenance
The performance of the SCS and individual components should be monitored regularly so that maintenance may be performed on a scheduled basis so that a failure does not take the system out of operation. However, preventive and demand maintenance will be required when components and parts deteriorate or fail as a result of continuous use.
The SCS is designed for convenient removal and replacement of component parts. Complete spare components should always be available. In general, if a problem or failure occurs, the complete part should be removed and replaced to limit system down time. If possible, components may be repaired (replacement of seats and seals, etc.) and then reused.
Under a process upset condition, it is possible for liquid to enter the sample probe and sample transport tubing. Normally, this liquid should purge from the sample transport line and be trapped in a coalescing filter at the sample supply port of the SCS.
If the sample line does not appear to completely clear during normal operation, it may be necessary to clean the sample transport line to remove any liquid that may adhere to the wall of the tubing. The sample transport line must be disconnected at both ends to allow cleaning. After cleaning, the line should be purged dry with air or nitrogen before the system is placed back in operation.
All filters should be checked regularly for obstruction. Obstruction of filter elements can be observed by a decreasing supply pressure or bypass flow. If liquid is observed in a filter housing or the filter is otherwise obstructed, the filter should be cleaned and the filter element replaced.
Due to the chemical properties of the process samples, care must be taken to repair or replace components with proper materials of construction. Maintenance personnel should have a thorough knowledge and understanding of the chemical characteristics of the process before performing maintenance on the SCS.
The system must be taken out of service during any cleaning of the sample transport line.

H2O and/or CO2 in Natural Gas
3–12 49000-02037 rev. B 10-7-10
THIS PAGE INTENTIONALLY LEFT BLANK
SS500/SS2000/SS3000 Operator’s Manual 4–1
4 - OPERATING THE ANALYZER
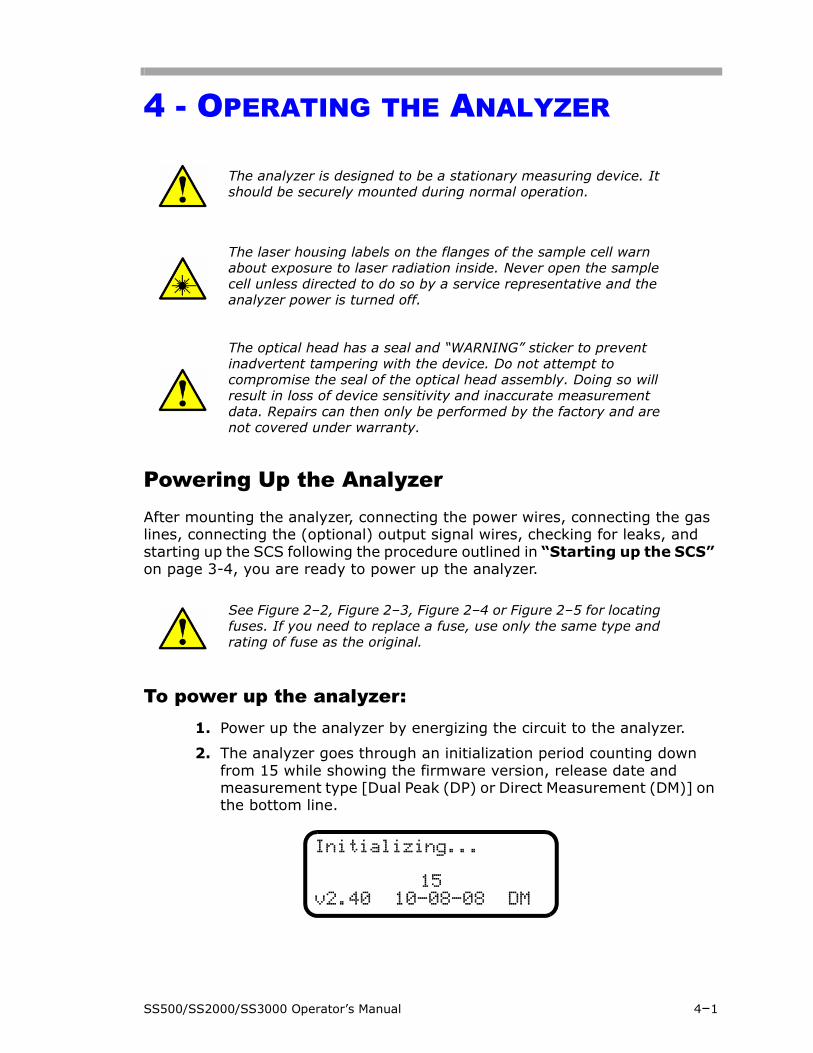
Powering Up the AnalyzerAfter mounting the analyzer, connecting the power wires, connecting the gas lines, connecting the (optional) output signal wires, checking for leaks, and starting up the SCS following the procedure outlined in “Starting up the SCS” on page 3-4, you are ready to power up the analyzer.
To power up the analyzer:1. Power up the analyzer by energizing the circuit to the analyzer.
2. The analyzer goes through an initialization period counting down from 15 while showing the firmware version, release date and measurement type [Dual Peak (DP) or Direct Measurement (DM)] on the bottom line.
The analyzer is designed to be a stationary measuring device. It should be securely mounted during normal operation.
The laser housing labels on the flanges of the sample cell warn about exposure to laser radiation inside. Never open the sample cell unless directed to do so by a service representative and the analyzer power is turned off.
The optical head has a seal and “WARNING” sticker to prevent inadvertent tampering with the device. Do not attempt to compromise the seal of the optical head assembly. Doing so will result in loss of device sensitivity and inaccurate measurement data. Repairs can then only be performed by the factory and are not covered under warranty.
See Figure 2–2, Figure 2–3, Figure 2–4 or Figure 2–5 for locating fuses. If you need to replace a fuse, use only the same type and rating of fuse as the original.
Initializing...
15v2.40 10-08-08 DM

H2O and/or CO2 in Natural Gas
4–2 49000-02037 rev. B 10-7-10
3. After initialization the LCD displays the Normal Mode screen with four lines (the third of which is blank for single-channel units).
4. Enable Peak Tracking following the procedure outlined in “To change parameters in Mode 2 or Mode 3” on page 4-8.
5. Continuous updates of the measurement parameters displaying on the LCD indicate that the analyzer is operating normally.
Powering Down the AnalyzerIt may be necessary to power down the analyzer for problem solving or maintenance reasons. An approved switch or circuit breaker rated for 15 amps should have been installed and clearly marked as the disconnecting device for the analyzer.
To power down the analyzer:1. Switch off the power to the analyzer using the switch or circuit
breaker designated as the disconnection device for the equipment.
2. If the analyzer is going to be shut down for a short period of time for routine maintenance, isolate the analyzer from the SCS by following the procedure under “To isolate the analyzer for short-term shutdown” on page 3-8.
3. If the analyzer is going to be shut down for a long period of time, follow the procedure under “To isolate the analyzer for long-term shutdown” on page 3-9. It is recommended to also disconnect the power completely from the analyzer to prevent potential damage from lightning strikes.
Operating the Analyzer from the KeypadThe keypads enable the operator to modify measurement units, adjust operational parameters, and perform diagnostics. During normal operation, the LCDs continuously display the measured components’ concentrations, sample cell temperatures, and sample cell pressures.
<NORMAL MODE>H2O: 1.0256lb/mmscf
P: 954.4mb T: 76.1F
Operating the Analyzer
49000-02037 rev. B 10-7-10 4–3
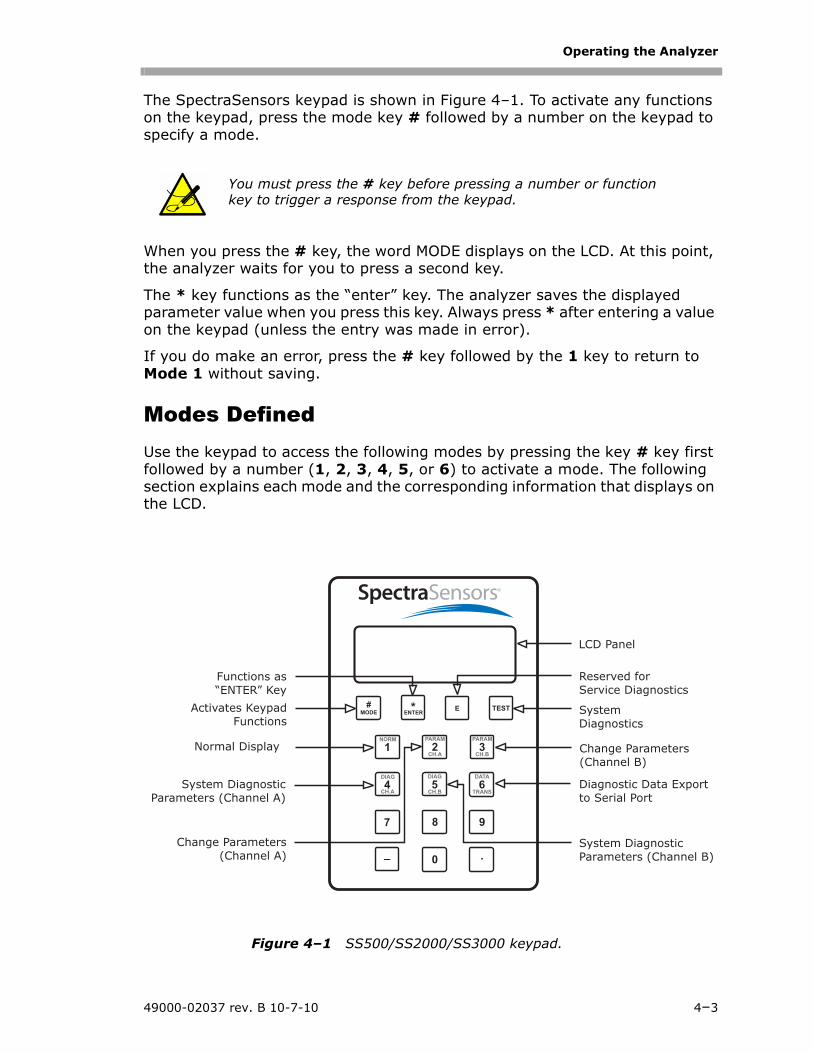
The SpectraSensors keypad is shown in Figure 4–1. To activate any functions on the keypad, press the mode key # followed by a number on the keypad to specify a mode.
When you press the # key, the word MODE displays on the LCD. At this point, the analyzer waits for you to press a second key.
The * key functions as the “enter” key. The analyzer saves the displayed parameter value when you press this key. Always press * after entering a value on the keypad (unless the entry was made in error).
If you do make an error, press the # key followed by the 1 key to return to Mode 1 without saving.
Modes DefinedUse the keypad to access the following modes by pressing the key # key first followed by a number (1, 2, 3, 4, 5, or 6) to activate a mode. The following section explains each mode and the corresponding information that displays on the LCD.
You must press the # key before pressing a number or function key to trigger a response from the keypad.
LCD Panel
Reserved for
Service Diagnostics
System
Diagnostics
Change Parameters
(Channel B)
Diagnostic Data Export
to Serial Port
System Diagnostic
Parameters (Channel B)
Functions as
“ENTER” Key
Activates Keypad
Functions
Normal Display
Change Parameters
(Channel A)
System Diagnostic
Parameters (Channel A)
#MODE
E TESTENTER
1
4
7
_
2
5
8
0
3
6
9
.
*
NORM
DIAG
PARAM
DIAG
PARAM
DATA
CH.A
CH.BCH.A
CH.B
TRANS
Figure 4–1 SS500/SS2000/SS3000 keypad.

H2O and/or CO2 in Natural Gas
4–4 49000-02037 rev. B 10-7-10
Mode 1: (Normal Mode)Continuously displays updated measurements. Press the # key followed by the 1 key.
The measurements displayed are:
• H2O — Concentration of CHA in units selected in Mode 2.
• CO2 — Concentration of CHB in units selected in Mode 3 (SS3000 only).
• P — Pressure in the sample cell in units selected in Mode 2.
• T — Temperature in the sample cell in units selected in Mode 2.
Mode 2: (Set Parameter Mode - Channel A)Enables user to view and change measurement parameters for Channel A. Press the # key followed by the 2 key. The LCD prompts for a numeric
password.
Enter the user password (3142) on the keypad, then press the * key to enter the number.
+# 1
<NORMAL MODE>H2O: 1.0256lb/mmscf
P: 954.4mb T: 76.1F
+# 2
<SET PARAMETER MODE>Enter password
v2.40 08-12-08 DM
<SET PARAMETER MODE>S Factor1.00000Enter a value
Operating the Analyzer
49000-02037 rev. B 10-7-10 4–5
Follow the procedure under “To change parameters in Mode 2 or Mode 3” on page 4-8 for viewing and changing any of the parameters.
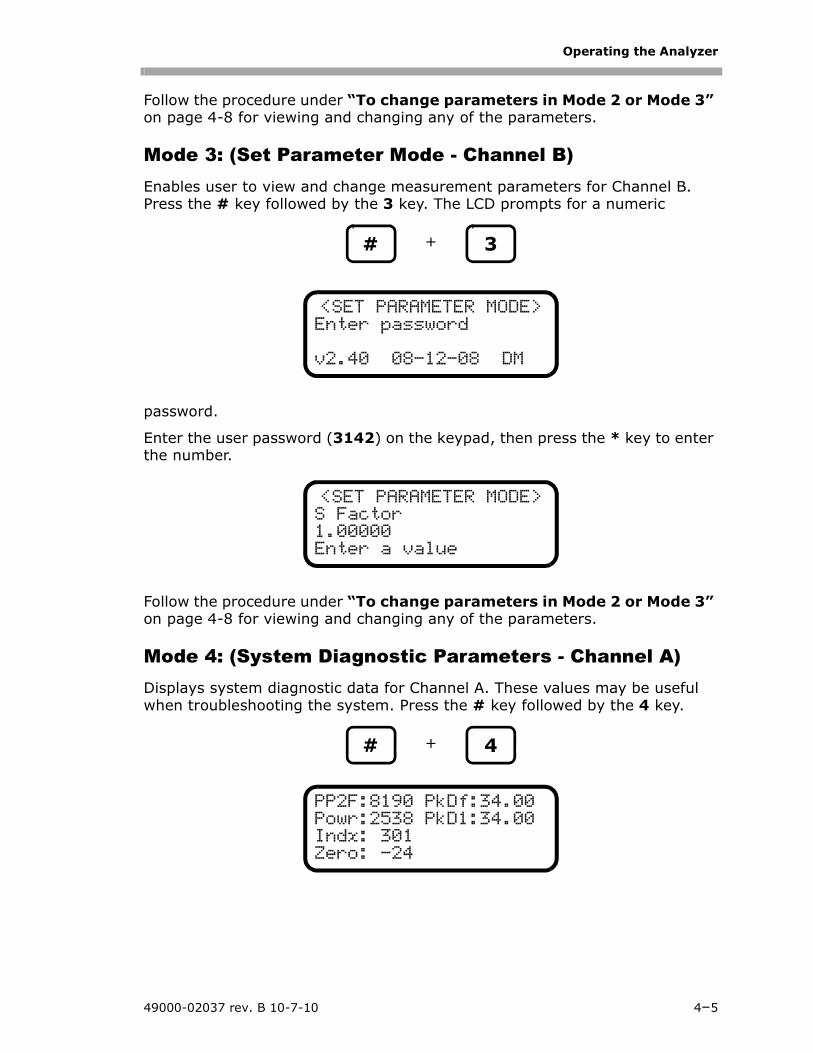
Mode 3: (Set Parameter Mode - Channel B)Enables user to view and change measurement parameters for Channel B. Press the # key followed by the 3 key. The LCD prompts for a numeric
password.
Enter the user password (3142) on the keypad, then press the * key to enter the number.
Follow the procedure under “To change parameters in Mode 2 or Mode 3” on page 4-8 for viewing and changing any of the parameters.
Mode 4: (System Diagnostic Parameters - Channel A)Displays system diagnostic data for Channel A. These values may be useful when troubleshooting the system. Press the # key followed by the 4 key.
+# 3
<SET PARAMETER MODE>Enter password
v2.40 08-12-08 DM
<SET PARAMETER MODE>S Factor1.00000Enter a value
+# 4
PP2F:8190 PkDf:34.00Powr:2538 PkD1:34.00Indx: 301Zero: -24
H2O and/or CO2 in Natural Gas
4–6 49000-02037 rev. B 10-7-10
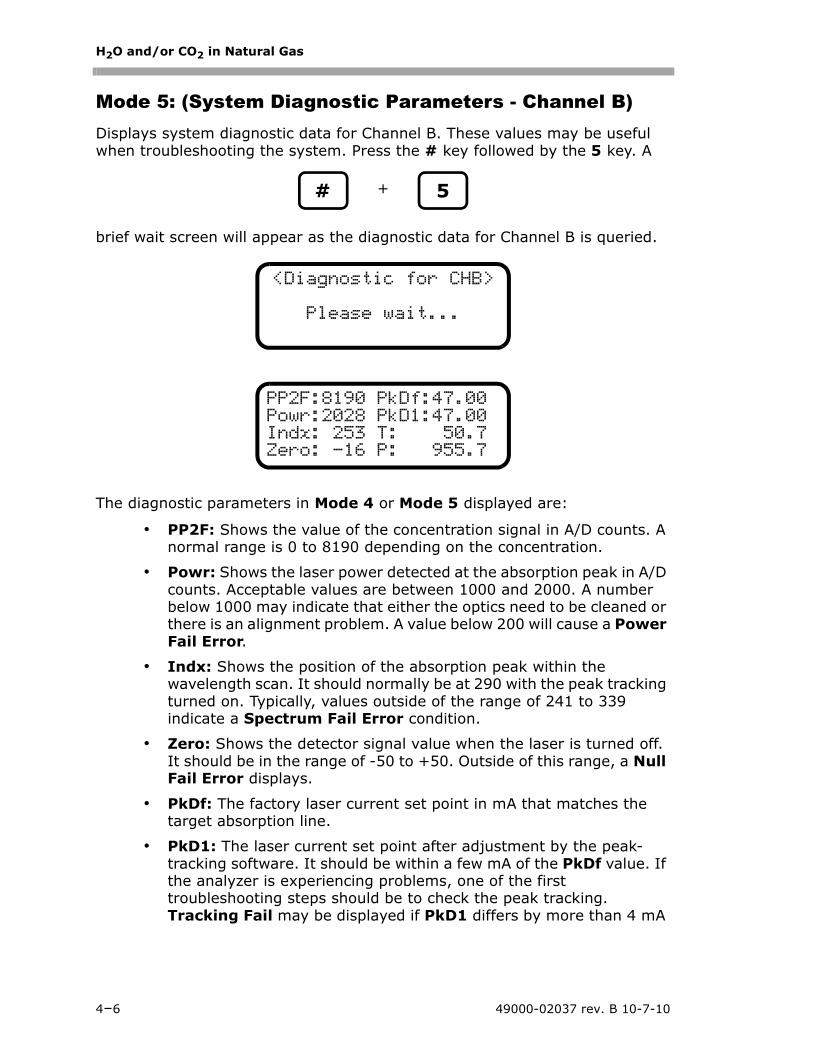
Mode 5: (System Diagnostic Parameters - Channel B)Displays system diagnostic data for Channel B. These values may be useful when troubleshooting the system. Press the # key followed by the 5 key. A
brief wait screen will appear as the diagnostic data for Channel B is queried.
The diagnostic parameters in Mode 4 or Mode 5 displayed are:
• PP2F: Shows the value of the concentration signal in A/D counts. A normal range is 0 to 8190 depending on the concentration.
• Powr: Shows the laser power detected at the absorption peak in A/D counts. Acceptable values are between 1000 and 2000. A number below 1000 may indicate that either the optics need to be cleaned or there is an alignment problem. A value below 200 will cause a Power Fail Error.
• Indx: Shows the position of the absorption peak within the wavelength scan. It should normally be at 290 with the peak tracking turned on. Typically, values outside of the range of 241 to 339 indicate a Spectrum Fail Error condition.
• Zero: Shows the detector signal value when the laser is turned off. It should be in the range of -50 to +50. Outside of this range, a Null Fail Error displays.
• PkDf: The factory laser current set point in mA that matches the target absorption line.
• PkD1: The laser current set point after adjustment by the peak-tracking software. It should be within a few mA of the PkDf value. If the analyzer is experiencing problems, one of the first troubleshooting steps should be to check the peak tracking.Tracking Fail may be displayed if PkD1 differs by more than 4 mA
+# 5
<Diagnostic for CHB>
Please wait...
PP2F:8190 PkDf:47.00Powr:2028 PkD1:47.00Indx: 253 T: 50.7Zero: -16 P: 955.7
Operating the Analyzer
49000-02037 rev. B 10-7-10 4–7
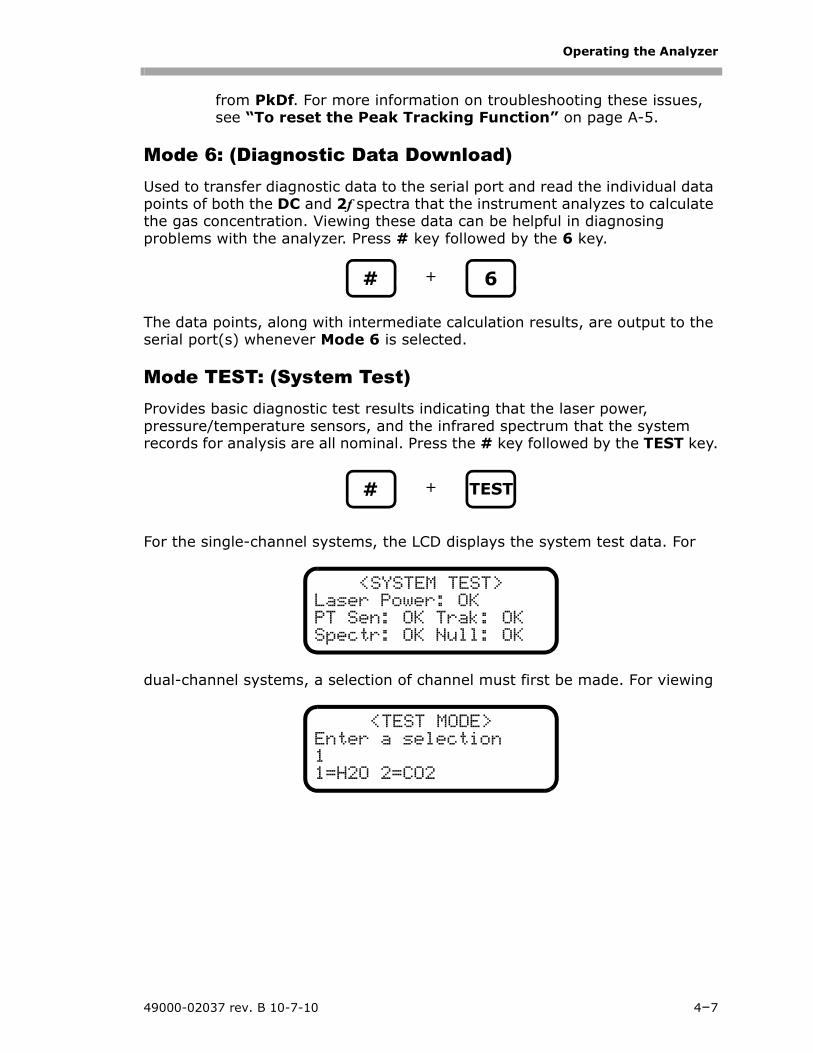
from PkDf. For more information on troubleshooting these issues, see “To reset the Peak Tracking Function” on page A-5.
Mode 6: (Diagnostic Data Download)Used to transfer diagnostic data to the serial port and read the individual data points of both the DC and 2f spectra that the instrument analyzes to calculate the gas concentration. Viewing these data can be helpful in diagnosing problems with the analyzer. Press # key followed by the 6 key.
The data points, along with intermediate calculation results, are output to the serial port(s) whenever Mode 6 is selected.
Mode TEST: (System Test)Provides basic diagnostic test results indicating that the laser power, pressure/temperature sensors, and the infrared spectrum that the system records for analysis are all nominal. Press the # key followed by the TEST key.
For the single-channel systems, the LCD displays the system test data. For
dual-channel systems, a selection of channel must first be made. For viewing
+# 6
+# TEST
<SYSTEM TEST>Laser Power: OKPT Sen: OK Trak: OKSpectr: OK Null: OK
<TEST MODE>Enter a selection11=H2O 2=CO2

H2O and/or CO2 in Natural Gas
4–8 49000-02037 rev. B 10-7-10
the Channel A data, press the 1 key followed by the * key. For viewing the
Channel B data, press the 2 key followed by the * key.
Changing Measurement and Control ParametersIn Mode 2 or Mode 3, all of the pertinent measurement and control parameters can be viewed and changed. Refer to Table 4–1 for a list of parameters and value ranges.
To change parameters in Mode 2 or Mode 3:1. Press the # key followed by the 2 (Mode 2 - Ch. A) or 3 (Mode 3 -
Ch. B) key. The LCD prompts for a numeric password.
2. Enter the user password (3142) on the keypad, then press the * key to enter the number.
3. Starting with the first parameter, enter a new value and/or press the * key to store the value and cycle to the next parameter.
4. When finished changing or viewing the measurement and control parameters, press the # key followed by the 1 key to return to Mode 1 and normal operation.
<H2O SYSTEM TEST>Laser Power: OKPT Sen: OK Trak: OKSpectr: OK Null: OK
<CO2 SYSTEM TEST>Laser Power: OKPT Sen: OK Trak: OKSpectr: OK Null: OK
<SET PARAMETER MODE>Enter password
v2.40 08-12-08 DM
<SET PARAMETER MODE>S Factor1.00000Enter a value

Operating the Analyzer
49000-02037 rev. B 10-7-10 4–9
Table 4–1 Measurement and control parameters.
Parameter Setting Function
S Factor User Set-99 – 99Default = 1
Analyzer response adjustment to match calibration standard in the field.
S Factor Offset User Set-999999 – 999999Default = 0
Analyzer offset adjustment to match calibration standard in the field.
# Spectrum Average 1 – 240Default = 4
Sets the number of scans averaged for each measurement
Logger Rate 1 – 300 readingsDefault = 4
Sets the number of measurements to include in a running average
Peak Tracking 0, 1, 2 Sets peak tracking capability to off, on, or reset
DO Alarm Delay Not applicable for SS500/SS2000/SS3000
Low Power Warning User Set200 – 4999Default = 200
Sets the DC power level below which the analyzer will issue a Low Power Warning
DO Alarm Setup Not applicable for SS500/SS2000/SS3000
Alarm Setpoint Not applicable for SS500/SS2000/SS3000
4-20 mA Alarm Action 0, 1, 2 or 3 Sets the current loop state upon alarm condition
4-20 mA % Test 0 – 101 Sets the 4-20 mA output to a per-centage of full scale
4 mA Value 0 – 999999 Sets the ppmv value that will corre-spond to 4 mA
20 mA Value 0 – 999999 Sets the ppmv value that will corre-spond to 20 mA
Temperature Unit 0 or 1 Sets the display unit for tempera-ture
Pressure Unit 0, 1, 2, or 3 Sets the display unit for pressure
Concentration Unit 0, 1 or 2 Sets the display unit for concentra-tion
Pipeline Pressure 0 – 999999 Sets pipeline pressure used to cal-culate dew point
Modbus Address User Set0 – 250
Sets Modbus address for the ana-lyzer
Modbus Mode User Set0, 1, or 2
Sets type of Modbus protocol
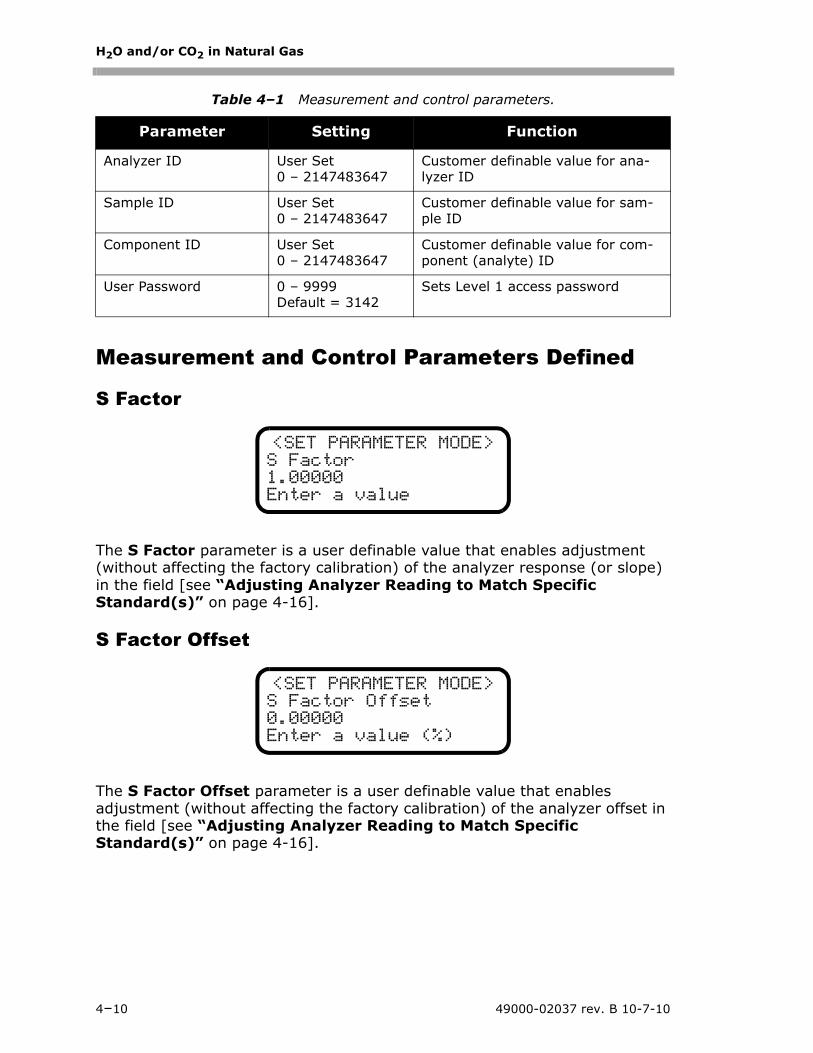
H2O and/or CO2 in Natural Gas
4–10 49000-02037 rev. B 10-7-10
Measurement and Control Parameters Defined
S Factor
The S Factor parameter is a user definable value that enables adjustment (without affecting the factory calibration) of the analyzer response (or slope) in the field [see “Adjusting Analyzer Reading to Match Specific Standard(s)” on page 4-16].
S Factor Offset
The S Factor Offset parameter is a user definable value that enables adjustment (without affecting the factory calibration) of the analyzer offset in the field [see “Adjusting Analyzer Reading to Match Specific Standard(s)” on page 4-16].
Analyzer ID User Set0 – 2147483647
Customer definable value for ana-lyzer ID
Sample ID User Set0 – 2147483647
Customer definable value for sam-ple ID
Component ID User Set0 – 2147483647
Customer definable value for com-ponent (analyte) ID
User Password 0 – 9999Default = 3142
Sets Level 1 access password
Table 4–1 Measurement and control parameters.
Parameter Setting Function
<SET PARAMETER MODE>S Factor1.00000Enter a value
<SET PARAMETER MODE>S Factor Offset0.00000Enter a value (%)
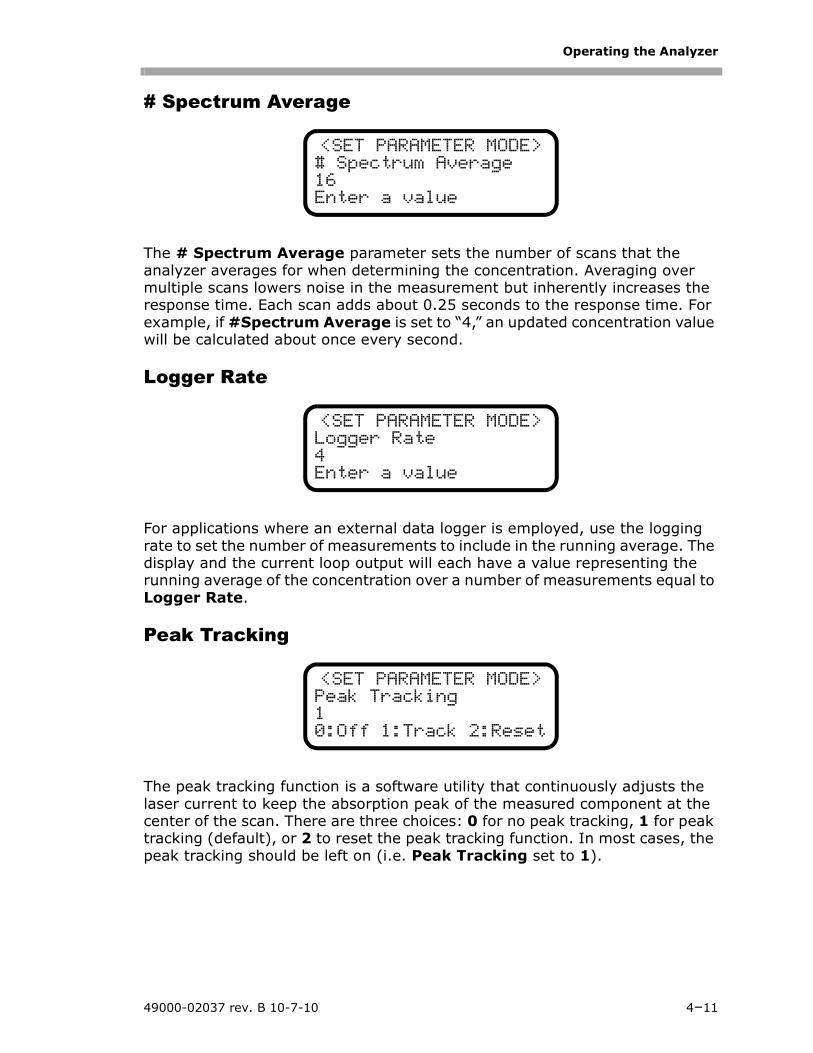
Operating the Analyzer
49000-02037 rev. B 10-7-10 4–11
# Spectrum Average
The # Spectrum Average parameter sets the number of scans that the analyzer averages for when determining the concentration. Averaging over multiple scans lowers noise in the measurement but inherently increases the response time. Each scan adds about 0.25 seconds to the response time. For example, if #Spectrum Average is set to “4,” an updated concentration value will be calculated about once every second.
Logger Rate
For applications where an external data logger is employed, use the logging rate to set the number of measurements to include in the running average. The display and the current loop output will each have a value representing the running average of the concentration over a number of measurements equal to Logger Rate.
Peak Tracking
The peak tracking function is a software utility that continuously adjusts the laser current to keep the absorption peak of the measured component at the center of the scan. There are three choices: 0 for no peak tracking, 1 for peak tracking (default), or 2 to reset the peak tracking function. In most cases, the peak tracking should be left on (i.e. Peak Tracking set to 1).
<SET PARAMETER MODE># Spectrum Average16Enter a value
<SET PARAMETER MODE>Logger Rate4Enter a value
<SET PARAMETER MODE>Peak Tracking10:Off 1:Track 2:Reset

H2O and/or CO2 in Natural Gas
4–12 49000-02037 rev. B 10-7-10
Low Power Warning
The Low Power Warning parameter sets the level at which the analyzer will issue a Low Power Warning.
4-20 mA Alarm Action
The 4-20 mA Alarm Action parameter determines the current loop state upon an alarm condition. Enter 0 (low) for the current loop to assume a low state (4 mA), 1 (high) for the current loop to assume a high state (20 mA), 2 (track and hold) for the current loop to hold the last valid measurement value, or 3 (no control) for the current loop to continue to track the concentration value upon an alarm condition.
4-20 mA % Test
The 4-20 mA % Test parameter enables keypad control of the current loop output for testing and calibration purposes. The value entered represents a percent of scale value where zero equals 4 mA and full scale equals 20 mA. Thus, the current loop output, i, is given by
,
where R is the 4-20 mA % Test parameter value. Entering 101 turns off the keypad control of the current loop and returns to the current loop output tracking the concentration value.
<SET PARAMETER MODE>Low Power Warning4Enter a value
<SET PARAMETER MODE>4-20 mA Alarm Action00:L 1:H 2:T&H 3:None
<SET PARAMETER MODE>4-20 mA % Test101Enter a % (101=Off)
i R= 20 mA 4 mA–( ) 4 mA+

Operating the Analyzer
49000-02037 rev. B 10-7-10 4–13
4 mA Value
The 4 mA Value parameter sets the concentration value [in ppmv or dew-point temperature (in temperature units selected with the Temperature Unit parameter)] that corresponds to 4 mA on the current loop output. Typically this will be 0.000.
20 mA Value
The 20 mA Value parameter sets the concentration value [in ppmv or dew-point temperature (in temperature units selected with the Temperature Unit parameter)] that corresponds to 20 mA on the current loop output. Typically this will be the full-scale value for which the analyzer was calibrated.
Temperature Unit
The Temperature Unit parameter designates the display units for the measured cell temperature. There are two choices: 0 for degrees Celsius and 1 for Fahrenheit. The default value is the standard unit of measurement in the region the analyzer is being used.
<SET PARAMETER MODE>4 mA Value0.00000ppmv or DewPoint F/C
<SET PARAMETER MODE>20 mA Value100.000ppmv or DewPoint F/C
<SET PARAMETER MODE>Temperature Unit00:C 1:F

H2O and/or CO2 in Natural Gas
4–14 49000-02037 rev. B 10-7-10
Pressure Unit
The Pressure Unit parameter designates the display units for the measured absolute pressure in the cell. There are four choices: 0 for millibar, 1 for Torr, 2 for kPa, and 3 for psia.
Concentration Unit
The Concentration Unit parameter designates the display units for the measured concentration. There are three choices: 0 for ppmv, 1 for lb/MMscf, and 2 (moisture systems only) for dew point (calculated at the Pipeline Pressure set below and displayed in the Temperature Unit set above). For percentage level analyzers, the choices are: 0 for ppmv and 1 for %.
For moiusture systems, adding a 1 in front of the display unit value assigns dew point to the 4-20 mA output. For example, a value of 10 would display ppmv on the LCD, but the value of the 4-20 mA output would correspond to dew point, scaled according to the minimum and maximum values set with 4 mA Value and 20 mA Value, respectively.
Pipeline Pressure (if applicable)
On moisture systems, the Pipeline Pressure parameter sets the pressure (in mbar) for the calculation of dew point.
<SET PARAMETER MODE>Pressure Unit
0:mb1:Torr2:Pa3:psia
<SET PARAMETER MODE>Concentration Unit00:ppmv 1:lb 2:DP
<SET PARAMETER MODE>Pipeline Pressure0.00000Enter a value

Operating the Analyzer
49000-02037 rev. B 10-7-10 4–15
Modbus Address
The Modbus Address parameter sets the analyzer address for when the analyzer is used as a Modbus device. Addresses from 1 to 250 can be used.
Modbus Mode
The Modbus Mode parameter sets the communications protocol for the RS232 port. There are three choices: 0 for turning the Modbus capabilities off and defaulting to generic serial output as described in “Receiving Serial Data (RS-232 Output)” on page 7-1; 1 for enabling the analyzer to respond to Gould Modbus RTU function codes 3, 6 and 16; and 2 for enabling the analyzer to respond to Daniel Modbus RTU function codes 3, 6 and 16.
User Analyzer ID
The User Analyzer ID parameter assigns a numeric identification to the data enabling SCADA or DCS systems to associate data with a particular analyzer.
<SET PARAMETER MODE>Modbus Address1Enter a value(1-250)
<SET PARAMETER MODE>Modbus Mode00:Off 1:GMR 2:DMR
<SET PARAMETER MODE>User Analyzer ID0Enter a value
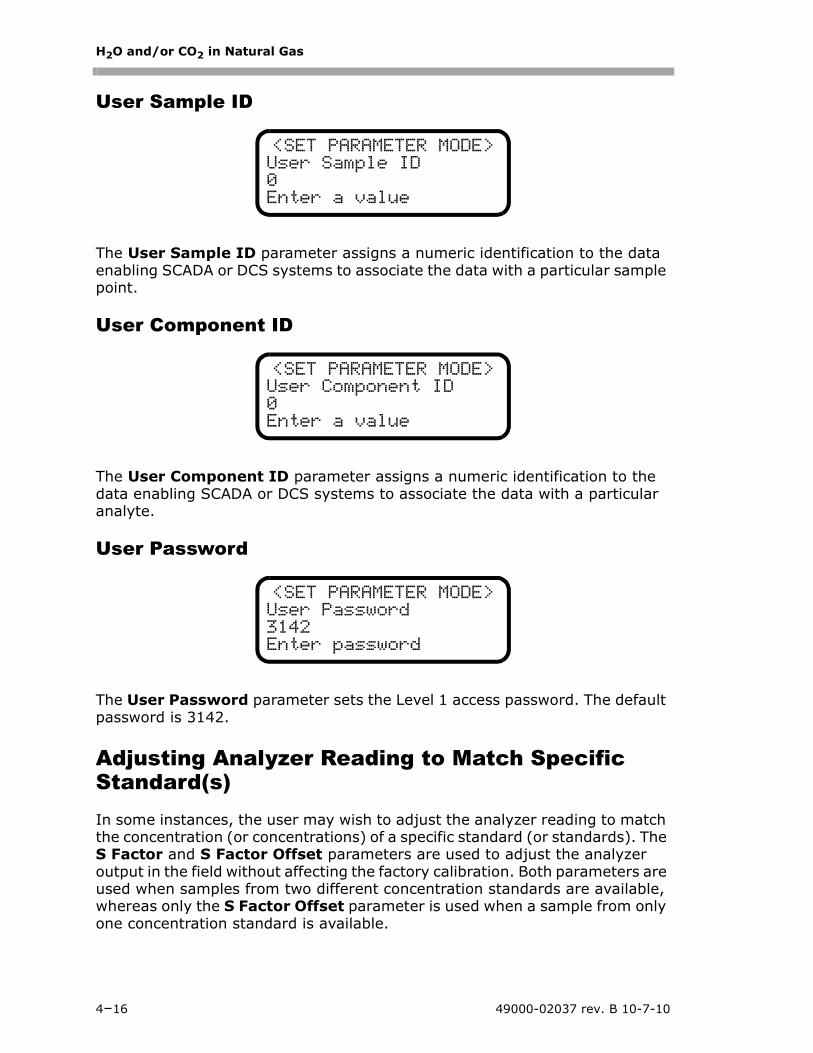
H2O and/or CO2 in Natural Gas
4–16 49000-02037 rev. B 10-7-10
User Sample ID
The User Sample ID parameter assigns a numeric identification to the data enabling SCADA or DCS systems to associate the data with a particular sample point.
User Component ID
The User Component ID parameter assigns a numeric identification to the data enabling SCADA or DCS systems to associate the data with a particular analyte.
User Password
The User Password parameter sets the Level 1 access password. The default password is 3142.
Adjusting Analyzer Reading to Match Specific Standard(s)In some instances, the user may wish to adjust the analyzer reading to match the concentration (or concentrations) of a specific standard (or standards). The S Factor and S Factor Offset parameters are used to adjust the analyzer output in the field without affecting the factory calibration. Both parameters are used when samples from two different concentration standards are available, whereas only the S Factor Offset parameter is used when a sample from only one concentration standard is available.
<SET PARAMETER MODE>User Sample ID0Enter a value
<SET PARAMETER MODE>User Component ID0Enter a value
<SET PARAMETER MODE>User Password3142Enter password
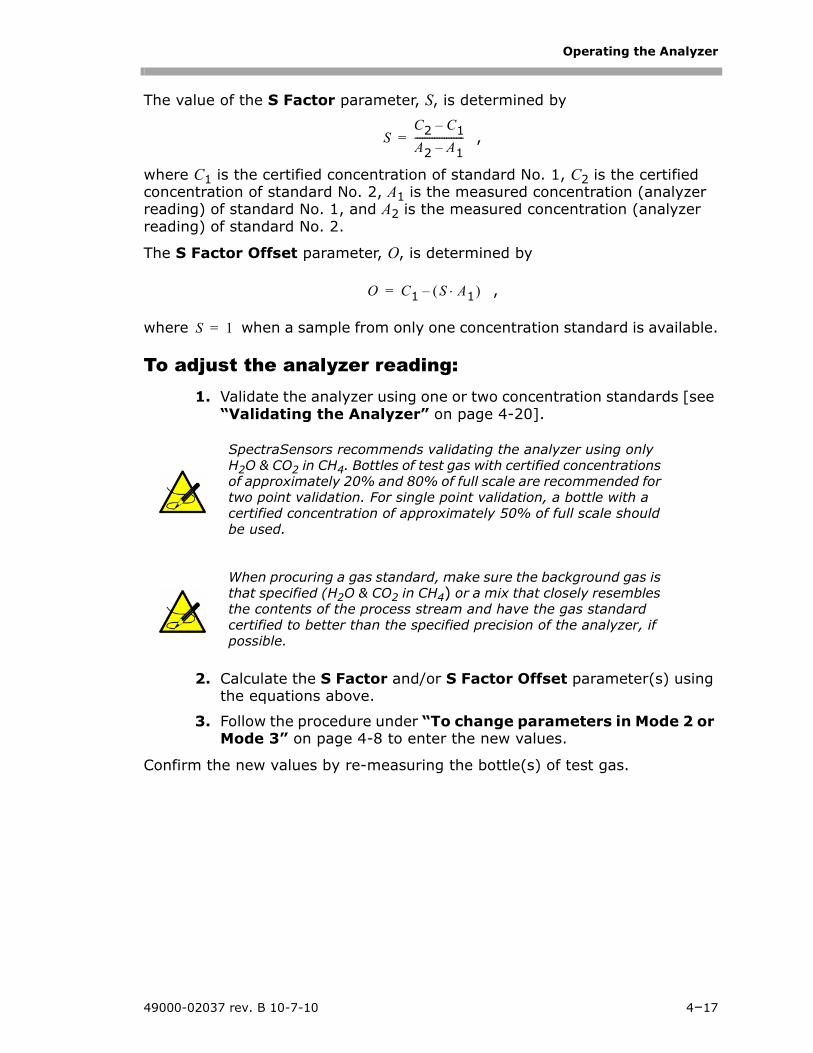
Operating the Analyzer
49000-02037 rev. B 10-7-10 4–17
The value of the S Factor parameter, S, is determined by
,
where C1 is the certified concentration of standard No. 1, C2 is the certified concentration of standard No. 2, A1 is the measured concentration (analyzer reading) of standard No. 1, and A2 is the measured concentration (analyzer reading) of standard No. 2.
The S Factor Offset parameter, O, is determined by
,
where when a sample from only one concentration standard is available.
To adjust the analyzer reading:1. Validate the analyzer using one or two concentration standards [see
“Validating the Analyzer” on page 4-20].
2. Calculate the S Factor and/or S Factor Offset parameter(s) using the equations above.
3. Follow the procedure under “To change parameters in Mode 2 or Mode 3” on page 4-8 to enter the new values.
Confirm the new values by re-measuring the bottle(s) of test gas.
SpectraSensors recommends validating the analyzer using only H2O & CO2 in CH4. Bottles of test gas with certified concentrations of approximately 20% and 80% of full scale are recommended for two point validation. For single point validation, a bottle with a certified concentration of approximately 50% of full scale should be used.
When procuring a gas standard, make sure the background gas is that specified (H2O & CO2 in CH4) or a mix that closely resembles the contents of the process stream and have the gas standard certified to better than the specified precision of the analyzer, if possible.
SC2 C1–A2 A1–--------------------=
O C1 S A1⋅( )–=
S 1=

H2O and/or CO2 in Natural Gas
4–18 49000-02037 rev. B 10-7-10
Scaling and Calibrating the Current Loop SignalThe 4-20 mA current loop signal is most conveniently scaled and calibrated at the receiving end (RTU, flow computer, etc.). To scale the receiver’s output, the
analyzer’s current loop output is set to 4 mA and 20 mA and the receiver is adjusted to read “0” and “Full Scale,” respectively.
To scale the current loop signal:1. Make sure the current loop to be adjusted is connected and the
receiver is set for the 4-20 mA board to source the current.
2. Set the current loop output to 4 mA by setting the 4-20 mA % Test parameter to zero (see “To change parameters in Mode 2 or Mode 3” on page 4-8).
3. Adjust the receiver calibration control to read the appropriate value. The current loop output of 4 mA corresponds to the concentration value set by the 4 mA Value parameter.
4. Set the current loop output to 20 mA by setting the 4-20 mA % Test parameter to 100.
5. Adjust the receiver calibration control to read the appropriate value. The current loop output of 20 mA corresponds to the concentration value set by the 20 mA Value parameter.
6. If desired, repeat by setting the 4-20 mA % Test parameter, R, to any value between 0 and 100 and confirm that the output, i, agrees with .
7. When finished, reset the 4-20 mA % Test parameter to 101.
Warnings• Low Power Warning: this warning occurs when the Ch. A DC signal
drops below the level set by the Low Power Warning parameter.
• Low Power Warning B: this warning occurs when the Ch. B DC signal drops below the level set by the Low Power Warning parameter.
The 4-20 mA current loop is factory set as the source unless otherwise specified. Contact your sales representative if a change is required.
Be sure to work in a non-hazardous area while handling any electrical connector.
i R= 20 mA 4 mA–( ) 4 mA+
Operating the Analyzer
49000-02037 rev. B 10-7-10 4–19
Faults/AlarmsAlarm and fault messages appear on the front panel LCD. The General Fault Alarm is triggered by system faults which cause the current loop to respond according to the 4-20 mA Alarm Action setting. System faults include one or more of the following:
• Power Fail Error: this fault occurs when the DC signal becomes too weak for a reliable measurement typically as a result of mirror contamination.
• Null Fail Error: this fault occurs if the detector signal value is out of the range of -50 to +50 when the laser is turned off.
• Spectrum Fail Error: this fault occurs when the system is unable to adequately fit a curve to the measured signal typically as a result of DC signal saturation in the absence of absorbing gas in the measurement cell, too much noise in the signal or an unexpected gas mixture in the measurement cell.
• PT Fail Error: this fault occurs when the pressure and/or temperature in the Ch. A measurement cell exceeds the specified maximum operating levels.
• Track Fail Error: this fault occurs when the Ch. A peak tracking function is out of range [PkDf (factory set midpoint) and PkD1 (peak track midpoint) differ by more than 4 counts].
• Power Fail Error B: this fault occurs when the Ch. B DC signal becomes too weak for a reliable measurement typically as a result of mirror contamination.
• Null Fail Error B: this fault occurs if the Ch. B detector signal value is out of the range of -50 to +50 when the laser is turned off.
• Spectrum Fail Err B: this fault occurs when the system is unable to adequately fit a curve to the measured Ch. B signal typically as a result of DC signal saturation in the absence of absorbing gas in the measurement cell, too much noise in the signal or an unexpected gas mixture in the measurement cell.
• PT Fail Error B: this fault occurs when the pressure and/or temperature in the Ch. B measurement cell exceeds the specified maximum operating levels.
• Track Fail Error B: this fault occurs when the Ch. B peak tracking function is out of range [PkDf (factory set midpoint) and PkD1 (peak track midpoint) differ by more than 4 counts].
See Appendix B for recommendations and solutions to common problems resulting in a system fault.
H2O and/or CO2 in Natural Gas
4–20 49000-02037 rev. B 10-7-10
Validating the AnalyzerValidation of the analyzer using an appropriate gas standard can be done manually on systems equipped with a check gas or validation gas port.
To validate manually (if applicable):1. Connect a bottle of validation gas to the check gas or validation gas
port (at the specified supply pressure).
2. Switch the check gas or validation gas valve to validation gas.
3. Adjust the sample flowmeter metering valve to the specified flow for the measurement cell.
4. Make a measurement after the gas flows for approximately five minutes or when the values on the LCDs settle.
5. After validation, switch the check gas or validation gas valve back to sample flow.
6. Adjust the sample flowmeter metering valve to the specified flow for the measurement cell and to return to normal operation.
SpectraSensors recommends validating the analyzer using only H2O in CH4. Bottles of test gas with certified concentrations of approximately 20% and 80% of full scale should be used for two point validation. For single point validation, a bottle with a certified concentration of approximately 50% of full scale should be used.
Calibrating the AnalyzerCalibrating the analyzer is typically not required under normal circumstances. SpectraSensors calibrates each analyzer to a National Institute of Standards
The adjustment setpoints of the analyzer flowmeters and pressure regulators will be interactive and may require readjustment multiple times until the final setpoints are obtained.
The analyzer system has been designed for the sample flow rate specified. A lower than specified sample flow rate may adversely affect analyzer performance. If you are unable to attain the specified sample flow rate, contact your factory sales representative.
When procuring a gas standard, make sure the background gas is that specified (H2O in CH4 or CO2 in CH4) or a mix that closely resembles the contents of the process stream and have the gas standard certified to better than the specified precision of the analyzer, if possible.

Operating the Analyzer
49000-02037 rev. B 10-7-10 4–21
and Technology (NIST) traceable standard before shipping the unit to the end user. Because SpectraSensors analyzers use a non-contact form of measurement, they are relatively insensitive to contamination, are quite rugged and virtually maintenance free ensuring years of reliable service.

H2O and/or CO2 in Natural Gas
4–22 49000-02037 rev. B 10-7-10
THIS PAGE INTENTIONALLY LEFT BLANK
SS500/SS2000/SS3000 Operator’s Manual 5–1
5 - SERIAL PORT COMMUNICATIONS
Receiving Serial Data (RS-232 Output)When the Modbus Mode parameter is set to 0, the analyzer is configured to transfer a string of data from the analyzer to a serial device via the RS-232 output. The receiving device is typically a computer terminal running HyperTerminal, which is a program included with Microsoft® Windows® 95, 98, & XP that enables serial communication and the viewing, capturing and storage of serial port data and messages.
To launch HyperTerminal:1. On your Windows desktop, click Start followed by Run (usually
located in the lower right side of the Start Menu).
2. Type Hypertrm.exe and hit Return to launch HyperTerminal.
3. Once HyperTerminal is activated, the Connection Description window appears, as shown in Figure 5–1. Type in a Filename (where the terminal session settings will be stored for future recall) and click on any icon. Click OK.
4. The Connect To window appears prompting for a connection, as shown in Figure 5–2. Click the Menu Arrow under Connect Using to view the choices.
5. Click on the appropriate port to which your analyzer is connected (COM1, COM2, COM3, etc.) as established under “Connecting the Output Signals” on page 2-5. Click OK.
6. Once the port is chosen, the COM Properties window appears. Make sure the COM properties for the port selected reflect those shown in Figure 5–3 (9600 baud, 8 data bits, 1 stop bit, no parity, and no flow control).
7. Click OK to establish the connection.
Once connected, the data will start streaming through the Hyperterminal Window as shown in Figure 5–4.
For quicker access to HyperTerminal, save a HyperTerminal shortcut to the desktop.
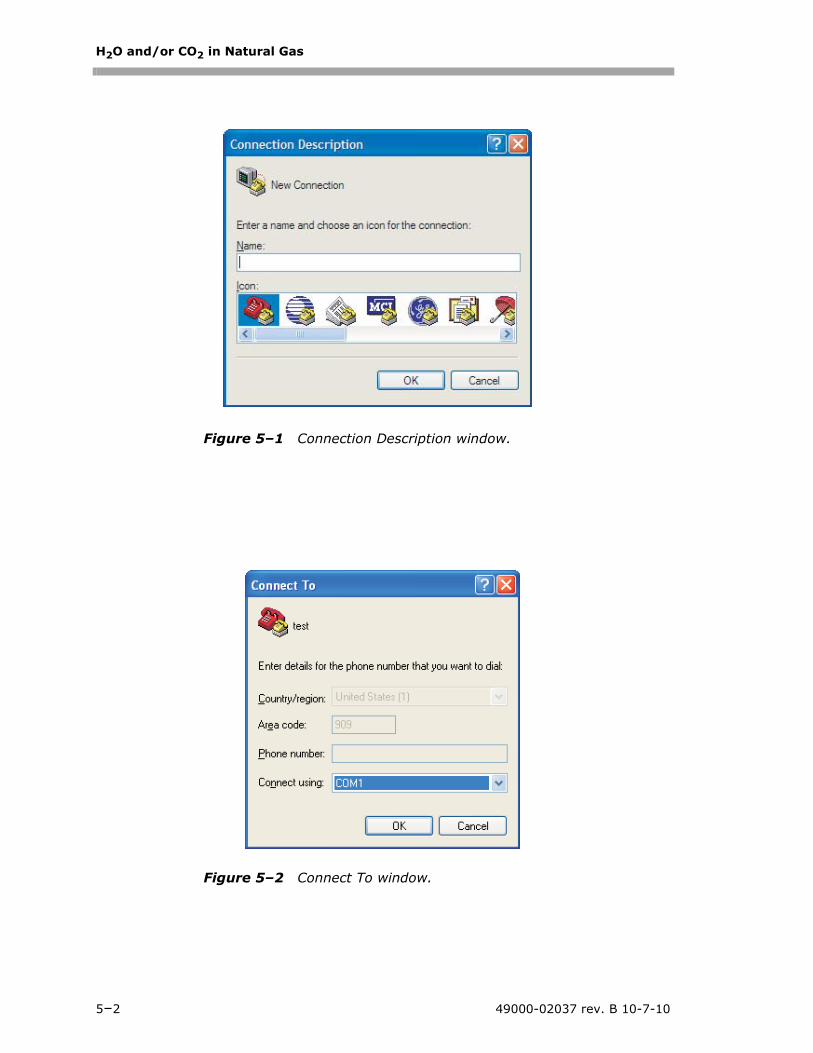
H2O and/or CO2 in Natural Gas
5–2 49000-02037 rev. B 10-7-10
Figure 5–1 Connection Description window.
Figure 5–2 Connect To window.
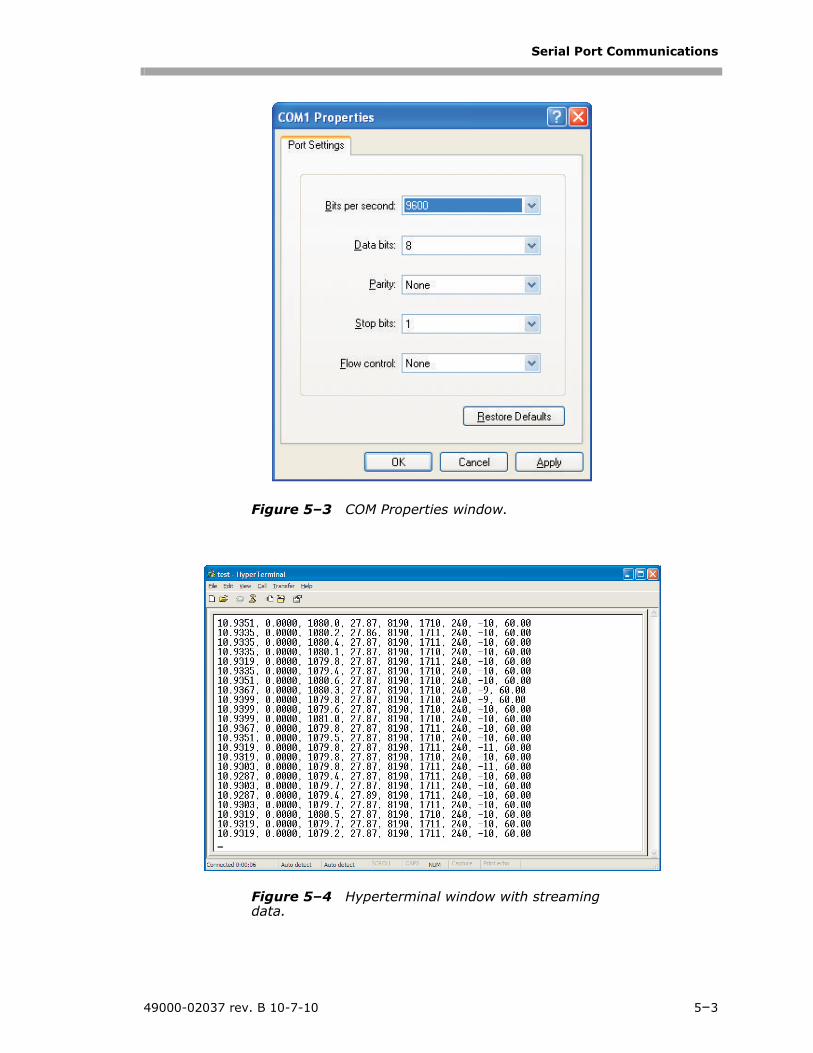
Serial Port Communications
49000-02037 rev. B 10-7-10 5–3
Figure 5–3 COM Properties window.
Figure 5–4 Hyperterminal window with streaming data.
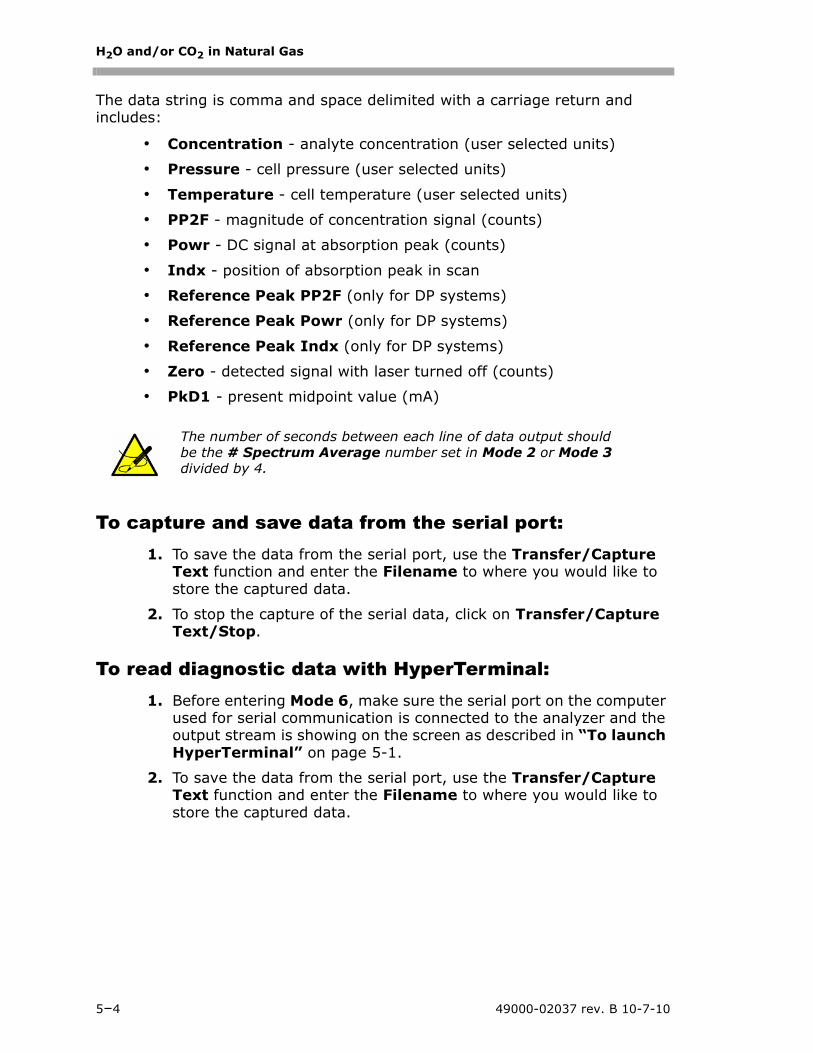
H2O and/or CO2 in Natural Gas
5–4 49000-02037 rev. B 10-7-10
The data string is comma and space delimited with a carriage return and includes:
• Concentration - analyte concentration (user selected units)
• Pressure - cell pressure (user selected units)
• Temperature - cell temperature (user selected units)
• PP2F - magnitude of concentration signal (counts)
• Powr - DC signal at absorption peak (counts)
• Indx - position of absorption peak in scan
• Reference Peak PP2F (only for DP systems)
• Reference Peak Powr (only for DP systems)
• Reference Peak Indx (only for DP systems)
• Zero - detected signal with laser turned off (counts)
• PkD1 - present midpoint value (mA)
To capture and save data from the serial port:1. To save the data from the serial port, use the Transfer/Capture
Text function and enter the Filename to where you would like to store the captured data.
2. To stop the capture of the serial data, click on Transfer/Capture Text/Stop.
To read diagnostic data with HyperTerminal:1. Before entering Mode 6, make sure the serial port on the computer
used for serial communication is connected to the analyzer and the output stream is showing on the screen as described in “To launch HyperTerminal” on page 5-1.
2. To save the data from the serial port, use the Transfer/Capture Text function and enter the Filename to where you would like to store the captured data.
The number of seconds between each line of data output should be the # Spectrum Average number set in Mode 2 or Mode 3 divided by 4.
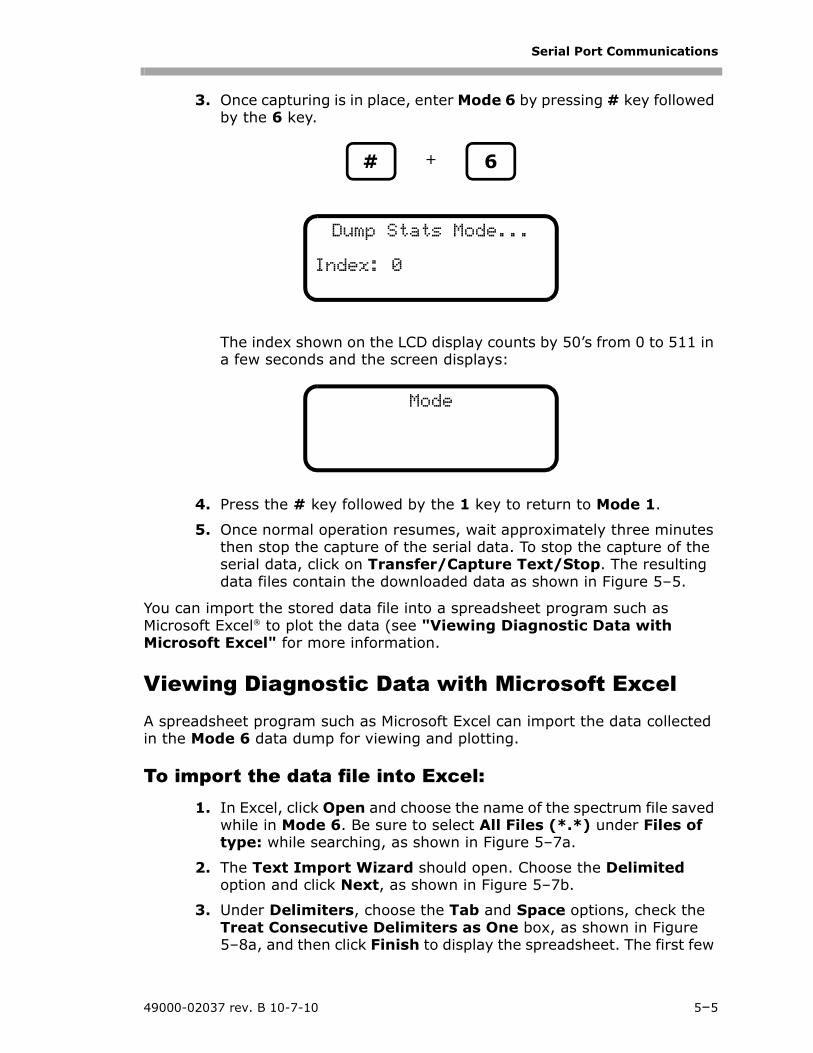
Serial Port Communications
49000-02037 rev. B 10-7-10 5–5
3. Once capturing is in place, enter Mode 6 by pressing # key followed by the 6 key.
The index shown on the LCD display counts by 50’s from 0 to 511 in a few seconds and the screen displays:
4. Press the # key followed by the 1 key to return to Mode 1.
5. Once normal operation resumes, wait approximately three minutes then stop the capture of the serial data. To stop the capture of the serial data, click on Transfer/Capture Text/Stop. The resulting data files contain the downloaded data as shown in Figure 5–5.
You can import the stored data file into a spreadsheet program such as Microsoft Excel® to plot the data (see "Viewing Diagnostic Data with Microsoft Excel" for more information.
Viewing Diagnostic Data with Microsoft ExcelA spreadsheet program such as Microsoft Excel can import the data collected in the Mode 6 data dump for viewing and plotting.
To import the data file into Excel:1. In Excel, click Open and choose the name of the spectrum file saved
while in Mode 6. Be sure to select All Files (*.*) under Files of type: while searching, as shown in Figure 5–7a.
2. The Text Import Wizard should open. Choose the Delimited option and click Next, as shown in Figure 5–7b.
3. Under Delimiters, choose the Tab and Space options, check the Treat Consecutive Delimiters as One box, as shown in Figure 5–8a, and then click Finish to display the spreadsheet. The first few
+# 6
Dump Stats Mode...
Index: 0
Mode
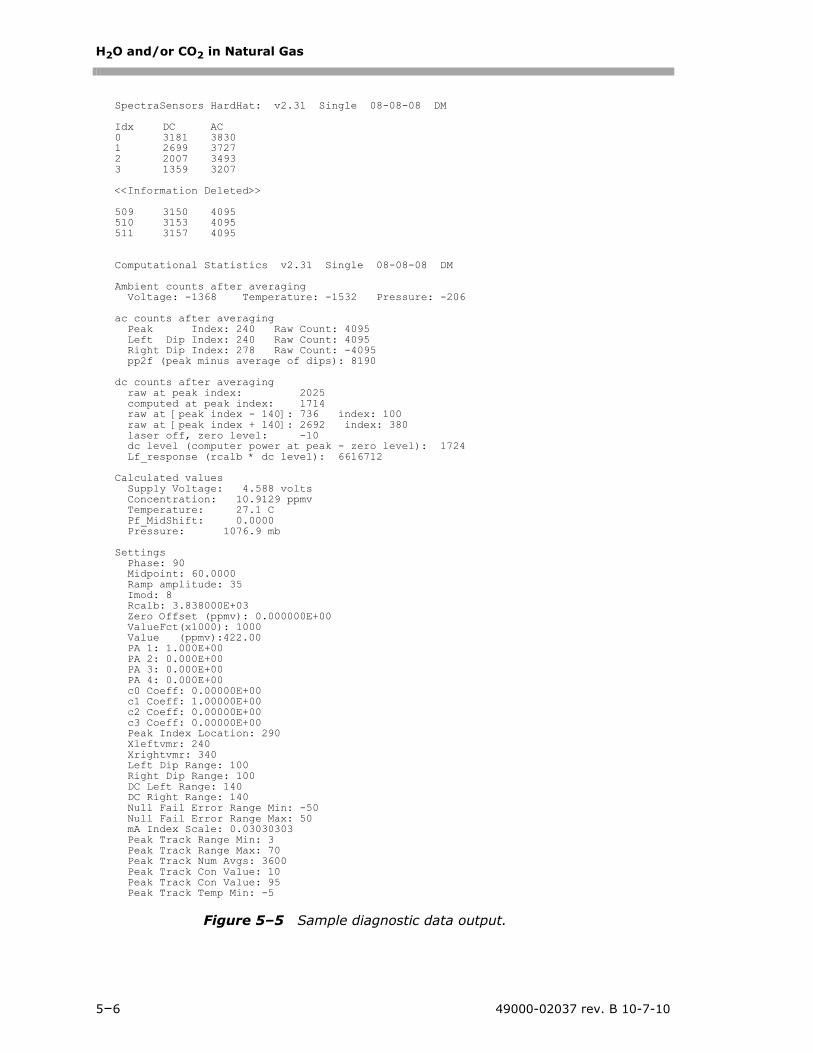
H2O and/or CO2 in Natural Gas
5–6 49000-02037 rev. B 10-7-10
Figure 5–5 Sample diagnostic data output.
SpectraSensors HardHat: v2.31 Single 08-08-08 DM
Idx DC AC 0 3181 3830 1 2699 3727 2 2007 3493 3 1359 3207
<<Information Deleted>>
509 3150 4095 510 3153 4095 511 3157 4095
Computational Statistics v2.31 Single 08-08-08 DM
Ambient counts after averaging Voltage: -1368 Temperature: -1532 Pressure: -206
ac counts after averaging Peak Index: 240 Raw Count: 4095 Left Dip Index: 240 Raw Count: 4095 Right Dip Index: 278 Raw Count: -4095 pp2f (peak minus average of dips): 8190
dc counts after averaging raw at peak index: 2025 computed at peak index: 1714 raw at [peak index - 140]: 736 index: 100 raw at [peak index + 140]: 2692 index: 380 laser off, zero level: -10 dc level (computer power at peak - zero level): 1724 Lf_response (rcalb * dc level): 6616712
Calculated values Supply Voltage: 4.588 volts Concentration: 10.9129 ppmv Temperature: 27.1 C Pf_MidShift: 0.0000 Pressure: 1076.9 mb
Settings Phase: 90 Midpoint: 60.0000 Ramp amplitude: 35 Imod: 8 Rcalb: 3.838000E+03 Zero Offset (ppmv): 0.000000E+00 ValueFct(x1000): 1000 Value (ppmv):422.00 PA 1: 1.000E+00 PA 2: 0.000E+00 PA 3: 0.000E+00 PA 4: 0.000E+00 c0 Coeff: 0.00000E+00 c1 Coeff: 1.00000E+00 c2 Coeff: 0.00000E+00 c3 Coeff: 0.00000E+00 Peak Index Location: 290 Xleftvmr: 240 Xrightvmr: 340 Left Dip Range: 100 Right Dip Range: 100 DC Left Range: 140 DC Right Range: 140 Null Fail Error Range Min: -50 Null Fail Error Range Max: 50 mA Index Scale: 0.03030303 Peak Track Range Min: 3 Peak Track Range Max: 70 Peak Track Num Avgs: 3600 Peak Track Con Value: 10 Peak Track Con Value: 95 Peak Track Temp Min: -5
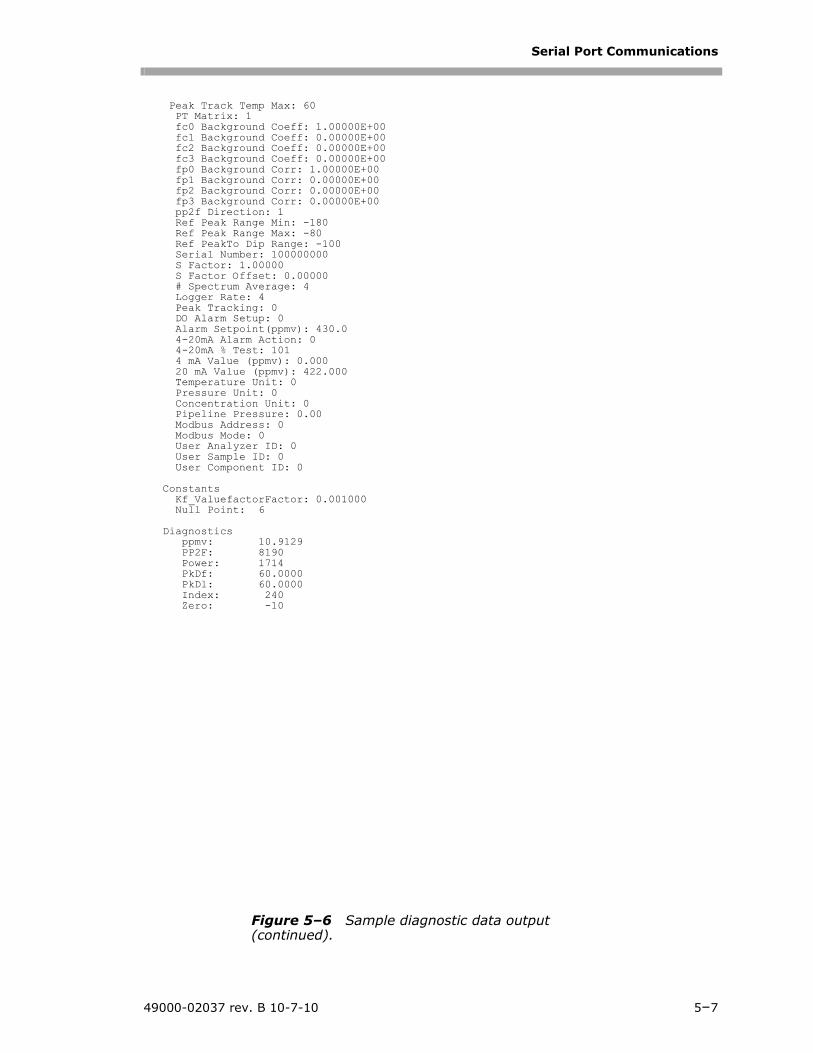
Serial Port Communications
49000-02037 rev. B 10-7-10 5–7
Figure 5–6 Sample diagnostic data output (continued).
Peak Track Temp Max: 60 PT Matrix: 1 fc0 Background Coeff: 1.00000E+00 fc1 Background Coeff: 0.00000E+00 fc2 Background Coeff: 0.00000E+00 fc3 Background Coeff: 0.00000E+00 fp0 Background Corr: 1.00000E+00 fp1 Background Corr: 0.00000E+00 fp2 Background Corr: 0.00000E+00 fp3 Background Corr: 0.00000E+00 pp2f Direction: 1 Ref Peak Range Min: -180 Ref Peak Range Max: -80 Ref PeakTo Dip Range: -100 Serial Number: 100000000 S Factor: 1.00000 S Factor Offset: 0.00000 # Spectrum Average: 4 Logger Rate: 4 Peak Tracking: 0 DO Alarm Setup: 0 Alarm Setpoint(ppmv): 430.0 4-20mA Alarm Action: 0 4-20mA % Test: 101 4 mA Value (ppmv): 0.000 20 mA Value (ppmv): 422.000 Temperature Unit: 0 Pressure Unit: 0 Concentration Unit: 0 Pipeline Pressure: 0.00 Modbus Address: 0 Modbus Mode: 0 User Analyzer ID: 0 User Sample ID: 0 User Component ID: 0
Constants Kf_ValuefactorFactor: 0.001000 Null Point: 6
Diagnostics ppmv: 10.9129 PP2F: 8190 Power: 1714 PkDf: 60.0000 PkDl: 60.0000 Index: 240 Zero: -10
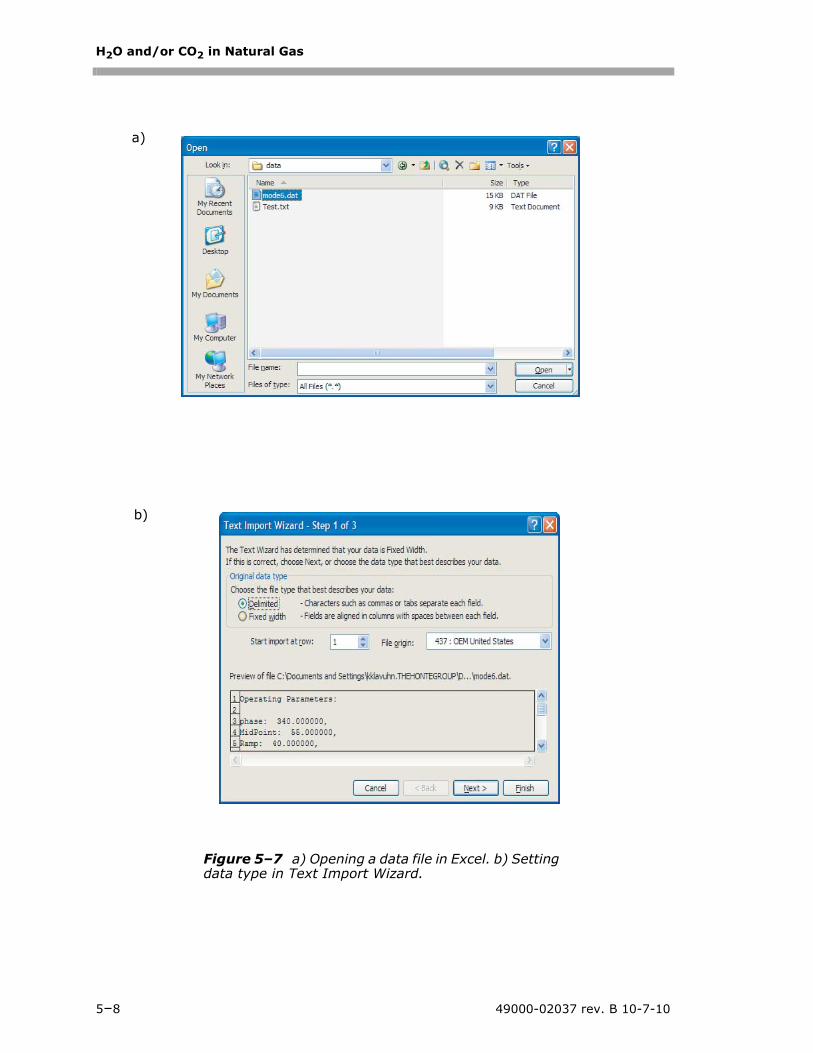
H2O and/or CO2 in Natural Gas
5–8 49000-02037 rev. B 10-7-10
Figure 5–7 a) Opening a data file in Excel. b) Setting data type in Text Import Wizard.
b)
a)
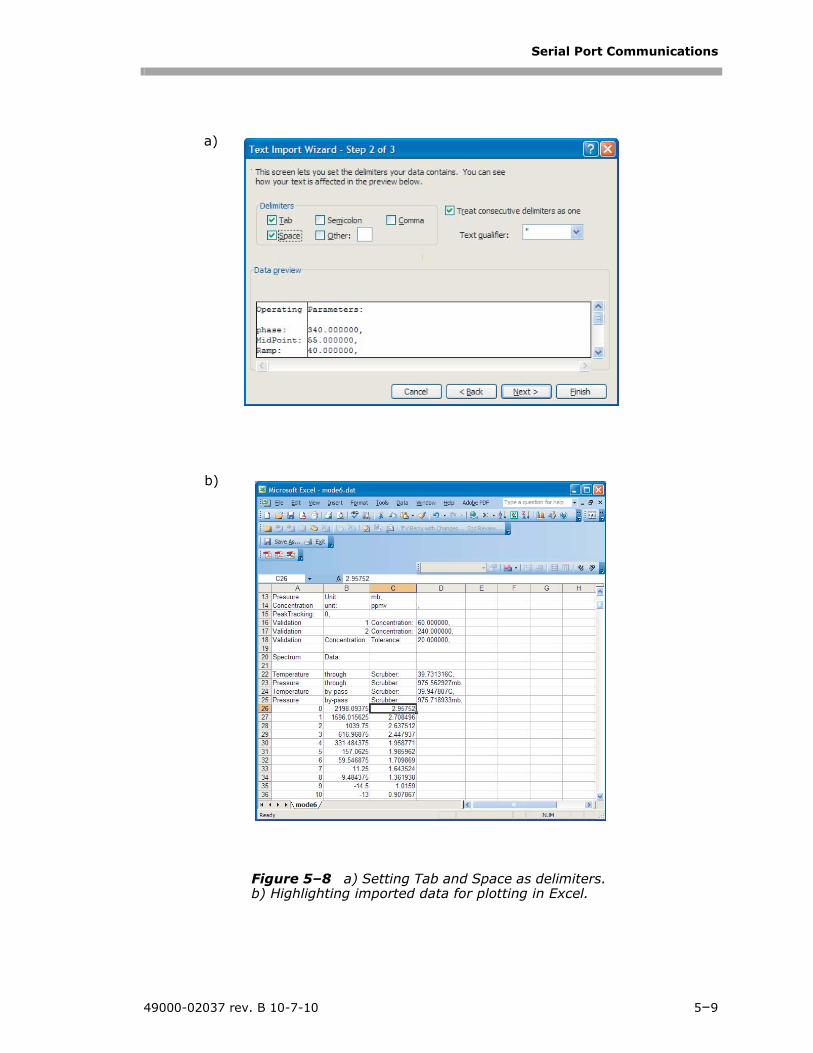
Serial Port Communications
49000-02037 rev. B 10-7-10 5–9
Figure 5–8 a) Setting Tab and Space as delimiters. b) Highlighting imported data for plotting in Excel.
a)
b)
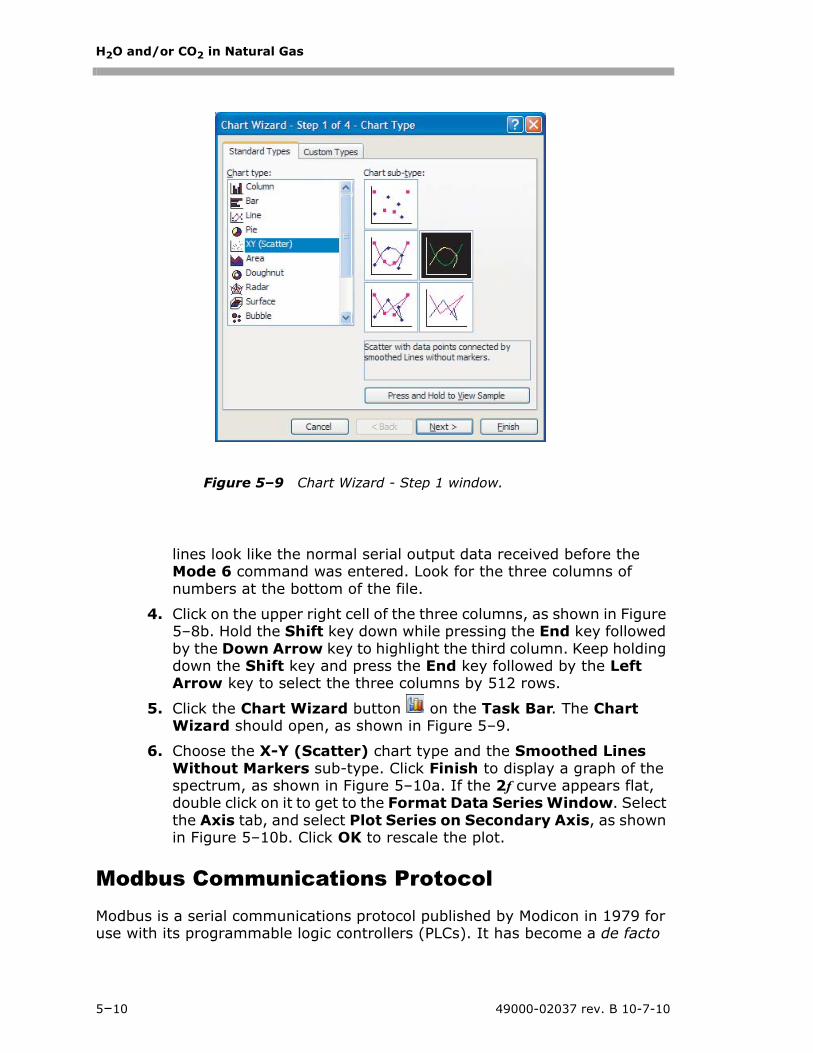
H2O and/or CO2 in Natural Gas
5–10 49000-02037 rev. B 10-7-10
lines look like the normal serial output data received before the Mode 6 command was entered. Look for the three columns of numbers at the bottom of the file.
4. Click on the upper right cell of the three columns, as shown in Figure 5–8b. Hold the Shift key down while pressing the End key followed by the Down Arrow key to highlight the third column. Keep holding down the Shift key and press the End key followed by the Left Arrow key to select the three columns by 512 rows.
5. Click the Chart Wizard button on the Task Bar. The Chart Wizard should open, as shown in Figure 5–9.
6. Choose the X-Y (Scatter) chart type and the Smoothed Lines Without Markers sub-type. Click Finish to display a graph of the spectrum, as shown in Figure 5–10a. If the 2f curve appears flat, double click on it to get to the Format Data Series Window. Select the Axis tab, and select Plot Series on Secondary Axis, as shown in Figure 5–10b. Click OK to rescale the plot.
Modbus Communications ProtocolModbus is a serial communications protocol published by Modicon in 1979 for use with its programmable logic controllers (PLCs). It has become a de facto
Figure 5–9 Chart Wizard - Step 1 window.
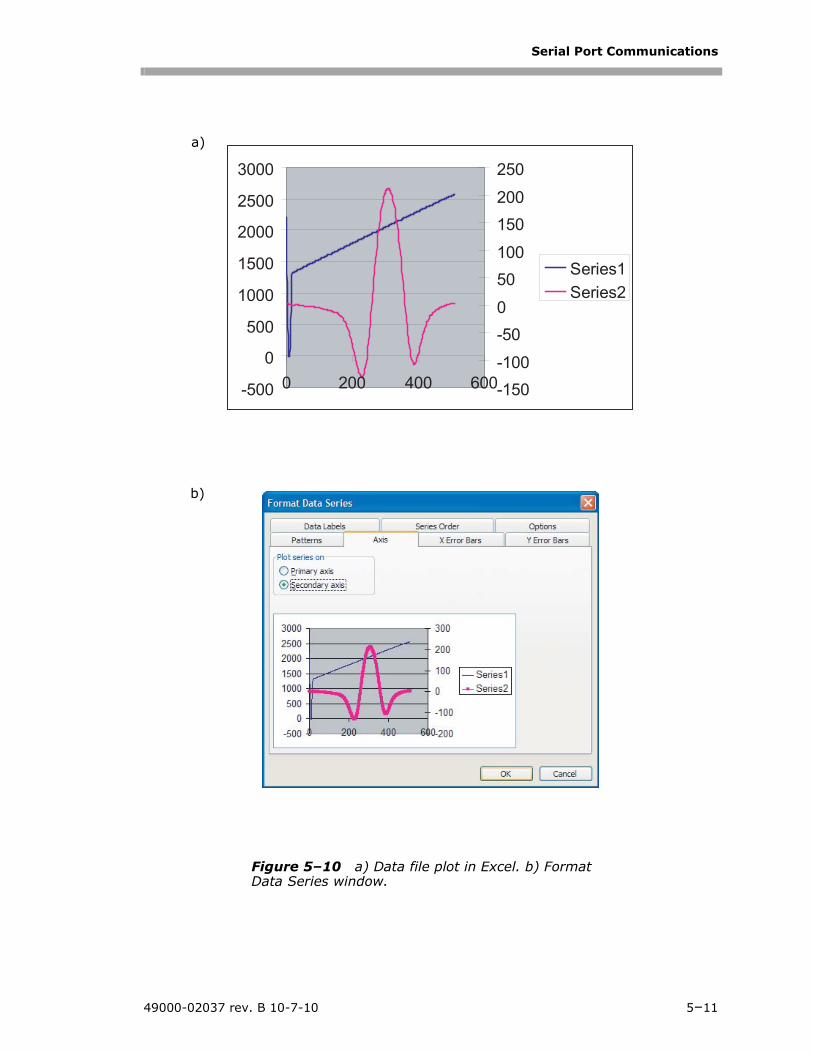
Serial Port Communications
49000-02037 rev. B 10-7-10 5–11
-500
0
500
1000
1500
2000
2500
3000
0 200 400 600-150-100
-500
50100
150200
250
Series1Series2
Figure 5–10 a) Data file plot in Excel. b) Format Data Series window.
a)
b)

H2O and/or CO2 in Natural Gas
5–12 49000-02037 rev. B 10-7-10
standard communications protocol in industry, and is now the most commonly available means of connecting industrial electronic devices. Modbus is used extensively in leu of other communications protocols because it is openly published and royalty-free, relatively easy to deploy, and capable of moving raw bits or words without placing many restrictions on vendors.
Modbus enables communication between many devices connected to the same network, for example, a supervisory computer with a remote terminal unit (RTU) in supervisory control and data acquisition (SCADA) systems.
The SpectraSensors analyzer acts as a slave in a master/slave(s) network of devices. It can receive queries from a master and send responses back using either Gould Modbus RTU protocol or Daniel Extended Modbus RTU protocol.
Framing/ProtocolThe transmission mode used to communicate is either Gould Modbus RTU or Daniel Modbus RTU with port parameters 9600 (baud rate), 8 (data bits), 1 (stop bit), no (parity), and none (flow control/handshake).
The transmission mode is set by the user via the Modbus Mode parameter. See “To change parameters in Mode 2 or Mode 3” on page 4-8. Note that the generic serial output (HyperTerminal) is disabled if either Gould or Daniel Modbus is selected.
FunctionsAvailable functions are 0x03 (read holding registers), 0x06 (write to a single register), 0x10 (write to multiple registers), and 0x2B (read device identification).
AddressingThe analyzer's Modbus slave node address can be in the range of 0-250 with the default being 1. All analyzers will respond to an address of 0, so this address can be used to interrogate a single unit when its address is unknown or to determine its address.
See Table 5–1 on page 5–15 for register definitions for both Gould and Daniel Modbus modes. Be aware that for Gould Modbus the table follows the convention of identifying the register with an offset of 40001. For example, the actual value transmitted in the starting register field of the command is the listed register value minus 40001, e.g. register 47001 is addressed as 7000.
Reading/Writing in Daniel Modbus ModeDaniel Modbus supports three types of registers: short integer, long integer and floating point. Each “short integer” register is two bytes in length and will contain an integer value. Each “long integer” register is four bytes in length and will contain an integer value and each “floating point” register is four bytes in length and will contain a floating point value.
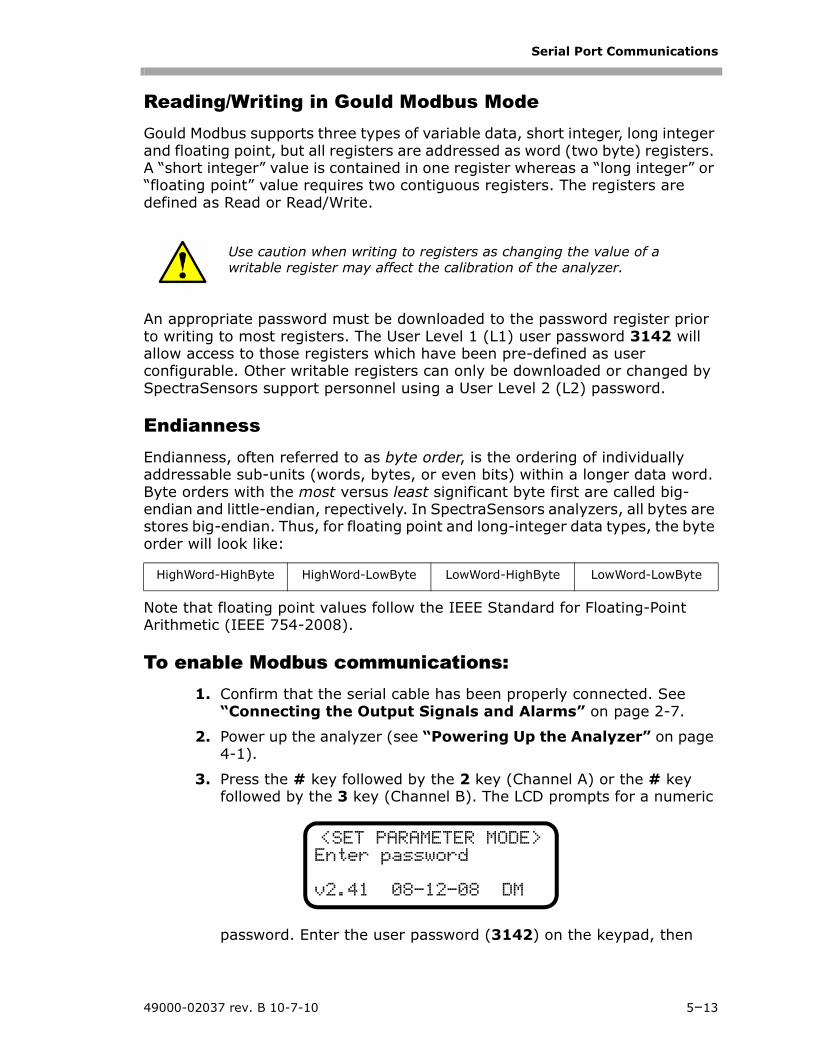
Serial Port Communications
49000-02037 rev. B 10-7-10 5–13
Reading/Writing in Gould Modbus ModeGould Modbus supports three types of variable data, short integer, long integer and floating point, but all registers are addressed as word (two byte) registers. A “short integer” value is contained in one register whereas a “long integer” or “floating point” value requires two contiguous registers. The registers are defined as Read or Read/Write.
An appropriate password must be downloaded to the password register prior to writing to most registers. The User Level 1 (L1) user password 3142 will allow access to those registers which have been pre-defined as user configurable. Other writable registers can only be downloaded or changed by SpectraSensors support personnel using a User Level 2 (L2) password.
EndiannessEndianness, often referred to as byte order, is the ordering of individually addressable sub-units (words, bytes, or even bits) within a longer data word. Byte orders with the most versus least significant byte first are called big-endian and little-endian, repectively. In SpectraSensors analyzers, all bytes are stores big-endian. Thus, for floating point and long-integer data types, the byte order will look like:
Note that floating point values follow the IEEE Standard for Floating-Point Arithmetic (IEEE 754-2008).
To enable Modbus communications:1. Confirm that the serial cable has been properly connected. See
“Connecting the Output Signals and Alarms” on page 2-7.
2. Power up the analyzer (see “Powering Up the Analyzer” on page 4-1).
3. Press the # key followed by the 2 key (Channel A) or the # key followed by the 3 key (Channel B). The LCD prompts for a numeric
password. Enter the user password (3142) on the keypad, then
Use caution when writing to registers as changing the value of a writable register may affect the calibration of the analyzer.
HighWord-HighByte HighWord-LowByte LowWord-HighByte LowWord-LowByte
<SET PARAMETER MODE>Enter password
v2.41 08-12-08 DM
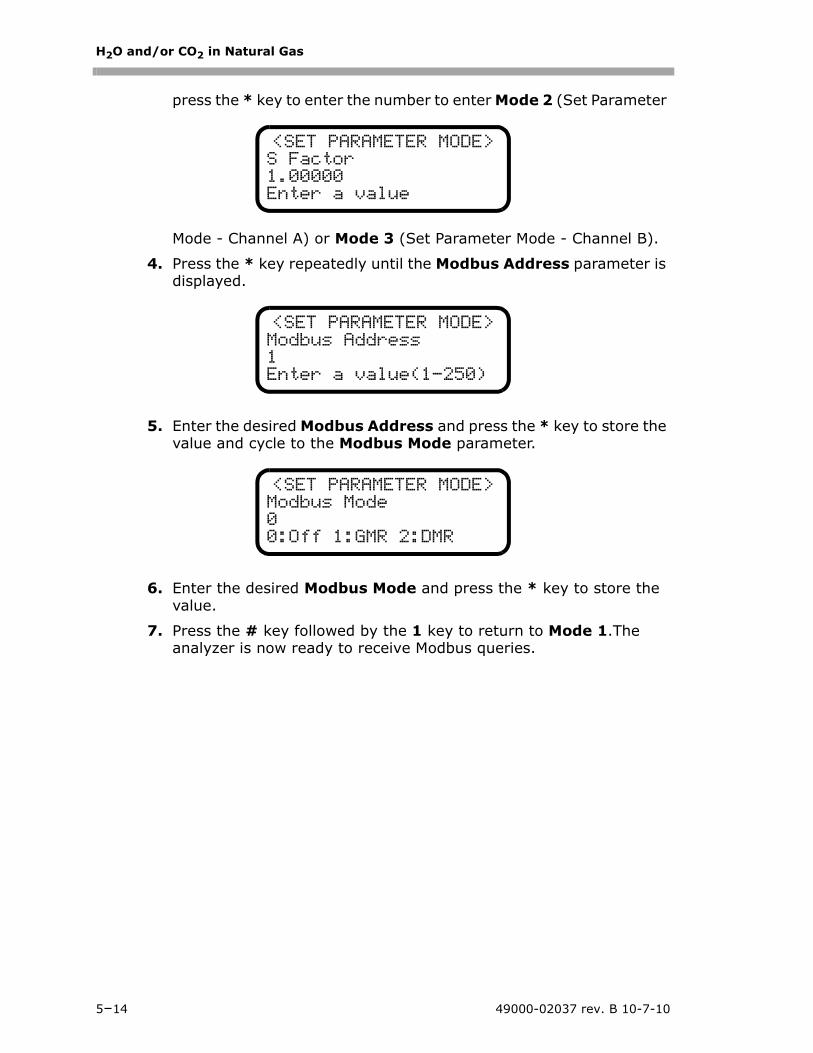
H2O and/or CO2 in Natural Gas
5–14 49000-02037 rev. B 10-7-10
press the * key to enter the number to enter Mode 2 (Set Parameter
Mode - Channel A) or Mode 3 (Set Parameter Mode - Channel B).
4. Press the * key repeatedly until the Modbus Address parameter is displayed.
5. Enter the desired Modbus Address and press the * key to store the value and cycle to the Modbus Mode parameter.
6. Enter the desired Modbus Mode and press the * key to store the value.
7. Press the # key followed by the 1 key to return to Mode 1.The analyzer is now ready to receive Modbus queries.
<SET PARAMETER MODE>S Factor1.00000Enter a value
<SET PARAMETER MODE>Modbus Address1Enter a value(1-250)
<SET PARAMETER MODE>Modbus Mode00:Off 1:GMR 2:DMR
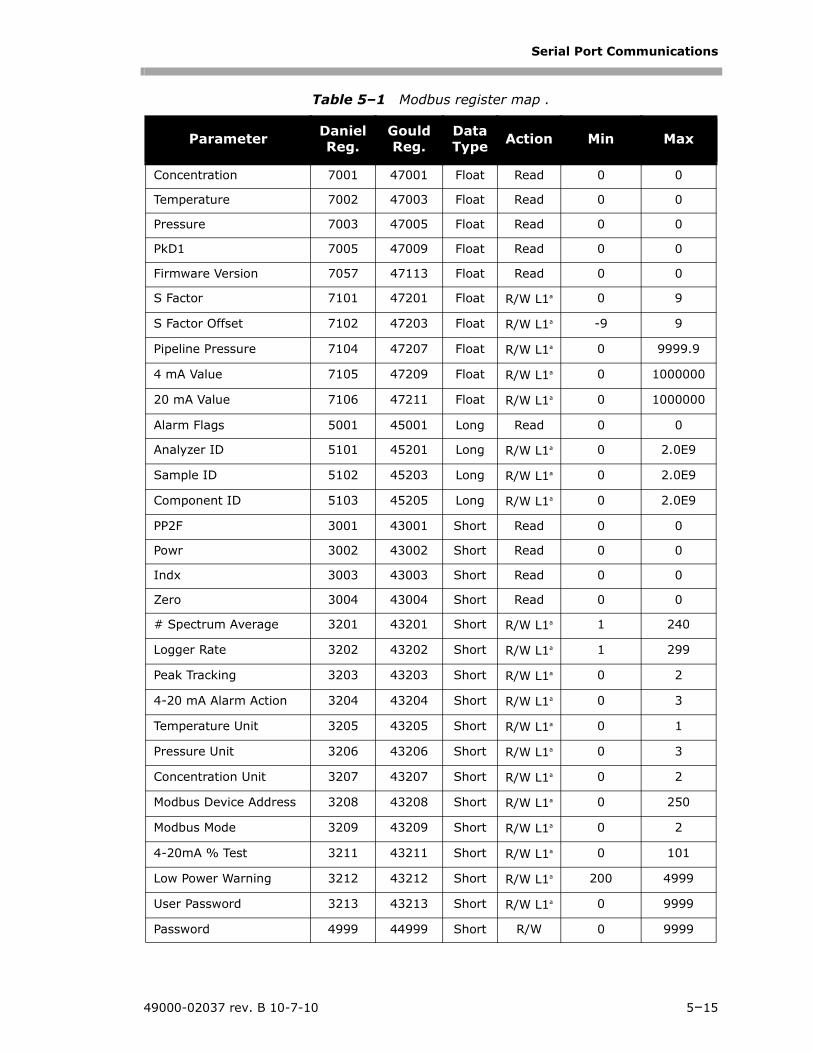
Serial Port Communications
49000-02037 rev. B 10-7-10 5–15
Table 5–1 Modbus register map .
Parameter Daniel Reg.
Gould Reg.
Data Type Action Min Max
Concentration 7001 47001 Float Read 0 0
Temperature 7002 47003 Float Read 0 0
Pressure 7003 47005 Float Read 0 0
PkD1 7005 47009 Float Read 0 0
Firmware Version 7057 47113 Float Read 0 0
S Factor 7101 47201 Float R/W L1a 0 9
S Factor Offset 7102 47203 Float R/W L1a -9 9
Pipeline Pressure 7104 47207 Float R/W L1a 0 9999.9
4 mA Value 7105 47209 Float R/W L1a 0 1000000
20 mA Value 7106 47211 Float R/W L1a 0 1000000
Alarm Flags 5001 45001 Long Read 0 0
Analyzer ID 5101 45201 Long R/W L1a 0 2.0E9
Sample ID 5102 45203 Long R/W L1a 0 2.0E9
Component ID 5103 45205 Long R/W L1a 0 2.0E9
PP2F 3001 43001 Short Read 0 0
Powr 3002 43002 Short Read 0 0
Indx 3003 43003 Short Read 0 0
Zero 3004 43004 Short Read 0 0
# Spectrum Average 3201 43201 Short R/W L1a 1 240
Logger Rate 3202 43202 Short R/W L1a 1 299
Peak Tracking 3203 43203 Short R/W L1a 0 2
4-20 mA Alarm Action 3204 43204 Short R/W L1a 0 3
Temperature Unit 3205 43205 Short R/W L1a 0 1
Pressure Unit 3206 43206 Short R/W L1a 0 3
Concentration Unit 3207 43207 Short R/W L1a 0 2
Modbus Device Address 3208 43208 Short R/W L1a 0 250
Modbus Mode 3209 43209 Short R/W L1a 0 2
4-20mA % Test 3211 43211 Short R/W L1a 0 101
Low Power Warning 3212 43212 Short R/W L1a 200 4999
User Password 3213 43213 Short R/W L1a 0 9999
Password 4999 44999 Short R/W 0 9999
H2O and/or CO2 in Natural Gas
5–16 49000-02037 rev. B 10-7-10
Modbus Accessible Parameter Definitions
• Concentration – current live concentration in selected engineering units.
• Temperature – current live temperature of the gas sample in selected engineering units.
• Pressure – current live pressure reading of the gas sample in selected engineering units atmospheric.
• PkD1 – midpoint current (mA) of laser scan being used in the analyzer when peak tracking is turned on.
• Firmware Version – firmware version running in the analyzer.
• S Factor – slope adjustment enabling the analyzer to be tuned to match a specific calibration standard without affecting the factory calibration.
• S Factor Offset – offset adjustment enabling the analyzer to be tuned to match a specific calibration standard without affecting the factory calibration.
• Pipeline Pressure – sets the pressure used in calculating dew point. The pressure unit is mb when setting this parameter via Modbus communications and as set by the Pressure Unit parameter when setting via the front panel.
• 4 mA Value – (ppmv) controls the low range of the 4-20 mA output.
• 20 mA Value – (ppmv) controls the high range of the 4-20 mA output.
• Alarm Flags – long integer register identifying the status of each individual alarm in the analyzer as follows:
Bit 0 = 1, general fault condition existsBit 1 = 1, Null Fail Error condition existsBit 2 = 1, Spectrum Fail Error condition existsBit 3 = 1, PT Fail condition existsBit 4 = 1, Power Fail Error condition existsBit 5 = 1, Track Fail Error condition exists
• User Analyzer ID – user defined numeric analyzer ID.
• User Sample ID – user defined numeric sample ID.
• User Component ID – user defined numeric component ID.
• PP2F – (counts) concentration signal.
• Powr – (counts) laser power detected at the absorption peak.
• Indx – position of the absorption peak along scan.
a. Write privilege requires User Level 1 (L1) password to be downloaded to the Pass-word register.

Serial Port Communications
49000-02037 rev. B 10-7-10 5–17
• Zero – (counts) detected signal level with laser off.
• # Spectrum Average – number of scans averaged for each measurement.
• Logger Rate – running average of the concentration reading.
• Peak Tracking – turns peak tracking on and off.
• 4-20 mA Alarm Action – sets 4-20 mA signal reaction to alarm condition.
• Temperature Unit – sets the temperature units.
• Pressure Unit – sets the pressure units.
• Concentration Unit – sets the concentration units.
• Modbus Address – user assigned numeric address identifying analyzer to Modbus host system.
• Modbus Mode – sets the Modbus communication protocol type.
• 4-20 mA % Test – user set relative output of 4-20 mA current loop.
• Low Power Warning– sets the level at which the analyzer will issue a Low Power Warning.
• User Password– sets Level 1 password.
• Password – password required to change register settings. In the above table those registers denoted as R/W L1 can be modified if the User Level 1 password is downloaded to this register.

H2O and/or CO2 in Natural Gas
5–18 49000-02037 rev. B 10-7-10
THIS PAGE INTENTIONALLY LEFT BLANK
SS500/SS2000/SS3000 Operator’s Manual A–1
Appendix A: TroubleshootingThis section presents recommendations and solutions to common problems, such as gas leaks, contamination, excessive sampling gas temperatures and pressures, and electrical noise. If your analyzer does not appear to be hampered by one of these related problems, contact your sales representative for service.
Gas LeaksProbably the most common cause of erroneous measurements is outside air leaking into the sample supply line. It is recommended the supply lines be
periodically leak-tested, especially if the analyzer has been relocated or has been replaced or returned to the factory for service and the sample lines have been reconnected.
ContaminationContamination and long exposure to high humidity are valid reasons for periodically cleaning the gas sampling lines. Contamination in the gas sampling lines can potentially find its way to the sample cell and deposit on the optics or interfere with the measurement in some other way. Although the analyzer is designed to withstand some contamination, it is recommended to always keep the sampling lines as contamination free as possible.
To keep the sampling lines clean:1. Make sure that a membrane separator filter (included with most
systems) is installed ahead of the analyzer and operating normally. Replace the membrane if necessary. If liquid enters the cell and accumulates on the internal optics, a Power Fail Error will result.
2. If mirror contamination is suspected, see “Cleaning the Mirrors” on page A-2.
Do not use plastic tubing of any kind for sample lines. Plastic tubing is permeable to moisture and other substances which can contaminate the sample stream. SpectraSensors recommends using 1/4” O.D x0.035” wall thickness, seamless stainless steel tubing.
Process samples may contain hazardous material in potentially flammable and/or toxic concentrations. Personnel should have a thorough knowledge and understanding of the physical properties and safety precautions for the sample contents before operating the SCS.
H2O and/or CO2 in Natural Gas
A–2 49000-02037 rev. B 10-7-10
3. Turn off the sample valve at the tap in accordance with site lock-out, tag-out rules.
4. Disconnect the gas sampling line from the supply port of the analyzer.
5. Wash the sampling line with alcohol or acetone and blow dry with mild pressure from a dry air or nitrogen source.
6. Once the sampling line is completely free of solvent, reconnect the gas sampling line to the supply port of the analyzer.
7. Check all connections for gas leaks. SpectraSensors recommends using a liquid leak detector.
Cleaning the MirrorsIf contamination makes its way into the cell and accumulates on the internal optics, a Power Fail Error will result. If mirror contamination is suspected, please consult with your factory sales representative before attempting to clean the mirrors. If advised to do so, use the following procedure.
Tools and Supplies:• Lens cleaning cloth (Cole Parmer® EW-33677-00 TEXWIPE®
Alphawipe® Low-Particulate Clean Room Wipes or equivalent)
• Reagent-grade isopropanol (ColeParmer® EW-88361-80 or equivalent)
• Small drop dispenser bottle (Nalgene® 2414 FEP Drop Dispenser Bottle or equivalent)
• Acetone-impenetrable gloves (North NOR CE412W Nitrile Chemsoft™ CE Cleanroom Gloves or equivalent)
Do not attempt to clean the cell mirror until you have consulted with your factory service representative and have been advised to do so.
The sample cell assembly contains a low-power, 10 mW MAX, CW Class IIIb invisible laser with a wavelength between 700-3000 nm. Never open the sample cell flanges or the optical assembly unless the power is turned off.
Always handle the optical assembly by the edge of the mount. Never touch the coated surfaces of the mirror.
Troubleshooting
49000-02037 rev. B 10-7-10 A–3
• Hemostat (Fisherbrand™ 13-812-24 Rochester-Pean Serrated Forceps)
• Bulb blower or dry compressed air/nitrogen
• Torque wrench
• Marker
• Flashlight
To clean the mirrors:1. Power down the analyzer following the procedure outlined in “To
power down the analyzer” on page 4-2.
2. Isolate the analyzer from the sample bypass flow by following the procedure outlined in “To isolate the analyzer for short-term shutdown” on page 3-8.
3. If possible, purge the system with nitrogen for 10 minutes.
4. Carefully mark the orientation of the mirror assembly on the cell body.
5. Gently remove the mirror assembly from the cell by removing the 6 socket-head cap screws and set on a clean, stable and flat surface
6. Look inside the sample cell at the top mirror using a flashlight to ensure that there is no contamination on the top mirror.
7. Remove dust and other large particles of debris using a bulb blower or dry compressed air/nitrogen. Pressurized gas duster products are not recommended as the propellent may deposit liquid droplets onto the optic surface.
8. Put on clean acetone-impenetrable gloves.
9. Double fold a clean sheet of lens cleaning cloth and clamp near and along the fold with the hemostats or fingers to form a “brush.”
10. Place a few drops of isopropanol onto the mirror and rotate the mirror to spread the liquid evenly across the mirror surface.
Careful marking of the mirror orientation is critical to restoring system performance upon reassembly after cleaning.
Due to its proximity to the optical head, SpectraSensors does not recommend cleaning the top mirror. If the top mirror is visibly contaminated, contact your factory service representative.
H2O and/or CO2 in Natural Gas
A–4 49000-02037 rev. B 10-7-10
11. With gentle, uniform pressure, wipe the mirror from one edge to the other with the cleaning cloth only once and only in one direction to remove the contamination. Discard the cloth.
12. Repeat with a clean sheet of lens cleaning cloth to remove the streak left by the first wipe. Repeat, if necessary, until there is no visible contamination on the mirror.
13. Carefully replace the mirror assembly onto the cell in the same orientation as previously marked making sure the o-ring is properly seated.
14. Tighten the 6 socket-head cap screws evenly with a torque wrench to 13 in-lbs.
Excessive Sampling Gas Temperatures and PressuresThe embedded software is designed to produce accurate measurements only within the allowable cell operating range (see Appendix B). Pressures and temperatures outside these ranges will trigger a P/T Fail Error fault.
Electrical NoiseHigh levels of electrical noise can interfere with laser operation and cause it to become unstable. Always connect the analyzer to a properly grounded power source.
Peak Tracking Reset ProcedureThe analyzer’s software is equipped with a peak tracking function that keeps the laser scan centered on the absorption peak. Under some circumstances, the peak tracking function can get lost and lock onto the wrong peak. If the difference between PkDf and PkD1 is more than 4, or Track Fail Error is displayed, the peak tracking function should be reset.
Never rub an optical surface, especially with dry tissues, as this can mar or scratch the coated surface.
If the pressure, temperature, or any other readings on the LCD appear suspect, they should be checked against the specifications (see Appendix B).
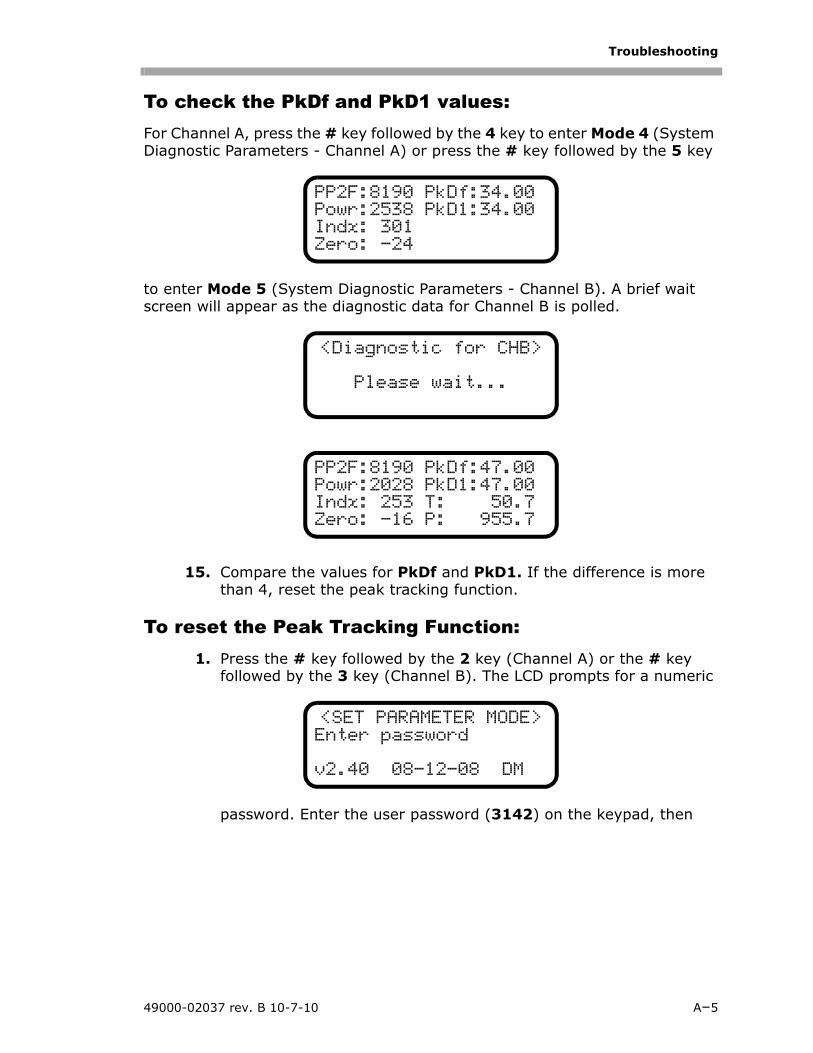
Troubleshooting
49000-02037 rev. B 10-7-10 A–5
To check the PkDf and PkD1 values:For Channel A, press the # key followed by the 4 key to enter Mode 4 (System Diagnostic Parameters - Channel A) or press the # key followed by the 5 key
to enter Mode 5 (System Diagnostic Parameters - Channel B). A brief wait screen will appear as the diagnostic data for Channel B is polled.
15. Compare the values for PkDf and PkD1. If the difference is more than 4, reset the peak tracking function.
To reset the Peak Tracking Function:1. Press the # key followed by the 2 key (Channel A) or the # key
followed by the 3 key (Channel B). The LCD prompts for a numeric
password. Enter the user password (3142) on the keypad, then
PP2F:8190 PkDf:34.00Powr:2538 PkD1:34.00Indx: 301Zero: -24
<Diagnostic for CHB>
Please wait...
PP2F:8190 PkDf:47.00Powr:2028 PkD1:47.00Indx: 253 T: 50.7Zero: -16 P: 955.7
<SET PARAMETER MODE>Enter password
v2.40 08-12-08 DM
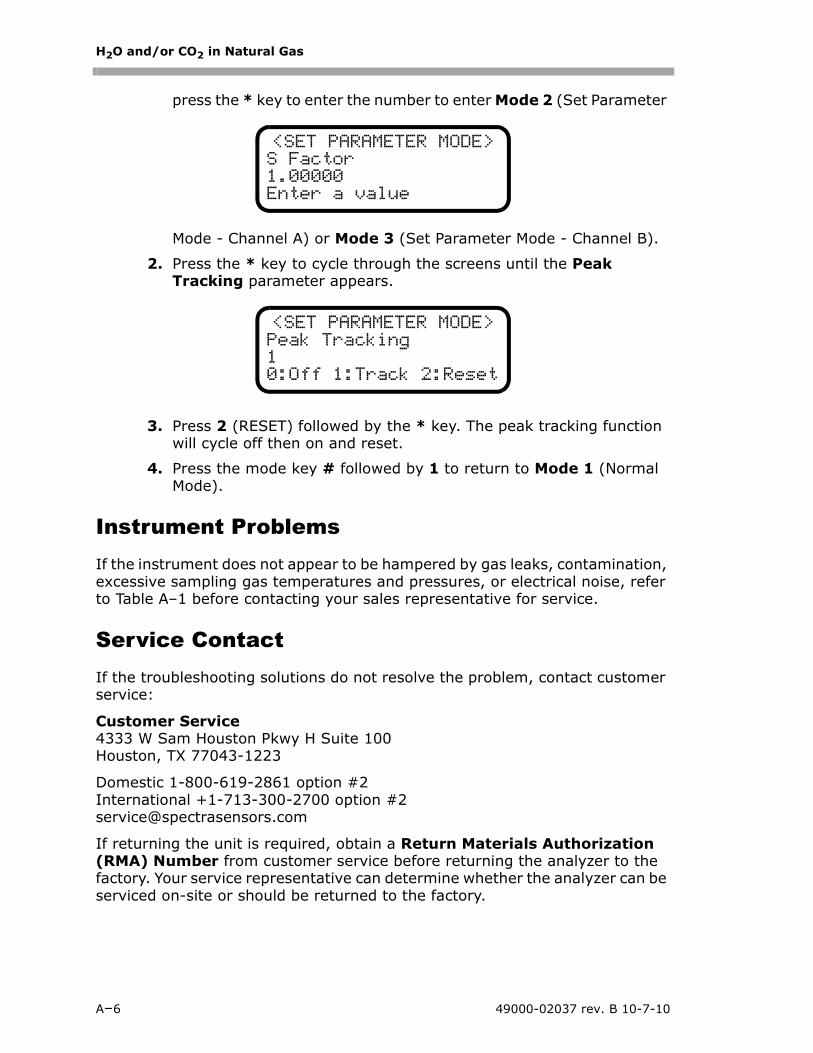
H2O and/or CO2 in Natural Gas
A–6 49000-02037 rev. B 10-7-10
press the * key to enter the number to enter Mode 2 (Set Parameter
Mode - Channel A) or Mode 3 (Set Parameter Mode - Channel B).
2. Press the * key to cycle through the screens until the Peak Tracking parameter appears.
3. Press 2 (RESET) followed by the * key. The peak tracking function will cycle off then on and reset.
4. Press the mode key # followed by 1 to return to Mode 1 (Normal Mode).
Instrument ProblemsIf the instrument does not appear to be hampered by gas leaks, contamination, excessive sampling gas temperatures and pressures, or electrical noise, refer to Table A–1 before contacting your sales representative for service.
Service ContactIf the troubleshooting solutions do not resolve the problem, contact customer service:
Customer Service4333 W Sam Houston Pkwy H Suite 100Houston, TX 77043-1223
Domestic 1-800-619-2861 option #2International +1-713-300-2700 option #[email protected]
If returning the unit is required, obtain a Return Materials Authorization (RMA) Number from customer service before returning the analyzer to the factory. Your service representative can determine whether the analyzer can be serviced on-site or should be returned to the factory.
<SET PARAMETER MODE>S Factor1.00000Enter a value
<SET PARAMETER MODE>Peak Tracking10:Off 1:Track 2:Reset

Troubleshooting
49000-02037 rev. B 10-7-10 A–7
DisclaimersSpectraSensors accepts no responsibility for consequential damages arising from the use of this equipment. Liability is limited to replacement and/or repair of defective components.
This manual contains information protected by copyright. No part of this guide may be photocopied or reproduced in any form without prior written consent from SpectraSensors.
WarrantyThe manufacturer warrants the items delivered shall be free from defects (latent and patent) in material and workmanship for a period of one year after delivery to the Buyer. The Buyer’s sole and exclusive remedy under this warranty shall be limited to repair or replacement. Defective goods must be returned to the manufacturer and/or its distributor for valid warranty claims. This warranty shall become inapplicable in instances where the items have been misused or otherwise subjected to negligence by the Buyer.
Notwithstanding any other provision of this contract, no other warranties, whether statutory or arising by operation of law, expressed or implied, including but not limited to those of merchantability or fitness for particular purpose, shall apply to the goods or services hereunder, other than the repair and replacement warranty above. Seller shall in no event be liable to Buyer or any third party for any damage, injury or loss, including loss of use or any direct or indirect incidental or consequential damages of any kind
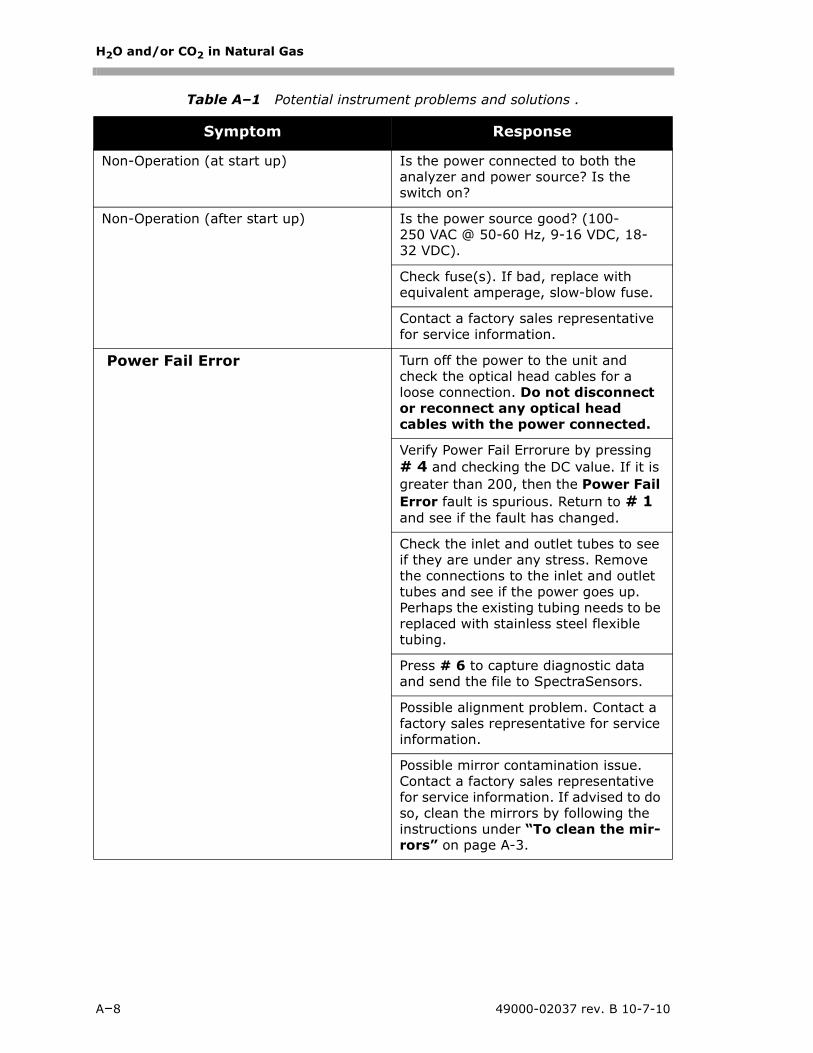
H2O and/or CO2 in Natural Gas
A–8 49000-02037 rev. B 10-7-10
Table A–1 Potential instrument problems and solutions .
Symptom Response
Non-Operation (at start up) Is the power connected to both the analyzer and power source? Is the switch on?
Non-Operation (after start up) Is the power source good? (100-250 VAC @ 50-60 Hz, 9-16 VDC, 18-32 VDC).
Check fuse(s). If bad, replace with equivalent amperage, slow-blow fuse.
Contact a factory sales representative for service information.
Power Fail Error Turn off the power to the unit and check the optical head cables for a loose connection. Do not disconnect or reconnect any optical head cables with the power connected.
Verify Power Fail Errorure by pressing # 4 and checking the DC value. If it is greater than 200, then the Power Fail Error fault is spurious. Return to # 1 and see if the fault has changed.
Check the inlet and outlet tubes to see if they are under any stress. Remove the connections to the inlet and outlet tubes and see if the power goes up. Perhaps the existing tubing needs to be replaced with stainless steel flexible tubing.
Press # 6 to capture diagnostic data and send the file to SpectraSensors.
Possible alignment problem. Contact a factory sales representative for service information.
Possible mirror contamination issue. Contact a factory sales representative for service information. If advised to do so, clean the mirrors by following the instructions under “To clean the mir-rors” on page A-3.

Troubleshooting
49000-02037 rev. B 10-7-10 A–9
Null Fail Error Verify Null Fail Error fault by pressing # 4 or # 5 and checking the zero reading is outside the range of -50 to 50. If not, the Null Fail Error fault is spurious. Return to #1 and see if the fault has changed.
Move the jumper JMP1 on the HC12 main board next to the pre-pot.
Press # 6 to capture diagnostic data and send the file to SpectraSensors.
Spectrum Fail Error Turn off the power to the unit and check the optical head cables for a loose connection. Do not disconnect or reconnect any optical head cables with the power connected.
Turn the analyzer off for 30 seconds and then turn it on again.
Reset the peak tracking.
Press # 6 to capture diagnostic data and send the file to SpectraSensors.
P/T Fail Error Check that the actual pressure in the measurement cell is within specification (see Appendix B).
If the pressure reading is incorrect, check that the pressure/temperature cable is tight. Check the connector on the pressure transducer. Check the pressure connector on the backplane board.
Check that the actual temperature in the measurement cell is within specifi-cation (see Appendix B).
If the temperature reading is incorrect, check that the pressure/temperature cable is tight. Check the connector on the cell temperature sensor. Check the temperature connector on the back-plane board. (Note: A temperature reading greater than 150 °C indicates a short circuit on the temperature sensor leads; a reading of less than –40 °C indicates an open circuit).
Table A–1 Potential instrument problems and solutions (Continued).
Symptom Response
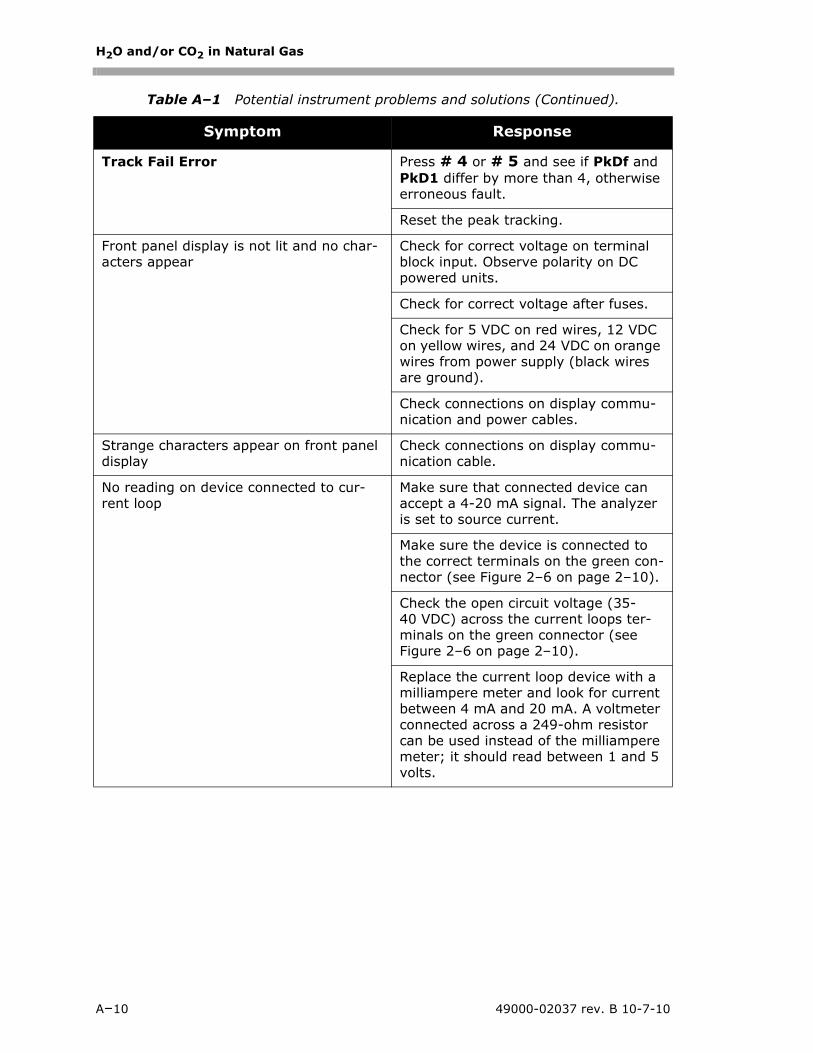
H2O and/or CO2 in Natural Gas
A–10 49000-02037 rev. B 10-7-10
Track Fail Error Press # 4 or # 5 and see if PkDf and PkD1 differ by more than 4, otherwise erroneous fault.
Reset the peak tracking.
Front panel display is not lit and no char-acters appear
Check for correct voltage on terminal block input. Observe polarity on DC powered units.
Check for correct voltage after fuses.
Check for 5 VDC on red wires, 12 VDC on yellow wires, and 24 VDC on orange wires from power supply (black wires are ground).
Check connections on display commu-nication and power cables.
Strange characters appear on front panel display
Check connections on display commu-nication cable.
No reading on device connected to cur-rent loop
Make sure that connected device can accept a 4-20 mA signal. The analyzer is set to source current.
Make sure the device is connected to the correct terminals on the green con-nector (see Figure 2–6 on page 2–10).
Check the open circuit voltage (35-40 VDC) across the current loops ter-minals on the green connector (see Figure 2–6 on page 2–10).
Replace the current loop device with a milliampere meter and look for current between 4 mA and 20 mA. A voltmeter connected across a 249-ohm resistor can be used instead of the milliampere meter; it should read between 1 and 5 volts.
Table A–1 Potential instrument problems and solutions (Continued).
Symptom Response

Troubleshooting
49000-02037 rev. B 10-7-10 A–11
Pressing keys on front panel do not have specified effect
Check connections on keypad cable.
Current loop is stuck at 4 mA or 20 mA Check display for fault message. If alarm has been triggered, reset the alarm.
On the current loop board, check the voltage between the end of resistor R1 closest to the jumper and ground. If the concentration reading is high, the voltage should be near 1 VDC. If the concentration reading is low, the volt-age should be near 4.7 VDC. If not, the problem is probably on the HC12 main board. Return to factory for service.
Reading seems to always be high by a fixed amount
See “Adjusting Analyzer Reading to Match Specific Standard(s)” on page 4-16.
Capture diagnostic data and send the file to SpectraSensors (see “To read diagnostic data with HyperTermi-nal” on page 5-4).
Reading seems to always be high by a fixed percentage
See “Adjusting Analyzer Reading to Match Specific Standard(s)” on page 4-16.
Capture diagnostic data and send the file to SpectraSensors (see “To read diagnostic data with HyperTermi-nal” on page 5-4).
Reading seems to always be low by a fixed amount
See “Adjusting Analyzer Reading to Match Specific Standard(s)” on page 4-16.
Capture diagnostic data and send the file to SpectraSensors (see “To read diagnostic data with HyperTermi-nal” on page 5-4).
Reading seems to always be low by a fixed percentage
See “Adjusting Analyzer Reading to Match Specific Standard(s)” on page 4-16.
Table A–1 Potential instrument problems and solutions (Continued).
Symptom Response
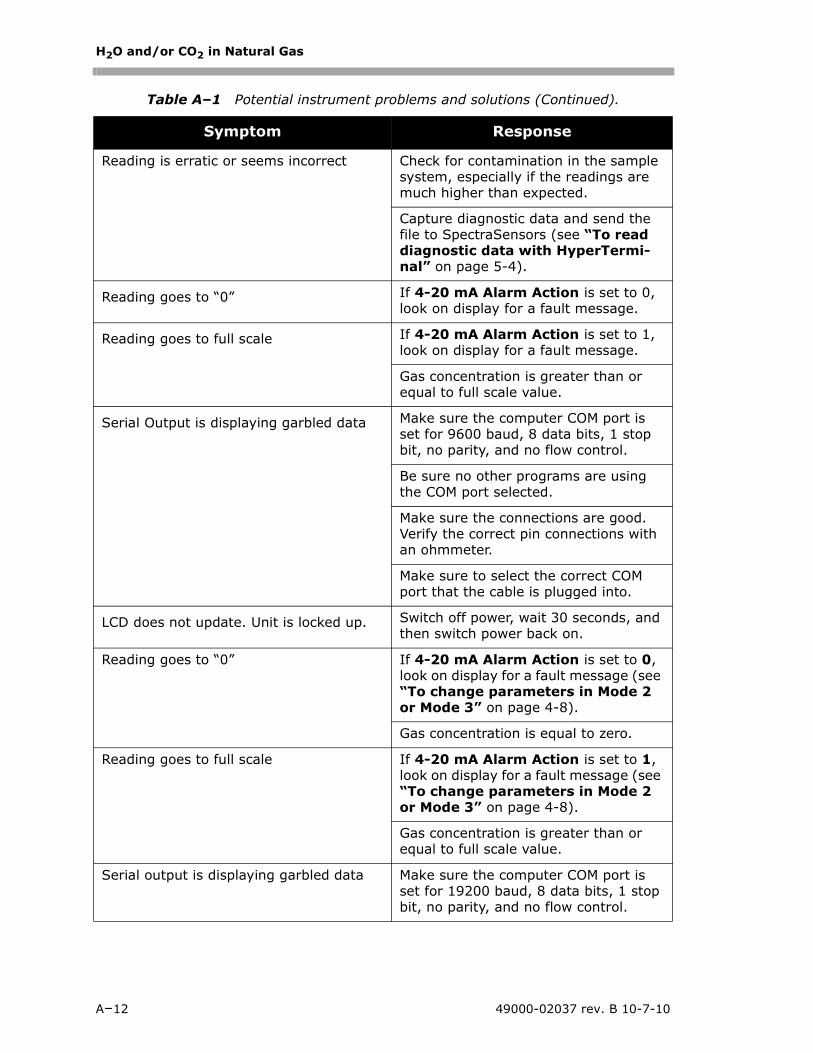
H2O and/or CO2 in Natural Gas
A–12 49000-02037 rev. B 10-7-10
Reading is erratic or seems incorrect Check for contamination in the sample system, especially if the readings are much higher than expected.
Capture diagnostic data and send the file to SpectraSensors (see “To read diagnostic data with HyperTermi-nal” on page 5-4).
Reading goes to “0” If 4-20 mA Alarm Action is set to 0, look on display for a fault message.
Reading goes to full scale If 4-20 mA Alarm Action is set to 1, look on display for a fault message.
Gas concentration is greater than or equal to full scale value.
Serial Output is displaying garbled data Make sure the computer COM port is set for 9600 baud, 8 data bits, 1 stop bit, no parity, and no flow control.
Be sure no other programs are using the COM port selected.
Make sure the connections are good. Verify the correct pin connections with an ohmmeter.
Make sure to select the correct COM port that the cable is plugged into.
LCD does not update. Unit is locked up. Switch off power, wait 30 seconds, and then switch power back on.
Reading goes to “0” If 4-20 mA Alarm Action is set to 0, look on display for a fault message (see “To change parameters in Mode 2 or Mode 3” on page 4-8).
Gas concentration is equal to zero.
Reading goes to full scale If 4-20 mA Alarm Action is set to 1, look on display for a fault message (see “To change parameters in Mode 2 or Mode 3” on page 4-8).
Gas concentration is greater than or equal to full scale value.
Serial output is displaying garbled data Make sure the computer COM port is set for 19200 baud, 8 data bits, 1 stop bit, no parity, and no flow control.
Table A–1 Potential instrument problems and solutions (Continued).
Symptom Response
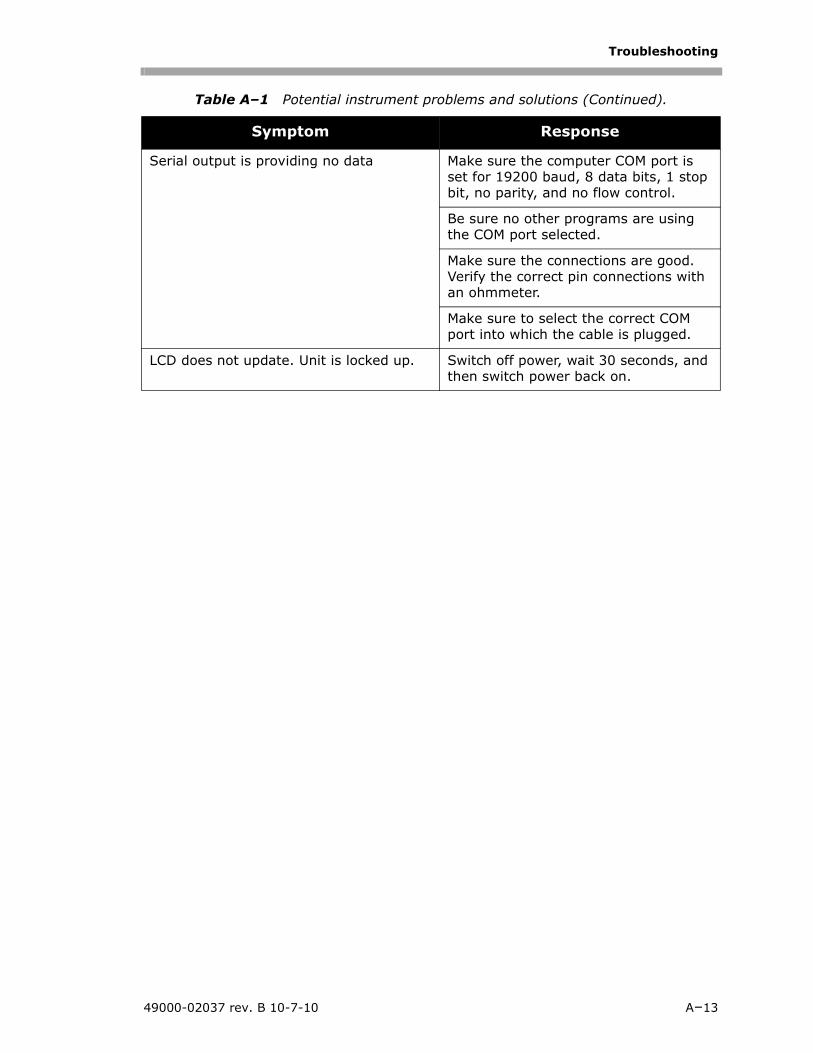
Troubleshooting
49000-02037 rev. B 10-7-10 A–13
Serial output is providing no data Make sure the computer COM port is set for 19200 baud, 8 data bits, 1 stop bit, no parity, and no flow control.
Be sure no other programs are using the COM port selected.
Make sure the connections are good. Verify the correct pin connections with an ohmmeter.
Make sure to select the correct COM port into which the cable is plugged.
LCD does not update. Unit is locked up. Switch off power, wait 30 seconds, and then switch power back on.
Table A–1 Potential instrument problems and solutions (Continued).
Symptom Response

H2O and/or CO2 in Natural Gas
A–14 49000-02037 rev. B 10-7-10
THIS PAGE INTENTIONALLY LEFT BLANK
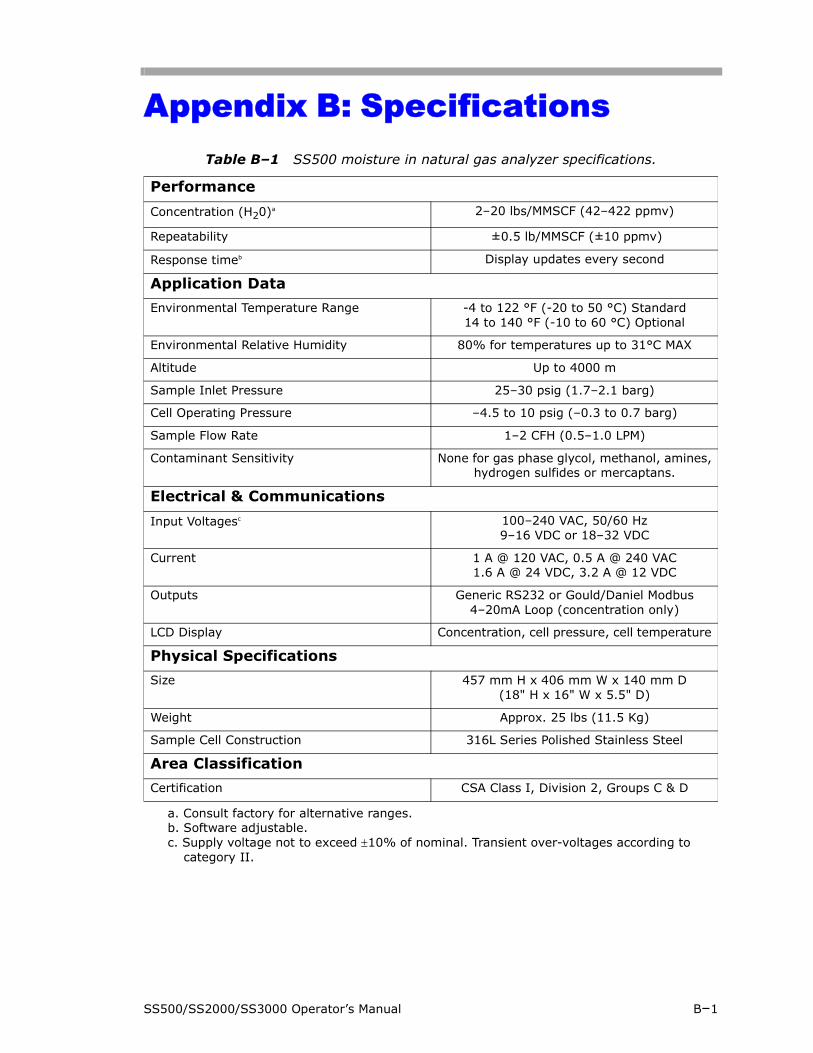
SS500/SS2000/SS3000 Operator’s Manual B–1
Appendix B: Specifications Table B–1 SS500 moisture in natural gas analyzer specifications.
Performance
Concentration (H20)a
a. Consult factory for alternative ranges.
2–20 lbs/MMSCF (42–422 ppmv)
Repeatability ±0.5 lb/MMSCF (±10 ppmv)
Response timeb
b. Software adjustable.
Display updates every second
Application Data
Environmental Temperature Range -4 to 122 °F (-20 to 50 °C) Standard14 to 140 °F (-10 to 60 °C) Optional
Environmental Relative Humidity 80% for temperatures up to 31°C MAX
Altitude Up to 4000 m
Sample Inlet Pressure 25–30 psig (1.7–2.1 barg)
Cell Operating Pressure –4.5 to 10 psig (–0.3 to 0.7 barg)
Sample Flow Rate 1–2 CFH (0.5–1.0 LPM)
Contaminant Sensitivity None for gas phase glycol, methanol, amines,hydrogen sulfides or mercaptans.
Electrical & Communications
Input Voltagesc
c. Supply voltage not to exceed ±10% of nominal. Transient over-voltages according to category II.
100–240 VAC, 50/60 Hz9–16 VDC or 18–32 VDC
Current 1 A @ 120 VAC, 0.5 A @ 240 VAC1.6 A @ 24 VDC, 3.2 A @ 12 VDC
Outputs Generic RS232 or Gould/Daniel Modbus4–20mA Loop (concentration only)
LCD Display Concentration, cell pressure, cell temperature
Physical Specifications
Size 457 mm H x 406 mm W x 140 mm D(18" H x 16" W x 5.5" D)
Weight Approx. 25 lbs (11.5 Kg)
Sample Cell Construction 316L Series Polished Stainless Steel
Area Classification
Certification CSA Class I, Division 2, Groups C & D
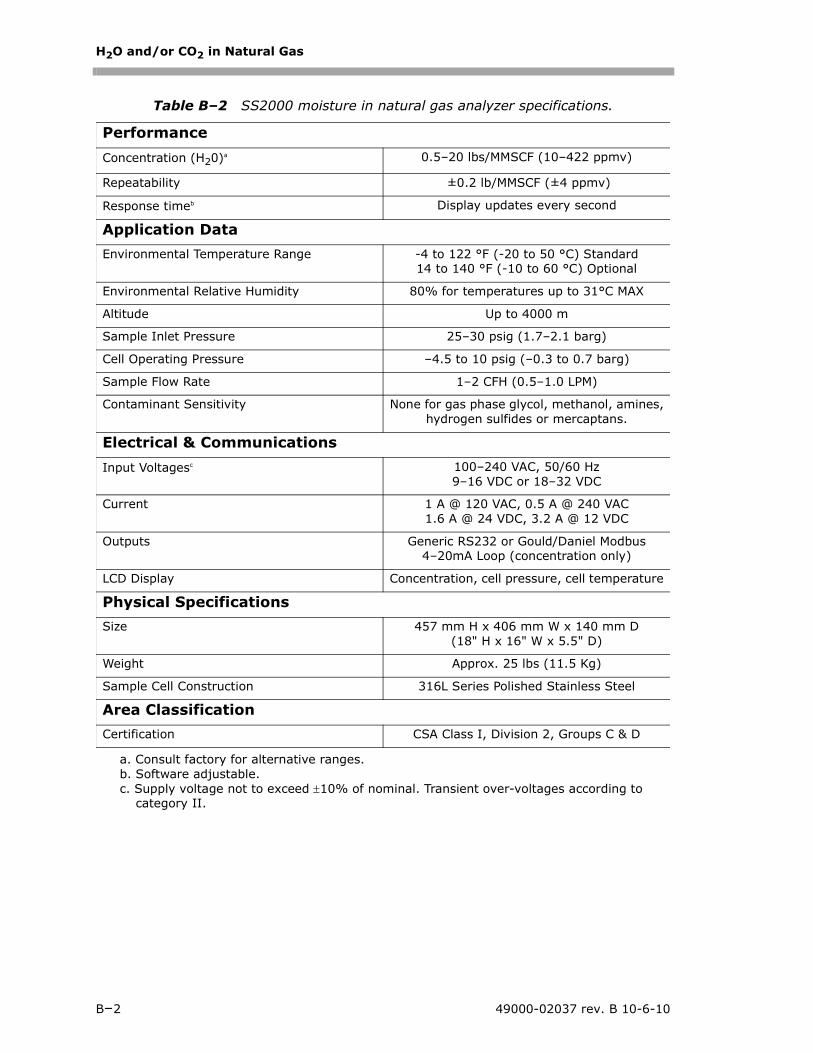
H2O and/or CO2 in Natural Gas
B–2 49000-02037 rev. B 10-6-10
Table B–2 SS2000 moisture in natural gas analyzer specifications.
Performance
Concentration (H20)a
a. Consult factory for alternative ranges.
0.5–20 lbs/MMSCF (10–422 ppmv)
Repeatability ±0.2 lb/MMSCF (±4 ppmv)
Response timeb
b. Software adjustable.
Display updates every second
Application Data
Environmental Temperature Range -4 to 122 °F (-20 to 50 °C) Standard14 to 140 °F (-10 to 60 °C) Optional
Environmental Relative Humidity 80% for temperatures up to 31°C MAX
Altitude Up to 4000 m
Sample Inlet Pressure 25–30 psig (1.7–2.1 barg)
Cell Operating Pressure –4.5 to 10 psig (–0.3 to 0.7 barg)
Sample Flow Rate 1–2 CFH (0.5–1.0 LPM)
Contaminant Sensitivity None for gas phase glycol, methanol, amines,hydrogen sulfides or mercaptans.
Electrical & Communications
Input Voltagesc
c. Supply voltage not to exceed ±10% of nominal. Transient over-voltages according to category II.
100–240 VAC, 50/60 Hz9–16 VDC or 18–32 VDC
Current 1 A @ 120 VAC, 0.5 A @ 240 VAC1.6 A @ 24 VDC, 3.2 A @ 12 VDC
Outputs Generic RS232 or Gould/Daniel Modbus4–20mA Loop (concentration only)
LCD Display Concentration, cell pressure, cell temperature
Physical Specifications
Size 457 mm H x 406 mm W x 140 mm D(18" H x 16" W x 5.5" D)
Weight Approx. 25 lbs (11.5 Kg)
Sample Cell Construction 316L Series Polished Stainless Steel
Area Classification
Certification CSA Class I, Division 2, Groups C & D
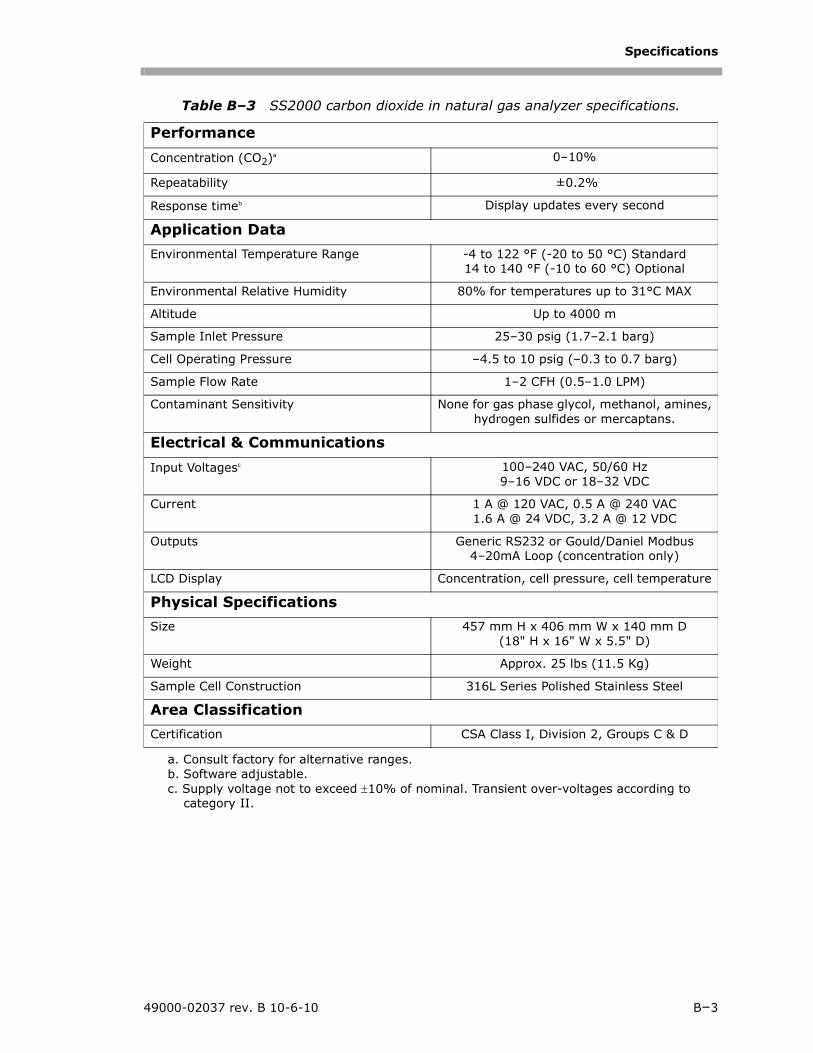
Specifications
49000-02037 rev. B 10-6-10 B–3
Table B–3 SS2000 carbon dioxide in natural gas analyzer specifications.
Performance
Concentration (CO2)a
a. Consult factory for alternative ranges.
0–10%
Repeatability ±0.2%
Response timeb
b. Software adjustable.
Display updates every second
Application Data
Environmental Temperature Range -4 to 122 °F (-20 to 50 °C) Standard14 to 140 °F (-10 to 60 °C) Optional
Environmental Relative Humidity 80% for temperatures up to 31°C MAX
Altitude Up to 4000 m
Sample Inlet Pressure 25–30 psig (1.7–2.1 barg)
Cell Operating Pressure –4.5 to 10 psig (–0.3 to 0.7 barg)
Sample Flow Rate 1–2 CFH (0.5–1.0 LPM)
Contaminant Sensitivity None for gas phase glycol, methanol, amines,hydrogen sulfides or mercaptans.
Electrical & Communications
Input Voltagesc
c. Supply voltage not to exceed ±10% of nominal. Transient over-voltages according to category II.
100–240 VAC, 50/60 Hz9–16 VDC or 18–32 VDC
Current 1 A @ 120 VAC, 0.5 A @ 240 VAC1.6 A @ 24 VDC, 3.2 A @ 12 VDC
Outputs Generic RS232 or Gould/Daniel Modbus4–20mA Loop (concentration only)
LCD Display Concentration, cell pressure, cell temperature
Physical Specifications
Size 457 mm H x 406 mm W x 140 mm D(18" H x 16" W x 5.5" D)
Weight Approx. 25 lbs (11.5 Kg)
Sample Cell Construction 316L Series Polished Stainless Steel
Area Classification
Certification CSA Class I, Division 2, Groups C & D
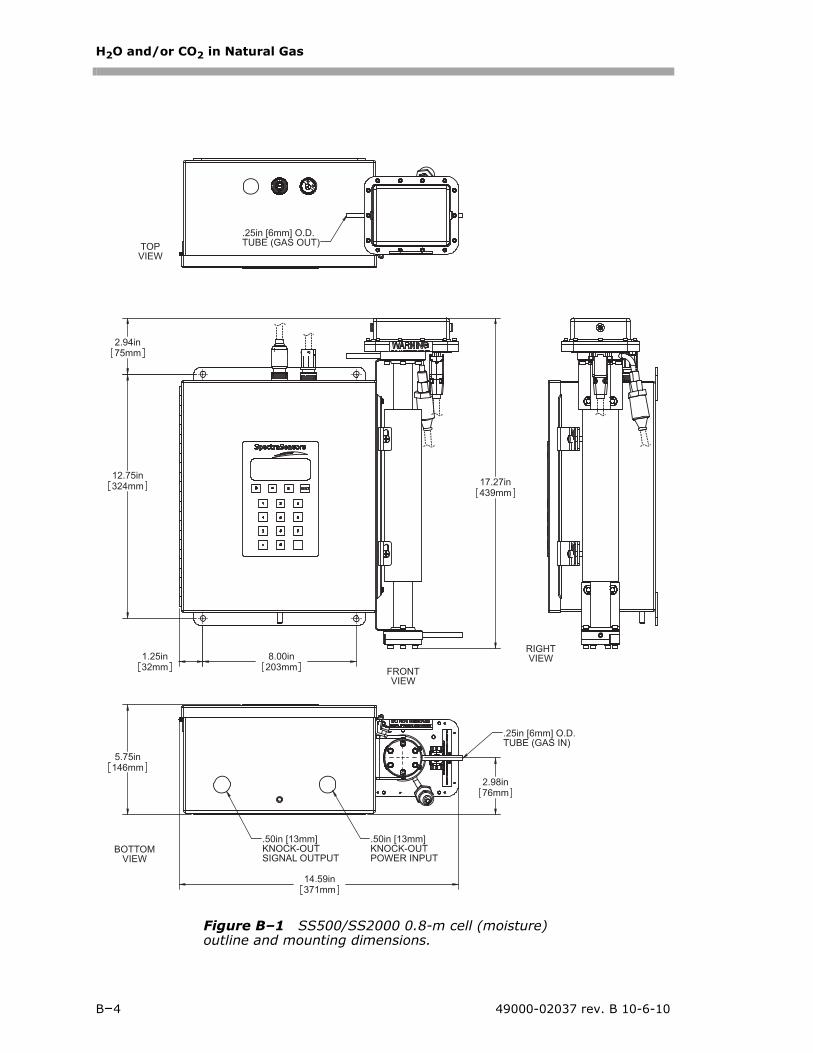
H2O and/or CO2 in Natural Gas
B–4 49000-02037 rev. B 10-6-10
14.59in371mm
BOTTOMVIEW
FRONTVIEW
12.75in324mm
75mm2.94in
439mm17.27in
32mm1.25in 8.00in
203mm
.50in [13mm]KNOCK-OUTPOWER INPUT
KNOCK-OUTSIGNAL OUTPUT
.50in [13mm]
.25in [6mm] O.D.TUBE (GAS IN)
146mm5.75in
2.98in76mm
RIGHTVIEW
.25in [6mm] O.D.TUBE (GAS OUT)TOP
VIEW
Figure B–1 SS500/SS2000 0.8-m cell (moisture) outline and mounting dimensions.

Specifications
49000-02037 rev. B 10-6-10 B–5
14.59in371mm
.25in [6mm] O.D.TUBE (GAS OUT)
TOPVIEW
RIGHTVIEW
.25in [6mm] O.D.TUBE (GAS IN)
BOTTOMVIEW
5.75in146mm
2.98in76mm
.50in [13mm]KNOCK-OUTPOWER INPUT
.50in [13mm]KNOCK-OUTSIGNAL OUTPUT
FRONTVIEW
32mm1.25in
324mm12.75in
2.96in75mm
203mm8.00in
16.09in409mm
Figure B–2 SS500/SS2000 0.1-m cell (carbon dioxide) outline and mounting dimensions.
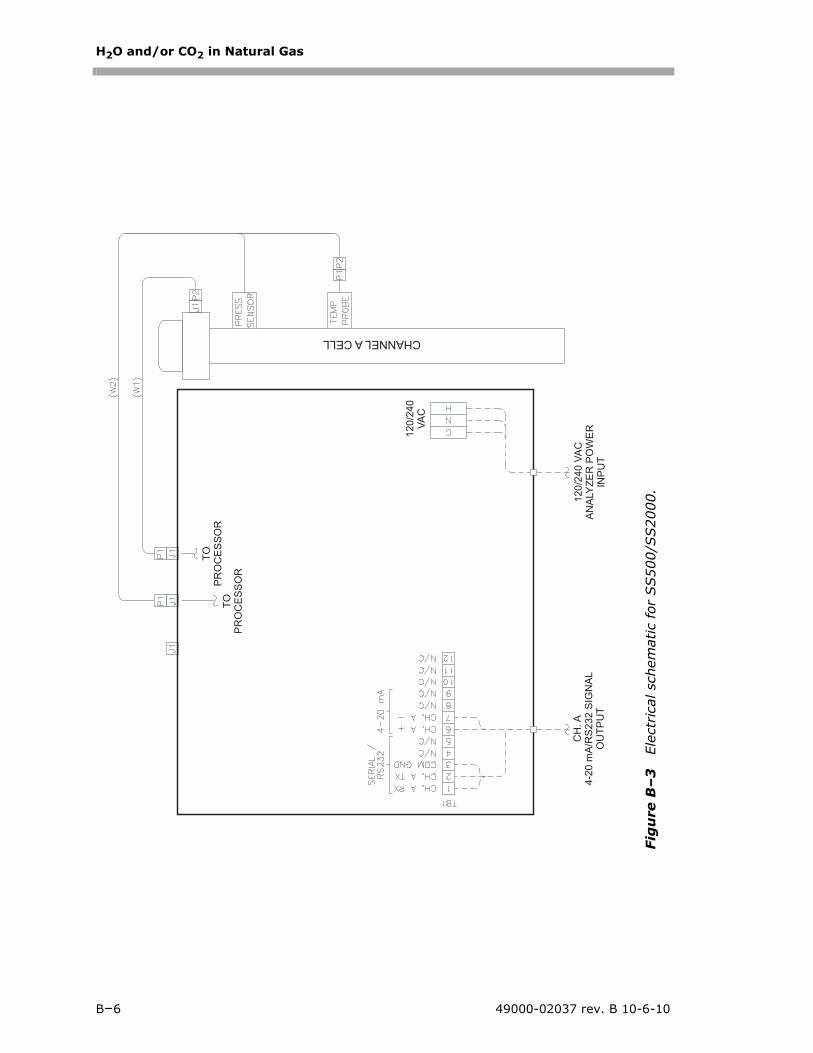
H2O and/or CO2 in Natural Gas
B–6 49000-02037 rev. B 10-6-10
Fig
ure
B–
3
Ele
ctrica
l sc
hem
atic
for
SS500/S
S2000.
TO
PR
OC
ES
SO
R
TO
PR
OC
ES
SO
R
12
0/2
40
VA
C
12
0/2
40
VA
CA
NA
LY
ZE
RP
OW
ER
INP
UT
CH
.A
4-2
0m
A/R
S2
32
SIG
NA
LO
UT
PU
T
CHANNELACELL
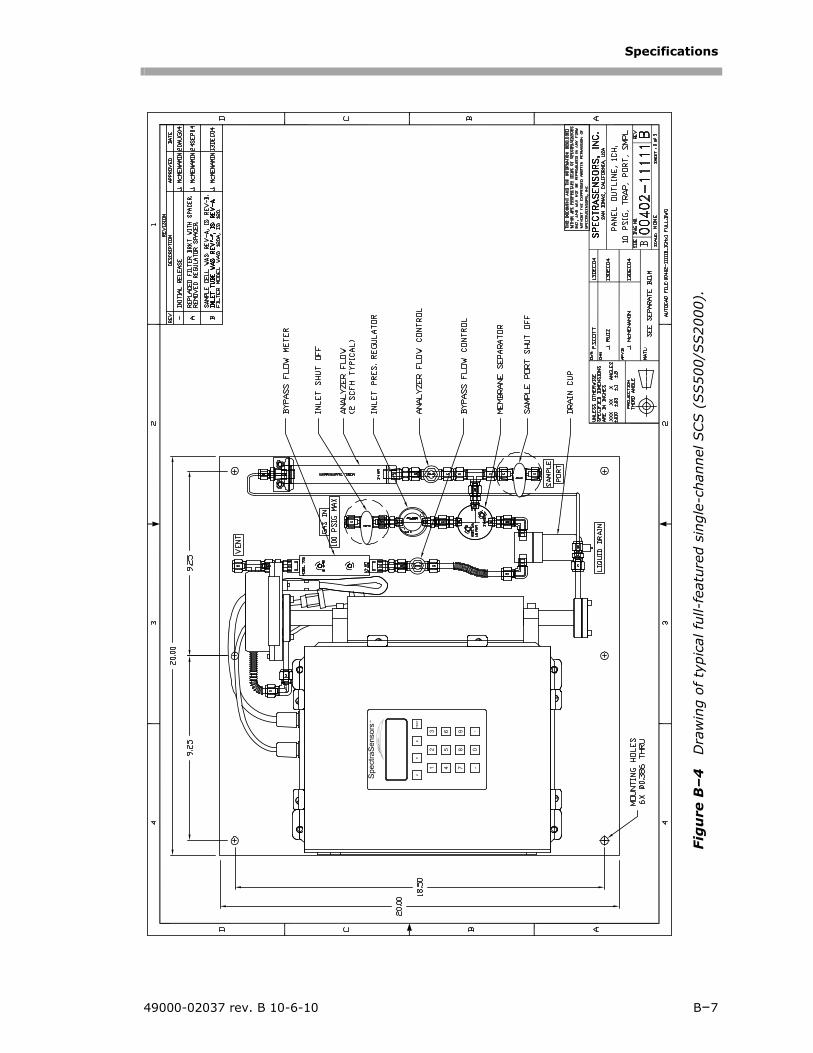
Specifications
49000-02037 rev. B 10-6-10 B–7
Fig
ure
B–
4
Dra
win
g o
f ty
pic
al f
ull-
featu
red s
ingle
-channel
SCS (
SS500/S
S2000).
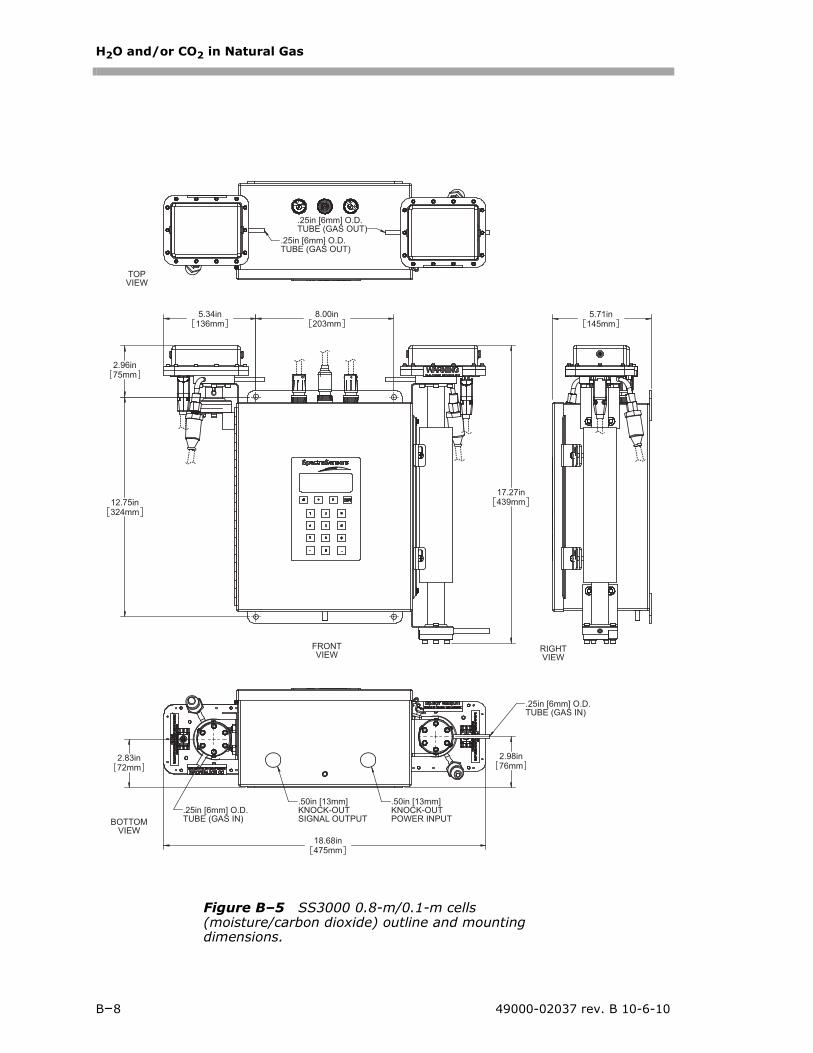
H2O and/or CO2 in Natural Gas
B–8 49000-02037 rev. B 10-6-10
TUBE (GAS OUT).25in [6mm] O.D.
.25in [6mm] O.D.TUBE (GAS OUT)
TOPVIEW
FRONTVIEW
75mm2.96in
324mm12.75in
5.34in136mm
8.00in203mm
17.27in439mm
.25in [6mm] O.D.
SIGNAL OUTPUTKNOCK-OUT.50in [13mm]
POWER INPUTKNOCK-OUT
TUBE (GAS IN)
.50in [13mm].25in [6mm] O.D.TUBE (GAS IN)BOTTOM
VIEW
2.83in72mm 76mm
2.98in
18.68in475mm
RIGHTVIEW
5.71in145mm
Figure B–5 SS3000 0.8-m/0.1-m cells (moisture/carbon dioxide) outline and mounting dimensions.
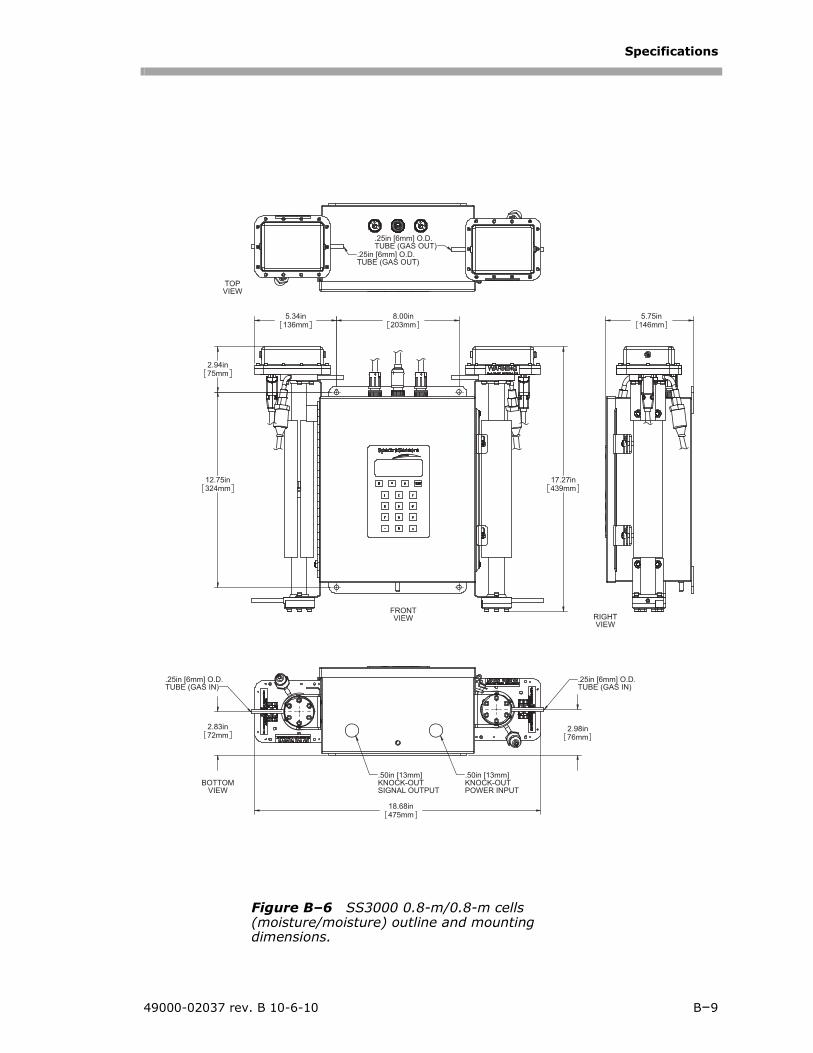
Specifications
49000-02037 rev. B 10-6-10 B–9
VIEW
TUBE (GAS IN)
BOTTOM
.25in [6mm] O.D..25in [6mm] O.D.TUBE (GAS IN)
76mm2.98in
18.68in475mm
2.83in72mm
.50in [13mm]KNOCK-OUTSIGNAL OUTPUT
.50in [13mm]KNOCK-OUTPOWER INPUT
RIGHTVIEW
5.75in146mm
.25in [6mm] O.D.TUBE (GAS OUT)
TOPVIEW
.25in [6mm] O.D.TUBE (GAS OUT)
FRONTVIEW
12.75in324mm
136mm5.34in
17.27in439mm
75mm2.94in
8.00in203mm
Figure B–6 SS3000 0.8-m/0.8-m cells (moisture/moisture) outline and mounting dimensions.
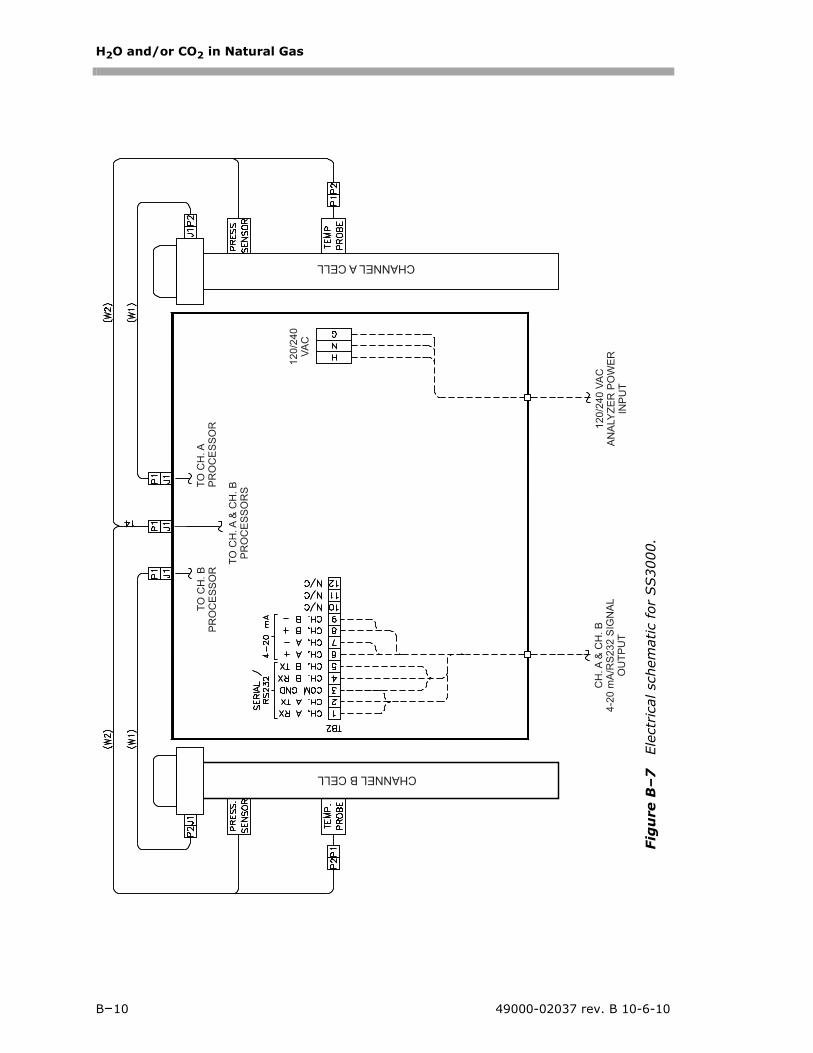
H2O and/or CO2 in Natural Gas
B–10 49000-02037 rev. B 10-6-10
Fig
ure
B–
7
Ele
ctrica
l sc
hem
atic
for
SS3000.
CHANNELBCELL
CHANNELACELL
TO
CH
.B
PR
OC
ES
SO
R
12
0/2
40
VA
C
12
0/2
40
VA
CA
NA
LY
ZE
RP
OW
ER
INP
UT
CH
.A
&C
H.B
4-2
0m
A/R
S2
32
SIG
NA
LO
UT
PU
T
TO
CH
.A
PR
OC
ES
SO
R
TO
CH
.A
&C
H.B
PR
OC
ES
SO
RS
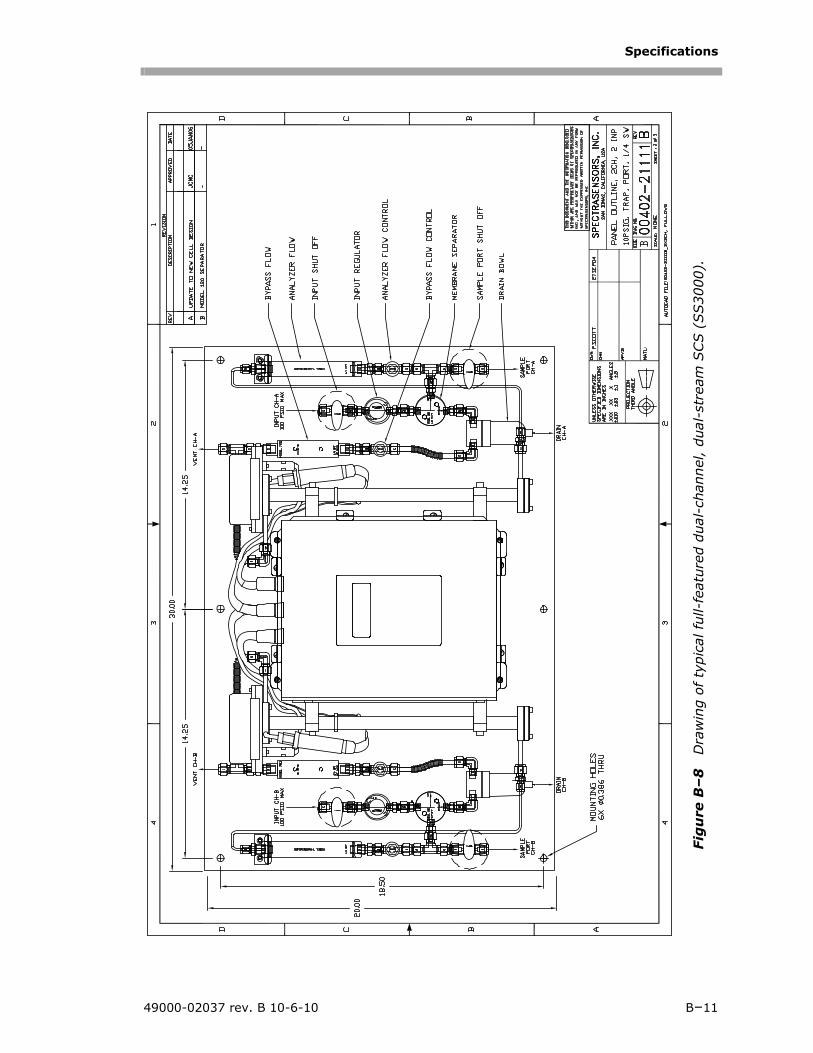
Specifications
49000-02037 rev. B 10-6-10 B–11
Fig
ure
B–
8
Dra
win
g o
f ty
pic
al f
ull-
featu
red d
ual-
chan
nel
, dual-
stre
am
SCS (
SS3000).
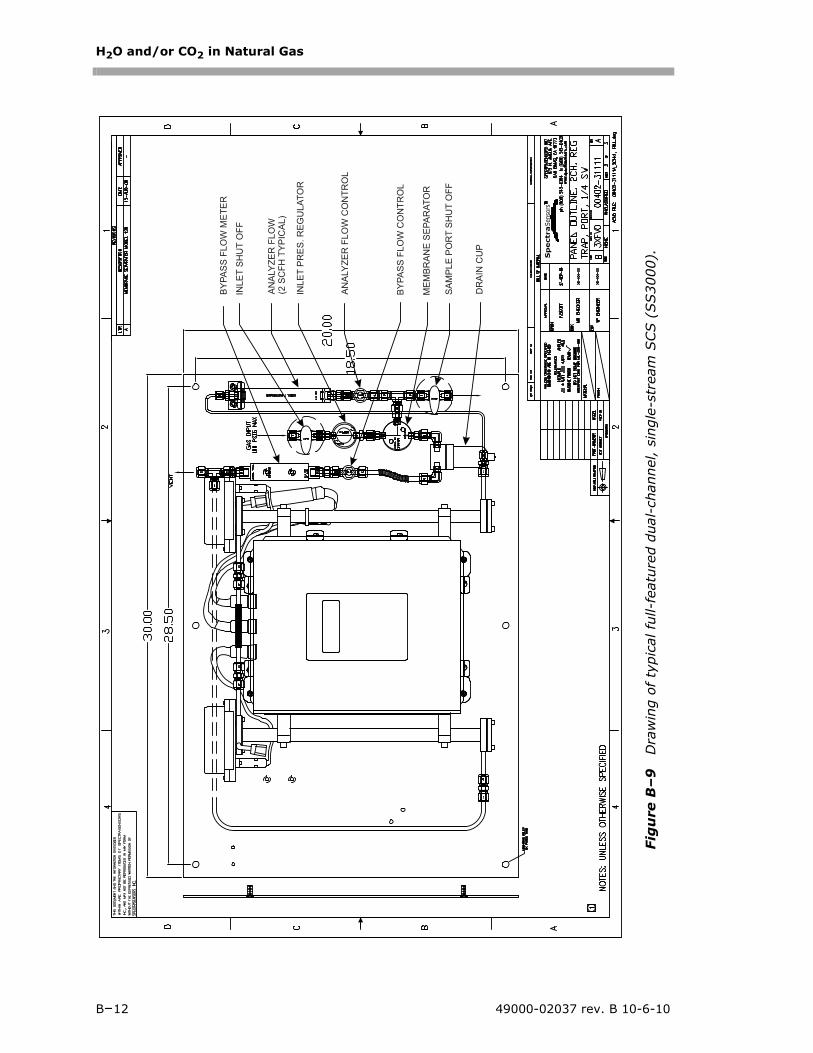
H2O and/or CO2 in Natural Gas
B–12 49000-02037 rev. B 10-6-10
AN
ALY
ZE
R F
LO
W(2
SC
FH
TY
PIC
AL
)
BY
PA
SS
FL
OW
ME
TE
R
BY
PA
SS
FL
OW
CO
NT
RO
L
ME
MB
RA
NE
SE
PA
RA
TO
R
DR
AIN
CU
P
SA
MP
LE
PO
RT
SH
UT
OF
F
INL
ET
PR
ES
. R
EG
UL
AT
OR
INL
ET
SH
UT
OF
F
AN
ALY
ZE
R F
LO
W C
ON
TR
OL
Fig
ure
B–
9
Dra
win
g o
f ty
pic
al f
ull-
featu
red d
ual-
chan
nel
, si
ngle
-str
eam
SCS (
SS3000).
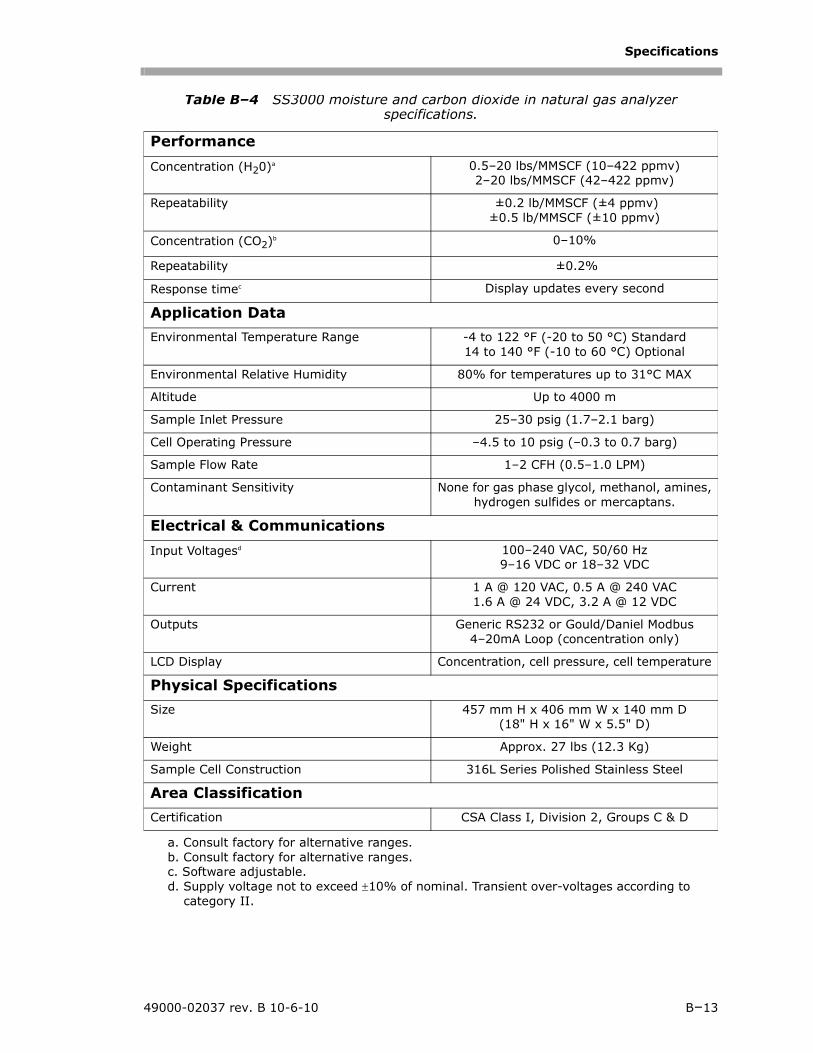
Specifications
49000-02037 rev. B 10-6-10 B–13
Table B–4 SS3000 moisture and carbon dioxide in natural gas analyzer specifications.
Performance
Concentration (H20)a
a. Consult factory for alternative ranges.
0.5–20 lbs/MMSCF (10–422 ppmv)2–20 lbs/MMSCF (42–422 ppmv)
Repeatability ±0.2 lb/MMSCF (±4 ppmv)±0.5 lb/MMSCF (±10 ppmv)
Concentration (CO2)b
b. Consult factory for alternative ranges.
0–10%
Repeatability ±0.2%
Response timec
c. Software adjustable.
Display updates every second
Application Data
Environmental Temperature Range -4 to 122 °F (-20 to 50 °C) Standard14 to 140 °F (-10 to 60 °C) Optional
Environmental Relative Humidity 80% for temperatures up to 31°C MAX
Altitude Up to 4000 m
Sample Inlet Pressure 25–30 psig (1.7–2.1 barg)
Cell Operating Pressure –4.5 to 10 psig (–0.3 to 0.7 barg)
Sample Flow Rate 1–2 CFH (0.5–1.0 LPM)
Contaminant Sensitivity None for gas phase glycol, methanol, amines,hydrogen sulfides or mercaptans.
Electrical & Communications
Input Voltagesd
d. Supply voltage not to exceed ±10% of nominal. Transient over-voltages according to category II.
100–240 VAC, 50/60 Hz9–16 VDC or 18–32 VDC
Current 1 A @ 120 VAC, 0.5 A @ 240 VAC1.6 A @ 24 VDC, 3.2 A @ 12 VDC
Outputs Generic RS232 or Gould/Daniel Modbus4–20mA Loop (concentration only)
LCD Display Concentration, cell pressure, cell temperature
Physical Specifications
Size 457 mm H x 406 mm W x 140 mm D(18" H x 16" W x 5.5" D)
Weight Approx. 27 lbs (12.3 Kg)
Sample Cell Construction 316L Series Polished Stainless Steel
Area Classification
Certification CSA Class I, Division 2, Groups C & D
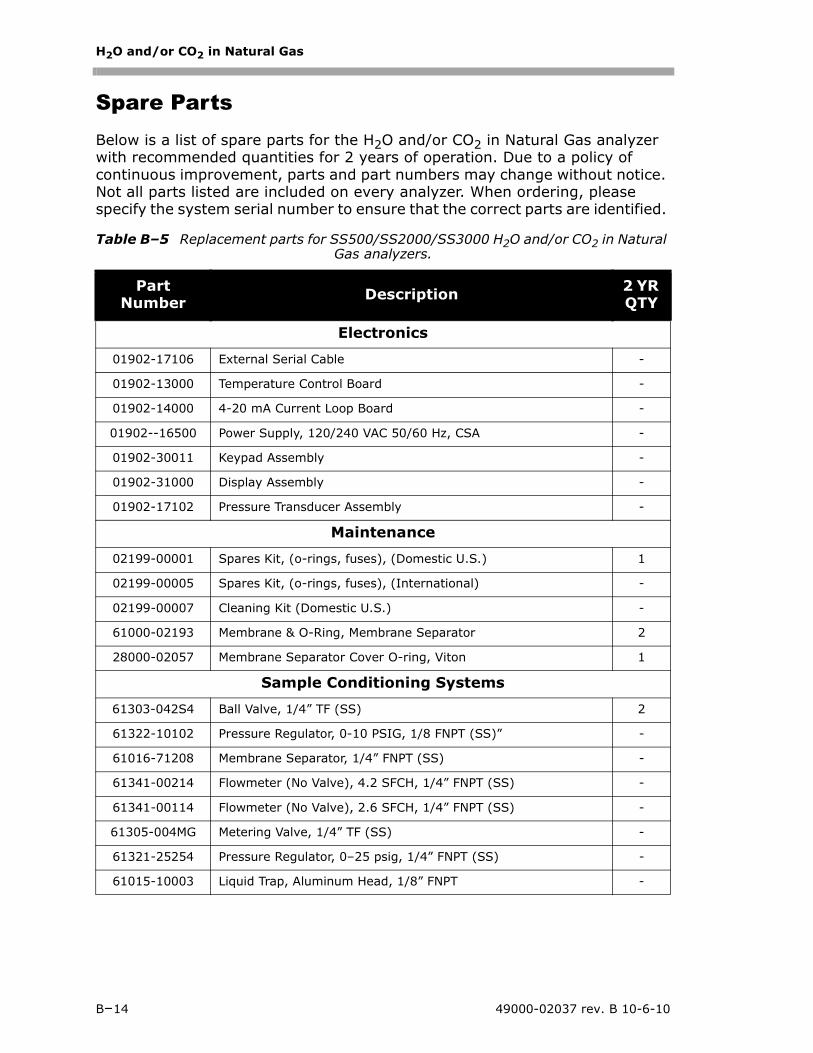
H2O and/or CO2 in Natural Gas
B–14 49000-02037 rev. B 10-6-10
Spare PartsBelow is a list of spare parts for the H2O and/or CO2 in Natural Gas analyzer with recommended quantities for 2 years of operation. Due to a policy of continuous improvement, parts and part numbers may change without notice. Not all parts listed are included on every analyzer. When ordering, please specify the system serial number to ensure that the correct parts are identified.
Table B–5 Replacement parts for SS500/SS2000/SS3000 H2O and/or CO2 in Natural Gas analyzers.
Part Number Description 2 YR
QTY
Electronics
01902-17106 External Serial Cable -
01902-13000 Temperature Control Board -
01902-14000 4-20 mA Current Loop Board -
01902--16500 Power Supply, 120/240 VAC 50/60 Hz, CSA -
01902-30011 Keypad Assembly -
01902-31000 Display Assembly -
01902-17102 Pressure Transducer Assembly -
Maintenance
02199-00001 Spares Kit, (o-rings, fuses), (Domestic U.S.) 1
02199-00005 Spares Kit, (o-rings, fuses), (International) -
02199-00007 Cleaning Kit (Domestic U.S.) -
61000-02193 Membrane & O-Ring, Membrane Separator 2
28000-02057 Membrane Separator Cover O-ring, Viton 1
Sample Conditioning Systems
61303-042S4 Ball Valve, 1/4” TF (SS) 2
61322-10102 Pressure Regulator, 0-10 PSIG, 1/8 FNPT (SS)” -
61016-71208 Membrane Separator, 1/4” FNPT (SS) -
61341-00214 Flowmeter (No Valve), 4.2 SFCH, 1/4” FNPT (SS) -
61341-00114 Flowmeter (No Valve), 2.6 SFCH, 1/4” FNPT (SS) -
61305-004MG Metering Valve, 1/4” TF (SS) -
61321-25254 Pressure Regulator, 0–25 psig, 1/4” FNPT (SS) -
61015-10003 Liquid Trap, Aluminum Head, 1/8” FNPT -

SS500/SS2000/SS3000 Operator’s Manual Index–1
INDEX4-20 mA current loop 2–5, 4–18Absorption 1–4, 1–5Absorption coefficient 1–5Absorption profile 1–6Absorption spectrometer 1–4Absorption spectroscopy 1–4Accessories. See Options.Acetone A–2Acetone-impenetrable gloves A–2, A–3Alarms
General Fault Alarm 4–19Attenuation 1–5Background gas 1–1, 4–17, 4–20Beam path 1–5Beer-Lambert absorption law 1–5Cautions 1–2Cleaning
Gas sampling lines A–1Mirrors A–2
COM port A–12, A–13COM properties 5–1, 5–3Concentration 4–2, 4–7, 4–11Contamination 1–6, 4–21, A–1Control system
Tracer 3–5Current loop 2–10, 4–11
Calibrating 4–18Receiver 2–11
Current tuning 1–5Data 1–5
Diagnostic 4–5, 4–6, 4–7, 5–6, 5–7Normalized 2f 1–7Normalized absorption 1–7Raw 1–5
Data string 5–4Detector 1–4, 1–5Differential switching 1–4Diode laser absorption spectrometer 1–4Electric traced tubing 3–3Electric tracer 3–5Electrical noise A–1, A–4Electronics enclosure 2–4, 2–5Enclosure
Electronics 2–5, 2–10, 2–11, 2–12Heated 1–4
Erroneous readings 2–15Excessive sampling gas pressure A–1,
A–4, A–6Excessive sampling gas temperature
A–1, A–4, A–6
External data logger 4–11Faults
Null Fail Error 4–6, 4–19, A–9Null Fail Error B 4–19P/T Fail Error A–4, A–9Power Fail Error 4–6, 4–19, A–1,
A–2, A–8Power Fail Error B 4–19PT Fail Error 4–19PT Fail Error B 4–19Spectrum Fail Err B 4–19Spectrum Fail Error 4–6, 4–19, A–9Track Fail Error 4–6, 4–19, A–4,
A–10Track Fail Error B 4–19
Field-pressure reducing regulator 3–1Field-pressure reducing station 3–3, 3–4,
3–5, 3–6, 3–7, 3–8, 3–9, 3–10Firmware version 5–16Flowmeter 3–2, 3–5, 3–6, 3–7, 3–9,
3–10, 4–20Sample Bypass 3–9
Gas leaks 2–14, 2–15, A–1, A–2Gas lines 2–13Gas sampling line A–2Gas standard 4–20Ground wire 2–5Hardware 2–2Hazardous environments 1–4HyperTerminal 5–1Import stored data into spreadsheet 5–5Incident intensity 1–5, 1–6Initialization period 4–1Installation 2–1, 2–2Intermediate calculation 4–7Isopropanol A–2, A–3Keypad 4–2, 4–3Laser absorption spectrometer 1–5Laser beam 1–5Laser output fluctuations 1–6LCD display 4–2Leak detector 2–14, 2–15, A–2Leaks A–1Lens cleaning cloth A–3, A–4Lens tissue A–2Lock-in amplifier 1–6Mating terminal block 2–10, 2–11, 2–13Measurement parameters 4–2Measurement units 4–2Membrane separator 3–11, A–1
H2O and/or CO2 in Natural Gas
Index–2 49000-02037 rev. B 10-7-10
membrane separator 3–2Microsoft Excel 5–5Mirror contamination 1–5, 1–6, A–1, A–2Modes
Mode 1 (Normal Mode) 4–3, 4–4, 4–8, 5–5, 5–14, A–6
Mode 2 (Set Parameter Mode - Channel A) 4–4, 4–8, 5–4, 5–14, A–6
Mode 3 (Set Parameter Mode - Channel B) 4–4, 4–5, 4–8, 5–4, 5–14, A–6
Mode 4 (System Diagnostic Parameters - Channel A) 4–5, 4–6, A–5, A–9, A–10
Mode 5 (System Diagnostic Parameters - Channel B) 4–6, A–5, A–9, A–10
Mode 6 (Diagnostic Data Download) 4–7, 5–4, 5–5, 5–10, A–8, A–9
Mode TEST (System Test) 4–7National Institute of Standards and
Technology 4–20Natural frequencies 1–5Noise in the measurement 4–11Optional analyzer hood 2–3Options 1–1, 1–4Outline schematic B–6, B–7, B–10, B–11,
B–12Output Signal
4-20 mA current loop 2–5Serial output 2–5
ParametersDiagnostic
Indx 4–6, 5–4, 5–16PkD1 4–6, 4–19, 5–4, 5–16, A–5,
A–10PkDf 4–6, 4–7, 4–19, A–5, A–10Powr 4–6, 5–16PP2F 4–6, 5–4, 5–16Reference Peak Index 5–4Reference Peak Power 5–4Reference Peak PP2F 5–4Zero 4–6, 5–4, 5–17
Measurement and control 4–8# Spectrum Average 4–11, 5–4,
5–1720 mA Value 4–13, 4–14, 4–18,
5–164 mA Value 4–13, 4–14, 4–18,
5–164-20 mA % Test 4–12, 4–18,
5–17
4-20 mA Alarm Action 4–12, 4–19, 5–17, A–12
Concentration Unit 4–14, 5–17Logger Rate 4–11, 5–17Low Power Warning 4–12,
4–18, 5–17Modbus Address 4–15, 5–14,
5–17Modbus Mode 4–15, 5–1, 5–12,
5–14, 5–17Peak Tracking 4–2, 4–11, 5–17,
A–6Pipeline Pressure 4–14, 5–16Powr 5–4Pressure Unit 4–14, 5–16, 5–17S Factor 4–10, 4–16, 4–17, 5–16S Factor Offset 4–10, 4–16,
4–17, 5–16Temperature Unit 4–13, 4–14,
5–17User Analyzer ID 4–15, 5–16User Component ID 4–16, 5–16User Password 4–16, 5–17User Sample ID 4–16, 5–16
Password 4–4, 4–5, 4–8, 5–13, 5–16, 5–17, A–5
Peak tracking function 4–11Pin numbers 2–11Port
Bypass return 2–15Check gas 4–20Pressure relief vent 2–13, 2–15Sample inlet 2–14Sample return 2–15, 3–3Sample supply 3–2Validation gas 4–20
Potential hazards 1–2Pressure regulator 3–2, 3–3, 3–4, 3–5,
3–6, 3–7, 3–8, 3–9, 3–10, 4–20Purge system 1–4Purging 1–4Recommendations and solutions to
common problems 4–19, A–1Resonances. See Natural FrequenciesResponse time 4–11Return materials authorization (RMA)
number A–6RS-232 Output 5–1Sample 1–4Sample bypass 3–5, 3–6, 3–7, 3–9, 3–10Sample cell 1–4, A–1Sample cell pressure 4–2Sample cell temperature 4–2

Index
49000-02037 rev. B 10-7-10 Index–3
Sample conditioning system (SCS) 1–4, 3–1, 3–2, 3–3, 3–4, 3–5, 3–6, 3–7, 3–8, 3–9, 3–10, 3–11
Sample gas 1–5, 3–2Sample probe 3–1, 3–3, 3–4, 3–5, 3–6,
3–8, 3–9, 3–11SCS 3–1Serial cable 2–10, 2–11Serial connection 2–10Serial port 2–11, 5–4Service contact A–6Signal wires 2–10Species concentration 1–5Spectra
2f 4–7, 5–10DC 4–7
Stainless steel tubing 2–13, 2–14, A–1Symbols 1–2System conditioning 2–15Temperature controller
Electric tracer 3–5Tools 2–2Tools and supplies A–2Trace species detection 1–4Tunable diode laser 1–4Units 4–13
Concentration 4–14Pressure 4–14Temperature 4–13
Validation 4–20Validation gas 4–20Valve
Check gas 4–20Isolation 3–1, 3–3, 3–4, 3–5, 3–8,
3–9Metering 3–2, 3–5, 3–6, 3–7, 3–10,
4–20Relief 3–3, 3–4, 3–5, 3–6, 3–8, 3–10Shut-off 3–2, 3–5, 3–6, 3–8, 3–9,
3–10Validation gas 4–20
Vent line 3–3, 3–4Warnings 1–2
Low Power Warning 4–18, 5–17Low Power Warning B 4–18
Wavelength modulation spectroscopy 1–6
