4470 lecture 11 2007.ppt
DESCRIPTION
TRANSCRIPT
Product Manufacturing
CHEN 4470 – Process Design Practice
Dr. Mario Richard EdenDepartment of Chemical Engineering
Auburn University
Lecture No. 11 – Introduction to Six Sigma in Product Manufacturing
March 6, 2007
Contains Material Developed by Dr. Daniel R. Lewin, Technion, Israel
Instructional Objectives
Be able to define the Sigma Level of a manufacturing process
Know the steps followed in product design and manufacture (DMAIC)
Be able to qualitatively analyze a process for the manufacture of a product and know how to identify the CTQ step using DMAIC
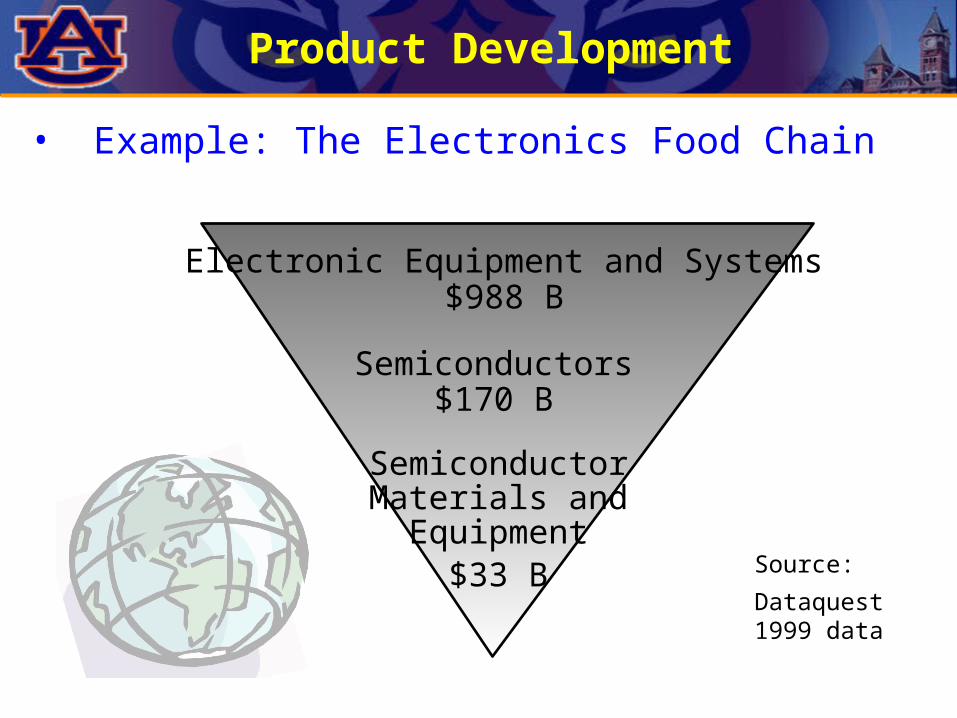
• Example: The Electronics Food Chain
Product Development
Source:
Dataquest1999 data
Electronic Equipment and Systems$988 B
Semiconductors$170 B
Materials and
$33 BEquipment
Semiconductor
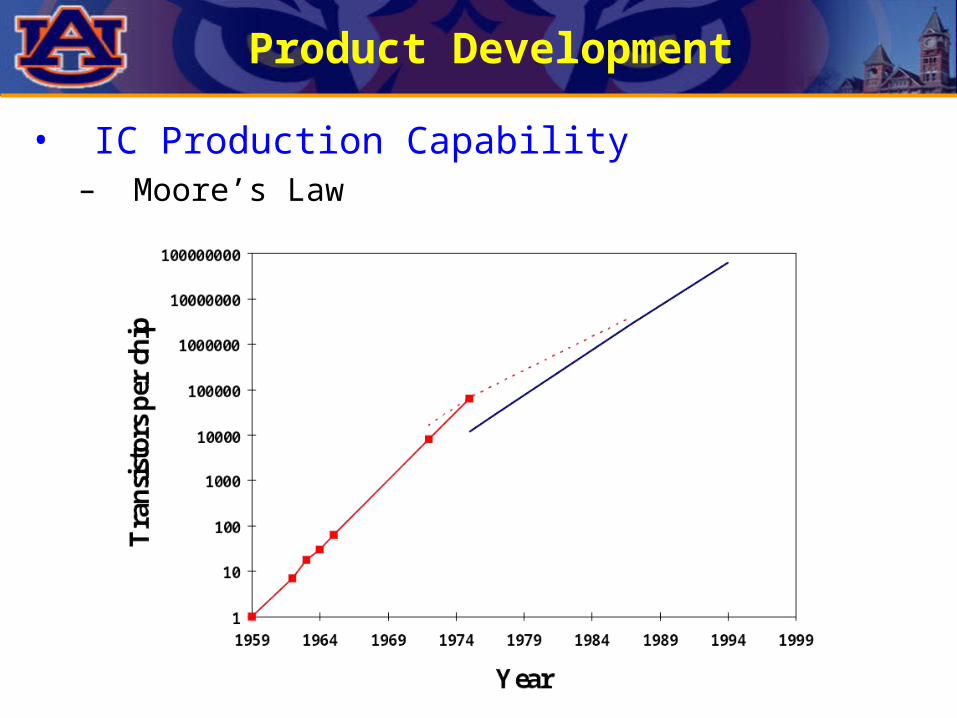
• IC Production Capability– Moore’s Law
Product Development

• Device Complexity Trends
Product Development
Chip Area
Device Year Transistors per Chip
(cm2)8086 1978 30K
0.3480286 1981 120K
0.7780386 1985 400K 1.0486 1990 2M 1.8Pentium 1993 3.5M 2.9Pentium Pro 1995 5.5M 2.9
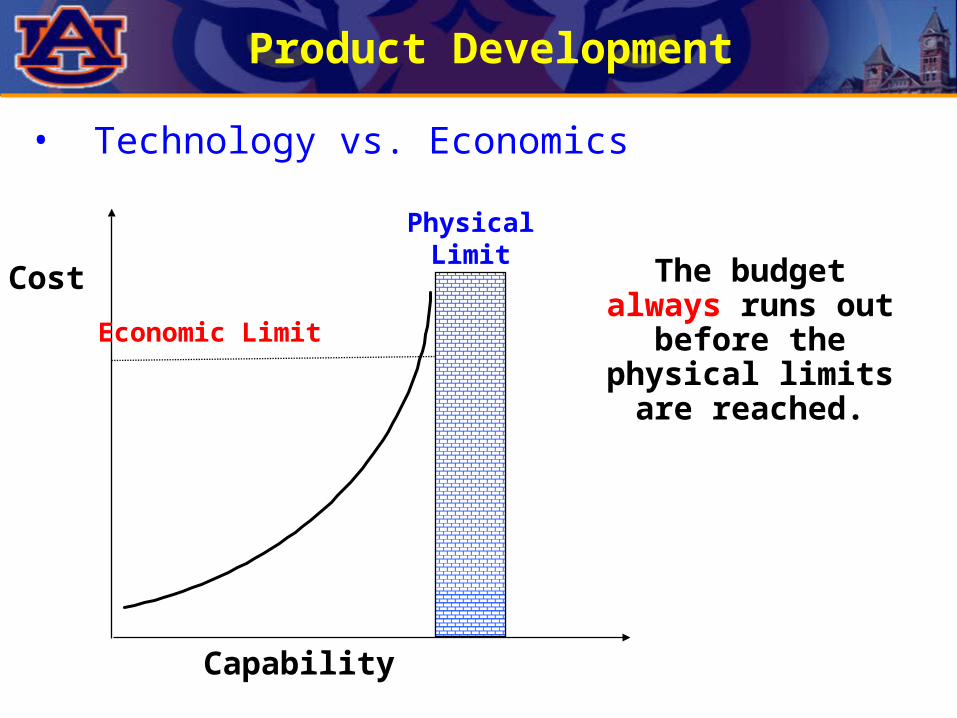
• Technology vs. Economics
Product Development
PhysicalLimit
Economic Limit
The budget always runs out
before the physical limits are reached.
Capability
Cost
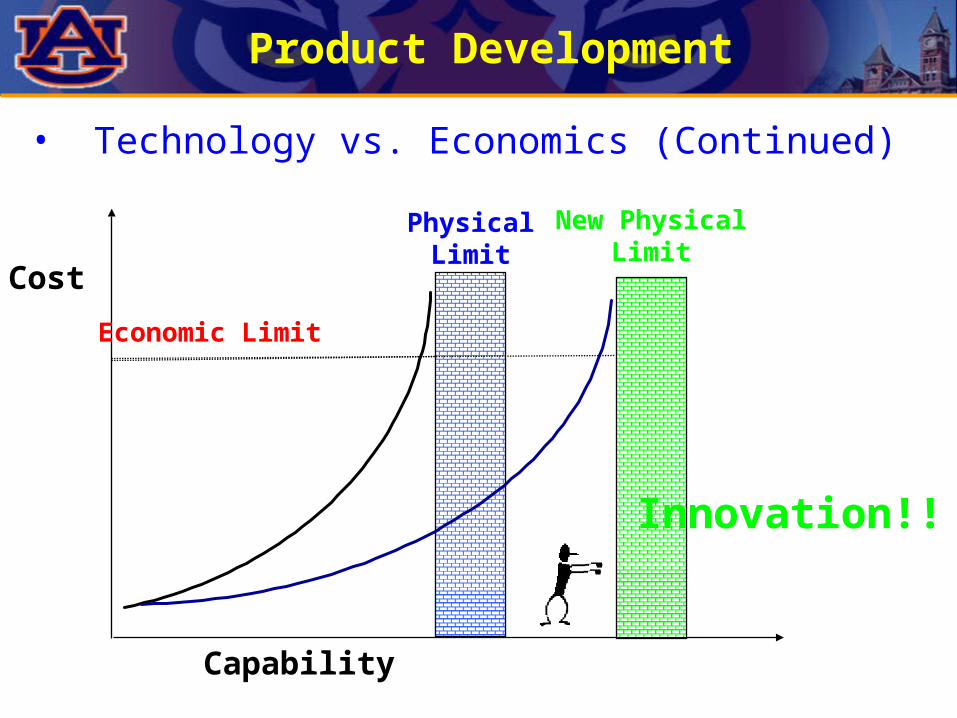
• Technology vs. Economics (Continued)
Product Development
PhysicalLimit
Economic Limit
Capability
Cost
New PhysicalLimit
Innovation!!

• Implications of Blind Faith in Moore’s Law– Fear is that exponential growth is only the first
half of an “S” shaped curve
Product Development
Reven
ue
Time

• Industry Drivers (Push vs. Pull)– Market requires (push):
• Smaller feature sizes desired• Larger chip area desired• Improved IC designs lead to innovations
– IC industry delivers (pull):• Lower cost per function (higher performance per cost)• New applications are enabled to use chips with new
capabilities• Higher volumes produced
Product Development
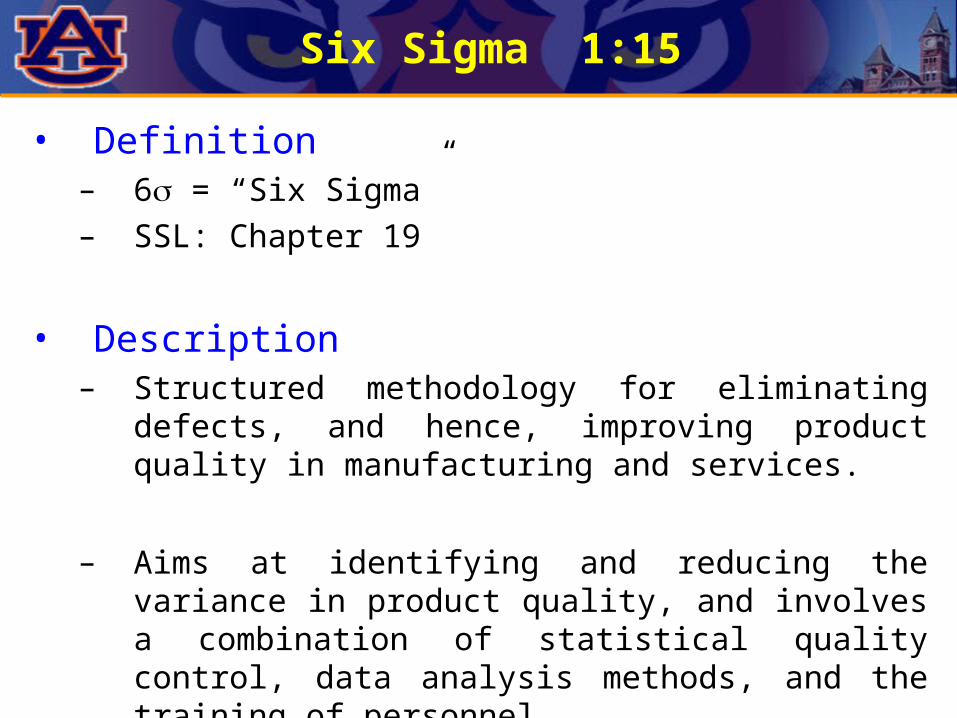
• Definition– 6 = “Six Sigma”– SSL: Chapter 19
• Description– Structured methodology for eliminating defects,
and hence, improving product quality in manufacturing and services.
– Aims at identifying and reducing the variance in product quality, and involves a combination of statistical quality control, data analysis methods, and the training of personnel.
Six Sigma 1:15
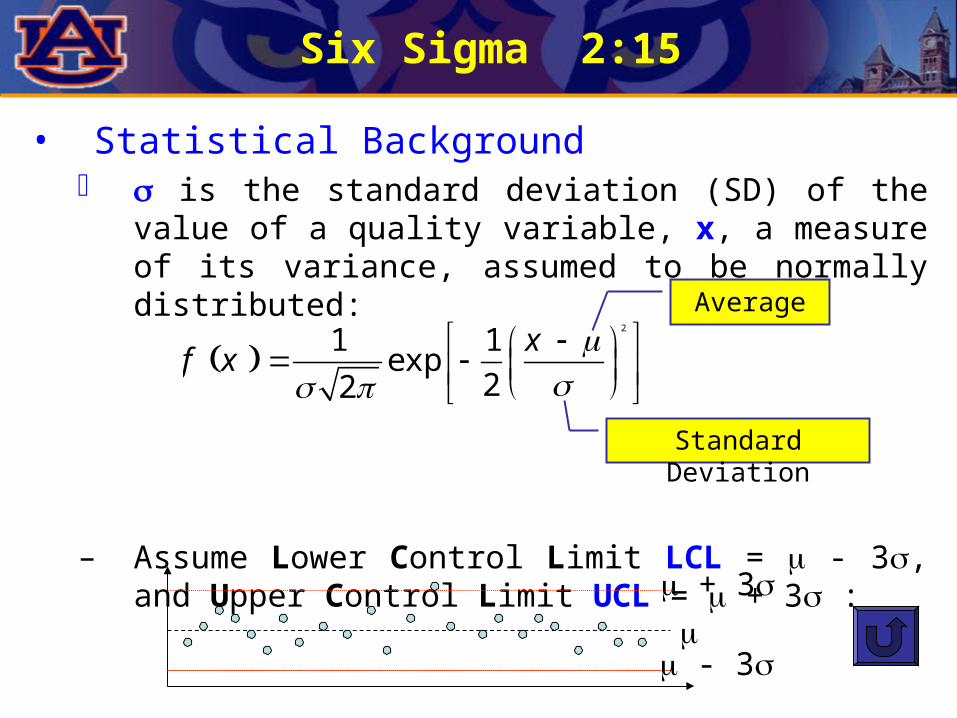
• Statistical Background is the standard deviation (SD) of the value of a
quality variable, x, a measure of its variance, assumed to be normally distributed:
– Assume Lower Control Limit LCL = - 3, and Upper Control Limit UCL = + 3 :
Six Sigma 2:15
2
1 1exp
22
xf x
Average
Standard Deviation
+ 3
- 3

• Statistical Background (Continued)– At SD = , the number of Defects Per Million
Opportunities (DPMO) below the LCL in a normal sample is:
Six Sigma 3:15
36 61
23 3DPMO 10 10 1 1,350f x dx f x dx
In a normal sample, the DPMO will be the same above the UCL. The plot shows f(x) for
= 2.
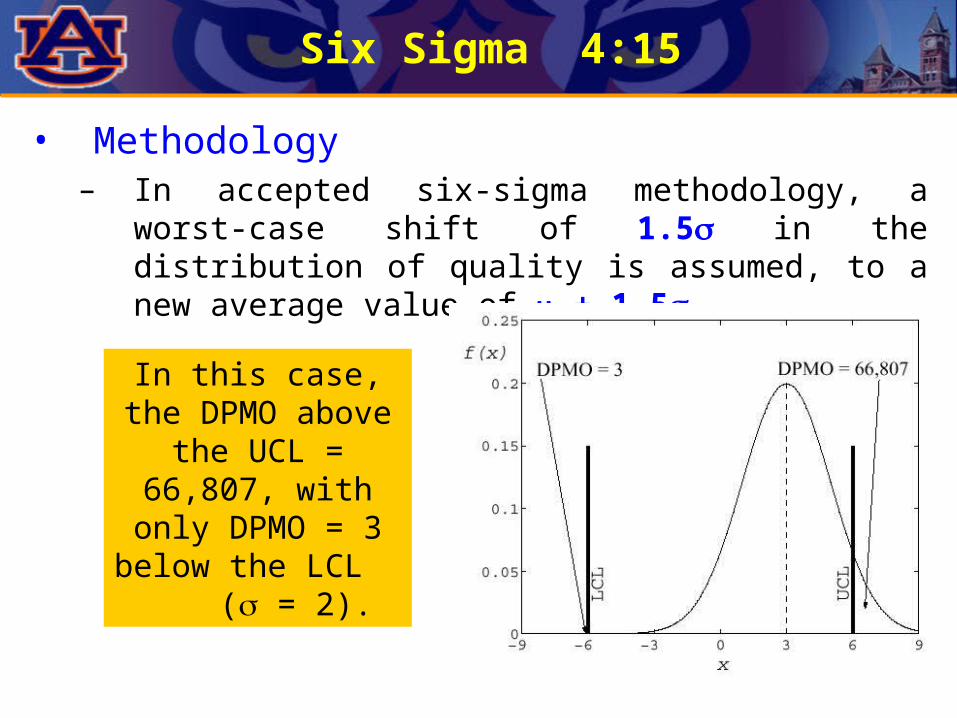
• Methodology– In accepted six-sigma methodology, a worst-case
shift of 1.5 in the distribution of quality is assumed, to a new average value of + 1.5
Six Sigma 4:15
In this case, the DPMO above the UCL = 66,807, with only DPMO = 3 below the
LCL ( = 2).
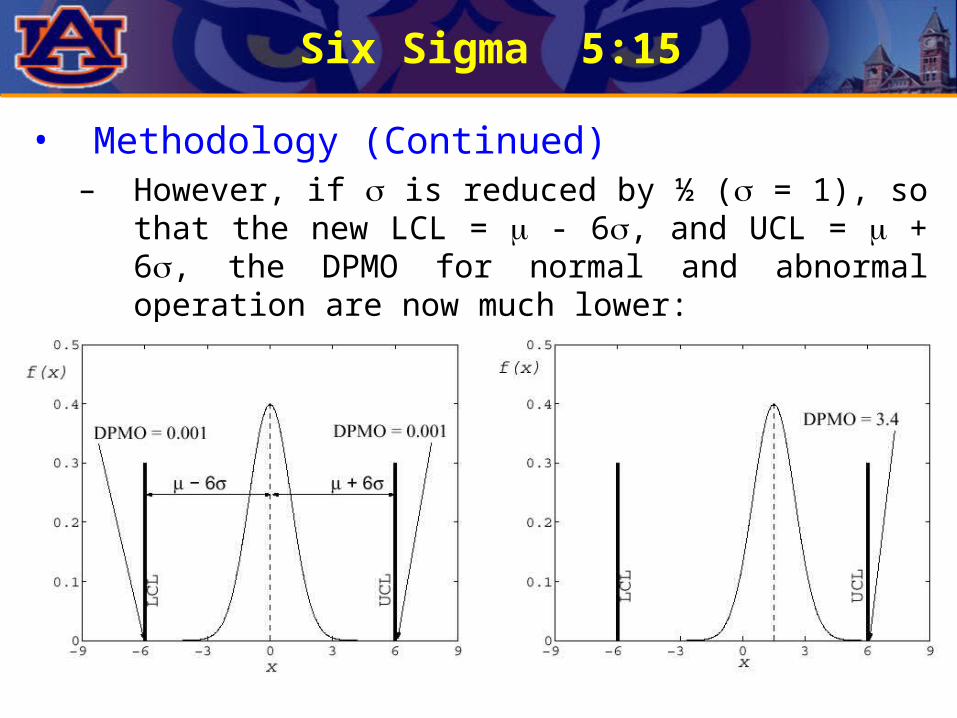
• Methodology (Continued)– However, if is reduced by ½ ( = 1), so that the
new LCL = - 6, and UCL = + 6, the DPMO for normal and abnormal operation are now much lower:
Six Sigma 5:15
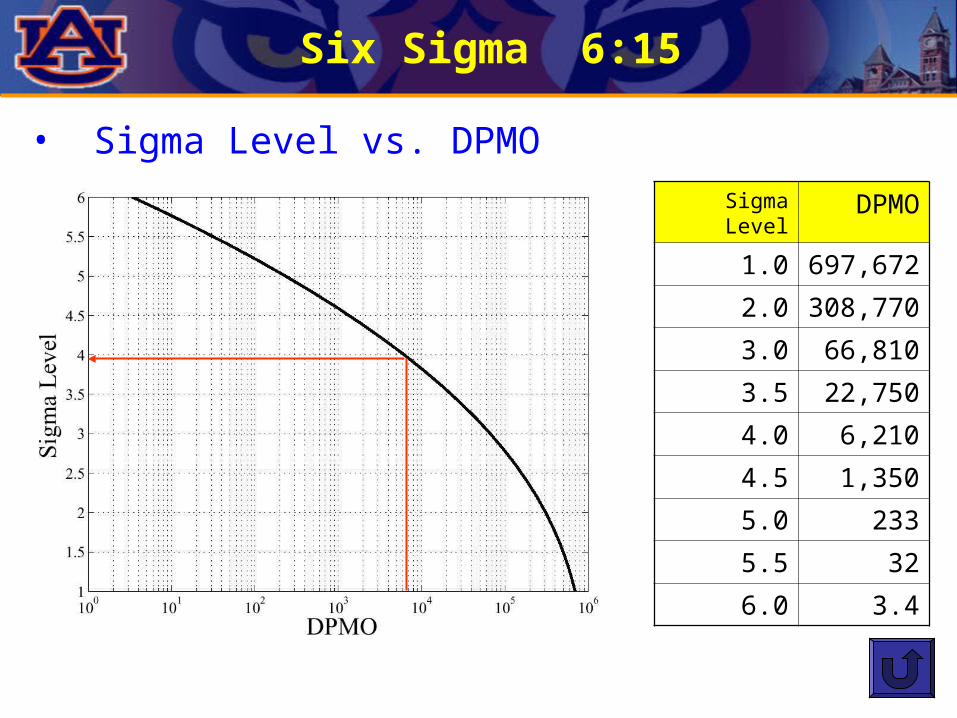
• Sigma Level vs. DPMO
Six Sigma 6:15
Sigma Level
DPMO
1.0 697,672
2.0 308,770
3.0 66,810
3.5 22,750
4.0 6,210
4.5 1,350
5.0 233
5.5 32
6.0 3.4
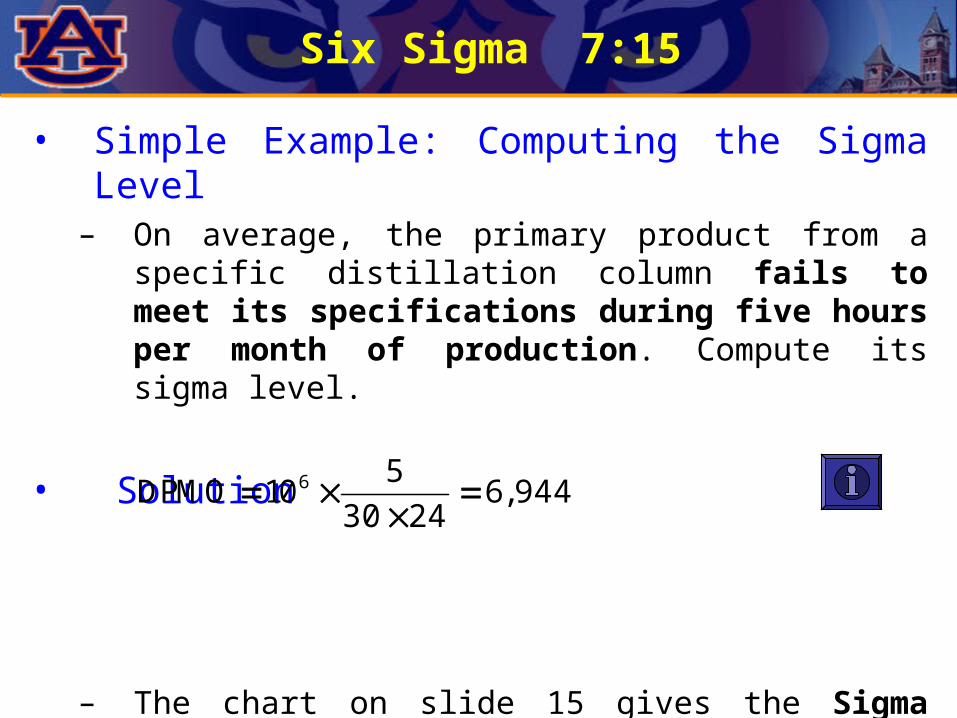
• Simple Example: Computing the Sigma Level
– On average, the primary product from a specific distillation column fails to meet its specifications during five hours per month of production. Compute its sigma level.
• Solution
– The chart on slide 15 gives the Sigma level as 3.8
Six Sigma 7:15
6 5DPMO 10 6,944
30 24
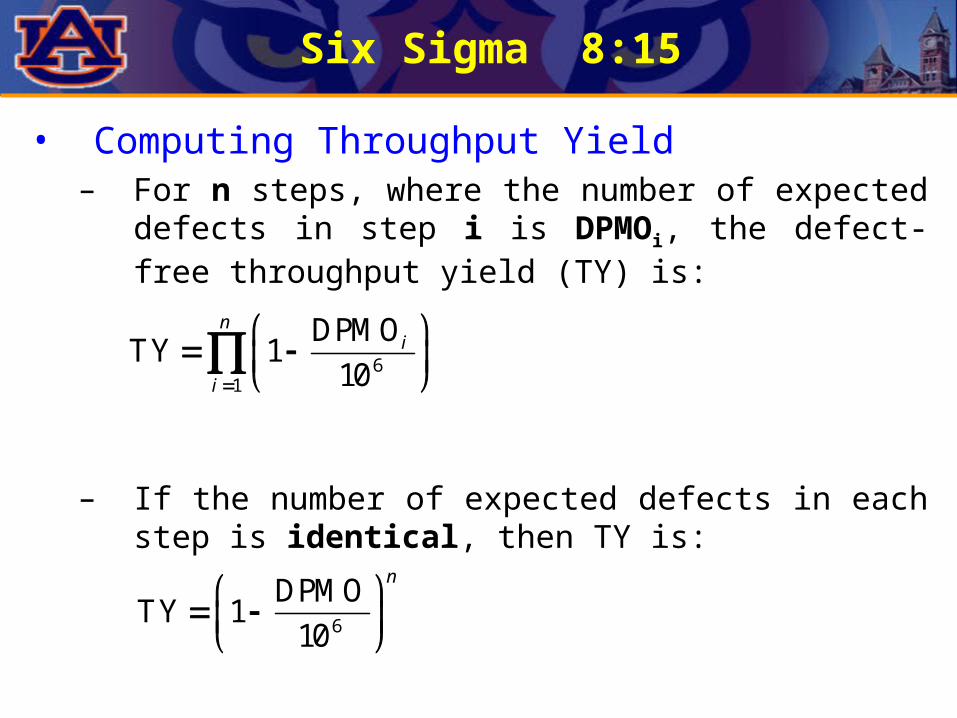
• Computing Throughput Yield– For n steps, where the number of expected
defects in step i is DPMOi, the defect-free throughput yield (TY) is:
– If the number of expected defects in each step is identical, then TY is:
Six Sigma 8:15
61
DPMOTY 1
10
ni
i
6
DPMOTY 1
10
n
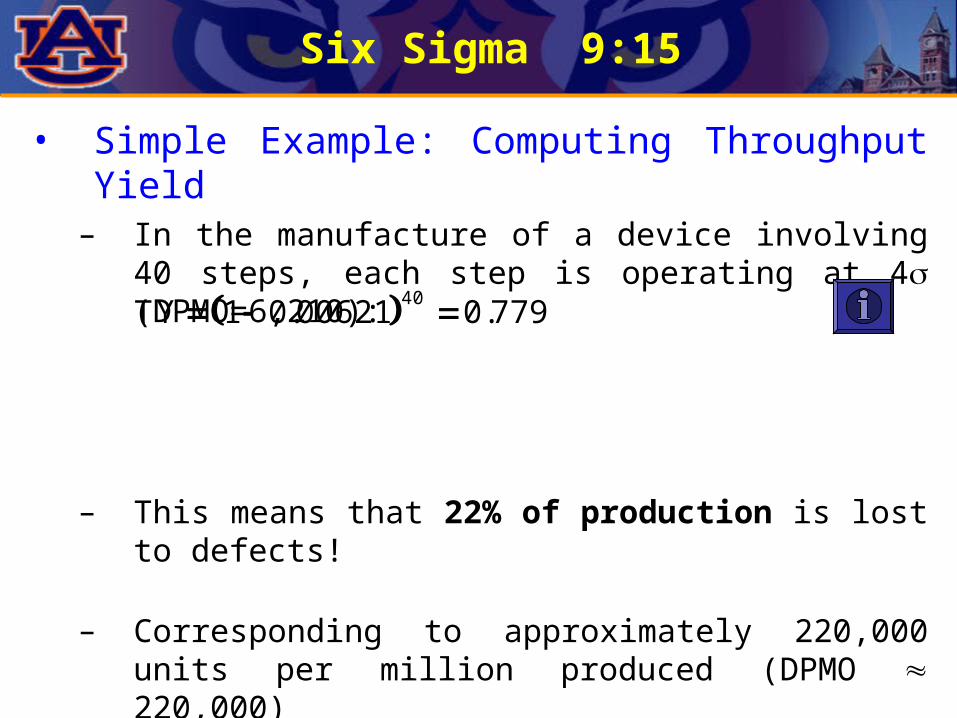
• Simple Example: Computing Throughput Yield
– In the manufacture of a device involving 40 steps, each step is operating at 4 (DPMO=6,210):
– This means that 22% of production is lost to defects!
– Corresponding to approximately 220,000 units per million produced (DPMO 220,000)
– The chart on slide 15 gives the Overall Sigma level as 2.3
Six Sigma 9:15
40TY 1 0.00621 0.779
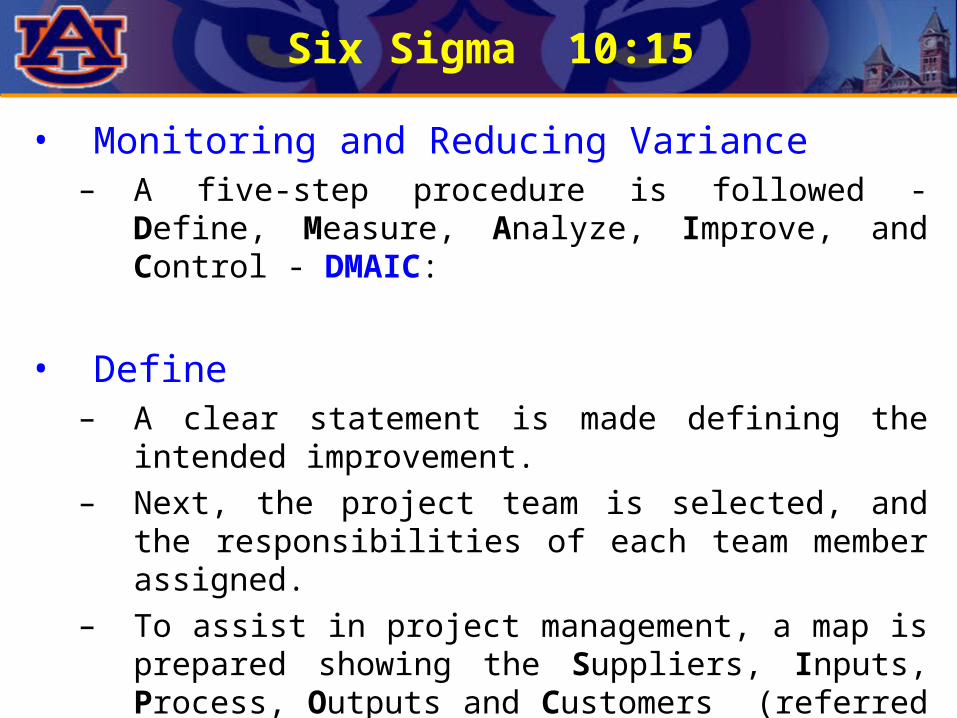
• Monitoring and Reducing Variance– A five-step procedure is followed - Define,
Measure, Analyze, Improve, and Control - DMAIC:
• Define– A clear statement is made defining the intended
improvement. – Next, the project team is selected, and the
responsibilities of each team member assigned. – To assist in project management, a map is
prepared showing the Suppliers, Inputs, Process, Outputs and Customers (referred to by the acronym, SIPOC).
Six Sigma 10:15
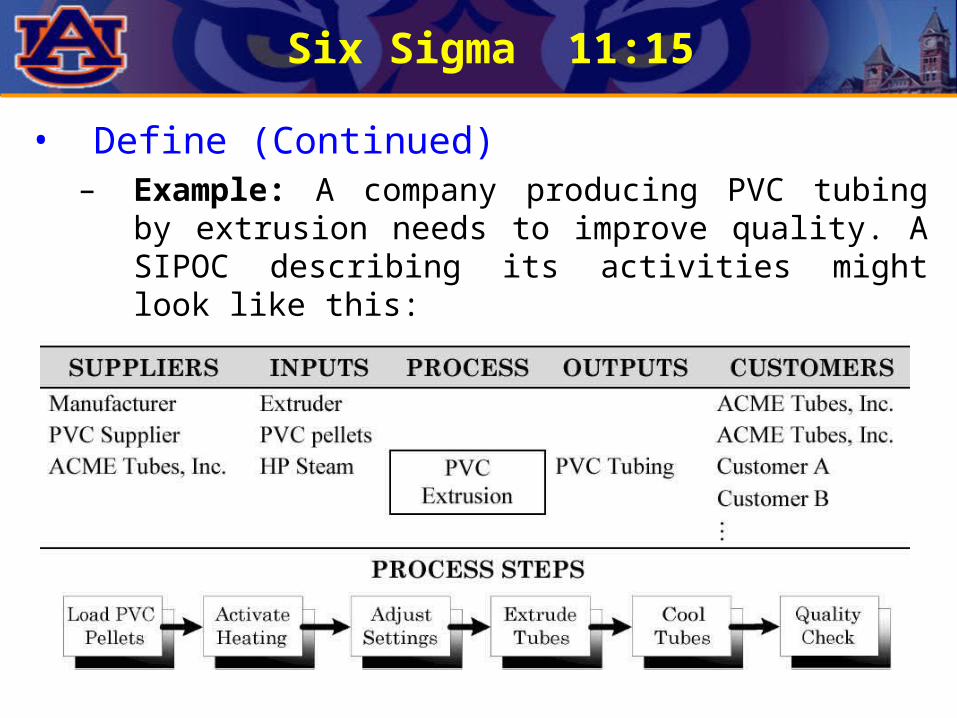
• Define (Continued)– Example: A company producing PVC tubing by
extrusion needs to improve quality. A SIPOC describing its activities might look like this:
Six Sigma 11:15
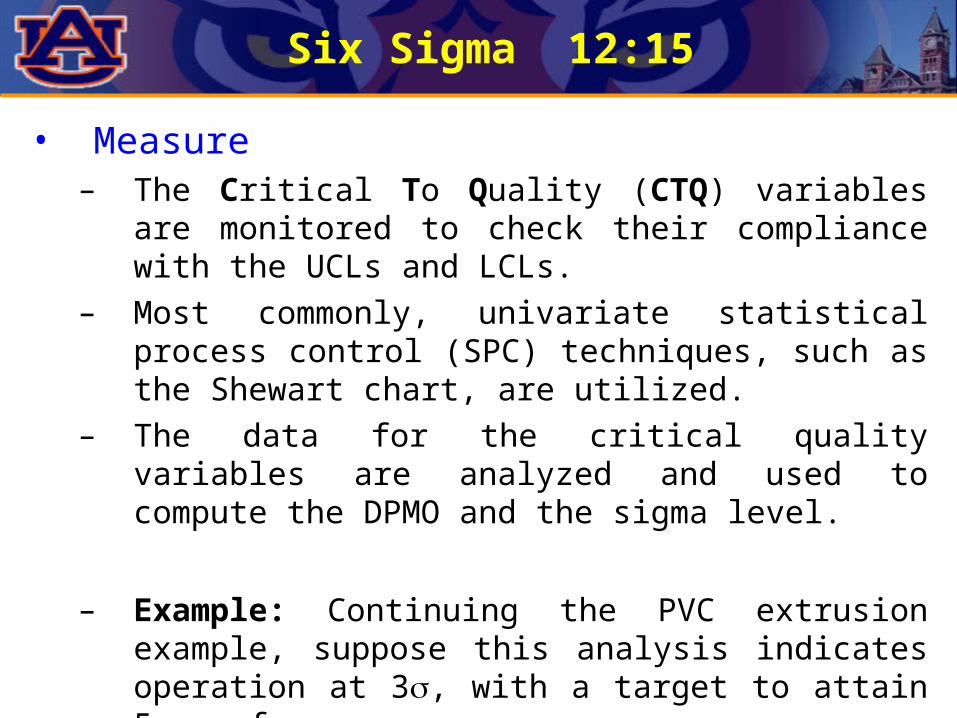
• Measure– The Critical To Quality (CTQ) variables are
monitored to check their compliance with the UCLs and LCLs.
– Most commonly, univariate statistical process control (SPC) techniques, such as the Shewart chart, are utilized.
– The data for the critical quality variables are analyzed and used to compute the DPMO and the sigma level.
– Example: Continuing the PVC extrusion example, suppose this analysis indicates operation at 3, with a target to attain 5 performance.
Six Sigma 12:15
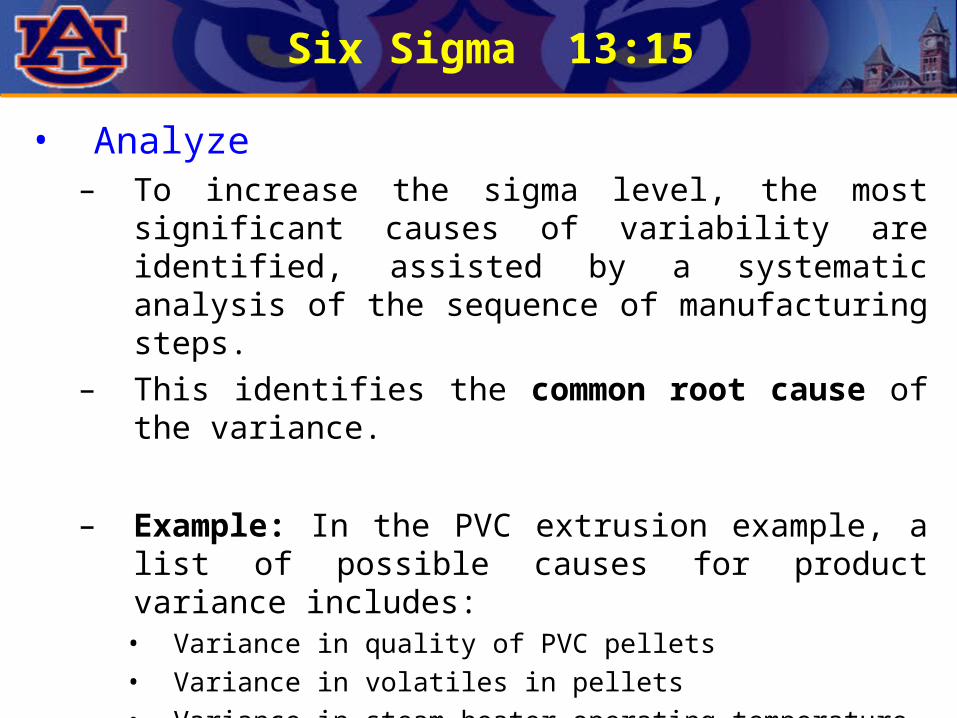
• Analyze– To increase the sigma level, the most significant
causes of variability are identified, assisted by a systematic analysis of the sequence of manufacturing steps.
– This identifies the common root cause of the variance.
– Example: In the PVC extrusion example, a list of possible causes for product variance includes:• Variance in quality of PVC pellets• Variance in volatiles in pellets• Variance in steam heater operating temperature
Six Sigma 13:15

• Improve– Having identified the common root cause of
variance, it is eliminated or attenuated by redesign of the manufacturing process or by employing process control.
– Example: Continuing the PVC tubing example, suggestions to how the variance in product quality can be reduced include:• Redesign the steam heater. • Install a feedback controller to manipulate the steam
valve to enable tighter control of the operating temperature.
• Combination of the above.
Six Sigma 14:15

• Control– After implementing steps to reduce the variance
in the CTQ variable, this is evaluated and maintained.
– Thus, steps M, A, I and C in the DMAIC procedure are repeated to continuously improve process quality.
– Note that achieving 6 performance is rarely the goal, and seldom achieved.
Six Sigma 15:15
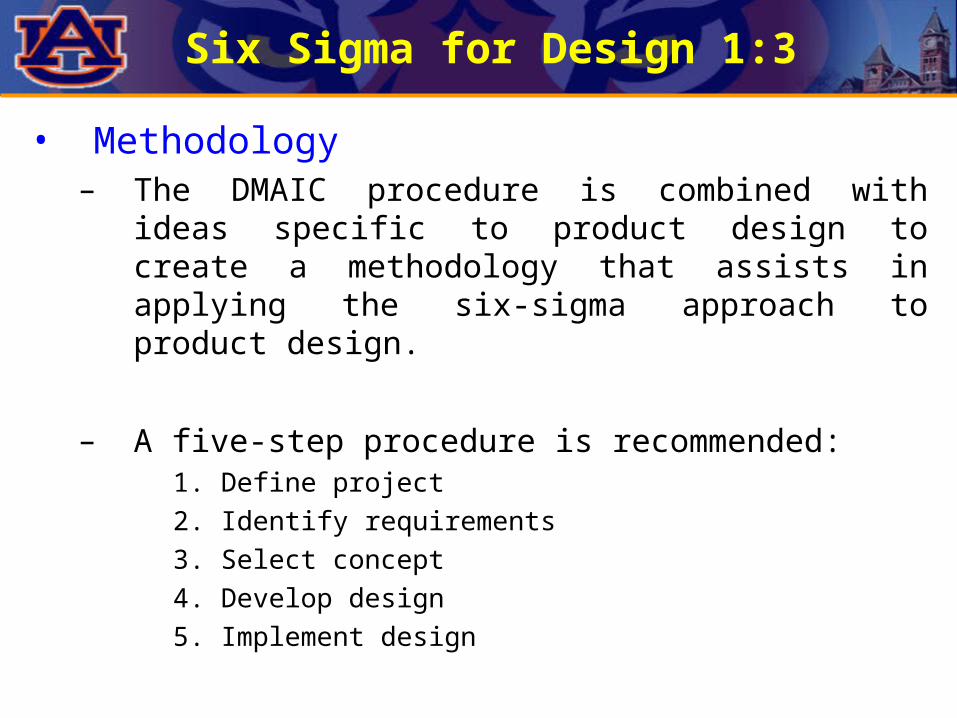
• Methodology– The DMAIC procedure is combined with ideas
specific to product design to create a methodology that assists in applying the six-sigma approach to product design.
– A five-step procedure is recommended:1. Define project2. Identify requirements3. Select concept4. Develop design5. Implement design
Six Sigma for Design 1:3
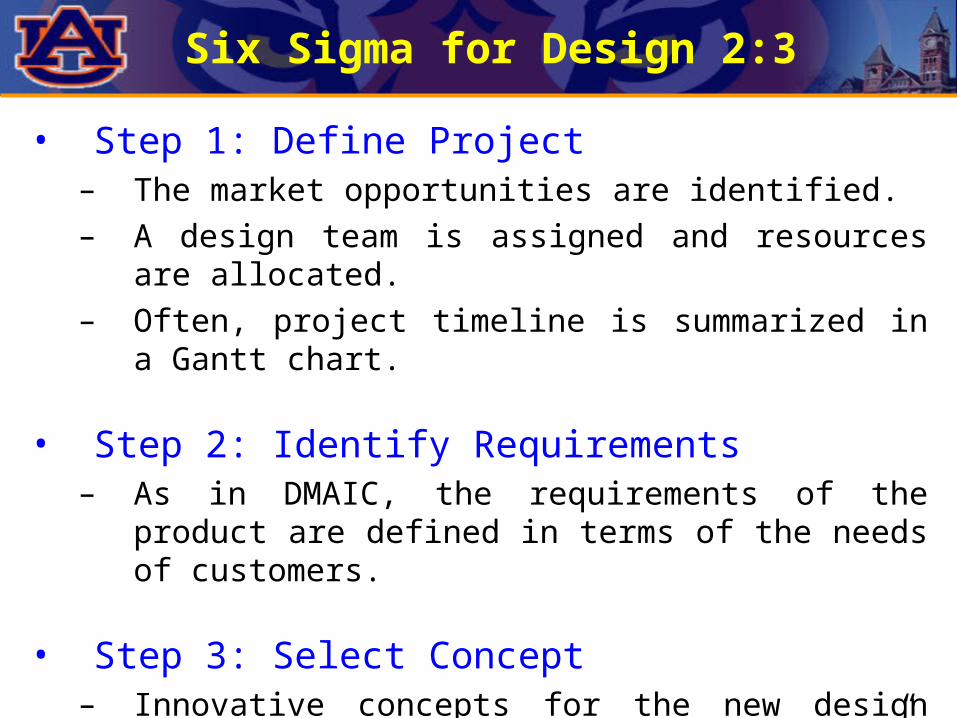
• Step 1: Define Project– The market opportunities are identified.– A design team is assigned and resources are
allocated. – Often, project timeline is summarized in a Gantt
chart.
• Step 2: Identify Requirements– As in DMAIC, the requirements of the product are
defined in terms of the needs of customers.
• Step 3: Select Concept– Innovative concepts for the new design are
generated, first by “brainstorming.” – The best are selected for further development.
Six Sigma for Design 2:3
• Step 4: Develop Design– Often several teams work in parallel to develop
and test competing designs, making modifications as necessary.
– The goal is to prepare a detailed design, together with a plan for its management, manufacture, and quality assurance.
• Step 5: Implement Design– The detailed designs in Step 4 are critically
tested.– The most promising design is pilot-tested and if
successful, proceeds to full-scale implementation.
Six Sigma for Design 3:3
Summary – Six Sigma
Define the Sigma Level of a manufacturing process (Increased losses [DPMO] means decreased sigma level).
Apply DMAIC in product design and manufacture.
Qualitatively analyze a process for the manufacture of a product and know how to identify the CTQ step using DMAIC.
On completion of this part, you should:

• Guest Lecture – March 8– Latest Acrolein research results
• Individual Team Assignments– Will be assigned over next two week period
• Progress Report No. 2– Can be turned in Friday March 16 before 5:00 PM
• External Evaluators Confirmed – Lee Daniel, Lead Product Developer, Civil
Systems Inc.– Robert D’Alessandro, Director of Process Eng.,
Degussa– Resumes will be posted on website soon
Other Business

• Field Trip to Degussa – March 13– More details will be provided at lecture on
Thursday– Suggested driver and passenger assignment
Other Business
#1 Brian Downs #2 Emily Baldwin #3 Stephen Dole Laura Ackley Natalie Wagner Zac Leeth Bob Edwards Austin Westenhofer Ashley Toellner Adam Strength Brent Goedjen Haley Brooks Kathryn Limbaugh Allison Collins Zach Davis #4 Justin Lambert #5 Wayne Davis Nolan Wilson Kenneth Williamson Clay Smith Jonathan Sutton Daniel Horn John Smola Brian Jackson