44-1 copyright 2005 mcgraw-hill australia pty ltd ppts t/a biology: an australian focus 3e by knox,...
TRANSCRIPT
44-1Copyright 2005 McGraw-Hill Australia Pty Ltd PPTs t/a Biology: An Australian focus 3e by Knox, Ladiges, Evans and Saint
Chapter 44: Ecosystems

44-2Copyright 2005 McGraw-Hill Australia Pty Ltd PPTs t/a Biology: An Australian focus 3e by Knox, Ladiges, Evans and Saint
Ecosystems and feeding relationships
• Ecosystems are dynamic systems consisting of interacting biotic and abiotic components
• The boundaries are seldom fixed or precise• Ecosystems are structured by trophic relationships
– autotrophs synthesise complex molecules using sunlight (photosynthesis) or chemical energy (chemosynthesis)
– heterotrophs cannot synthesise organic matter, just reorganise it. Include herbivores, carnivores, parasites, scavengers, detritivores and decomposers

44-3Copyright 2005 McGraw-Hill Australia Pty Ltd PPTs t/a Biology: An Australian focus 3e by Knox, Ladiges, Evans and Saint
Fig. 44.2: Flow of energy and materials through an ecosystem
Fig. 44.2 shows that although energy flows through the system, materials are recycled

44-4Copyright 2005 McGraw-Hill Australia Pty Ltd PPTs t/a Biology: An Australian focus 3e by Knox, Ladiges, Evans and Saint
Food chains and food webs
• Grazer chains occur when consumers depend on living plants for food
– rocky shores, grasslands
• Detritus chains are those where consumers eat decaying matter (detritus) and debris
– mangroves, forests
• The distinction of the two types may not be clear– termites consume both living and detrital plant matter
• Chains are over-simplified: webs more realistic (see Fig. 44.4)

44-5Copyright 2005 McGraw-Hill Australia Pty Ltd PPTs t/a Biology: An Australian focus 3e by Knox, Ladiges, Evans and Saint
Fig. 44.4: Simplified food web
44-6Copyright 2005 McGraw-Hill Australia Pty Ltd PPTs t/a Biology: An Australian focus 3e by Knox, Ladiges, Evans and Saint
Basic patterns of food webs
• Usually only 3 to 4 trophic levels• Omnivores (i.e. feed on >1 trophic level) are
scarce• Insect- and detritus-based webs are often
exceptions to the above patterns (see Fig. 44.4)• Trophic interactions may be compartmentalised• The number of trophic levels limits web complexity

44-7Copyright 2005 McGraw-Hill Australia Pty Ltd PPTs t/a Biology: An Australian focus 3e by Knox, Ladiges, Evans and Saint
Ecological pyramids
‘Why are big, fierce animals rare?’ (Colinvaux, 1993)
• Pyramids of numbers do not work (e.g. termites and cattle both eat grass)
• Pyramids of biomass do not take into account the rate of biomass production (e.g. phytoplankton)
• Pyramids of energy flowing between trophic levels conform best to Elton’s classic ascending pyramid

44-8Copyright 2005 McGraw-Hill Australia Pty Ltd PPTs t/a Biology: An Australian focus 3e by Knox, Ladiges, Evans and Saint
Why food chains are short
Is it because of reduction of energy up the trophicscale?• Usually only 10–20 per cent of energy is
transferred to next level above• Energy base of different ecosystems ranges widely
so expect wide variation in length of food chains
BUT the observed number of levels is uniformly small
length cannot be controlled just by energy input
44-9Copyright 2005 McGraw-Hill Australia Pty Ltd PPTs t/a Biology: An Australian focus 3e by Knox, Ladiges, Evans and Saint
Other models to explain food chain length• Ecosystem stability models
– persistent ecosystems are those able to recover stability after disturbance, so simpler ones best
• Cascading hierarchy in feeding links– a species can only feed on those below it, and be fed on
by those above it in the hierarchy
• Manipulative ecological experiments are needed to test these hypotheses

44-10Copyright 2005 McGraw-Hill Australia Pty Ltd PPTs t/a Biology: An Australian focus 3e by Knox, Ladiges, Evans and Saint
Potted food webs
• Experiments were performed in rainforests to test hypothesis that amount of energy at bottom of chain limits the chain length
• Artificial ‘tree holes’ were supplied with three different amounts of detritus, as food
• Food supply was shown to be a minor factor compared with the length of time the pots were left
• Only unnaturally small food supplies had a significant and limiting effect on food web structure
44-11Copyright 2005 McGraw-Hill Australia Pty Ltd PPTs t/a Biology: An Australian focus 3e by Knox, Ladiges, Evans and Saint
Biomass, energy and productivity• Biomass is expressed as energy equivalents, e.g.
kJ per kg• Net primary productivity of an ecosystem is rate of
change of biomass per unit area, e.g. gm-2yr-1, after respiratory losses of plants are accounted for
• Some primary production may– be ‘lost’
as shed structures, e.g. leaves, branches; carapace, cuticle – be eaten
e.g. fruit, flowers– die during senescence

44-12Copyright 2005 McGraw-Hill Australia Pty Ltd PPTs t/a Biology: An Australian focus 3e by Knox, Ladiges, Evans and Saint
Productivity of different ecosystems
• Production of plant communities varies with rainfall, temperature, nutrients (see Fig. 44.10)
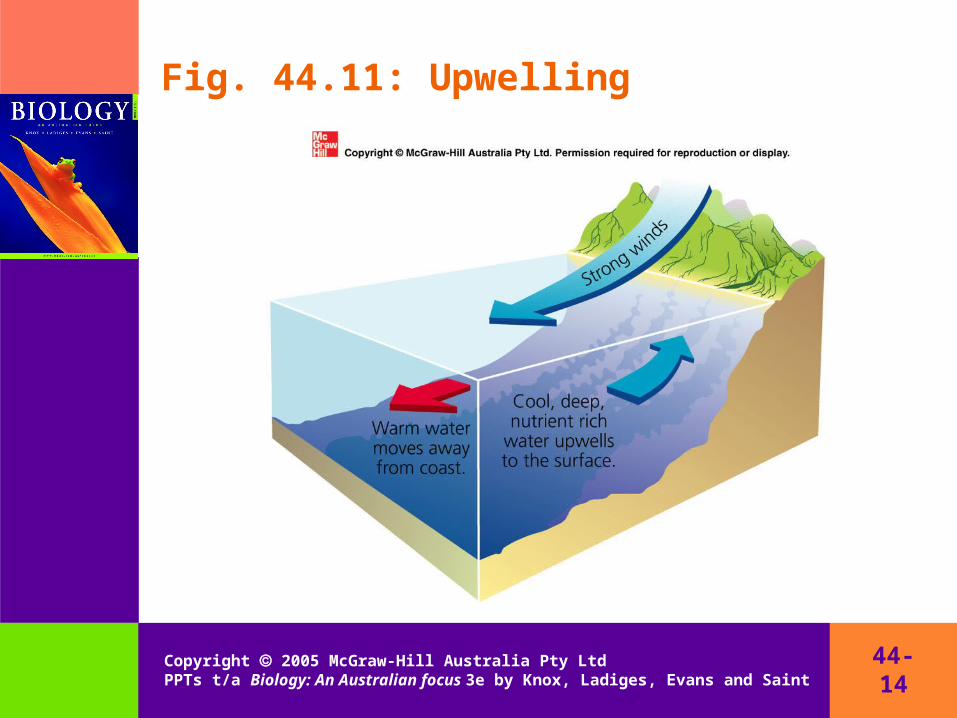
• Marine communities are usually nutrient limited except in areas of upwelling (see Fig. 44.11) and in coastal areas
• Biomass can be misleading as an indicator of productivity: it is the rate of change of biomass that matters

44-13Copyright 2005 McGraw-Hill Australia Pty Ltd PPTs t/a Biology: An Australian focus 3e by Knox, Ladiges, Evans and Saint
Fig. 44.10: World ecosystems
44-14Copyright 2005 McGraw-Hill Australia Pty Ltd PPTs t/a Biology: An Australian focus 3e by Knox, Ladiges, Evans and Saint
Fig. 44.11: Upwelling

44-15Copyright 2005 McGraw-Hill Australia Pty Ltd PPTs t/a Biology: An Australian focus 3e by Knox, Ladiges, Evans and Saint
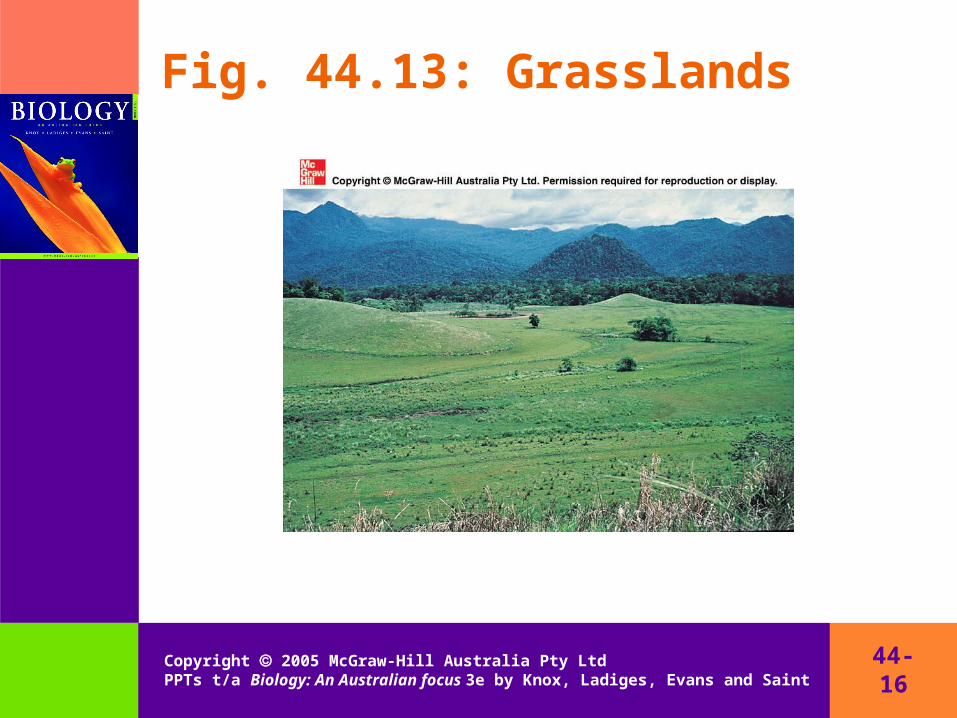
Productivity changes as the ecosystem ages• Young ecosystems have more actively growing
tissue, but older systems have more biomass• If resources are limited, regeneration of the original
ecosystem may be impossible—cleared rainforest may revert to open grassland (see Fig. 44.13)
44-16Copyright 2005 McGraw-Hill Australia Pty Ltd PPTs t/a Biology: An Australian focus 3e by Knox, Ladiges, Evans and Saint
Fig. 44.13: Grasslands
44-17Copyright 2005 McGraw-Hill Australia Pty Ltd PPTs t/a Biology: An Australian focus 3e by Knox, Ladiges, Evans and Saint
Biogeochemical cycles
• Whereas energy flows through the biosphere, materials are recycled
• Ecosystem productivity is controlled by efficiency of recycling as well as by energy available
• Materials transported in the atmosphere (water, carbon, nitrogen and sulphur) global cycles
• Phosphorus, potassium, calcium and magnesium move through soil local ecosystem cycles
44-18Copyright 2005 McGraw-Hill Australia Pty Ltd PPTs t/a Biology: An Australian focus 3e by Knox, Ladiges, Evans and Saint
The global water cycle
• See Fig. 44.15• 97 per cent of water on earth is in the oceans• Processes of convection, precipitation,
transpiration, respiration move water round the cycle
• Approx. 3 per cent of total water is relatively inaccessible, in icecaps, glaciers, deep groundwater
• Within the scale of local ecosystems, water behaves more like energy because it effectively flows through and is not recycled

44-19Copyright 2005 McGraw-Hill Australia Pty Ltd PPTs t/a Biology: An Australian focus 3e by Knox, Ladiges, Evans and Saint
Fig. 44.15: Global water cycle

44-20Copyright 2005 McGraw-Hill Australia Pty Ltd PPTs t/a Biology: An Australian focus 3e by Knox, Ladiges, Evans and Saint
Australian conditions
• Two-thirds of mainland Australia is desert (see Fig. 44.16)
• Rainfall has high variability• Desert ecosystems are productive in pulses when
rain falls, or from utilisation of reserves (seeds, lignotubers) at other times (see Fig. 44.17)
• Consumers must – adopt a pulse and reserve pattern e.g. grasshoppers– eat reserves of other organisms e.g. seed or wood-eaters
or – adopt opportunistic feeding habits

44-21Copyright 2005 McGraw-Hill Australia Pty Ltd PPTs t/a Biology: An Australian focus 3e by Knox, Ladiges, Evans and Saint
Fig. 44.16: Desert areas of the world

44-22Copyright 2005 McGraw-Hill Australia Pty Ltd PPTs t/a Biology: An Australian focus 3e by Knox, Ladiges, Evans and Saint
Fig. 44.17: Water flows through a desert ecosystem

44-23Copyright 2005 McGraw-Hill Australia Pty Ltd PPTs t/a Biology: An Australian focus 3e by Knox, Ladiges, Evans and Saint
Effects of clearing trees
• Rainfall is no longer taken up by deep tree roots after clearing
Groundwater is recharged, water table rises (Lemon catchment in WA—water table rose 20 m after clearing)
• Salt from subsoil rises in groundwater and discharges at surface
Degrades land because vegetation cannot grow in salty conditions
44-24Copyright 2005 McGraw-Hill Australia Pty Ltd PPTs t/a Biology: An Australian focus 3e by Knox, Ladiges, Evans and Saint
The carbon cycle
• Most carbon is locked up in earth’s rocks as carbonate (and also fossil fuels)
• The most active pool is carbon dioxide, 0.03 per cent of the atmosphere
• CO2 is withdrawn by photosynthesis and replaced during respiration (see Fig. 44.19)
• Large amounts of CO2 are dissolved in the ocean
• Burning of fossil fuels returns CO2 to the atmosphere faster than it can be cycled
This contributes to global warming

44-25Copyright 2005 McGraw-Hill Australia Pty Ltd PPTs t/a Biology: An Australian focus 3e by Knox, Ladiges, Evans and Saint
Fig. 44.19: Global carbon cycle

44-26Copyright 2005 McGraw-Hill Australia Pty Ltd PPTs t/a Biology: An Australian focus 3e by Knox, Ladiges, Evans and Saint
The nitrogen cycle
• Abundant in atmosphere, 78 per cent• Plants cannot absorb atmospheric nitrogen• Absorbed as ammonium or nitrate after fixation of
nitrogen by symbiotic bacteria, or in soil solution• Denitrifying bacteria convert nitrate back to
gaseous nitrogen (see Fig. 44.20)• Electrical storms also fix nitrogen• Nitrogen becomes limiting if microbial activity is
inhibited

44-27Copyright 2005 McGraw-Hill Australia Pty Ltd PPTs t/a Biology: An Australian focus 3e by Knox, Ladiges, Evans and Saint
Fig. 44.20: Cycle of nitrogen

44-28Copyright 2005 McGraw-Hill Australia Pty Ltd PPTs t/a Biology: An Australian focus 3e by Knox, Ladiges, Evans and Saint
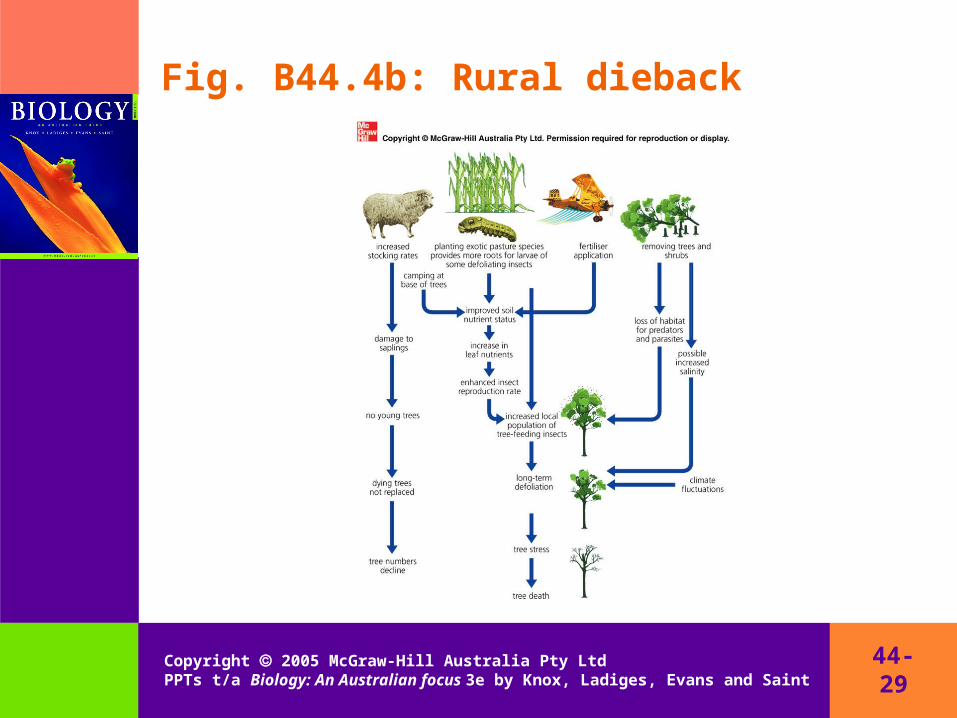
Nitrogen and tree dieback
• Tree dieback results from long or repeated periods of sublethal stress
• Effects of increased stocking rates, growing exotic pasture species, adding fertilisers and land-clearing combine to cause rural dieback
• Insect damage to leaves is worse where soil fertility is high
• Stock congregate under few remaining shade trees, both damaging saplings and enriching the soil (see Fig. B44.4 (b))
44-29Copyright 2005 McGraw-Hill Australia Pty Ltd PPTs t/a Biology: An Australian focus 3e by Knox, Ladiges, Evans and Saint
Fig. B44.4b: Rural dieback
44-30Copyright 2005 McGraw-Hill Australia Pty Ltd PPTs t/a Biology: An Australian focus 3e by Knox, Ladiges, Evans and Saint
The phosphorus cycle
• Essential to all life, in ATP• Not common in earth’s crust or in atmosphere• Taken up by plants as phosphate from sparingly
soluble soil storage pool (see Fig. 44.22 (a))• Australian flora are well adapted to low P, and
efficient at recycling phosphorus• Symbiosis between plant roots and mycorrhizal
fungi enhances the phosphorus supply

44-31Copyright 2005 McGraw-Hill Australia Pty Ltd PPTs t/a Biology: An Australian focus 3e by Knox, Ladiges, Evans and Saint
Fig. 44.22a: Local cycle of phosphorous