4.12 utilities and service systems draft 2
TRANSCRIPT

Downtown General Plan & Specific Plan No. 45 Amendments 4.12 Utilities & Service Systems Draft Program EIR
taha 2006-027 4.12-1
4.12 UTILITIES AND SERVICE SYSTEMS
INTRODUCTION This section addresses the demand that could be placed on utility service providers, whether this demand can be met without the need for additional infrastructure, and whether the proposed project would be in compliance with regulations governing the provision of these utilities. Assessment of impacts on utility infrastructure varies depending on the utility, but generally includes the comparison of project-generated demand against existing and anticipated resource supplies and/or conveyance/treatment capacity. Determination of impacts depends on estimation of demand generated by the proposed project compared to the availability and capacity of existing supplies and the conveyance/treatment infrastructure. EXISTING SETTING The project site is developed with infrastructure currently in place to support the provision of stormwater drainage, water, sewer, solid waste, electricity, and natural gas. Stormwater and Drainage Generally, the City of Redlands is a developed area and includes mostly paved roads and other impervious surfaces. The City has existing stormwater drainage and conveyance infrastructure in place. Stormwater drainage facilities in the City and on the project site is operated and maintained by United States Army Corps of Engineers (USACE), San Bernardino Flood Control District (SBCFCD), and the City of Redlands Municipal Utilities and Engineering Department (RMUED). The Mission-Zanja Creek System is a major storm drain facility that is partially owned by the USACE and the SBCFCD. In the City, tributary storm drains to the Mission Zanja are owned and maintained by the RMUED. The Mission-Zanja Creek flows in an east-west direction; it begins to the east of the City at Crafton Hills and flows through the City and into the Santa Ana River near the City of Loma Linda. Within the project site boundaries, the Mission-Zanja Creek flows in a southwest direction from near the intersection of Church Street and the Burlington Northern Santa Fe (BNSF) Railroad right-of-way until it meets 9th Street. From 9th Street to Texas Street, the Mission-Zanja Creek flows parallel to Redlands Boulevard. The Mission-Zanja Creek is an open channel from its origin to the Santa Ana River, except for the segment within the project site from 9th Street to Eureka Street, where it exists as an underground box culvert that runs beneath Redlands Boulevard. The portion of the Mission-Zanja Creek from the BNSF Railroad right-of-way to 275 feet west of 9th Street is operated and maintained by the SBCFCD. The portion of the Mission Zanja-Creek from approximately 275 feet west of 9th Street to western border of the project site is operated and maintained by the USACE.1 The Mission-Zanja is generally limited in its ability to contain water during storms and is prone to overflow. Historically, flooding within the project site is attributed to the limited capacity within the project boundaries. The primary storm drain is an underground box inlet located beneath Redlands Boulevard with a maximum capacity of 300 cubic feet per second (cfs) that is less than the City’s Reservoir Canyon stormdrain which has a capacity of 1,920 cfs.2 Exacerbating the limits of the Mission-
1San Bernardino County Flood Control District. Flood Control System Number Index and General File Codes. January 2010.
2The Reservoir Canyon Stormdrain drains the areas to the southwest of the project site. The Reservoir Canyon Stormdrain travels in a northwest direction, beneath Redlands Boulevard, and terminates at the Mission-Zanja near the Redlands Boulevard/8th Street intersection.
Downtown General Plan & Specific Plan No. 45 Amendments 4.12 Utilities & Service Systems Draft Program EIR
taha 2006-027 4.12-2
Zanja is the development of the unincorporated areas east of the City. Stormwater runoff within the unincorporated areas east of the City ultimately flows to the Mission-Zanja. Increased development in these unincorporated areas has led to a reduction in the amount of permeable surfaces, and, thus, increased the amount of storm runoff flowing into the City’s storm drains. The increased development has put additional strain not only on the City’s storm drain system, but the Mission-Zanja as well.3 The RMUED maintains four major City storm drains that serve the project site. The Oriental, Carrot, Texas, and Post Office storm drains collect and convey stormwater from the project site to the Mission-Zanja Creek System. The Oriental, Carrot, Texas, and Post Office storm drains that collect and convey water are 24 to 30, 48, 66, and 60 inches in diameter, respectively. Additional information on storm flows and drainage is included in Section 4.13 Water Resources. The majority of the project site consists of developed land with stormwater drainage infrastructure in place. Several semi-paved vacant lots are located in the area between I-10 to the north, Oriental Avenue to the south, Orange Street to the east, and Texas Street to the west. Although these properties are currently undeveloped, it is likely that at one time that they were developed and that stormwater collection and drainage infrastructure currently exists at the properties. Stormwater runoff on these semi-paved vacant sites is assumed to be conveyed into the City stormdrains. Sewage and Wastewater Treatment The RMUED provides wastewater conveyance and treatment infrastructure to the City and unincorporated areas adjacent to the City limits. The service area of the RMUED wastewater conveyance and treatment system is approximately 40.5 square miles and includes land within the City limits and the unincorporated San Bernardino County areas of Mentone, Crafton Hills, and the “donut hole” area in the northwestern portion of the City.4 Wastewater Treatment and Conveyance Infrastructure Wastewater generated within the City is treated at the City-owned Redlands Wastewater Treatment Plant (WWTP). The WWTP is located at 1950 N. Nevada Street and is approximately 50 acres in size. The WWTP has a treatment capacity of 9.5 million gallons per day (MGD). The WWTP treats approximately six MGD of wastewater and has a remaining treatment capacity of 3.5 MGD.5 A pump station located at the corner of San Bernardino and Mountain View Avenues pumps water from northwestern area of the City into the WWTP for treatment. The City’s wastewater conveyance infrastructure is comprised of 212 miles of sewage pipeline that range from 6 to 48 inches in diameter. The earliest sewers serving the City were constructed at the turn of the 20th century and were utilized to convey wastewater to irrigate crops until 1932. Many of these sewers still serve the City.6 Currently, about a quarter of the existing conveyance infrastructure is comprised of primary sewers, or trunk sewers, that are 10 to 48 inches in diameter. Primary sewers collect and convey wastewater to the WWTP. The remaining 164 miles (77 percent) of the sewage pipeline are six to eight inches in diameter and predominately collect wastewater from residential areas.7
3City of Redlands Quality of Life Department, City of Redlands Flood Plan, July 15, 2008. 4City of Redlands, Wastewater Collection System Master Plan Volume I – Report, August 1998. 5City of Redlands Municipal Utilities and Engineering Department, Wastewater, Available at:
http://www.ci.redlands.ca.us/utilities/waste_water.htm, Accessed on May 24, 2010. 6Ibid. 7City of Redlands, Wastewater Collection System Master Plan Volume I – Report, August 1998.

Downtown General Plan & Specific Plan No. 45 Amendments 4.12 Utilities & Service Systems Draft Program EIR
taha 2006-027 4.12-3
Project Site The streets, alleys, and buildings on the project site were generally developed in the late 19th and early 20th century and are served by sewer pipelines that range from eight to 24 inches in diameter.8,9 Much of the wastewater infrastructure that serves the project site is the oldest in the City. In general, wastewater is generated from indoor water uses, such as toilets, as well as commercial and industrial discharges, such as those resulting from restaurant operations. Table 4.12-1 shows the estimated wastewater generation for the existing land uses. Land uses on the project site are estimated to generate approximately 94,615 gallons per day (GPD) or 0.09 MGD of wastewater that is approximately one percent of the design capacity of the WWTP. TABLE 4.12-1: ESTIMATED WASTEWATER GENERATION OF THE EXISTING USES ON THE
PROJECT SITE
Land Use Quantity Unit Sewage Generation Factor (gpd/unit) /a/ Water use (gpd)
Residential Units /b/ 58 Residential
Unit 180 10,440
Retail Uses 401,751 square feet 0.080 32,140
Restaurants 41,096 square feet 0.300 12,329
Office Space 44,500 square feet 0.150 6,675
Theater 2,803 seats 4 11,212
Government/Civic 112,100 square feet 0.150 16,815
Warehouse 57,800 square feet 0.02 1,586
Industrial 48,100 square feet 0.08 3,848
Total Estimated Wastewater Usage of Existing Uses on the Project Site 94,615/a/ Utilized sewage generation rates to estimate water usage.
/b/ Utilized the two bedroom single-family residential dwelling sewage generation rate
SOURCE: City of Los Angeles CEQA Thresholds Guide, 2006
Water The RMUED operates and maintains the water system that serves the City and adjacent San Bernardino County unincorporated areas. The RMUED serves approximately 21,500 metered water connections and a service area of 25.9 square miles. The City’s average daily water consumption is approximately 27 MGD with a maximum of 50 MGD in the summer.10 Water Supply The City’s water supply is comprised of local groundwater and surface water from the Bunker Hill Groundwater Basin, Yucaipa Groundwater Basin, Mill Creek Watershed, Santa Ana River Watershed, and the California State Water Project (SWP) when required, and recycled water.
8E-mail Correspondence. Chris Diggs, Water Resource Manager, May 18,2010. 9City of Redlands, Downtown Specific Plan, October 2009. 10City of Redlands Municipal Utilities and Engineering Department., Water Supply – System Overview, Available at:
http://www.ci.redlands.ca.us/utilities/water_supply.htm, Accessed on May 24, 2010.

Downtown General Plan & Specific Plan No. 45 Amendments 4.12 Utilities & Service Systems Draft Program EIR
taha 2006-027 4.12-4
Local Groundwater. The majority of the City’s water supply is obtained from groundwater sources. The City obtains groundwater through adjudicated groundwater pumping rights and common law appropriative rights to the Bunker Hill and Yucaipa Groundwater Basins, respectively.11 The Bunker Hill Groundwater Basin, which is also known as the San Bernardino Basin, is bounded by the San Bernardino Mountains, San Gabriel Mountains, Crafton Hills, and several faults. The Bunker Hill Groundwater Basin is approximately 120 square miles in size. Historically, the Bunker Hill Groundwater Basin has been recharged from infiltration of runoff from the San Gabriel and San Bernardino Mountains. The Santa Ana River, Mill Creek, and Lytle Creek contribute more than 60 percent of the total recharge of the groundwater basin. The total groundwater storage capacity of the Bunker Hill Groundwater basin is estimated at 5,976,000 acre-feet.12,13 The groundwater rights to pump from the Bunker Hill Groundwater Basin were determined through a judicial water adjudication in 1969, Western Municipal Water District of Riverside County et al., v. East San Bernardino County Water District et al, Riverside Superior Court, Case No. 78426. The water adjudication of the Bunker Hill Groundwater Basin set the annual groundwater pumping safe-yield to 232,100 acre-feet of water per year (AFY). Per the water adjudication, the City and other local water users are permitted to pump as much groundwater as needed. Groundwater pumped in excess of the safe-yield must be recharged back into the groundwater basin by the San Bernardino Valley Municipal Water District (SBVMWD). Typically, the SBVMWD utilizes imported water from SWP to recharge the basin. The water judgment does not requires that the Bunker Hill Groundwater have a same year recharge, therefore, allowing the City, and other parties to the judgment, to over pump during dry years and recharge during wet years.14 The City utilizes up to 20 wells to pump water from the Bunker Hill Groundwater Basin. The City’s groundwater pumping capacity from the Bunker Hill Groundwater Basin is currently 37,000 AFY. Water pumped from the Bunker Hill Groundwater Basin is treated at the Horace Hinckley (Hinckley) Water Treatment Plant (WTP).15 The Yucaipa Groundwater Basin is bounded by the San Andreas Fault, Redlands Fault, Crafton Hills, Banning fault, and Yucaipa Hills. The Yucaipa Groundwater Basin is approximately 39 square miles in size. Recharge of the Yucaipa Groundwater basin is from percolation of precipitation and infiltration within channels of its overlying streams, such as Yucaipa and Oak Glen Creeks. There are also four artificial recharge facilities that have a capacity of 56,500 AFY.16 The City obtains water from the Yucaipa Groundwater Basin through its common law appropriative rights to the Yucaipa Groundwater Basin due to its ownership of mutual stock of the South Mountain Water Company, which is a private water company. The Yucaipa Groundwater Basin has not been subject to water adjudication and groundwater production is limited to common law water rights of various entities and individuals pumping water. The Yucaipa Groundwater Basin is currently in the state of overdraft.17 To address the overdraft, the Yucaipa Valley Water District is currently preparing a groundwater management plan. The goal of the groundwater management plan is to stabilize the groundwater levels of
11City of Redlands Municipal Utilities Engineering Department, Water Supply Assessment Concept Plan No. 3, 2006. 12California Department of Water Resources, California Groundwater Bulletin 118 -- Hydrologic Region, South Coast
- Upper Santa Ana Valley Groundwater Basin, Bunker Hill Subbasin, February 17, 2004. 13An acre-foot of water is equivalent to 325, 851 gallons. 14City of Redlands Municipal Utilities Engineering Department, Water Supply Assessment Concept Plan No. 3, 2006. 15Ibid. 16California Department of Water Resources, California Groundwater Bulletin 118 -- Hydrologic Region, South Coast
- Upper Santa Ana Valley Groundwater Basin, Bunker Hill Subbasin, February 17, 2004. 17California Department of Water Resources, California Groundwater Bulletin 118 -- Hydrologic Region, South Coast
- Upper Santa Ana Valley Groundwater Basin, Yucaipa Subbasin, February 27, 2004.

Downtown General Plan & Specific Plan No. 45 Amendments 4.12 Utilities & Service Systems Draft Program EIR
taha 2006-027 4.12-5
the Yucaipa Groundwater Basin through the implementation of sustainable pumping and replenishment practices based on the safe-yield of the basin.18 The City utilizes two wells, owned by the South Mountain Water Company, to pump water from the Yucaipa Groundwater Basin. The City’s groundwater pumping capacity is currently 1,000 AFY. Groundwater obtained from the Yucaipa Groundwater Basin is treated at the Hinckley WTP.19,20 Local Surface Water. The City obtains surface water from the Mill Creek and Santa Ana River watersheds. The City exercises its water rights to the Mill Creek and Santa Ana River watersheds as an appropriator under common law. Mill Creek Watershed is a major tributary to the Santa Ana River. The City is entitled obtain 18,000 AFY of water from the Mill Creek watershed through its pre-1914 right to divert 44.7 percent of the watershed’s flow and its ownership of private water company stock. Local surface water obtained from the Mill Creek watershed is treated at the Henry Tate (Tate) WTP. The Tate WTP treatment capacity of 14.9 MGD allows it to only receive and treat 16,690 AFY from the Mill Creek watershed.21 The City is entitled to obtain 15,680 AFY of water from the Santa Ana River watershed through its pre-1914 appropriative rights and its ownership of other private water company stock. Water diversions from the Santa Ana River watershed are expected to be raised to 20,160 AFY due to the planned expansion of the Hinckley WTP. Water obtained from the Santa Ana River Watershed is treated at the Hinckley WTP.22 State Water Project. Water from the SWP is transported from Northern California to Southern California through the California Aqueduct (CAA). The City obtains SWP water from the San Bernardino Valley Municipal Water District (SBVMWD). The SBVMWD is entitled to approximately 102,600 acre-feet per year of water from the SWP. The SBVMWD uses the SWP water to recharge groundwater basins and redistributes SWP water amongst its member agencies. The City and other member agencies do not have entitlements to the SBVMWD’s SWP entitlement and must submit requests, in competition amongst each other, for SWP water. The City projects that it will require 5,000 AFY of water from the SWP through 2030.23 Water from the CAA is conveyed to the City from the CAA’s East Branch where it is conveyed eastward to the City via the 17-mile Foothill Pipeline. Water from the CAA is treated at the Hinckley WTP.24 Recycled Water. The City recycles wastewater from its residents at its Water Reclamation Plant (WRP). Recycled water from the WRP is intended for non-potable uses. The City projects that projected recycled water usage will increase from 7,000 AFY to 9,000 AFY.25 The current and planned water supply of the City is listed in Table 4.12-2.
18City of Redlands Municipal Utilities Engineering Department, Water Supply Assessment Concept Plan No. 3, 2006. 19City of Redlands Municipal Utilities Engineering Department, Water Supply Assessment Concept Plan No. 3, 2006. 20City of Redlands Municipal Utilities and Engineering Department., Water Supply – System Overview, Available at:
http://www.ci.redlands.ca.us/utilities/water_supply.htm, Accessed on May 24, 2010. 21City of Redlands Municipal Utilities Engineering Department, Water Supply Assessment Concept Plan No. 3, 2006. 22Ibid. 23Ibid. 24Ibid. 25Ibid.

Downtown General Plan & Specific Plan No. 45 Amendments 4.12 Utilities & Service Systems Draft Program EIR
taha 2006-027 4.12-6
TABLE 4.12-2: CITY OF REDLANDS CURRENT AND PLANNED WATER SUPPLY
Source
Water Supply by Year (AFY)
2005 2010 2015 2020 2025 2030
Potable Sources
Local Groundwater 38,000 46,000 46,000 46,000 46,000 46,000
Local Surface Water 32,000 32,000 36,850 36,850 36,850 36,850
SWP Water 5,000 5,000 5,000 5,000 5,000 5,000
Non-Potable Water
Local Ground Water 4,500 6,000 8,000 10,000 10,000 12,000
Recycled Water 0 7,500 8,000 8,500 8,500 9,000
Total 79,500 96,500 103,850 106,350 106,350 108,850SOURCE: City of Redlands, Water Supply Assessment – Concept Plan No.3, 2006.
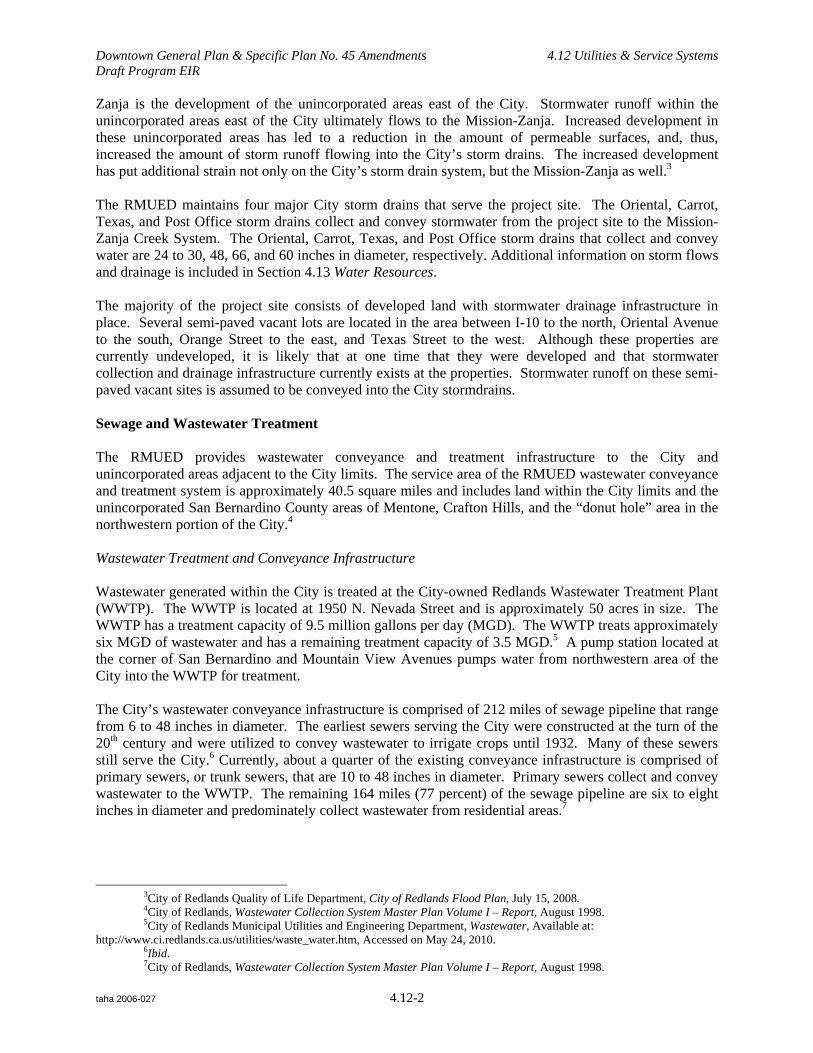
Water Treatment and Conveyance Infrastructure The City owns and operates the Tate and Hinckley Surface WTPs. The Tate and Hinckley Surface WTPs have a design capacity to treat 20 and 14.9 MGD of water, respectively.26,27 The City’s water distribution system is comprised of nearly 400 miles of pipeline and includes seven pressure zones. The storage capacity of the City’s water distribution system is 54.4 million gallons.28 Project Site The project site is located within water pressure zone 1570. The project site is served by three large water pipelines located within Orange Avenue, Eureka Avenue, and 6th Street. The Orange Avenue, Eureka Avenue, and 6th Street water pipelines are 12-, 12-, and 16-inches in diameter, respectively. Other streets on the project site are served by one-and-a-half- to four-inch pipelines.29 Table 4.12-3 shows the estimated water consumption of the existing land uses on the project site. Existing land uses on the project site consume approximately 94,615 GPD (106 APY), or 0.09 MGD of water. Water usage on the project site is approximately 0.11 percent of the projected 2010 water supply of the City and 0.47 and 0.6 percent of the design capacities of the Tate and Hinckley Surface WTPs, respectively. Solid Waste The City of Redlands Solid Waste Division of the Quality of Life Department is responsible for the collection and disposal of solid waste generated within the City.30 Solid waste collected by the City is disposed at the City-owned and operated California Street Landfill. The California Street Landfill is located at 2151 Nevada Street. The California Street Landfill is a Class III landfill that has been permitted through the year 2048, has a total capacity of approximately 11 million cubic yards, a remaining capacity of 5.7 million cubic yards, and total daily intake capacity of 829 tons, or 829 cubic yards.31,32
26City of Redlands Municipal Utilities Engineering Department, Water Supply, Available at: http://www.ci.redlands.ca.us/utilities/water.htm, Accessed on May 25, 2010.
27City of Redlands Municipal Utilities Engineering Department, Water Supply Assessment Concept Plan No. 3, 2006. 28Ibid. 29E-mail Correspondence. Chris Diggs, Water Resource Manager, May 18,2010. 30City of Redlands. General Plan. 31Telephone Conversation with Gary vanDorst, City of Redlands Quality of Life Director, May 20, 2010. 32Assuming one cubic yard is equivalent to one ton.
Downtown General Plan & Specific Plan No. 45 Amendments 4.12 Utilities & Service Systems Draft Program EIR
taha 2006-027 4.12-7
TABLE 4.12-3: ESTIMATED WATER USAGE OF EXISTING USES ON PROJECT SITE
Land Use Quantity Unit Usage Factor (gpd/unit) /a/ Water Use (gpd) Water Use (AFY)
Residential Units /b/ 58 Residential
Unit 180 10,440 12
Retail Uses 401,751 square feet 0.080 32,140 36
Restaurants 41,096 square feet 0.300 12,329 14
Office Space 44,500 square feet 0.150 6,675 7
Theater 2,803 seats 4 11,212 13
Government/Civic 112,100 square feet 0.150 16,815 19
Warehouse 57,800 square feet 0.02 1,586 1
Industrial 48,100 square feet 0.08 3,848 4
Total Estimated Water Usage of Existing Uses on the Project Site 94,615 106/a/ Utilized sewage generation rates to estimate water usage. Assumed water usage is equivalent to wastewater generation.
/b/ Utilized the two bedroom single-family residential dwelling sewage generation rate
SOURCE: City of Los Angeles CEQA Thresholds Guide, 2006.
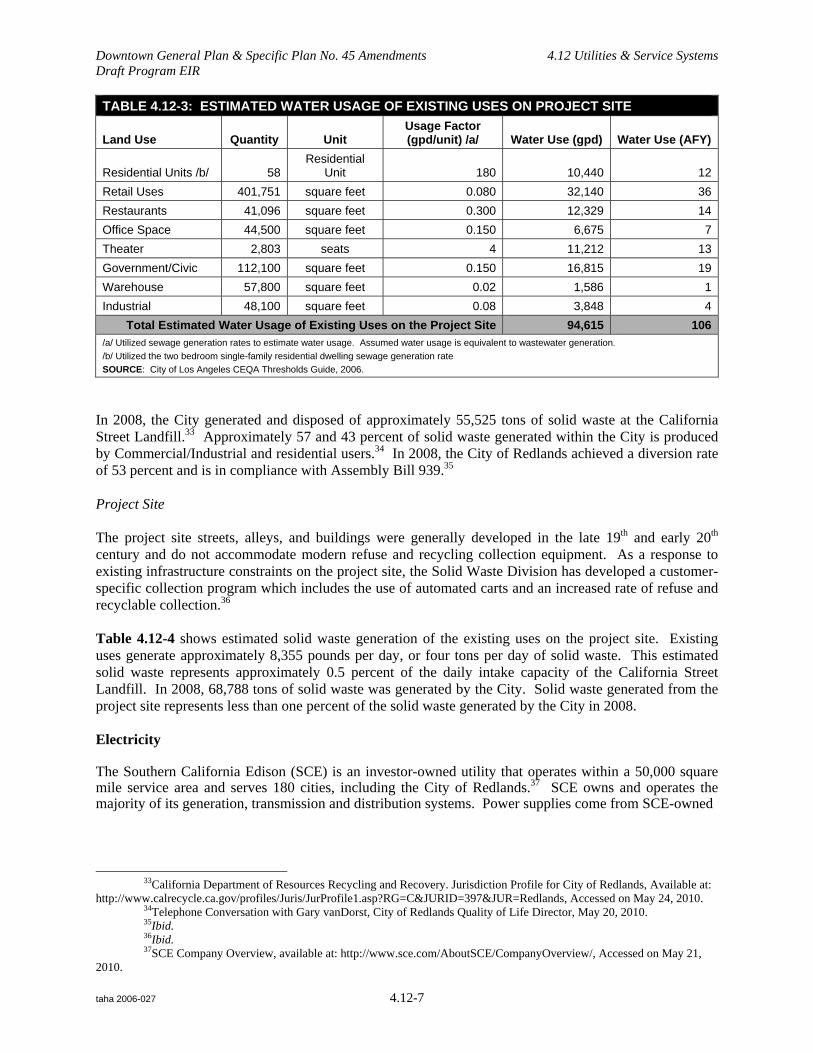
In 2008, the City generated and disposed of approximately 55,525 tons of solid waste at the California Street Landfill.33 Approximately 57 and 43 percent of solid waste generated within the City is produced by Commercial/Industrial and residential users.34 In 2008, the City of Redlands achieved a diversion rate of 53 percent and is in compliance with Assembly Bill 939.35 Project Site The project site streets, alleys, and buildings were generally developed in the late 19th and early 20th century and do not accommodate modern refuse and recycling collection equipment. As a response to existing infrastructure constraints on the project site, the Solid Waste Division has developed a customer-specific collection program which includes the use of automated carts and an increased rate of refuse and recyclable collection.36 Table 4.12-4 shows estimated solid waste generation of the existing uses on the project site. Existing uses generate approximately 8,355 pounds per day, or four tons per day of solid waste. This estimated solid waste represents approximately 0.5 percent of the daily intake capacity of the California Street Landfill. In 2008, 68,788 tons of solid waste was generated by the City. Solid waste generated from the project site represents less than one percent of the solid waste generated by the City in 2008. Electricity The Southern California Edison (SCE) is an investor-owned utility that operates within a 50,000 square mile service area and serves 180 cities, including the City of Redlands.37 SCE owns and operates the majority of its generation, transmission and distribution systems. Power supplies come from SCE-owned
33California Department of Resources Recycling and Recovery. Jurisdiction Profile for City of Redlands, Available at:
http://www.calrecycle.ca.gov/profiles/Juris/JurProfile1.asp?RG=C&JURID=397&JUR=Redlands, Accessed on May 24, 2010. 34Telephone Conversation with Gary vanDorst, City of Redlands Quality of Life Director, May 20, 2010. 35Ibid. 36Ibid. 37SCE Company Overview, available at: http://www.sce.com/AboutSCE/CompanyOverview/, Accessed on May 21,
2010.

Downtown General Plan & Specific Plan No. 45 Amendments 4.12 Utilities & Service Systems Draft Program EIR
taha 2006-027 4.12-8
TABLE 4.12-4: SOLID WASTE GENERATION OF EXISTING USES ON THE PROJECT SITE
Land Use Quantity Unit
Solid Waste Generation Factor
(pounds per day/unit)
Estimated Solid Waste Generated (pounds per day)
Residential 58 Residential Unit 12 709
Retail Uses 401,751 Square feet 0.005 2,009
Restaurants 41,096 Square feet 0.005 205
Office Space 44,500 Square feet 0.006 267
Theater/a/ 16,818 Square Feet 0.005 84
Government/Civic 112,100 Square feet 0.007 785
Warehouse 57,800 square feet 0.0142 821
Industrial 48,100 square feet 0.0625 3,006
Total Estimated Solid Waste Generated from Existing Uses on the Project Site 8,355/a/ Assumed theater solid waste generation is equivalent to the commercial solid waste generation.
SOURCE: California Department of Resources Recycling and Recovery, 2010.
power plants within California and shared-ownership power generating facilities in Arizona and New Mexico. SCE’s power supply is generated from natural gas, coal, nuclear, and hydroelectric power. In 2006, coal, nuclear, and hydroelectric power represented approximately 8, 17, and 5 percent, respectively, of the all resources used to generate electricity for SCE’s customers.38 SCE provided its customers approximately 88,208 million kilowatt-hours (kWh) of electricity in 2007.39 SCE obtains natural gas-fueled electricity from the Mountainview Power Plant located within the City. The Mountainview Power Plant is owned by SCE. The Mountainview Power plant is comprised of two turbine units and has a plant capacity of 1,54 megawatts (MW). SCE obtains coal-generated electricity from the Four Corners Generating Station located in Fruitland, New Mexico. The Four Corners Generating station is jointly owned by SCE, Arizona Public Service, and four other utility companies in the Southwest.40 The Four Corners Generating Station is comprised of five units and has a plant capacity of 2,048 MW. Units 1, 2, and 3 of the Four Corners Generating Station are owned by the Arizona Public Service. Units 4 and 5 are owned by SCE, Arizona Public Service, El Paso Electric, PNM, the Salt River Project, and Tucson Electric Power. Currently, SCE owns approximately 48 percent share, or 754 MW, of generating capacity of Units 4 and 5.41 SCE obtains nuclear-generated electricity from the San Onofre Nuclear Generating Station (SONGS) and Palo Verde Nuclear Generating Station. SONGS is located in the San Clemente, California. SONGS is a jointly-owned by SCE, San Diego Gas and Electric, and the City of Riverside. SONGS is comprised of three nuclear reactors which are named Unit 1, 2, and 3, respectively. Unit 1 was retired in 1992 and is currently being decommissioned. The remaining nuclear reactors, Units 2 and 3, have a capacity to produce 2,200 megawatts of power.42 Currently, SCE owns approximately 78 percent share, or 1,716 MW, of the generating capacity of SONGS. The Palo Verde Nuclear Generating Station is located in Wintersburg, Arizona. The Palo Verde Generating station is jointly owned by the SCE, Arizona Public
38Sources of Electricity for Major Utilities in California, available at: http://www.energyalmanac.ca.gov/electricity/electricity_resource_mix_pie_charts/index.html, Accessed on August 2, 2010. 39California Energy Commission. California Energy Consumption Database.
40Arizona Public Service - Power Plants - Generation, http://www.aps.com/general_info/AboutAPS_18.html, Accessed on May 21,2010.
41Four Generating Station, available at: http://www.edison.com/ourcompany/sce.asp?id=2081, Accessed on May 21,2010.
42 SCE San Onofre Nuclear Generating Station, http://www.edison.com/ourcompany/sce.asp?id=2082, Accessed on May 21, 2010.

Downtown General Plan & Specific Plan No. 45 Amendments 4.12 Utilities & Service Systems Draft Program EIR
taha 2006-027 4.12-9
Service, and six other utility companies in the Southwest.43 The Palo Verde generating station is comprised of three nuclear reactors that produce approximately 3,600 megawatts of power.44 Currently, SCE owns approximately 16 percent share, or 576 MW, of the Palo Verde Generating Station. SCE obtains hydroelectric power from SCE-owned Big Creek Hydroelectric facilities (Big Creek) located in Shaver Lake, California. Big Creek is comprised of nine powerhouses that have a capacity to produce 1,000 megawatts of power.45 Table 4.12-5 lists the estimated electricity usage of the existing uses on the project site. The estimated electricity usage of the existing uses on the project site is 10.6 million kWh per year, or less than one percent of the total power provided to SCE customers in 2007. TABLE 4.12-5: ELECTRICITY USAGE OF EXISTING USES ON THE PROJECT SITE
Land Use Quantity Unit
Electricity Usage Rate
(kWh/unit/year)
Electricity Usage
(kWh/year)
Electricity Usage
(kWh/year)
Electricity Usage
(kWh/year)
Residential 58
Residential Unit 5,627 326,337 894 326
Retail Uses 401,751 Square feet 14 5,443,726 15,291 5,444
Restaurants 41,096 Square feet 47 1,950,005 5,478 1,950
Office Space 44,500 Square feet 13 57,6275 1,619 576
Theater 16,818 Square feet 11 176,589 496 117
Government/Civic 112,100 Square feet 13 1,451,695 4,078 1,452
Warehouse /a/ 57,800 square feet 4.35 251,430 706 251
Industrial /a/ 48,100 square feet 10.5 505,050 1,419 505
Total Estimated Electricity Usage of Existing Uses 10,681,107 29,981 10,681 SOURCE: South Coast Air Quality Management District CEQA Air Quality Handbook, 1993.
Natural Gas The Southern California Gas Company (SoCalGas) is investor-owned subsidiary of Sempra Energy. SoCalGas distributes natural gas to approximately 20.5 million customers through 5.7 million gas meters within a 20,000-square-mile service area that includes over 530 cities in Central and Southern California, including the City of Redlands.46 SoCalGas obtains natural gas supplies from sedimentary basins located in California, New Mexico, West Texas, Rocky Mountain, and Western Canada. SoCalGas and the San Diego Gas and Electric Company (SDG&E) share interstate pipelines that convey natural gas to Southern California. Interstate pipelines have a natural gas upstream capacity of 7,725 million cubic feet per day, or 218,250 million cubic feet per month.47 In 2007, SDG&E and SoCalGas customers consumed approximately 547 million therms or 4408 cubic feet per month of natural gas and 5,592 million therms,
43Arizona Public Service - Power Plants - Generation, http://www.aps.com/general_info/AboutAPS_18.html,
Accessed on May 21, 2010. 44SCE Palo Verde Nuclear Generating Station, http://www.edison.com/ourcompany/sce.asp?id=2080, Accessed on
May 21, 2010. 45SCE Big Creek Hydro Facilities, Available at: http://www.edison.com/ourcompany/sce.asp?id=2078, Accessed on
May 21, 2010. 46Southern California Gas Company. Company Profile. Accessed February 3, 2009 from http://www.socalgas.com/aboutus/profile.html,
47California Gas and Electric Utilities, 2008 California Gas Report, 2008.

Downtown General Plan & Specific Plan No. 45 Amendments 4.12 Utilities & Service Systems Draft Program EIR
taha 2006-027 4.12-10
or 45,065 million cubic feet per month, of natural gas, respectively.48,49 The remaining capacity of the natural gas pipeline utilized by SoCalGas and SDG&E is 168,777 million cubic feet per month of gas. The estimated natural gas usage on the project site is 2.3 million cubic feet per month of gas, or less than one percent of the total capacity of the interstate pipelines available to SoCalGas. Table 4.12-6 lists the estimated natural gas usage for the existing uses within the plan boundaries. TABLE 4.12-6: NATURAL GAS USAGE OF EXISTING USES ON THE PROJECT SITE
Land Use Quantity Unit
Natural Gas Usage Rate
(cubic feet/unit/month) Natural Gas
(cubic feet/month)
Residential 58 Residential Unit 6,665 386,570
Retail Uses 401,751 Square feet 2.9 1,165,078
Restaurants 41,096 Square feet 2.9 119,178
Office Space 44,500 Square feet 2.0 89,000
Theater/a/ 16,818 Square Feet 2.9 48,772
Government/Civic 112,100 Square feet 2.0 224,200
Warehouse /a/ 57,800 square feet 2.9 167,620
Industrial/a/ 48,100 square feet 2.9 139,490
Total Estimated Natural Gas Usage of Existing Uses on the Project Site 2,339,909/a/ Utilized the Retail/Shopping Centers Natural Gas Consumption Rate
SOURCE: South Coast Air Quality Management District CEQA Air Quality Handbook, 1993.
REGULATORY FRAMEWORK State Urban Water Management Planning Act. In 1983, the California Legislature enacted the Urban Water Management Planning Act, which was codified into Sections 10610 to 10656 of the California Water Code. Section 10610.4 of the California Water Code requires urban water suppliers to develop water management plans to actively pursue the efficient use of available supplies. Every five years, water suppliers are required to develop Urban Water Management Plans (UWMPs) to identify short-term and long-term water demand management measures to meet growing water demands. City of Redlands, as a water supplier, has prepared and adopted an UWMP. The City’s latest UWMP was completed in the year 2005. Currently the City is preparing a Regional UWMP in concert with the SBVMWD and other local water agencies. The Regional UWMP will fulfill the City’s legal obligation to prepare a UWMP for 2010. The proposed project is required to comply with the requirements of the Urban Water Management Planning Act. California Integrated Waste Management Act of 1989 (AB 939). Solid waste regulation in California is governed by the California Integrated Waste Management Act of 1989, which is commonly known as Assembly Bill (AB) 939. The Act, codified into the California Public Resources Code, emphasizes a reduction of waste disposed in California landfills. To achieve a reduction of waste in California landfills, AB 939 requires all city and county plans to include a waste diversion schedule with the goals to divert 25 percent of solid waste from landfills by 1995 and divert 50 percent of solid waste from landfills by the year 2000. To achieve these goals, AB 939 emphasizes that cities and counties reduce the
48California Energy Commission. California Energy Consumption Database.
49One therm is equal to 96.7 cubic feet.

Downtown General Plan & Specific Plan No. 45 Amendments 4.12 Utilities & Service Systems Draft Program EIR
taha 2006-027 4.12-11
production, recycle, and reuse solid waste. As a response to AB 939, the City adopted a Hazardous Waste Element, a Source Reduction Element, and enacted Ordinance 2544. Ordinance 2544 was codified into Chapter 13.66 of the City of Redlands Municipal Code (RMC) and is discussed below. The proposed project is required to comply with the applicable requirements of AB 939. Section 11952 to 11954 of the California Water Code (CWC). Sections 11952 to 11954 of the CWC contain the State’s water conservation requirements. The State water requirements were codified into the CWC after the passage of the Water Conservation Projects Act of 1985. The intent of Sections 11952 to 11954 of the CWC is to encourage local water agencies and private enterprises to implement potential water conservation and reclamation projects. Regional Santa Ana Regional Water Quality Control Board (SRWQCB). The SRWQCB is one of the nine State Regional Water Quality Control Boards (RWQCB) that are under the purview of the State Water Resources Control Board (SWRCB). The SWRCB sets statewide policy and together with the nine State RWQCBs implement State and federal laws and regulations that pertain to water quality of surface water and groundwater. The SRWQCB implements State and federal laws and regulations within its jurisdiction and as well as continuously maintains its Water Quality Control Plan. The SRWQCB issues permits which govern and restrict the amount of pollutants discharged into the ground or a water body. The SRWQCB has a stormwater runoff water quality discharge requirements for incorporated cities of San Bernardino County. These stormwater runoff requirements are outlined in the SRWQCB Order No. R8-2010-0036, National Pollution Discharge Elimination System (NPDES) Permit No. CAS618036. Order No. R8-2010-0036, NPDES Permit No. CAS618036 requires new developments to prepare a Water Quality Management Plan (WQMP). The City and the proposed project are required to comply with all regulations of the SRWQCB. Local Chapter 3.56 of the RMC. The intent and purpose of Chapter 3.56 of the RMC is to implement the City’s General Plan and ensure storm drain facilities and improvements, which satisfy the City standards, are available concurrent with the need caused by new development within the City. Section 3.56.040 of the RMC requires that applicants of development permits pay storm drain fees prior to the issuance of a building permit and that the building permit be consistent with the City’s master storm drain plan. All City development projects are required to comply with Chapter 3.56 of the RMC. City of Redlands Municipal Code Chapter 3.44. Chapter 3.44 of the RMC establishes the sewer capital improvement fund that would be used to implement the City’s General Plan and to finance the construction of wastewater facilities to provide new capacity required to serve development requiring sewer service from the City. Wastewater capital facilities include wastewater treatment facilities, sewer trunk lines, sewage disposal facilities, outfall sewers, interceptor sewers, and other capital facilities and appurtenances over and above eight-inch collection mains and appurtenances used to serve property frontage, except as otherwise provided in Chapter 13.44 of the RMC. Section 3.44.030 of the RMC requires that a sewer capital improvement charge be paid as a condition of issuing building permits, or any other City entitlement, as determined within the sole discretion of the City, for buildings containing plumbing fixtures that are required to have a new sewer service connection to the City’s sewage system or increasing flow into the City’s sewer system as estimated by the City. The proposed project is required to comply with Chapter 3.44 of the RMC. City of Redlands Municipal Code Chapter 13.52. Chapter 13.52 of the RMC sets forth uniform requirements of all users of the City’s wastewater treatment infrastructure and enables the City to comply with all applicable State and federal laws. Chapter 13.52.080 of the RMC enables the Director of the

Downtown General Plan & Specific Plan No. 45 Amendments 4.12 Utilities & Service Systems Draft Program EIR
taha 2006-027 4.12-12
RMUED to gain entry to properties that are users of the RMUED wastewater treatment infrastructure to perform compliance monitoring. Compliance monitoring performed by the Director of the RMUED is ensure users of the RMUED wastewater treatment infrastructure is complying with Chapter 13.52 of the RMC and any wastewater discharge permit issued under the Chapter 13.52 of the RMC. The proposed project is required to comply with Chapter 13.52 of the RMC. City of Redlands 2005 Urban Water Management Plan. The City’s 2005 UWMP addresses all subjects of Section 10631 of the Urban Water Management Planning Act. The 2005 UWMP addresses conservation, local supplies, State Water Project supplies, Santa Ana River and Mill Creek supplies, and water drawn from regional storage. City of Redlands Water Shortage Contingency Plan (WSCP). The WSCP would be used by the City to respond to water supply shortages. The WSCP includes four action stages to respond to water shortages; a discussion of minimum water supplies during a drought period; prohibitions, penalties, and consumption reduction methods; and water use monitoring procedures. The entire language of the WSCP is found in Appendix F of the City’s 2005 UWMP. The proposed project is required to comply with City’s WSCP. Chapter 13.06 of the RMC. In January 2003, Ordinance 2544 was approved and codified into the Chapter 13.06 of the RMC. Chapter 13.06 of the RMC is the City’s Water Conservation Plan. Chapter 13.06 of the RMC was developed as a response to the SBVMWD requirements that its member agencies develop water conservation plans and programs and pursuant to the City’s UWMP and State laws. The purpose of Chapter 13.06 of the RMC is to reduce nonessential use of water and conserve City water supplies which thereby minimize the effect of water shortage upon City users. The proposed project is expected to comply with Chapter 13.06 of the RMC. City of Redlands Municipal Code Chapter 3.48. Chapter 3.48 of the RMC establishes the water capital improvement fund that would be used to implement the City’s General Plan and to finance the construction of water capital facilities and improvements required to serve new development requiring water service from the City. Water capital facilities include the development of water resources, water production, transmission, storage, and other capital facilities and appurtenances over and above the eight-inch distribution mains and appurtenances used to serve property frontage. Section 3.48.030 of the RMC requires that a water capital improvement charge be paid as a condition of approval of any new water connection or, any property or use having an existing water connection and which is increasing its water demand on the City’s utilities system prior to the issuance of building permits, business license, or any other City entitlement associated with the change in the property or use that is causing such increased demand. The proposed project is expected to comply with Chapter 3.48 of the RMC. Chapter 3.70 of the RMC. Chapter 3.70 of the RMC is intended to implement the City’s General plan and finance the cost of solid waste capital facilities and equipment to provide new capacity to serve development requiring solid waste service from the City. Section 3.70.030 of the RMC requires that a solid waste capital improvement charge be paid to the City prior to the issuance of a building permit for buildings that are required to have new solid waste services or buildings that would increase the solid waste stream into the City’s Solid Waste system as estimated by the City. The proposed project is expected to comply with the requirements of Chapter 3.70 of the RMC. Chapter 13.64 of the RMC. Chapter 13.64 of the RMC is the City’s Integrated Solid Waste Management Program (ISWMP) that is mandated by California Public Resources Code Sections 40100 et sq. The purpose of the City’s ISWMP is to establish procedures for regular collection, transfer, processing, and disposal from properties within the City. The proposed project is expected to comply with the requirements of Chapter 13.04 of the RMC.

Downtown General Plan & Specific Plan No. 45 Amendments 4.12 Utilities & Service Systems Draft Program EIR
taha 2006-027 4.12-13
Chapter 13.66 of the RMC. Chapter 13.66 of the RMC establishes the recycling requirements for each specified development activity to facilitate the City’s compliance with State recycling mandates, the removal of architectural barriers to recycling, and ensure recycling of construction and demolition debris. Section 13.66.040 of the RMC specifies the demolition and construction recycling requirements of the City. Developers of projects must comply with recycling planning and reporting requirements of Section 13.66.040 of the RMC prior to obtaining a demolition permit, building permit, and certificate of occupancy. Section 13.66.030 of the RMC requires that developers submit to the City, for review and approval, a site and building recycling plan prior to obtaining a building permit and a certificate of occupancy. The proposed project is expected to comply with requirements of Chapter 13.66 of the RMC. THRESHOLDS OF SIGNIFICANCE The proposed project would have a significant impact on utilities and service systems if it would: $ Require or result in the construction of new stormwater drainage facilities or expansion of
existing facilities, the construction of which could cause significant environmental effects; $ Result in exceeding wastewater treatment requirements of the applicable Regional Water Quality
Control Board; $ Require or result in the construction of new water or wastewater treatment facilities or expansion
of existing facilities, the construction of which could cause significant environmental effects; $ Result in a determination by the wastewater treatment provider which serves or may serve the
project that it does not have adequate capacity to serve the project’s projected demand in addition to the provider’s existing commitments;
$ Result in a demand for water supplies beyond that available from existing entitlements and resources;
$ Result in solid waste generation that could not be accommodated in existing landfills with sufficient permitted capacity to accommodate the project;
$ Result in the City not complying with federal, State, and/or local statutes and regulations related to solid waste; and/or
$ Require the construction of new energy production and/or transmission facilities or expansion of existing facilities, the construction of which could cause significant environmental effects.
IMPACTS Stormwater and Drainage Two major stormdrain projects are planned as part of the proposed project to ensure that stormwater runoff is adequately conveyed off the properties in Downtown and into the Mission-Zanja Creek System. The first includes the installation of a stormdrain beginning at 9th Street and ending to the east of Texas Street that would run parallel to Redlands Boulevard and Oriental Avenue. The second project includes the installation of a storm drain beneath 6th Street from the BNSF Railroad right-of-way to the previously mentioned proposed stormdrain. However, due to current economic conditions, the City does not have sufficient funds to undertake either project. In addition to the proposed enhancements, developers of residential, retail, and commercial uses associated with the proposed project are expected to comply with Chapter 3.56 of the RMC. Compliance with Chapter 3.56 of the RMC would ensure that (a) any public facilities and improvements (including the new stormdrains) would be available to serve new developments associated with the proposed project and (b) that stormdrain infrastructure on developed properties would be in compliance with the City’s storm drain master plan and would thus ensure stormwater is adequately conveyed off the project site and into the Mission-Zanja Creek System. Therefore, the proposed project would result in less-than-significant impacts related to City stormwater and drainage infrastructure serving the project site.

Downtown General Plan & Specific Plan No. 45 Amendments 4.12 Utilities & Service Systems Draft Program EIR
taha 2006-027 4.12-14
The proposed project would not substantially increase the volume of stormwater runoff from the project site into the Misson-Zanja Creek System. However, the proposed project could increase the stormwater runoff rate into the Mission-Zanja Creek System. The project site is developed and served by existing stormwater collection and conveyance systems. Construction activities associated with development of the proposed project could result in localized changes to drainage patterns. In particular, vacant lots that drain via sheet flow would be developed with collection, treatment and conveyance systems. These changes could increase the rate of discharge into the storm drain system. Individual projects developed within the project area would include project design features that would aid in the conveyance and possible detention of storm water to existing facilities. All runoff would continue to be conveyed via streets and gutters to storm drain locations within the project area. However, changes in the drainage system, as well as the inability of the City to make upgrades at this time, could result in significant impacts to the Mission-Zanja Creek System. Therefore, without mitigation, the proposed project would result in a significant impact related to the Mission-Zanja Creek System. Sewage and Wastewater Treatment Buildout of proposed project would result in a net increase of 1,618 residential units, 392,362 square feet of retail uses, 78,650 square feet of restaurant uses, 285,500 square feet of office uses, two movie theater/cinema screens, 100 hotel rooms (20,000 square feet), and 7,900 square feet of government/civic uses. The revised Downtown Specific Plan focuses on the urban form rather than specific land uses. However, for purposes of this Program EIR, it is necessary to include a quantification of plan buildout. The residential units and building square footages provided represent a conservative estimate for analysis of year 2025 buildout. This analysis is intended to be conservative such that the highest potential number of new residential units and building square footages is provided. It is likely that plan buildout would include a smaller incremental change from existing conditions to 2025. The proposed project would include the construction of new commercial, retail, restaurant, residential, entertainment, and other uses all of which would be expected to generate wastewater. The proposed project is expected to comply with requirements of Chapter 13.52 of the RMC. Compliance with Chapter 13.52 of the RMC would ensure that the proposed project would not exceed wastewater treatment requirements of the SRWQCB. The City would enforce compliance with Chapter 13.52 of the RMC by performing compliance monitoring per Section 13.52.080 of the RMC. Therefore, the proposed project would result in less-than-significant impacts related to water quality. Table 4.12-7 identifies the estimated wastewater generation of the proposed project. As shown in Table 4.12-7, the estimated wastewater generation of the proposed project is 496,365 GPD. Net wastewater generation from the proposed project is estimated to be approximately 401,750 GPD. The estimated wastewater generated by the proposed project represents, approximately, an 11 percent reduction of the remaining daily treatment capacity of the WWTP. The proposed project would not cause the WWTP to exceed its design capacity. In addition, the reduction of the WWTP’s remaining daily treatment capacity would be partially offset by the proposed project’s Environmental Footprint and Green Building Design Guidelines that includes the usage of low flow plumbing appliances and fixtures as well as many other efficiency measures. Buildout of the proposed project is not anticipated to result in the WWTP exceeding its design capacity or require the expansion of the WWTP or construction of a new wastewater treatment facility. Therefore, the proposed project would result in less-than-significant impacts related to wastewater treatment infrastructure. The existing sewer connections and wastewater conveyance infrastructure within the project site was designed to serve the existing density of residential, retail, entertainment, commercial/office, government/civic, warehouse, and industrial land uses. Portions of the wastewater conveyance infrastructure serving the project site were likely constructed early in the 20th century. The proposed project would increase the density of development within the Downtown area and intensify the usage of

Downtown General Plan & Specific Plan No. 45 Amendments 4.12 Utilities & Service Systems Draft Program EIR
taha 2006-027 4.12-15
existing wastewater connections and conveyance infrastructure, some of which may be over 100 years in age. TABLE 4.12-7: ESTIMATED WASTEWATER GENERATION OF THE PROPOSED PROJECT
BUILDOUT
Land Use Quantity Unit Usage Factor (gpd/unit) /a/ Water use (gpd)
Residential Units 1,676 Residential Unit 180 301,680
Retail Uses 793,113 square feet 0.080 63,449
Restaurants 119,746 square feet 0.300 35,924
Office Space 330,000 square feet 0.150 49,500
Theater 3,703 seats 4 14,812
Hotel 100 rooms 130 13,000
Government/Civic 120,000 square feet 0.150 18,000
Total Estimated Wastewater Generation 496,365
Less Existing Wastewater Generation (94,615)
Net Estimated Wastewater Generation 401,750 /a/ Utilized sewage generation rates to estimate water usage.
SOURCE: City of Los Angeles CEQA Thresholds Guide
Development of the proposed project could require improvements to the existing sewage connections and conveyance infrastructure such as creating connections to nearby higher capacity trunk lines. Any required improvements to the existing sewage connection and conveyance infrastructure would be met by the proposed project’s expected compliance with Chapter 3.44 of the RMC. Per Section 3.44.030 of the RMC, developers of residential and commercial uses associated with the proposed project would be required to pay a sewer capital improvement charge prior to obtaining a building permit. Compliance with Chapter 3.44 of the RMC would ensure that sewer connections and conveyance infrastructure would be constructed and available to serve the new development under the proposed project prior to and concurrent with the need. Therefore, the proposed project would result in less-than-significant impacts related to wastewater conveyance infrastructure. Water Table 4.12-8 lists the estimated water usage of the proposed project. As shown in Table 4.12-8, the estimated water usage of the proposed project is 496,365 GPD (556 APY). Net water usage from the proposed project is estimated at approximately 401,750 GPD (450 APY). A water supply and demand analysis during normal and dry year scenarios that incorporates the net water demand of the proposed project is shown in Table 4.12-9. As shown in Table 4.12-9, there would be sufficient water supplies available at the time of the proposed project’s build out under the normal, single-dry, and multiple-dry year scenarios. Projected water supplies are anticipated to meet the projected water demanded by the proposed project. The City is not anticipated to require new and/or expanded water entitlements for the proposed project. Therefore, the proposed project would result in less-than-significant impacts related to water supply of the RMUED.

Downtown General Plan & Specific Plan No. 45 Amendments 4.12 Utilities & Service Systems Draft Program EIR
taha 2006-027 4.12-16
TABLE 4.12-8: ESTIMATED WATER USAGE OF THE PROPOSED PROJECT
Land Use Quantity Unit Usage Factor (gpd/unit) /a/
Water use (gpd)
Water Use (AFY)
Residential Units 1,676 Residential Unit 180 301,680 338
Retail Uses 793,113 square feet 0.080 63,449 71
Restaurants 119,746 square feet 0.300 35,924 40
Office Space 330,000 square feet 0.150 49,500 55
Theater 3,703 seats 4 14,812 17
Hotel 100 rooms 130 13,000 15
Government/Civic 120,000 square feet 0.150 18,000 20
Total Estimated Water Usage 496,365 556
Less Existing Water Usage (105,045) (106)
Net Estimated Water Usage 401,750 450/a/ Utilized sewage generation rates to estimate water usage. Assumed water usage is equivalent to wastewater generation.
SOURCE: City of Los Angeles CEQA Thresholds Guide, 2006.
TABLE 4.12-9: 2025 SUPPLY-DEMAND ANALYSIS
Source
Normal Water Year Scenario
(AFY)
Single Dry Year Scenario
(AFY)
Multiple Water Dry Year Scenario (AFY)
Year 1 Year 2 Year 3
Potable Water Sources
Local Groundwater 46,000 46,000 46,000 46,000 36,800
Local Surface Water 36,850 31,320 31,320 25,800 18,430
SWP Water 5,000 250 250 250 250
Non-Potable Water Sources
Local Groundwater 10,000 10,000 10,000 10,000 8,000
Recycled Water 8,500 8,500 8,500 8,500 8,500
Total Supplies 106,350 96,070 96,070 90,550 71,980
Future City Water Demand (61,500) (61,500) (61,500) (61,500) (61,500)
Project Net Water Demand (450) (450) (450) (450) (450)
Surplus Supply 44,400 34,120 34,120 28,600 10,030SOURCE: City of Redlands 2005 Urban Water Management Plan, 2005 and TAHA, 2010.
As mentioned previously, the estimated water usage of the proposed project is 496,365 GPD. Net water usage from the proposed project is approximately 401,750 GPD. The estimated water usage of the proposed project represents approximately a two and three percent reduction of the daily treatment capacities of the Tate and Hinckley Surface WTPs, respectively. The proposed project is not anticipated to cause the Tate and Hinckley Surface WTPs to exceed their design capacity. In addition, the reduction of the Tate and Hinckley Surface WTPs’ remaining daily treatment capacity would be partially offset by the proposed project’s Environmental Footprint and Green Building Design Guidelines that include the usage of low flow plumbing appliances and fixtures, native species and drought-tolerant plants for landscaping, the capture of rainwater with a cistern, and the re-use of grey water for irrigation and landscaping. Buildout of the proposed project is not anticipated to result in the Tate and Hinckley WTPs exceeding their design capacity or require the expansion of the Tate and Hinckley WTPs or construction of a new water treatment facility. Therefore, the proposed project would result in less-than-significant impacts related to water treatment infrastructure.

Downtown General Plan & Specific Plan No. 45 Amendments 4.12 Utilities & Service Systems Draft Program EIR
taha 2006-027 4.12-17
The existing water connections and water conveyance infrastructure within the project site were designed to serve the project site’s existing density of residential, retail, entertainment, commercial/office, and government/civic land uses. The proposed project would increase the density of development on the project site and intensify the usage of existing water connections and conveyance infrastructure. Development of the proposed project could require improvements to the existing water connections and conveyance infrastructure. To address the increasing demand for water on the project site the installation of eight- and 12-inch water pipelines beneath Stuart Avenue, High Avenue, 7th Street, 8th Street, and 11th Street are included in the proposed project. The required improvements to the existing water connection and conveyance infrastructure would be met by the proposed project’s expected compliance with Chapter 3.48 of the RMC. Per Section 3.48.030 of the RMC, developers of residential and commercial uses associated with the proposed project must pay a water capital improvement charge prior to obtaining a building permit. Compliance with Chapter 3.48 of the RMC would ensure that water connections and conveyance infrastructure would be constructed and available to serve the new development under the proposed project prior to and concurrent with the need. Therefore, the proposed project would result in less-than-significant impacts related to water conveyance infrastructure. Solid Waste Demolition and Construction Phases Solid waste is anticipated to be generated as a result of individual projects developed as part of the proposed project. Per Section 13.66 of the Redlands Municipal Code, individual developers in the project site would be required to submit a construction and demolition plan to the City prior to demolition and construction. Compliance with Section 13.66 of the Redlands Municipal Code would ensure that each project has a plan for recycling of construction debris in place and that at least 50 percent of demolition and construction debris would be diverted from the California Street Landfill. Every effort would be made to divert construction and demolition debris to the maximum extent feasible. Therefore, the proposed project would result in less-than-significant impacts related to solid waste during the construction phase. Operation Table 4.12-10 lists the estimated solid waste generation during the build out of the proposed project. As shown in Table 4.12-10, the estimated solid waste generation from the proposed project is 28,007 pounds per day. Net solid waste generation of the proposed project is approximately 19,652 pounds per day or 1.2 percent of the permitted daily intake of the California Street Landfill. Prior to the occupancy and use of individual projects, developers would have to comply with Chapter 13.66 of the RMC that requires developers to prepare and submit a recycling plan to the City as a condition of the approval of a Certificate of Occupancy. Project compliance with Chapter 13.66 of the RMC would ensure that the proposed project would divert at least 50 percent of solid waste from landfills.

Downtown General Plan & Specific Plan No. 45 Amendments 4.12 Utilities & Service Systems Draft Program EIR
taha 2006-027 4.12-18
TABLE 4.12-10: ESTIMATED SOLID WASTE GENERATION OF THE PROPOSED PROJECT BUILDOUT
Land Use Quantity Unit
Solid Waste Generation Factor
(pounds per day/unit)
Estimated Solid Waste Generated
(pounds per day)
Residential Units 1,676 Residential
Unit 12 20,112
Retail Uses 793,113 square feet 0.005 3,966
Restaurants 119,746 square feet 0.005 599
Office Space 330,000 square feet 0.006 1,980
Theater 3,703 seats 0.005 111
Hotel 100 rooms 4 400
Government/Civic 120,000 square feet 0.007 840
Total Estimated Solid Waste Generation 28,007
Less Solid Waste Generated by Existing Uses (8,355)
Net Estimated Solid Waste Generation 19,652 /a/ Assumed theater solid waste generation is equivalent to the commercial solid waste generation.
SOURCE: California Department of Resources Recycling and Recovery, 2010.
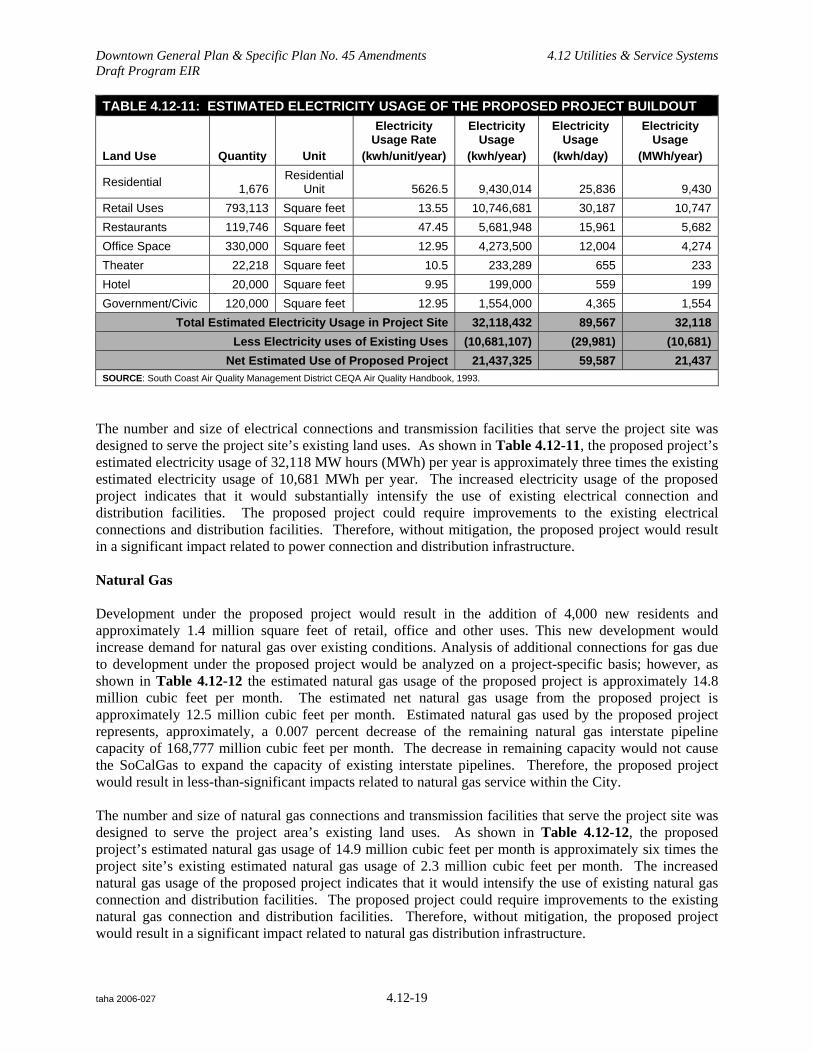
Approximately 9,826 pounds per day of solid waste would be disposed of at the California Street Landfill as a result of the development of the proposed project and compliance with Chapter 13.66 of the RMC. The disposal of the proposed project’s solid waste at the California Street Landfill would be approximately less than one percent of its permitted daily intake. Therefore, the California Street Landfill would have sufficient capacity to continue to accommodate the demand for disposal facilities generated by development under the proposed project. Therefore, the increase in solid waste generation associated with the development under the proposed project would not exacerbate landfill capacity shortages in the region to the point of significantly altering the projected timeline of any landfill to reach capacity. Therefore, the proposed project would result in less-than-significant impacts related to the City’s California Street Landfill. Electricity Development under the proposed project would result in the addition of 4,000 new residents and approximately 1.4 million square feet of retail, office and other uses. This new development would increase demand for electricity over existing conditions. Analysis of additional connections for electricity due to development under the proposed project would be analyzed on a project-specific basis; however, as shown in Table 4.12-11, the estimated electricity usage of the proposed project is 32.1 million kWh per year of electricity. Net electricity usage of the proposed project is estimated at approximately 21.4 million kWh per year of electricity. Estimated electricity used by the proposed project would represent an increase of approximately 0.02 percent increase to the total power provided to SCE customers in 2007. The incremental increase of electricity usage from the proposed project buildout would be partially offset by the proposed project’s Environmental Footprint and Green Building Design Guidelines that includes the incorporation of solar panels, usage of tankless water heaters, and tailoring water treatment to “end use” to reduce energy usage. Therefore, the proposed project would result in less-than-significant impacts related to electricity generation infrastructure.
Downtown General Plan & Specific Plan No. 45 Amendments 4.12 Utilities & Service Systems Draft Program EIR
taha 2006-027 4.12-19
TABLE 4.12-11: ESTIMATED ELECTRICITY USAGE OF THE PROPOSED PROJECT BUILDOUT
Land Use Quantity Unit
Electricity Usage Rate
(kwh/unit/year)
Electricity Usage
(kwh/year)
Electricity Usage
(kwh/day)
Electricity Usage
(MWh/year)
Residential 1,676
Residential Unit 5626.5 9,430,014 25,836 9,430
Retail Uses 793,113 Square feet 13.55 10,746,681 30,187 10,747
Restaurants 119,746 Square feet 47.45 5,681,948 15,961 5,682
Office Space 330,000 Square feet 12.95 4,273,500 12,004 4,274
Theater 22,218 Square feet 10.5 233,289 655 233
Hotel 20,000 Square feet 9.95 199,000 559 199
Government/Civic 120,000 Square feet 12.95 1,554,000 4,365 1,554
Total Estimated Electricity Usage in Project Site 32,118,432 89,567 32,118
Less Electricity uses of Existing Uses (10,681,107) (29,981) (10,681)
Net Estimated Use of Proposed Project 21,437,325 59,587 21,437 SOURCE: South Coast Air Quality Management District CEQA Air Quality Handbook, 1993.
The number and size of electrical connections and transmission facilities that serve the project site was designed to serve the project site’s existing land uses. As shown in Table 4.12-11, the proposed project’s estimated electricity usage of 32,118 MW hours (MWh) per year is approximately three times the existing estimated electricity usage of 10,681 MWh per year. The increased electricity usage of the proposed project indicates that it would substantially intensify the use of existing electrical connection and distribution facilities. The proposed project could require improvements to the existing electrical connections and distribution facilities. Therefore, without mitigation, the proposed project would result in a significant impact related to power connection and distribution infrastructure. Natural Gas Development under the proposed project would result in the addition of 4,000 new residents and approximately 1.4 million square feet of retail, office and other uses. This new development would increase demand for natural gas over existing conditions. Analysis of additional connections for gas due to development under the proposed project would be analyzed on a project-specific basis; however, as shown in Table 4.12-12 the estimated natural gas usage of the proposed project is approximately 14.8 million cubic feet per month. The estimated net natural gas usage from the proposed project is approximately 12.5 million cubic feet per month. Estimated natural gas used by the proposed project represents, approximately, a 0.007 percent decrease of the remaining natural gas interstate pipeline capacity of 168,777 million cubic feet per month. The decrease in remaining capacity would not cause the SoCalGas to expand the capacity of existing interstate pipelines. Therefore, the proposed project would result in less-than-significant impacts related to natural gas service within the City. The number and size of natural gas connections and transmission facilities that serve the project site was designed to serve the project area’s existing land uses. As shown in Table 4.12-12, the proposed project’s estimated natural gas usage of 14.9 million cubic feet per month is approximately six times the project site’s existing estimated natural gas usage of 2.3 million cubic feet per month. The increased natural gas usage of the proposed project indicates that it would intensify the use of existing natural gas connection and distribution facilities. The proposed project could require improvements to the existing natural gas connection and distribution facilities. Therefore, without mitigation, the proposed project would result in a significant impact related to natural gas distribution infrastructure.

Downtown General Plan & Specific Plan No. 45 Amendments 4.12 Utilities & Service Systems Draft Program EIR
taha 2006-027 4.12-20
TABLE 4.12-12: ESTIMATED NATURAL GAS USAGE OF THE PROPOSED PROJECT BUILDOUT
Land Use Quantity Unit Natural Gas Usage Rate (cubic feet/unit/month)
Natural Gas (cubic feet/month)
Residential 1,676 Residential Unit 6,665 11,170,540
Retail Uses 793,113 Square feet 2.9 2,300,028
Restaurants 119,746 Square feet 2.9 347,263
Office Space 330,000 Square feet 2.0 660,000
Theater/a/ 22,218 Square feet 2.9 64,432
Hotel 20,000 Square feet 4.8 96,000
Government/Civic 120,000 Square feet 2.0 240,000
Total Estimated Natural Gas Usage in Project Site 14,878,263
Less Natural Gas Usage of Existing Uses (2,339,909)
Net Estimated Natural Gas of Proposed Project 12,538,355/a/ Assumed theater solid waste generation is equivalent to the commercial solid waste generation.
SOURCE: California Department of Resources Recycling and Recovery, 2010.
MITIGATION MEASURES Stormwater and Drainage US1 Individual projects within the project area shall include drainage improvements, such as catch
basins, surface parking drains, and other drainage improvements as necessary. These improvements must be constructed as part of the proposed project in accordance with standard engineering practices and BMPs. In addition, individual projects, shall include detention basins, infiltration areas, porous pavements, and landscape swales as feasible. All drainage improvements, detention basins, infiltration areas, porous pavements, and landscape swales shall be constructed in a way to ensure that the stormwater runoff rate within the project site at build out does not exceed the existing rate of stormwater runoff.
Wastewater Although no significant impacts are anticipated upon wastewater treatment and conveyance infrastructure, the following mitigation measure is recommended to ensure developments under the proposed project are adequately served by the City. US2 Sewer systems associated with individual projects within the project area shall be subject to
project-specific design review and approval by the RMUED. Water Although no significant impacts are anticipated upon water treatment and conveyance infrastructure, the following mitigation measure is recommended to ensure projects developed under the proposed project would meet City specifications regarding design and construction. Project level review by the City would also help ensure the area is adequately served in the interim years and through project buildout. US3 Water systems associated with individual projects within the project area shall be subject to
project-specific design review and approval by the RMUED.

Downtown General Plan & Specific Plan No. 45 Amendments 4.12 Utilities & Service Systems Draft Program EIR
taha 2006-027 4.12-21
Solid Waste Impacts related to solid waste are less than significant, no mitigation measures are required. . Electricity US4 Developers of individual projects associated with the proposed project shall submit final project
design plans to SCE to determine if existing electrical connections and off-site distribution facilities would require improvement as a result of the proposed project’s operation. Developers of properties on the project site shall follow SCE guidelines, if improvements to existing electrical connections and off-site distribution facilities are found to be necessary as a result of the proposed project’s operation.
Natural Gas US5 Developers of individual projects associated with the proposed project shall submit final project
design plans to SoCalGas to determine if existing natural gas distribution infrastructure would require improvement as a result of the proposed project’s operation. Developers of properties on the project site shall follow SoCalGas guidelines, if improvements to existing natural gas connections and off-site distribution facilities are found to be necessary as a result of the proposed project’s operation.
LEVEL OF IMPACT AFTER MITIGATION Stormwater and Drainage Implementation of Mitigation Measure US1, which requires standard engineering practices and BMPs as well as detention basins, infiltration areas, porous pavements, and landscape swalls for individual projects within the project area, would result in a reduction in the amount of stormwater runoff expected from future uses within the project area than under existing conditions. Therefore, Mitigation Measure US1 would reduce the impacts to less than significant. Wastewater Impacts related to wastewater were determined to be significant without mitigation. Mitigation Measure US2 would reduce the impacts to less than significant. Water Impacts related to water were determined to be significant without mitigation. Mitigation Measure US3 would reduce the impacts to less than significant. Solid Waste Impacts related to solid waste were determined to be less than significant without mitigation. Electricity Impacts related to electricity were determined to be significant without mitigation. Mitigation Measure US4 would reduce the impacts to less than significant.
Downtown General Plan & Specific Plan No. 45 Amendments 4.12 Utilities & Service Systems Draft Program EIR
taha 2006-027 4.12-22
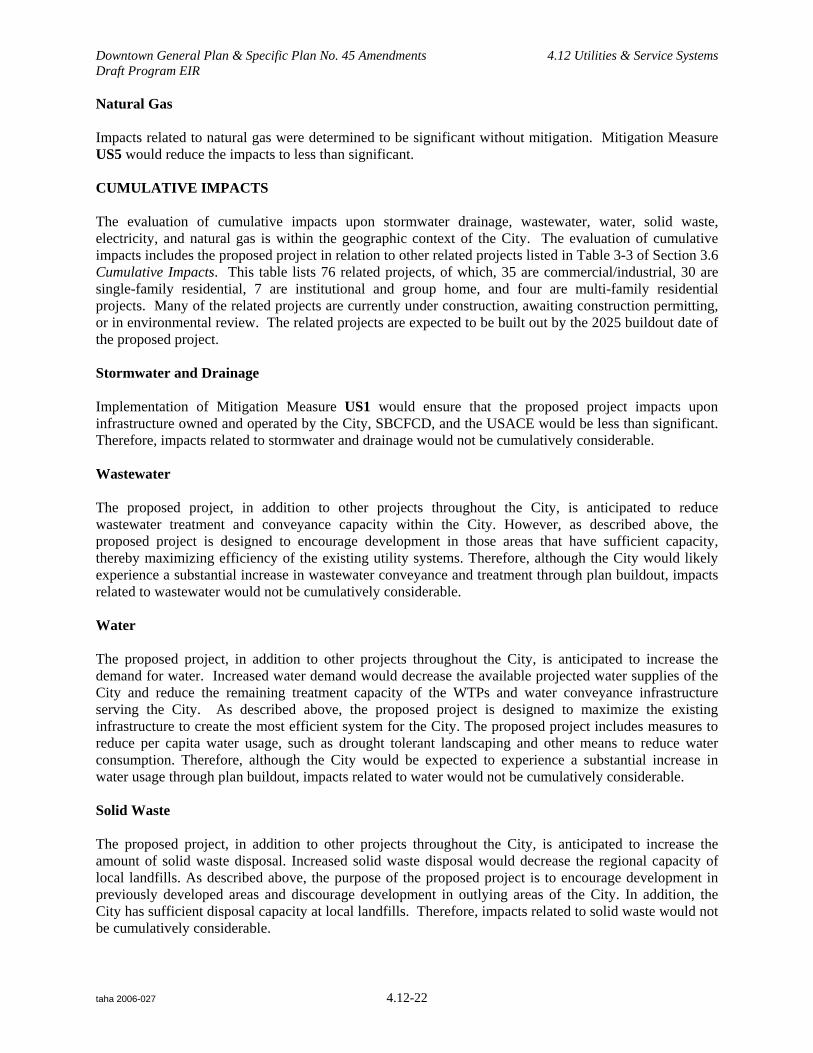
Natural Gas Impacts related to natural gas were determined to be significant without mitigation. Mitigation Measure US5 would reduce the impacts to less than significant. CUMULATIVE IMPACTS The evaluation of cumulative impacts upon stormwater drainage, wastewater, water, solid waste, electricity, and natural gas is within the geographic context of the City. The evaluation of cumulative impacts includes the proposed project in relation to other related projects listed in Table 3-3 of Section 3.6 Cumulative Impacts. This table lists 76 related projects, of which, 35 are commercial/industrial, 30 are single-family residential, 7 are institutional and group home, and four are multi-family residential projects. Many of the related projects are currently under construction, awaiting construction permitting, or in environmental review. The related projects are expected to be built out by the 2025 buildout date of the proposed project. Stormwater and Drainage Implementation of Mitigation Measure US1 would ensure that the proposed project impacts upon infrastructure owned and operated by the City, SBCFCD, and the USACE would be less than significant. Therefore, impacts related to stormwater and drainage would not be cumulatively considerable. Wastewater The proposed project, in addition to other projects throughout the City, is anticipated to reduce wastewater treatment and conveyance capacity within the City. However, as described above, the proposed project is designed to encourage development in those areas that have sufficient capacity, thereby maximizing efficiency of the existing utility systems. Therefore, although the City would likely experience a substantial increase in wastewater conveyance and treatment through plan buildout, impacts related to wastewater would not be cumulatively considerable. Water The proposed project, in addition to other projects throughout the City, is anticipated to increase the demand for water. Increased water demand would decrease the available projected water supplies of the City and reduce the remaining treatment capacity of the WTPs and water conveyance infrastructure serving the City. As described above, the proposed project is designed to maximize the existing infrastructure to create the most efficient system for the City. The proposed project includes measures to reduce per capita water usage, such as drought tolerant landscaping and other means to reduce water consumption. Therefore, although the City would be expected to experience a substantial increase in water usage through plan buildout, impacts related to water would not be cumulatively considerable. Solid Waste The proposed project, in addition to other projects throughout the City, is anticipated to increase the amount of solid waste disposal. Increased solid waste disposal would decrease the regional capacity of local landfills. As described above, the purpose of the proposed project is to encourage development in previously developed areas and discourage development in outlying areas of the City. In addition, the City has sufficient disposal capacity at local landfills. Therefore, impacts related to solid waste would not be cumulatively considerable.
Downtown General Plan & Specific Plan No. 45 Amendments 4.12 Utilities & Service Systems Draft Program EIR
taha 2006-027 4.12-23
Electricity The proposed project would result in an increase in residential, office, retail and other uses that would increase the demand for electricity provided by SCE. Based on SCE’s planning practices, it is anticipated that SCE would meet future electricity demands necessary for the proposed project. It is anticipated that SCE would ensure that any new and existing electrical connections and distribution facilities would adequately serve the City. In addition, as new projects are developed, energy conservation measures are anticipated to be required. For example, all new projects constructed in California are required to conform to the energy conservation standards specified in Title 24 of the CCR, and many individual projects include other energy conservation measures in order to achieve green building status, either officially (as recognized by the LEED Green Building Rating System) or unofficially (in order to recognize sustainable building principles). Therefore, impacts related to electricity would not be cumulatively considerable. Natural Gas The proposed project would result in a permanent and continued use of natural gas. The project area is currently served by existing infrastructure that conveys gas from SoCalGas. SoCalGas has stated that it can supply natural gas without jeopardizing other service commitments. Because SoCalGas has stated that demand projections are continuously updated, and SoCalGas’s system has ample capacity to assure continued levels of service to customers within the region, supplying the project area with additional natural gas would not compromise its existing and projected service commitments. Therefore, impacts related to natural gas would not be cumulatively considerable.