4.1 climatic regions of rajasthan t -...
TRANSCRIPT
Assessment of Climatic Vulnerability 135
4.1 CLIMATIC REGIONS OF RAJASTHAN
The climate of Rajasthan state has varied contrasts and the presence of
Aravallis is the greatest influencing factor. The state can broadly be divided into
Arid, Semi-Arid and Sub-Humid Regions, on the basis of rainfall intensities. The
Western Rajasthan i.e. in the arid region consist of the districts of Hanumangarh,
Jaisalmer, Barmer, Ganganagar, Churu, Jhunjhunu, Sikar, Nagaur, Jodhpur, Pali and
Jalore covering an area of nearly 1,43,842 sq.km. The region is characterized by low
and highly variable rainfall years creating inhospitable living condition to both
human and livestock population. An area of 9,290 sq km in extreme western parts of
the state has true desert conditions. With an improvement in rainfall pattern from the
west towards the east Rajasthan semi-arid conditions are created in an area of about
66,830 sq km in the districts of Alwar, Jaipur, Bharatpur, Ajmer, Tonk, Sawai
Madhopur, Bhilwara, Bundi, Kota, Chittorgarh, Udaipur, Sirohi, Dungarpur and
parts of Jhalawar and Banswara.
The distribution of climatic regions of Rajasthan on the basis of rainfall and
temperature variations is divided into the following categories: (See Map – 18)
(1) Arid Region: The Arid region includes Jaisalmer district, northern parts of
Barmer, western of the Phalodi Tehsil of Jodhpur, western parts of Bikaner
and southern parts of Ganganagar district. Climate of the region is very
severe and arid. Rainfall less than 10 cm in extreme west parts of regions and
rest areas record less than 20 cm rainfall. The average temperature during
summer is recorded more than 34o C and during winters it ranges in between
12oC to 16
oC.

Assessment of Climatic Vulnerability 136
MAP - 18

Assessment of Climatic Vulnerability 137
(2) Semi-arid Region: The average temperature during winter season ranges
between 10o C and 17
o C and the summer season temperature range 32
o C
to
36o C. As the region has erratic as well as torrential rainfall it brings floods
too each time. Rainfall ranges 20 to 40 cm. This region comprises the
western parts of Ganganagar, Hanumangarh, Jodhpur and Barmer districts.
The winter season is very short and arid in the northern parts of this region.
(3) Sub-humid Region: In the semi arid humid region, rainfall is meager and
the amount of rainfall is limited to a few monsoon months only. The rainfall
is between 40 to 60 cm and the average temperature during summer season
ranges from 28o
to 34o C whereas it is recorded 12
o C in northern parts and
18o C in the southern parts. Alwar, Jaipur, Dausa and Ajmer, eastern parts of
Jhunjhunu, Sikar, Pali and Jalore districts, north-western parts of Tonk,
Bhilwara and Sirohi districts are included in this category. This region has
steppe type of vegetation.
(4) Humid Region: this region receives winter rainfall associated with cyclones
along with monsoon season rainfall which varies from 60 to 80 cm. Deciduous
trees dominate the region. Humid region is found at the districts of Bharatpur,
Dholpur, Sawai Madhopur, Bundi, Kota, Barmer and Rajsamand and the
north-eastern parts of Udaipur.
(5) Very Humid Region: Very Humid Region includes south-east Kota, Baran,
Jhalawar, Banswara, south-west Udaipur and adjacent areas of Mt. Abu.
Here, the summers are very hot and winters are cold and dry. Rainfall
received is between 80 cm to 150 cm, which is mostly during the rainy
season. Monsoon savanna type of vegetation is present in the region.
Assessment of Climatic Vulnerability 138
Koppen’s Classification:
Koppen’s classification for the World Climatic regions is totally based on the
vegetation, as the effects of temperature and rainfall are directly evident and visible it.
Here, the three categories are associated with Tropical/Mega-thermal climates, Dry
(arid and semiarid) climates and Mild Temperate/Meso-thermal climates respectively.
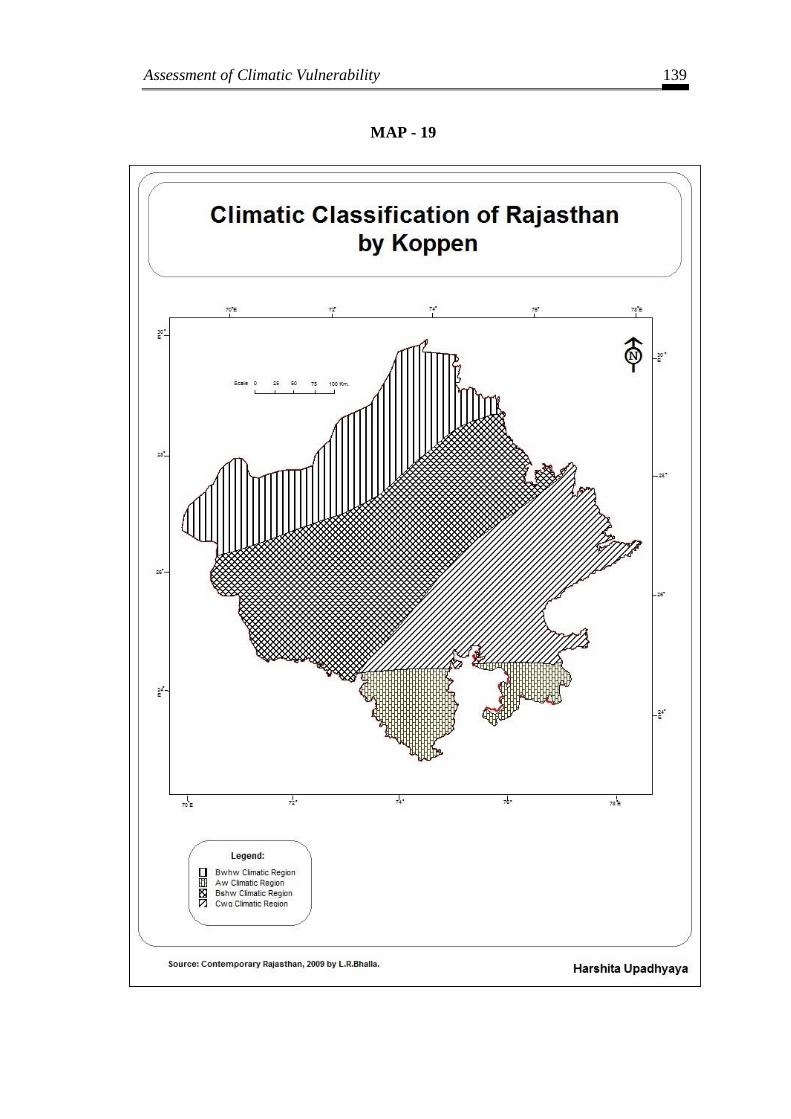
The classification of Rajasthan according to Koppen is as follows (see Map – 19):
(1) Aw or Tropical Humid Region: The southern parts of Dungarpur district
and Banswara come under the region. Here, arid tropical grasslands and
Savanna like region are found along with deciduous trees of Monsoon type.
Winter season is arid and cool whereas summers experience scorching heat.
Rainfall also mainly occurs in summer season. The temperature is more than
18o C in the coldest month records.
(2) Bshw Climatic Region: This climatic region is semi-arid, where winters are
dry and even in summers there is no sufficient amount of rainfall. Vegetation
is of steppe type, characterized with thorny bushes and grasses. This region
comprises the districts of Barmer, Jalore, Jodhpur, Nagaur, Churu, Sikar,
Jhunjhunu and Hanumangarh.
(3) Bwhw Climatic Region: The region has arid-hot desert climate with very
scanty rainfall. On the contrary the process of evaporation is very active.
Thus, these areas are known as desert region, limited to western parts of Thar
Desert. North-western Jodhpur, Jaisalmer, western Bikaner and western parts
of Ganganagar district are included in this category.
(4) Cwg Climatic Region: The south-eastern areas of Aravalli are the part of
the region. Rains are limited to few monsoon months only. Seasonal winds
do not bring rains to this region during winters.
Assessment of Climatic Vulnerability 139
MAP - 19
Assessment of Climatic Vulnerability 140
Thorntwaite’s Classification
The base of this classification Thornthwaite took into account the amount of
rainfall and evaporation along with seasonal and monthly distribution of temperature
and rainfall which made it popular and widely accepted. Rajasthan may broadly be
divided into the following four regions (see Map – 20):
(1) CA’w Climatic Region: this region is characterized by wet summers and
dry winters. Savanna and Monsoon type of vegetation are found here. This
region includes south-eastern parts of Udaipur and districts of Banswara,
Dungarpur, Kota, and Jhalawar.
(2) DA’w Climatic Region: The region comprises south and eastern areas of
Rajasthan, covering districts of Sirohi, east Jalor, Pali, Ajmer, Chittorgarh,
Bundi, Sawai Madhopur, Tonk, Bhilwara, Bharatpur, Jaipur, Dausa, Alwar,
Sikar and Jhunjhunu. Rainfall is meager and Semi-arid vegetation is found.
Summers are marked by High temperatures.
(3) DB’W Climatic Region: It includes the northern areas of Rajasthan i.e.
Ganganagar, Hanumangarh, Churu and Bikaner districts. The region has
short and dry winters whereas summers are long and associated with good
rains. Thorny bushes and semi-arid vegetation are found here.
(4) EA’d Tropical Desert Climatic Region: This region of Marusthali includes
Barmer, Jaisalmer, western Jodhpur, south-western Bikaner district. The
climate is very hot and arid. Rains are deficient in every season. Only
Xerophytic vegetation grown only.

Assessment of Climatic Vulnerability 141
MAP - 20

Assessment of Climatic Vulnerability 142
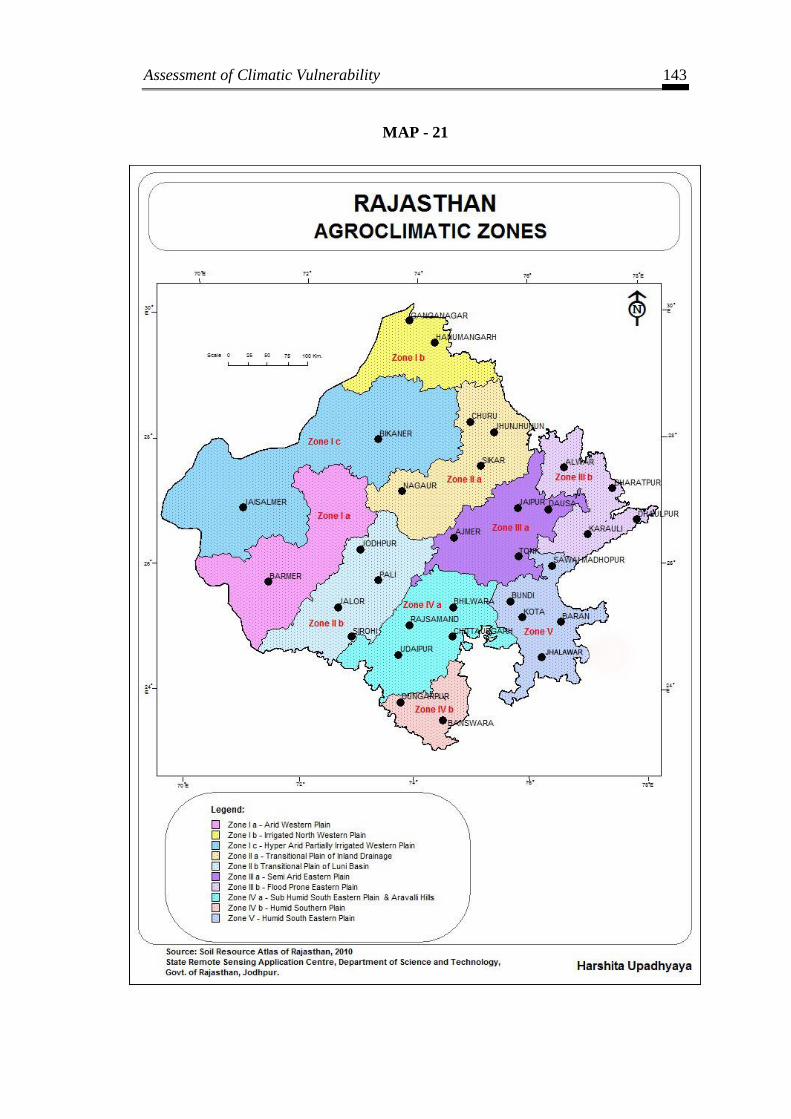
AGRO- CLIMATIC ZONES
The entire country has been delineated into 126 agro-climatic zones by The
Indian Council of Agricultural Research, out of which the state has been divided into
10 agro-climatic zones (see Map– 21). These zones have been classified on the basis
of agro-climatic parameters like rainfall, temperature regime, topography, soil
characteristics, cropping pattern and irrigation availability. See Annexure – I. The
Agro-climatic zones are as follows:
1. Arid North Western Sandy Plain
The plain is characterized by vast sandy plain with sand dunes, sandy plain
pediments and palayas present in the region. The vast area covered with sand dunes
has coarse textured soil with CaCO3 and gypsum. This physiographic zone is located
in the north western part of the state covering Jaisalmer, Barmer, Bikaner and
Jodhpur districts. The zone has erratic and uncertain rainfall witnessing frequent
droughts. The mean annual rainfall is 100 to 400mm. Groundwater is deep and
saline but at few places tube-well water is used for irrigation. Rain-fed agriculture is
practiced in some pockets and livelihood is primarily livestock based.
2. Irrigated North Western Plain
This plain extends in the northern part of the state in Ganganagar, Hanumangarh
and north western part of Bikaner district. As the zone is irrigated by network of
Indira Gandhi Canal, Bhakra and Gang canal, it is intensively cultivated. The plain is
dominantly covered by the medium and fine textured deep to very deep soils. The bed
of River Ghagghar stretching from Suratgarh to Anupgarh is fine textured and
intensively cultivated. In addition, in the southern and eastern part the region there is
vast Aeolian plain covered with dunes with small area of deep buried pediments.
Assessment of Climatic Vulnerability 143
MAP - 21

Assessment of Climatic Vulnerability 144
3. Hyper Arid Partial Irrigated Zone
This zone is spread in the arid region of Bikaner, Jaisalmer and parts of Churu,
where the farmers have partial dependence on the sources of irrigation. The normal
rainfall in the region is 185 to 390 mm. the regions has desert soil characterized by
sand dunes and aeolian soil. The soil is loamy coarse in texture and with calcareous
characteristics.
4. Transitional Plain of Inland Drainage
This plain is spread in the central part of the state covering western, eastern
and northern part of Nagaur and entire Sikar, Churu and Jhunjhunu districts. There is
no drainage out of this area. The zone is covered with sandy plain, sand dunes and
occasional hills. The area distinguishes from western sandy plain in having better
rainfall (300-400mm). Livelihood of villagers depends mainly on livestock rearing
along with some rain-fed farming.
5. Alluvial Plain of Luni Basin
The physiographic zone is located in the central part of the state where a
number of ephemeral streams and River Luni and its tributaries flow through this
area covering Pali, Jalore, part of Nagaur, Jodhpur and Barmer districts. Rainfall
ranges between 400 and 500mm. water is saline in this zone. Cultivation of cash
crops is Rainfed or done with the help of tube-wells. Dominant soils are medium to
fine textured.
6. Semi Arid Eastern Plain
This plain is drained by the river Banas and its tributaries and receives 500-
700mm rainfall. The zone is spread in the eastern part of the state covering Jaipur,

Assessment of Climatic Vulnerability 145
Ajmer, Dausa and Tonk districts. The plain is sandy plain. Occasional sand dunes
and buried pediments and scattered hills with substantial area under alluvium are
features of this zone.
7. Flood Prone Eastern Plain
This zone developed on the alluvium deposited by the river Yamuna and its
tributaries and is spread over the eastern part of the state and forms western fringe of
the Indo-Gangetic plain. This zone extends in Alwar, Bharatpur and Dholpur
districts. Soils are yellowish-brown to dark yellowish brown, sandy loam to clay
loam and non-calcareous. The rainfall in the zone is 600-700mm. A large area of
this zone is under kharif and rabi crops.
8. Sub Humid Southern Plain and Aravallis
High hills are scattered through the zone and there is a contiguous appearance
of the Aravalli hills, running south to north. The zone extends in the southern part of
the state in Bhilwara, Rajsamand, Sirohi, Udaipur and Chittorgarh districts. The zone
receives 700-900mm rainfall. Hills and pediments are under hills for rest which
support natural vegetation cover including trees, shrubs and grasses. Cultivated land
occurs in between the hills. Medium to fine textured deep soils are dominant in this
region.
9. Humid Southern Plain
This plain characterized by hills and valley fills is spread in the southern part
of the state in Dungarpur, Banswara and Pratapgarh districts. In Banswara and
Pratapgarh districts the soils formed from lava flow of basalt are also found. In
between, scattered areas of deep buried pediments are also encountered. This zone

Assessment of Climatic Vulnerability 146
receives 900-1000mm rainfall. The hills are covered with thick density of trees,
shrubs and grasses.
10. Humid South Eastern Plain
This zone receives the highest rainfall in the state 700-1000mm. The plain is
spread at the south eastern part of the state covering Sawai Madhopur, Karauli,
Jhalawar, Baran, Kota and Bundi districts. The landscape is characterized by hills
pediments and vast alluvial plain formed by the rivers Chambal, Parbati, Parwan,
Kalisindh and their tributaries. Because of these rivers deep gullies and ravines have
been formed. Because of the presence of fine textured alluvium deposited by the
rivers in this zone the land is very productive.

Assessment of Climatic Vulnerability 147
4.2 ANALYSIS OF RAINFALL VARIABILITY
The degree to which rainfall amounts vary across an area or through time is
an important characteristic of climate of that area. This subject area in meteorology
and climatology is called ‘Rainfall Variability’. Rainfall Variability explains the
availability of water at a particular time and area. There are 2 components of rainfall
variability – Areal and Temporal Variability. Temporal variation analysis helps to
explain the nature of rainfall variability across time-span. Simulation models predict
an increased hydrological cycle and an increase in mean annual rainfall over most of
Asia but there is a large degree of variation in these predictions. Some studies
suggest an increase of 30% or more in precipitation over north-western India by
2050 and an increase in the probability of extreme rainfall events. This increased
precipitation intensity, particularly during the summer monsoon, could increase
floods (Tideman and Khatana, 2004).
Here, in this chapter the Rajasthan state’s rainfall variability has been
analyzed. This may be termed as the large scale variability analysis. This form of
analysis can reflect the presence or absence of cyclic nature in the rainfall availability
and can also reveal the nature of rainfall variability for the coming period. The time
span taken is of 50 years starting from 1960 up to 2009. Gupta (1990) has explained
that the variability increases with decreasing of time which has been considered for
the analysis of rainfall. Khan (1998) states that the time duration influences the value
of rainfall variability and daily rainfall will always be higher than the annual one.
The analysis of rainfall variability of the state has been carried out on the
basis of co-efficient of variation dividing the time span of 1960 to 2009 into class

Assessment of Climatic Vulnerability 148
interval of 5 years each. The coefficient of variation (CV) which is expressed in
percentage is defined as below:
C.V. = Standard deviation (σ) x 100
Normal Annual Rainfall (N)
Where, N = 564.89 and the standard deviation and CV are tabulated in Table – 6.
Table – 6 Standard Deviation (𝛔) and coefficient of variation (CV) of Rajasthan
(1960-2009)
Years 𝛔 CV
1960 - 1964 106.71 18.8904
1965 - 1969 93.55 16.56075
1970 -1974 122.3 21.65023
1975 - 1979 110.05 19.48167
1980 - 1984 99.62 17.63529
1985 - 1989 83.36 14.75686
1990 - 1994 71.83 12.71575
1995 - 1999 91.14 16.13411
2000 - 2004 120.01 21.24484
2005 - 2009 91.001 16.10951
Source: http://waterresources.rajasthan.gov.in/Daily_Rainfall_Data/Rainfall_Index.htm
During 1960 to 1964 the CV of the state was 18.89% which decreased to
16.56% during 1965 and 1969. During 1970 and 1974 the state recorded the highest
CV in the 50 years (1960 to 2009) which was 21.65%. For the next 5 years the CV
was 19.48%. Continuing this low CV trend was during 1980 and 1984 when it
reached 17.63%. Further lowering of CV in Rajasthan state was seen during 1985
and 1989 and 1990 and 1994 when CV was 14.75% and 12.71% respectively.

Assessment of Climatic Vulnerability 149
12.71% CV is the lowest of the observed 50 years in the state. During 1995
and 1999 time span the CV rose to 16.13 and further to 21.24% during 2000 and
2004. The CV reduced to 16.10% during 2005 and 2009.
Hence, it is seen that an alternatively temporal variation with increase and
decrease of CV was observed from 1980 and 1964 to 1965 and 1969 to 1970 and
1974 and 1975 and 1979. There was found a continuous decrease of CV within the
class interval of five years.
During 1995 to 1999 CV percentage again increased and the increasing trend
continued further during 2000 and 2004. During 2005 and 2009 CV again decreased.
It is seen that the time period with high rainfall variability have flood years and the
ones with low rainfall variability have drought years, but it is not a rule.
It is also observed that the CV values ranged between as high as 21.65 % and
fell down to 12.71 % in the observed 50 years. The same can be seen in Graph – 5.
Graph – 5
0
5
10
15
20
25
CV
in
%
Years
Rainfall Variability in Rajasthan
Assessment of Climatic Vulnerability 150
Rainfall variability at a time scale from years to days is as much a characteristic
of climate as the total amounts recorded and low values do not necessarily lead to
drought and high values do not necessarily lead to flooding. Variability of rainfall
may be used to characterize a climate and to deduce evidences of climate change.
By the study of rainfall and variability the adaptation to future climate change
can be developed through the experience of adapting to rainfall variability today on
the various components like water resource availability, in increase or decrease of
floods on drought or change in the nature of rainfall.

Assessment of Climatic Vulnerability 151
4.3 DISTRICT WISE ANALYSIS OF RAINFALL
Rainfall in large parts of the State is not only inadequate but also varies
sharply from year to year and place to place. The average rainfall of Rajasthan is
564.89 mm (1960 to 2009) compared to the all-India average of 1,100mm
(Government of Rajasthan, 2011) and a significant variation is seen across different
regions. The South-west monsoon brings the maximum rainfall in the state. In
certain areas south-east and intermediate rainfalls also contribute towards the total
rainfall. Pre-monsoon showers start towards the end of June and post-monsoon
showers may continue till the first week of October. At many of the places highest
rainfall is received in July and August. The period of monsoon is shortest, ranging
around 2 to 2.5 months. Its onset is late and withdrawal early as compared to other
States and one or two dry spells is a common phenomenon. 90 percent of the total
rainfall is received during monsoon season (July-September) (Commissionerate of
Watershed Development and Soil Conservation, 2010).
In the western Rajasthan, the average annual rainfall during 1980 to 2009
ranges from less than 171.12 mm in north-western part of Jaisalmer (lowest in the
state) to 400 mm in Sikar, Jhunjhunu region and along the western periphery of the
Aravalli range. In the eastern region, the rainfall ranges from around 400 mm in
Ajmer to 762.19 mm in Jhalawar. In plains, Banswara (795.25 mm) and Jhalawar
(762.19 mm) districts receive the maximum annual rain. The highest rainfall is
received in the southwest region of the State. The annual spatially averaged rainfall
is highly variable and it is most erratic in the western region with frequent dry spells,
punctuated occasionally by heavy downpour in some years associated with the
passing low pressure systems over the region (Rathore, 2006). The number of rainy

Assessment of Climatic Vulnerability 152
days during the south west monsoon period from June end to mid-September over
Rajasthan varies from 10 in Jaisalmer to 40 in Jhalawar and to 48 in Mount Abu.
The quantum of rain and number of rainfall days during the rest of the year in
different parts of Rajasthan range from 2.1 cm at Jaisalmer to 7.2 cm at Jaipur,
distributed over 2.5 to 6 rainy days (Khan, 1998). During the rainfall deficit year of
2002, the state received just 220.4 mm rainfall up to September, against the normal
of 518.6 mm in the overall monsoon (Government of Rajasthan, 2011). The
maximum average rainfall of 726 mm was recorded in 1996 and minimum 291.6
mm was recorded in 1987, prior to 2002 (Goel and Singh, 2006). Rajasthan is
heavily dependent on rainfall as it is the major source of water resource in the arid /
semi-arid state. All the rivers of Rajasthan are rain-fed, the only exception being
river Chambal. The major land use is rain-fed cropping, the Eastern Rajasthan that
falls in the semi-arid 500–1000mm annual rainfall zone and is intensively cultivated.
Thus, any fluctuation of rainfall in the climate sensitive state of Rajasthan can pose a
multitude of socio-economic problems.
As rainfall is one of the most important climatic parameter of Rajasthan the
following chapter analyses the rainfall pattern of Rajasthan district wise on the basis
of the intensity of rainfall they have received in the past 30 years ranging from 1980
to 2009. These ‘Category of Intensity’ are based on the general terminology used by
Indian Meteorological Department in its weather bulletins. This categorization is
shown in Table – 7. The average annual rainfall have been collected and computed
from 1980-2009 district wise, station wise for all Rajasthan.
Assessment of Climatic Vulnerability 153
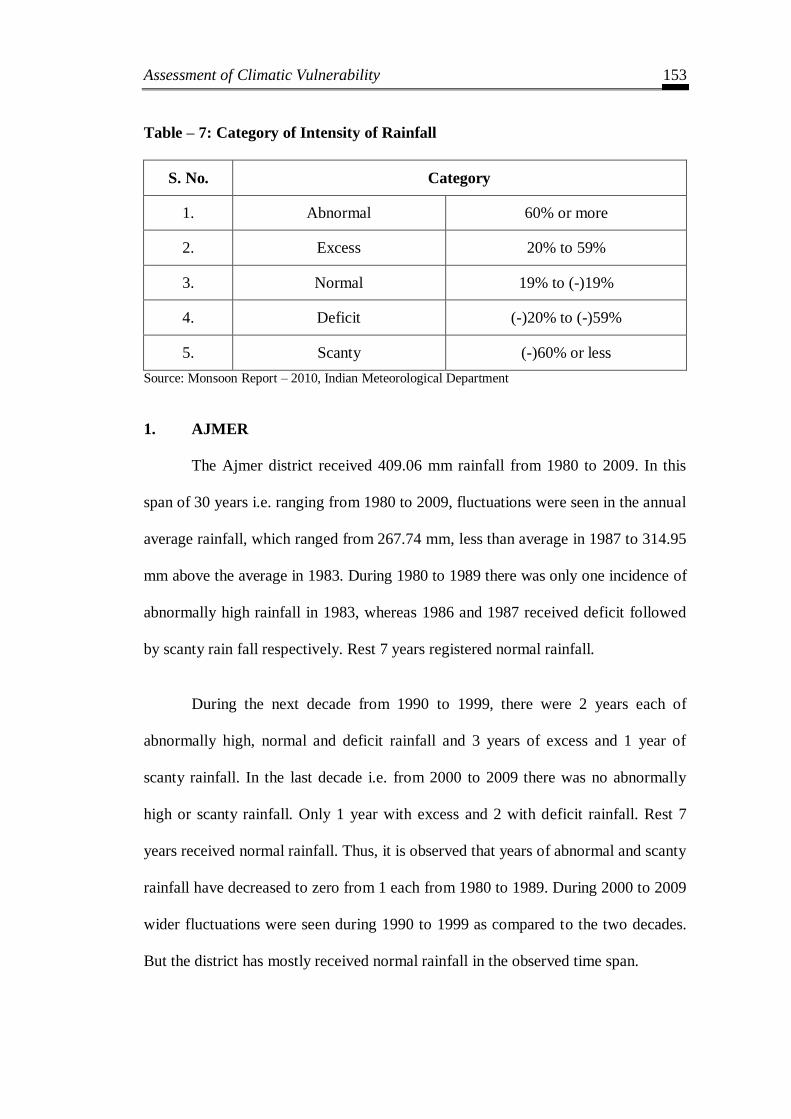
Table – 7: Category of Intensity of Rainfall
S. No. Category
1. Abnormal 60% or more
2. Excess 20% to 59%
3. Normal 19% to (-)19%
4. Deficit (-)20% to (-)59%
5. Scanty (-)60% or less
Source: Monsoon Report – 2010, Indian Meteorological Department
1. AJMER
The Ajmer district received 409.06 mm rainfall from 1980 to 2009. In this
span of 30 years i.e. ranging from 1980 to 2009, fluctuations were seen in the annual
average rainfall, which ranged from 267.74 mm, less than average in 1987 to 314.95
mm above the average in 1983. During 1980 to 1989 there was only one incidence of
abnormally high rainfall in 1983, whereas 1986 and 1987 received deficit followed
by scanty rain fall respectively. Rest 7 years registered normal rainfall.
During the next decade from 1990 to 1999, there were 2 years each of
abnormally high, normal and deficit rainfall and 3 years of excess and 1 year of
scanty rainfall. In the last decade i.e. from 2000 to 2009 there was no abnormally
high or scanty rainfall. Only 1 year with excess and 2 with deficit rainfall. Rest 7
years received normal rainfall. Thus, it is observed that years of abnormal and scanty
rainfall have decreased to zero from 1 each from 1980 to 1989. During 2000 to 2009
wider fluctuations were seen during 1990 to 1999 as compared to the two decades.
But the district has mostly received normal rainfall in the observed time span.

Assessment of Climatic Vulnerability 154
2. ALWAR
The average rainfall in Alwar district during 1980 to 2009 is 575.75 mm. In
1996 the rainfall was abnormally high i.e. 580.94 mm above the average and 371.27
mm less than the average in 1999. During 1980 to 1989 there was one incidence
each of abnormal and excess rainfall and 4 years of normal as well as deficit rainfall.
There is no incidence of scanty rainfall. The 1990-1999 decade shows a great range
of fluctuations in rainfall, with excess rainfall year 1998 followed by scanty rainfall
year i.e. 1999. The highest and lowest rainfall of the observed 30 years is also
recorded in this decade.
During 2000-2009, there is 1 year of each of abnormal, excess and scanty
rainfall, with 2 deficit years. 5 years recorded normal rainfall. In general, in the last
30 years, 14 years received normal rainfall followed by 7 years of deficit rainfall.
3. BANSWARA
The average rainfall of Banswara during 1980 to 2009 is 795.24 mm. The
region in the observed years has never registered the occurrence of scanty rainfall
and only 2 years of abnormal rainfall during 2006 and 2007. The district has 14
years of normal rainfall out of the 30 years followed by 10 years of deficit rainfall.
The occurrence of excess rainfall has also decreased from 1980-89 to 1990-
1999 and 2000-2009. During the 2000-2009 decade wide variations are seen as 2000
to 2002 are rainfall deficit years, whereas, 2004 was excess rainfall year and 2006
and 2007 were abnormally high rainfall years again followed by 2008’s deficit
rainfall.

Assessment of Climatic Vulnerability 155
Hence, the district has a trend towards greater variation in the last decade of
2000-2009 compared to 1980-1989 decade where 2, 5, and 3 years of excess, normal
and deficit rainfall were observed respectively.
4. BARAN
The average rainfall of the region during 1980 to 2009 has been 756.37 mm.
and in this span of 30 years there has been no year of abnormally high rainfall and
only 2002 has been an exception year where the district registered scanty rainfall.
The year 2002 received rainfall below normal in the entire state. Normal rainfall is
seen as a feature of the district. Out of the observed 30 years, 23 years observed
normal rainfall. During 1980-1989 there was only 1 year and during 1990-1999 there
were 3 years of excess rainfall in the district. 1986 and 1989 are the only deficit
years from 1980 to 2009.
5. BARMER
The average rainfall of the district during the observed years is 244.74 mm.
The fluctuations in tin rainfall in the region vary largely. During 1980 and 2009
rainfall received in 23 out of 30 years is either normal or below normal. During 1980
to 1989 there have been 2 years (1980 & 1981) of scanty and 3 years (1985 to 1987)
of deficit rainfall and 3 years of rainfall above normal as well. The trend of more years
having normal rainfall or below normal continues during 1990 to 1999 and 2000 to
2009 as well i.e. 7 and 8 years respectively. It is mostly seen that years with abnormal
rainfall are followed by the year which has either scanty or deficit rainfall. During
1990-1999 there is one 1 of abnormal and 2 years of excess rainfall, whereas during
2000-2009 there are 2 years of abnormal rainfall and no year of excess rainfall.

Assessment of Climatic Vulnerability 156
6. BHARATPUR
The average rainfall in Bharatpur district during 1980-2009 was 535.38 mm.
The maximum departure from the average was observed in 1995 when the average
annual rainfall was 384.34 mm, above the normal and in 1987 when it was lowest
below the normal by 252.17 mm.
Generally the region has received normal rainfall i.e. 46.6% of the observed
years. During 1980-1989 there was neither scanty nor abnormal rainfall. Excess
rainfall was observed for 2 years consecutively in 1982-83. Deficit rainfall was
observed for 4 years with 1986-87 in succession.
In 1990-1999 decade 1995-1996 were abnormal rainfall years. 1998 had
excess rainfall whereas 1991 had deficit rainfall. During 200-2009 there were 2
years of excess rainfall and 4 years of both normal and deficit rainfall. There was no
year with abnormal or scanty rainfall during this decade.
7. BHILWARA
The average rainfall during the observed years is 512.65 mm. In the year
2002 the district received least rainfall which was 240.61 mm, below normal and the
maximum rainfall in the 30 years slot between 1980 and 2009 was observed in 2004
which was 261.32 mm, above normal. 50% of the observed years have recorded
normal rainfall years in the district. During 1980-1989 decade there were 3 years of
deficit rainfall years, with 1980-1981 were consecutively deficit followed by 2 years
of excess rainfall in 1982-1983. During 1990-1999 there were 3 years of excess and
deficit rainfall with 4 normal rainfall years. 1998-1999 were consecutive deficit
rainfall years.

Assessment of Climatic Vulnerability 157
In the 2000-2009 decade 6 years recorded normal rainfall and 2 years each of
excess and deficit rainfall.
There has been no abnormal or scanty rainfall year from 1980 to 2009; and
in each decade the number of excess and deficit years is same.
8. BIKANER
The average rainfall of the district during 1980 to 2009 is 233.94 mm.
During this time span of 30 years, 8 years had excess and deficit rainfall and 1983
and 2002 were the only years that had abnormal and scanty rainfall respectively. In
all the 3 decades i.e. 1980-89, 90-99 and 2000-2009, there have been 4 normal years.
During these 4 normal years of deficit rainfall consecutively from 1984-1987 and
year 1982 was of excess and deficit rainfall; and during 2000-2009. 2002 was such
year with scanty rainfall and 2004 with deficit rainfall. 40% of the observed years
had normal rainfall and 26.6% each had excess and deficit rainfall.
9. BUNDI
The average rainfall of Bundi district from 1980 to 2009 is 558.65 mm. The
maximum rainfall was seen in 1994 when it was 286.84 mm above the average and
minimum was 251.44mm below the average in 2002. There has been no year of
abnormal or scanty rainfall in the district during 1980-2009. Mostly the years have
recorded normal rainfall, i.e. 20 out of 30 years. There have been 4 incidents of
deficit rainfall, 2 each during 1980-89 and 2000-2009 respectively. Excess rainfall
was once during 1980-89, thrice during 1990-1999 and twice during 2000-2009.

Assessment of Climatic Vulnerability 158
10. CHITTORGARH
The average annual rainfall during 1980-2009 at Chittorgarh district was
588.81 mm. The maximum average annual rainfall was recorded in 2006 which was
388.15 mm, above the average and in 1987 average annual rainfall was recorded
257.36 mm below the average. There has been no year of scanty rainfall and only
2006 had abnormal rainfall.
During 1980-1989 there were 5 years of normal rainfall and 2 consecutive
excess rainfall years i.e. 1983-1984; whereas 1986 to 1988 were 3 deficit rainfall
years. During 1990-1999 there were 2 excess, 3 deficit and 5 normal rainfall years
where rainfall deficit years were followed by excess rainfall years alternately from
1993 to 1996.
In the 2000-2009 decade 2006 recorded normal rainfall, 2 years each recorded
excess and deficit rainfall.
11. CHURU
The average rainfall of Churu district from 1980 to 2009 was 343.74 mm.
During 1980-1989 there were 4 deficit years with 2 in succession in 1986-1987, 2
excess and 3 normal rainfall years were recorded. 1983 recorded abnormally high
rainfall, which was 242.93 mm above the average and also highest in the observed
years. There are no abnormal or scanty years in the district during 1990 to 2009 and
5 years each of normal rainfall years. During 1990-1999 there are 3 excess and 2
deficit years whereas during 2000-2009 there are 2 excess and 3 deficit years.
Generally the district has recorded normal rainfall i.e. 13 out of 30 years
followed by deficit which is 9 out of 30 years.

Assessment of Climatic Vulnerability 159
12. DAUSA
The average annual rainfall of the district during 1980-2009 is 661.05 mm.
The maximum rainfall was recorded in 1996 which was 995.94 mm above the
average and in 2002 it was 458.60 mm below the average and it was the only year in
which it recorded scanty rainfall in last 30 years. During 1980-1989 there were 5
deficit years with 3n in succession from 1986-1988 – 2 excess and 2 normal years.
In the 1990-1999 decade 6 years were normal and 2 years, 1995 and 1996
were normal and 2 years 1995, 1996 were consecutively abnormal. The year 1992
was excess rainfall and 1999 was deficit rainfall year. In 2000-2009 decade years
2000 and 2001 had deficit rainfall along with 3 other years. 2008 had excess rainfall
and 2002 had scanty rainfall, 3 years had normal rainfall. The district generally
received normal or below normal rainfall for 23 years out of the observed 30 years.
13. DHOLPUR
The average rainfall of the district from 1980 to 2009 is 531.45 mm. the
district had no record of scanty rainfall in past 30 years and just one year with
abnormal rainfall in 2008 when the average annual rainfall was 433.52 mm, above
the district average. Excess rainfall was received for 4 years during 1990-1999
decade only with consecutively in 1995-1996. During 1980-1999 decade only 1991
was deficit year, 4 years were excess rainfall and 5 normal rainfall years were
observed. From 2000 to 2009, 2008 was abnormal rainfall year, 2 years were deficit
and rest 7 years had normal rainfall. In general, mostly normal rainfall years have
been seen in the region, which have increased during 2000-2009 decade.
Assessment of Climatic Vulnerability 160
14. DUNGARPUR
The average rainfall in the district during 1980 to 2009 is 654.58 mm. There
was no scanty rainfall year during the observed time span. There are only 2 years of
abnormal rainfall i.e. 1994 and 2006. 1983-1984 and 1990 are excess rainfall years
and 1985-1986, 1999-2000 are consecutive deficit years along with 3 other years.
The deficit years during 2000-2009 were more than other decades. There were 6
years of normal rainfall in each decade.
15. GANGANAGAR
The district during 1980-2000 received rainfall below average for 15 years
out of 30 and received rainfall above normal for 11 years. Though, it can be seen
that the deficit and scanty rainfall years have decreased during2000-2009 decade as
compared to 1990-1999 decade. The average rainfall for the observed 30 years has
been 164.85 mm. There is not much variation in the number of abnormal rainfall
years and in total there were 5 such years with succession in 1982-83, 2007-2008
and 1996 which recorded the maximum rainfall in the district, which was 524.93
mm above the average. There were 3 excess rainfall years in the 1st and last decade
each and none during the 2nd
decade. 1984-85 were the consecutive excess rainfall
years. Normal rainfall years have increased from 1 year to 3 years in the last decade.
1988-1993 were continuous 6 rainfall deficit years followed by scanty rainfall years
from 1994 to 2001 leaving 1999 and 2000. The state has more frequency of
witnessing deficit or scanty rainfall years and their frequency was more during
1990-1999 decade.

Assessment of Climatic Vulnerability 161
16. HANUMANGARH
The average annual rainfall of the district during the observed 30 years was
296.40 mm and there has been no scanty rainfall year in the district. 1983 was the
only year to register abnormal rainfall and this year the rain was 198.74 mm above
the average. There has been 1 excess rainfall year in the 1st decade, 4 in 2
nd and 2 in
the last decade, with 1994-95, 1997-98 and 2007-08 as consecutive years of this
category. Deficit rainfall years were 3, 1 and 4 during the 3 decades respectively
with 1986-87, 89-90 as consecutive ones. Year 2002 recorded the least rainfall in the
district which was 163.54 mm below the average. Rest 5, 3 and 4 years were normal
rainfall years in the respective 3 decades.
17. JAIPUR
The average annual rainfall of the district for the 30 observed years is 433.24
mm. There have been 11 years of normal and deficit rainfall in the district, 6 of excess
and two of abnormal and no year with scanty rainfall in the observed time span. The
maximum and minimum rainfall were recorded in the same decade i.e. 1983 had
rainfall 380.11 mm above the average whereas 1987 had rainfall 234.07 mm below
the average. 1981 and 1983 are the only abnormal years in the entire 30 year span and
1982 and 1985 were excess rainfall years. Deficit rainfall was observed for 4 years
with 1986-87 in continuation. Rest 2 were normal rainfall years.
The 1990-99 decade had no year with abnormal or excess rainfall. Most
years received normal rainfall and there were 4 deficit rainfall years with 1993-1994
in continuation.

Assessment of Climatic Vulnerability 162
In the last decade there are 4 years with excess rainfall each. 2001-2002 were
consecutive deficit rainfall years. It can be seen that no incidence of abnormal
rainfall occurred in the last 2 decades and years with excess rainfall have increased.
The inter-decadal fluctuations were more during 1990-1999.
18. JAISALMER
The average annual rainfall in the district during 1980-2009 is 171.11 mm
above the average. The frequency of excess rainfall was 1 during the 1st decade, in
the second it rose to 6 with 1994-1996 and 1998-99 being successive rainfall years
and in the 3rd
decade 2003 and 2007-08 experienced excess rainfall. Normal rainfall
has fluctuated from 5 to 3 years each in the 2nd
and 3rd
decades. There were 3 deficit
rainfall years during 1980’s and all in sequence since 1984 to 1986. During 1990’s
only 1991 was deficit rainfall year. 2004 and 2009 were the deficit rainfall years of
the last decade. 1987 and 2002 are the only occurrences of scanty rainfall in the
district. Year 1987 registered least rainfall which was 129.90 mm less than the
average. It can be seen that the frequency of rainfall near the normal or above it is
rising in the district.
19. JALORE
The average annual rainfall of the district from 1980 to 2009 was 330.11 mm.
The lowest was observed in the 1st decade in 1987 which was 273.16 mm below the
average and the maximum rainfall was received in 2006 which was 412.34 mm
above the average. The frequency of abnormal rainfall years has increased from 1 to
2 each in the last 2 decades. 1994 was the only year with excess rainfall in the 30
observed years. The frequency of normal rainfall years has increased to 6 during 1st

Assessment of Climatic Vulnerability 163
and 2nd
decade. The frequency of deficit and scanty rainfall has decreased from 4 to
2 years and 1 year to no occurrence in the last decade respectively. In the last 30
years there have been 12 years of rainfall below average and 11 years with normal
and 7 years of above normal rainfall.
20. JHALAWAR
The average annual rainfall of the district during the observed years was
762.18 mm. mostly the frequency of years having normal rainfall has been very high
and is 20 out of 30 years. There is no occurrence of scanty rainfall. 2006 had the only
occurrence of abnormal rainfall which was 553.66 mm above the average. There
were 2 years of excess rainfall during 1st and 2
nd decade and none in the last decade.
Deficit rainfall varied from 2 years during 19889 to 1 during 1990-99 to 2 again
during 2000-09.
21. JHUNJHUNUN
The average annual rainfall of the district is 420.62 mm. There has been only
one year of abnormal rainfall i.e. 1996 when it rained 292.75 mm above the average.
In 2002 the only scanty rainfall has occurred when it rained 272.49 mm below
average. The excess rainfall years have fluctuated from 2 to 3 and 3 to 2 again in the
3 decades respectively. Normal rainfall varied from 3 to 5 to 4 in the 3 decades. A
significant variation is seen i9n the deficit years which fluctuated from 5 during 80’s
to just 1 in 90’s to 3 years in 2000-2009 decade. Generally the normal rainfall years
have been higher in the district i.e. 40% years.

Assessment of Climatic Vulnerability 164
22. JODHPUR
The average annual rainfall of the district was 237.62 mm during 1980-2009.
There is only one year with abnormal rainfall i.e. 1983 when it rained 207.43 mm
above the average. The scanty rainfall year was also one only in 2002 when it rained
151.08 mm below the average. The years of excess rainfall have increased gradually
during the decades whereas deficit rainfall years have decreased. Normal rainfall
years have been almost uniform and also have been maximum in the observed time
spent i.e. 13 years out of 30 years followed by 7 deficit rainfall years and 6 excess
rainfall years.
23. KARAULI
The average annual rainfall of Karauli district was 535.95 during 1980 and
2009. Year 1983 has been the only abnormal rainfall year with rainfall of 333.44
mm above normal and in the same decade in 1989 the rainfall was a minimum of 30
years with 305.08 mm below the average. There is no year with scanty rainfall. The
frequency of excess rainfall years has increased whereas frequency of deficit years
has decreased. Most of the years in the district during the observed period have been
of normal rainfall.
24. KOTA
There has been only 1 abnormal rainfall year i.e. 2001 during the observed
time span with 370.16 mm rainfall, above the average annual rainfall of 523.57 mm.
The frequency of excess rainfall days widely fluctuated from 5 to 1 to 6 in the 3
decades. Normal rainfall years decreased by 3 to 2 to 1 in the respective three
decades. Deficit rainfall years were 2 in the 1st and last decade whereas they rose to

Assessment of Climatic Vulnerability 165
6 in the 2nd
decade. There is only 1 scanty rainfall year i.e. 1998, when it rained
399.56 mm below the average.
25. NAGAUR
The average annual rainfall during 1980 and 2009 has been 322.00 mm in
the district. During 1980 and 1989 decade there was 1 abnormal and 1 excess
rainfall year. There are 3 normal rainfall years and 5 deficit years with 1984 to 1987
being consecutive deficit years. Year 1987 recorded the least rainfall which was
189.48 mm below the average. There are no scanty rainfall years in the district.
In the 1990 to 1999 decade, 1996 was the abnormal rainfall year with 290.44
mm above normal rainfall. There were 3 years each of excess, normal and deficit
rainfall. Last decade had 2 excess and deficit rainfall years and 6 normal rainfall
years. It can be seen that only normal rainfall years have increased, rest decreased.
26. PALI
The average annual rainfall of the district during 1980 and 2009 was 270.43
mm. the maximum and minimum rainfall of the observed years has been seen during
1980 and 1989 decade. 1981 recorded maximum rainfall which was 505.93 mm above
average and 1987 recorded 246.75 mm below average being the lowest rainfall. It can
be observed that the frequency of abnormal years above increased from 1st to last
decade, so have excess rainfall years. Normal rainfall years have fluctuated from 2 to1
to 2 in the 3 decades. Scanty rainfall years were three in 1980’s which increased to 5
years during 1990’s and there was none during 2000 and 2009.
In the last 30 years there have been 8 scanty rainfall followed by 6 deficit
and abnormal years and 5 excess and normal years.
Assessment of Climatic Vulnerability 166
27. PRATAPGARH
In 2006 the district received its only abnormal rainfall which was 761.95
mm. There was 1 record of excess rainfall during 1980-89 in 1984 and twice during
1990-99 and again once in 2004. The district in 57.69% of the years received normal
rainfall. Deficit rainfall was during 23.07% times in the state with consecutive
occurrence from 1998-2000. The year 1998 received minimum rainfall out of the 30
observed years, which was 362.04 mm less than the average.
28. RAJSAMAND
With an average annual rainfall of 510.38 mm, the district has no record of
abnormal or scanty rainfall. The maximum rainfall was observed in 2009 with
266.06 mm above average. The no. of excess years has increased in the past 30 years
from 2 during 1980-1989 to 3 in 1990-1999 and 2000-2009. 2005 and 2006 were
consecutive excess rainfall years. Deficit rainfall years have increased from 4 to 2 in
1980-89 to 19901999 and 2000-2009. 1984-85 and 1999 and 2000 are consecutive
deficit years. Rests have normal rainfall out of 30. The frequency of normal years
has increased from 2 to 4 to 5 in the 3 decades respectively. Generally the district
has normal rainfall succeeded by 8 excess and 8 deficit years.
29. SAWAI MADHOPUR
The average annual rainfall of the district is 525.36 mm. The maximum
rainfall was in 1983 which was 565.67 mm, above average and other than this
another abnormal rainfall year was 1995. In all there are 7 years of excess rainfall in
the district, which came down from 3 in the first decade to 2 each in the next two
decades. The number of deficit years has fluctuated from 3 to 4 to 2 during the 3

Assessment of Climatic Vulnerability 167
decades respectively. 1986-1987 and 1997-1998 were successive deficit rainfall
years. Year 2002 only had scanty rainfall which was 329.55 mm below average.
Rest all years had normal rainfall. In all, 10 years had rainfall below average and 9
years had rainfall above average.
30. SIKAR
The district had no year with scanty rainfall. Abnormal rainfall was recorded
in 1983 and 1996. 1983 had maximum rainfall, which was266.45 mm above the
average of 400.60 mm excess rainfall years fluctuated from 2 to 3 to 2 in the
respective 3 decades from 1980-89, 1990-1999 and 2000-2009.
Deficit years 8 in total which was 3 in 1st decade fell to just 1 in 2
nd decade
and then again rose to 4 during the last decade. Number of normal years fluctuated
from 2 to 3 to 2 in the respective 3 decades. Like many other districts Sikar too had
maximum no. of normal rainfall followed by 8 deficit and 7 excess rainfall years.
31. SIROHI
The average annual rainfall of the district during the observed period is
438.57 mm. During the 1980-1989 decade there were 3 continuous years of excess
rainfall – 1980, 1981, 1982 along with 1985; 2 abnormal rainfall years 1983 and
1987; 2 consecutive scanty rainfall years – 1986 & 1987. 1987 recorded the lowest
rainfall out of 30 years; it was 381.97 mm below normal. These scanty years were
followed by 2 consecutive deficit rainfall years- 1988 and 1989. This decade had no
year with normal rainfall.
In the second decade i.e. during 1990-1999, there is no year with abnormal
rainfall, 1992 had excess rainfall and 1990 had normal rainfall. 1993-1994 were 2

Assessment of Climatic Vulnerability 168
consecutive deficit years along with 1997. 1991, 1995-96 and 1998-99 were years
with scanty rainfall. In the last decade from 200 to 2009, there was no year of scanty
rainfall. 2000, 2004 and 2008 were abnormal rainfall years where in 2006 highest
rainfall of 30 years was received, was 733.50 mm above average. 2002 & 2009
received deficit rainfall and rest 3 years were of excess rainfall. It can be seen that
out of 30, maximum 8 years were of excess rainfall along with 4 years of abnormal
rainfall. There were 7 years of each deficit and scanty rainfall and just 4 years of
normal rains.
32. TONK
Here, there has been no year of scanty rainfall in 30 years from 1980 to 2009
and just 1 year i.e. 1983 of abnormal rainfall. This year had the maximum rainfall
out of the 30 years when it rained 332.20 mm, above the average of 415.39mm. Year
2002 had the minimum rainfall when it rained 216.70 mm, below average. In the
first decade 1986 and 1987 were deficit rainfall years. In the second 1993 and 1996-
97 were deficit and during the last decade 2002 and 2009 were deficit years. Normal
rainfall varied from 6 to 4 to 7 in the respective 3 decades. During 1st and 3
rd decade
there was 1 rainfall excess year but during 1990-1999 the no. Of excess rainfall days
was 3. Generally more years were of normal rainfall followed by deficit and excess
rainfall years.
33. UDAIPUR
The average annual rainfall of Udaipur district from 1980 to 2009 is 441.48
mm. During 1980-1989 decade only 1982 had abnormal rainfall; 4 years had excess

Assessment of Climatic Vulnerability 169
rainfall in 1980-1981 and 1984-1985, 1986-1987 were rainfall deficiency years. No
year had scanty rainfall in this decade.
During 1990-1999, 1995 had scanty rainfall, which was 304.99 mm, less than
the average and was least of 30 years. Two years were normal rainfall years. 1991,
1993-1994, 1996-1997, 1999 were rainfall deficit years.
In the last decade i.e. 2000-2009, had 5 excess rainfall years in 2004-2005
and 2007-2009 and 3 normal rainfall years. 2006 had the maximum rainfall out of
the 30 years which was 678.30 mm, above the average. 2000 was a deficit year. The
frequency of excess and deficit rainfall years during the 30 years is same i.e. 9 years
followed by 7 normal years.
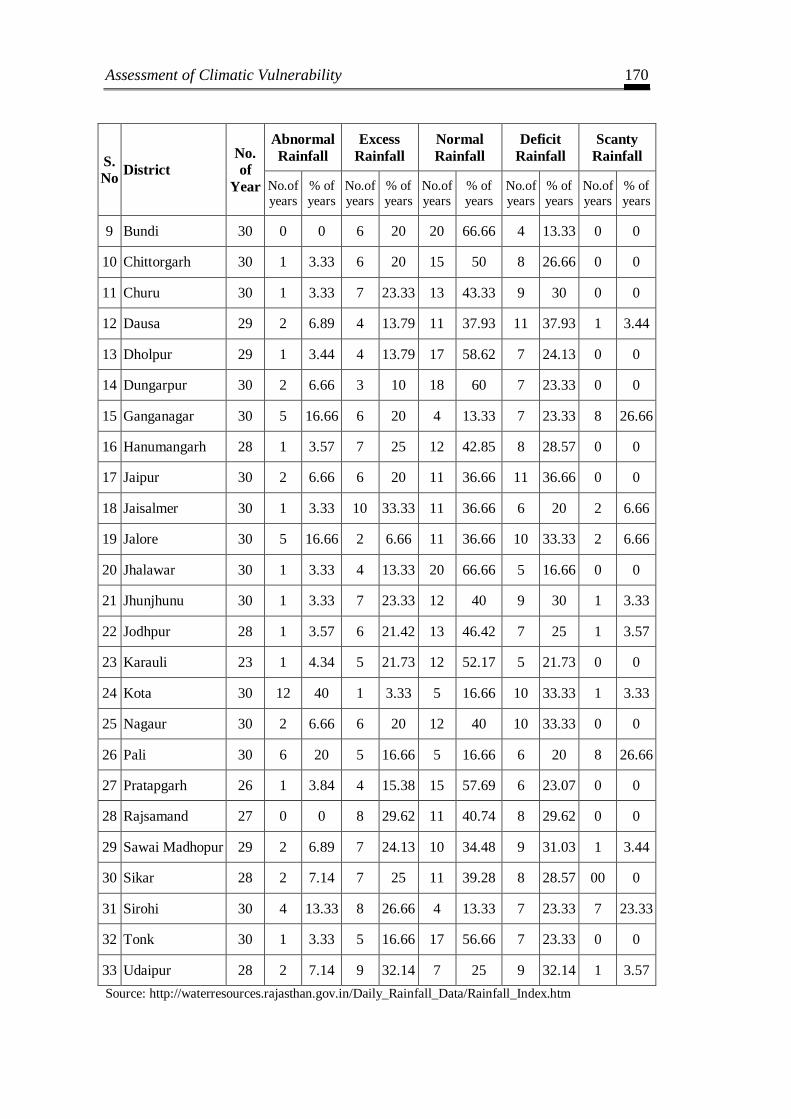
On the basis of the analysis done above the rainfall intensities in Rajasthan
from 1980 to 2009 can be summed up in the Table – 8.
Table – 8: District-wise rainfall intensities in Rajasthan (1980 to 2009)
S.
No District
No.
of
Year
Abnormal
Rainfall
Excess
Rainfall
Normal
Rainfall
Deficit
Rainfall
Scanty
Rainfall
No.of
years
% of
years
No.of
years
% of
years
No.of
years
% of
years
No.of
years
% of
years
No.of
years
% of
years
1 Ajmer 30 3 10 4 13.33 16 53.33 5 16.66 2 6.66
2 Alwar 30 4 13.33 3 10 14 46.66 7 23.33 2 6.66
3 Banswara 30 2 6.66 4 13.33 14 46.66 10 33.33 0 0
4 Baran 30 0 0 4 13.33 23 76.666 2 6.66 1 3.33
5 Barmer 30 4 13.33 3 10 10 33.33 9 30 4 13.33
6 Bharatpur 30 2 6.66 5 16.66 14 46.66 9 30 0 0
7 Bhilwara 30 0 0 7 23.33 15 50 8 26.66 0 0
8 Bikaner 30 1 3.33 8 26.66 12 40 8 26.66 1 3.33
Assessment of Climatic Vulnerability 170
S.
No District
No.
of
Year
Abnormal
Rainfall
Excess
Rainfall
Normal
Rainfall
Deficit
Rainfall
Scanty
Rainfall
No.of
years
% of
years
No.of
years
% of
years
No.of
years
% of
years
No.of
years
% of
years
No.of
years
% of
years
9 Bundi 30 0 0 6 20 20 66.66 4 13.33 0 0
10 Chittorgarh 30 1 3.33 6 20 15 50 8 26.66 0 0
11 Churu 30 1 3.33 7 23.33 13 43.33 9 30 0 0
12 Dausa 29 2 6.89 4 13.79 11 37.93 11 37.93 1 3.44
13 Dholpur 29 1 3.44 4 13.79 17 58.62 7 24.13 0 0
14 Dungarpur 30 2 6.66 3 10 18 60 7 23.33 0 0
15 Ganganagar 30 5 16.66 6 20 4 13.33 7 23.33 8 26.66
16 Hanumangarh 28 1 3.57 7 25 12 42.85 8 28.57 0 0
17 Jaipur 30 2 6.66 6 20 11 36.66 11 36.66 0 0
18 Jaisalmer 30 1 3.33 10 33.33 11 36.66 6 20 2 6.66
19 Jalore 30 5 16.66 2 6.66 11 36.66 10 33.33 2 6.66
20 Jhalawar 30 1 3.33 4 13.33 20 66.66 5 16.66 0 0
21 Jhunjhunu 30 1 3.33 7 23.33 12 40 9 30 1 3.33
22 Jodhpur 28 1 3.57 6 21.42 13 46.42 7 25 1 3.57
23 Karauli 23 1 4.34 5 21.73 12 52.17 5 21.73 0 0
24 Kota 30 12 40 1 3.33 5 16.66 10 33.33 1 3.33
25 Nagaur 30 2 6.66 6 20 12 40 10 33.33 0 0
26 Pali 30 6 20 5 16.66 5 16.66 6 20 8 26.66
27 Pratapgarh 26 1 3.84 4 15.38 15 57.69 6 23.07 0 0
28 Rajsamand 27 0 0 8 29.62 11 40.74 8 29.62 0 0
29 Sawai Madhopur 29 2 6.89 7 24.13 10 34.48 9 31.03 1 3.44
30 Sikar 28 2 7.14 7 25 11 39.28 8 28.57 00 0
31 Sirohi 30 4 13.33 8 26.66 4 13.33 7 23.33 7 23.33
32 Tonk 30 1 3.33 5 16.66 17 56.66 7 23.33 0 0
33 Udaipur 28 2 7.14 9 32.14 7 25 9 32.14 1 3.57
Source: http://waterresources.rajasthan.gov.in/Daily_Rainfall_Data/Rainfall_Index.htm
Assessment of Climatic Vulnerability 171
4.4 WATER SURPLUS AND DEFICIENCY ANALYSIS
Rajasthan which is the largest state in India has only 1.16 % of the country’s
water resources. These too are highly unevenly distributed with most of the available
water resources been confined to south and south-eastern part of the State. River
Chambal is the only perennial river of the state rest all the rivers are rain-fed. The
west-central part of western Rajasthan is devoid of any drainage network. This
scenario makes Rajasthan the driest state with nearly 70 percent (2/3rd) of the area
classified as arid and semi arid region. such a scenario any change in climate
variables can affect the hydrological cycle by directly increasing evaporation of
available surface water as a result influencing precipitation amount and intensity
which indirectly impact the storage of water in surface and groundwater reserves.
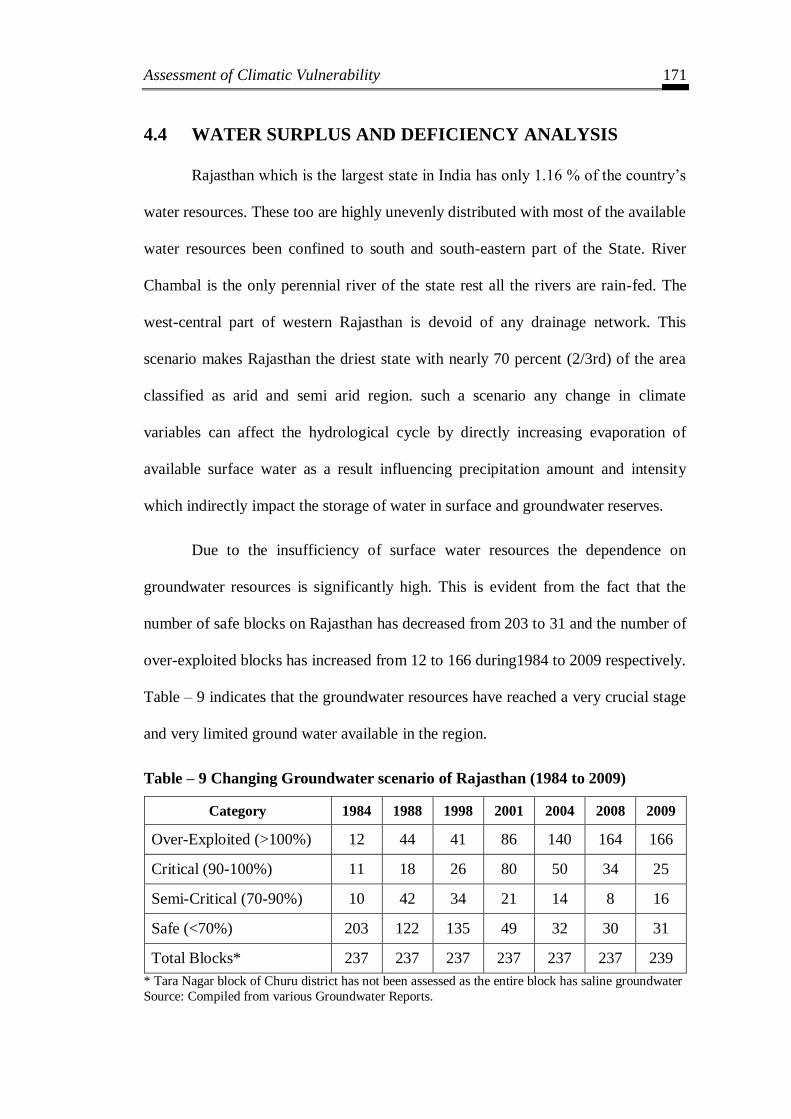
Due to the insufficiency of surface water resources the dependence on
groundwater resources is significantly high. This is evident from the fact that the
number of safe blocks on Rajasthan has decreased from 203 to 31 and the number of
over-exploited blocks has increased from 12 to 166 during1984 to 2009 respectively.
Table – 9 indicates that the groundwater resources have reached a very crucial stage
and very limited ground water available in the region.
Table – 9 Changing Groundwater scenario of Rajasthan (1984 to 2009)
Category 1984 1988 1998 2001 2004 2008 2009
Over-Exploited (>100%) 12 44 41 86 140 164 166
Critical (90-100%) 11 18 26 80 50 34 25
Semi-Critical (70-90%) 10 42 34 21 14 8 16
Safe (<70%) 203 122 135 49 32 30 31
Total Blocks* 237 237 237 237 237 237 239
* Tara Nagar block of Churu district has not been assessed as the entire block has saline groundwater
Source: Compiled from various Groundwater Reports.
Assessment of Climatic Vulnerability 172
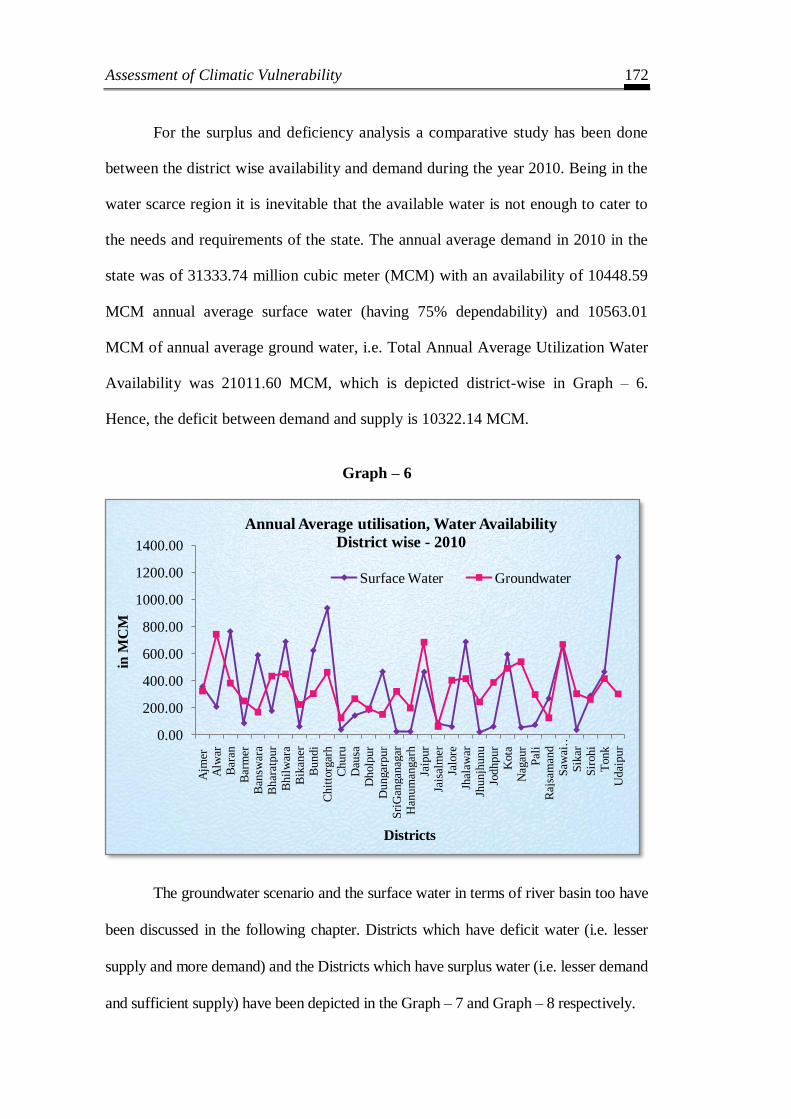
For the surplus and deficiency analysis a comparative study has been done
between the district wise availability and demand during the year 2010. Being in the
water scarce region it is inevitable that the available water is not enough to cater to
the needs and requirements of the state. The annual average demand in 2010 in the
state was of 31333.74 million cubic meter (MCM) with an availability of 10448.59
MCM annual average surface water (having 75% dependability) and 10563.01
MCM of annual average ground water, i.e. Total Annual Average Utilization Water
Availability was 21011.60 MCM, which is depicted district-wise in Graph – 6.
Hence, the deficit between demand and supply is 10322.14 MCM.
Graph – 6
The groundwater scenario and the surface water in terms of river basin too have
been discussed in the following chapter. Districts which have deficit water (i.e. lesser
supply and more demand) and the Districts which have surplus water (i.e. lesser demand
and sufficient supply) have been depicted in the Graph – 7 and Graph – 8 respectively.
0.00
200.00
400.00
600.00
800.00
1000.00
1200.00
1400.00
Ajm
er
Alw
ar
Bar
an
Bar
mer
Ban
swar
a
Bhar
atpur
Bh
ilw
ara
Bik
aner
Bundi
Chit
torg
arh
Churu
Dau
sa
Dh
olp
ur
Dungar
pur
Sri
Gan
gan
agar
Han
um
angar
h
Jaip
ur
Jais
alm
er
Jalo
re
Jhal
awar
Jhu
njh
unu
Jodhpur
Kota
Nag
aur
Pal
i
Raj
sam
and
Saw
ai …
Sik
ar
Sir
ohi
Tonk
Udai
pur
in M
CM
Districts
Annual Average utilisation, Water Availability
District wise - 2010
Surface Water Groundwater

Assessment of Climatic Vulnerability 173
Graph – 7
Graph – 8
-3500.00
-3000.00
-2500.00
-2000.00
-1500.00
-1000.00
-500.00
0.00
in M
CM
Districts
Districts having deficit water
(lesser supply and more demand)
0.00
100.00
200.00
300.00
400.00
500.00
600.00
700.00
in M
CM
Districts
Districts having surplus water
(lesser demand and sufficient supply)

Assessment of Climatic Vulnerability 174
The water Surplus and deficiency analysis depending on its demand and
availability from the surface and groundwater resources in each agro-climatic zone
has been as follows:
1. Arid North Western Sandy Plain
The Arid North Western Sandy Plain is a water deficit region as it is not able
to meet the demand posed by the region. The deficit is of 1783.29 MCM. Out of the
14 major catchment regions in the region has 17.6% basin of river Luni and 13.0%
of the other small regional streams in this zone. There are 8 groundwater blocks in
this zone. Here safe blocks have increased from 0 in 2001 to 1 in 2004 and 2009.
The semi-critical blocks decreased to 0 in 2004 and 2009. Whereas the number of
semi-critical and over exploited blocks were remained 2 and 5 respectively from the
years 2001 to 2009.
2. Irrigated North Western Plain
The Irrigated North Western Plain is a water deficit region with more
dependence on the scarce groundwater resources of the region. Its total annual
average water availability is 564.4 MCM which is met from groundwater (518.6
MCM) and surface water (45.7 MCM.) resources. The annual average demand
creates a deficiency or gap of 1098.3 MCM. Only some small streams contribute
25.5% of their basin in this region.
On the groundwater scenario this region is divided into 18 blocks and most
of the region 10 to 11 blocks are constantly safe and 5 blocks are over exploited
since 2001 to 2009. This distribution shows a good status of Groundwater in this
region.

Assessment of Climatic Vulnerability 175
3. Hyper Arid Partial Irrigated Zone
The Hyper Arid Partial Irrigated Zone has an annual average deficit of
4865.49 MCM, as only 428.64 MCM water is available annually on an average. Out
of this 145.66 MCM is available from surface resources and 282.97 MCM is
available from groundwater resources of the region. Here the region has 8 blocks
which were critical in 2009. There are a considerable number of safe blocks in the
region numbering 4 and 3 during 2001 and 2009 respectively. The region is drained
by small local streams which have their 39.8% basin in this zone.
4. Transitional Plain of Inland Drainage
Transitional Plain of Inland Drainage is a water deficient agro-climatic zone
as it is not able to meet its average annual demand of water. Here, the annual average
availability of water is 145.68 MCM from surface resources and 1207.97 MCM
from groundwater resources, total 1353.65 MCM which is deficit by 2035.01 MCM.
River Shekhawati, Sabi and Luni have 68.8%, 11.2%, and 4.9% basin in this region
respectively. The local small streams also have 23% of their basin in this region.
There are 33 groundwater blocks out of which only 3 blocks were in the safe category
during the years 2001 to 2009. On the other hand the region has 19, 22 and 26 blocks
in the over-exploited category during the years 2001, 2004 and 2009 respectively.
5. Alluvial Plain of Luni Basin
The Alluvial Plain of Luni Basin is a water deficient agro-climatic zone as it
is not able to meet its average annual demand. Here, the annual average availability
of water is 477.40 MCM from surface resources and 1345.52 MCM from groundwater
resources, which is deficit by 1718.62 MCM. The surface water resources include
River Sukli, West Banas, Luni and Sabarmati which have their 100%, 99.9%, 70.6%
and 2.1% basins in this region respectively. The entire basin of the Nallas of Jalore
Assessment of Climatic Vulnerability 176
is present in this region along with the small streams having their 11.7% basin. In
the groundwater scenario out of the 31 blocks there are only 2 safe blocks since
2001 to 2009. In 2001 the number of critical blocks was 13 but by 2004 their
number decreased to 10. The blocks under the over exploited category also increased
greatly from 15 to 19 blocks during 2001 to 2004 and 23 blocks in 2009.
6. Semi Arid Eastern Plain
The Semi Arid Eastern Plain agro-climatic zone is a water surplus region as
it is able to meet its annual average water demand. Total annual average availability
of water is 3104.29 MCM out of which major dependence is on ground water
resources i.e. 1682.82 MCM. The agro-climatic zone is divided into 32 groundwater
blocks. There were 6 safe and 3 semi-critical groundwater blocks in 2001, both of
which decreased to zero 2004 onwards. The number of over exploited blocks
increased from 16 to 28 from 2001 to 2009. The surface water scenario of this
region includes the basin of a few rivers. The region has 26.5% basin of River
Shekhawati, 41% basin of River Banganga; 2.9% basin of River Gambhir; 26.9%
Sabi; 42.6% basin of Banas, 17% of Chambal and 5.4% Luni basin.
7. Flood Prone Eastern Plain
The Flood Prone Eastern Plain has been blessed with both surface (890.37
MCM) and ground water (1699.19 MCM) resources. River Ruparail has its entire
basin in this region. River Parbati has its 82.7%, River Sabi has its 61.9%, River
Banganga has its 55.9%, River Gambhir has its 34.2%, River Shekhawati has its
4.7% and River Chambal has its 2.8% basin in this region. In the context of ground
water resources the region has been divided into 32 blocks. The number of safe
blocks has decreased from 9 to 0 from 2001 to 2009. During 2009 the semi-critical

Assessment of Climatic Vulnerability 177
blocks decreased to just 1 and critical blocks were 5 in number. The situation of over
exploited blocks is also alarming as they rose from 13 to 26 during 2001 to 2009.
8. Sub Humid Southern Plain and Aravallis
The Sub-Humid Southern Plain and Aravalli Zone is a water surplus region.
It has a surplus of 492.20 MCM. There are a significant percentage of river basins in
the region which include – River Sabarmati’s 82.3% basin, River Mahi’s 51.7%
basin, River Banas’s 46.7% basin, River Chambal’s 13.1% basin, River Luni’s 1.5%
basin and West Banas’s 0.1% basin. The ground water of the region has been
exploited inappropriately. Out of the 43 ground blocks of this region there was just 1
safe zone and 2 semi-critical zones during 2009. The number of critical blocks
decreased from 25 to 5 from 2001 to 2009. Whereas the over exploited blocks
increased from 17 to 37 during the observed years.
9. Humid Southern Plain
This Humid Southern Plain Region is also water surplus, with a total availability
of 1368.63 MCM. The water resources of the region are optimally utilized. River
Mahi and Sabarmati have their 48.3% and 15.6% basin respectively in this region and
there are 13 groundwater blocks in the district. In 2001 there were six blocks which
fell in the category of safe blocks but by 2009 the number was raised to 8. The semi-
critical blocks were 2 during 2001 which was raised to 8 in 2004 but again reduced to
5 in 2009. There are no critical or over exploited blocks in the district in 2009.
10. Humid South Eastern Plain
The Humid South Eastern Plain is water deficit region. It has an availability
of 4910.03 MCM water from surface and groundwater resources, which is deficit by
90.48 MCM. Out of the 27 ground water blocks of the region the number of safe

Assessment of Climatic Vulnerability 178
blocks decreased from 9 to 3 during 2001 to 2009. The semi-critical and critical
blocks decreased from 7 and 10 respectively to 4 during 2001 to 2009. But
unfortunately the number of over exploited blocks increased from 1 in 2001 to 16 in
2009. This region has 82.4% basin of River Chambal, 62.9% basin of River
Gambhir, 17.3% basin of River Parbati, 10.7% basin of River Banas and 3.1% basin
of River Banganga to cater to the needs of the region.
Many agro climatic regions of the state come under the various river basins
but as these rivers are mostly seasonal and due to other constraints their benefit
cannot be taken annually. Hence, this too aggravates the situation of water deficit.
The paucity of surface water increases dependence on groundwater in the state. The
Total Annual Average Utilization Water Availability is depicted Agro-Climatic
Zone wise in Graph – 9.
Graph – 9
0
500
1000
1500
2000
2500
3000
3500
Un
it i
n M
CM
Total Annual Average Water Availability in Rajasthan
Agro-Climatic Zone Wise- 2010
Surface Water Ground Water

Assessment of Climatic Vulnerability 179
4.5 TEMPERATURE ANALYSIS
The state witnesses great peculiarities in temperature. Winters are very
severe and temperature falls below freezing point at places like Ganganagar;
summers are intense and quite severe in region like the western Rajasthan. High
resolution regional model projections for 2071-2100 have predicted an increase in
annual mean surface temperature for all parts of India with an increase of 2-40C for
the state of Rajasthan (Government of Rajasthan, 2010). May is generally the hottest
month and generally January records the lowest daily maximum and minimum
temperature. Changes in the climate variables like temperature increase can affect
the hydrologic cycle and agriculture and allied sectors which exhibit high sensitivity
to climate stresses.
Graph – 10
The Graph – 10 depicts the temperature variation in the state in the observed
30 years. This graph indicates an overall increase in the temperature, as the mean
0.0
5.0
10.0
15.0
20.0
25.0
30.0
1975 1985 1995 2005 2015
Tem
per
atu
re
in 0
C
Years
Trend of Annual Mean Temperature in Rajasthan (1980-2009)
Average Linear (Average)

Assessment of Climatic Vulnerability 180
decadal temperature witnessed a rise from 23.80C during 1980 and 1989 to 25.1
0C
during 1990 and 1999 and maintained itself during 2000 and 2009 as well.
Here, according the data the average temperature is 25.20C and the highest
mean average annual temperature was recorded during 2002, which was 2.20C above
the average and the minimum temperature was 2.50C below the average in 1986.
The highest maximum temperature was 50.00C, which was observed during
1992, 1994, 1995 and 1998. The maximum temperatures in Rajasthan indicate an
increase, these varied between 45 0C to 50
0C. It can be seen that the maximum
temperatures rose during the 1990’s more that than the other two decades, but a
general trend towards the increase of maximum temperature can also be seen. The
Graph – 11 depicts the highest maximum temperatures over the 30 observed years in
Rajasthan.
Graph – 11
42.0
43.0
44.0
45.0
46.0
47.0
48.0
49.0
50.0
51.0
1980
1981
1982
1983
1984
1985
1986
1987
1988
1989
1990
1991
1992
1993
1994
1995
1996
1998
1999
2000
2001
2002
2003
2004
2005
2006
2007
2008
2009
Tem
per
atu
re
in 0
C
Years
Yearly Highest Maximum Temperatures of Rajasthan
(1980-2009)
Highest Maximum Temperature Linear (Highest Maximum Temperature)

Assessment of Climatic Vulnerability 181
The Graph – 12 depicts the highest minimum temperatures over the 30
observed years in Rajasthan. The lowest minimum temperature was -4.00C, which
was observed during 1987. It can be seen that the minimum temperatures too are
gradually increasing, as is also indicated by the upward moving trend line.
Graph – 12
The chapter tries to look at the mean annual temperature observations to
trace if there is any trend of increase or decrease of mean annual temperature in the
state. The temperature observatories in the state are at the following centers:- Ajmer;
Alwar; Anoopgarh; Bansawara; Barmer; Bharatpur; Bhilwara; Bikaner; Bundi;
Chittorgarh; Churu; Dabok A.P.; Dholpur; Dungarpur; Erinpura Road; Ganganagar;
Jaipur; Jaisalmer; Jalore; Jawai Bandh;Jhalawar; Jodhpur A.P.; Jodhpur city; Kota;
Mount Abu; Nagaur; Phalodi; Pilani; Rawat Bhata; Sawai Madhopur; Sikar; Tonk;
and Udaipur. It can be seen that there is a rise of temperature at almost all these
temperature centre/stations in the state. The increasing decadal mean temperatures
have been depicted through Graph – 13.
-5.0
-4.0
-3.0
-2.0
-1.0
0.0
1.0
2.0
3.0
4.0
19
80
19
81
19
82
19
83
1984
19
85
19
86
1987
19
88
19
89
1990
19
91
19
92
19
93
19
94
19
95
19
96
19
98
19
99
20
00
20
01
2002
20
03
20
04
2005
20
06
20
07
2008
20
09
Tem
per
atu
re
0C
Years
Yearly Lowest Minimum Temperatures of Rajasthan
(1980-2009)
Lowest Minimum Temperature Linear (Lowest Minimum Temperature)
Assessment of Climatic Vulnerability 182
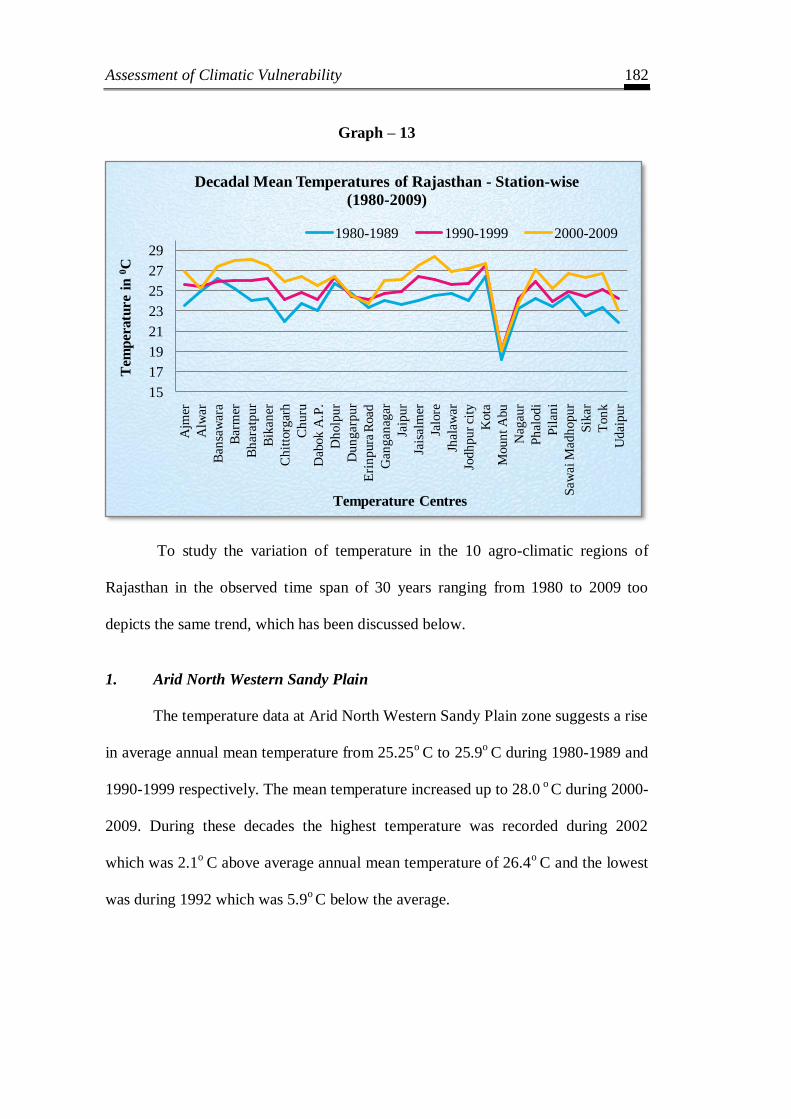
Graph – 13
To study the variation of temperature in the 10 agro-climatic regions of
Rajasthan in the observed time span of 30 years ranging from 1980 to 2009 too
depicts the same trend, which has been discussed below.
1. Arid North Western Sandy Plain
The temperature data at Arid North Western Sandy Plain zone suggests a rise
in average annual mean temperature from 25.25o
C to 25.9o
C during 1980-1989 and
1990-1999 respectively. The mean temperature increased up to 28.0 o
C during 2000-
2009. During these decades the highest temperature was recorded during 2002
which was 2.1o
C above average annual mean temperature of 26.4o
C and the lowest
was during 1992 which was 5.9o C below the average.
15
17
19
21
23
25
27
29
Ajm
er
Alw
ar
Ban
saw
ara
Bar
mer
Bh
arat
pur
Bik
aner
Ch
itto
rgar
h
Ch
uru
Dab
ok
A.P
.
Dh
olp
ur
Du
ngar
pur
Eri
np
ura
Road
Gan
gan
agar
Jaip
ur
Jais
alm
er
Jalo
re
Jhal
awar
Jod
hp
ur
city
Kota
Mou
nt A
bu
Nag
aur
Ph
alodi
Pil
ani
Saw
ai M
adh
opu
r
Sik
ar
Ton
k
Udai
pur
Tem
per
atu
re
in 0
C
Temperature Centres
Decadal Mean Temperatures of Rajasthan - Station-wise
(1980-2009)
1980-1989 1990-1999 2000-2009

Assessment of Climatic Vulnerability 183
2. Irrigated North Western Plain
The mean annual temperature of this zone during 1980-2009 was 25.1o
C.
During this time span the highest temperature was recorded in 2006 where the
temperature was 1.3oC above the average and minimum was recorded in 1982 when it
was 2.6o
C below the average. The comparison of decadal averages suggests that this
centre has an increase in the temperature as the temperature rose from 24.2o
C during
1980-1989 to 25.1o C during 1990-1999 to 26.0
o C during 2000-2009.
3. Hyper Arid Partial Irrigated Zone
The annual average mean temperature of the Hyper Arid Partial Irrigated
Zone in the studied 30 years i.e. 1980-2009 has been 25.9oC. The minimum
temperature of these 30 years was recorded in 1986 when it was 2.4oC below the
average and the highest was recorded in 2004 which was 2.0oC above the average.
During 1980-1989 the average mean annual temperature was 24.1oC with
lowest in
1986 and highest in 1989. In the second decade the annual average mean
temperature rose to 26.2oC. The annual average mean temperature further rose to
27.4oC during 2000-2009. According to the decade annual average mean temperature
comparisons it can be seen that there has been a rise of temperature in the last 30
years in the centre, from 24.1oC to 26.2
oC to 27.4
oC during the 3 decades.
4. Transitional Plain of Inland Drainage
In the Transitional Plain of Inland Drainage Zone the average mean annual
temperature during 1980-2009 has been 24.5o
C. The lowest temperature was
recorded during the first decade in 1983 when it was 2.6o
C below the average and
the maximum temperature of the 3 decades was recorded in the last decade i.e. 2004
Assessment of Climatic Vulnerability 184
when it was 2.4o C above the average. The decadal mean temperature shows a rise in
temperature at this centre too. Here, the mean annual temperature during 1980-1989
is 23.2o C which rose to 24.4
o C during 1990-1999 to 25.9
o C during 2000-2009.
5. Alluvial Plain of Luni Basin
The temperature data at Alluvial Plain of Luni Basin suggests a rise in
average annual mean temperature from 23.1o
C to 24.4o
C during 1980-1989 and
1990-1999 respectively. The mean temperature increased up to 26.0 o
C during 2000-
2009. During these decades the highest temperature was recorded during 2002
which was 3.3o
C above average annual mean temperature of 24.5o
C and the lowest
was during 1986 which was 2.3o C below the average.
6. Semi Arid Eastern Plain
The average annual mean temperature in this zone during 1980-2009 has
been 25.0oC. This centre too shows and increases in temperature as the temperature
increased from 23.5o C to 25.1
o C to 26.4
o C over the 3 observed decades. The
highest and the lowest temperature of the observed 30 years were during 2002 and
1983, which were 2.8o C above and 2.4
o C below the average.
7. Flood Prone Eastern Plain
The average annual mean temperature of the Flood Prone Eastern Plain Zone
during 1980-2009 has been 25.9oC. The highest mean temperature was recorded in
2002 which was 2.1oC above the average where the lowest mean temperature was
2.6oC below the average recorded in 1986. The comparison between the decadal
averages show that the temperature rose from 25.3oC (1980-1989) to 25.9
oC (1990-

Assessment of Climatic Vulnerability 185
1999) to 26.6oC (2000-2009). This implies that there is a rise of mean annual
temperature at this centre.
8. Sub Humid Southern Plain and Aravallis
The temperature data at Sub Humid Southern Plain and Aravallis region
suggests a rise in average annual mean temperature from 22.8oC to 24.7
o C during
1980-1989 and 1990-1999 respectively. The mean temperature increased up to 24.3o
C during 2000-2009. During these decades the highest temperature was recorded
during 1994 which was 2.4o
C above average annual mean temperature of 23.5o
C
and the lowest was during 1982 and 1986 which was 1.8o C below the average.
9. Humid Southern Plain
The average annual mean temperature in this zone during 1980-2009 had
been 25.5oC. During these 30 years the highest annual mean temperature was
recorded in 1985 which was 1.4oC above the average and the lowest annual mean
temperature was 2.2oC below the average in the year 1989. This centre suggests the
decadal fluctuation in temperature but an eventual rise as the average annual mean
temperature during 1980-1989 was 25.3o
C which dropped to 24.8o
C during 1990-
1999 and then again rose to 26.2o C during 2000-2009.
10. Humid South Eastern Plain
At the Humid South Eastern Plain Zone the average mean annual temperature
during 1980-2009 has been 26.2o
C. The lowest temperature was recorded during the
first decade in 1986 when it was 1.6o
C below the average and the maximum
temperature of the 3 decades was recorded in the last decade i.e. 2002 when it was
3.4o C above the average. The decadal mean temperature shows a rise in temperature

Assessment of Climatic Vulnerability 186
at this centre too. Here, the mean annual temperature during 1980-1989 is 25.5o
C
which rose to 25.9o C during 1990-1999 to 27.0
o C during 2000-2009.
In each of the agro climatic zones of the state it can be seen that the
temperature has increased. This suggests that the temperature is towards an increase
during the observed 30 years in the state. Graph - 14 depicts the rising temperature
trend in the state in the various Agro-Climatic Regions.
Graph - 14
20
22
24
26
28
30
Tem
per
atu
re
in 0
C
Decadal Mean Temperatures of Rajasthan:
Agro-Climatic Region wise (1980-2009)
1980-1989 1990-1999 2000-2009
Assessment of Climatic Vulnerability 187
4.6 SEASONAL TEMPERATURE ANALYSIS
Due to warm-dry continental climate of the state which is characterized by
arid and semi-arid climatic conditions there is a significant diurnal and seasonal
range of temperature. The variations in seasons are based on rainfall and temperature
conditions that differ amongst different seasons. The Aravallis play a significant role
here, as on the west of Aravallis the climate is arid having low rainfall, low humidity
and extremes of diurnal and annual temperature. To the east of Aravallis the climate
is semi-arid to sub-humid having lesser extremes of temperature, higher humidity
and rainfall.
According to the Indian Meteorological Department the year may be divided
into four seasons, namely:
1. The Winter Season from January to February
2. The Pre-Monsoon season from March to May
3. The Southwest Monsoon season from June to September
4. The Post Monsoon Season from October to December
January is the coldest month, with minimum temperature ranging between
20C in the north and 7.8
0C in the south-west (Rajasthan State Pollution Control
Board, 1994) Sharp decrease in the night temperature is attributed to the presence of
sandy soil at places like Sikar, Churu, Bikaner and Pilani. Also during the winters
the entire state is brought under under a spell of series of cold-waves due to the
western disturbances which bring along with them chilling winds for 2-5 days.
During the winter and monsoon season the temperatures increase southwards and
northwards respectively. The month of March marks the beginning of the hot
Assessment of Climatic Vulnerability 188
weather season. From here on the temperatures start increasing reaching the highest
during June with the mean maximum temperature reaching as high as 480C. The
plateau regions have comparatively lower temperatures during summers. The night
minimum temperatures are lower in higher latitudes except during the southwest
monsoon when they are more or less uniform. Weather during July generally
remains harsh due to high temperature and humidity. Rest of the monsoon period
has high humidity but the day temperature reduces.
To study the temperature variation during the 4 seasons in Rajasthan 4
districts one from each climatic region as classified according to the Thornthwaite
are taken into account. The districts are namely:
1. Udaipur - CA’w Climatic Region
2. Jaipur - DA’w Climatic Region
3. Churu - DB’W Climatic Region
4. Barmer - EA’d Tropical Desert Climatic Region
Udaipur District
The district has on the whole a dry climate, with the hot season milder than
in the Rajasthan desert areas to the northwest of the district. The cold season is from
December to February and is followed by the hot season which lasts till about the
middle of June. Mid June to mid September constitutes the southwest monsoon season.
The post monsoon season from the middle of September to the end of November is
one of transition from monsoon to winter conditions (Indian Meteorological
Department, 2010).

Assessment of Climatic Vulnerability 189
There are two meteorological observatories in the district, one at Udaipur
and other at Udaipur City. During the winter season both day and night temperatures
begin to drop steadily which starts during late November. During 1980-2009 the
mean yearly maximum temperature during the cold season was 26.240C and the
mean yearly minimum temperature has been 7.390C. The minimum temperature
sometimes reaches the freezing point of water and frost may occur occasionally.
During winter and summer months the diurnal range of temperature is large. During
early March the temperatures start rising rapidly till May early June. The mean yearly
maximum temperature during the hot/pre-monsoon season in the district during
1980-2009 was 36.790C and the mean yearly minimum temperature was 19.37
0C.
By the third or fourth week of June the temperatures drop significantly as the
southwest monsoon reaches the district. But after the withdrawal of the southwest
monsoon there is again a slight increase in day temperatures around mid-September.
During 1980-2009 the mean yearly maximum temperature during the monsoon
season and post-monsoon season was 32.730C and 29.62
0C respectively and the
mean yearly minimum temperature during the monsoon season and post-monsoon
season has been 23.760C and 11.95
0C respectively.
The temperature of the cold season registers slight increase. The mean
maximum and the mean minimum temperature rose from 25.37 o
C to 26.19 o
C
to26.85 o
C and 7.22 o
C to 6.05oC reaching 10.45
oC during 1980-1989, 1990-1999
and 2000-2009 respectively. The hot season too had an increase in both mean
maximum and mean minimum temperature. The mean maximum and mean minimum
temperature in summers during 1980-1989, 1990-1999 and 2000-2009 varied from

Assessment of Climatic Vulnerability 190
36.15 o
C to 36.62 o
C reaching 37.42 o
C and 18.71 o
C to 21.17 o
C reaching 21.72 o
C
respectively.
The mean maximum and the mean minimum temperature during monsoon
season fluctuated around 32.37 o
C, 32.61 o
C and 32.73 o
C; and 23.40 o
C, 25.66 o
C
and 23.76 oC during 1980’s, 1990’s and 2000’s respectively.
Graph – 15
The post monsoon season’s mean maximum and mean minimum temperature
recorded an increased during 1980-1989, 1990-1999 and 2000-2009 from 29.35 o
C
to 29.13oC reaching 30.08
oC and 10.09
oC rising 17.96
oC and then falling to 15.12
oC
respectively. The mean minimum temperature during the post monsoon season
showed the greatest variation of a rise of 7.87 o
C and then a fall of 2.84 o
C between
the 1st and the 2
nd; and 2
nd and 3
rd decade. See Graph – 15 depicts the seasonal
fluctuations of Udaipur district. The highest mean maximum temperature in the cold,
0
5
10
15
20
25
30
35
40
Tem
per
atu
re
in °
C
Seasonal Mean Temperatures
Decadal Seasonal Temperature trend of Udaipur District
(1980-2009)
1980-1989 1990-1999 2000-2009

Assessment of Climatic Vulnerability 191
hot, monsoon and post monsoon seasons in the district were 32.45oC(1993), 42.19
oC
(2006), 40.45 o
C (1995) and 37.4 o
C (1987) and lowest mean maximum temperature
were 20.9 oC(1983), 30.09
oC(1990), 26.95
oC(1983) and 24.2
oC(1991) respectively.
The highest mean minimum temperature in the cold, hot, monsoon and the
post-monsoon seasons was 10.67 o
C (1987), 27.5 o
C (2003), 30.25 o
C(1994) and the
lowest mean minimum temperature was 4.83 o
C(1984), 10.54 o
C(1988), 19.03 o
C
(1984) and 4.85oC(1986) respectively.
Barmer District
The characteristic feature of the climate of this district in common with the
adjoining districts of Rajasthan is its dryness, large diurnal range of temperature and
the fitful and erratic nature of the rainfall. The year may be divided into four seasons,
the winter from November to March, the summer from April to June, the southwest
monsoon season from July to mid September and the post monsoon season from mid
September to the end of October (Indian Meteorological Department, 2010).
At Barmer the hot season attains its highest value in May or June which
begins by March when the temperature begins to rise rapidly. The district witnesses’
intense heat and heat waves intensify summers in the region. During 1980-2009 the
mean yearly maximum temperature during the hot/pre-monsoon season was 38.50
0C and the mean yearly minimum temperature has been 23.28
0C. With the onset of
the monsoon there is decrease in temperature and after the withdrawal of the
monsoon there is again an increase in temperature. The mean yearly maximum
temperature during the monsoon season was 37.280C and the mean yearly minimum

Assessment of Climatic Vulnerability 192
temperature has been 26.250C during 1980-2009. And during the post monsoon
season the mean yearly maximum temperature was 31.980C and the mean yearly
minimum temperature was 16.560C.
During the cold season, the temperatures are low especially in the night and
January is the coldest month. The diurnal range of temperature is large in all the
months. During this season the mean yearly maximum temperature was 27.420C and
the mean yearly minimum temperature was 11.480C.
The temperature gradient of the Barmer district does not fluctuate much
which can be seen in the Graph – 16. The temperature during the cold season show
some rise during the observed time span of 1980 to 2009. The mean maximum
temperature and the mean minimum temperature rose from 26.76oC to 27.75
oC to
27.78 o
C and 10.54 o
C to 11.72 o
C to 12.18 o
C during 1980-1989, 1990-1999 and
2000-2009 respectively. The mean maximum temperature of the hot season too
shows an increase from 38.18 o
C in 1980’s to 38.20 o
C in 1990’s reaching 39.13 o
C
in 2000’s. The mean minimum temperature of this season fluctuated from 23.33 o
C
to 22.87 oC to 23.6
oC during 1980-1989 to 1990-1999 and 2000-2009 respectively.
The mean maximum and mean minimum temperature of the monsoon season
showed very slight variation. The mean maximum temperature was 37.31 o
C in
1980-1989 and 1990-1999 which showed a 0.08 o
C decrease in 2000-2009 reaching
37.23 o
C. Similarly, the mean minimum temperature during the same season varied
around 26.11 o
C in 1980-1989 to 26.40 o
C in 1990-1999 and 26.23 o
C during 2000-
2009.
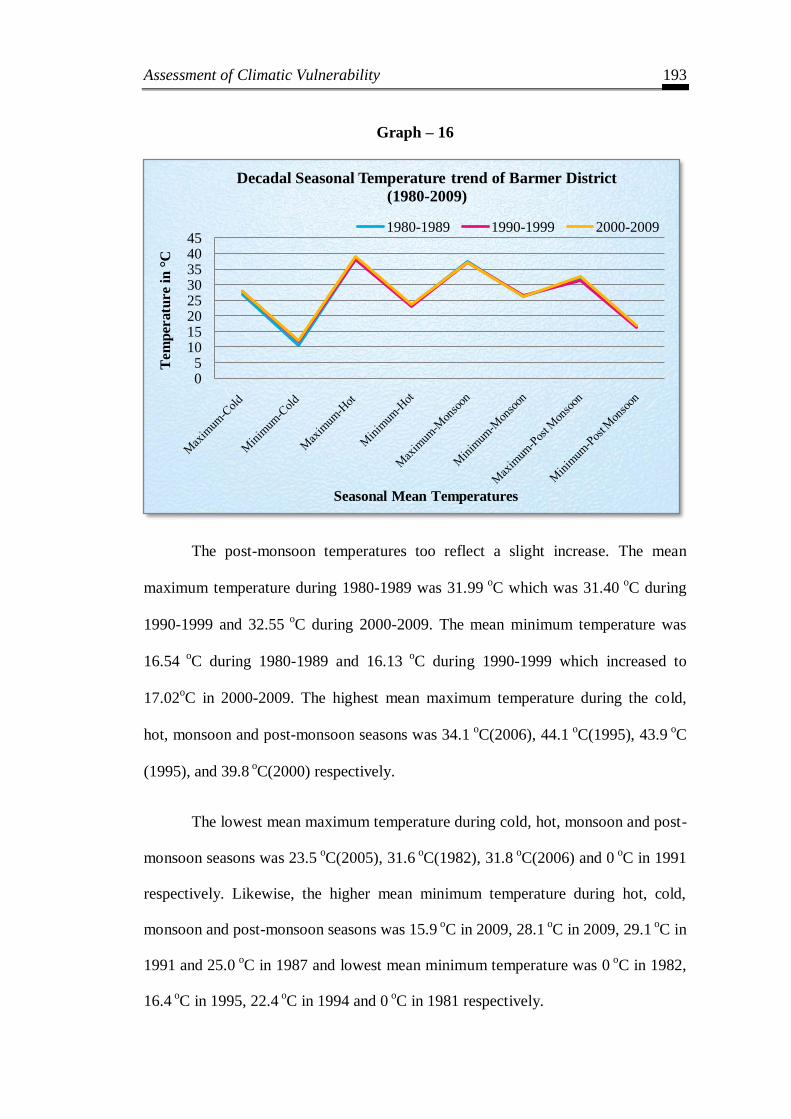
Assessment of Climatic Vulnerability 193
Graph – 16
The post-monsoon temperatures too reflect a slight increase. The mean
maximum temperature during 1980-1989 was 31.99 o
C which was 31.40 o
C during
1990-1999 and 32.55 o
C during 2000-2009. The mean minimum temperature was
16.54 o
C during 1980-1989 and 16.13 o
C during 1990-1999 which increased to
17.02oC in 2000-2009. The highest mean maximum temperature during the cold,
hot, monsoon and post-monsoon seasons was 34.1 o
C(2006), 44.1 o
C(1995), 43.9 o
C
(1995), and 39.8 oC(2000) respectively.
The lowest mean maximum temperature during cold, hot, monsoon and post-
monsoon seasons was 23.5 o
C(2005), 31.6 o
C(1982), 31.8 o
C(2006) and 0 o
C in 1991
respectively. Likewise, the higher mean minimum temperature during hot, cold,
monsoon and post-monsoon seasons was 15.9 oC in 2009, 28.1
oC in 2009, 29.1
oC in
1991 and 25.0 o
C in 1987 and lowest mean minimum temperature was 0 o
C in 1982,
16.4 oC in 1995, 22.4
oC in 1994 and 0
oC in 1981 respectively.
05
1015202530354045
Tem
per
atu
re
in °
C
Seasonal Mean Temperatures
Decadal Seasonal Temperature trend of Barmer District
(1980-2009)
1980-1989 1990-1999 2000-2009
Assessment of Climatic Vulnerability 194
CHURU DISTRICT
The district has a dry desert climate, with large variations of temperature and
scanty rainfall. The winter period from November to March is followed by the
summer season from April to June. The period from July to mid September is the
southwest monsoon season. Mid September to October is the period of transition
from monsoon to the cold season (Indian Meteorological Department, 2010).
In the Churu district the variation in the minimum and maximum temperature
is perhaps greatest for any place in the world. Perhaps it is the only place in the
world where temperature dips below sub-zero but does not have snowfall
(http://churu.nic.in/AboutUs/geography.html). Here, May and June are the hottest
months with the mean yearly maximum temperature in the hot season during 1980-
2009 was 36.020C and the mean yearly minimum temperature at about 18.34
0C. It is
intensely hot and scorching dust laden winds prevail. The temperatures fluctuate
with the advance of the southwest monsoon season and the humidity is very high.
During the monsoon season the mean yearly maximum temperature was 37.850C
and the mean yearly minimum temperature has been 24.990C. After the monsoon
withdraws, the mean yearly maximum temperature and the mean yearly minimum
temperature begin to decrease. During the post monsoon season in the observed
years they were 30.120C and 12.01
0C respectively. In the cold season the diurnal
range of temperature is very large. After October the drop in temperature is rather
sudden and January is the coldest month. Cold waves in association with passing
western disturbances, affect the district and the minimum temperatures sometimes
drop to four to five degrees below the freezing point of water and frost occurs,

Assessment of Climatic Vulnerability 195
during winter season. The mean yearly maximum temperature in the cold season
was 25.850C and the mean yearly minimum temperature was 7.74
0C.
During the observed 30 years from 1980 to 2009, in the 4 major seasons
there were some fluctuations in the temperature. During the cold season the mean
maximum temperature rose from 25.460C to 25.82
0C to 26.26
0C during 1980 to 1989
and 1990 to 1999 and 2000 to 2009 respectively. A similar rising trend is seen in the
mean minimum temperature as well. Here, the mean minimum temperature rose
from 6.02oC to 8.07
oC to 9.14
oC during the above said 3 decades. During the hot
season both the mean maximum temperature and the mean minimum temperature
rose from 30.26oC to 38.79
oC to 39.03
oC and 11.59
oC to 21.05
oC to 22.3
oC
respectively during 1980s 1990s and 2000 to 2009 decade. During the monsoon
season the mean maximum temperature showed slight variation from 38.59oC to
37.15oC to 37.81
oC; whereas the mean minimum temperature increased 24.69
oC to
24.70oC to 25.58oC during the three decades.
The post monsoon season registered a fall in both mean maximum and mean
minimum temperature of the three decades. The mean maximum temperature varied
from 32.92oC to 28.81
oC to 28.64
oC and mean minimum varied from 68.80
oC to
98.11oC to 10.13
oC during 1980-1989, 1990 to 1999 and 2002-2009.
In this decadal analysis it can be seen that the major temperature differences
were seen between 1980-1989 and 1990-1999 whereas during 1990-1999 and 2000-
2009 there was not that much variation. See Graph – 17.

Assessment of Climatic Vulnerability 196
Graph – 17
From 1980 to 2009 the highest mean maximum temperature during cold, hot,
monsoon and post-monsoon season was 35.2oC (2003), 44.9
oC (1994), 44.1
oC
(1995), and 28.5oC (1981)respectively; the lowest mean maximum temperature cold,
hot, monsoon and post-monsoon season was 20.7 o
C (1988,1994) 20.3 o
C (1983),
32.5 oC(1990) and 21.0
oC (1989).
Similarly, the highest mean minimum temperature and the lowest mean
minimum temperature was recorded was 15.0oC (2003), 30.0
oC (2003), 29.9
oC
(1986) and 25.9 o
C (1983); and 1.7 o
C (1987), 0.8 oC (1980), 13.8
oC (1997) and 2.5
oC (2002) respectively during the cold, hot, monsoon and post-monsoon seasons.
05
1015202530354045
Tem
per
atu
re
in °
C
Seasonal Mean Temperatures
Decadal Seasonal Temperature trend of Churu District
(1980-2009)
1980-1989 1990-1999 2000-2009

Assessment of Climatic Vulnerability 197
JAIPUR DISTRICT
The district has a dry climate except during the southwest monsoon season.
December to February is the cold season after which the hot season commences and
continues till about the third week of June when the southwest monsoon sets in. The
southwest monsoon season is comparatively short in this region and lasts only till
mid September. The period from the second half of September to the end of
November is the post monsoon season or retreating monsoon season (Indian
Meteorological Department, 2010).
The period from March to June is one of continuous increase in temperatures,
May and the first half of June being the hottest part of the year. During the observed
years i.e. 1980 to 2009 the mean yearly maximum temperature of the hot season was
36.440C and the mean yearly minimum temperature was 21.70
0C. During the on-set
of the southwest monsoon the temperatures may lower down to some extent but the
humidity increases. Here the mean yearly maximum temperature during monsoon
season was 35.340C and the mean yearly minimum temperature was 25.55
0C.
After the withdrawal of the monsoon, in the post-monsoon season the mean
yearly maximum temperature was 29.280C and the mean yearly minimum temperature
was 14.380C. After November both day and night temperatures drop till January,
which is the coldest month. During the cold season the district gets affected by the
cold waves which get associated with the passing western disturbances across north
India. The mean yearly maximum temperature and the mean yearly minimum
temperature during the observed years were 24.090C and 9.90
0C respectively.

Assessment of Climatic Vulnerability 198
During 1980 and 2009 in the cold season the mean maximum temperature
has gradually increased. It was 28.58 o
C during 1980-1989 which rose to 23.96 o
C
during 1990-1999 and reached 24.72 o
C during 2000-2009. Whereas, the mean
minimum temperature of the same season varied from 9.49 o
C in the1st decade to
10.31 oC in the 2
nd and 9.91
oC in the last decade of the observed years.
In the hot season both mean maximum and the mean minimum temperature
increased gradually. The mean maximum temperature rose from 36.00 o
C to 36.02oC
reaching 37.30oC and the mean minimum temperature rose from 20.97
oC to 21.84
oC
reaching 22.3oC during 1980-1989 to 1990-1999 and 2000-2009 respectively. There
was slight variation in the monsoon season’s mean maximum and mean minimum
temperature. The mean maximum temperature varied from 35.55 o
C to 34.98 o
C to
35.51 o
C and the mean minimum temperature varied from 25.38 o
C to 25.79 o
C to
25.47 oC during 1980-1989 to 1990-1999 and 2000-2009 respectively.
In the post-monsoon season the mean maximum and the minimum
temperature did not very much but fluctuations were seen. The mean maximum
temperature varied from 29.00oC to 28.90
oC to 29.95
oC and the mean minimum
temperature varied from 13.99 o
C to 14.50 o
C to 14.65 o
C during 1980-1989 to
19990-1999 and 2000-2009 respectively. The Graph – 18 depicts the temperature
variation in the district during the 30 observed years.
The highest mean maximum temperature in the district in the observed 30
years in the cold, hot, monsoon and the post-monsoon season was 31.5 o
C in 2006,
43.2 o
C in 1988, 41.8 o
C in 1981 and 1995 and 36.5 o
C in 2000 and the lowest mean
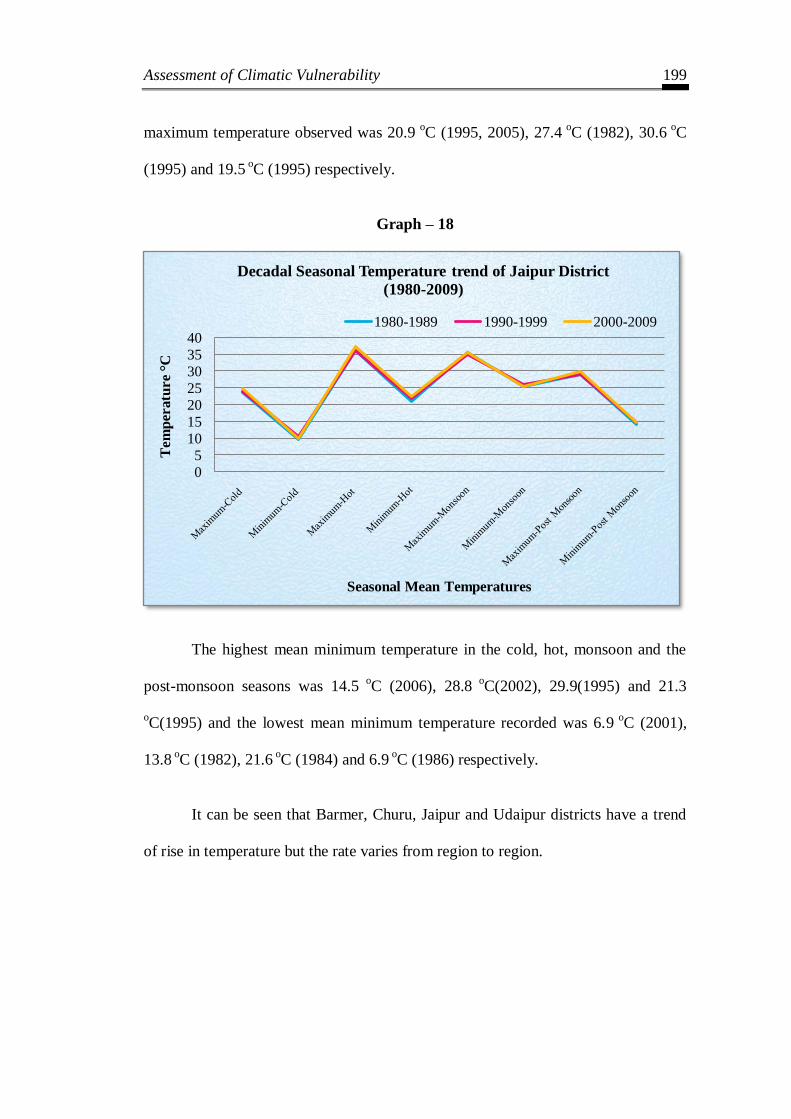
Assessment of Climatic Vulnerability 199
maximum temperature observed was 20.9 o
C (1995, 2005), 27.4 o
C (1982), 30.6 o
C
(1995) and 19.5 oC (1995) respectively.
Graph – 18
The highest mean minimum temperature in the cold, hot, monsoon and the
post-monsoon seasons was 14.5 o
C (2006), 28.8 o
C(2002), 29.9(1995) and 21.3
oC(1995) and the lowest mean minimum temperature recorded was 6.9
oC (2001),
13.8 oC (1982), 21.6
oC (1984) and 6.9
oC (1986) respectively.
It can be seen that Barmer, Churu, Jaipur and Udaipur districts have a trend
of rise in temperature but the rate varies from region to region.
0
5
10
15
20
25
30
35
40
Tem
per
atu
re
°C
Seasonal Mean Temperatures
Decadal Seasonal Temperature trend of Jaipur District
(1980-2009)
1980-1989 1990-1999 2000-2009
