4. site 1169
TRANSCRIPT

Exon, N.F., Kennett, J.P., Malone, M.J., et al., 2001Proceedings of the Ocean Drilling Program, Initial Reports Volume 189
4. SITE 11691
Shipboard Scientific Party2
PRINCIPAL RESULTS
Site 1169 is located in deep water (3568 m) in a flat plain on thewestern part of the South Tasman Rise (STR), 400 km south of Tasma-nia. It lies 30 km east of the ridge of the Tasman Fracture Zone (TFZ)that rises 400 m above the plain. The site is ~100 km south of the Sub-tropical Front (Subtropical Convergence). At Site 1169 we planned topenetrate open-ocean carbonate oozes deposited from the Miocene on-ward as Australia moved northward from Antarctica. In the early Mio-cene (20 Ma), the site was at 55°S compared to its present latitude of47°S. The primary objective was to core a complete upper Neogene se-quence with high sedimentation rates in northern subantarctic watersfor high-resolution biostratigraphic and paleoclimate investigations.
Seismic profiles indicate that the site is in a westerly thickeningwedge of transparent young Neogene ooze, ~200 m thick at the site,that apparently onlaps a prominent reflector and unconformity, belowwhich is more transparent ooze or chalk. This wedge of ooze appears tohave been deposited in the lee of the western ridge (TFZ), which pro-vided protection from scouring by the easterly flowing Antarctic Cir-cumpolar Current. The results from Site 1170, where a comparablesection was drilled in shallower water to the east, show that the trans-parent wedge results from facies change rather than younging west-ward.
We had planned to core three advanced hydraulic piston corer/ex-tended core barrel (APC/XCB) holes, but poor weather conditions andlarge heaves greatly degraded the quality of the cores, and only Hole1169A was cored to 246.3 mbsf with 91.4% recovery (Table T2, p. 94, inthe “Leg 189 Summary” chapter). Although recovery was high in theAPC cores, flow-in and other disturbances meant that both core struc-ture and age reliability were severely compromised. This will precludefuture high-resolution paleoclimatic investigations.
1Examples of how to reference the whole or part of this volume.2Shipboard Scientific Party addresses.
Ms 189IR-104
SHIPBOARD SCIENTIFIC PARTYCHAPTER 4, SITE 1169 2
The drilled sequence consists of 246.3 m of nannofossil ooze with atotal age range from the late Miocene (12.2 Ma) to the late Quaternary,although two disconformities removed much of the record. The upper~200 mbsf of the sequence represents the last ~4 m.y. and disconform-ably overlies a thin (~200 to 220 mbsf) sequence of late Miocene age(6.5 to 6.8 Ma). This, in turn, is underlain by sediments of middle Mio-cene age (~12.5 Ma), although strong sediment disturbance makes fordifficult dating in this part of the sequence. This time break is corre-lated with a seismic unconformity. Sediments are dominated through-out by nannofossil ooze with rare to common foraminifers and sili-ceous microfossils that include diatoms and radiolarians. Siliciclasticsediment components are largely absent in this open-ocean location.One lithostratigraphic unit is recognized, which is subdivided into twosubunits: Subunit IA (0–170.1 mbsf) is a nannofossil ooze with com-mon to abundant siliceous microfossils; Subunit IIB (170.1–246.3 mbsf)is a nannofossil ooze with rare to few siliceous microfossils. Sedimenta-tion rates were low (1.6 cm/k.y.) during the Quaternary through latePliocene, very high (20 cm/k.y.) during the early Pliocene, and moder-ately high (10.9 cm/k.y.) during the brief late Miocene interval repre-sented. The nannofossil oozes were deposited in upper abyssal waterdepths under well-oxygenated bottom-water conditions.
Although the primary objective, high-resolution climatic history,could not be met, Site 1169 provides a number of highlights. We wereable to develop a useful, although relatively broad, integrated subant-arctic biostratigraphy for the Pliocene and Quaternary involving plank-tonic foraminifers, calcareous nannofossils, diatoms, radiolarians, andorganic dinocysts. Ostracodes are also persistently present throughout.Few previous sites from the subantarctic region have allowed the devel-opment of such an integrated stratigraphy, particularly from the Austra-lian sector of the Southern Ocean. This site also contains thesouthernmost late Neogene dinocyst record ever found. A conspicuouslevel of microtektites was discovered in association with the latest Mio-cene/earliest Pliocene disconformity, the first of this age to be reportedfrom the Southern Ocean. Conspicuous late Miocene unconformitiessuggest intensification of bottom-water circulation during that timeand associated carbonate dissolution on the STR at depths close to 3.5km.
Planktonic microfossil assemblages reflect the influence of both sub-antarctic and temperate water masses in this northern subantarctic lo-cation. These mixed assemblages may indicate shifts in position of theSubtropical Convergence over the region. Antarctic elements are alsopresent in some planktonic microfossil groups, reflecting influence ofmore highly productive antarctic surface waters to the south. The veryhigh sedimentation rates of the early Pliocene at this site have previ-ously been observed over broad areas of the South Pacific and elsewhere(Kennett, von der Borch, et al., 1986). These high rates were consideredto represent a significant increase in calcareous biogenic productivityassociated with fundamental paleoceanographic changes affecting sur-face waters during early Pliocene warmth. Rates of early Pliocene bio-genic sedimentation at Site 1169 may have been further amplified bywinnowing of calcareous nannofossils from the STR into the localcatchment basin in which Site 1169 is located. Site 1169 extends obser-vations for the first time to the subantarctic region of remarkably highearly Pliocene biogenic productivity.

SHIPBOARD SCIENTIFIC PARTYCHAPTER 4, SITE 1169 3
BACKGROUND AND OBJECTIVES
Site 1169 is located in present-day upper abyssal water depths (~3570m) on the western part of the STR near its western margin at ~47°S innorthern subantarctic waters (Fig. F3, p. 68, in the “Leg 189 Summary”chapter). The site is located in thick, almost flat-lying sediments accu-mulated in a shallow basin on a gentle structural low formed on theCretaceous surface (Exon et al., 1997). The younger part of the Neogenesection is seismically transparent and has accumulated in the lee of theTasman Fracture Zone, which forms a ridge to the west. The older Neo-gene section is well bedded but hummocky in character and probablyconsists of chalks with some hiatuses. The lowest part of the Neogenemay be absent. The seismically similar underlying Eocene sequence isprobably largely mudstone.
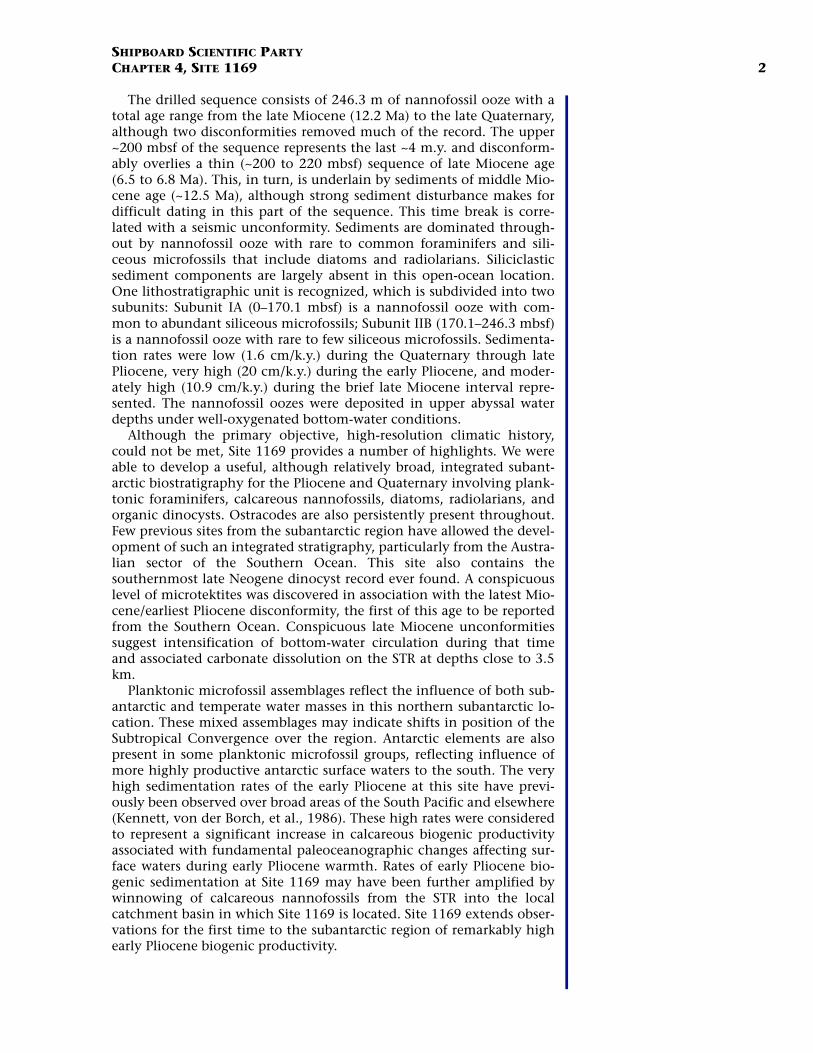
Site 1169 was selected at the intersection of multichannel seismicprofiles Tasmante 125-4 (Fig. F1) and -9. This shallow-penetration sitewas designed to fully recover a thick, young Neogene sequence. Weplanned to penetrate 0.23 s (195 m) of Pliocene to Holocene transpar-ent ooze that apparently onlapped 0.22 s (185 m) of upper Oligocene toMiocene ooze and chalk above an inferred Oligocene unconformity. Be-low the Oligocene unconformity is 0.1 s (110 m) of presumed upperEocene to lower Oligocene marine mudstone, marl, and chalk, above0.08 s (90 m) of presumed middle Eocene mudstone. The base of thesite at 246.3 mbsf was shown to be middle Miocene, and the upper on-lapped surface was just ~30 m above the base.
The primary objective of Site 1169 was to core a complete late Neo-gene sequence of high sedimentation rate in northern subantarctic wa-ters for high-resolution biostratigraphic and paleoclimatic studies. Thedepths are sufficiently shallow to provide a high-quality carbonate bio-genic sequence and at a high enough latitude for preservation of bothcalcareous and siliceous microfossils as proxies for paleoclimaticchange. This location was specifically selected because of seismic strati-graphic data indicating a sequence of especially high sedimentationrate that would allow high-resolution paleoclimatic investigations. Site1169 would also provide basic biostratigraphic records for several mi-crofossil groups of late Neogene age from the northern subantarctic ofthe Pacific/Indian Ocean region. These would complement such recordsobtained from the subantarctic region south of South Africa (ShipboardScientific Party, 1999).
To the north of Site 1169 is the Subtropical Front (Subtropical Con-vergence), which marks the northern limit of subantarctic surface wa-ters and the Southern Ocean and is marked by a strong surface-watertemperature gradient of ~4°C (from 14° to 18°C in summer) and a tem-perature of 11°C at 150 m (Tchernia, 1980; Rintoul et al., 1997; Sikes1995). Site 1169 lies north of the Subantarctic Front marked by a sur-face-water temperature gradient of 6°–8°C (Rintoul et al., 1997). Thisforms the boundary between the Australasian surface water and Cir-cumpolar Subantarctic surface water (Heath, 1985). Subantarctic watersare driven to the east by often strong prevailing westerlies as part of theCircumpolar Current. The subantarctic water mass is bounded to thesouth by the Antarctic Polar Front or Convergence, a major boundarymarked by the 2°C vertical isotherm in winter (Barrows et al., 2000) andconsidered the northern limit of the antarctic zone.
Site 1169 is well located to have recorded meridional movement ofsurface-water masses including the oceanic fronts separating major wa-
Two-
way
trav
eltim
e (s
)
SW NE5 km
SP 11399 11299 11199 11099 10999 10899 10799 10703 SP
7.0
4.0
4.5
5.0
5.5
6.0
s125mig125_04
Site1169
6.5
F1. A portion of seismic line Tas-mante 125-04 through Site 1169, p. 27.
SHIPBOARD SCIENTIFIC PARTYCHAPTER 4, SITE 1169 4
ter masses (Sikes, 1995). Today, the Subtropical Convergence overliesthe STR, and the Polar Front is only a few degrees to the south. At 3500m, Site 1169 lies within Circumpolar Deep Water and has the potentialto record changes in this water mass that may be linked with oscilla-tions in the strength of the so-called oceanic conveyor belt circulation.
The Southern Ocean is considered to be very important in Quater-nary global climate change as it certainly was earlier in the Cenozoic.Very high biological productivity of the Southern Ocean in combina-tion with major regional production of deep and intermediate watersstrongly influence atmospheric CO2 levels and, hence, global climate(Broecker et al., 1980; Mortlock et al., 1991; Howard and Prell, 1992).Quaternary climatic changes in the Southern Ocean have been largeand on Milankovitch scales, as documented by changes in the extent ofsea ice, sea-surface temperatures, water-mass boundaries, deep- and in-termediate-water production, and biological productivity of surface wa-ters. The relative importance of North Atlantic and Southern Oceansources of deep waters to the ocean has oscillated during the late Qua-ternary with major implications for climate change (Boyle and Keigwin,1985; Charles et al., 1996). The subantarctic region is a repository of pa-leoclimatic information critical for better understanding of late Neo-gene climatic processes and variability. Site 1169 was designed to obtainrecords for such investigations.
OPERATIONS
Transit to Site 1169 Via Hobart
The transit from Site 1168 to the Port Huon pilot station for a per-sonnel transfer was accomplished at an average speed of 12.6 kt, whichput the vessel at the mouth of the D’Entrecasteaux Channel at 0900 hr,>4 hr ahead of schedule. After reviewing the option of remaining sta-tionary and waiting for the pilot boat to transit to the vessel, we de-cided to continue directly to the innerpilot station near Hobart,arriving at 1245 hr on 28 March.
The ship rendezvoused with the pilot boat, and three new personnel(two from the Ocean Drilling Program [ODP] and one from OverseasDrilling Limited) were transferred on board along with some lightcargo. Two personnel, an ODP engineer and a technical representativefrom Maritime Hydraulics, left the vessel. At 1255 hr, the transfer wascompleted and the JOIDES Resolution altered course and continued tothe next site. The vessel proceeded on a southerly course for the 270-nmi transit, which was accomplished at an average speed of 11.3 kt.
Hole 1169A
At 1245 hr on March 28, a beacon was deployed, hydrophones andthrusters were extended, and the vessel settled on location. An APC/XCB bottom-hole assembly (BHA) was made up and run to near theprecision depth recorder depth of 3584.4 mbrf.
As the drill string was being deployed, a cold front passed over ourlocation, driving the winds from 28 kt to >55 kt in the space of a fewminutes. Accompanying the arrival of the front were very heavy rainsand a drop in temperature of 4°C in <15 min. Although the intensity ofthe winds quickly abated as the direction shifted from the north to the

SHIPBOARD SCIENTIFIC PARTYCHAPTER 4, SITE 1169 5
west, the resulting conditions from the passage of the front strongly af-fected subsequent coring.
Hole 1169A was spudded with the APC at 2245 hr on 28 March. Theseafloor depth was calculated from the recovery of the first core and de-termined to be 3578.9 mbrf, or 3567.9 mbsl. As piston coring was initi-ated, the weather deteriorated and generated considerable vesselmotion that adversely affected the quality of the cores. During coring inthis hole, the winds were predominantly from the west and neverdropped below 22 kt with gusts frequently measured between 35 and 40kt. There was also a complex swell from the west and southwest (~5 mamplitude) that would periodically combine and push the vessel heave>6 m.
The weather made for difficult operations with resulting poor qualityof the piston cores. During operations, the wireline had to be re-termi-nated at the rope socket twice because of fraying steel-rope membersarising from an excessive bending radius caused by excessive vessel mo-tion. Two additional wireline round-trips were needed to fish out thecore barrel when the wireline eventually parted at the rope socket. Onanother occasion, coring had to be stopped for several hours while thedrill crew disassembled the piston corer to clean out a core liner thatcompletely failed, likely a result of the extreme hydraulic forces. Thewireline speed was also reduced to accommodate the weather-inducedmotion of the drill string and vessel.
The quality of the cores was poor because of the flow-in and verticaldisturbance caused by the dynamics of attempting to piston core in thisenvironment. During piston coring, the heave compensator is not usedexcept for drilling or washing ahead to position the drill bit for the nextpiston core attempt. When the piston corer is fired, the heave compen-sator is locked and the bit is forced to follow the vertical motion of thevessel. It was expected that as soon as XCB coring was initiated, thecore quality would improve because of the activation of the heave com-pensator with a resulting decrease in core disturbance. Unfortunately,the main objective for this site was recovery of an upper Neogene sec-tion for high-resolution analysis that only undisturbed APC cores couldprovide.
After the APC coring advanced to a depth of 199 mbsf, we switchedto the XCB system in an attempt to minimize core disturbance, despitethe fact that only minimum pull-out force was required to free the corebarrel from the sediment. Coring concluded when the XCB deepenedthe hole from 199 mbsf to the depth objective of 247 mbsf. The maingoal for this site was high-resolution analysis of the sedimentary record;hence, operations were terminated because of the effect that the seastate was having on core quality. The average recovery of the piston-cored section of the hole was 100%, with overall recovery being 91%(Table T1).
The drill bit was pulled clear of the seafloor at 0200 hr on 31 March,and the drill string was recovered. As the BHA was being disassembledinto the component drill collars in preparation for the transit to thenext site, the beacon was successfully recovered. Following the retrac-tion of the thrusters and hydrophones and the securing of the drillingequipment, the vessel began the short transit to the next site at 0830 hron 31 March.
T1. Coring summary, p. 48.

SHIPBOARD SCIENTIFIC PARTYCHAPTER 4, SITE 1169 6
LITHOSTRATIGRAPHY
Introduction
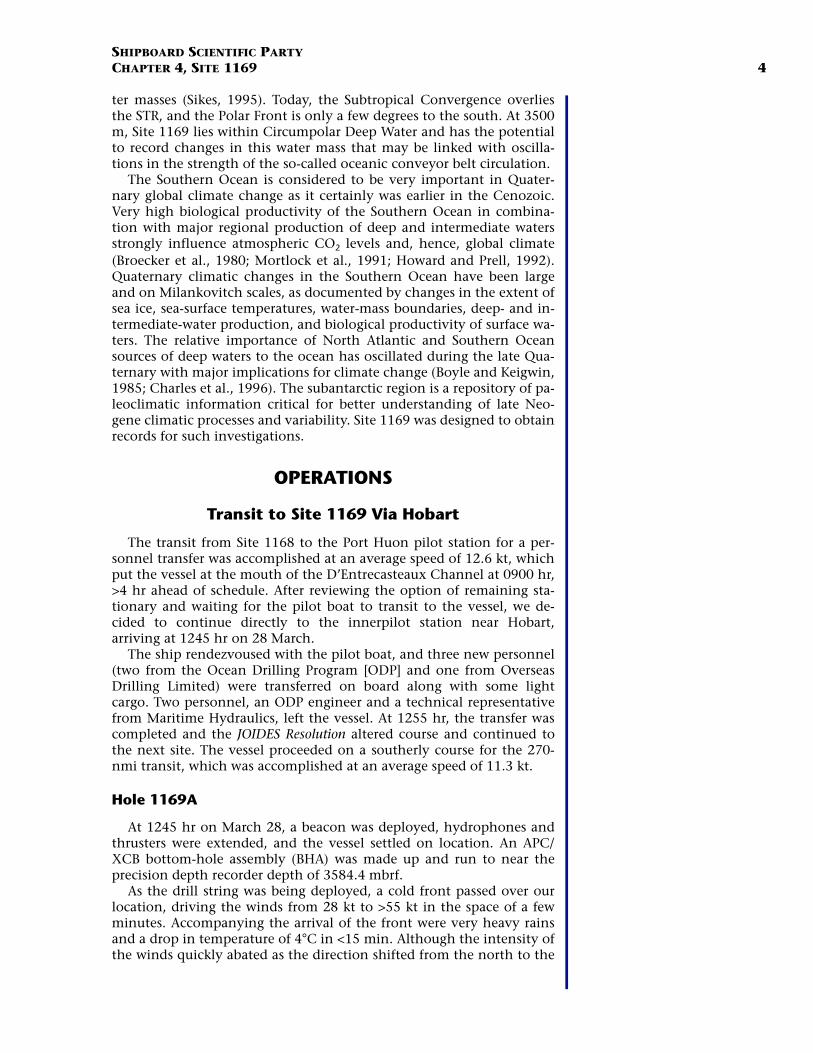
At Site 1169, one hole with 26 cores was drilled. Hole 1169A reached246.3 mbsf with a total sediment recovery of 91.4% using the APC andXCB (Fig. F2). The sediments at Site 1169 mainly consist of pelagic nan-nofossil ooze with minor constituents such as foraminifers and sili-ceous microfossils. Siliciclastic components were rarely observed.Because the entire sediment sequence at the site exhibits no majorlithologic changes, only one unit is recognized. Unit I, with two sub-units differentiated, shows relatively minor differences in core features,smear slides, reflectance spectrophotometry, and coulometric carbonateanalyses. Two hiatuses were recognized, at ~220 and ~200 mbsf, basedon multitaxa biostratigraphy.
The primary site objective was to obtain late Neogene high-resolu-tion (i.e., Milankovitch scale) paleoceanographic data in the subantarc-tic. Although the overall recovery was relatively high, the piston-coredsediments (Cores 189-1169A-1H through 21H) were moderately tostrongly disturbed during the drilling operation, whereas no significantdrilling disturbance occurred for XCB drilled cores below Core 189-1169A-22X (Fig. F2). The coring disturbances for APC sediments re-sulted from heavy swell, strong winds, and related technical problemssuch as crushed and split liners. No further attempt was made to drillthe scheduled B and C holes at this site because of the severe weatherconditions. The relative intensity of sediment disturbance is shown inFigure F3A. Severely disturbed soupy (e.g., Cores 189-1169A-1H, 2H,and 11H) and vertically deformed (e.g., Cores 189-1169A-4H, 5H, 10H,and 15H) sediments hampered our measurements of several chemicaland physical properties. Although high-resolution data could not becollected from the disturbed sediments, measurements of several sedi-mentary parameters exhibit trends that have aided interpretations ofgeneral changes in depositional environments.
Description of Lithostratigraphic Units
Unit I
Depth: 0 to 246.3 mbsfAge: Pleistocene to middle MioceneInterval: Cores 189-1169A-1H through 26XThickness: 246.3 mbsf
Unit I consists of 246.3 m of middle Miocene to Pleistocene pelagicnannofossil ooze with rare to common foraminifers and siliceous fossilsincluding radiolarians, diatoms, silicoflagellates, and sponge spicules.The sediments of Unit I are generally massive and exhibit no notablesedimentary structures, except for sporadic occurrences of isolated lightbluish gray thin to medium laminations and small (~10 mm) in situblack pyrite concentrates. Occasionally, dark pyritic thin beds were ob-served (e.g., Core 189-1169A-17H). The color of sediments varies fromlight greenish gray to white. Calcium carbonate content is relativelyhigh throughout the unit, ranging between 78.9 and 95.5 wt%, exceptfor an anomalous low value of 63.8 wt% measured at 137.32 mbsf (Sam-ple 189-1169A-15H-4, 72 cm) (see “Organic Geochemistry,” p. 19). TheAPC-cored sediments (i.e., Cores 189-1169A-1H through 21H) show a
Lithology
Uni
tS
ubun
itA
ge
Lightness(L*)
Dep
th (
mbs
f)
0
101H
2H
3H
4H
5H
6H
7H
8H
9H
10H
11H
12H
13H
14H
15H
16H
17H
18H
19H
20H
21H
22X
23X
24X
25X
26X
20
30
40
60
70
80
90
110
120
130
140
160
170
180
190
50
100
150
200
210
220
230
240
TD 246.3 m
Rec
over
y
Cor
e
Hole1169A
TTTTTTTTTTTTTTTTTTTTTTTTTTTTTTTTTTTTTTTTTTTTTTTTTTTTTTTTTTTTTTTTTTTTTTTTTTTTTTTTTTTTTTTTTTTTTTTTTTTTTTTTTTTTTTTTTTTTTTTTTTTTTTTTTTTTTTTTTTTTTTTTTTTTTTTTTTTTTTTTTTTTTTTTTTTTTTTTTTTTTTTTTTTTTTTTTTTTTTTTTTTTTTTTTTTTTTTTTTTTTTTTTTTTTTTTTTTTTTTTTTTTTTTTTT
TTTTTTTTTTTTTTTTTTTTTTTTTTTTTTTTTTTTTTTTTTTTTTTTTTTTTTTTTTTTTTTTTTTTTTTTTTTTTTTTTTTTTTTTTTTTTTTTTTTTTTTTTTTTTTTTTTTTTTTTTTTTTTTTTTTTTTTTTTTTTTTTTTTTTTTTTTTTTTTTTTTTTTTTTTTTTTTTTTTTTTTTTTTTTTTTTTTTTTTTTTTTTTTTTTTTTTTTTTTTTTTTTTTTTTTTTTTTTTTTTTTTTTTTTTTTTTTTTTTTTTTTTTTTTTTTTTTTTTTTTTTTTTTTTTTTTTTTTTTTTTTTTTTTTTTTTTTTTTTTTTTTTTTTTTTTTTTTTTTTTTTTTTTTTTTTTTTTTTTTTTTTTTTTTTTTTTTT
v
v
v
v
v
v
v
v
v
v
v
vv
v
v
v
v
v
v
v
v
v
v
vv
v
v
v
v
v
v
v
v
v
v
vv
v
v
v
v
v
v
v
v
v
v
vv
v
v
v
v
v
v
v
v
v
v
vv
v
v
v
v
v
v
v
v
v
v
vv
v
v
v
v
v
v
v
v
v
v
vv
v
v
v
v
v
v
v
v
v
v
vv
v
v
v
v
v
v
v
v
v
v
vv
v
v
v
v
v
v
v
v
v
v
vv
v
v
v
v
v
v
v
v
v
v
vv
v
v
v
v
v
v
v
v
v
v
vv
v
v
v
v
v
v
v
v
v
v
vv
v
v
v
v
v
v
v
v
v
v
vv
v
v
v
v
v
v
v
v
v
v
vv
v
v
v
v
v
v
v
v
v
v
vv
v
v
v
v
v
v
v
v
v
v
vv
v
v
v
v
v
v
v
v
v
v
vv
v
v
v
v
v
v
v
v
v
v
vv
v
v
v
v
v
v
v
v
v
v
vv
v
v
v
v
v
v
v
v
v
v
vv
v
v
v
v
v
v
v
v
v
v
vv
v
v
v
v
v
v
v
v
v
v
vv
v
v
v
v
v
v
v
v
v
v
vv
v
v
v
v
v
v
v
v
v
v
vv
v
v
v
v
v
v
v
v
v
v
vv
v
v
v
v
v
v
v
v
v
v
vv
v
v
v
v
v
v
v
v
v
v
vv
v
v
v
v
v
v
v
v
v
v
vv
v
v
v
v
v
v
v
v
v
v
vv
v
v
v
v
v
v
v
v
v
v
vv
v
v
v
v
v
v
v
v
v
v
vv
v
v
v
v
v
v
v
v
v
v
vv
v
v
v
v
v
v
v
v
v
v
vv
v
v
v
v
v
v
v
v
v
v
vv
v
v
v
v
v
v
v
v
v
v
vv
v
v
v
v
v
v
v
v
v
v
vv
v
v
v
v
v
v
v
v
v
v
vv
v
v
v
v
v
v
v
v
v
v
vv
v
v
v
v
v
v
v
v
v
v
vv
v
v
v
v
v
v
v
v
v
v
vv
v
v
v
v
v
v
v
v
v
v
vv
v
v
v
v
v
v
v
v
v
v
vv
v
v
v
v
v
v
v
v
v
v
vv
v
v
v
v
v
v
v
v
v
v
vv
v
v
v
v
v
v
v
v
v
v
vv
v
v
v
v
v
v
v
v
v
v
vv
v
v
v
v
v
v
v
v
v
v
vv
v
v
v
v
v
v
v
v
v
v
vv
v
v
v
v
v
v
v
v
v
v
v
A
B
50 90
Carbonate(wt%)
Ple
isto
cene
I
60 70 80 40 60 80 90
early
Plio
cene
late
Plio
cene
l. M
ioce
nem
. Mio
cene
Sili
ceou
s m
icro
foss
il-be
arin
g na
nnof
ossi
l ooz
eN
anno
foss
il oo
zeTTTTTTT
TTTTTTT
Nannofossil ooze/chalk
vvvvvvvvvvv
v
v
v
v
v
v
v
v
v
v
v
v
v
v
v
v
v
v
vvvvvvvvvvv
Siliceous fossil-bearing nannofossil ooze
F2. Lithostratigraphic summary, p. 28.
Cor
e
Dep
th (
mbs
f)
Rec
over
y
0
101H
2H
3H
4H
5H
6H
7H
8H
9H
10H
11H
12H
13H
14H
15H
16H
17H
18H
19H
20H
21H
22X
23X
24X
25X
26X
20
30
40
60
70
80
90
110
120
130
140
160
170
180
190
50
100
150
200
210
220
230
240
TD 246.3 mbsf
0 2 4
Relativesediment
disturbanceMedium StrongNone
Hole1169A
Subunits Biogenic components (%)
Blue
Colorimetric coordinate b*Yellow
-5 0 5 10 15 20
A C
CaCO3 (wt%)
IAIB
50 60 80 90 10070 50 60 80 90 10070
B D
Calcareous
Siliceous
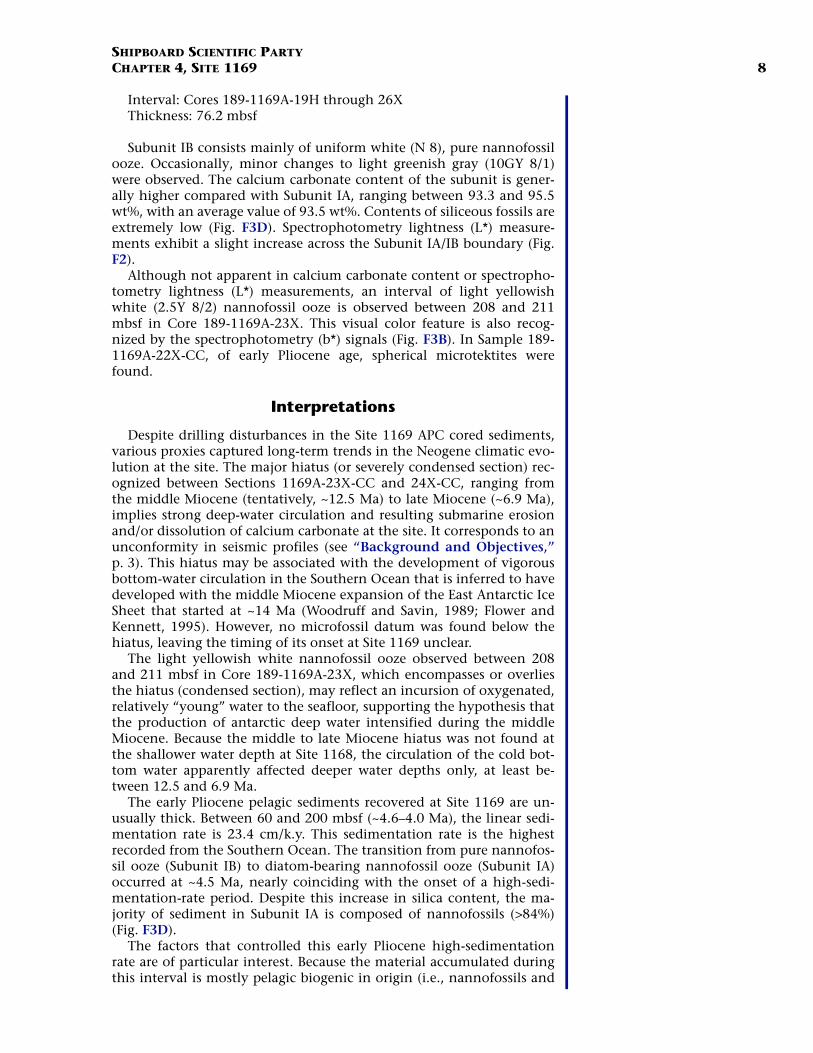
F3. Physical and chemical proper-ties, p. 29.

SHIPBOARD SCIENTIFIC PARTYCHAPTER 4, SITE 1169 7
variety of coring disturbance features in many intervals (Fig. F3A) thatprevented us from observing detailed sedimentary structures. No coringdisturbance was observed for the XCB-drilled cores below Core 189-1169A-22X.
In spite of the above-mentioned drilling disturbances, two subunitshave been recognized within Unit I at Site 1169. Subunit IA (0–170.1mbsf) is characterized by light greenish gray to light gray nannofossilooze with common to abundant siliceous microfossils, mostly diatoms,sponge spicules, and bioclasts, as modifiers. The average calcium car-bonate content for the Subunit IA sediments is 84.4 wt%. The differ-ence between Subunits IA and IB is the minor biogenic components—Subunit IB (170.1–246.3 mbsf) is purely composed of nannofossil ooze.The representative lithologic color of Subunit IB is white. Its calciumcarbonate content averages 93.5 wt%, higher than that of Subunit IA.
The boundary between Subunits IA and IB is placed between Cores189-1169A-18H and 19H, based on changes in sediment color and per-cent content of siliceous fossils. The siliceous fossil-bearing greenishgray nannofossil ooze of Subunit IA changes to white pure nannofossilooze of Subunit IB at the bottom of Core 189-1169A-18H. Although dis-turbed during coring, the sediments in Cores 189-1169A-17H and 18Hare transitional in color and siliceous fossil content from Subunits IA toIB facies (Fig. F3). Biostratigraphic studies at this site suggest the pres-ence of a major hiatus between Samples 189-1169A-23X-CC and 24X-CC (~218 mbsf), possibly spanning much of the middle Miocene to lateMiocene, and a lesser one between Samples 189-1169A-21H-CC and22X-CC (~200 mbsf), removing part the late Miocene to early Pliocene(see “Biostratigraphy,” p. 9).
Subunit IA
Depth: 0 to 170.1 mbsfAge: Pleistocene to early PlioceneInterval: Cores 189-1169A-1H through 18HThickness: 170.1 mbsf
Subunit IA consists predominantly of light greenish gray to light gray(10GY 8/1 to N 7) siliceous fossil-bearing nannofossil ooze. Throughoutthe subunit, siliceous fossils such as diatoms, sponge spicules, sili-coflagellates, and radiolarians are present. The percent estimates of thebiogenic components examined under smear slides, as plotted in FigureF3D, exhibit a sharp decrease in siliceous contents between 160 and 170mbsf, where the subunit boundary is placed. The calcium carbonate con-tent of Subunit IA sediments averages 84.4 wt%, ranging between 78.9and 89.9 wt% (Fig. F3C). Minor amounts of foraminifers, calcareous bio-clasts (fragments of biogenic materials such as foraminifers and ostra-codes), and clay are found in the nannofossil ooze throughout the sub-unit. Nannofossil oozes in the upper part (Cores 189-1169A-1H through3H) of the subunit contain noticeable amounts of foraminifers and bio-clasts. These foraminifer- and bioclast-bearing nannofossil oozes arevery pale brown (10YR 8/3 to 7/3), reflecting more abundant calcareousfossils (Fig. F3D).
Subunit IB
Depth: 170.1 to 246.3 mbsfAge: early Pliocene to middle Miocene
SHIPBOARD SCIENTIFIC PARTYCHAPTER 4, SITE 1169 8
Interval: Cores 189-1169A-19H through 26XThickness: 76.2 mbsf
Subunit IB consists mainly of uniform white (N 8), pure nannofossilooze. Occasionally, minor changes to light greenish gray (10GY 8/1)were observed. The calcium carbonate content of the subunit is gener-ally higher compared with Subunit IA, ranging between 93.3 and 95.5wt%, with an average value of 93.5 wt%. Contents of siliceous fossils areextremely low (Fig. F3D). Spectrophotometry lightness (L*) measure-ments exhibit a slight increase across the Subunit IA/IB boundary (Fig.F2).
Although not apparent in calcium carbonate content or spectropho-tometry lightness (L*) measurements, an interval of light yellowishwhite (2.5Y 8/2) nannofossil ooze is observed between 208 and 211mbsf in Core 189-1169A-23X. This visual color feature is also recog-nized by the spectrophotometry (b*) signals (Fig. F3B). In Sample 189-1169A-22X-CC, of early Pliocene age, spherical microtektites werefound.
Interpretations
Despite drilling disturbances in the Site 1169 APC cored sediments,various proxies captured long-term trends in the Neogene climatic evo-lution at the site. The major hiatus (or severely condensed section) rec-ognized between Sections 1169A-23X-CC and 24X-CC, ranging fromthe middle Miocene (tentatively, ~12.5 Ma) to late Miocene (~6.9 Ma),implies strong deep-water circulation and resulting submarine erosionand/or dissolution of calcium carbonate at the site. It corresponds to anunconformity in seismic profiles (see “Background and Objectives,”p. 3). This hiatus may be associated with the development of vigorousbottom-water circulation in the Southern Ocean that is inferred to havedeveloped with the middle Miocene expansion of the East Antarctic IceSheet that started at ~14 Ma (Woodruff and Savin, 1989; Flower andKennett, 1995). However, no microfossil datum was found below thehiatus, leaving the timing of its onset at Site 1169 unclear.
The light yellowish white nannofossil ooze observed between 208and 211 mbsf in Core 189-1169A-23X, which encompasses or overliesthe hiatus (condensed section), may reflect an incursion of oxygenated,relatively “young” water to the seafloor, supporting the hypothesis thatthe production of antarctic deep water intensified during the middleMiocene. Because the middle to late Miocene hiatus was not found atthe shallower water depth at Site 1168, the circulation of the cold bot-tom water apparently affected deeper water depths only, at least be-tween 12.5 and 6.9 Ma.
The early Pliocene pelagic sediments recovered at Site 1169 are un-usually thick. Between 60 and 200 mbsf (~4.6–4.0 Ma), the linear sedi-mentation rate is 23.4 cm/k.y. This sedimentation rate is the highestrecorded from the Southern Ocean. The transition from pure nannofos-sil ooze (Subunit IB) to diatom-bearing nannofossil ooze (Subunit IA)occurred at ~4.5 Ma, nearly coinciding with the onset of a high-sedi-mentation-rate period. Despite this increase in silica content, the ma-jority of sediment in Subunit IA is composed of nannofossils (>84%)(Fig. F3D).
The factors that controlled this early Pliocene high-sedimentationrate are of particular interest. Because the material accumulated duringthis interval is mostly pelagic biogenic in origin (i.e., nannofossils and

SHIPBOARD SCIENTIFIC PARTYCHAPTER 4, SITE 1169 9
diatoms), the possibility of dilution by a nonbiogenic component is ex-cluded. The other possible factors are increase in productivity, redeposi-tion of winnowed materials, or a combination of both. Incursion ofnutrient-rich waters to the site, probably associated with southward mi-gration of the Subtropical Front and/or regional upwelling, may havestimulated nannoplankton productivity and induced an enormous fluxof carbonate in the region. Such high-primary productivity may be re-sponsible for the increase in siliceous fossil content at the site. Redepo-sition of reworked or winnowed materials may also have contributed tothe elevated sedimentation rate at Site 1169.
The episode of early Pliocene amplified sedimentation rate is alsodocumented from other areas in the Pacific Ocean. Specifically, themagnitude of the early Pliocene sedimentation rate increase in the Tas-man Sea (Deep Sea Drilling Project [DSDP] Sites 590 through 594) iscomparable to that of Site 1169. Nelson (1986) attributed the elevatedPliocene sedimentation rate observed in the Tasman Sea to increasedcalcareous biogenic productivity. Although it appears that increase inbiogenic productivity is responsible for the early Pliocene high sedi-mentation rate, the causes of concurrent occurrence of the event in var-ious locations remain unclear.
BIOSTRATIGRAPHY
Site 1169 is situated beneath present-day subantarctic waters on thewestern part of the STR (Hole 1169A is located at latitude 47°03.9159′S)in upper abyssal water depths (3568 m). A high degree of sediment flowand disturbance was encountered within the recovered cores for Hole1169A. Soft-sediment deformation and downhole caving complicatedthe biostratigraphy, therefore only last occurrence (LO) events are usedin the final age model (Fig. F4). Seven major microfossil groups recov-ered from core-catcher samples are used to constrain the base of Hole1169A to no older than 13.6 Ma (middle Miocene) and to construct anage-depth model. The youngest core (189-1169A-1H) is assigned to themiddle Pleistocene on biostratigraphic and paleomagnetic information(see also “Paleomagnetism,” p. 17). The biostratigraphic data suggestthe presence of two hiatuses; the younger spans the Miocene/Plioceneboundary and the older straddles the middle Miocene/upper Mioceneboundary. Reconstructed linear sedimentation rates imply enhancedcalcareous nannofossil production during the early Pliocene, demon-strated for the first time in the subantarctic. In addition, Hole 1169Acontains the most southerly late Neogene dinoflagellate cyst (dinocyst)record discovered to date. There are few subantarctic sites where such abroad range of microfossil groups are present, affording a unique oppor-tunity for a highly integrated multiple-group biostratigraphy.
Fluctuations in the abundance of cold- and warm-water dinocystsand siliceous microfossils (diatoms and radiolarians) in the Pliocene–Pleistocene signify possible meridional shifts in the position of the Sub-tropical Convergence during this time. Deposition at abyssal paleo-depths throughout the sequence is inferred from the benthic foramini-fers.
Calcareous Nannofossils
All core-catcher samples as well as additional samples from some crit-ical intervals were examined for calcareous nannofossils at Site 1169.
Dep
th (
mbs
f)
0
50
100
150
200
Age (Ma)0 2 4 6 8 10 12 14
Pleisto-cene
late early late middlePliocene Miocene
Cor
e
Rec
over
y
1H2H3H4H5H
6H
7H8H
9H10H
11H12H
13H14H
15H
16H17H
18H19H20H
21H22X
23X24X25X26X
TD 246.3 mbsf
10.9 cm/k.y.
condensed section/hiatus
23.4 cm/k.y.
1.78 cm/k.y.
hiatus
? cm/k.y.
F4. Site 1169 age-depth plot and linear sedimentation rates, p. 31.

SHIPBOARD SCIENTIFIC PARTYCHAPTER 4, SITE 1169 10
Calcareous nannofossils are generally abundant and well to moderatelypreserved throughout the cored interval (Table T2). Poor coring condi-tions at this site resulted in Cores 189-1169A-1H through 21H beinghighly disturbed and Cores 189-1169A-22X through 26X having low re-covery (see “Lithostratigraphy,” p. 6). The nannofossil biostratigraphy(Table T3) for the middle Miocene through the Pleistocene sedimentsshould be considered with these limitations in mind.
Sample 189-1169A-1H-CC contains Pseudoemiliania lacunosa but notEmiliania huxleyi. Toothpick samples were taken through Core 189-1169A-1H in an effort to establish the first occurrence (FO) of Emilianiahuxleyi (0.26 Ma) and the LO of P. lacunosa (0.45 Ma). Analysis of thesesamples revealed successive events taking place in a haphazard order in-dicating core disturbance or strong bioturbation. The FO of E. huxleyiand the LO of P. lacunosa could not be located within Core 189-1169A-1H to any degree of confidence.
The LO of Discoaster brouweri (1.95 Ma) and the LO of Discoaster sur-culus (2.55 Ma) are found between Samples 189-1169A-2H-CC and 3H-CC (Table T3). Toothpick samples taken from Core 189-1169A-2Hshowed similar disturbance to Core 1H, and these datums could not beseparated. The Pliocene/Pleistocene boundary, which is marked by theLO of D. brouweri in low latitudes or approximated by the LO of Calci-discus macintyrei (1.67 Ma) in nontropical areas where discoasters arerare, is therefore placed between Samples 189-1169A-1H-CC and 2H-CCbased on the latter datum.
The LO of Reticulofenestra pseudoumbilicus (3.75 Ma) is found betweenSamples 189-1169A-3H-CC and 4H-CC, marking the lower Pliocene/up-per Pliocene boundary. The base of nannofossil Zone CN11 at 4.6 Ma ismarked by the LO of Amaurolithus primus between Samples 189-1169A-4H-CC and 5H-CC. Ceratolithus acutus and Discoaster quinqueramus arenot encountered, and the Miocene/Pliocene boundary can not be iden-tified by nannofossil biostratigraphy.
Samples 189-1169A-7H-CC through 22X-CC yield abundant, well-preserved nannofossil assemblages that do not provide useful age infor-mation. These assemblages are dominated by Calcidiscus leptoporus, C.macintyrei, and Coccolithus pelagicus with a few reticulofenestrids.
The base of the late Miocene calcareous nannofossil Subzone CN9b isplaced between Samples 189-1169A-23X-3, 44 cm, and 23X-4, 25 cm,based on the LO of Discoaster loeblichii (6.8 Ma). The LO of Amaurolithusdelicatus is recorded between Samples 189-1169A-23X-CC and 24X-1,120 cm. Although this species is rare in Hole 1169A, its LO at 6.9 Ma inthis interval is in good agreement with bioevents above and below thisinterval. The FO of D. loeblichii (8.7 Ma) between Samples 189-1169A-24X-1, 120 cm, and 24X-2, 60 cm, may have been shifted downhole inthis disturbed section by caving or other means, and this datum has notbeen included in the construction of the age-depth model for this site(see “Age Model and Sedimentation Rates,” p. 16). The LO of Cyclicar-golithus floridanus (11.9 Ma) is present between Samples 189-1169A-24X-3, 10 cm, and 24X-4, 35 cm. This datum generally lies below theupper Miocene/lower Miocene boundary (Gartner, 1992).
The last three datums are present within 7.9 m and span 5.0 m.y.This indicates a condensed section or hiatus between Sample 189-1169A-23X-CC and 24X-4, 35 cm. The break in sedimentation appearsto be between Sample 189-1169A-23X-CC and 24X-1, 120 cm, indi-cated by 120 cm of sediment representing 1.8 m.y. (0.07 cm/k.y. sedi-mentation rate). An even less optimistic interpretation of thenannofossil data, ignoring the FO of D. loeblichii as possibly being re-
T2. Distribution and abundance of nannofossils, p. 49.
T3. Calcareous nannofossil datum levels and their assigned age esti-mates, p. 50.
SHIPBOARD SCIENTIFIC PARTYCHAPTER 4, SITE 1169 11
worked and using the LO of C. floridanus at 11.9 Ma, would result in 5.0m.y. being represented by 6.4 m of sediment (0.12 cm/k.y. sedimenta-tion rate).
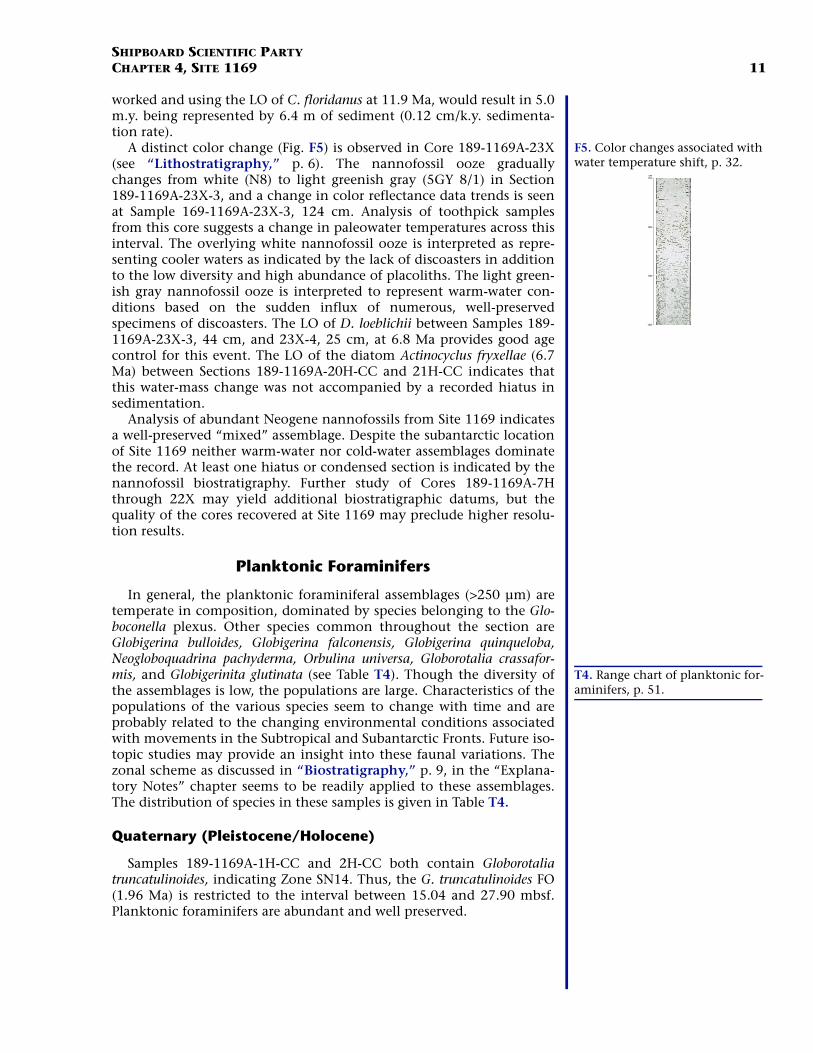
A distinct color change (Fig. F5) is observed in Core 189-1169A-23X(see “Lithostratigraphy,” p. 6). The nannofossil ooze graduallychanges from white (N8) to light greenish gray (5GY 8/1) in Section189-1169A-23X-3, and a change in color reflectance data trends is seenat Sample 169-1169A-23X-3, 124 cm. Analysis of toothpick samplesfrom this core suggests a change in paleowater temperatures across thisinterval. The overlying white nannofossil ooze is interpreted as repre-senting cooler waters as indicated by the lack of discoasters in additionto the low diversity and high abundance of placoliths. The light green-ish gray nannofossil ooze is interpreted to represent warm-water con-ditions based on the sudden influx of numerous, well-preservedspecimens of discoasters. The LO of D. loeblichii between Samples 189-1169A-23X-3, 44 cm, and 23X-4, 25 cm, at 6.8 Ma provides good agecontrol for this event. The LO of the diatom Actinocyclus fryxellae (6.7Ma) between Sections 189-1169A-20H-CC and 21H-CC indicates thatthis water-mass change was not accompanied by a recorded hiatus insedimentation.
Analysis of abundant Neogene nannofossils from Site 1169 indicatesa well-preserved “mixed” assemblage. Despite the subantarctic locationof Site 1169 neither warm-water nor cold-water assemblages dominatethe record. At least one hiatus or condensed section is indicated by thenannofossil biostratigraphy. Further study of Cores 189-1169A-7Hthrough 22X may yield additional biostratigraphic datums, but thequality of the cores recovered at Site 1169 may preclude higher resolu-tion results.
Planktonic Foraminifers
In general, the planktonic foraminiferal assemblages (>250 µm) aretemperate in composition, dominated by species belonging to the Glo-boconella plexus. Other species common throughout the section areGlobigerina bulloides, Globigerina falconensis, Globigerina quinqueloba,Neogloboquadrina pachyderma, Orbulina universa, Globorotalia crassafor-mis, and Globigerinita glutinata (see Table T4). Though the diversity ofthe assemblages is low, the populations are large. Characteristics of thepopulations of the various species seem to change with time and areprobably related to the changing environmental conditions associatedwith movements in the Subtropical and Subantarctic Fronts. Future iso-topic studies may provide an insight into these faunal variations. Thezonal scheme as discussed in “Biostratigraphy,” p. 9, in the “Explana-tory Notes” chapter seems to be readily applied to these assemblages.The distribution of species in these samples is given in Table T4.
Quaternary (Pleistocene/Holocene)
Samples 189-1169A-1H-CC and 2H-CC both contain Globorotaliatruncatulinoides, indicating Zone SN14. Thus, the G. truncatulinoides FO(1.96 Ma) is restricted to the interval between 15.04 and 27.90 mbsf.Planktonic foraminifers are abundant and well preserved.
cm
120
140
130
110
F5. Color changes associated with water temperature shift, p. 32.
T4. Range chart of planktonic for-aminifers, p. 51.

SHIPBOARD SCIENTIFIC PARTYCHAPTER 4, SITE 1169 12
Pliocene
The uppermost planktonic foraminifer zone of the Pliocene (Globoro-talia inflata Zone; SN13) was not recognized in Hole 1169A. Therefore,the G. inflata Zone is either present within a highly condensed intervalbetween 15.04 and 27.90 mbsf or absent altogether. Samples 189-1169A-3H-CC through 6H-CC contain Globorotalia puncticulata withouteither G. inflata or Globorotalia pliozea, indicative of Subzone SN12b.This subzone, the G. puncticulata Subzone, is highly expanded in Hole1169A, spanning the interval bounded by Samples 189-1169A-3H-CCand 21H-CC, roughly 130 m of section. Between Sections 189-1169A-7H-CC and 21H-CC, samples contain a typical Subzone SN12b assem-blage, but many specimens of G. inflata are present in most of the as-semblages, indicating contamination from above. In general,planktonic foraminifers are abundant and well preserved throughoutthis interval.
Sample 189-1169A-22X-CC yielded diminutive specimens ascribed toG. pliozea, indicating Subzone SN12a. The absence of G. pliozea in Sam-ple 189-1169A-21H-CC and its presence in Sample 22X-CC restricts theLO of this taxon (4.6 Ma) to between 198.19 and 202.06 mbsf. Plank-tonic foraminifers are common within Sample 189-1169A-22X-CC butare unusually small. Preservation within the G. pliozea Subzone is vari-able with many specimens exhibiting differing degrees of dissolutionand abrasion.
Middle Miocene
Sample 189-1169A-22X-CC, which is assigned to the lower Pliocene,is underlain by sediments in Sample 189-1169A-23X-CC that containspecimens of Paragloborotalia mayeri, indicating an age of middle Mio-cene (Zone SN7). The presence of P. mayeri indicates a minimum age of11.4 Ma for Sample 189-1169A-23X-CC. Thus, a significant strati-graphic gap (~6.8 m.y.) is inferred between Samples 189-1169A-22X-CCand 23X-CC. Preservation in Sample 189-1169A-23X-CC is good withabundant planktonic foraminifers.
Mixed Assemblages of Indeterminant Age
Sample 189-1169A-24X-CC contains a mixed assemblage; however,the presence of Paragloborotalia continuosa restricts the age to a mini-mum of Zone SN9 (8.0 Ma). Given its stratigraphic position, Sample189-1169A-24X-CC should be relatively older than Sample 189-1169A-23X-CC, yet the age of this mixed assemblage remains equivocal. It issuspected that another hiatus separates Samples 189-1169A-23X-CCand 24X-CC.
Sample 189-1169A-25X-CC contains an enigmatic assemblage char-acteristic of the Pleistocene, consisting only of small specimens of G.quinqueloba and G. glutinata. Assemblages contained within Sample189-1169A-26X-CC also consist of upsection contaminants. These twolowermost samples are assigned a general Neogene age. Preservationthroughout this part of the record varies from good (Section 189-1169A-25X-CC) to poor (Section 189-1169A-26X-CC) with planktonicforaminifers being common. Age-significant events are summarized inTable T5. T5. Planktonic foraminifer datum
levels, Hole 1169A, p. 52.

SHIPBOARD SCIENTIFIC PARTYCHAPTER 4, SITE 1169 13
Benthic Foraminifers, Ostracodes, and Bolboforma
Benthic foraminifers are generally well preserved, highly diverse, andabundant at this site (Fig. F6). Faunal assemblages suggest a paleodepthof 2000–4000 m (abyssal). Sample 189-1169A-1H-CC contains the low-oxygen indicator Chilostomella oolina. Deposition under moderate- towell-oxygenated bottom-water conditions is inferred from Samples 189-1169A-2H-CC through 23X-CC. The presence of Melonis barleeanus andMelonis pompilioides suggests a high flux of organic carbon in these sam-ples. Samples 189-1169A-24X-CC through 26X-CC lack M. barleeanusand M. pompilioides, suggesting a lower flux of organic carbon in this in-terval. The transition from samples containing Melonis spp. to thosewhich do not contain Melonis spp. coincides with the middle/upperMiocene hiatus/condensed interval (see Figs. F4, F6).
Other microfossils recorded include ostracodes, which are presentthroughout the drilled section. Their carapaces are mostly disarticu-lated, suggesting some degree of water turbulence. Additionally, bolbo-formids are present in Hole 1169A. Bolboforma aculeata is identified inSamples 189-1169A-22X-CC through 26X-CC. This species has a rangefrom the base of Zone N14 to the top of Zone N17 at the Miocene/Pliocene boundary (Spiegler and von Daniels, 1991). Notable is thehigh abundance of bolboformids in Sample 189-1169A-26X-CC.
Radiolarians
Sediments from Hole 1169A contain Pliocene to middle Miocene“non-antarctic” and antarctic radiolarians. Abundant, well-preservedradiolarians were recovered from Samples 189-1169A-1H-CC through17H-CC. Samples 189-1169A-18H-CC through 20H-CC commonly con-tain radiolarians, but with poor preservation. Samples 189-1169A-21H-CC through 25X-CC yield few to common radiolarians, whereas Sam-ple 189-1169A-26X-CC is almost barren of radiolarians.
Samples 189-1169A-1H-CC through 11H-CC yield typical antarcticfaunas. An abrupt faunal change to non-antarctic assemblages is presentbetween Samples 189-1169A-11H-CC and 12H-CC. This fauna lacks orrarely contains species of Antarctissa, Cycladophora, and Spongoplegma.However, previous studies have reported rare to common occurrence ofthese taxa in the subantarctic near the Subtropical Convergence.
Pliocene
Radiolarian evidence suggests that the interval between Samples 189-1169A-1H-CC through 22X-CC should be assigned to the Pliocene.Sample 189-1169A-1H-CC is younger than the LO of Eucyrtidium cal-vertense. This sample is older than 1.9 Ma as indicated by the presenceof E. calvertense. Five events are recognized for age assignment in thePliocene interval (viz., the LO of Pseudocubus vema between Samples189-1169A-4H-CC and 5H-CC (2.4 Ma), the LO of Lampromitra coronatabetween Samples 189-1169A-6H-CC and 7H-CC (3.35 Ma), the FO of P.vema between Samples 189-1169A-7H-CC and 8H-CC (4.5 Ma), the LOof Lychnocanoma grande between Samples 189-1169A-16H-CC and 17H-CC (5.0 Ma), and the LO of Dictyophimus splendens between Samples189-1169A-21H-CC and 22X-CC (5.2 Ma). Samples 189-1169A-1H-CCthrough 4H-CC are correlated to the E. calvertense Zone, Samples 189-1169A-5H-CC through 7H-CC to the Upsilon Zone, and Samples 189-1169A-8H-CC through 11H-CC to the Tau Zone, respectively. The inter-
Dep
th (
mbs
f)
0
50
100
150
200
abyssal(~2000–4000 m)
= moderate organic carbon flux,moderate to well-oxygenated
Melonis spp. + Globocassidulina spp.= moderate to high organic carbonflux, moderate to well-oxygenated
Melonis spp. + Chilostomella spp.= high organic carbon flux and low oxygenation
good
Paleodepth Benthic foraminiferalassemblages
Pre
serv
atio
n
1.78cm/k.y.
23.4cm/k.y.
10.9cm/k.y.
?cm/k.y.
Pleistocene
latePliocene
earlyPliocene
lateMiocene
middleMiocene
Age
Sed
imen
tatio
nra
te
Cor
eR
ecov
ery
1H2H3H4H5H6H7H8H9H10H11H12H13H14H15H16H17H18H19H20H21H22X23X24X25X26XTD 246.3 mbsf
F6. Paleodepth and interpretation of bottom-water conditions, based on benthic foraminiferal assem-blages, p. 33.
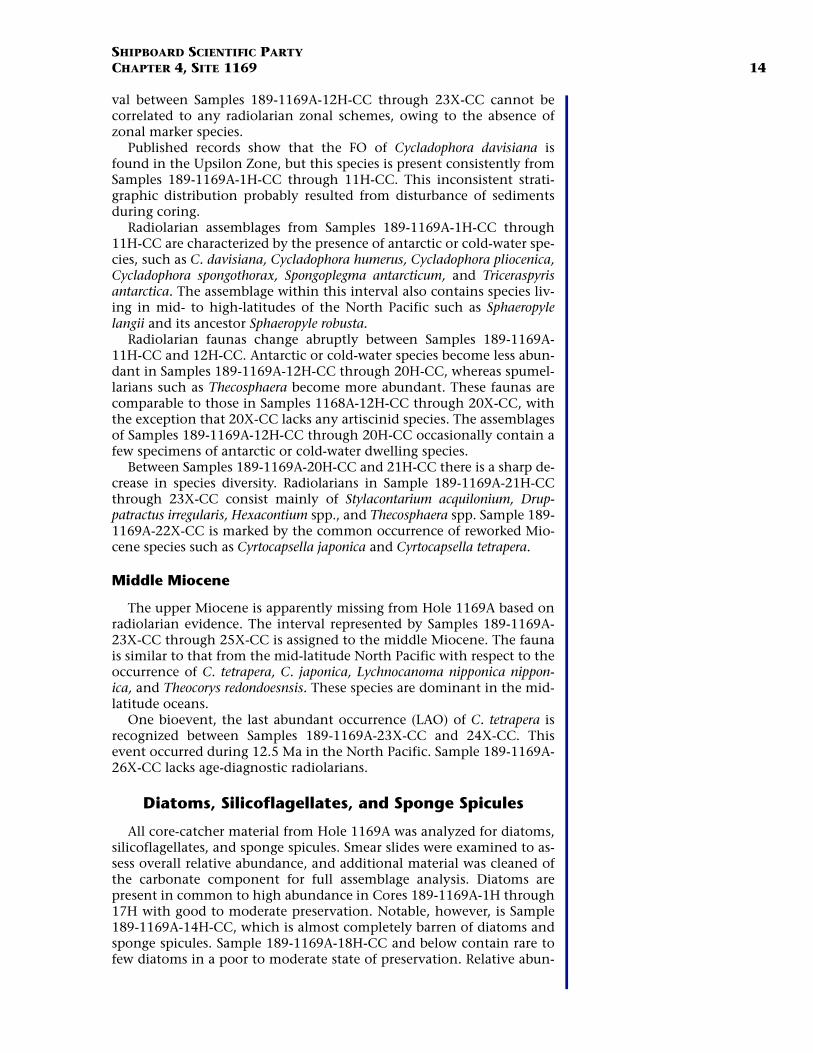
SHIPBOARD SCIENTIFIC PARTYCHAPTER 4, SITE 1169 14
val between Samples 189-1169A-12H-CC through 23X-CC cannot becorrelated to any radiolarian zonal schemes, owing to the absence ofzonal marker species.
Published records show that the FO of Cycladophora davisiana isfound in the Upsilon Zone, but this species is present consistently fromSamples 189-1169A-1H-CC through 11H-CC. This inconsistent strati-graphic distribution probably resulted from disturbance of sedimentsduring coring.
Radiolarian assemblages from Samples 189-1169A-1H-CC through11H-CC are characterized by the presence of antarctic or cold-water spe-cies, such as C. davisiana, Cycladophora humerus, Cycladophora pliocenica,Cycladophora spongothorax, Spongoplegma antarcticum, and Triceraspyrisantarctica. The assemblage within this interval also contains species liv-ing in mid- to high-latitudes of the North Pacific such as Sphaeropylelangii and its ancestor Sphaeropyle robusta.
Radiolarian faunas change abruptly between Samples 189-1169A-11H-CC and 12H-CC. Antarctic or cold-water species become less abun-dant in Samples 189-1169A-12H-CC through 20H-CC, whereas spumel-larians such as Thecosphaera become more abundant. These faunas arecomparable to those in Samples 1168A-12H-CC through 20X-CC, withthe exception that 20X-CC lacks any artiscinid species. The assemblagesof Samples 189-1169A-12H-CC through 20H-CC occasionally contain afew specimens of antarctic or cold-water dwelling species.
Between Samples 189-1169A-20H-CC and 21H-CC there is a sharp de-crease in species diversity. Radiolarians in Sample 189-1169A-21H-CCthrough 23X-CC consist mainly of Stylacontarium acquilonium, Drup-patractus irregularis, Hexacontium spp., and Thecosphaera spp. Sample 189-1169A-22X-CC is marked by the common occurrence of reworked Mio-cene species such as Cyrtocapsella japonica and Cyrtocapsella tetrapera.
Middle Miocene
The upper Miocene is apparently missing from Hole 1169A based onradiolarian evidence. The interval represented by Samples 189-1169A-23X-CC through 25X-CC is assigned to the middle Miocene. The faunais similar to that from the mid-latitude North Pacific with respect to theoccurrence of C. tetrapera, C. japonica, Lychnocanoma nipponica nippon-ica, and Theocorys redondoesnsis. These species are dominant in the mid-latitude oceans.
One bioevent, the last abundant occurrence (LAO) of C. tetrapera isrecognized between Samples 189-1169A-23X-CC and 24X-CC. Thisevent occurred during 12.5 Ma in the North Pacific. Sample 189-1169A-26X-CC lacks age-diagnostic radiolarians.
Diatoms, Silicoflagellates, and Sponge Spicules
All core-catcher material from Hole 1169A was analyzed for diatoms,silicoflagellates, and sponge spicules. Smear slides were examined to as-sess overall relative abundance, and additional material was cleaned ofthe carbonate component for full assemblage analysis. Diatoms arepresent in common to high abundance in Cores 189-1169A-1H through17H with good to moderate preservation. Notable, however, is Sample189-1169A-14H-CC, which is almost completely barren of diatoms andsponge spicules. Sample 189-1169A-18H-CC and below contain rare tofew diatoms in a poor to moderate state of preservation. Relative abun-

SHIPBOARD SCIENTIFIC PARTYCHAPTER 4, SITE 1169 15
dance data for diatoms, sponge spicules, and silicoflagellates are pre-sented in Table T6.
Most biostratigraphic diatom markers (see “Biostratigraphy,” p. 9,in the “Explanatory Notes” chapter) are not present in core-catcher ma-terial from Hole 1169A. Some reworking is evident, notably in Sample189-1169A-24X-CC, where upper Oligocene to lower Miocene materialis inferred to be reworked into middle Miocene sediments by the com-mon presence of the well-preserved late Oligocene to early Miocenemarker Rocella gelida var. gelida and the variety schraderi. No other sam-ples contain these taxa. Robust diatom Actinocyclus ingens var. nodusmay also be reworked into Sample 189-1169A-24X-CC.
The LO of Proboscia barboi (1.8 Ma) is confidently placed within Core189-1169A-1H. This defines the youngest bioevent for this site. Simi-larly, the LO of Fragilariopsis weaveri (2.6 Ma) and Fragilariopsis lacrima(2.9 Ma) are positioned between the two upper cores and Cores 189-169A-4H and 5H, respectively. An apparent FO of Fragilariopsis barronii(4.44 Ma) is encountered between Cores 189-1169A-6H and 7H, butthis event is discarded from the final age model for reasons explainedabove. The LO of A. fryxellae (6.7 Ma) is present between Cores 189-1169A-20H and 21H. This robust taxon is observed in trace amounts insamples above Core 189-1169A-20H and is assumed to be reworked.The LO of the distinctive middle–late Miocene marker Denticulopsis di-morpha (10.7 Ma) is confidently placed between Cores 189-1169A-23Xand 24X. Diatom datums are presented along with other microfossilevents in Table T7.
Paleoceanographic information is evident from the initial analyses ofdiatom floras at Site 1169. Downhole floristic and diversity changessuggest fluctuations in the dominance of different water masses. Sam-ples 189-1169A-1H-CC through 4H contain a relatively diverse, mixedflora of temperate-warm taxa (e.g., Hemidiscus cuneiformis) and endemicsubantarctic-antarctic taxa (e.g., Thalassiosira lentiginosa). Samples 189-1169A-5H-CC and 8H-CC contain a comparatively lower diversity floraof dominantly temperate-warm species, whereas Samples 189-1169A-7H-CC and 13H-CC contain dominantly subantarctic-antarctic taxa.The remaining samples contain a mixed flora (viz., Samples 189-1169A-1H-CC through 4H; see above). Noteworthy, however, is the distinctivechange from Samples 189-1169A-8H-CC (temperate-warm signal) to7H-CC (subantarctic-antarctic signal) occurring at (inferred) 4.0 Ma inthe late early Pliocene. Such changes may herald meridional shifts inthe position of the Subtropical Convergence. Radiolarian and dinocystassemblage changes observed at this site (see “Radiolarians,” p. 13, and“Palynology,” p. 15) also imply surface-water variations over this site.
Palynology
Onboard palynological analysis included approximately half of thecore-catcher samples taken from Hole 1169A. Recovery of palynomor-phs was good down to Sample 189-1169A-9H-CC, assigned to the earli-est Pliocene on nannofossil evidence. Unfortunately, below thishorizon, samples are barren or palynomorphs (notably dinoflagellatecysts) are present only in trace amounts. Such occurrences are consid-ered the result of downhole contamination. Dinoflagellate cysts (di-nocysts) are the most abundant palynomorphs in Hole 1169A; theseoccurrences represent the southernmost late Neogene dinocyst recordever found. Foraminifer organic linings and sporomorphs are the other
T6. Relative abundance of selected diatom taxa, sponge spicules, and silicoflagellates, Hole 1169A, p. 53.
T7. Combined bioevents used for age model, Hole 1169A, p. 54.

SHIPBOARD SCIENTIFIC PARTYCHAPTER 4, SITE 1169 16
quantitatively important categories of palynomorphs present in Hole1169A (Table T8).
Middle Pleistocene to upper Pliocene Samples 189-1169A-1H-CC and4H-CC yield relatively well-diversified dinocyst assemblages. Mostabundant are taxa indicative of relatively warm, oligotrophic watermasses. Also common are species that suggest the influence of dis-tinctly colder and more eutrophic water masses. The latter include taxaendemic to the Antarctic region such as Dalella chathamense and Sele-nopemphix antarctica. In these “mixed” assemblages, cysts of presumedheterotrophic dinoflagellates (e.g., of Protoperidinium spp.) are also rela-tively common. Their occurrence may also be caused by the occasionalpresence of nutrient-rich surface waters, possibly associated with the“cold portion” of the assemblage. The mixed assemblages may indicateshifts of the position of the Subtropical Convergence (see “Diatoms,Silicoflagellates, and Sponge Spicules,” p. 14).
The underlying lower Pliocene Samples 189-1169A-5H-CC and 9H-C,in contrast, yield poorly diversified dinocyst assemblages generally in-dicative of warm oligotrophic surface waters. Only in Sample 189-1169A-9H-CC can some indication of the influence of colder watermasses be found in the occurrences of the arctic species Impagidiniumpallidum and the cold-temperate Corrudinium harlandii. The range top ofInvertocysta tabulata (2.65 Ma) between Samples 189-1169A-5H-CC and9H-CC may assist the age assessment of Hole 1169A (Table T9; Fig. F4).
Below Sample 189-1169A-9H-CC, available core-catcher samples arebarren or yield a few dinocysts (usually Nematosphaeropsis labyrinthea,Impagidinium aculeatum, and/or Impagidinium paradoxum) that are quiteabundant in the overlying interval. These taxa are stratigraphically longranging and may be present in situ through to early Miocene age oreven older sediments. However, given the problems with core recoveryat Site 1169, these occurrences are considered a result of downhole con-tamination, rather than being in place.
Age Model and Sedimentation Rates
Because of the caving throughout the majority of Cores 189-1169A-1H to 21H, FO datums can not be placed with any confidence, thereforeonly the LO bioevents have been used in the final biostratigraphic as-sessment of Site 1169. These events total 19 and are presented in TableT7.
The age-depth curve is presented in Figure F4. The curve is refined byfour paleomagnetic events in the Pliocene–Pleistocene (see “Paleomag-netism,” p. 17). Ages may be in error by as much as 1 m.y. at the base ofHole 1169A because of the lack of biostratigraphic data for the bottomthree cores. Two hiatuses are inferred—one spanning the interval of12.5–6.9 Ma (defined by the LAO of C. tetrapera and the LO of A. delica-tus, respectively) and a second spanning the interval of 6.7–4.6 Ma(defined by the LO of A. fryxellae and G. pliozea, respectively). Unfortu-nately, the Miocene/Pliocene boundary falls within the younger hiatus.A short period of sedimentation (200 k.y.) at a rate of 10.9 cm/k.y. is in-ferred between the two periods of net nondeposition. Unfortunately, nodefinitive biostratigraphic information was recovered for Cores 189-1169A-8H through 16H. The age-depth model is most sketchy for thisinterval and should be regarded as such. However, one interpretationsuggests a significant increase of nannoplankton production based onan apparently rapid (600 k.y.) and elevated sedimentation rate (23.4cm/k.y.) in the lower Pliocene (4.6–4.0 Ma) following the younger hia-
T8. Distribution of organic walled dinocysts and percentage of sporo-morph and foraminifer linings, Hole 1169A, p. 55.
T9. Selected age-diagnostic di-nocyst event, Hole 1169A, p. 56.

SHIPBOARD SCIENTIFIC PARTYCHAPTER 4, SITE 1169 17
tus. Increased calcareous nannoplankton production resulting in ele-vated sedimentation rates is observed in the lower Pliocene in tropicaland temperate locations (Kennett and Von der Borch, 1986; Nelson,1986); however, this phenomenon is recorded in the subantarctic forthe first time. The average sedimentation rate in the upper Pliocene andPleistocene falls to just 1.78 cm/k.y. The moderate amount of scatter inthe bioevents during this period (Fig. F4) created problems for delineat-ing an average sedimentation rate for this period. The curve, which isdefined by the paleomagnetic events, conveniently approximates to anaverage through the scatter. It is stressed again that the age-depthmodel should be regarded with caution for intervals where the core isdisturbed (see “Lithostratigraphy,” p. 6).
PALEOMAGNETISM
Introduction
After alternating-field (AF) demagnetization to 20 mT, the natural re-manent magnetization (NRM) of whole-round sections from Hole1169A was measured at 5-cm intervals using the pass-through cryo-genic magnetometer. An exception was made for cores whose linerswere deformed, to avoid possible damage to the magnetometer. Thesedeformed sections were measured as archive-half cores. The nonmag-netic core barrel assembly was used for odd-numbered cores, startingwith Core 3H. The comparison between results from cores collectedwith the nonmagnetic corer and those from the standard corer is dis-cussed in the “Appendix” chapter as are results of experiments investi-gating the effect of core splitting on magnetization and other coring-related magnetic experiments. The Tensor tool was used to orient theAPC cores beginning with the third core at each hole, but the variabil-ity in the declination values of the cores from Hole 1169A precludedthe orientation of cores.
Discrete oriented samples were routinely collected from Hole 1169A;two samples were taken from each working-half core. These sampleswere used to aid in the interpretation of the long-core record of magne-tization by providing additional measurements of polarity and basicmagnetic characterization. Most of them were demagnetized at 5, 10,15, 20, 30, 40, and 50 mT to permit principal component analysis. Forrock magnetic characterization, anhysteretic remanent magnetization(ARM) was induced in 0.2-DC and 200-mT AC fields and isothermal re-manent magnetization (IRM) in a DC field of 1 T. Some discrete sampleswere progressively saturated up to 1.3 T to study the hardness of theIRM.
Results
Long-Core Measurements
The long-core measurements were predominantly normal (Fig. F7)throughout the hole, which reflected the ubiquitous flow-in distur-bance of the hole. The affected cores exhibit extreme deformation, withfeatures extended in the upcore direction (see “Lithostratigraphy,”p. 6). The associated magnetization appears to be consistently upward.The sediment must therefore be remagnetized in the upward directionby the present field and then oversteepened so that the behavior is not
C1n
C2n
C1r.1r
0.780
19.2
3.5
6.0
40.6
25.2
Gauss
Olduvai
Jaramillo
Brunhes
Matuyama
Inclination (°) Intensity (mA/m)
-90 0 90
10-6 10-4 10-2 100
0
10
20
30
40
50
C1r.1n
C1r.2r
C2n
C2r
C2An.1
?
0.990
1.770
?
2.581
Depth(mbsf)
early
Ple
isto
cene
late
Plio
cene
Dep
th (
mbs
f)
Normal polarity Reverse polarity No recovery Disturbed sediment
Epoch Age(Ma)
Polarity
F7. Long-core results showing lim-ited magnetostratigraphy for the late Pliocene and early Pleistocene, p. 34.

SHIPBOARD SCIENTIFIC PARTYCHAPTER 4, SITE 1169 18
entirely passive, as in the passive markers of structural geology. The ex-treme upward inclination caused by the deformation serves as a usefulmarker of sediment plastic deformation.
Many core section extremities presented an anomalous reversal of in-clination and intensity increase, part of which appears to record mag-netic contamination during section cutting and capping. The strongremagnetization in the normal direction was helpful in the identifica-tion of contamination. It appeared important in carbonate sedimentsmarked by a weak intensity on the order of 10–4 or 10–5 A/m. For the re-maining sites of Leg 189, where weak intensities are also expected, thiseffect will have to be taken into consideration in evaluating the reliabil-ity of apparent short reversal chrons at the ends of sections.
Sequences of poorly recorded reversals appeared in the upper part ofHole 1169A, where no flow-in was observed (Fig. F7). With the help ofbiostratigraphic datums (see “Biostratigraphy,” p. 9), these reversalswere identified as being the onset of Brunhes Chron (C1n) at 3.5 mbsf,the termination of Jaramillo Subchron (C1r.1n) at 6 mbsf, the OlduvaiSubchron (C2n) between 19.2 and 25.2 mbsf, and the termination ofSubchron C2An.1r at 40.6 mbsf.
Discrete Samples
Most of the progressive demagnetization carried out on discrete sam-ples did not permit identification of reliable paleodirections of the mag-netic field. The NRM, ARM, and IRM values and NRM:IRM ratio suggesta detrital origin of the magnetic signal (Fig. F8). Among these cores,Core 189-1169A-22X was marked by a microtektites layer (see “Litho-stratigraphy,” p. 6). Rock magnetic analysis on discrete samples takenfrom Core 189-1169A-22X confirmed this observation. The ratio ofARM:IRM is high, indicating that the magnetic signal is principally car-ried by fine particles. The sediment containing the microtektites has ac-quired a stable magnetization (Fig. F8), that is considerably strongerthan other sediments. The presence of microtektites, revealed by thisrelatively strong intensity, is apparent between 198.5 and 212.2 mbsf.This suggests that the microtektites were initially magnetized and havebeen magnetically oriented in the past field direction. Microscope ob-servations showed spherical microtektites ~200 µm in diameter. Theparticles are likely to carry a thermoremanent magnetization acquiredduring initial cooling that is evidently strong enough to orient them inthe water column and in the final sediment.
Magnetostratigraphy
A reliable magnetostratigraphy could not be established at this sitebecause of the extreme sediment deformation (Fig. F7). The few chronsrecognized in the upper part of Hole 1169A (Fig. F8) were dependentupon biostratigraphic tie points (Table T10). Reversed magnetizationsare observable at the ends of some sections. But, we did not interpretthem because of the sensitivity of these weakly magnetized carbonatesto magnetic contamination, which appears to be concentrated at theend of cores. Discrete-sample demagnetization revealed a poor mag-netic record, so that even in the absence of the deformation, it wouldprobably have proved difficult to obtain a good magnetostratigraphy.
10-5
10-4
10-3
10-2
10-1
0 50 100 150 200
Interval 189-1169A-15H-6, 77–79 cm
NRM ARMIRM IRM acquisition
Rem
anen
t mag
netiz
atio
n (
A/m
)
10-4
10-3
10-2
10-1
100
101
0 50 100 150 200
Interval 189-1169A-22X-1, 50–52 cm
Rem
anen
t mag
netiz
atio
n in
tens
ity (
A/m
)
Field (mT)
F8. Magnetic characteristics for two samples, p. 35.
T10. Magnetostratigraphic results, p. 57.

SHIPBOARD SCIENTIFIC PARTYCHAPTER 4, SITE 1169 19
ORGANIC GEOCHEMISTRY
The shipboard organic geochemistry program at Site 1169 includedstudies of volatile hydrocarbons, total nitrogen, and total organic andinorganic carbon. CNS analysis, gas chromatography, and carbon cou-lometry were performed (see “Organic Geochemistry,” p. 20, in the“Explanatory Notes” chapter). Sample spacing varied because of thecore disturbance during drilling; therefore, a lower resolution geochem-ical record was produced here compared to Site 1168.
Sedimentary Geochemistry
Results
Carbonate (CaCO3) content values for the strata sampled at Site 1169range from 60 to 95 wt% (Fig. F9; Table T11). In general, the profile ex-hibits an overall slightly decreasing upward trend. Sediments from ~250to ~170 mbsf commonly contain >90 wt% CaCO3, except for one hori-zon with a value of ~85 wt%. An abrupt decrease to ~60 wt% is observ-able at ~135 mbsf. From this horizon, carbonate content values fluctu-ate between ~80 and 90 wt%.
The total organic carbon (TOC) content for most samples from Site1169 is <0.7 wt%, except for one sample at ~200 mbsf that contains>1.3 wt% TOC (Fig. F9; Table T11). Organic matter type was assessed us-ing C and N analyses (Fig. F9; Table T11); C/N ratios of ~5–8 are gener-ally considered as indicative of marine organic matter, whereas ratios of~25–35 suggest the presence of terrestrially derived organic matter (Bor-dovskiy, 1965; Emerson and Hedges, 1988). Total nitrogen contentthrough the core is generally low, so C/N ratios must be consideredwith care.
Discussion
The high carbonate content of sediments at Site 1169 reflects a dom-inance of calcareous nannoplankton and foraminifers (see “Biostratig-raphy,” p. 9). The extremely high carbonate content may represent en-hanced carbonate preservation, perhaps indicating relatively highbiogenic productivity. This observation is similar to one made for mid-dle Miocene through Quaternary sediments at Site 1168. Of note is thecarbonate decline at ~135 mbsf. Several distinct carbonate declines arevisible between ~100 and 200 mbsf at Site 1168 (see Fig. F27, p. 87, inthe “Site 1168” chapter), so these horizons with relatively low carbon-ate content may represent regionally correlatable horizons.
The generally low TOC contents in this sequence seem to record set-tling of organic matter through a well-mixed water column and/or to awell-oxygenated seafloor. The TOC content profile here is similar to theTOC content distribution at Site 1168, even considering the lower reso-lution sampling at Site 1169. Of particular interest are the TOC contentvariations between ~100 and 200 mbsf (Fig. F9), which are similar tovariations observed between ~60 and 160 mbsf in Hole 1168A (see Fig.F27, p. 87, in the “Site 1168” chapter). These peaks may represent simi-larities in organic carbon preservation recorded at both sites.
The C/N ratios show a wide range of values from 0 to >100 and co-vary with the TOC content. Some of these apparent variations may bedescribed by the extremely low total nitrogen content of the samples.However, if these values indicate variations in organic matter type, then
CaCO3 (wt%)
Dep
th (
mbs
f)
0 20 40 60 80 100
0.0 0.1
TOC (wt%)
N (wt%)
0 1 20
100
200
C/N
0 10 20 30 40 50 Lith
olog
icsu
buni
ts
IA
IB
F9. Plots of carbonate, total organ-ic carbon, total nitrogen, and C/N ratios, Hole 1169A, p. 36.
T11. Values for inorganic carbon, calcium carbonate, total carbon, total organic carbon, total nitro-gen, and C/N in sediments, Hole 1169A, p. 58.

SHIPBOARD SCIENTIFIC PARTYCHAPTER 4, SITE 1169 20
they may record variations in seafloor redox conditions. Low C/N inter-vals could record preservation of marine-derived organic matter per-haps associated with carbonate producers, or dinoflagellates (see“Biostratigraphy,” p. 9), whereas relatively higher C/N intervals mayrecord organic matter denitrification. Denitrification is usually limitedin marine sediments (Killops and Killops, 1994) and does not generallyoccur until most of the sedimentary organic carbon has been metabo-lized (Mechalas, 1974). Alternatively, the high C/N units may representtotal oxidation of labile-marine organic matter and subsequent preser-vation of minor quantities of refractory terrestrial residuum.
Volatile Hydrocarbons
Results
Concentrations of volatile hydrocarbon gases were measured fromevery core using the standard ODP headspace-sampling technique andgas chromatographic analysis. Methane content (Table T12) was ex-tremely low (0 to <100 ppmv), although it generally increases down-core.
Discussion
The extremely low gas content at Site 1169 is likely a function of twocharacteristics of the sediment. First, the sediments contain little or-ganic matter as a source of natural gas. Second, pore-water profilesshow that appreciable SO4
2– exists to the bottom of Hole 1169A; thus,sulfate reduction processes may be limiting the onset of methanogene-sis in this interval (see “Inorganic Geochemistry,” p. 20).
INORGANIC GEOCHEMISTRY
Shipboard interstitial water (IW) analyses were performed on 15 ofthe 27 whole-round samples taken from Hole 1169A. The balance ofthe samples was archived for shore-based investigations. The whole-round samples were taken at the frequency of three per core in the up-per ~70 mbsf, one per core from 70–100 mbsf, and one every third coreto total depth. All results on IW geochemistry are reported in Table T13and Figures F10, F11, F12, F13, and F14. Although the sediment coreswere heavily disturbed during drilling, the geochemical results on IWexhibit patterns that are comparable to those obtained at Site 1168.
Chloride, Sodium, and Salinity
The conservative parameters salinity (not shown in figure), chloride(Cl–), and sodium (Na+) exhibit very little change within the upper 250mbsf (Fig. F10). Salinity decreases downward to 34 from the near-sea-floor concentration of ~35; maximum dilution relative to seawater isonly 3%. Chloride varies from 556 to 564 mM and exhibits a maximumat ~25–50 mbsf. Sodium ranges between 470 and 488 mM and remainsconservative with respect to Cl–. Within the analytical precision of ship-board instrumentation, the Na+ concentrations show no change withdepth from the normal seawater sodium concentration of 480 mM.
The ~1.4% increase in chloride within the upper ~25–50 mbsf rela-tive to the uppermost sample, which was also observed in Hole 1168,
T12. Headspace gas composition, Hole 1169A, p. 59.
T13. Interstitial water data, Hole 1169A, p. 60.
Cl– (mM)
Na+ (mM)
250
200
150
100
50
0555 560 565
460 470 480
IA
IB
Lith
olog
ic
subu
nitsSW
SW
Dep
th (
mbs
f)
F10. Concentration-depth profiles of Cl– and Na+, p. 37.
SO42– (mM)
250
200
150
100
50
0
Dep
th (
mbs
f)
15 20 25 30
Alkalinity (mM)
IA
IB
0 5 10 Lith
olog
ic
subu
nits
7.2 7.4 7.6
pH
SW SW
F11. Concentration-depth profiles of SO4
2–, pH, and alkalinity, p. 38.
Sr2+ (µM) Li+ (µM)
Lith
olog
ic
subu
nits
250
200
150
100
50
00 500 1000
Dep
th (
mbs
f)
SW0 20 40 60 80 100
IA
IB
SW
10 11 12 13
Ca2+ (mM)SW
F12. Concentration-depth profiles of Sr2+, Ca2+, and Li+, p. 39.
10.0 10.5 11.0 11.5
44 46 48 50 52 54 56
Mg2+ (mM)
K+ (mM)
250
200
150
100
50
0
IA
IB
Lith
olog
icsu
buni
tsSW
SW
Dep
th (
mbs
f)
F13. Concentration-depth profiles of Mg2+ and K+, p. 40.

SHIPBOARD SCIENTIFIC PARTYCHAPTER 4, SITE 1169 21
may be attributed to a salinity increase during the last glacial maximumas proposed by McDuff (1985) and Schrag et al. (1996).
Sulfate, pH, and Alkalinity
Titration alkalinity values from the uppermost pore waters are ~4.0mM and slightly increase to a maximum of 6.8 mM at ~200 mbsf (Fig.F11). The pH decreases from ~7.5 at the top to <7.3 at 30 mbsf and sub-sequently increases to 7.5 between 40–100 mbsf (Fig. F11). From thatdepth downward, the pH continuously decreases to <7.4. Sulfate con-centrations decrease from near-seawater values (26–27 mM) at the topof the hole to a minimum of ~18 mM at ~200 mbsf (~33% decrease),thus never being completely removed (Fig. F11).
The downcore change in sulfate and alkalinity is most likely causedby organic matter remineralization. Interstitial water SO4
2– concentra-tions at Site 1169 do not exhibit the same amount of depletion throughcomparable depths at Site 1168; the degree of sulfate reduction is halfthat observed at Site 1168, although TOC concentrations have compa-rable concentrations. The downcore change in alkalinity is similar atboth holes, although values are generally lower by ~1–2 mM at Site1169.
Strontium, Calcium, and Lithium
Strontium (Sr2+) concentrations gradually increase with depth from~141 µM near the seafloor to ~700 µM at 200 mbsf (Fig. F12). A Sr2+
concentration decline to ~600 µM was observed from 200 mbsf to thebase of the hole. Calcium (Ca2+) concentrations remain near seawatervalues for the upper ~100 mbsf of the hole (Fig. F12). A distinct maxi-mum in Ca2+ concentrations (12.8 mM) exists at ~200 mbsf. Lithium(Li+) concentrations remain relatively constant with depth, varying be-tween 8 and 17 µM in the uppermost ~170 mbsf (Fig. F12). Below, Li+
concentrations steadily increase, reaching 97 µM at ~220 mbsf.The pronounced maximum in Sr2+ concentrations at ~200 mbsf
within the calcareous lithostratigraphic Unit I compares to the Sr2+
maximum at comparable depths in Hole 1168A, although absolute con-centrations are higher in Hole 1168A. Recrystallization of biogenic cal-cite to diagenetic low-Mg calcite and dolomite and/or dissolution ofbiogenic calcite causes a release of dissolved strontium into pore waters(Manheim and Sayles, 1974; Baker et al., 1982). Dissolution and precip-itation reactions were shown to control the Ca2+ profile at Site 1168.The increase in Li+ in the same interval may also be attributed to alter-ation of biogenic carbonate, although the abundance of Li+ in biogeniccarbonates may not be sufficient to account for all the Li+ observedhere. Alternatively, the early diagenesis of biogenic opal-A and ion-exchange reactions involving clay minerals may influence dissolved Li+
concentrations (Gieskes, 1983; DeCarlo, 1992).
Magnesium and Potassium
The downcore magnesium (Mg2+) and potassium (K+) profiles exhibitgradually decreasing concentrations (Fig. F13). Mg2+ concentrations are~54 mM at the top of the hole and decrease by ~20% to ~44 mM at thebase of Hole 1169A. K+ concentrations decrease by ~10% in the hole.The change in concentration of both elements is highly correlated (r =
IA
IB
Lith
olog
ic
subu
nits
250
200
150
100
50
0400 600 800 1000
H4SiO40 (µM)
Dep
th (
mbs
f)
F14. Concentration-depth profile of dissolved silica within intersti-tial water, p. 41.

SHIPBOARD SCIENTIFIC PARTYCHAPTER 4, SITE 1169 22
0.81) and suggests the involvement of similar processes (e.g., basementalteration, ion-exchange reactions associated with clay minerals; seeGieskes, 1983; De Carlo, 1992).
Silica
Dissolved silica concentrations (H4SiO40) range from ~600 to 950 µM
and exhibit a near-continuous increasing downward profile (Fig. F14).The highest concentrations (>900 µM) are between ~90 and 190 mbsf.Below this, silica concentrations decrease to ~800 µM.
Although dissolved silica concentrations in Hole 1169A are consis-tently higher by ~20%–30% than those observed in Hole 1168A, thedowncore pattern of dissolved silica is similar for the uppermost sedi-ment sections in both cores. In Hole 1168A most silica dissolution oc-curs in sediments rich in biogenic silica and IW-silica concentrationsare a reflection of the opal content of the sediments. In Hole 1169A, weexpect a similar relationship between dissolved silica and biogenic opal.The suspected opal increase in Hole 1169A matches the observationthat carbonate concentrations in Hole 1169A are slightly lower inlithostratigraphic Subunits IA and IB compared to Hole 1168A.
Geochemical Zonation
The pore-water profiles allow us to differentiate the cored intervalinto two geochemical zones. Lithostratigraphic Subunit IA is dividedinto an upper Zone 1 covering the upper ~100 mbsf. This zone containsno gradient in Ca2+ and K+ concentrations, whereas dissolved silica iscontinuously decreasing. Zone 2, from ~100 to ~170 mbsf (the bound-ary between lithostratigraphic Subunits IA and IB), instead showssharply increasing gradients in Ca2+ and K+ concentrations, whereas dis-solved silica reaches a steady state.
PHYSICAL PROPERTIES
The physical properties program at Site 1169 included multisensortrack (MST) and thermal conductivity measurements of whole-roundcores and compressional wave (P-wave) velocity, moisture and density(MAD), and vane shear-strength measurements of split cores. Because ofthe extensive disturbance of the cores and the pervasive flow-in, thequality of sediments recovered is poor and the available physical prop-erties data set is limited.
Multisensor Track
All core sections from Hole 1169A were measured on the MST (formagnetic susceptibility, P-wave velocity, and gamma-ray attenuation[GRA] density) at 2-cm intervals. P-wave velocities were recorded at 2-cm intervals in Hole 1169A to a depth of ~197.9 mbsf. P-wave velocitieswere not recorded in the XCB-cored sections.
The combination of flow-in and high carbonate content of the sedi-ments is reflected in the relatively unvarying downcore magnetic sus-ceptibility profile (Fig. F15A). GRA density values and discrete wet bulk-density data exhibit similar downhole trends (Fig. F15B). The GRA andMAD density data, however, show more variability than the magneticsusceptibility data. Because of the ubiquitous flow-in, it is difficult to
-5 0 5 10 15 200
50
100
150
200
250
Magnetic susceptibility (SI units)
Dep
th (
mbs
f)
A
F15. Magnetic susceptibility, GRA density, and discrete wet bulk den-sity vs. depth, Hole 1169A, p. 42.

SHIPBOARD SCIENTIFIC PARTYCHAPTER 4, SITE 1169 23
determine whether the downcore variations result from lithologic vari-ation or disturbance. A significant decrease in GRA density at ~200mbsf corresponds to the switch from APC to XCB coring.
GRA values are higher than the discrete density values (Fig. F15B) re-flecting the MST calibration procedure. The calibration procedure forthe MST is optimized for mixed sediments, so the GRA-density mea-surements are overestimated in the carbonate-rich sediments at Site1169.
Velocity
Discrete compressional velocity measurements (PWS1, PWS2, andPWS3) were performed at a sample frequency of one per section, whensections were not characterized completely by flow-in or disturbed sedi-ments (Fig. F16; Table T14). A comparison of the filtered continuousMST velocity profile with the discrete values is shown in Figure F16.PSW3 (x- [across core] direction) velocities are higher than expected forthe sediment type (Fig. F16). The velocity measurements perpendicular(PSW1; z- [along core] direction) and parallel to the bedding (PSW2; y-[perpendicular to the core] direction) are similar, ranging between 1500and 1620 m/s. Although discrete velocity measurements were always at-tempted in less disturbed intervals, data interpretation is difficult be-cause of the high degree of disturbance and presence of flow-inthroughout much of the core.
Vane Shear Strength
Vane shear strength was measured in sections with relatively lowamounts of flow-in and disturbance in Hole 1169A. However, the dataquality is unknown considering the high degree of disturbance. Theshear strength results are displayed in Figure F17 and Table T15. Withthe exception of several high shear-strength values at ~80 mbsf, thedata fluctuate around an average of ~20 kPa.
Thermal Conductivity
Thermal conductivity was measured on Section 3 of Cores 1H–6Hand 14H–18H in Hole 1169A (Fig. F18; Table T16). Thermal conductiv-ity measurements are made before core splitting; therefore, it is impos-sible to assess sediment quality when taking measurements. The dataare limited and of suspect quality because of the highly disturbed sedi-ments and the presence of flow-in.
Moisture and Density
The density data from discrete samples (Fig. F19; Table T17) have astrong first-order correlation with the GRA data (Fig. F15B). MAD sam-ples were chosen only from sections that appeared to display minimaldisturbance or flow-in. However, because flow-in and disturbance wereso prevalent, it is difficult to assess the quality of the data.
1500 1600 1700 1800 1900 20000
50
100
150
200
Along Core (z)Perpendicular to Core (y)Across Core (x)MST
P-wave velocity (m/s)
Dep
th (
mbs
f)
F16. P-wave velocities measured for discrete samples and in whole cores vs. depth, p. 44.
T14. P-wave velocities measured at discrete intervals, Hole 1169A, p. 61.
0 10 20 30 40 50 60 700
50
100
150
200
Shear strength (kPa)
Dep
th (
mbs
f)
F17. Shear strength measured on whole cores vs. depth, Hole 1169A, p. 45.
T15. Undrained shear strength from miniature vane-shear mea-surements, Hole 1169A, p. 62.
F18. Thermal conductivity mea-sured on whole cores vs. depth, p. 46.
0.9 1 1.1 1.2 1.30
50
100
150
Thermal conductivity (W/[m·K])
Dep
th (
mbs
f)
T16. Thermal conductivity mea-sured on whole-core sections, Hole 1169A, p. 63.

SHIPBOARD SCIENTIFIC PARTYCHAPTER 4, SITE 1169 24
1.5 1.7 1.90
50
100
150
200
250
Wet bulk density (g/cm3)
Dep
th (
mbs
f)
30 40 50 60 70
Porosity (%)
20 40 60 80
Water content (dry wt%)
F19. Wet bulk density, water con-tent, and porosity measured at dis-crete intervals vs. depth, Hole 1169A, p. 47.
T17. Index properties measured at discrete intervals, Hole 1169A, p. 64.

SHIPBOARD SCIENTIFIC PARTYCHAPTER 4, SITE 1169 25
REFERENCES
Baker, P.A., Gieskes, J.M., and Elderfield, H., 1982. Diagenesis of carbonates in deep-sea sediments: evidence from Sr2+/Ca2+ ratios and interstitial dissolved Sr2+ data. J.Sediment. Petrol., 52:71–82.
Barrows, T.T., Juggins, S., DeDeckker, P., Thiede, J., and Martinez, J.I., 2000. Sea-sur-face temperatures of the southwest Pacific Ocean during the Last Glacial Maxi-mum. Paleoceanography, 15:95–109.
Berggren, W.A., Kent, D.V., Swisher, C.C., III, and Aubry, M.-P., 1995. A revised Ceno-zoic geochronology and chronostratigraphy. In Berggren, W.A., Kent, D.V., Aubry,M.-P., and Hardenbol, J. (Eds.), Geochronology, Time Scales and Global StratigraphicCorrelation. Spec. Publ.—Soc. Econ. Paleontol. Mineral. (Soc. Sediment. Geol.),54:129–212.
Bordovskiy, O.K., 1965. Accumulation and transformation of organic substances inmarine sediment, 2. Sources of organic matter in marine basins. Mar. Geol., 3:5–31.
Boyle, E.A., and Keigwin, L.D., 1985. Comparison of Atlantic and Pacific paleochemi-cal records for the last 215,000 years: changes in deep-ocean circulation and chem-ical inventories. Earth Planet. Sci. Lett., 76:135–150.
Broecker, W.S., Peng, T.H., and Engh, R., 1980. Modeling the carbon system. Radiocar-bon, 22:565–598.
Charles, C.D., Lynch-Stieglitz, J., Ninnemann, U.S., and Fairbanks, R.G., 1996. Cli-mate connections between the hemispheres revealed by deep sea sediment core/icecore correlations. Earth Planet. Sci. Lett., 142:19–27.
De Carlo, E.H., 1992. Geochemistry of pore water and sediments recovered from theExmouth Plateau. In von Rad, U., Haq, B.U., et al., Proc. ODP, Sci. Results, 122: Col-lege Station, TX (Ocean Drilling Program), 295–308.
Emerson, S., and Hedges, J.I., 1988. Processes controlling the organic carbon contentof open ocean sediments. Paleoceanography, 3:621–634.
Exon, N.F., Moore, A.M.G., and Hill, P.J., 1997. Geological framework of the SouthTasman Rise, south of Tasmania, and its sedimentary basins. Aust. J. Earth Sci.,44:561–577.
Flower, B.P., and Kennett, J.P., 1995. Middle Miocene deepwater paleoceanography inthe southwest Pacific: relations with East Antarctic ice sheet development. Pale-oceanography, 10:1095–1112.
Gartner, S., 1992. Miocene nannofossil chronology in the North Atlantic, DSDP Site608. Mar. Micropaleontol., 18:307–331.
Gieskes, J.M., 1983. The chemistry of interstitial waters of deep-sea sediments: inter-pretation of deep-sea drilling data. In Riley, J.P., and Chester, R. (Eds.), ChemicalOceanography (Vol. 8): London (Academic), 221–269.
Heath, R.A., 1985. A review of the physical oceanography of the seas around NewZealand–1982. N. Z. J. Mar. Freshwater Res., 19:70–124.
Howard, W.R., and Prell, W.L., 1992. Late Quaternary surface circulation of the south-ern Indian Ocean and its relationship to orbital variations. Paleoceanography, 7:79–117.
Kennett, J.P., and von der Borch, C.C., 1986. Southwest Pacific Cenozoic paleocean-ography. In Kennett, J.P., von der Borch, C.C., et al., Init. Repts. DSDP, 90 (Pt. 2):Washington (U.S. Govt. Printing Office), 1493–1517.
Killops, S.D., and Killops, V.J., 1994. An Introduction to Organic Geochemistry: Essex(Longman Scientific and Technical).
Manheim, F.T., and Sayles, F.L., 1974. Composition and origin of interstitial waters ofmarine sediments, based on deep sea drill cores. In Goldberg, E.D. (Ed.), The Sea(Vol. 5): Marine Chemistry: The Sedimentary Cycle: New York (Wiley), 527–568.
McDuff, R.E., 1985. The chemistry of interstitial waters, Deep Sea Drilling Project Leg86. In Heath, G.R., Burckle, L.H., et al., Init. Repts. DSDP, 86: Washington (U.S.Govt. Printing Office), 675–687.

SHIPBOARD SCIENTIFIC PARTYCHAPTER 4, SITE 1169 26
Mechalas, B.J., 1974. Pathways and environmental requirements for biogenic gas pro-duction in the ocean. In Kaplan, I.R. (Ed.), Natural Gases in Marine Sediments. Mar.Sci., 3:11–25.
Mortlock, R.A., Charles, C.D., Froelich, P.N., Zibello, M.A., Saltzman, J., Hays, J.D.,and Burckle, L.H., 1991. Evidence for lower productivity in the Antarctic Oceanduring the last glaciation. Nature, 351:220–223.
Nelson, C.S., 1986. Lithostratigraphy of Deep Sea Drilling Project Leg 90 drill sites inthe Southwest Pacific: an overview. In Kennett, J.P., von der Borch, C.C., et al., Init.Repts. DSDP, 90: Washington (U.S. Govt. Printing Office), 1471–1491.
Rintoul, S.R., Donguy, J.R., and Roemmich, D.H., 1997. Seasonal evolution of upperocean thermal structure between Tasmania and Antarctica. Deep-Sea Res., 44:1185–1202.
Schrag, D.P., Hampt, G., and Murray, D.W., 1996. Pore fluid constraints on the tem-perature and oxygen isotopic composition of the glacial ocean. Science, 272:1930–1932.
Shipboard Scientific Party, 1999. Leg 177 summary: Southern Ocean paleoceanogra-phy. In Gersonde, R., Hodell, D.A., Blum, P., et al., Proc. ODP, Init. Repts., 177: Col-lege Station, TX (Ocean Drilling Program), 1–67.
Sikes, E.L., 1995. Southern Ocean paleoceanographic studies: clues for changes inatmospheric CO2 content. In Exon, N.F., et al. (Eds.), AGSO Cruise 147 Report. AGSORecord, 1995/56.
Spiegler, D., and von Daniels, C.H., 1991. A stratigraphic and taxonomic atlas of Bol-boforma (Protophytes, incertae sedis, Tertiary). J. Foraminiferal Res., 21:126–158.
Tchneria, P., 1980. Descriptive Regional Oceanography: New York (Pergamon Press).Williams, G.L., Brinkhuis, H., et al., 1998. Cenozoic dinocyst events. In De Gracian-
ski, et al. (Eds.), Sequence Stratigraphy of European Basins. Spec. Publ.—Soc. Econ.Paleontol. Mineral., 60.
Woodruff, F., and Savin, S.M., 1989. Miocene deepwater oceanography. Paleoceanogra-phy, 4:87–140.

SH
IPB
OA
RD
SC
IEN
TIFIC P
AR
TY
CH
AP
TE
R 4
, SIT
E 11
69
27
Figure roximate depth of penetration. SP = shotpoint.
Two-
way
trav
eltim
e (s
)
NE
SP 10899 10799 10703 SP
7
4
4
5
5
6
6
F1. A portion of seismic line Tasmante 125-04 through Site 1169, including the app
SW 5 km
11399 11299 11199 11099 10999
.0
.0
.5
.0
.5
.0
s125mig125_04
Site1169
.5

SHIPBOARD SCIENTIFIC PARTYCHAPTER 4, SITE 1169 28
Figure F2. Lithostratigraphic summary of Site 1169, western South Tasman Rise. Magnetic susceptibilityand GRA bulk-density profiles are not plotted in this summary figure, the quality of data being question-able because of the coring disturbances. TD = total depth.
Lithology
Uni
tS
ubun
itA
ge
Lightness(L*)
Dep
th (
mbs
f)
0
101H
2H
3H
4H
5H
6H
7H
8H
9H
10H
11H
12H
13H
14H
15H
16H
17H
18H
19H
20H
21H
22X
23X
24X
25X
26X
20
30
40
60
70
80
90
110
120
130
140
160
170
180
190
50
100
150
200
210
220
230
240
TD 246.3 m
Rec
over
y
Cor
e
Hole1169A
TTTTTTTTTTTTTTTTTTTTTTTTTTTTTTTTTTTTTTTTTTTTTTTTTTTTTTTTTTTTTTTTTTTTTTTTTTTTTTTTTTTTTTTTTTTTTTTTTTTTTTTTTTTTTTTTTTTTTTTTTTTTTTTTTTTTTTTTTTTTTTTTTTTTTTTTTTTTTTTTTTTTTTTTTTTTTTTTTTTTTTTTTTTTTTTTTTTTTTTTTTTTTTTTTTTTTTTTTTTTTTTTTTTTTTTTTTTTTTT
TTTTTTTTTTTTTTTTTTTTTTTTTTTTTTTTTTTTTTTTTTTTTTTTTTTTTTTTTTTTTTTTTTTTTTTTTTTTTTTTTTTTTTTTTTTTTTTTTTTTTTTTTTTTTTTTTTTTTTTTTTTTTTTTTTTTTTTTTTTTTTTTTTTTTTTTTTTTTTTTTTTTTTTTTTTTTTTTTTTTTTTTTTTTTTTTTTTTTTTTTTTTTTTTTTTTTTTTTTTTTTTTTTTTTTTTTTTTTTTTTTTTTTTTTTTTTTTTTTTTTTTTTTTTTTTTTTTTTTTTTTTTTTTTTTTTTTTTTTTTTTTTTTTTTTTTTTTTTTTTTTTTTTTTTTTTTTTTTTTTTTTTTTTTTTTTTTTTTTTTTTTTTTTTTTTTTTTT
v
v
v
v
v
v
v
v
v
v
v
vv
v
v
v
v
v
v
v
v
v
v
vv
v
v
v
v
v
v
v
v
v
v
vv
v
v
v
v
v
v
v
v
v
v
vv
v
v
v
v
v
v
v
v
v
v
vv
v
v
v
v
v
v
v
v
v
v
vv
v
v
v
v
v
v
v
v
v
v
vv
v
v
v
v
v
v
v
v
v
v
vv
v
v
v
v
v
v
v
v
v
v
vv
v
v
v
v
v
v
v
v
v
v
vv
v
v
v
v
v
v
v
v
v
v
vv
v
v
v
v
v
v
v
v
v
v
vv
v
v
v
v
v
v
v
v
v
v
vv
v
v
v
v
v
v
v
v
v
v
vv
v
v
v
v
v
v
v
v
v
v
vv
v
v
v
v
v
v
v
v
v
v
vvv
vv
vv
vv
vv
vvv
v
v
v
v
v
v
v
v
v
v
vv
v
v
v
v
v
v
v
v
v
v
vv
v
v
v
v
v
v
v
v
v
v
vv
v
v
v
v
v
v
v
v
v
v
vv
v
v
v
v
v
v
v
v
v
v
vv
v
v
v
v
v
v
v
v
v
v
vv
v
v
v
v
v
v
v
v
v
v
vv
v
v
v
v
v
v
v
v
v
v
vv
v
v
v
v
v
v
v
v
v
v
vv
v
v
v
v
v
v
v
v
v
v
vv
v
v
v
v
v
v
v
v
v
v
vv
v
v
v
v
v
v
v
v
v
v
vv
v
v
v
v
v
v
v
v
v
v
vv
v
v
v
v
v
v
v
v
v
v
vv
v
v
v
v
v
v
v
v
v
v
vv
v
v
v
v
v
v
v
v
v
v
vv
v
v
v
v
v
v
v
v
v
v
vv
v
v
v
v
v
v
v
v
v
v
vv
v
v
v
v
v
v
v
v
v
v
vv
v
v
v
v
v
v
v
v
v
v
vv
v
v
v
v
v
v
v
v
v
v
vv
v
v
v
v
v
v
v
v
v
v
vv
v
v
v
v
v
v
v
v
v
v
vv
v
v
v
v
v
v
v
v
v
v
vv
v
v
v
v
v
v
v
v
v
v
vv
v
v
v
v
v
v
v
v
v
v
vv
v
v
v
v
v
v
v
v
v
v
vv
v
v
v
v
v
v
v
v
v
v
vv
v
v
v
v
v
v
v
v
v
v
vv
v
v
v
v
v
v
v
v
v
v
vv
v
v
v
v
v
v
v
v
v
v
vv
v
v
v
v
v
v
v
v
v
v
vv
v
v
v
v
v
v
v
v
v
v
v
A
B
50 90
Carbonate(wt%)
Ple
isto
cene
I
60 70 80 40 60 80 90
early
Plio
cene
late
Plio
cene
l. M
ioce
nem
. Mio
cene
Sili
ceou
s m
icro
foss
il-be
arin
g na
nnof
ossi
l ooz
eN
anno
foss
il oo
ze
TTTTTTT
TTTTTTT
Nannofossil ooze/chalk
vvvvvvvvvvv
v
v
v
v
v
v
v
v
v
v
v
v
v
v
v
v
v
v
vvvvvvvvvvv
Siliceous fossil-bearing nannofossil ooze

SHIPBOARD SCIENTIFIC PARTYCHAPTER 4, SITE 1169 29
Figure F3. Physical and chemical properties of Site 1169. A. Relative sediment disturbance from 0 (no dis-turbance) to 4 (soupy or vertically deformed). B. Colorimetric coordinate b* by spectrophotometry (blue tonegative and yellow to positive values). C. Calcium carbonate content in weight percent (see “OrganicGeochemistry,” p. 19). D. Relative abundance of siliceous and calcareous microfossils as identified insmear slides, standardized against calcium carbonate content. Nonbiogenic components, such as clays andin situ minerals, are generally in low abundance (~10%) and are not considered in this diagram. TD = totaldepth. (Figure shown on next page.)

SH
IPB
OA
RD
SC
IEN
TIFIC P
AR
TY
CH
AP
TE
R 4
, SIT
E 11
69
30
Figure
Dep
th (
mbs
f)
0
10
20
30
40
60
70
80
90
110
120
130
140
160
170
180
190
50
100
150
200
210
220
230
240
)
0
F3 (continued). (Caption shown on previous page.)C
ore
Rec
over
y
1H
2H
3H
4H
5H
6H
7H
8H
9H
10H
11H
12H
13H
14H
15H
16H
17H
18H
19H
20H
21H
22X
23X
24X
25X
26X
TD 246.3 mbsf
0 2 4
Relativesediment
disturbanceMedium StrongNone
Hole1169A
Subunits Biogenic components (%
Blue
Colorimetric coordinate b*Yellow
-5 0 5 10 15 20
A C
CaCO3 (wt%)
IAIB
50 60 80 90 10070 50 60 80 90 1070
B D
Calcareous
Siliceous
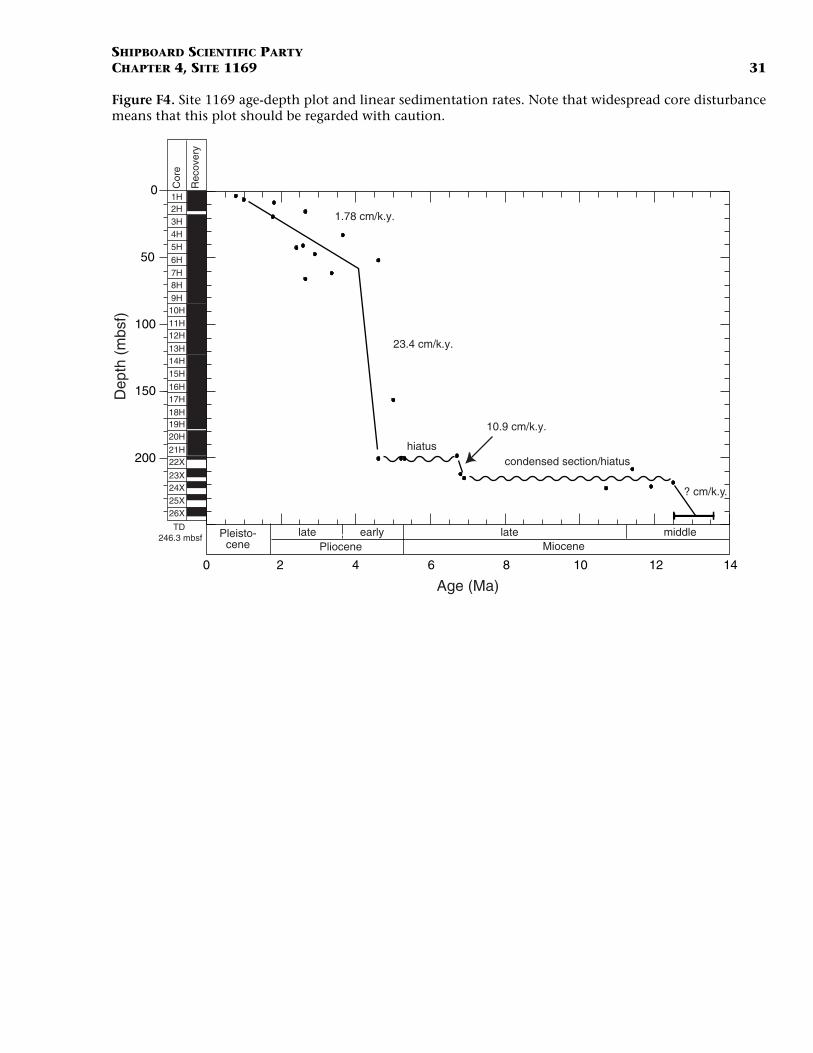
SHIPBOARD SCIENTIFIC PARTYCHAPTER 4, SITE 1169 31
Figure F4. Site 1169 age-depth plot and linear sedimentation rates. Note that widespread core disturbancemeans that this plot should be regarded with caution.
Dep
th (
mbs
f)
0
50
100
150
200
Age (Ma)0 2 4 6 8 10 12 14
Pleisto-cene
late early late middlePliocene Miocene
Cor
e
Rec
over
y1H2H3H4H5H
6H
7H8H
9H10H
11H12H
13H14H
15H
16H17H
18H19H20H
21H22X
23X24X25X26X
TD 246.3 mbsf
10.9 cm/k.y.
condensed section/hiatus
23.4 cm/k.y.
1.78 cm/k.y.
hiatus
? cm/k.y.

SHIPBOARD SCIENTIFIC PARTYCHAPTER 4, SITE 1169 32
Figure F5. Color changes associated with water temperature shift (interval 189-1169A-23X, 110–140 cm).
cm
120
140
130
110
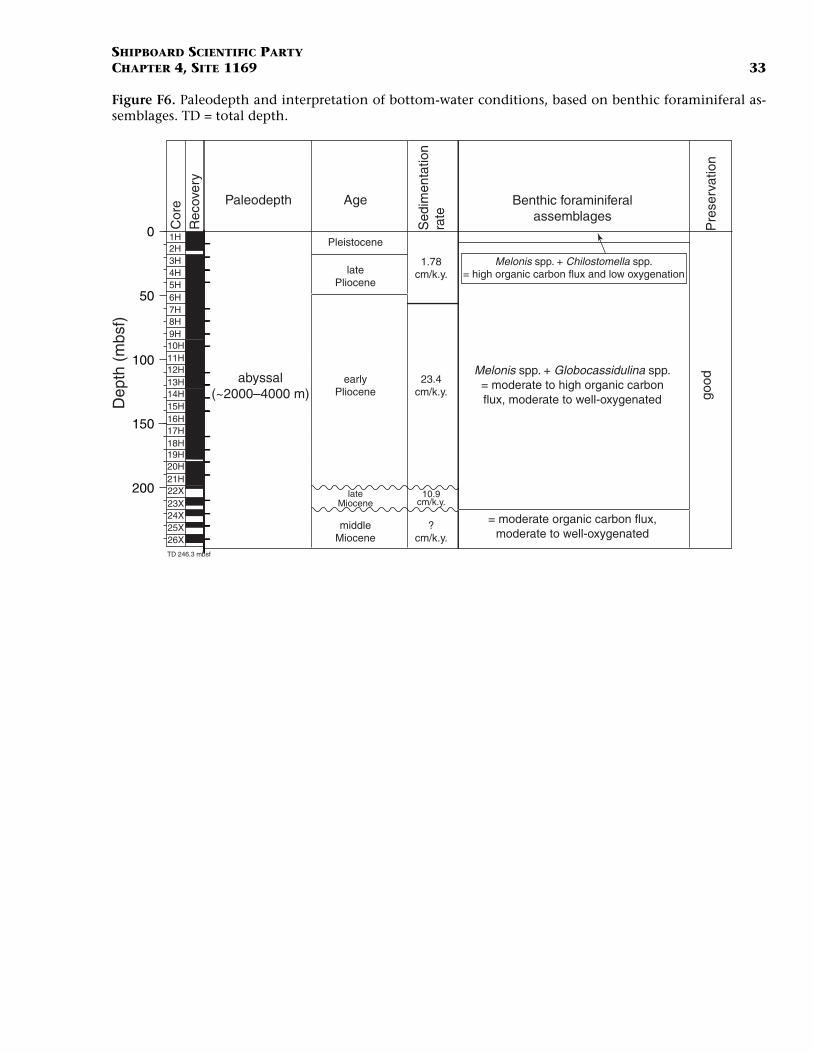
SHIPBOARD SCIENTIFIC PARTYCHAPTER 4, SITE 1169 33
Figure F6. Paleodepth and interpretation of bottom-water conditions, based on benthic foraminiferal as-semblages. TD = total depth.
Dep
th (
mbs
f)
0
50
100
150
200
abyssal(~2000–4000 m)
= moderate organic carbon flux,moderate to well-oxygenated
Melonis spp. + Globocassidulina spp.= moderate to high organic carbonflux, moderate to well-oxygenated
Melonis spp. + Chilostomella spp.= high organic carbon flux and low oxygenation
good
Paleodepth Benthic foraminiferalassemblages
Pre
serv
atio
n
1.78cm/k.y.
23.4cm/k.y.
10.9cm/k.y.
?cm/k.y.
Pleistocene
latePliocene
earlyPliocene
lateMiocene
middleMiocene
Age
Sed
imen
tatio
nra
te
Cor
eR
ecov
ery
1H2H3H4H5H6H7H8H9H10H11H12H13H14H15H16H17H18H19H20H21H22X23X24X25X26XTD 246.3 mbsf

SHIPBOARD SCIENTIFIC PARTYCHAPTER 4, SITE 1169 34
Figure F7. Long-core results showing limited magnetostratigraphy for the late Pliocene and early Pleist-ocene with boundaries in undisturbed core.
C1n
C2n
C1r.1r
0.780
19.2
3.5
6.0
40.6
25.2
Gauss
Olduvai
Jaramillo
Brunhes
Matuyama
Inclination (°) Intensity (mA/m)
-90 0 90
10-6 10-4 10-2 100
0
10
20
30
40
50
C1r.1n
C1r.2r
C2n
C2r
C2An.1
?
0.990
1.770
?
2.581
Depth(mbsf)
early
Ple
isto
cene
late
Plio
cene
Dep
th (
mbs
f)
Normal polarity Reverse polarity No recovery Disturbed sediment
Epoch Age(Ma)
Polarity

SHIPBOARD SCIENTIFIC PARTYCHAPTER 4, SITE 1169 35
Figure F8. Magnetic characteristics for Sample 189-1169A-15H-6, 77–79 cm, and for Sample 22X-1, 50–52cm. The latter sample bears microtektite.
10-5
10-4
10-3
10-2
10-1
0 50 100 150 200
Interval 189-1169A-15H-6, 77–79 cm
NRM ARMIRM IRM acquisition
Rem
anen
t mag
netiz
atio
n (
A/m
)
10-4
10-3
10-2
10-1
100
101
0 50 100 150 200
Interval 189-1169A-22X-1, 50–52 cm
Rem
anen
t mag
netiz
atio
n in
tens
ity (
A/m
)
Field (mT)

SH
IPB
OA
RD
SC
IEN
TIFIC P
AR
TY
CH
AP
TE
R 4
, SIT
E 11
69
36
Figure (TOC), total nitrogen, and C/N ratios for Hole 1169A. Shaded areas on the C/N ratio plot de-lineate r fields. Lithostratigraphic units are indicated on the far right side of the figure.
Dep
th (
mbs
f)
0.0 0.1
TOC (wt%)
N (wt%)
1 20
100
200
C/N
0 10 20 30 40 50 Lith
olog
icsu
buni
ts
IA
IB
F9. Plots of carbonate, total organic carbon typical marine and terrestrial organic matte
CaCO3 (wt%)
0 20 40 60 80 100 0

SHIPBOARD SCIENTIFIC PARTYCHAPTER 4, SITE 1169 37
Figure F10. Concentration-depth profiles of Cl– and Na+ at Site 1169 with approximate location of litho-stratigraphic boundaries (see “Lithostratigraphy,” p. 6). Standard seawater (SW) concentrations are indi-cated.
Cl– (mM)
Na+ (mM)
250
200
150
100
50
0555 560 565
460 470 480
IA
IB
Lith
olog
ic
subu
nitsSW
SW
Dep
th (
mbs
f)

SHIPBOARD SCIENTIFIC PARTYCHAPTER 4, SITE 1169 38
Figure F11. Concentration-depth profiles of SO42–, pH, and alkalinity at Site 1169 with the approximate
location of lithostratigraphic boundaries (see “Lithostratigraphy,” p. 6). Where appropriate, standard sea-water (SW) concentrations are indicated.
SO42– (mM)
250
200
150
100
50
0
Dep
th (
mbs
f)
15 20 25 30
Alkalinity (mM)
IA
IB
0 5 10 Lith
olog
ic
subu
nits
7.2 7.4 7.6
pH
SW SW

SHIPBOARD SCIENTIFIC PARTYCHAPTER 4, SITE 1169 39
Figure F12. Concentration-depth profiles of Sr2+, Ca2+, and Li+ at Site 1169 with approximate location oflithostratigraphic boundaries (see “Lithostratigraphy,” p. 6). Standard seawater (SW) concentrations areindicated.
Sr2+ (µM) Li+ (µM)
Lith
olog
ic
subu
nits
250
200
150
100
50
00 500 1000
Dep
th (
mbs
f)
SW0 20 40 60 80 100
IA
IB
SW
10 11 12 13
Ca2+ (mM)SW
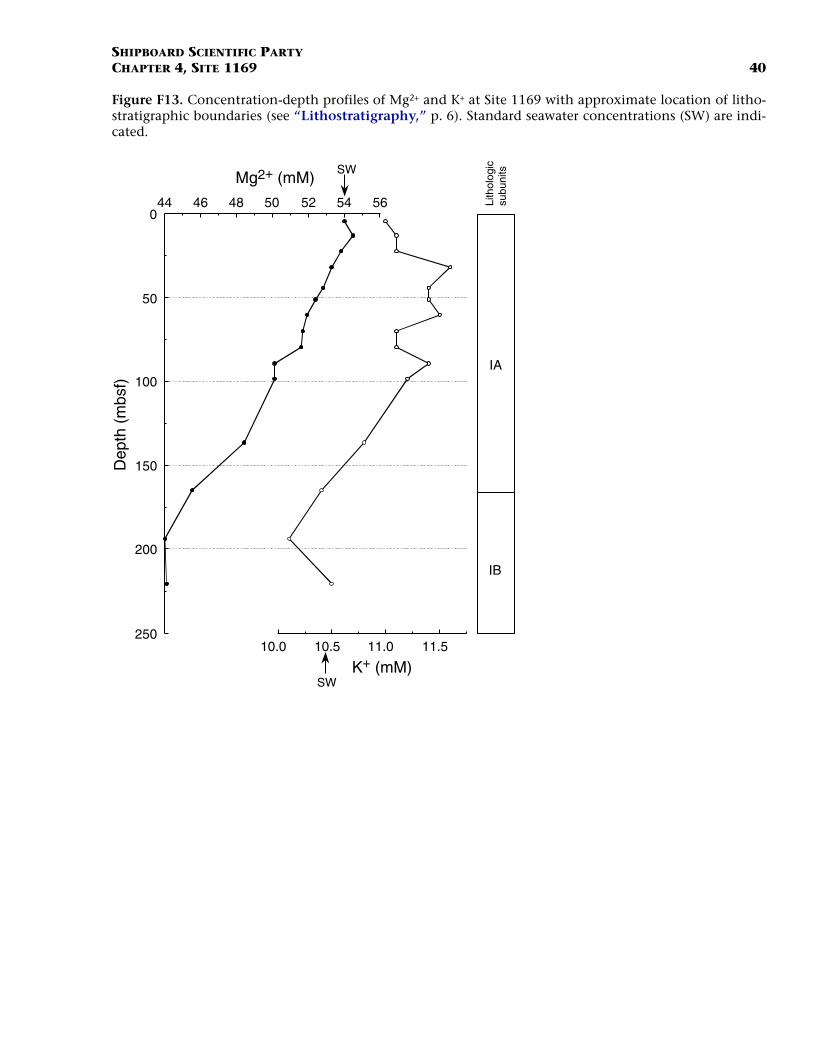
SHIPBOARD SCIENTIFIC PARTYCHAPTER 4, SITE 1169 40
Figure F13. Concentration-depth profiles of Mg2+ and K+ at Site 1169 with approximate location of litho-stratigraphic boundaries (see “Lithostratigraphy,” p. 6). Standard seawater concentrations (SW) are indi-cated.
10.0 10.5 11.0 11.5
44 46 48 50 52 54 56
Mg2+ (mM)
K+ (mM)
250
200
150
100
50
0
IA
IB
Lith
olog
icsu
buni
tsSW
SW
Dep
th (
mbs
f)

SHIPBOARD SCIENTIFIC PARTYCHAPTER 4, SITE 1169 41
Figure F14. Concentration-depth profile of dissolved silica within interstitial water at Site 1169. Lithostrati-graphic boundaries are indicated (see “Lithostratigraphy,” p. 6).
IA
IB
Lith
olog
ic
subu
nits
250
200
150
100
50
0400 600 800 1000
H4SiO40 (µM)
Dep
th (
mbs
f)

SHIPBOARD SCIENTIFIC PARTYCHAPTER 4, SITE 1169 42
Figure F15. A. Magnetic susceptibility measured on whole cores by the MST vs. depth for Hole 1169A.There is little downcore variation in the magnetic susceptibility record, resulting from the high carbonatecontent of the sediments and the influence of flow-in. (Continued on next page.)
-5 0 5 10 15 200
50
100
150
200
250
Magnetic susceptibility (SI units)
Dep
th (
mbs
f)
A

SHIPBOARD SCIENTIFIC PARTYCHAPTER 4, SITE 1169 43
Figure F15 (continued). B. GRA density (open circles) and wet bulk density determined for discrete sam-ples (solid diamonds) vs. depth for Hole 1169A. The two techniques provide similar data; however, becauseof the presence of flow-in and the high degree of disturbance in the cores, variation may be caused by thedisturbance rather than lithologic change.
1 1.5 2 2.50
50
100
150
200
250
GRA and MAD density (g/cm3)
Dep
th (
mbs
f)
B

SHIPBOARD SCIENTIFIC PARTYCHAPTER 4, SITE 1169 44
Figure F16. P-wave velocities (PWS1, PWS2, and PWS3) measured for discrete samples and P-wave velocitiesmeasured in whole cores (MST) vs. depth for Site 1169.
1500 1600 1700 1800 1900 20000
50
100
150
200
Along Core (z)Perpendicular to Core (y)Across Core (x)MST
P-wave velocity (m/s)D
epth
(m
bsf)
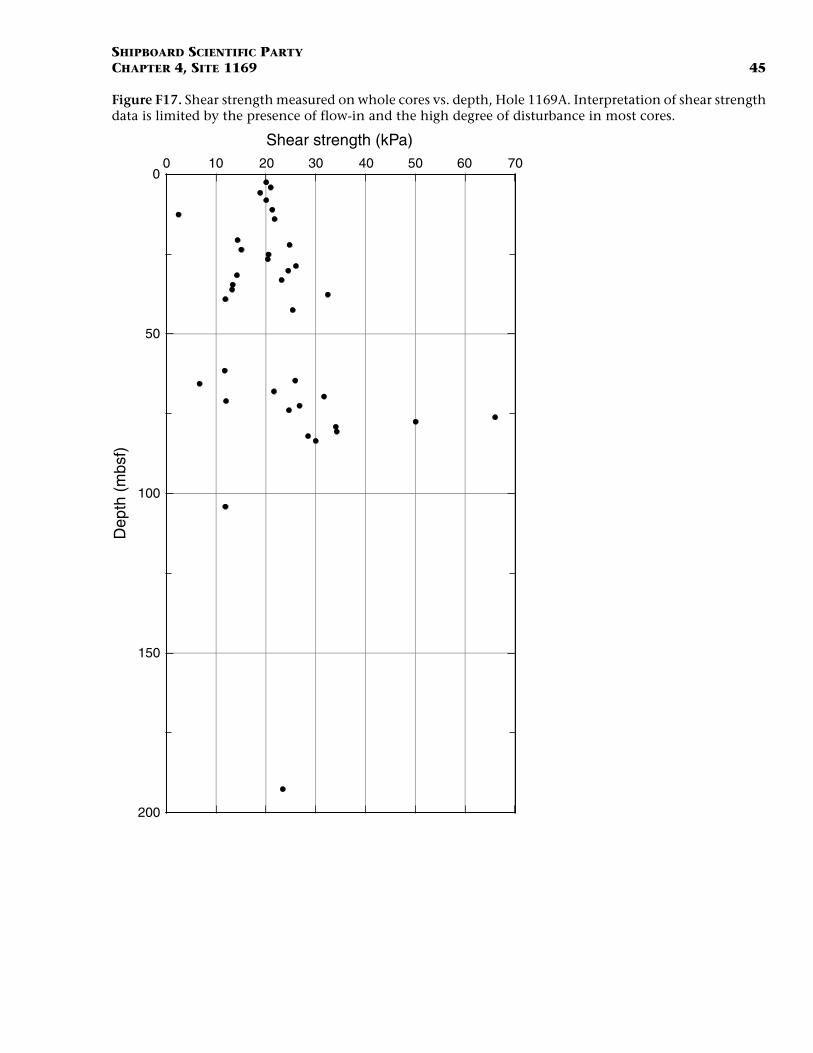
SHIPBOARD SCIENTIFIC PARTYCHAPTER 4, SITE 1169 45
Figure F17. Shear strength measured on whole cores vs. depth, Hole 1169A. Interpretation of shear strengthdata is limited by the presence of flow-in and the high degree of disturbance in most cores.
0 10 20 30 40 50 60 700
50
100
150
200
Shear strength (kPa)D
epth
(m
bsf)

SHIPBOARD SCIENTIFIC PARTYCHAPTER 4, SITE 1169 46
Figure F18. Thermal conductivity measured on whole cores vs. depth, Hole 1169A.
0.9 1 1.1 1.2 1.30
50
100
150
Thermal conductivity (W/[m·K])D
epth
(m
bsf)

SH
IPB
OA
RD
SC
IEN
TIFIC P
AR
TY
CH
AP
TE
R 4
, SIT
E 11
69
47
Figure vals vs. depth for Hole 1169A. Discrete wet bulk density cor-relates re trends in physical properties is difficult because of the in-fluenc
5
10
15
20
25
Dep
th (
mbs
f)
30 40 50 60 70
Porosity (%)
F19. Wet bulk density, water content, and porosity measured at discrete inter well to GRA density (Fig. F15B, p. 43). However, interpretation of all downcoe of flow-in and highly disturbed sediments.
1.5 1.7 1.90
0
0
0
0
0
Wet bulk density (g/cm3)
20 40 60 80
Water content (dry wt%)

SHIPBOARD SCIENTIFIC PARTYCHAPTER 4, SITE 1169 48
Table T1. Coring summary, Site 1169.
Hole 1169ALatitude: 47°3.9159′SLongitude: 145°14.2089′ETime on site: 2 days, 19 hr, 45 min; 67.75 hr (1245 hr, 28 March–0830 hr, 31 March 2000)Time on hole: 2 days, 19 hr, 45 min; 67.75 hr (1245 hr, 28 March–0830 hr, 31 March 2000)Seafloor (drill pipe measurement from rig floor, mbrf): 3578.9Distance between rig floor and sea level (m): 11.0Water depth (drill pipe measurement from sea level, m): 3567.9Total depth (from rig floor, mbrf): 3825.2Total penetration (mbsf): 246.3Total length of cored section (m): 246.3Total core recovered (m): 225.02Core recovery (%): 91.4Total number of cores: 26
Core
Date (March2000) Time (local)
Depth (mbsf) Length (m)Recovery
(%)Top Bottom Cored Recovered
189-1169A-1H 28 2320 0.0 8.6 8.6 8.56 99.52H 29 0025 8.6 18.1 9.5 6.49 68.33H 29 0125 18.1 27.6 9.5 9.85 103.74H 29 0225 27.6 37.1 9.5 9.80 103.25H 29 0520 37.1 46.6 9.5 9.74 102.56H 29 0640 46.6 56.1 9.5 9.56 100.67H 29 0720 56.1 65.6 9.5 9.95 104.78H 29 0850 65.6 75.1 9.5 9.77 102.89H 29 1040 75.1 84.6 9.5 9.36 98.510H 29 1200 84.6 94.1 9.5 9.95 104.711H 29 1310 94.1 103.6 9.5 10.05 105.812H 29 1420 103.6 113.1 9.5 9.94 104.613H 29 1630 113.1 122.6 9.5 9.25 97.414H 29 2010 122.6 132.1 9.5 9.61 101.215H 29 2325 132.1 141.6 9.5 10.04 105.716H 30 0100 141.6 151.1 9.5 9.91 104.317H 30 0230 151.1 160.6 9.5 10.00 105.318H 30 0815 160.6 170.1 9.5 9.82 103.419H 30 1005 170.1 179.6 9.5 8.11 85.420H 30 1230 179.6 189.1 9.5 9.78 103.021H 30 1520 189.1 198.6 9.5 9.14 96.222X 30 1755 198.6 207.9 9.3 3.51 37.723X 30 1940 207.9 217.5 9.6 6.34 66.024X 30 2115 217.5 227.1 9.6 4.88 50.825X 30 2245 227.1 236.7 9.6 4.53 47.226X 31 0015 236.7 246.3 9.6 7.08 73.8
Totals: 246.3 225.02 91.4

SHIPBOARD SCIENTIFIC PARTYCHAPTER 4, SITE 1169 49
Table T2. Distribution and abundances of nannofossils, Hole 1169A.
Notes: Abundance: A = abundant, C = common, F = few, R = rare. Preservation: G = good, M = moderate, P = poor.
Core, section, interval (cm)
Depth (mbsf) Pr
eser
vatio
n
Gro
up a
bun
dan
ce
Amau
rolit
hus
delic
atus
Amau
rolit
hus
prim
us
Cal
cidi
scus
lept
opor
us
Cal
cidi
scus
mac
inty
rei
Cal
cidi
scus
pre
mac
inty
rei
Cer
atol
ithus
arm
atus
Cer
atol
ithus
rug
osus
Coc
colit
hus
mio
pela
gicu
s
Coc
colit
hus
pela
gicu
s
Cyc
licar
golit
hus
florid
anus
Dic
tyoc
occi
tes
prod
uctu
s
Dis
coas
ter
bolli
i
Dis
coas
ter
braa
rudi
i
Dis
coas
ter
brou
wer
i
Dis
coas
ter
chal
leng
eri
Dis
coas
ter
loeb
lichi
i
Dis
coas
ter
surc
ulus
Dis
coas
ter
tam
alis
Dis
coas
ter
varia
bilis
Gep
hyro
caps
a sp
p. (
smal
l)
Hel
icos
phae
ra k
ampt
neri
Hel
icos
phae
ra s
ellii
Pseu
doem
ilian
ia la
cuno
sa
Retic
ulof
enes
tra
min
uta
Retic
ulof
enes
tra
perp
lexa
Retic
ulof
enes
tra
pseu
doum
bilic
us
189-1169A-1H-CC, 17-21 8.52 G A A F R2H-CC, 12-17 15.04 G A A F A R R A3H-CC, 15-20 27.90 M A A A A R R R R4H-CC, 10-15 37.35 G A A A A F R F5H-CC, 11-16 46.79 G A F A F R A R R6H-CC, 14-19 56.11 G A A C R A R C7H-CC, 14-19 66.00 M A A C A R F8H-CC, 0-5 75.32 M A F R A F C9H-CC, 9-14 84.41 M A R A F R A R10H-CC, 22-27 94.50 M A A F A11H-CC, 21-26 104.10 P A A F A12H-CC, 23-27 113.50 M A F R13H-CC, 20-25 122.30 M A F R R R14H-CC, 73-78 132.16 M A F A A R15H-CC, 20-25 142.09 G A C C R16H-CC, 13-18 151.46 G A A C A17H-CC, 11-16 161.05 G A A C A R R18H-CC, 13-18 170.37 M A R A C R A R R R F19H-CC, 8-13 178.16 M A R A C A C20H-CC, 23-29 189.32 M A R C R C21H-CC, 21-26 198.19 M A C R22X-CC, 0-5 202.06 M A C A A C23X-3, 44-44 211.34 M A A A C23X-4, 25-25 212.65 M A A A F C F23X-CC, 12-17 214.19 M A R C A A C24X-1, 120-120 218.70 M A C F F24X-2, 60-60 219.60 M A C C R R C24X-3, 10-10 220.60 M A A C C F24X-4, 35-35 222.05 M A C24X-CC, 8-13 222.33 M A C R C25X-CC, 14-19 231.58 M A C A C26X-CC, 21-26 243.73 M A C R A R C

SHIPBOARD SCIENTIFIC PARTYCHAPTER 4, SITE 1169 50
Table T3. Calcareous nannofossil datum levels and their assigned age estimates, Hole 1169A.
Notes: The depth of each datum is assigned at the midpoint between depths of observed samples. LO = last occurrence, FO = firstoccurrence.
DatumAge(Ma)
Interval (cm) Depth (mbsf) Mean(m)
Error bar(m) ReferencesTop Bottom Top Bottom
LO Reticulofenestra pseudoumbilica 3.65 3H-CC 4H-CC 27.90 37.35 32.63 4.73 Berggren et al., 1995LO Amaurolithus primus 4.60 5H-CC 6H-CC 46.79 56.11 51.45 4.66 Berggren et al., 1995LO Discoaster loeblechii 6.80 23X-3, 44 23X-4, 25 211.34 212.65 212.00 0.66 Berggren et al., 1995LO Amaurolithus delicatus 6.90 23X-CC 24X-1, 120 214.19 215.39 214.79 0.60 Gartner, 1992FO Discoaster loeblechii 8.70 24X-1, 120 24X-2, 60 218.70 219.60 219.15 0.45 Berggren et al., 1995LO Cyclicargolithus floridanus 11.90 24-3, 10 24-4, 35 220.60 222.05 221.33 0.73 Gartner, 1992

SH
IPB
OA
RD
SC
IEN
TIFIC P
AR
TY
CH
AP
TE
R 4
, SIT
E 11
69
51
Table
Note: X
Hole, cosection Pa
ragl
obor
otal
ia n
ymph
a
Zone/Subzone Age
189-11691H-CC SN14 Pleistocene2H-CC
SN12b latePlio.
3H-CC4H-CC5H-CC6H-CC7H-CC8H-CC9H-CC10H-CC11H-CC12H-CC13H-CC14H-CC15H-CC16H-CC17H-CC18H-CC19H-CC20H-CC21H-CC22H-CC SN12a early23H-CC X
SN7 middleMiocene
24H-CC25H-CC26H-CC SN1 early
T4. Range chart of planktonic foraminifers, Hole 1169A.
= present, ? = questionable identification.
re, Depth(mbsf) Be
ella
dig
itata
Glo
bige
rina
bullo
ides
Glo
bige
rina
falc
onen
sis
Glo
bige
rina
prae
bullo
ides
Glo
bige
rina
quin
quel
oba
Glo
bige
rinel
la a
equi
late
ralis
Glo
bige
rinel
la o
besa
Glo
bige
rinita
glu
tinat
a
Glo
bige
rinita
nap
arim
aens
is
Glo
bige
rinita
uvu
la
Glo
boro
talia
cra
ssac
onic
a
Glo
boro
talia
cra
ssaf
orm
is (
sin)
Glo
boro
talia
cra
ssul
a
Glo
boro
talia
fohs
i lob
ata
Glo
boro
talia
hirs
uta
Glo
boro
talia
infla
ta (
sin)
Glo
boro
talia
pan
da
Glo
boro
talia
plio
zea
Glo
boro
talia
pun
ctic
ulat
a
Glo
boro
talia
pun
ctic
uloi
des
Glo
boro
talia
sci
tula
Glo
boro
talia
sph
eric
omio
zea
Glo
boro
talia
tria
ngul
a
Glo
boro
talia
tru
ncat
ulin
oide
s
Glo
botu
rbor
otal
ita a
pert
ura
Glo
botu
rbor
otal
ita d
ecor
aper
ta
Neo
glob
oqua
drin
a co
ntin
uosa
Neo
glob
oqua
drin
a du
tert
rei
Neo
glob
oqua
drin
a pa
chyd
erm
a (s
in)
Orb
ulin
a un
iver
sa
Para
glob
orot
alia
con
tinuo
sa
Para
glob
orot
alia
may
eri
A-8.52 X X X X X X X X X X X
15.04 X X X X X X X X X X X X X X X X X X27.90 X X X X X X X X X X37.35 X X X X X X X X X X X ? X X X46.79 X X X X X ? X X X X56.11 X X X X X ? X X X X X66.00 X X X X X X X X X X X75.32 X X X X X X X X X84.41 X X X X X X X X X94.50 X X X X X X X ? X X
104.10 X X X X X X ? X113.50 X X X X X X X X X122.30 X X X X X X X X X X132.16 X X X X X X X X142.09 X X X X X X ? X151.46 X X X X X X ? X X X ? X161.05 X X X X X X X X170.37 X X X X ? X X X ? X X178.16 X X X X X X X X ? X X189.32 X X X X X X X X198.19 X X X X X ? X X202.06 X X X X ? X X X X X214.19 X X X X X X222.33 X X X X X X X X X231.58 X X X X X X X X X243.73 X X X

SHIPBOARD SCIENTIFIC PARTYCHAPTER 4, SITE 1169 52
Table T5. Planktonic foraminifer datum levels, Hole 1169A.
Note: LO = last occurrence.
BioeventAge(Ma)
Interval Depth (mbsf) Mean(mbsf)
Error bar(m)Top Bottom Top Bottom
LO Globorotalia pliozea 4.60 21H-CC 22H-CC 198.18 202.06 200.120 1.940LO Paragloborotalia mayeri 11.40 22X-CC 23X-CC 202.06 214.19 208.125 6.065

SH
IPB
OA
RD
SC
IEN
TIFIC P
AR
TY
CH
AP
TE
R 4
, SIT
E 11
69
53
Table e 1169A.
Notes: P rare, T = trace, B = barren.
Core, sinterva Si
licof
lage
llate
tes
tsSp
ong
e sp
icul
esSy
nedr
a jo
usea
naTh
alas
sion
ema
nitz
schi
oide
sT.
nitz
schi
oide
s va
r. pa
rva
Thal
assi
osira
com
plic
ata
Thal
assi
osira
con
vexa
Thal
assi
osira
ecc
entr
ica
Thal
assi
osira
elli
ptip
ora
Thal
assi
osira
fasc
icul
ata
Thal
assi
osira
gra
cilis
Thal
assi
osira
insi
gna
Thal
assi
osira
inur
aTh
alas
sios
ira le
ntig
inos
aTh
alas
sios
ira le
ptop
usTh
alas
sios
ira o
estr
upii
Thal
assi
osira
oliv
eran
aTh
alas
sios
ira s
pp.
Thal
assi
osira
tor
okin
aTh
alas
sios
ira s
tria
ta
Thal
assi
osira
sym
met
rica
T. t
etra
oest
rupi
i var
. rei
mer
iTh
alas
sios
ira t
orok
ina
Thal
assi
othr
ix a
ntar
ctic
a
189-11691H-CC, C A F R R C A2H-CC, C A R F F F F F F A3H-CC, F A R R R F F R R C R D4H-CC, F A R R R R C R R F D5H-CC, F A F C C R D6H-CC, F F R R F R F C7H-CC, F C F R F R C8H-CC, F A R R F C9H-CC, F C F F C R R C10H-CC F A P R C P P C11H-CC P C P P F F F C12H-CC P C F P P P C P D13H-CC P F P P C14H-CC P R T15H-CC P C F C16H-CC P C C D17H-CC P C F P P C18H-CC R R19H-CC R R20H-CC P P F21H-CC T22X-CC F T23X-CC F T24X-CC C F P25X-CC F P26X-CC T
T6. Relative abundance of selected diatom taxa, sponge spicules, and silicoflagellates, Hol
reservation: G = good, M = moderate, P = poor. Abundance: D = dominant, A = abundant, C = common, F = few, R =
ection, l (cm)
Depth(mbsf) G
roup
pre
serv
atio
n
Gro
up a
bun
dan
ceAc
tinoc
yclu
s cu
rvat
ulus
Actin
ocyc
lus
fryx
ella
eAc
tinoc
yclu
s in
gens
Actin
ocyc
lus
inge
ns v
ar. n
odus
Actin
ocyc
lus
inge
ns v
ar. o
valis
Aste
rom
phal
us s
pp
.Az
peiti
a no
dulif
ercf
. Azp
eitia
nod
ulife
rAz
peiti
a ta
bula
ris g
roup
Ces
todi
scus
ant
arct
icus
Cha
etoc
eros
res
ting
sp
ores
Cos
cino
disc
us m
argi
natu
sC
osci
nodi
scus
rho
mbi
cus
Den
ticul
opsi
s di
mor
pha
Den
ticul
opsi
s hu
sted
tiiD
iplo
neis
bom
bus
Ethm
odis
cus
rex
Euca
mpi
a an
tarc
tica
Frag
ilario
psis
bar
roni
i Fr
agila
riops
is fo
ssili
sFr
agila
riops
is k
ergu
elen
sis
Frag
ilario
psis
lacr
ima
Frag
ilario
psis
rei
nhol
dii
Frag
ilario
psis
rits
cher
iFr
agila
riops
is s
pp
.Fr
agila
riops
is w
eave
riH
emid
iscu
s cf
. cun
eifo
rmis
Hem
idis
cus
cune
iform
isH
emid
iscu
s ka
rste
nii
Lisi
tzin
ia o
rnat
aN
itzsc
hia
dona
huen
sis
Prob
osci
a ba
rboi
Rhiz
osol
enia
sp
p.
Roce
lla g
elid
a Ro
cella
gel
ida
var.
schr
ader
i
A- 17-21 8.52 MG C C C R C R R A R F A F C 12-17 15.04 G C R R F R P C C R C C C A 15-20 27.90 G C R R R P C C C F F 10-15 37.35 P A F C R R R R P F F R F R C R 11-16 46.79 M A R F P F R F C 14-19 56.11 MG R D F P F F R 14-19 66.00 M C F R R P F C C R 0-5 75.32 MG A R R C P R D A F 9-14 84.41 MG C R C R P P R R F R C R F F R, 22-27 94.50 M A F P P P C F P F P P P D, 21-26 104.10 G C P C C P P C, 23-27 113.50 MG A P F P P P P C P P C, 20-25 122.30 M C C P P F P, 73-78 132.16 P T, 20-25 142.09 G C F C C, 13-18 151.46 M C C C P C C, 11-16 161.05 G C C P C P, 13-18 170.37 P R T, 8-13 178.16 P R R P R, 23-29 189.32 P F F F F T P P P P R, 21-26 198.19 P T P R, 0-5 202.06 P T T T, 12-17 214.19 P F F F P, 8-13 222.33 MG F C P C F C, 14-19 231.58 P F F F C P R, 21-26 243.73 P T T

SHIPBOARD SCIENTIFIC PARTYCHAPTER 4, SITE 1169 54
Table T7. Combined bioevents used for the age model, Hole1169A.
Notes: Group: D = diatom, R = radiolarian, C = dinocyst, N = nannofossil, F =planktonic foraminifer, B = bolboforma. LO = last occurrence, LAO = lastabundant occurrence. This table is also available in ASCII format.
Group BioeventAge (Ma)
Interval (cm) Depth (mbsf)Top Bottom
D LO Proboscia barboi 1.80 0.0 1H-CC 8.52R LO Pseudocubus vema 2.40 4H-CC 5H-CC 42.07C LO Invertocysta tabulata 2.65 5H-CC 9H-CC 65.50D LO Fragilariopsis weaveri 2.65 1H-CC 2H-CC 15.04D LO Fragilariopsis lacrima 2.90 4H-CC 5H-CC 46.79R LO Lampromitra coronata 3.35 6H-CC 7H-CC 61.06N LO Reticulofenestra pseudoumbilica 3.65 3H-CC 4H-CC 32.63N LO Amaurolithus primus 4.60 5H-CC 6H-CC 51.45F LO Globorotalia pliozea 4.60 21H-CC 22H-CC 200.13R LO Lychnocanoma grande 5.00 16H-CC 17H-CC 156.30R LO Dictyophimus splendens 5.20 21H-CC 22X-CC 200.13B LO Bolboforma aculeata 5.30 21H-CC 22X-CC 200.13D LO Actinocyclus fryxellae 6.70 20H-CC 21H-CC 198.19N LO Discoaster loeblechii 6.80 23X-3, 44 23X-4, 25 212.00N LO Amaurolithus delicatus 6.90 23X-CC 24X-1, 120 214.76D LO Denticulopsis dimorpha 10.70 23X-CC 24X-CC 222.33F LO Paragloborotalia mayeri 11.40 22X-CC 23X-CC 208.13N LO Cyclicargolithus floridanus 11.90 24X-3, 10 24X-4, 35 221.33R LAO Cyrtocapsella tetrapera 12.50 23X-CC 24X-CC 218.30
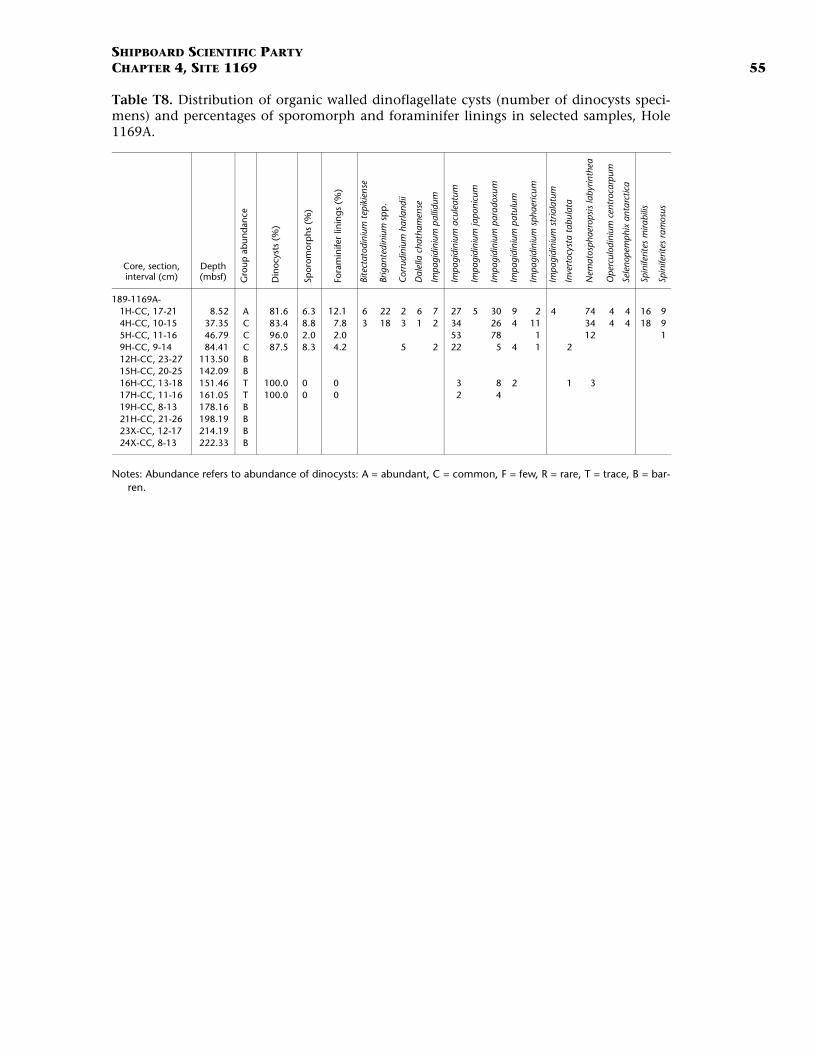
SHIPBOARD SCIENTIFIC PARTYCHAPTER 4, SITE 1169 55
Table T8. Distribution of organic walled dinoflagellate cysts (number of dinocysts speci-mens) and percentages of sporomorph and foraminifer linings in selected samples, Hole1169A.
Notes: Abundance refers to abundance of dinocysts: A = abundant, C = common, F = few, R = rare, T = trace, B = bar-ren.
Core, section, interval (cm)
Depth (mbsf) G
roup
abu
ndan
ce
Din
ocys
ts (
%)
Spor
omor
phs
(%
)
Fora
min
ifer
linin
gs
(%)
Bite
ctat
odin
ium
tep
ikie
nse
Brig
ante
dini
um s
pp.
Cor
rudi
nium
har
land
ii
Dal
ella
cha
tham
ense
Impa
gidi
nium
pal
lidum
Impa
gidi
nium
acu
leat
um
Impa
gidi
nium
japo
nicu
m
Impa
gidi
nium
par
adox
um
Impa
gidi
nium
pat
ulum
Impa
gidi
nium
sph
aeric
um
Impa
gidi
nium
str
iala
tum
Inve
rtoc
ysta
tab
ulat
a
Nem
atos
phae
rops
is la
byrin
thea
Ope
rcul
odin
ium
cen
troc
arpu
m
Sele
nope
mph
ix a
ntar
ctic
a
Spin
iferit
es m
irabi
lis
Spin
iferit
es r
amos
us
189-1169A-1H-CC, 17-21 8.52 A 81.6 6.3 12.1 6 22 2 6 7 27 5 30 9 2 4 74 4 4 16 94H-CC, 10-15 37.35 C 83.4 8.8 7.8 3 18 3 1 2 34 26 4 11 34 4 4 18 95H-CC, 11-16 46.79 C 96.0 2.0 2.0 53 78 1 12 19H-CC, 9-14 84.41 C 87.5 8.3 4.2 5 2 22 5 4 1 212H-CC, 23-27 113.50 B15H-CC, 20-25 142.09 B16H-CC, 13-18 151.46 T 100.0 0 0 3 8 2 1 317H-CC, 11-16 161.05 T 100.0 0 0 2 419H-CC, 8-13 178.16 B21H-CC, 21-26 198.19 B23X-CC, 12-17 214.19 B24X-CC, 8-13 222.33 B

SHIPBOARD SCIENTIFIC PARTYCHAPTER 4, SITE 1169 56
Table T9. Selected age-diagnostic dinocyst event, Hole 1169A.
Note: LO = last occurrence.
Dinocyst Datum
Interval Depth (mbsf) Mean(mbsf)
Error(m)
Age(Ma) SourceTop Bottom Top Bottom
LO Invertocysta tabulata 5H-CC 9H-CC 46.79 84.41 65.60 18.81 2.65 Williams et al., 1998

SHIPBOARD SCIENTIFIC PARTYCHAPTER 4, SITE 1169 57
Table T10. Magnetostratigraphic results, Site 1169.
ChronAge(Ma)
Depth (mbsf)
Onset C1n 0.78 3.50Termination C1r.1n 0.99 6.00Termination C2n 1.77 19.20Termination C2An.1n 2.58 40.60

SHIPBOARD SCIENTIFIC PARTYCHAPTER 4, SITE 1169 58
Table T11. Values for inorganic carbon, calcium car-bonate, total carbon, total organic carbon, total nitro-gen, and hydrogen in sediments, Hole 1169A.
Notes: IC = inorganic carbon, CaCO3 = calcium carbonate, TC = totalcarbon, TOC = total organic carbon. NA = not analyzed.
Hole, core, section
Depth (mbsf)
IC (wt%)
CaCO3 (wt%)
TC (wt%)
TOC (wt%)
N (wt%)
H (mg H/g)
189-1169A-1H-1 0.72 10.78 89.80 11.09 0.31 0.02 0.121H-3 3.72 9.91 82.55 10.44 0.53 0.01 0.151H-5 6.72 NA NA NA NA NA NA2H-1 9.32 10.00 83.28 10.40 0.40 0.00 0.172H-3 12.32 10.39 86.54 10.63 0.24 0.01 0.152H-5 14.82 10.58 88.09 10.96 0.39 0.01 0.123H-1 18.82 10.30 85.82 10.54 0.24 0.00 0.153H-3 21.82 9.47 78.88 9.87 0.40 0.04 0.213H-5 24.82 9.99 83.24 10.24 0.25 0.00 0.177H-5 62.83 9.89 82.35 10.20 0.31 0.02 0.188H-3 69.32 10.16 84.65 10.40 0.24 0.01 0.158H-5 72.32 9.69 80.74 10.05 0.36 0.00 0.189H-1 75.82 9.75 81.20 10.10 0.35 0.01 0.189H-3 78.52 10.79 89.89 11.11 0.32 0.00 0.089H-5 81.64 10.11 84.25 10.36 0.25 0.01 0.1412H-1 104.25 9.73 81.07 10.37 0.64 0.00 0.1515H-2 134.32 10.50 87.50 10.47 0.00 0.01 0.1115H-4 137.32 7.66 63.78 8.08 0.42 0.06 0.3419H-1 170.83 11.23 93.58 11.49 0.26 0.01 0.0619H-3 173.59 11.47 95.54 11.53 0.06 0.01 0.0620H-3 183.33 11.22 93.42 11.47 0.25 0.01 0.0722X-1 199.33 10.34 86.09 11.63 1.29 0.00 0.0424X-1 218.22 11.43 95.25 11.69 0.26 0.00 0.0424X-3 221.22 11.29 94.05 11.51 0.22 0.01 0.0525X-1 227.88 11.19 93.25 11.47 0.28 0.00 0.0525X-3 230.91 11.33 94.36 11.52 0.19 0.01 0.0426X-1 237.42 11.20 93.28 11.55 0.35 0.00 0.0426X-3 240.42 11.20 93.30 11.53 0.33 0.01 0.0526X-5 243.42 11.44 95.26 11.54 0.10 0.01 0.05

SHIPBOARD SCIENTIFIC PARTYCHAPTER 4, SITE 1169 59
Table T12. Headspace gas composition, Hole 1169A.
Note: C1 = methane, ppmv = parts per million by volume.
Hole, core, section
Depth (mbsf)
C1 (ppmv)
189-1169A-1H-4 4.50 32H-4 13.10 53H-4 22.60 34H-4 32.10 65H-6 43.94 57H-4 60.60 158H-4 70.10 119H-4 79.60 1510H-4 89.10 2211H-4 98.60 2112H-4 108.10 2413H-4 117.60 1714H-2 124.10 2815H-4 136.60 6216H-4 146.10 5217H-4 155.60 3418H-4 165.10 4319H-4 174.60 3120H-4 184.10 6021H-4 193.60 6622X-2 200.10 8023X-3 210.90 9324X-3 220.50 9725X-3 230.10 4126X-4 241.20 92

SHIPBOARD SCIENTIFIC PARTYCHAPTER 4, SITE 1169 60
Table T13. Interstitial water data, Hole 1169A.
Core, section, interval (cm)
Depth (mbsf) pH
Alkalinity (mM) Salinity
Cl– (mM)
SO42–
(mM) Na+
(mM)Mg2+ (mM)
Ca2+ (mM)
K+ (mM)
H4SiO40
(µM) Sr2+
(µM)Li+
(µM)
189-1169A-1H-3, 145-150 4.45 7.51 3.98 35.0 556 26.8 488 54.0 10.8 11.0 610 141 172H-3, 145-150 13.05 7.39 4.24 35.0 561 26.3 469 54.5 10.8 11.1 691 191 143H-3, 145-150 22.55 7.47 4.98 35.0 561 24.0 472 53.8 10.7 11.1 693 228 134H-3, 145-150 32.05 7.26 5.35 35.0 563 25.5 470 53.3 10.7 11.6 732 255 125H-6, 140-150 45.19 7.48 5.45 35.0 564 24.8 474 52.8 10.6 11.4 809 297 126H-3, 145-150 51.05 7.46 5.37 35.0 562 23.3 474 52.4 10.3 11.4 803 299 107H-3, 145-150 60.55 7.46 5.39 35.0 559 24.1 474 51.9 10.5 11.5 864 313 118H-3, 145-150 73.05 7.44 5.61 35.0 561 22.7 476 51.7 10.1 11.1 817 331 99H-3, 145-150 79.55 7.46 5.84 34.0 561 23.2 472 51.6 10.6 11.1 858 360 910H-3, 145-150 89.05 7.47 5.82 34.0 560 22.7 474 50.1 10.5 11.4 923 382 1011H-3, 145-150 98.55 7.50 5.79 34.0 560 22.4 478 50.1 10.7 11.2 945 413 1015H-3, 140-150 136.50 7.38 5.96 34.0 559 21.5 474 48.4 11.8 10.8 927 561 818H-3, 140-150 165.00 7.42 6.30 34.0 559 19.6 478 45.5 12.3 10.4 874 679 1221H-3, 140-150 193.50 7.35 6.77 34.0 558 17.9 479 44.0 12.8 10.1 953 701 5524X-2, 140-150 220.40 7.39 6.04 34.0 558 19.1 472 44.1 11.8 10.5 807 603 97

SHIPBOARD SCIENTIFIC PARTYCHAPTER 4, SITE 1169 61
Table T14. P-wave velocities measured at discrete in-tervals, Hole 1169A.
Notes: All P-wave velocities measured at discrete intervals along thecore. PSW1 = measured along the core, PSW2 = measured perpen-dicular to the core, PSW3 = measured across the core (Hamiltonframe).
Core, section, interval (cm)
Depth (mbsf)
PWS1 (km/s)
PWS2 (km/s)
PSW3 (km/s)
189-1169A-1H-1, 50.00 0.50 1.582 1.576 1.8561H-1, 50.00 2.00 1.594 1.589 1.8621H-3, 50.00 3.50 1.551 1.543 1.8021H-4, 89.80 5.40 1.514 1.505 1.7571H-6, 49.90 8.00 1.518 1.509 1.7462H-2, 49.90 10.60 1.536 1.541 1.7842H-3, 49.90 12.10 1.551 1.553 1.8102H-4, 50.00 13.60 1.582 1.8813H-2, 50.00 20.10 1.608 1.570 1.8873H-3, 50.00 21.60 1.577 1.573 1.8133H-4, 49.90 23.10 1.8103H-4, 50.00 23.10 1.561 1.5543H-5, 50.00 24.60 1.544 1.541 1.7953H-6, 50.00 26.10 1.560 1.551 1.8284H-1, 49.90 28.10 1.559 1.5774H-3, 50.00 28.25 1.7984H-2, 50.00 29.60 1.539 1.5454H-4, 50.00 29.70 1.7824H-3, 50.10 31.10 1.583 1.587 1.8404H-4, 50.00 32.60 1.585 1.577 1.8584H-5, 50.00 34.10 1.582 1.579 1.8334H-6, 50.00 35.60 1.565 1.555 1.8285H-1, 50.00 37.60 1.572 1.5865H-1, 50.90 37.61 1.8405H-2, 49.10 38.63 1.550 1.5425H-4, 112.50 42.26 1.5407H-4, 48.10 61.08 1.556 1.569 1.8547H-5, 28.90 62.39 1.5527H-5, 49.30 62.59 1.551 1.8527H-6, 49.20 64.09 1.596 1.8897H-7, 48.50 65.58 1.608 1.607 1.8698H-2, 49.00 67.59 1.604 1.603 1.8798H-3, 48.50 69.08 1.582 1.582 1.8418H-4, 48.40 70.58 1.552 1.561 1.8118H-5, 48.80 72.09 1.546 1.542 1.8168H-6, 49.00 73.59 1.556 1.8309H-1, 48.50 75.58 1.576 1.582 1.8439H-2, 48.90 77.09 1.5849H-2, 49.50 77.10 1.588 1.8719H-3, 51.60 78.62 1.597 1.617 1.8819H-4, 48.50 80.08 1.557 1.553 1.8199H-5, 41.70 81.52 1.544 1.563 1.8289H-6, 41.10 83.01 1.544 1.567 1.82712H-1, 47.70 104.08 1.559 1.580 1.88021H-3, 52.30 192.62 1.624 1.968

SHIPBOARD SCIENTIFIC PARTYCHAPTER 4, SITE 1169 62
Table T15. Undrained shear strength from miniaturevane-shear measurements, Hole 1169A.
Core, section, interval (cm)
Depth (mbsf)
Undrainedshear strength
(kPa)
189-1169A-1H-2, 100.2 2.50 20.0701H-3, 109.9 4.10 20.9571H-4, 125.2 5.75 18.8511H-6, 60.4 8.10 20.0702H-2, 99.6 11.10 21.2902H-3, 99.2 12.59 2.4402H-4, 86.9 13.97 21.7333H-2, 99.2 20.59 14.3043H-3, 98.5 22.08 24.7283H-4, 99.0 23.59 15.0803H-5, 99.4 25.09 20.5143H-6, 99.2 26.59 20.4034H-1, 114.2 28.74 26.0584H-2, 109.5 30.19 24.5064H-3, 99.1 31.59 14.1934H-4, 99.1 33.09 23.1754H-5, 99.1 34.59 13.3064H-6, 99.0 36.09 13.1955H-1, 60.8 37.71 32.4895H-2, 97.2 39.11 11.8655H-4, 140.0 42.54 25.3937H-4, 94.8 61.55 11.7547H-6, 95.4 64.55 25.9477H-7, 47.8 65.58 6.6538H-2, 94.6 68.05 21.6238H-3, 94.7 69.55 31.7138H-4, 94.5 71.04 11.9768H-5, 94.4 72.54 26.7238H-6, 77.3 73.87 24.6179H-1, 94.7 76.05 66.0889H-2, 92.2 77.52 50.1209H-3, 100.0 79.10 34.0429H-4, 97.8 80.58 34.2649H-5, 90.8 82.01 28.4989H-6, 83.7 83.44 30.05012H-1, 47.5 104.07 11.86521H-3, 53.6 192.64 23.397

SHIPBOARD SCIENTIFIC PARTYCHAPTER 4, SITE 1169 63
Table T16. Thermal conductivity measured on whole-core sections, Hole 1169A.
Core, section, interval (cm)
Depth (mbsf)
Thermal conductivity (W/[m·K])
189-1169A-1H-3, 75 3.75 1.0492H3, 75 12.35 0.9233H-3, 75 21.85 1.0014H-3, 75 31.35 1.0825H-3, 75 40.39 1.1386H-3, 75 50.35 0.9237H-3, 75 59.85 1.09914H-3, 75 124.85 1.13415H-3, 75 135.85 1.01316H-3, 75 145.35 1.1317H-3, 75 154.85 1.12918H-3, 75 164.35 1.261

SHIPBOARD SCIENTIFIC PARTYCHAPTER 4, SITE 1169 64
Table T17. Index properties measured at discrete in-tervals, Hole 1169A.
Core, section, interval (cm)
Depth (mbsf)
Water content
(bulk wt%)
Density (g/cm3) Porosity (%)Wet bulk Dry bulk
189-1169A-1H-1, 70.0-72.0 0.70 42.0 1.594 0.924 65.41H-2, 70.0-72.0 2.20 44.0 1.564 0.876 67.21H-3, 70.0-72.0 3.70 44.4 1.558 0.867 67.51H-4, 84.0-86.0 5.34 43.6 1.571 0.886 66.92H-1, 128.0-130.0 9.88 44.3 1.560 0.869 67.42H-3, 70.0-72.0 12.30 42.7 1.596 0.915 66.53H-3, 70.0-72.0 21.80 39.4 1.634 0.990 62.83H-4, 70.0-72.0 23.30 35.6 1.708 1.100 59.33H-5, 70.0-72.0 24.80 37.6 1.664 1.038 61.13H-6, 70.0-72.0 26.30 35.9 1.702 1.091 59.74H-1, 70.0-72.0 28.30 32.6 1.756 1.184 55.94H-3, 70.0-72.0 31.30 35.6 1.696 1.092 59.04H-4, 70.0-72.0 32.80 36.6 1.681 1.067 60.04H-5, 70.0-72.0 34.30 36.2 1.691 1.079 59.74H-6, 70.0-72.0 35.80 36.1 1.688 1.078 59.65H-4, 100.0-102.0 42.14 36.3 1.682 1.072 59.65H-5, 70.0-72.0 43.34 35.5 1.696 1.094 58.97H-4, 70.0-72.0 61.30 35.5 1.708 1.101 59.37H-5, 70.0-72.0 62.80 36.0 1.695 1.084 59.77H-6, 70.0-72.0 64.30 39.7 1.635 0.985 63.47H-7, 61.0-63.0 65.71 36.1 1.695 1.083 59.78H-2, 70.0-72.0 67.80 36.5 1.676 1.063 59.88H-3, 70.0-72.0 69.30 35.5 1.701 1.097 59.08H-4, 70.0-72.0 70.80 35.3 1.706 1.104 58.78H-5, 70.0-72.0 72.30 36.2 1.697 1.082 60.08H-6, 70.0-72.0 73.80 36.3 1.681 1.071 59.58H-7, 50.0-52.0 75.10 47.0 1.507 0.799 69.19H-1, 70.0-72.0 75.80 35.4 1.682 1.086 58.29H-2, 70.0-72.0 77.30 35.3 1.688 1.092 58.29H-3, 40.0-42.0 78.50 31.4 1.782 1.222 54.79H-4, 70.0-72.0 80.30 38.2 1.631 1.007 60.99H-5, 51.0-53.0 81.61 33.2 1.743 1.165 56.49H-6, 70.0-72.0 83.30 33.1 1.745 1.168 56.410H-1, 97.0-99.0 85.57 30.9 1.782 1.231 53.812H-1, 63.0-65.0 104.23 35.6 1.692 1.090 58.815H-2, 70.0-72.0 134.30 34.7 1.731 1.131 58.615H-4, 70.0-72.0 137.30 39.9 1.620 0.974 63.119H-1, 70.0-72.0 170.80 17.6 1.848 1.523 31.719H-3, 50.0-52.0 173.60 28.5 1.835 1.313 51.020H-3, 70.0-72.0 183.30 27.5 1.857 1.345 49.921H-3, 70.0-72.0 192.80 29.7 1.818 1.278 52.821H-6, 100.0-102.0 197.60 31.8 1.767 1.204 54.922X-1, 70.0-72.0 199.30 37.5 1.680 1.049 61.523X-2, 70.0-72.0 210.10 33.5 1.743 1.158 57.123X-4, 70.0-72.0 213.10 36.0 1.711 1.095 60.124X-1, 70.0-72.0 218.20 36.4 1.697 1.079 60.324X-3, 70.0-72.0 221.20 36.2 1.704 1.087 60.225X-1, 77.0-79.0 227.87 36.3 1.694 1.079 60.125X-3, 80.0-82.0 230.90 35.7 1.702 1.095 59.326X-1, 70.0-72.0 237.40 33.9 1.748 1.155 57.926X-3, 70.0-72.0 240.40 35.7 1.703 1.095 59.426X-5, 70.0-72.0 243.40 34.6 1.721 1.126 58.1