3d scanning system - cnc-step.com · laserprobe4500 3d laser scanning system hylewicz cnc-technik...
TRANSCRIPT

LaserProbe4500
CNC-STEP
"LaserProbe4500" 3D laser scanning system Instruction manual
LaserProbe4500 3D laser scanning system
Hylewicz CNC-Technik Siemensstrasse 13-15 D-47608 Geldern
Fon.: +49 (0) 2831 133236
E-Mail: [email protected]
Website: www.cnc-step.de
2

LaserProbe4500 3D laser scanning system
Contents 1. Safety .......................................................................................................................................................4
1.1. Symbols used................................................................................................................................4
2. Purpose ...................................................................................................................................................4
3. Basic technical data and characteristics .................................................................................................4
3.1. Scanning parameters ...................................................................................................................4
3.2. Allowable synchronization methods .............................................................................................4
3.3. Series LA901 laser sensor ..........................................................................................................5
3.4. Synchronization unit.....................................................................................................................6
3.5. Optical isolation unit .....................................................................................................................7
4. Delivery set............................................................................................................................................7
5. Operation principle.................................................................................................................................8
6. Connection versions ..............................................................................................................................8
6.1. Connection to machines with direct stepper control .....................................................................8
6.2. Connection to Beaver 9A/12A/12AV/18A/24A/26A machines......................................................8
6.3. Connection to machines with encoder impulse signals ................................................................9
6.4. Connection to machines with command signal pulses or with differential output encoder
(for example, Beaver 26AVST with servo-controller) ...................................................................9
6.5. Connection to machines with sinusoidal encoder signals (3 wires)..............................................9
6.6. Connection to machines with sinusoidal and differential encoder signals (5 wires) ...................10
7. Connection of the optical isolation unit.................................................................................................10
7.1. Block diagram .............................................................................................................................10
7.2. Designation of contacts...............................................................................................................11
7.3. Connection to the synchronization unit .......................................................................................12
8. Selection of the synchronization option................................................................................................12
8.1. Connection to machine with direct stepper control .....................................................................12
8.2. Connection to machine with encoder impulse signals ................................................................13
8.3. Connection to machines with impulse differential encoder signals.............................................13
8.4. Connection to machines with analog encoder signals ................................................................14
8.5. Connection to machines with analog differential encoder signals ..............................................14
9. The «Dorgonia» software .....................................................................................................................15
9.1. Basic functions ............................................................................................................................15
9.2. Program start...............................................................................................................................15
9.3. Settings........................................................................................................................................16
9.3.1. Positioning of the sensor ....................................................................................................16
9.3.2. Setting-up of the laser sensor parameters .........................................................................16
9.3.3. Setting-up of program filters ...............................................................................................17
9.3.4. Setting-up of the scanning parameters ..............................................................................18
9.4. Generating scanning file for CNC ...............................................................................................18
9.5. Scanning of the item ...................................................................................................................18
9.6. Generate result file ......................................................................................................................18
10. Example of filter operation ...................................................................................................................19
11. System requirements ...........................................................................................................................21
12. Warranty ...............................................................................................................................................21
13. Example of the scanning result............................................................................................................21
14. Troubleshooting ...................................................................................................................................22
3
LaserProbe4500 3D laser scanning system
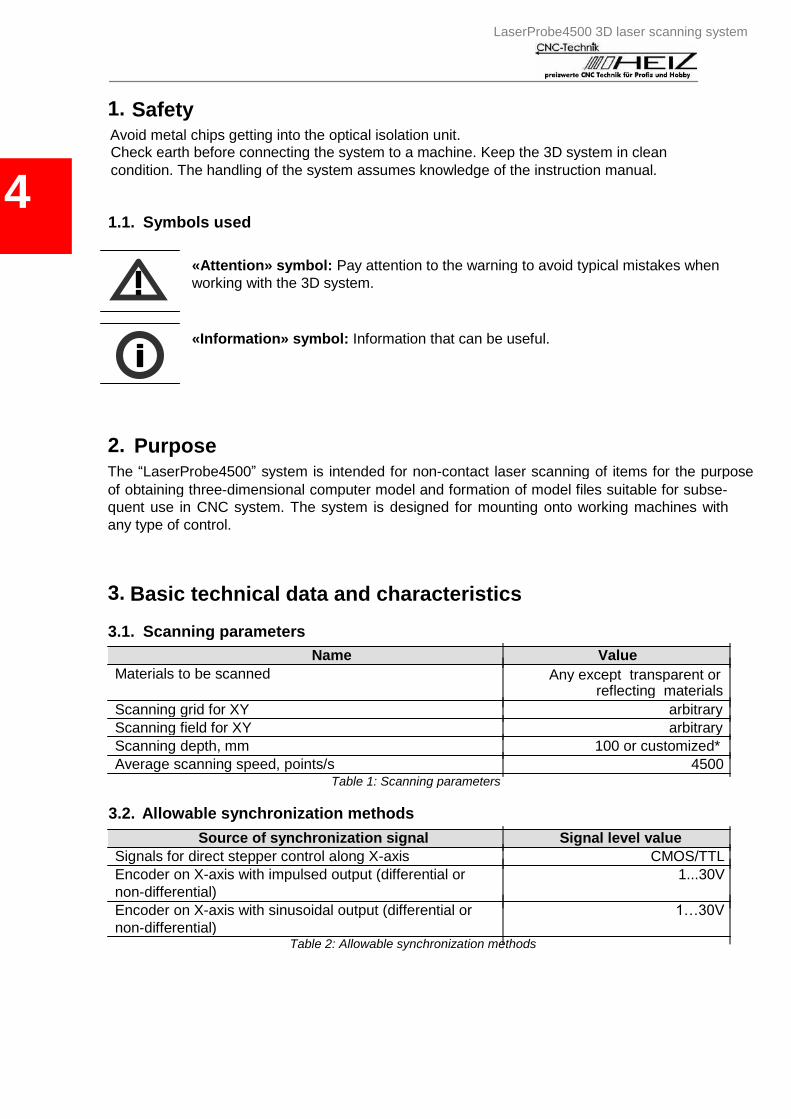
Name Value
Scanning grid for XY arbitrary
Scanning field for XY arbitrary
Scanning depth, mm 100 or customized*
Average scanning speed, points/s 4500
Source of synchronization signal Signal level value
Symbols used 1.1.
Table 2: Allowable synchronization methods
Safety Avoid metal chips getting into the optical isolation unit.
Check earth before connecting the system to a machine. Keep the 3D system in clean
condition. The handling of the system assumes knowledge of the instruction manual.
Basic technical data and characteristics 3.
1.
2. Purpose The “LaserProbe4500” system is intended for non-contact laser scanning of items for the purpose
of obtaining three-dimensional computer model and formation of model files suitable for subse-
quent use in CNC system. The system is designed for mounting onto working machines with
any type of control.
«Information» symbol: Information that can be useful.
1…30V
4
«Attention» symbol: Pay attention to the warning to avoid typical mistakes when
working with the 3D system.
1...30V Encoder on X-axis with impulsed output (differential or
non-differential)
CMOS/TTL Signals for direct stepper control along X-axis
Allowable synchronization methods 3.2.
Table 1: Scanning parameters
Any except transparent or reflecting materials
Materials to be scanned
Scanning parameters
Encoder on X-axis with sinusoidal output (differential or
non-differential)
3.1.
LaserProbe4500 3D laser scanning system
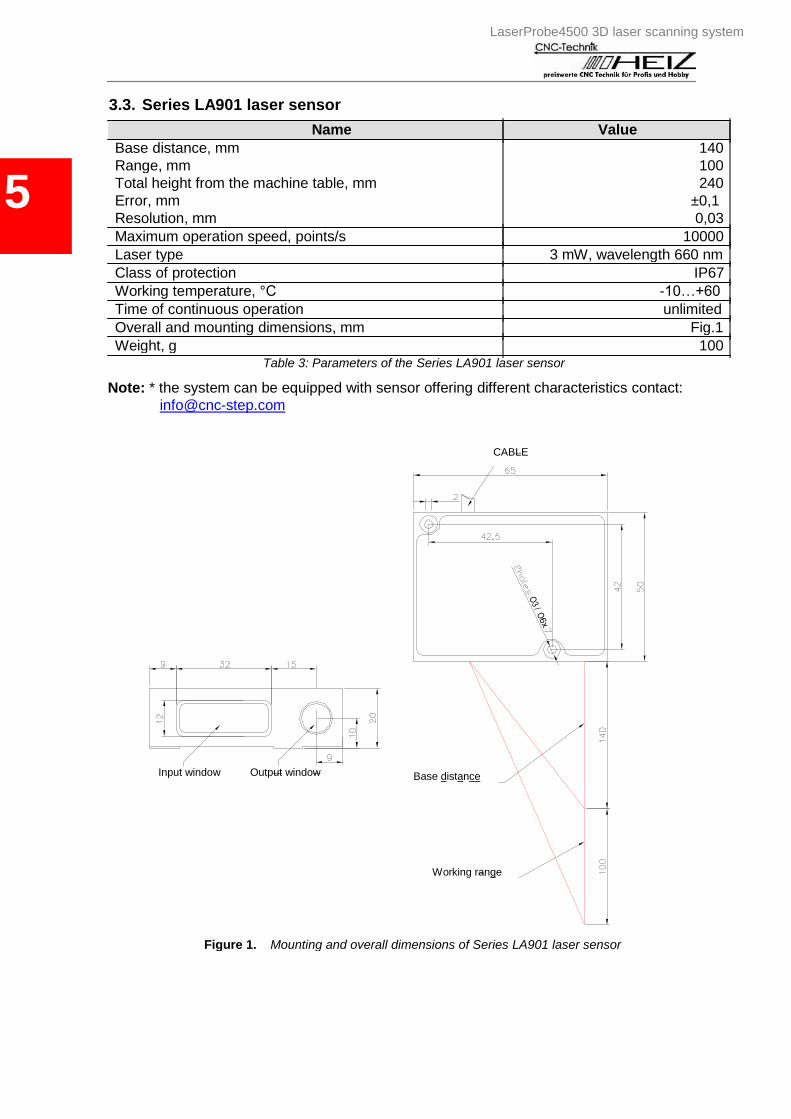
Maximum operation speed, points/s 10000
Laser type 3 mW, wavelength 660 nm
Class of protection IP67
Working temperature, °С -10…+60
Time of continuous operation unlimited
Overall and mounting dimensions, mm Fig.1
Weight, g 100
Figure 1. Mounting and overall dimensions of Series LA901 laser sensor
Working range
Table 3: Parameters of the Series LA901 laser sensor
window Output window Input Base distance
3.3. Series LA901 laser sensor
Name Value
Base distance, mm
Range, mm
Total height from the machine table, mm
Error, mm
Resolution, mm
140
100
240
±0,1
0,03
RIFTEK
CABLE
Note: * the system can be equipped with sensor offering different characteristics contact: [email protected]
5

LaserProbe4500 3D laser scanning system
PC communication interface USB 2.0
Class of protection IP67
Dimensions, mm Fig.2
№ Designation
2 Connector for laser sensor;
3 Power connector +5V;
2 3
30,5
137 60,5
4 5
24,7 4
1
56,3
4 125
Table 5: Designation of connectors of the synchronization unit
USB-cable for connection of the system to PC. 5
4 Beaver
Table 4: Parameters of the synchronization unit
-10…+60 Working temperature, °С 6
Value Name
Synchronization unit 3.4.
24,7
Connector for machine, in case of mounting on Beaver 9A/12A/12AV/18A/24A/26A
machines, not used otherwise;
on Connector for optical isolation unit (for mounting
9A/12A/12AV/18A/24A/26A machines – 15-conductor cable to PC);
1
Figure 2. General view of the synchronization unit

LaserProbe4500 3D laser scanning system
Class of protection IP64
Working temperature, °С -10…+60
Mounting on DIN-rail
- 1 piece
- 1 piece
- 1 piece
- 1 piece
- 1 piece
- 2 pieces
- 1 piece
- 1 piece
- 1 piece
- 1 piece
- 1 piece
- 1 piece
4.
36 45
LA901 laser sensor
Bracket for mounting sensor on machine
Synchronization unit with USB-cable for connection to PC
Cable for the synchronization unit
Power source Screw М3x18
Compact disc with drivers, software and operation manual
Optical isolation unit (optional)
Cable for the optical isolation unit (optional)
Cable for the synchronization unit «CABLE-001-15» (optional) Passport for the Series LA901 laser sensor Packing list
The delivery set includes:
Delivery set
Figure 3. General view of the optical isolation unit
3.5. Optical isolation unit
Name
16,6
7
87,4
158
Table 6: Parameters of the optical isolation unit
Fig. 3 Dimensions, mm 7
5
Value

LaserProbe4500 3D laser scanning system
Figure 5. Connection to Beaver machines through 15-conductor cable (in this case, optical isolation unit
is not required)
Sensor
Control
signals
Control
signals
CNC
machine
Synchronization
unit PC
USB () to PC
Power supply +5V
Connection to Beaver 9A/12A/12AV/18A/24A/26A machines 6.2.
Figure 4. Connection to machines with direct stepper control
Sensor
AGND
GND AGND GND
+5V +5V DIR Optical isolation
xDIR+ unit
CNC machine
DIR Synchronization
unit DIR
STEP xSTEP+ STEP STEP USB () to PC
Power supply
+5V
~110..220VAC
Connection to machines with direct stepper control 6.1.
Connection versions 6.
8
5. Operation principle The laser sensor is mounted onto the machine movement system. In the scanning mode,
the machine CNC system moves the sensor line-by-line over the item prototype. The sensor
measures the distance (Z coordinate) to the item surface. Data takeoff from the sensor is syn-
chronized with the sensor movement (XY coordinates), and the result is communicated to the
PC through the USB-port. Thus, XYZ coordinate array for the surface is formed, i.e. a digital pro-
totype model is created which is saved as a point cloud file as well as in a common STL format
suitable for subsequent use in CNC.
LaserProbe4500 3D laser scanning system
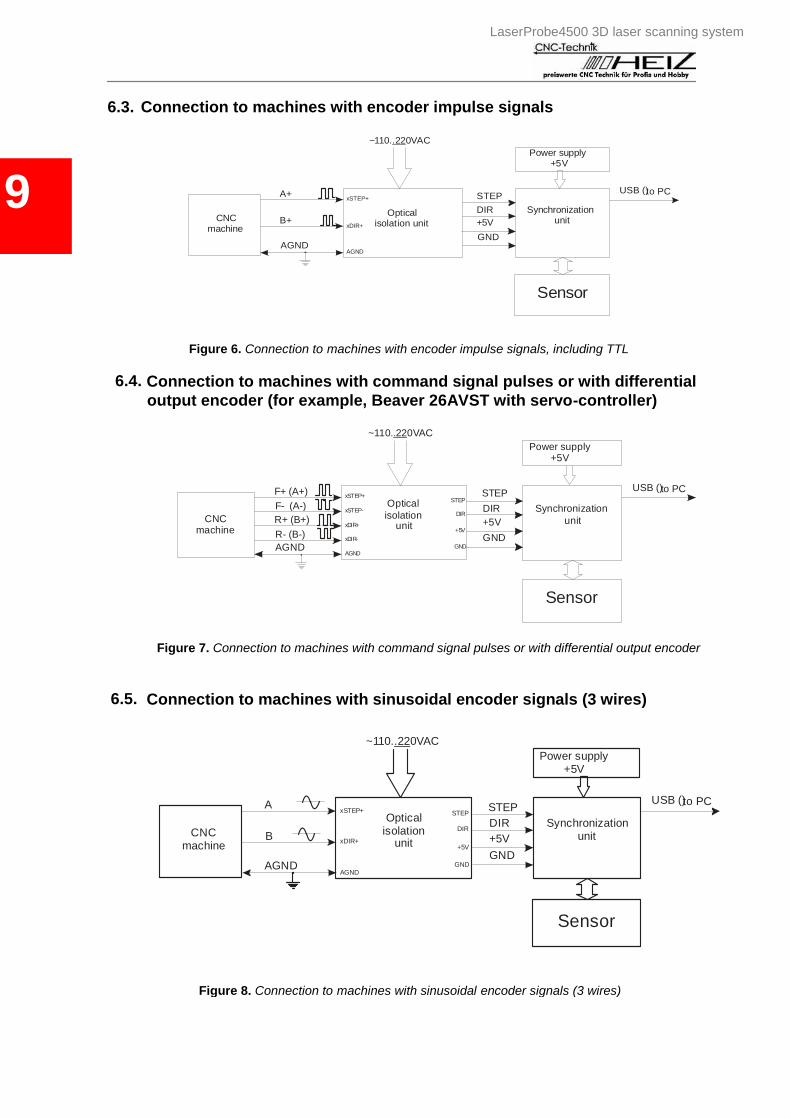
Figure 8. Connection to machines with sinusoidal encoder signals (3 wires)
Sensor
AGND GND AGND
GND +5V
xDIR+ +5V B CNC machine
DIR Synchronization
unit DIR Optical
isolation unit
STEP xSTEP+ STEP A USB () to PC
Power supply +5V
~110..220VAC
Connection to machines with sinusoidal encoder signals (3 wires) 6.5.
Figure 7. Connection to machines with command signal pulses or with differential output encoder
Sensor
GND AGND xDIR-
AGND
GND +5V
R- (B-) xDIR+ +5V CNC
machine R+ (B+)
xSTEP- Synchronization
unit
DIR Optical
isolation unit
F- (A-) STEP
DIR
xSTEP+ STEP F+ (A+) USB () to PC
Power supply +5V
~110..220VAC
Connection to machines with command signal pulses or with differential
output encoder (for example, Beaver 26AVST with servo-controller)
6.4.
Figure 6. Connection to machines with encoder impulse signals, including TTL
Sensor
AGND AGND
GND
+5V B+ CNC machine
Optical isolation unit xDIR+
Synchronization unit
DIR
xSTEP+ STEP A+ USB () to PC 9 Power supply
+5V
~110..220VAC
Connection to machines with encoder impulse signals 6.3.

LaserProbe4500 3D laser scanning system
A
To decode input signals and convert them to levels used for sensor, the unit contains
“Input decoders”. One of the operation modes of the “Input decoders” is chosen depending on
the position of the "Operation mode selector ".
The input decoder (CPLD) supports the following synchronization signals from different
Sources, such as:
• CMOS/TTL command signals for control of stepper along the X axis;
Figure 10: Block diagram of the optical isolation unit
Block diagram 7.1.
Connection of the optical isolation unit 7.
Figure 9. Connection to machines with sinusoidal and differential encoder signals
Sensor
AGND GND
B
AGND xDIR- GND
+5V xDIR+ +5V B CNC
machine
DIR xSTEP- Synchronization
unit
DIR Optical
isolation
unit
STEP xSTEP+ STEP A USB () to PC
10 Power supply
+5V
~110..220VAC
Connection to machines with sinusoidal and differential encoder
signals (5 wires)
6.6.
LaserProbe4500 3D laser scanning system
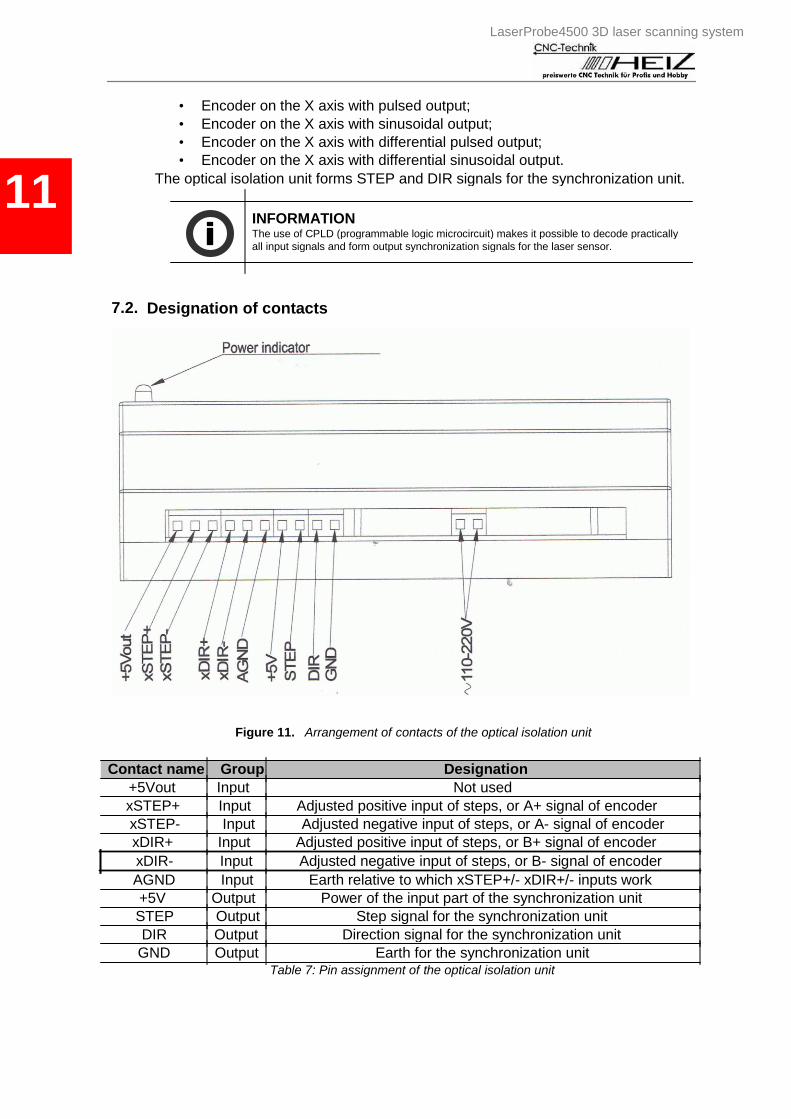
Contact name Group Designation
+5Vout Input Not used
xSTEP+ Input Adjusted positive input of steps, or A+ signal of encoder
xSTEP- Input Adjusted negative input of steps, or A- signal of encoder
xDIR+ Input Adjusted positive input of steps, or B+ signal of encoder
xDIR- Input Adjusted negative input of steps, or B- signal of encoder
AGND Input Earth relative to which xSTEP+/- xDIR+/- inputs work
+5V Output Power of the input part of the synchronization unit
STEP Output Step signal for the synchronization unit
GND Output Earth for the synchronization unit
• Encoder on the X axis with pulsed output;
• Encoder on the X axis with sinusoidal output;
• Encoder on the X axis with differential pulsed output;
• Encoder on the X axis with differential sinusoidal output.
The optical isolation unit forms STEP and DIR signals for the synchronization unit.
Table 7: Pin assignment of the optical isolation unit
Direction signal for the synchronization unit Output DIR
Figure 11. Arrangement of contacts of the optical isolation unit
Designation of contacts 7.2.
INFORMATION The use of CPLD (programmable logic microcircuit) makes it possible to decode practically
all input signals and form output synchronization signals for the laser sensor.
11
LaserProbe4500 3D laser scanning system
Red Power of the input part of the synchronization unit +5V
Blue Step signal for the synchronization unit STEP
White Direction signal for the synchronization unit DIR
Brown Earth for the synchronization unit GND
12 Wire color Designation Terminal on the optical isolation
unit
Table 8: Designation of wires of the synchronization unit “CABLE-001-15” cable
8. Selection of the synchronization option
Selection of the synchronization option is made by means of micro-switches on the optical isolation unit.
7.3. Connection to the synchronization unit
The optical isolation unit is supplied together with a cable whose 15-conductor connector on
the one end is connected to the synchronization unit while four wires on the other end are con-
nected to the optical isolation unit. Wire designations are shown in Table 8:
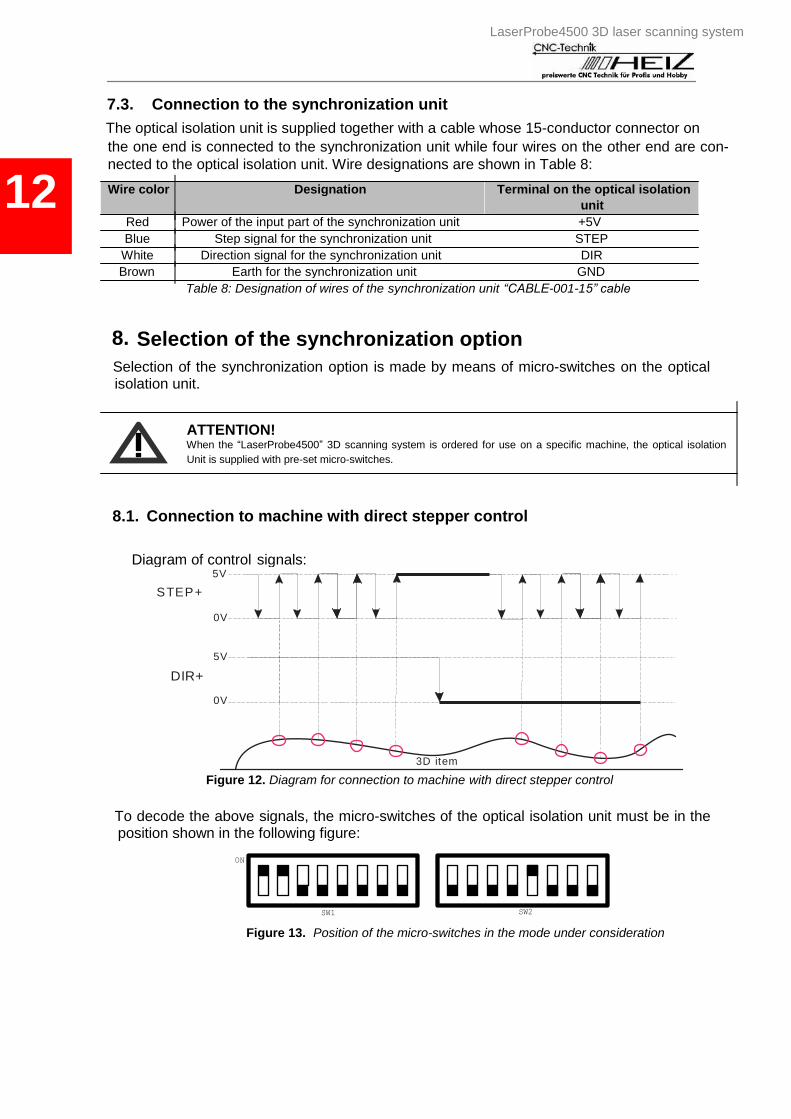
8.1. Connection to machine with direct stepper control
Diagram of control 5V
STEP+
signals:
0V
5V
DIR+
0V
3D item
Figure 12. Diagram for connection to machine with direct stepper control
To decode the above signals, the micro-switches of the optical isolation unit must be in the position shown in the following figure:
ON
SW2 SW1
Figure 13. Position of the micro-switches in the mode under consideration
ATTENTION! When the “LaserProbe4500” 3D scanning system is ordered for use on a specific machine, the optical isolation
Unit is supplied with pre-set micro-switches.

LaserProbe4500 3D laser scanning system
Figure 16. Diagram of signals for connection to machine with impulse differential encoder signals
3D item
B+
B-
A+ A-
Diagram of control signals:
Connection to machines with impulse differential encoder signals 8.3.
Figure 15. Position of the micro-switches in the mode under consideration
SW1 SW2
ON
To decode the above signals, the micro-switches of the optical isolation unit must be in the position shown in the following figure:
Figure 14. Diagram of signals for connection to machine with encoder impulse signals
3D item
0V
B+ 5V
0V
A+ 5V
13 Diagram of control signals:
Connection to machine with encoder impulse signals 8.2.
LaserProbe4500 3D laser scanning system
Figure 20. Diagram of signals for connection to machine with analog differential encoder signals
3D item
B-
B+
A-
A+
8.5. Connection to machines with analog differential encoder signals
Diagram of control signals:
Figure 19. Position of the micro-switches in the mode under consideration
SW1 SW2
ON
To decode the above signals, the micro-switches of the optical isolation unit must be in
the position shown in the following figure:
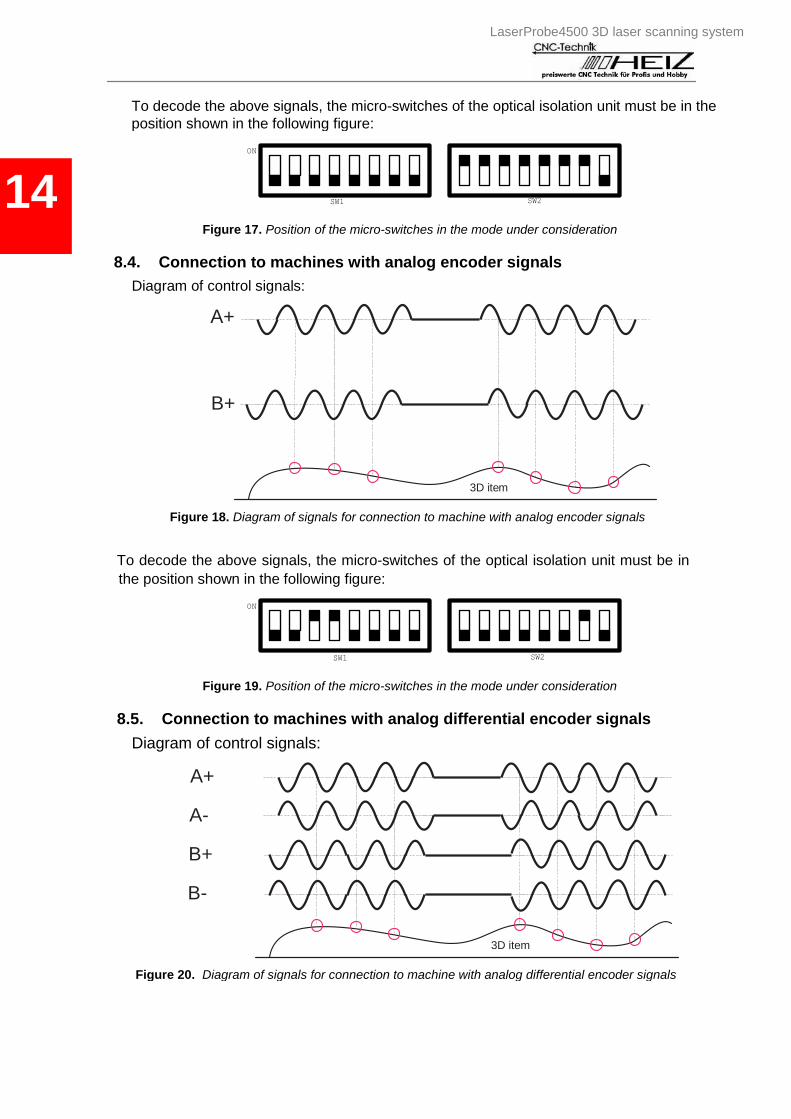
Figure 18. Diagram of signals for connection to machine with analog encoder signals
3D item
B+
A+
8.4. Connection to machines with analog encoder signals
Diagram of control signals:
Figure 17. Position of the micro-switches in the mode under consideration
SW1 SW2 14 ON
To decode the above signals, the micro-switches of the optical isolation unit must be in the
position shown in the following figure:
A
A
B
C
D
E
LaserProbe4500 3D laser scanning system
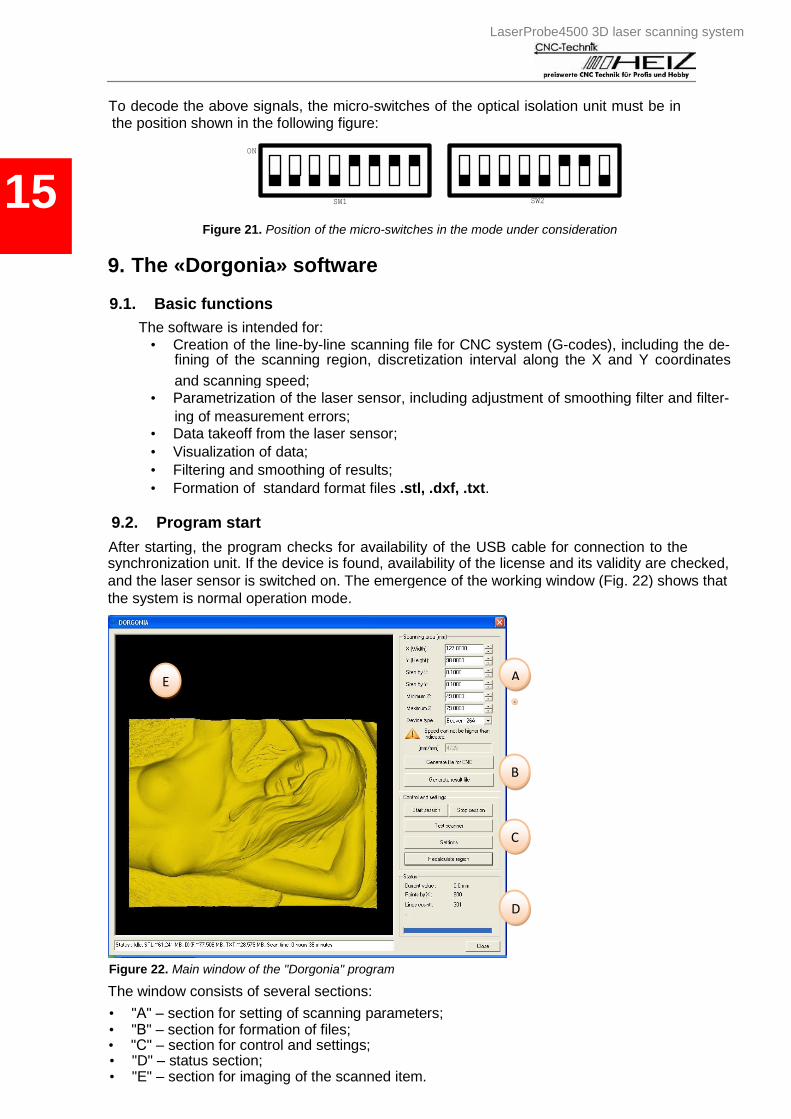
Figure 22. Main window of the "Dorgonia" program
9.2. Program start
After starting, the program checks for availability of the USB cable for connection to the synchronization unit. If the device is found, availability of the license and its validity are checked,
and the laser sensor is switched on. The emergence of the working window (Fig. 22) shows that
the system is normal operation mode.
9.1. Basic functions
The software is intended for:
• Creation of the line-by-line scanning file for CNC system (G-codes), including the de- fining of the scanning region, discretization interval along the X and Y coordinates
and scanning speed;
• Parametrization of the laser sensor, including adjustment of smoothing filter and filter-
ing of measurement errors; • Data takeoff from the laser sensor;
• Visualization of data;
• Filtering and smoothing of results;
• Formation of standard format files .stl, .dxf, .txt.
The «Dorgonia» software 9.
Figure 21. Position of the micro-switches in the mode under consideration
SW1 SW2 15 ON
To decode the above signals, the micro-switches of the optical isolation unit must be in the position shown in the following figure:
The window consists of several sections:
• "А" – section for setting of scanning parameters; • "В" – section for formation of files; • "С" – section for control and settings; • "D" – status section; • "E" – section for imaging of the scanned item.
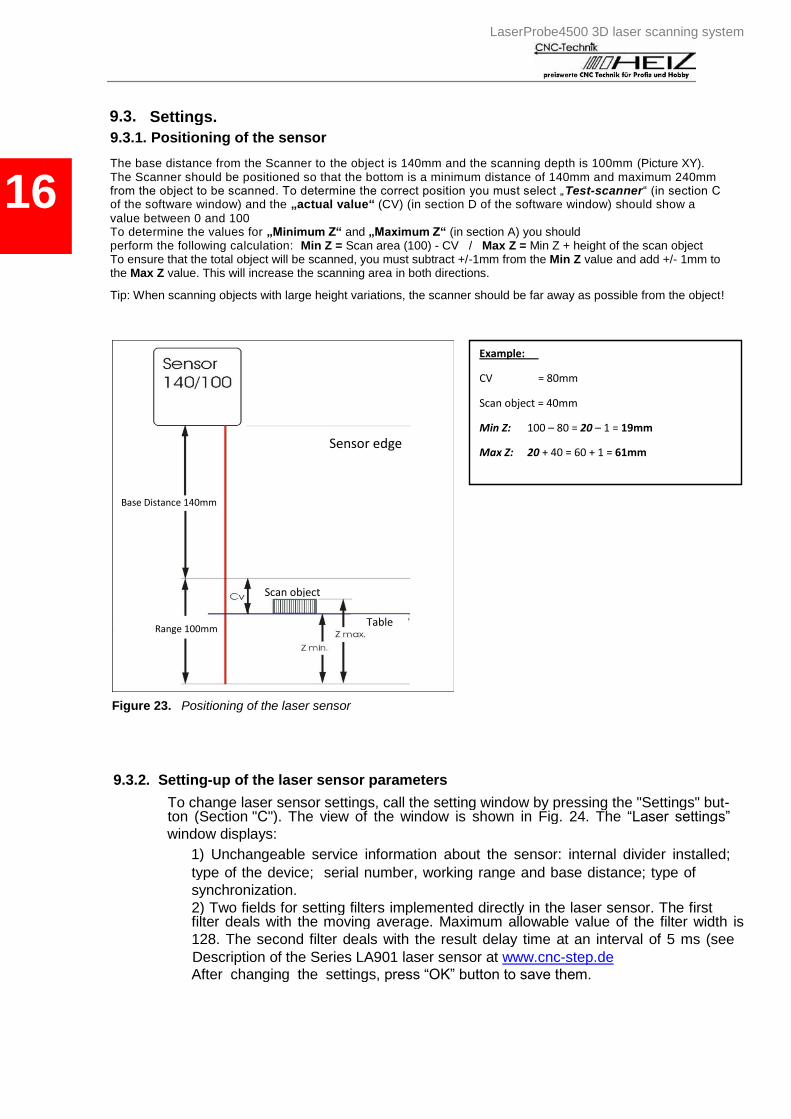
Example:
CV = 80mm
Scan object = 40mm
Min Z: 100 – 80 = 20 – 1 = 19mm
Max Z: 20 + 40 = 60 + 1 = 61mm
Base Distance 140mm
Range 100mm Table
Scan object
LaserProbe4500 3D laser scanning system
9.3.2. Setting-up of the laser sensor parameters
To change laser sensor settings, call the setting window by pressing the "Settings" but- ton (Section "С"). The view of the window is shown in Fig. 24. The “Laser settings”
window displays:
1) Unchangeable service information about the sensor: internal divider installed;
type of the device; serial number, working range and base distance; type of
synchronization.
2) Two fields for setting filters implemented directly in the laser sensor. The first filter deals with the moving average. Maximum allowable value of the filter width is
128. The second filter deals with the result delay time at an interval of 5 ms (see
Description of the Series LA901 laser sensor at www.cnc-step.de
After changing the settings, press “OK” button to save them.
Figure 23. Positioning of the laser sensor
9.3.1. Positioning of the sensor
Settings. 9.3.
16
Sensor edge
The base distance from the Scanner to the object is 140mm and the scanning depth is 100mm (Picture XY). The Scanner should be positioned so that the bottom is a minimum distance of 140mm and maximum 240mm from the object to be scanned. To determine the correct position you must select „Test-scanner“ (in section C of the software window) and the „actual value“ (CV) (in section D of the software window) should show a
value between 0 and 100 To determine the values for „Minimum Z“ and „Maximum Z“ (in section A) you should perform the following calculation: Min Z = Scan area (100) - CV / Max Z = Min Z + height of the scan object To ensure that the total object will be scanned, you must subtract +/-1mm from the Min Z value and add +/- 1mm to the Max Z value. This will increase the scanning area in both directions.
Tip: When scanning objects with large height variations, the scanner should be far away as possible from the object!

LaserProbe4500 3D laser scanning system
Figure 25. Settings of the program filters
9.3.3. Setting-up of program filters
To change settings of the program filters, call the settings window by pressing the
"Settings" button, go to the «Program settings» tab, set the required width of the
median filter and smoothing filter (Gaussian core), and enable or disable display of the
model. To save the settings, press "ОК".
The "Display model" switch is intended for enabling/disabling of the model display function. This function is used when RAM is not sufficient.
Figure 24. Laser settings
17

LaserProbe4500 3D laser scanning system
9.6. Generate result file
The result of scanning is displayed in the section "Е". Control of the item image in this section is possible with the help of the mouse pointer:
- dragging of the mouse with the left key pressed – rotation of the item;
- dragging of the mouse with the right key pressed – movement of the item;
- scrolling with the mouse – zoom-in and zoom-out of the item (scaling). To obtain the result file, it is sufficient to press the “Generate result file” button, select the
file type (STL/DXF/TXT) in the emerging window (Fig. 26), enter the file name, select file folder
for saving and press the “Save” button.
To make changes in the region already scanned (discretization interval along the X or Y
axis, length and width of the region), it is necessary to enter new values and press the “Recalcu-
late region” button (section “С” in Fig. 22). To return to the initial view of the model (if filters
were used and limits along Z were set), it is sufficient to switch off the filters and press the “Re-
calculate region” button.
9.5. Scanning of the item
• To perform scanning it is necessary to:
• use control program for CNC to open the file formed by the “Dorgonia” program according
to par. 9.4; • position the machine movement system to a point from which scanning must be
started;
• press the "Start session" button in the section "С" of the program working window;
• start the machine to execute the program. The task execution time depends on the size of the scanning region, speed and step
values with which the carriage moves along the X and Y axes
After the machine has executed the program, it is necessary to switch the scanning
mode off by releasing the "Start session" button.
ATTENTION! The allowable scanning speed is calculated automatically based on the sensor response speed and the scanning
grid specified, its value being set in the formed scanning program. Forced changing of the scanning speed may
cause distortion of the picture obtained.
9.4. Generating scanning file for CNC
To form the scanning file for the machine CNC system, it is necessary to set scanning parameters according to par. 9.3.4, press the "Generate file for CNC» button in the section "В" of
the program working window (Fig. 22), and define the place in the PC memory where the control file must be written. The output text file contains control G-codes for correct movements of the machine.
18
9.3.4. Setting-up of the scanning parameters
Before scanning is started, it is necessary to use section “A” to define the size of
the scanning field (X - width, Y – field length), discretization interval along the X and Y
coordinates, range of heights of the item to be scanned (Z minimum and Z maximum)
and select the type of machine whereto the scanner is connected. After the parameters
are set, the program calculates the allowable scanning speed and displays it in the pa-
rameters windows.

LaserProbe4500 3D laser scanning system
19
Fig. 27 shows the result of scanning obtained without programmed filtration used. The
peaks in the picture are caused by the influence of vertical walls of the item.
Fig. 28 shows the image of the item in the case where “Median filter” with a width of 9
was used (see par. 9.3.3.). As seen in the picture, the peaks disappeared.
Figure 27. Initial view of the item directly after scanning
Example of filter operation 10.
Figure 26. The window of result saving
LaserProbe4500 3D laser scanning system
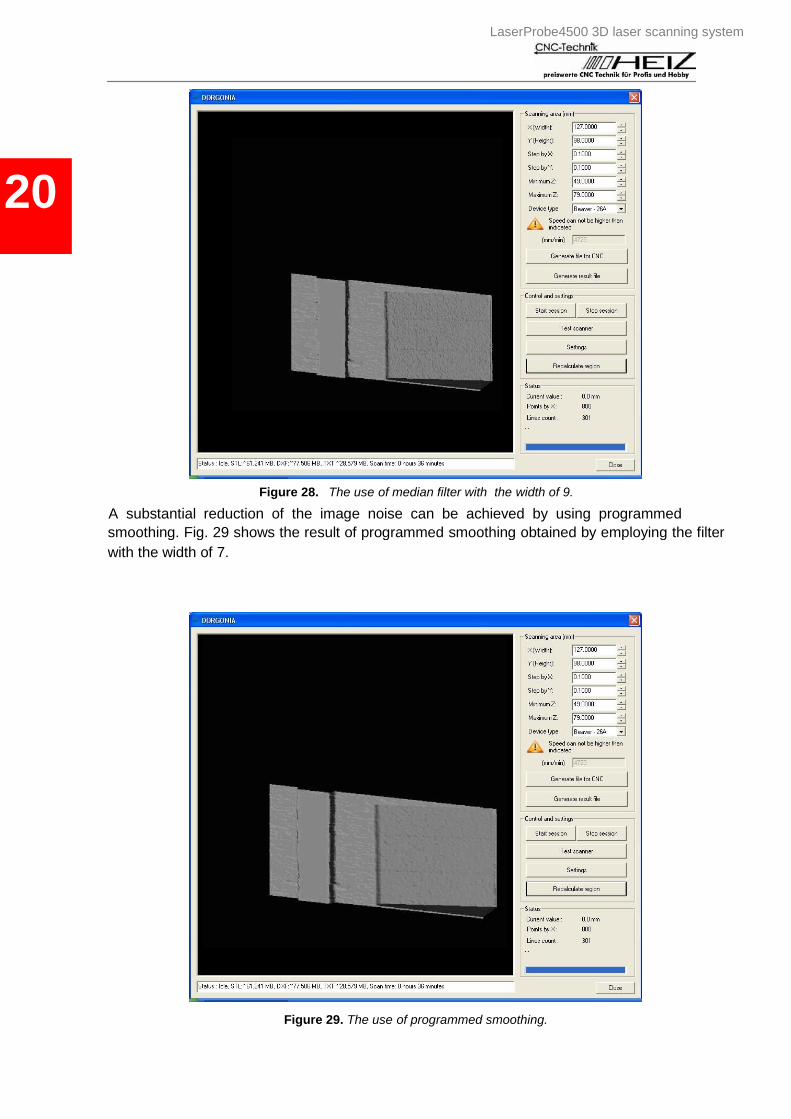
Figure 29. The use of programmed smoothing.
A substantial reduction of the image noise can be achieved by using programmed
smoothing. Fig. 29 shows the result of programmed smoothing obtained by employing the filter
with the width of 7.
Figure 28. The use of median filter with the width of 9.
20

LaserProbe4500 3D laser scanning system
21
Example of the scanning result 13.
Warranty period of the LaserProbe4500 3D laser scanning system is 24 months from the date of putting in operation. Guaranteed storage time is 12 months.
Warranty
11. System requirements
Stable work of the «Dorgonia» software requires the following system:
Processor:
RAM: Disk space:
Video card:
Operating system: Other:
not lower than Intel Pentium 4 2.0GHz.
not less than 1024 MB (recommended 4096MB).
not less than 20 GB, NFTS file system required.
ATI/NVidia and not less than 256MB of video memory.
Windows 2000/ Windows XP.
USB 2.0 is required.
12.

LaserProbe4500 3D laser scanning system
Problem Cause Solution
The «Dorgonia» program gives an
error message: «Error: scanner
does not respond»
1. Using oscilloscope, check for availability of
STEP/DIR signals
1. There is a problem with Synchronization signals
(STEP/DIR) coming from
machine (through the optical
isolation unit, if available).
The «Dorgonia» program gives an
error message: «Erroneous data
file»
1. Check connection of the sensor to the synchronization unit.
2. Check connection of power supply to the
synchronization unit.
The «Dorgonia» program gives an error message: «Error: data file
is empty »
1. Using oscilloscope, check for availability of synchronization signals from the machine
(if optical isolation unit is in place, this must be
done through the optical isolation unit). It is
possible that no power is supplied to the
optical isolation unit (if available).
1. Sensor is not connected to
synchronization unit.
2. Power supply unit (+5V)
not connected to the
synchronization unit.
1. There are no signals of
synchronization with the
machine.
22 1. Reinstall drivers from original compact disc
2. Check USB cable connection.
1. USB drivers not installed.
2. USB cable not connected.
The «Dorgonia» program gives an
error message: «Error: no scanner
found»
Troubleshooting 14.