3d object detection from roadside data using laser … · 3d object detection from roadside data...
TRANSCRIPT

1
3D Object Detection from Roadside Data Using Laser Scanners
Jimmy Tang and Avideh Zakhor
Berkeley, CA
ABSTRACT
The detection of objects on a given road path by vehicles equipped with range measurement
devices is important to many civilian and military applications such as obstacle avoidance in
autonomous navigation systems. In this thesis, we develop a method to detect objects of a
specific size lying on a road using an acquisition vehicle equipped with forward looking Light
Detection And Range (LiDAR) sensors and inertial navigation system. We use GPS data to
accurately place the LiDAR points in a world map, extract point cloud clusters protruding from
the road, and detect objects of interest using weighted random forest trees. We show that our
proposed method is effective in identifying objects for several road datasets collected with
various object locations and vehicle speeds.
Keywords: Plane Fitting, Laser Scanners, Road Detection
1. INTRODUCTION
Light Detection and Range (LiDAR) scanners provide an attractive source of data for these
applications by virtue of their dense, accurate sampling. However, due to the volume of data
involved data, acquisition and processing must be scalable and relatively free of human
intervention. Automatic detection of objects on a given road path using range measurement
devices is important to many civilian and military applications such as obstacle avoidance in
autonomous navigation systems.
Previous work in identifying road bumps includes using multi-modal sensors [8]. Haug
uses a combination of video, radar, LiDAR, laser, and ultrasonic sensors to capture road data.
This data is then input to an evaluation unit using an estimation method such as a Kalman Filter.
The evaluation unit determines if a bump exists in the road ahead, and provides this information
to the driver as a visual and/or audio and/or haptic warning signal. This approach results in
limited detection ranges less than 5 meters due to the ultrasonic sensors.
Attempts have also been made in mining to determine the obstacles using a 2D laser
scanner. In [9], a LiDAR scanner is attached to the front of a Load-Haul-Dump (LHD) vehicle
and is calibrated using GPS to determine the exact location of a scan. Using this information, a
terrain map is generated and input to an evaluation system that detects high values of
longitudinal slope. Areas with a sudden increase in slope are classified as obstacles to be
avoided. Using this approach, obstacles of height 30 cm are detectable on smooth ground while
moving slowly.
Manduchi et al. have proposed an obstacle detection technique based on stereo range
measurements for long-range 3D obstacle detection and terrain color identification, and single-
axis LiDAR for close-range visible/hidden obstacle detection [10]. For the LiDAR portion, a fast
triangulation algorithm generates a terrain map with surfaces. This establishes triplets of points
based on proximity in distance and time which are then triangulated to form a surface. The slope

2
and height of these surfaces are used to classify and output regions of interest to the driver [10].
In this paper, we develop a method to identify roadside objects of a specific size using an
acquisition vehicle equipped with forward-looking LiDAR scanners and inertial navigation
system. We first use GPS to accurate place the LiDAR points in a world map. Subsequent steps
consist of LiDAR preprocessing, object extraction, and object classification. Object extraction,
described in Section 3, seeks to identify the ground, remove all points associated with it, and
cluster the remaining points into potential objects of interest. This is achieved through local
leveling, plane fitting, point removal based on proximity to the found plane, and clustering of the
remaining points. We then compute features associated with each cluster and train a weighted
random forest tree to detect objects of interest as described in Section 4. In Section 5 we
demonstrate our algorithm on many datasets obtained by a vehicle-borne acquisition system over
a road of length 0.2 km. These datasets correspond to various object locations and orientations,
and are collected at vehicle speeds of 2 mph, 5 mph, and 10 mph. Section 6 includes conclusions
and future work.
2. DATA COLLECTION PROCEDURE
Our LIDAR data set was collected under sunny conditions with a SICK LMS 291-S14 laser
scanner mounted forward-looking on the front of a truck, 1 meter above the ground with a 25-
degree angle downwards as shown in Figure 1. This particular model of laser scanner supports
up to a 180-degree field-of-view, a measurement resolution of 10 mm, and a maximum scan
range of 80 meters. In our data collection we use only a single scanner operating at 75 Hz with a
90-degree field of view and 180 points per scan line.
Figure 1: Data acquisition vehicle with the LiDAR scanner and GPS receiver.
We use 4 bricks of dimension 8 4 2.25 inches as objects to be detected and lay them
in various positions and orientations throughout our flat, dirt test road. Each data set corresponds
to a combination of brick locations and orientations shown in Table 1 and Figure 2, as well as
speed configurations from Table 2. A view of the road where data was collected is shown in

3
Figure 3. We chose bricks as a representation for the minimum size limit of objects that we wish
to detect because scanning an object smaller than a brick results in too few return points to be
detected accurately. The size limitations of detectable objects are related to scan rate, scan point
resolution within a scan, and the speed of the acquisition vehicle.
Brick Configuration Explanation 0 - None No bricks placed on road 1 - Center-Perpendicular Bricks placed in the center of the road. Brick orientation is perpendicular to
the direction of the road. 2 - Center-Parallel Bricks placed in the center of the road. Brick orientation is parallel to the
direction of the road. 3 - Side-Perpendicular Bricks placed on the side of the road. Brick orientation is perpendicular to the
direction of the road. 4 - Side-Parallel Bricks placed on the side of the road. Brick orientation is parallel to the
direction of the road. Table 1: Brick configurations
Figure 2: Visual representation of brick configurations from Table 1
Speed Configuration Explanation 2 MPH – Forward LIDAR scanner travels 2 MPH in the forward direction in the road. 2 MPH – Backward LIDAR scanner travels 2 MPH in the backward direction in the road. 5 MPH – Forward LIDAR scanner travels 5 MPH in the forward direction in the road. 5 MPH – Backward LIDAR scanner travels 5 MPH in the backward direction in the road. 10 MPH – Forward LIDAR scanner travels 10 MPH in the forward direction in the road. 10 MPH – Backward LIDAR scanner travels 10 MPH in the backward direction in the road.
Table 2: Speed configurations

4
Figure 3: Data acquisition vehicle in motion.
3. OBJECT EXTRACTION
Object extraction is an important part of the process of object detection because by extracting the
LiDAR points associated with each object, we can perform isolated analysis on them. The first
step is to pre-process the data from the LiDAR scanner. This is done by locally leveling the road
using a moving median filter as shown in Section 3.1. In this step, the median -value of scan
points in a window is subtracted from each point in the sample. The purpose of this is to fit a
plane through the flattened data points and classify those points that are near the plane as ground,
while still maintaining sharp height differences that result from objects being scanned. Local
plane fitting in the - plane and point removal is the next step, shown in Section 3.2. In this
step, the sample points that are near each locally fit plane are removed; the remaining points
become clustered together based on proximity as shown in Section 3.3. These clusters represent
potential objects of interest and are processed in further steps to minimize false alarm
probability.
We exploit the fact that objects of interest on the road create holes in the ground scan
near the object. This is due to the object blocking the scanner’s view of the ground and leaving a
shadow. To take advantage of this to reduce the number of false alarms, we design an algorithm
to find these holes and to match each hole with a cluster. This is done by projecting the original
point cloud onto an - plane and placing hole markers wherever a 2-cm × 2-cm section of
these projected points contains no points. These hole markers are then grouped together by
proximity similar to how clusters are created as shown in Section 3.4. With these new hole
groups, we find cluster-hole pairs based on proximity and scan angle alignment between holes
and clusters as explained in Section 3.5. If a cluster does not have a hole pair, it is removed from
consideration. With this last step, we greatly reduce the number of candidate clusters.
The next step is to process the clusters so that objects of interest can be detected. This
step involves augmenting the detected cluster’s point cloud by adding back points removed from
the plane fitting and point removal process. The points to add back are found by a proximity
search on the original point cloud around the location of the cluster. These augmented clusters
are then input into a weighted random forest tree as described in Section 4.
3.1 Local Leveling of the Point Cloud
Since roads are generally only locally planar, we choose to detect protruding objects in local
planes rather than a simple global plane for the entire road. The purpose of the local leveling
algorithm is to locally fit a plane to our data so that the points above it can be further processed
to detect objects of interest. The algorithm operates on a non-overlapping moving 2-meter × 2-
meter - square of point cloud data. It subtracts the median -value of the 2-meter × 2-meter
square from each point in the square. This results in a leveled point cloud that maintains the local
height variations. An example of raw data projected along the - view is shown in Figure
4(a), and the result of local leveling is shown in Figure 4(b). As seen in Figure 4(a), the average
height of the local point cloud ranges from 157.4 meters to 157.7 meters over the range of 5
meters in the -axis. In contrast the height variation in Figure 4(b) is less than 2 cm. The
purpose of this step is to remove any slopes and macro effects so as to properly fit a plane
through the points. In practice, this is a useful step because most of the data collected, even at

5
seemingly flat ground, usually has a slight slope. The leveling process essentially transforms our
three dimensional point cloud into a height field, thus significantly reducing the complexity of
future steps.
Figure 4: - view of point cloud (a) before and (b) after leveler algorithm.
3.2 Local Plane Fitting and Point Removal
We use the algorithm described in [1] to detect horizontal - planes in the locally leveled 3D
point cloud resulting from Section 3.1. This is done by binning the points in the 3D point cloud
along the -axis and then choosing the height of the plane as the bin with the highest number of
points. Specifically, our algorithm finds a flat plane that maximizes fit relative to points for each
2-meter × 2-meter - square window and removes all points in proximity to the plane as
shown in Figure 5. As seen in Figure 5(b), the points closest to the bottom are removed.
Figure 5: - view of point cloud in Figure 3, (a) before and (b) after local plane fitting and point removal.
3.3 Cluster Finding
After local plane fitting and point removal, the points that are not removed by being close to the
plane are grouped together by proximity so that each cluster represents a candidate object to be

6
analyzed. Figure 6(a) shows the - view of such clusters for the dataset shown in Figure 5.
The centers of mass are calculated and stored for future processing as displayed in Figure 6(b).
This is the beginning of object segregation. Each of these groups of free point clusters is a
potential object that is further processed in the future steps to minimize false alarm probability.
Figure 6: (a) - view of clusters after local plane fitting. (b) - view of clusters (green) and centers (blue).
3.4 Hole Finding
When the LiDAR sensor scans a protruding object as shown in Figure 7(a), the resulting scan
viewed from an - perspective has a hole representing a shadow immediately after the object
as shown in Figure 7(b).
Figure 7: (a) Holes are created when a moving vehicle with an attached scanner scans a protruding object. (b) An illustration of
the resulting point cloud projected onto - plane.
By finding holes or potential shadows, it is possible to associate each cluster to a hole,
thus increasing the confidence level in the cluster actually corresponding to a protruding object
of interest. Hole finding is accomplished by first projecting the original point cloud onto an -
7
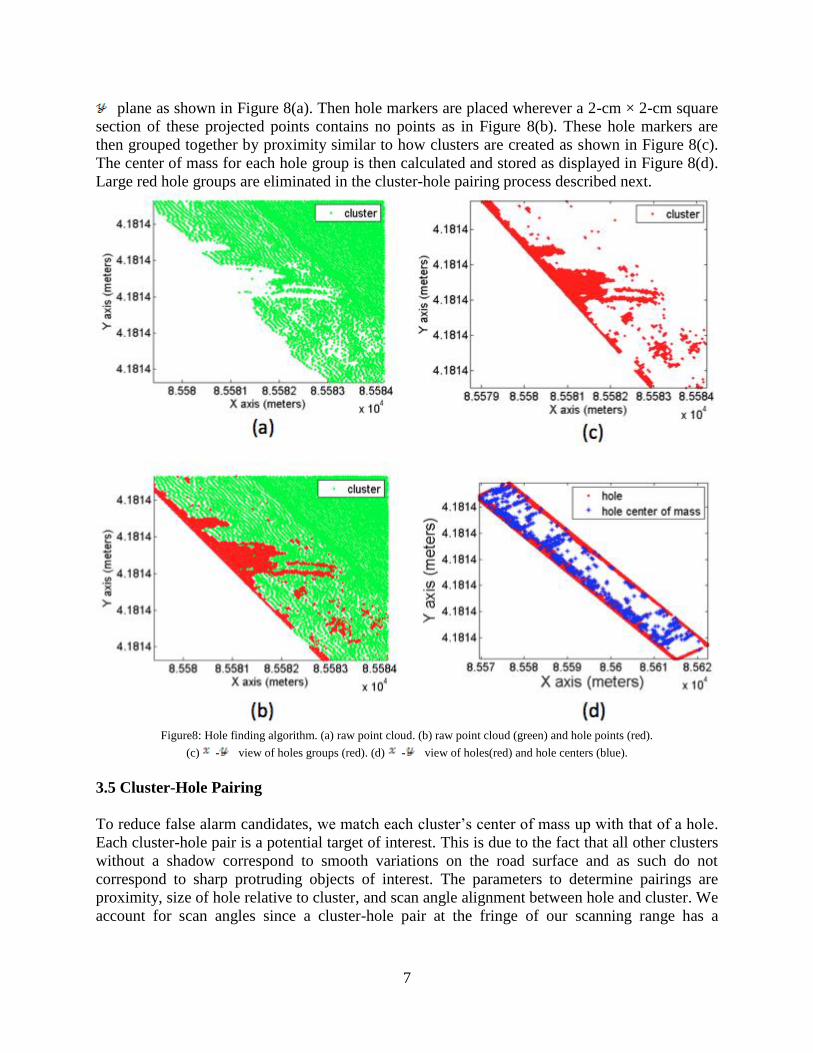
plane as shown in Figure 8(a). Then hole markers are placed wherever a 2-cm × 2-cm square
section of these projected points contains no points as in Figure 8(b). These hole markers are
then grouped together by proximity similar to how clusters are created as shown in Figure 8(c).
The center of mass for each hole group is then calculated and stored as displayed in Figure 8(d).
Large red hole groups are eliminated in the cluster-hole pairing process described next.
Figure8: Hole finding algorithm. (a) raw point cloud. (b) raw point cloud (green) and hole points (red).
(c) - view of holes groups (red). (d) - view of holes(red) and hole centers (blue).
3.5 Cluster-Hole Pairing
To reduce false alarm candidates, we match each cluster’s center of mass up with that of a hole.
Each cluster-hole pair is a potential target of interest. This is due to the fact that all other clusters
without a shadow correspond to smooth variations on the road surface and as such do not
correspond to sharp protruding objects of interest. The parameters to determine pairings are
proximity, size of hole relative to cluster, and scan angle alignment between hole and cluster. We
account for scan angles since a cluster-hole pair at the fringe of our scanning range has a
8
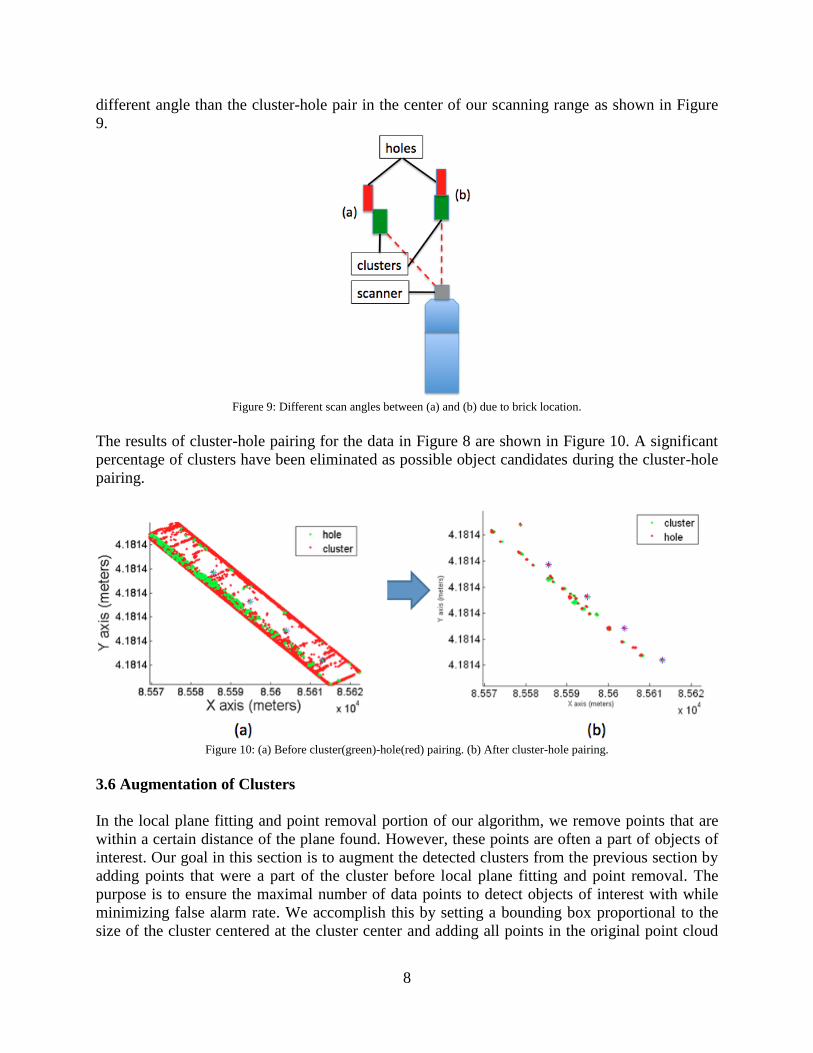
different angle than the cluster-hole pair in the center of our scanning range as shown in Figure
9.
Figure 9: Different scan angles between (a) and (b) due to brick location.
The results of cluster-hole pairing for the data in Figure 8 are shown in Figure 10. A significant
percentage of clusters have been eliminated as possible object candidates during the cluster-hole
pairing.
Figure 10: (a) Before cluster(green)-hole(red) pairing. (b) After cluster-hole pairing.
3.6 Augmentation of Clusters
In the local plane fitting and point removal portion of our algorithm, we remove points that are
within a certain distance of the plane found. However, these points are often a part of objects of
interest. Our goal in this section is to augment the detected clusters from the previous section by
adding points that were a part of the cluster before local plane fitting and point removal. The
purpose is to ensure the maximal number of data points to detect objects of interest with while
minimizing false alarm rate. We accomplish this by setting a bounding box proportional to the
size of the cluster centered at the cluster center and adding all points in the original point cloud
9
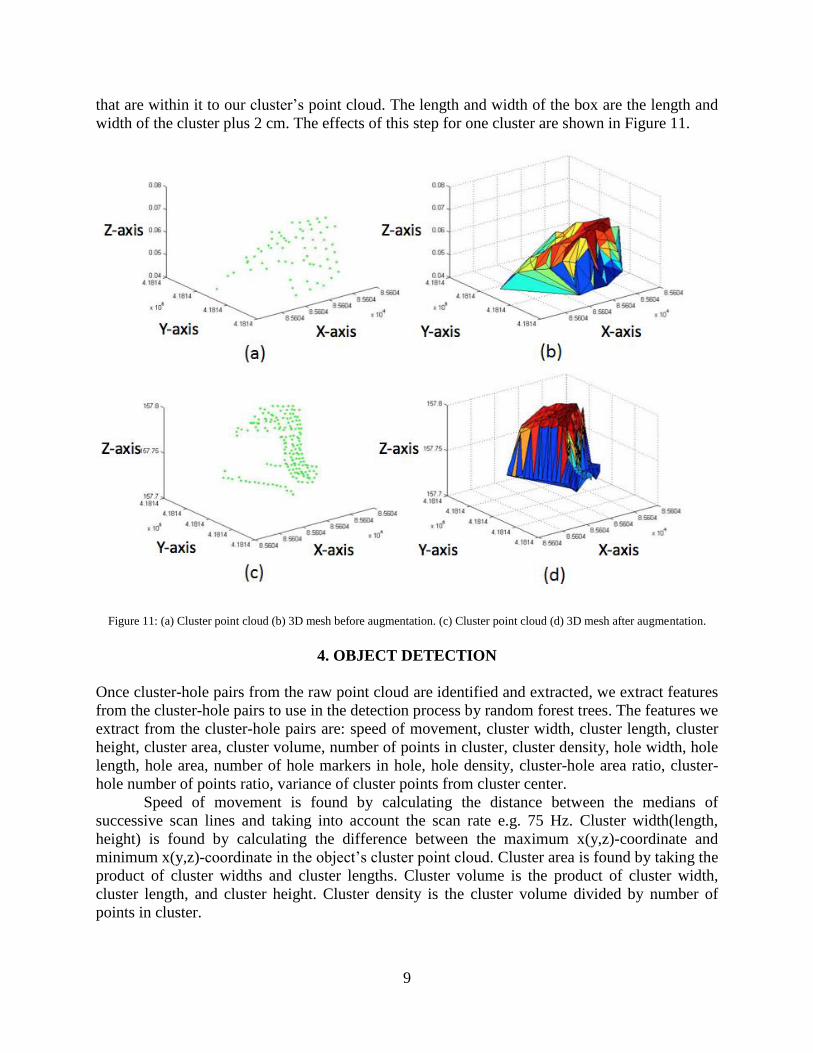
that are within it to our cluster’s point cloud. The length and width of the box are the length and
width of the cluster plus 2 cm. The effects of this step for one cluster are shown in Figure 11.
Figure 11: (a) Cluster point cloud (b) 3D mesh before augmentation. (c) Cluster point cloud (d) 3D mesh after augmentation.
4. OBJECT DETECTION
Once cluster-hole pairs from the raw point cloud are identified and extracted, we extract features
from the cluster-hole pairs to use in the detection process by random forest trees. The features we
extract from the cluster-hole pairs are: speed of movement, cluster width, cluster length, cluster
height, cluster area, cluster volume, number of points in cluster, cluster density, hole width, hole
length, hole area, number of hole markers in hole, hole density, cluster-hole area ratio, cluster-
hole number of points ratio, variance of cluster points from cluster center.
Speed of movement is found by calculating the distance between the medians of
successive scan lines and taking into account the scan rate e.g. 75 Hz. Cluster width(length,
height) is found by calculating the difference between the maximum x(y,z)-coordinate and
minimum x(y,z)-coordinate in the object’s cluster point cloud. Cluster area is found by taking the
product of cluster widths and cluster lengths. Cluster volume is the product of cluster width,
cluster length, and cluster height. Cluster density is the cluster volume divided by number of
points in cluster.

10
Hole width(length) is found by calculating the difference between the maximum x(y)-
coordinate and minimum x(y)-coordinate in the object’s hole point cloud. Hole area is found by
multiplying hole width and hole length together. Number of hole markers in a hole is a sum of
the number of hole markers placed in a hole during the hole finding algorithm. Hole density is
the hole area divided by number of hole markers in hole. Cluster-hole area ratio is found by
dividing cluster area by hole area. Cluster-hole number of points ratio is found by dividing
number of points in cluster by number of hole markers in hole. Variance of cluster points from
cluster center is found by calculating the variance from the distances of cluster points from
center of cluster.
After these features have been computed, we use a weighted random forest tree classifier
to detect objects of interest. We use this classifier because it is accurate, provides an estimate of
what variables are important in classification, and does not overfit if an excess of trees are run
[7]. The random forest tree is trained and tested with manually sorted data from our datasets
using 10 fold cross validation. Two different tests were run: all 5 mph datasets and total. Exact
brick configurations and vehicle speed are shown in Table 3 and Table 4.
Brick Configuration Vehicle Speed
0 - None 5 MPH – Forward
1 - Center-Perpendicular 5 MPH – Forward
2 - Center-Parallel 5 MPH – Forward
3 - Side-Perpendicular 5 MPH – Forward
4 - Side-Parallel 5 MPH – Forward
0 - None 5 MPH – Backward
1 - Center-Perpendicular 5 MPH – Backward
2 - Center-Parallel 5 MPH – Backward
3 - Side-Perpendicular 5 MPH – Backward
4 - Side-Parallel 5 MPH – Backward Table 3: Test 1 datasets used for 5 mph runs.
Brick Configuration Vehicle Speed
0 - None 2 MPH – Forward
1 - Center-Perpendicular 2 MPH – Forward
2 - Center-Parallel 2 MPH – Forward
3 - Side-Perpendicular 2 MPH – Forward
4 - Side-Parallel 2 MPH – Forward
0 - None 5 MPH – Forward
1 - Center-Perpendicular 5 MPH – Forward
2 - Center-Parallel 5 MPH – Forward
3 - Side-Perpendicular 5 MPH – Forward
4 - Side-Parallel 5 MPH – Forward
0 - None 5 MPH – Backward
1 - Center-Perpendicular 5 MPH – Backward
2 - Center-Parallel 5 MPH – Backward
3 - Side-Perpendicular 5 MPH – Backward
4 - Side-Parallel 5 MPH – Backward
11
0 - None 10 MPH – Forward
1 - Center-Perpendicular 10 MPH – Forward
2 - Center-Parallel 10 MPH – Forward
3 - Side-Perpendicular 10 MPH – Forward
4 - Side-Parallel 10 MPH – Forward Table 4: Test 2 datasets used for mixed speeds.
For each test cluster, the classifier calculates a percentage of how similar the cluster is to
the objects of interest in the training data. The weight portion of the random forest tree classifier
relates to the threshold where clusters are classified as an object of interest. By lowering the
threshold, we will have a higher false alarm rate, but a lower missed detection rate. Typically, a
weight ratio is inversely proportional to the ratio of the number of objects of interest to the
number of non-objects of interest.
5. RESULTS
Our objects of interest are bricks laying on the road in various orientations and locations,
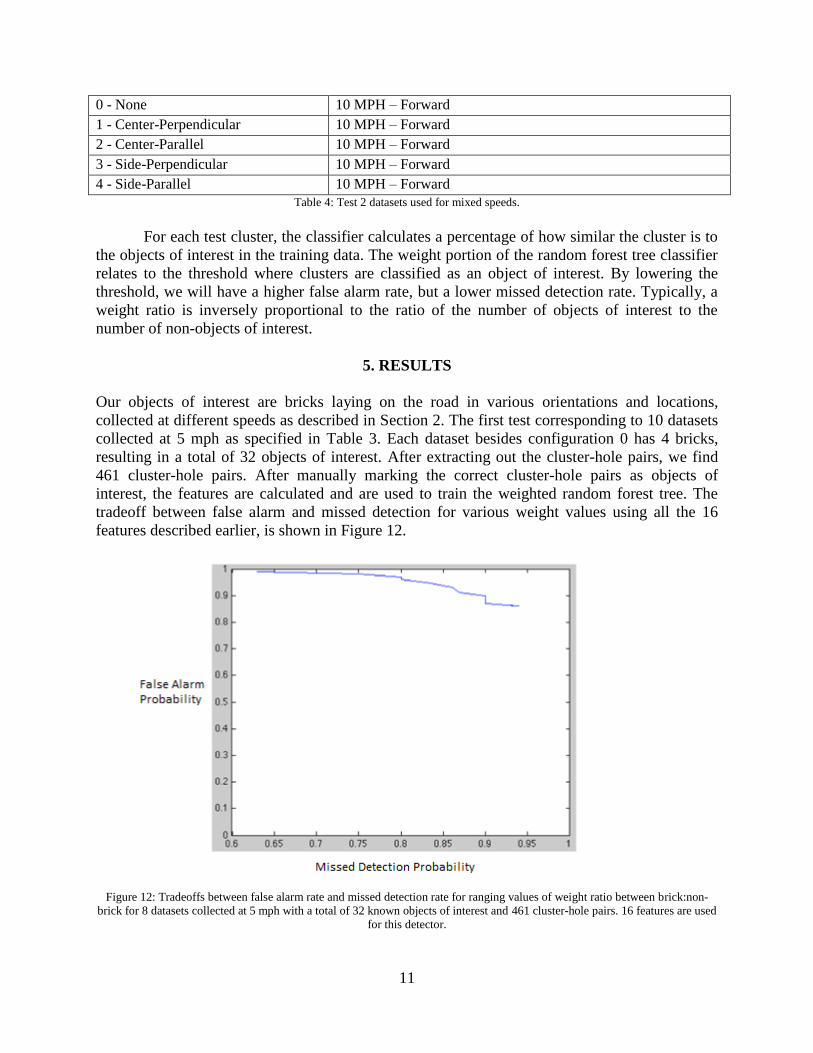
collected at different speeds as described in Section 2. The first test corresponding to 10 datasets
collected at 5 mph as specified in Table 3. Each dataset besides configuration 0 has 4 bricks,
resulting in a total of 32 objects of interest. After extracting out the cluster-hole pairs, we find
461 cluster-hole pairs. After manually marking the correct cluster-hole pairs as objects of
interest, the features are calculated and are used to train the weighted random forest tree. The
tradeoff between false alarm and missed detection for various weight values using all the 16
features described earlier, is shown in Figure 12.
Figure 12: Tradeoffs between false alarm rate and missed detection rate for ranging values of weight ratio between brick:non-
brick for 8 datasets collected at 5 mph with a total of 32 known objects of interest and 461 cluster-hole pairs. 16 features are used
for this detector.

12
The second test corresponding to 20 datasets collected at mixed speeds as specified in
Table 4. Each dataset besides configuration 0 has 4 bricks, resulting in a total of 64 objects of
interest. We extract 832 cluster-hole pairs. After manually marking the correct cluster-hole pairs
as objects of interest, the features were calculated and input to the weighted random forest tree.
The tradeoff between false alarm and missed detection for various weight values using all the 16
features mentioned earlier is shown in Figure 13.
Figure 13: Tradeoffs between false alarm rate and missed detection rate for ranging values of weight ratio between brick:non-
brick for 16 datasets collected at speeds 2 mph, 5 mph, and 10 mph with a total of 64 known objects of interest and 832 cluster-
hole pairs. 16 features are used in this detector.
In both tests, the 3 features found to be most useful for the detection of bricks were
number of points in cluster, variance of cluster points from cluster center, and hole area. To
further specify the results, the 2 tests are repeated with only these 3 features. The tradeoffs
between false alarm and missed detection using 3 features only are shown in Figures 14 and 15.

13
Figure 14: Tradeoffs between false alarm rate and missed detection rate for ranging values of weight ratio between brick:non-
brick for 8 datasets collected at 5 mph with a total of 32 known objects of interest and 461 cluster-hole pairs. Features limited to
number of points in cluster, variance of cluster points from cluster center, and hole area.
Figure 15: Tradeoffs between false alarm rate and missed detection rate for ranging values of weight ratio between brick:non-
brick for 16 datasets collected at speeds 2 mph, 5 mph, and 10 mph with a total of 64 known objects of interest and 832 cluster-
hole pairs. Features limited to number of points in cluster, variance of cluster points from cluster center, and hole area.
As expected, there is some degradation in performance in reducing the number of features from
16 to 3. Overall, the performance is still reasonable. An example of a correctly detected object is
shown in Figure 16.

14
Figure 16: (a) Point cloud (b) 3D mesh of a correctly detected object.
An example of a missed detection of an object is shown in Figure 17:
Figure 17: (a) Point cloud (b) 3D mesh of a missed detection.
An example of a false alarm is shown in Figure 18:

15
Figure 18: Two examples of falsely detected target clusters. Weight ratio between brick:non-brick is 10:1.
The likely reason for incorrectly classified clusters is the fundamental inability of LiDAR
to distinguish between objects of interest, i.e. bricks, and other bumps on the road with similar
size and shape as a brick.
6. CONCLUSIONS AND FUTURE WORK
After performing data collection and processing, using 16 features in our weighted random forest
tree, we capture about 95% of the objects of interest in both tests with a false alarm rate of 10%.
The quality of the object identification by our proposed method is highly dependent on the
quality of the laser scanning process. Clearly greater scan density can result in greater precision.
One method of increasing scan density is a reduction in vehicle velocity. Another is to increase
the number of scanners. Each brick corresponds to 30-40 points in the cluster space at 5 mph.
Future work includes expansion to include detection of a larger class of objects of
interest. This likely requires different features to be calculated for the weighted random forest
classifier and much more data to be collected. Another possibility is to increase the number of
sensors to allow for higher velocities. Additionally, integration with other sensors, in particular
radar, is another area of interest. One of the advantages of a multi-modal approach is the sensors
can complement each other. For example, radar has issues in distinguishing returns from
reflections. Using LiDAR, we may be able to detect walls and remove reflections; unlike
LiDAR, radar can penetrate surfaces to return more information about a particular object.
REFERENCES
[1] M. Johnston and A.Zakhor. “Estimating building Floor-plans from exterior using laser
scanners”. SPIE Electronic Imaging Conference, 3D Image Capture and Applications,
San Jose, California, January 2008.
[2] G. Vosselman. “Slope based filtering of laser altimetry data”. International Archives of
Photogrammetry, Remote Sensing and Spatial Information Sciences, 33(B3/2):935–942,
2000.
[3] F. Rottensteiner and C. Briese. “A new method for building extraction in urban areas
from high-resolution lidar data”. International Archives Photogrammetry and Remote
Sensing (IAPRS), 34(3A):295–301, 2002.

16
[4] C. Fruh and A. Zakhor. “Constructing 3d city models by merging aerial and ground
views”. IEEE Computer Graphics and Applications, 23(6):52–61, 2003.
[5] J. Andrews. “Merging fast surface reconstructions of ground-based and airborne lidar
range data”. Master’s thesis, University of California, Berkeley, 2009.
[6] M. Carlberg, J. Andrews, P. Gao, and A. Zakhor. “Fast surface reconstruction and
segmentation with ground-based and airborne lidar range data”. 3DPVT ’08: Proceedings
of the Fourth International Symposium on 3D Data Processing, Visualization, and
Transmission, pages 97–104, 2008.
[7] Breiman, Leo, and Adele Cutler. “Random Forests - Classification
Description”.Department of Statistics Homepage. Web. 28 Apr. 2010.
<http://www.stat.berkeley.edu/~breiman/RandomForests/cc_home.htm>.
[8] Karsten Haug. “Method and system for assisting the driver of a motor vehicle in
identifying road bumps”. United States Patent Application publication, Publication
number 11/824,098, June 2007
[9] J. Roberts and P. Corke. “Obstacle detection for a mining vehicle using a 2D laser”.
Proceedings of the Australian Conference on Robotics, 2000.
[10] R. Manduchi, A. Castano, A. Talukder, and L. Matthies. “Obstacle Detection and
Terrain Classification for Autonomous Off-Road Navigation”, in Autonomous robots,
volume 18, no. 1, Jan. 2005
[11] J. C. Last and Robbie Main. “Techniques Used In Autonomous Vehicle Systems:
A Survey”, University of Iowa, Artificial Intelligence course, 2009