31e00700 labor economics: lecture 6 - aalto-econ.fi · mium represents a fixed weighted average...
TRANSCRIPT

31E00700 Labor Economics:Lecture 6
Matti Sarvimäki
12 Nov 2012

Introduction Stylized Facts Competitive Labor Markets The Impact of Immigration
First Part of the Course: Outline
1 Supply of labor2 Demand for labor3 Labor market equilibrium
1 Perfectly competitive markets; immigration (today)2 Imperfectly competitive labor markets; minimum wages
3 Roy model; technological change and polarization
31E00700 Labor Economics: Lecture 6 Matti Sarvimäki
Introduction Stylized Facts Competitive Labor Markets The Impact of Immigration
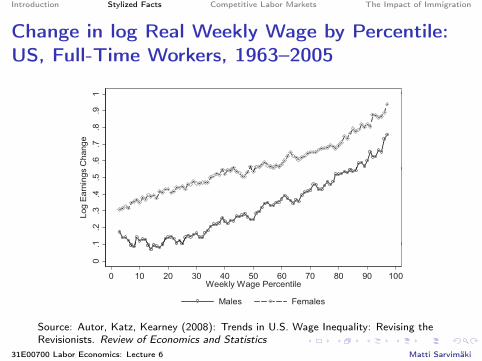
Change in log Real Weekly Wage by Percentile:US, Full-Time Workers, 1963–2005
tail inequality); between-group wage differentials, illus-trated using the college/high school wage premium; andwithin-group (residual) wage inequality, summarized by the90/10, 90/50, and 50/10 residual wage gaps conditioning onmeasures of education, age/experience, and gender.10
Figures 2A and 2B display the evolution of the 90/10overall and residual wage gaps for males and the college/high school log wage premium for our two core samples;March FTFY 1963 to 2005 and CPS May/ORG hourly 1973to 2005. The estimated college/high school log wage pre-mium represents a fixed weighted average of the college-plus/high school wage gaps separately estimated for malesand for females in four different experience groups. Thefigure underscores a key, and oft-neglected, fact about theevolution of U.S. wage inequality, which is that the rise ofinequality is not a unitary phenomenon. While all threeinequality measures expand in tandem during the 1980sthen flatten somewhat in the 1990s, the series diverged inboth the 1970s and the 1960s. Specifically, while overalland residual inequality were either modestly rising (March)or flat (May/ORG) during the 1970s, the college wagepremium declined sharply in this decade and then re-bounded even more rapidly during the 1980s. The collegewage premium expanded considerably during the 1960s,even while aggregate inequality was quiescent. These di-vergent patterns suggest that the growth of inequality isunlikely to be adequately explained by any single factor.
Underlying the rapid growth of overall wage inequalityduring the 1980s followed by a deceleration in the 1990s isa divergence in inequality trends at the top and bottom ofthe wage distribution. This divergence is shown in figure 3,
10 The robustness of conclusions concerning the timing of changes inoverall and residual wage inequality changes to the choice of wageconcept and sample are illustrated in an online reference, tables 1a and 1b,which presents changes over consistent subperiods from 1975 to 2005 ofdifferent measures of inequality for males, females, and both combinedusing weekly earnings for full-time workers and hourly wages for allworkers for the March CPS and May/ORG CPS.
FIGURE 1.—CHANGE IN LOG REAL WEEKLY WAGE BY PERCENTILE, FULL-TIME WORKERS, 1963–2005
1.6
.7.8
.91
Cha
nge
1.2
.3.4
.5
Log
Ear
ning
s
0. 1
0 10 20 30 40 50 60 70 80 90 100Weekly Wage Percentile
Males Females
Source: March CPS data for earnings years 1963–2005, full-time, full-year workers ages 16 to 64 with0 to 39 years of potential experience whose class of work in their longest job was private or governmentwage/salary employment. Full-time, full-year workers are those who usually worked 35-plus hours perweek and worked forty plus weeks in the previous year. Weekly earnings are calculated as the logarithmof annual earnings divided by weeks worked. Calculations are weighted by CPS sampling weights andare deflated using the personal consumption expenditure (PCE) deflator. Earnings of below $67/week in1982 dollars ($112/week in 2000 dollars) are dropped. Allocated earnings observations are excluded inearnings years 1967 forward using either family earnings allocation flags (1967–1974) or individualearnings allocation flags (1975 earnings year forward).
FIGURE 2.—THREE MEASURES OF WAGE INEQUALITY: COLLEGE/HIGH
SCHOOL PREMIUM, MALE 90/10 OVERALL INEQUALITY, AND MALE 90/10RESIDUAL INEQUALITY
Sample for panel A is full-time, full-year workers from March CPS for earnings years 1963–2005.Sample for panel B is CPS May/ORG, all hourly workers for earnings years 1973–2005. Processing ofMarch CPS data A is detailed in table 1 and figure 1 notes. For panel B, samples are drawn from MayCPS for 1973 to 1978 and CPS Merged Outgoing Rotation Group for years 1979 to 2005. Sample islimited to wage/salary workers ages 16 to 64 with 0 to 39 years of potential experience in currentemployment. Calculations are weighted by CPS sample weight times hours worked in the prior week.Hourly wages are equal to the logarithm of reported hourly earnings for those paid by the hour and thelogarithm of usual weekly earnings divided by hours worked last week for nonhourly workers. Top-codedearnings observations are multiplied by 1.5. Hourly earners of below $1.675/hour in 1982 dollars($2.80/hour in 2000 dollars) are dropped, as are hourly wages exceeding 1/35th the top-coded value ofweekly earnings. All earnings are deflated by the chain-weighted (implicit) price deflator for personalconsumption expenditures (PCE). Allocated earnings observations are excluded in all years, except whereallocation flags are unavailable (January 1994 to August 1995). Where possible, we identify and dropnonflagged allocated observations by using the unedited earnings values provided in the source data.
The college/high school wage premium series depicts a fix-weighted ratio of college to high/school wagesfor a composition-constant set of sex-education-experience groups (two sexes, five education categories, andfour potential experience categories). See table 1 notes and data appendix for further details.
The overall 90/10 inequality series depicts the difference between the 90th and 10th percentile of logweekly (March) or log hourly (May/ORG) male earnings. The residual 90/10 series depicts the 90/10difference in wage residuals from a regression of the log wage measure on a full set of age dummies,dummies for nine discrete/schooling categories, and a full set of interactions among the schoolingdummies and a quartic in age.
TRENDS IN U.S. WAGE INEQUALITY 303
Source: Autor, Katz, Kearney (2008): Trends in U.S. Wage Inequality: Revising theRevisionists. Review of Economics and Statistics
31E00700 Labor Economics: Lecture 6 Matti Sarvimäki
Introduction Stylized Facts Competitive Labor Markets The Impact of Immigration
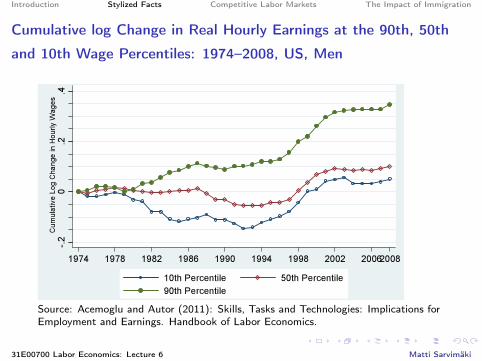
Cumulative log Change in Real Hourly Earnings at the 90th, 50th
and 10th Wage Percentiles: 1974–2008, US, Men
!
!"#$%&'()'
!Source: Acemoglu and Autor (2011): Skills, Tasks and Technologies: Implications forEmployment and Earnings. Handbook of Labor Economics.
31E00700 Labor Economics: Lecture 6 Matti Sarvimäki
Introduction Stylized Facts Competitive Labor Markets The Impact of Immigration
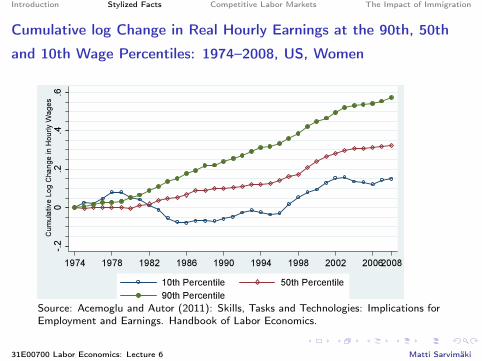
Cumulative log Change in Real Hourly Earnings at the 90th, 50th
and 10th Wage Percentiles: 1974–2008, US, Women
!"#$%&'()'
!Source: Acemoglu and Autor (2011): Skills, Tasks and Technologies: Implications forEmployment and Earnings. Handbook of Labor Economics.
31E00700 Labor Economics: Lecture 6 Matti Sarvimäki

Introduction Stylized Facts Competitive Labor Markets The Impact of Immigration
Real disposable income growth, 1966–1990,Finland
Source: Riihelä (2009): Essays on income inequality, poverty and the evolution of topincome shares. VATT-publications 52.
31E00700 Labor Economics: Lecture 6 Matti Sarvimäki

Introduction Stylized Facts Competitive Labor Markets The Impact of Immigration
Potential Explanations
Supply of skillsEducation, female participation, birth cohort size, immigration
Demand for skillsTechnological change, trade, outsoucing
Institutions / policyDecline of unions, minimum wage
31E00700 Labor Economics: Lecture 6 Matti Sarvimäki

Introduction Stylized Facts Competitive Labor Markets The Impact of Immigration
Equilibrium in a Competitive Labor Market
S
D0
w*
P
Q
E* EHEL
Dollars
Employment
The labor market is in equilibrium when supply equals demand; E* workers are
employed at a wage of w*. In equilibrium, all persons who are looking for work
at the going wage can find a job. The triangle P gives the producer surplus;
the triangle Q gives the worker surplus. A competitive market maximizes the
gains from trade, or the sum P + Q.
31E00700 Labor Economics: Lecture 6 Matti Sarvimäki

Introduction Stylized Facts Competitive Labor Markets The Impact of Immigration
Competitive Equilibrium Across Labor Markets
If workers were mobile and entry and exit of workers to thelabor market was free, then there would be a single wage paidto all workers.The allocation of workers to firms equating the wage to thevalue of marginal product is also the allocation that maximizesnational income (this is known as allocative efficiency).The “invisible hand” process: self-interested workers and firmsaccomplish a social goal that no one had in mind, i.e.,allocative efficiency.
31E00700 Labor Economics: Lecture 6 Matti Sarvimäki

Competitive Equilibrium Across Labor Markets
SS
Dollars
Employment
wS
DS
(b) The Southern Labor Market
Dollars
Employment
SN
wN
DN
(a) The Northern Labor Market
Suppose the wage in the northern region (wN) exceeds the wage in the
southern region (wS). Southern workers want to move North, shifting the
southern supply curve to the left and the northern supply curve to the right. In
the end, wages are equated across regions at w*. Total production increases by
ABC and the allocation of labor is now efficient.

Competitive Equilibrium Across Labor Markets
SS
Dollars
Employment
SS
w*
wS
DS
(b) The Southern Labor Market
Dollars
Employment
SN
wN
w*
DN
(a) The Northern Labor Market
s!
A
B
C
Suppose the wage in the northern region (wN) exceeds the wage in the
southern region (wS). Southern workers want to move North, shifting the
southern supply curve to the left and the northern supply curve to the right. In
the end, wages are equated across regions at w*. Total production increases by
ABC and the allocation of labor is now efficient.

Introduction Stylized Facts Competitive Labor Markets The Impact of Immigration
Wage Convergence Across States
Pe
rce
nt A
nn
ua
l W
ag
e G
row
th
Manufacturing Wage in 1950.9 1.1 1.3 1.5 1.7 1.9
4.5
4.7
4.9
5.1
5.3
5.5
5.7
AL
AZ
AR
CA
CO
CTDE
FL
GA
ID
ILIN
IA
KS
KY
LA
ME
MDMA
MI
MN
MS
MO
MT
NE
NV
NH
NJ
NM
NY
NC
ND
OHOK
OR
PA
RI
SC
SD
TN
TX
UT
VTVA
WA
WVWI
WY
Source: Blanchard, Katz (1992).Regional Evolutions, Brookings Papers on
Economic Activity 1:1-61.
31E00700 Labor Economics: Lecture 6 Matti Sarvimäki

The Short-Run Impact of Immigration:Homogeneous Workers
Dollars
Supply
w0
w1
Demand
N0EmploymentE1N1
As immigrants and natives are perfect substitutes, the two groups are
competing in the same labor market. Immigration shifts out the labor supply
curve. As a result, the wage falls from w0 to w1, and total employment
increases from N0 to E1. At the lower wage, the number of natives who work
declines from N0to N1
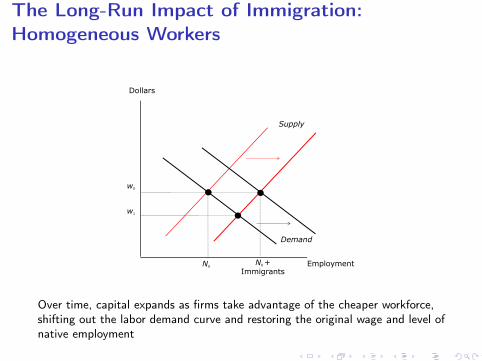
The Long-Run Impact of Immigration:Homogeneous Workers
Dollars
Supply
w0
w1
Demand
N0EmploymentN0 +
Immigrants
Over time, capital expands as firms take advantage of the cheaper workforce,
shifting out the labor demand curve and restoring the original wage and level of
native employment

A Model of High- and Low-Skilled Workers
Cobb-Douglass production function
q = AHαL
1−α
where A is a productivity term, H the number of high-skilled workers, L the
number of low-skilled workers (we omit capital as the focus is on the long-run).
Wages
wH = qH (�) = αA
�L
H
�1−α
wL = qL (�) = (1 − α)A
�H
L
�α
Thus δwH/δH < 0, δwL/δL < 0 and δwL/δH > 0, δwH/δL > 0
→ If immigrants low-skilled, high-skilled natives benefit andlow-skilled natives lose (and vice versa)

Introduction Stylized Facts Competitive Labor Markets The Impact of Immigration
Impact of Immigration
Homogeneous workers / immigrants and natives have similar skills
decrease employment and wages of natives in the short run
... but there is no long-run impact
When immigrants alter the skill mixworkers who are gross substitutes to immigrants loseworkers who are gross complements to immigrants win
gross complement = may be substitutes in production, but
the scale effect exceeds the substitution effect
the winners win more than losers lose (immigration surplus)
31E00700 Labor Economics: Lecture 6 Matti Sarvimäki

The Immigration Surplus
Dollars
S!S
0
C
B
N M
A
w0
w1
D
Dollars
Employment
S!S
0
C
B
N M
A
w0
w1
D
F
Prior to immigration, there are N native workers in the economy and national
income is given by the trapezoid ABN0. Immigration increases the labor supply
to M workers and national income is given by the trapezoid ACM0. Immigrants
are paid a total of FCMN dollars as salary. The immigration surplus gives the
increase in national income that accrues to natives and is given by the area in
the triangle BCF.

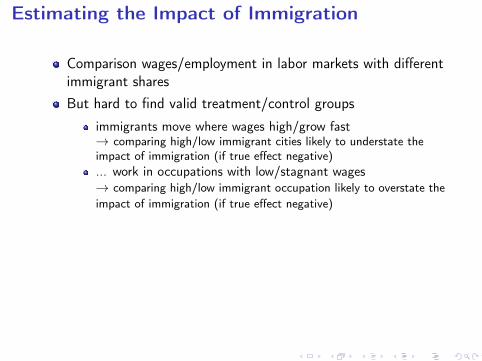
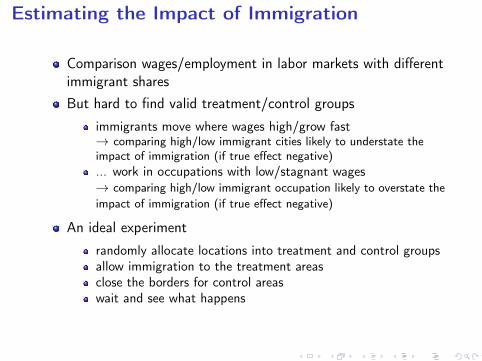
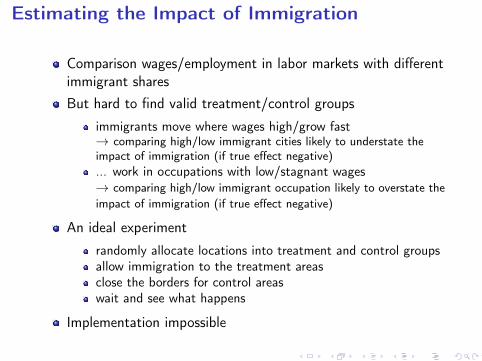
Estimating the Impact of Immigration
Comparison wages/employment in labor markets with differentimmigrant shares
But hard to find valid treatment/control groupsimmigrants move where wages high/grow fast
→ comparing high/low immigrant cities likely to understate the
impact of immigration (if true effect negative)
... work in occupations with low/stagnant wages
→ comparing high/low immigrant occupation likely to overstate the
impact of immigration (if true effect negative)
An ideal experimentrandomly allocate locations into treatment and control groups
allow immigration to the treatment areas
close the borders for control areas
wait and see what happens
Implementation impossible
Estimating the Impact of Immigration
Comparison wages/employment in labor markets with differentimmigrant sharesBut hard to find valid treatment/control groups
immigrants move where wages high/grow fast
→ comparing high/low immigrant cities likely to understate the
impact of immigration (if true effect negative)
... work in occupations with low/stagnant wages
→ comparing high/low immigrant occupation likely to overstate the
impact of immigration (if true effect negative)
An ideal experimentrandomly allocate locations into treatment and control groups
allow immigration to the treatment areas
close the borders for control areas
wait and see what happens
Implementation impossible

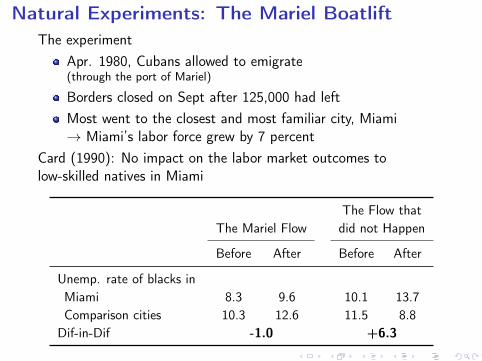
Natural Experiments: The Mariel BoatliftThe experiment
Apr. 1980, Cubans allowed to emigrate(through the port of Mariel)
Borders closed on Sept after 125,000 had leftMost went to the closest and most familiar city, Miami→ Miami’s labor force grew by 7 percent
Card (1990): No impact on the labor market outcomes tolow-skilled natives in Miami
The Flow that
The Mariel Flow did not Happen
Before After Before After
Unemp. rate of blacks in
Miami 8.3 9.6 10.1 13.7
Comparison cities 10.3 12.6 11.5 8.8
Dif-in-Dif -1.0 +6.3

Introduction Stylized Facts Competitive Labor Markets The Impact of Immigration
Local vs. National Variation
Problems with the spatial correlations approachControl group may not be valid (the “second boatlift” that did nothappen; Angrist and Krueger, 1999)
Control areas may be affected by the treatmenttrade (Rybczynski Theorem)
native outmigration from Miami
capital flows to Miami
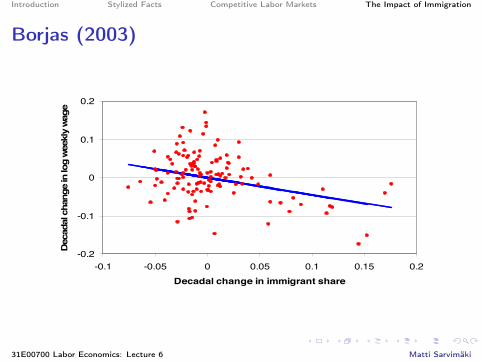
Borjas (2003): The Labor Demand Curve Is Downward SlopingDefines labor markets by age and education at national level
10% increase in labor supply → 3–4% decline in wages
Problems (Card 2009, Ottaviano and Peri 2010)
skill-bias technological change could lead to similar results
results sensitive to how education is defined
31E00700 Labor Economics: Lecture 6 Matti Sarvimäki

Introduction Stylized Facts Competitive Labor Markets The Impact of Immigration
Local vs. National Variation
Problems with the spatial correlations approachControl group may not be valid (the “second boatlift” that did nothappen; Angrist and Krueger, 1999)
Control areas may be affected by the treatmenttrade (Rybczynski Theorem)
native outmigration from Miami
capital flows to Miami
Borjas (2003): The Labor Demand Curve Is Downward SlopingDefines labor markets by age and education at national level
10% increase in labor supply → 3–4% decline in wages
Problems (Card 2009, Ottaviano and Peri 2010)
skill-bias technological change could lead to similar results
results sensitive to how education is defined
31E00700 Labor Economics: Lecture 6 Matti Sarvimäki
Introduction Stylized Facts Competitive Labor Markets The Impact of Immigration
Borjas (2003)
-0.2
-0.1
0
0.1
0.2
-0.1 -0.05 0 0.05 0.1 0.15 0.2Decadal change in immigrant share
Dec
adal
cha
nge
in lo
g w
eekl
y w
age
31E00700 Labor Economics: Lecture 6 Matti Sarvimäki

Introduction Stylized Facts Competitive Labor Markets The Impact of Immigration
Mass Migration to Israel (Friedberg, 2001)
Collapse of the Soviet Union → mass migration to Israelincreased the population of Israel by 13.6% in 1989–1995
mostly high-skilled workers (physicians, engineers etc)
Identification strategydefine labor markets by occupation
use occupation in fSU as an instrument for occupation in Israel
The key identifying assumptionoccupational composition of Soviet immigrants independent of
time-variant shocks affecting wages/employment at
occupational level in Israel
In essence: people chose to migrate because of conditions in
fSU and Israel was their only immediate option
31E00700 Labor Economics: Lecture 6 Matti Sarvimäki

Estimation
Basic estimation equation
wjt = α+ Xjtβ + γrjt + �jt
where wjt is the average native log-wage in occupation j at time t, Xjt
occupational-level observables & year dummies, rjt ratio of immigrant to native
workers (the treatment) and ejt summarizes unobservable factors affecting wjt .
OLS in levels consistent if rjt and �jt uncorrelated
if immigrants do jobs that natives don’t want, cov (rjt , �jt) < 0
→ OLS estimates likely to be biased downwards
Dif-in-dif: difference out occupation fixed-effects
if immigrants employed in declining occupations, cov (rjt , �jt |ηj ) < 0
To deal with occupational downgrading: instrument rjt with pjt
pjt =ratio of immigrant to native workers if immigrants would
remain in the same occupations as before migration
identifying assumption, cov (pjt , �jt) = 0

ResultsTable I
Russians more educated than Israelis, more likely to work full time... have average hourly wages 45% less than Israelis
Table II, Figs III–VI
each number comes from a separate regressionunit of observation is occupation
Col 1: occupation in fSU and Israel correlated→ IV has first-stageFig III: occupational downgrading seems important
occupations below 45º degree line: engineers, managers, physicians andteachersoccupations above 45º degree line: service workers, housemaids,locksmith/welders
Col 2, Fig IV: negative OLS in levels estimate = occupations with a high shareof immigrants have low wagesCol 3, row 1 & Fig V: negative dif-in-dif estimate = occupations whereimmigrant share is rising fast experience slower wage growthCol 3, row 2 & Fig VI: positive but insignificant “reduced form” estimate =occupations where Russian immigrants used to work before migration do notexperience slower wage growthCol 3, row 3: positive but insignificant IV estimate: no evidence thatimmigration causes the negative association in col 2–3

ResultsTable III: similar to Table II, but now with microdata (and rows andcolumns the other way around)
increases statistical powercontrols for the composition of workers (education,age,gender, ethnicity, nativity, years-since-migration)Col 1: negative OLS
if this was causal, a 10% immigration induced increase in labor
supply would decrease native wages by 3.2%
smaller than in Tab II: natives working with immigrants have
below average education
Col 2: strong first-stageCol 3: positive and significant reduced formCol 4: positive and significant IV estimate
point estimate suggest that a 10% immigration induced
increase in labor supply would increase native wages by 7%
note that the 95% confidence interval is [0.046,1.39]

Introduction Stylized Facts Competitive Labor Markets The Impact of Immigration
Immigrant-Native Complementarity
Friedberg’s results suggest immigrants and natives arecomplements even within occupation
Sussman and Zakai (1998): Russian physicians confined to
generalists positions → Israeli physicians promoted to fill the
higher-paying ranks of the health care system
Peri and Sparber (2009): Task Specialization, Immigration and Wages.
American Economic Journal: Applied Economics, D’Amuri and Peri
(2010):Immigration and Occupations in Europe, CReAM WP, University
College London.
Immigrants replace “tasks”, not workers
Immigrants typically supply manual skills → push natives to
(higher-wage) jobs requiring communication skills
31E00700 Labor Economics: Lecture 6 Matti Sarvimäki

Introduction Stylized Facts Competitive Labor Markets The Impact of Immigration
Concluding Remarks
Basic models suggest that immigration hurts some andbenefits others
but how many are hurt and how much remains controversial
(see Lowenstein: The Immigration Equation. New York Times Magazine)
Impact on native wages/employment may be muted becauseeconomies adjust in many ways
(employment, wages, production structure, technology)
immigrants and natives are not perfect substitutes (even within
narrow education/occupation categories) → previous immigrants
most affected by new immigration
31E00700 Labor Economics: Lecture 6 Matti Sarvimäki