31december2010 india daily
TRANSCRIPT
For Private Circulation Only. FOR IMPORTANT INFORMATION ABOUT KOTAK SECURITIES’ RATING SYSTEM AND OTHER DISCLOSURES. REFER TO THE END OF THIS MATERIAL.
INDIA DAILYDecember 31, 2010
Kotak Institutional Equities Research [email protected] . Mumbai: +94-22-6634-1100
India 30-Dec 1-day1-mo 3-mo
Sensex 20,389 0.7 4.4 1.6
Nifty 6,102 0.7 4.1 1.2
Global/Regional indices
Dow Jones 11,570 (0.1) 5.1 7.2
Nasdaq Composite 2,663 (0.1) 6.6 12.4
FTSE 5,971 (0.4) 8.0 7.6
Nikkie 10,229 (1.1) 2.9 9.2
Hang Seng 22,999 0.1 (0.0) 2.9
KOSPI 2,051 0.4 7.7 9.5
Value traded – India
Cash (NSE+BSE) 185 182 207
Derivatives (NSE) 1,682 1,150 2,116
Deri. open interest 1,687 1,303 2,107
Forex/money market
Change, basis points
30-Dec 1-day 1-mo 3-mo
Rs/US$ 44.8 (9) (109) (17)
10yr govt bond, % 7.9 2 (13) 9
Net investment (US$mn)
29-Dec MTD CYTD
FIIs 134 (466) 28,525
MFs (52) 322 (282)
Top movers -3mo basis
Change, %
Best performers 30-Dec 1-day 1-mo 3-mo
TCS IN Equity 1170.2 1.1 8.8 26.2
HNDL IN Equity 244.7 1.3 18.4 24.2
IBULL IN Equity 170.9 3.0 (1.8) 20.0
SUNP IN Equity 482.5 0.4 7.8 19.4
TTMT IN Equity 1300.2 2.1 5.3 18.4
Worst performers
HDIL IN Equity 188.6 1.0 (0.4) (27.2)
SCS IN Equity 66.0 (1.3) 5.9 (26.9)
UT IN Equity 64.8 2.0 2.2 (26.6)
RELI IN Equity 810.4 0.6 (4.0) (24.2)
DLFU IN Equity 287.4 0.1 (6.3) (24.0)
Contents
Update Coal India: Stumbling over environment hurdle
News Round-up
With the Centre developing cold feet on increasing diesel prices, the finance ministry may give in to the petroleum ministry demand for increasing the govt.'s share in petroleum subsidy. (BSTD)
Despite the high statistical base last year, wholesale food inflation for the week ended Dec. 18 touched a 10 month high of 14.44%. (BSTD)
Growth of six core infrastructure sectors slumped to the lowest level since Sept. 2002 to 2.3% in Nov. 2010, primarily due to a steep fall in cement production durin the month. (BSTD)
The Reliance Anil Dhirubhai Ambani Group is rebranding all its businesses as "Reliance" rather than maintaining individual identities for each services. (ECNT)
The environment ministry have deferred clearances for JSW Steel's (JSTL IN) USD 5.55bn capacity expansion proposal at Bellary plant & sought details of coal linkage & disaster management plans among other things. (BSTD)
SBI (SBIN IN) plans to raise USD 2.66bn through bonds to fund its business growth. (BSTD)
MOIL (MOIL IN) is in talks with Gabon's govt. over acquiring possible mining concessions in central African state. Gabon is the world's second largest producer of manganese. (BSTD)
ONGC (ONGC IN) has hired an ultra-deep water drilling rig from Vantage Drilling Co. for USD 1.1bn for five years. (BSTD)
Sahara Group has bought Grosvenor House Hotel in Central London for USD 733.33mn, making it the one of the largest acquisitions in the hospitality space by an Indian company. (BSTD)
HCL Infosystems (HCLI IN) would acquire 20% stake in Dubai firm Techmart Telecom Distribution FZCO, through its Singapore based SPV. (BSTD)
KS Oils Ltd. (KSO IN) board has approved the allotment of 16.4 million equity shares of INR 1 each to its promoters. (BSTD)
Lanco Infratech (LANCI IN) has won a new USD 222.22mn road project in Uttar Pradesh. (BSTD)
Source: ECNT= Economic Times, BSTD = Business Standard, FNLE = Financial Express, THBL = Business Line.
Sampl
e Rep
ort

For private Circulation Only. FOR IMPORTANT INFORMATION ABOUT KOTAK SECURITIES’ RATING SYSTEM AND OTHER DISCLOSURES, REFER TO THE END OF THIS MATERIAL.
Management indicates production slippages on account of CEPI
CIL management has indicated that the production for the next two years will likely fall short of their original targets if stricter environmental norms and proposed classification of no-go mining areas continue to inhibit the required capacity ramp-up. We, however, highlight that lower-than-guided production is factored to an extent in our estimates as we build in production of 443 mn tons in FY2011E and 463 mn tons in FY2012E as against official company target of 460 mn tons and 486 mn tons, respectively; though we do not entirely rule out downside risks to our numbers if the standoff between Ministry of Coal and Ministry of Environment and Forest does not find an early resolution.
Comprehensive Environmental Pollution Index (CEPI) – a new environment hurdle
CIL management has indicated that a continuation of CEPI norms could impact production targets by 16 mn tons and 39 mn tons in FY2011E and FY2012E, respectively. CEPI was introduced by Ministry of Environment and Forest (MoEF) in 2009 to assess the environmental quality of industrial clusters in India. In January 2010, MoEF imposed a temporary moratorium on development projects in 43 clusters which also includes seven coalfields of CIL. The moratorium was put in place till August 2010 but was further extended by MoEF (in October 2010) till March 2011 thus further delaying the award of environmental clearance for these projects.
Maintain ADD with a target price of Rs345/share
We maintain our ADD rating with a target price of Rs345/share. Our target price is based on 12.5X FY2012E EPS adjusted for overburden removal and interest income and implies an EV/EBITDA of 9.2X on FY2012E EBITDA (adjusted for overburden removal). CIL currently trades at 15X FY2012E EPS (reported) and 9.7X FY2012E EBITDA (reported).
We highlight that if CIL were to achieve volumes of 435 mn tons in FY2012E, 5% lower than our estimate of 458 mn tons, earnings would be impacted by 14% to Rs18/share from Rs21/share currently, eroding Rs42/share from our target price of Rs345/share (see Exhibit 2). We maintain our estimates as we remain optimistic that the debate between environment and development will likely find a plausible solution that does not put to risk India’s energy requirements.
Coal India (COAL)
Metals & Mining
Stumbling over environment hurdle. Coal India Ltd continues to be plagued by environment hurdles, now manifested in the form of Comprehensive Environment Pollution Index (CEPI) that threatens 39 mn tons out of 486 mn tons of production targeted in FY2012E. We believe that the environmental hurdle remains a key bottleneck for projected volume growth and have maintained a conservative 4.7% CAGR in volumes versus the company target of 6% volume growth.
Coal IndiaStock data Forecasts/Valuations 2010 2011E 2012E
52-week range (Rs) (high,low) EPS (Rs) 15.2 17.8 20.8Market Cap. (Rs bn) 1,959.7 EPS growth (%) 363.0 16.8 16.7
Shareholding pattern (%) P/E (X) 20.4 17.4 14.9Promoters 90.0 Sales (Rs bn) 485.8 537.4 600.4FIIs 3.3 Net profits (Rs bn) 96.2 112.4 131.2MFs 0.4 EBITDA (Rs bn) 127.9 151.0 164.3
Price performance (%) 1M 3M 12M EV/EBITDA (X) 12.3 10.0 8.6Absolute (2.2) 0.0 0.0 ROE (%) 40.4 36.4 34.0Rel. to BSE-30 (6.3) 0.0 0.0 Div. Yield (%) 1.1 1.7 2.0
Company data and valuation summary
358-245
ADD
DECEMBER 31, 2010
UPDATE
Coverage view: Attractive
Price (Rs): 308
Target price (Rs): 345
BSE-30: 20,389
Sampl
e Rep
ort

Coal India Metals & Mining
KOTAK INSTITUTIONAL EQUITIES RESEARCH 3
In our view, CIL will likely continue to command premium multiples to account for (1) expectations of narrowing discount to global coal prices, and (2) constantly improving employee efficiency metrics that will further propel margin expansion. Lower-than-estimated volumes and possible imposition of mining tax could be a key risk to our earnings and valuation estimates.
Exhibit 1: Our target price implies an EV/EBITDA of 9X on FY2012E adjusted EBITDA Target price calculation of CIL
EBITDA (Rs bn) 147OBR (Rs bn) 32Adjusted EBITDA (Rs bn) 179Interest income (Rs bn) 32PAT (Rs bn) 131Adjusted PAT (Rs bn) 131EPS (Rs/share) 21Adjusted EPS (Rs/share) 21P/E on FY2012E adjusted PAT (X) 12.5Value of coal business (Rs bn) 1,636Cash (Rs bn) 543Market Cap (Rs bn) 2,179Target price 345
Notes.(1) Adjusted EBITDA is calculated after removing the effect OBR adjustment.(2) Adjusted PAT is calculating after removing the effect ofOBR adjustment and interest income net of taxes.
Source: Company, Kotak Institutional Equities estimates
Exhibit 2: 5% lower volumes in FY2012E erodes Rs42/share from our target price Sensitivity of target price to FY2012E volumes
413 435 458 481 505-10% -5% Base +5% +10%
985 121 153 187 221 2561,094 189 224 262 300 3391,216 264 304 346 387 4311,338 339 383 429 475 5231,471 422 470 521 572 625
Target priceVolumes in FY2012E (mn tons)
Ble
nd
ed
real
izat
ion
in
FY20
12E
(%)
Source: Company, Kotak Institutional Equities estimates
CEPI – affected coal blocks and subsidiaries
CEPI has identified 43 clusters in India as critically polluted and has temporarily stalled development projects in these clusters. These clusters include seven coalfields of CIL including Chandrapur, Korba, Jharia, Talcher, Singrauli, Raniganj and IB Valley. The directly affected CIL subsidiaries are ECL (Raniganj), BCCL (Jharia), SECL (Korba), NCL (Singrauli) and MCL (Talcher and IB Valley). CIL’s coalfields, identified as critical under CEPI, contributed 295 mn tons or 68% of FY2010 production and account for ~66% of CIL’s total extractable reserves of 21.75 bn tons (see Exhibit 4).
We also highlight that a significant portion of near-term capacity addition of CIL was supposed to be undertaken in the Talcher and IB Valley coalfields of MCL and continuation of CEPI norms could impact near-term ramp-up of capacity and hence production growth.
Sampl
e Rep
ort

Metals & Mining Coal India
4 KOTAK INSTITUTIONAL EQUITIES RESEARCH
Exhibit 3: ECL, CCL and MCL are lagging in production Subsidiary-wise production of CIL as of November 2010 (mn tons)
Production FY2011E April-Nov 2010 As of Nov-2010 FY2011E April-Nov 2010
ECL 33.0 18.3 17.8 53.8 96.9BCCL 29.0 18.5 17.6 60.8 95.5
CCL 50.0 29.6 25.9 51.7 87.5
WCL 46.5 28.9 27.0 58.0 93.4SECL 112.0 69.7 68.4 61.1 98.1
MCL 116.8 69.4 59.9 51.3 86.3
NCL 72.0 45.2 39.2 54.4 86.6NEC 1.3 0.6 0.5 38.6 80.9Total CIL 460.5 280.1 256.1 55.6 91.4
Production target Achieved (%)
Source: Company, Kotak Institutional Equities
‘No Go’—another stumbling block
Pursuant to a proposal dated July 8, 2010, MoEF introduced initiatives for the identification of environmentally sensitive areas classified as ‘No Go’ where coal mining activities would not be permitted. ‘No Go' areas for mining have been defined as those that have over 30% gross forest cover or over 10% weighted forest cover. Several significant coalfields where CIL is currently carrying on mining activities have been classified as ‘No Go’ including large mines such as North Karanpura in Jharkhand, IB Valley in Orissa and Chhattisgarh, Singrauli Coalfield in Madhya Pradesh and Uttar Pradesh and Talcher coalfield in Orissa.
Sampl
e Rep
ort

Coal India Metals & Mining
KOTAK INSTITUTIONAL EQUITIES RESEARCH 5
Exhibit 4: CEPI-affected coalfields contributed 68% of FY2010 production Production and reserves profile of CIL coalfields
Capacity ProductionCoalfield Subsidiary Location (mn tons) (mn tons) Proved Indicated Inferred Reserves ExtractableBCCL
Jharia BCCL Dhanbad,Bokaro/Jharkhand 32.74 27.45 5,983 1,009 51 7,043 1,145
Total BCCL 32.74 27.45 5,983 1,009 51 7,043 1,145CCL
North Karanpura CCLRanchi,Hazaribagh,Chatra,Palamu and Latehar/Jharkhand 23.67 23.56 4,458 35 0 4,493 2,072
East Bokaro CCL Bokaro/Jharkhand 10.47 12.7 2,116 1,110 0 3,227 692West Bokaro CCL Ramgarh, Hazaribagh/Jharkhand 6.57 5.16 1,516 236 10 1,762 462South Karanpura CCL Ramgarh, Hazaribagh/Jharkhand 4.98 3.98 1,550 196 7 1,753 308Ramgarh CCL Ramgarh/Jharkhand 1.36 1.1 386 19 0 405 138Giridh CCL Giridih/Jharkhand 0.93 0.58 18 0 0 18 15Total CCL 47.98 47.08 10,044 1,596 17 11,658 3,687ECL
Raniganj ECL
Burdwan,Bankura,Purulia,Birbhum/West Bengal Dhanbad/Jharkhand 20.97 17.02 7,556 1,242 379 9,177 662
Rajmahal/Deogarh ECL Deograh and Godda/Jharkhand 11.14 13.1 1,378 382 579 2,339 546Total ECL 32.11 30.12 8,934 1,624 958 11,516 1,208MCLTalcher MCL Angul/Orissa 69.3 59.74 7,568 1,721 640 9,929 5,893
IB Valley MCL Jharsugudah and Sundergarh/Orissa 45.3 44.34 3,242 161 0 3,403 2,119
Total MCL 114.6 104.08 10,810 1,882 640 13,332 8,012NCL
Singrauli NCL Madhya Pradesh and Uttar Pradesh 77.36 67.67 3,270 212 0 3,482 1,891
Total NCL 77.36 67.67 3,270 212 0 3,482 1,891NECMakum NEC Tinsukia/Assam 1.1 1.11 362 0 0 362 239Total NEC 1.1 1.11 362 0 0 362 239SECLKorba SECL Korba/Chattisgarh 75.22 78.46 3,896 1,605 51 5,552 2,670
Central India Coalfields SECL Madhya Pradesh and Chattisgarh 28.63 24.72 2,665 892 123 3,681 774Mand Raigarh SECL Raigarh/Chattisgarh 5.24 4.83 1,957 114 0 2,070 659Total SECL 109.09 108.01 8,518 2,611 174 11,303 4,103WCL
Wardha Valley WCLChandrapur and Yeotmal/Maharashtra 29.23 29.32 2,249 614 58 2,921 795
Kamptee WCL Nagpur/Maharashtra 4.78 5.03 817 121 0 938 214Umrer Nand Bander WCL Nagpur/Maharashtra 4.31 4.27 558 1 0 558 215Pench-Kanhan WCL Chindwara/Madhya Pradesh 5.01 3.86 693 199 44 936 148Pathakhera WCL Betul/Madhya Pradesh 3.56 3.26 190 28 0 218 87Total WCL 46.89 45.74 4,507 963 102 5,571 1,459Total CIL 461.87 431.26 52,428 9,897 1,942 64,267 21,744
Reserves (mn tons)2010
Source: Company, Kotak Institutional Equities
Sampl
e Rep
ort

Metals & Mining Coal India
6 KOTAK INSTITUTIONAL EQUITIES RESEARCH
Exhibit 5: Profit model, balance sheet, cash model of CIL, March fiscal year-ends, 2009-2015E (Rs mn)
2009 2010 2011E 2012E 2013E 2014E 2015EProfit modelNet sales 387,888 446,153 497,386 556,970 615,841 671,253 724,139 Coal issued for other purpose 20,220 20,690 23,801 28,022 31,893 34,659 37,483 Transport and loading recovery 14,698 12,260 13,058 13,715 14,422 15,063 15,602 Total income 424,142 485,774 537,412 600,403 663,790 722,151 778,181 EBITDA 39,309 114,735 133,515 146,816 177,350 204,028 227,316 Interest income 28,447 26,940 19,925 32,492 42,142 53,577 67,163 Other Income (ex transport, interest) 8,051 13,209 17,447 17,447 17,447 17,447 17,447 Interest expense (1,789) (1,560) (1,373) (1,293) (1,193) (1,134) (1,118) Depreciation (16,909) (13,138) (13,925) (15,137) (16,859) (18,223) (19,237) Pretax profits 57,110 140,186 155,589 180,325 218,887 255,695 291,570 Tax (36,336) (43,996) (43,221) (49,163) (57,418) (70,677) (83,151) Net income 20,774 96,190 112,368 131,162 161,470 185,018 208,419 Extraordinary items 13 35 — — — — — Reported profit 20,787 96,224 112,368 131,162 161,470 185,018 208,419 Earnings per share (Rs) 3 15 18 21 26 29 33 Balance sheetPaid-up common stock 63,164 63,164 63,164 63,164 63,164 63,164 63,164Total shareholders' equity 191,651 257,952 326,497 406,505 505,002 617,862 744,998Minority interest 19 236 236 236 236 236 236Total borrowings 21,485 20,869 17,869 15,469 13,148 12,540 12,140Shifting and rehab fund 12,238 14,774 18,092 21,519 25,521 30,445 36,088Total liabilities and equity 225,393 293,831 362,693 443,729 543,906 661,083 793,462Net fixed assets 110,212 120,354 118,056 150,701 171,266 181,969 181,807Capital work-in progress 19,195 22,107 56,269 52,601 52,477 48,958 45,430Investments 15,052 12,823 12,823 12,823 12,823 12,823 12,823Cash 296,950 390,778 456,187 543,081 660,078 809,928 989,034Current assets (excl. cash) 174,009 152,466 168,530 185,912 203,852 220,511 236,401Current liabilities and provisions 399,293 414,316 458,931 510,598 565,396 621,017 679,357Deferred tax asset 9,268 9,604 9,759 9,208 8,804 7,910 7,322Misc. expenditure — 15 — — — — — Total assets 225,393 293,831 362,694 443,729 543,906 661,083 793,462Free cash flowOperating cash flow, excl. working capital 39,616 106,073 126,138 146,849 178,732 204,135 228,245Working capital changes 77,708 22,856 28,551 34,285 36,859 38,962 42,449Capital expenditure (18,758) (19,804) (45,789) (44,114) (37,299) (25,408) (15,547)Free cash flow 98,567 109,125 108,900 137,020 178,291 217,690 255,147Ratios Net debt/equity (%) (143.7) (143.4) (134.2) (129.8) (128.1) (129.1) (131.1) Return on equity (%) 11 43 38 36 35 33 31 Book value per share (Rs) 30 41 52 64 80 98 118ROCE (%) 11 43 40 38 37 35 32
Source: Company, Kotak Institutional Equities estimates
Sampl
e Rep
ort
In
dia D
aily Sum
mary - D
ecemb
er 31, 2010
7
KOTAK IN
STITUTIO
NAL EQ
UITIES RESEARCH
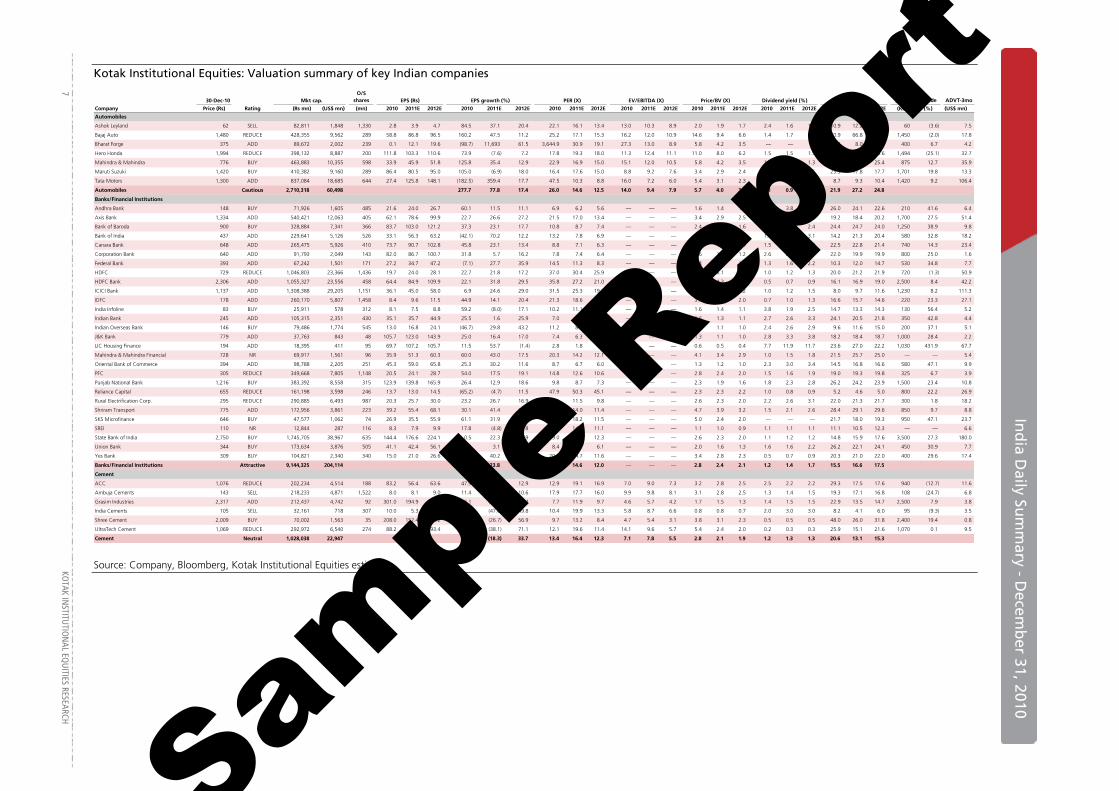
Kotak Institutional Equities: Valuation summary of key Indian companies
30-Dec-10 Mkt cap.O/S
shares EPS (Rs) EPS growth (%) PER (X) EV/EBITDA (X) RoE (%)Target price Upside ADVT-3mo
Company Price (Rs) Rating (Rs mn) (US$ mn) (mn) 2010 2011E 2012E 2010 2011E 2012E 2010 2011E 2012E 2010 2011E 2012E 2010 2011E 2012E 2010 2011E 2012E 2010 2011E 2012E (Rs) (%) (US$ mn)
Automobiles
Ashok Leyland 62 SELL 82,811 1,848 1,330 2.8 3.9 4.7 84.5 37.1 20.4 22.1 16.1 13.4 13.0 10.3 8.9 2.0 1.9 1.7 2.4 1.6 1.6 10.9 12.2 13.5 60 (3.6) 7.5
Bajaj Auto 1,480 REDUCE 428,355 9,562 289 58.8 86.8 96.5 160.2 47.5 11.2 25.2 17.1 15.3 16.2 12.0 10.9 14.6 9.4 6.6 1.4 1.7 1.7 70.9 66.8 50.2 1,450 (2.0) 17.8
Bharat Forge 375 ADD 89,672 2,002 239 0.1 12.1 19.6 (98.7) 11,693 61.5 3,644.9 30.9 19.1 27.3 13.0 8.9 5.8 4.2 3.5 — — — 5.2 8.0 16.2 400 6.7 4.2
Hero Honda 1,994 REDUCE 398,132 8,887 200 111.8 103.3 110.6 73.9 (7.6) 7.2 17.8 19.3 18.0 11.3 12.4 11.1 11.0 8.0 6.2 1.5 1.5 1.5 59.0 48.0 38.6 1,494 (25.1) 32.7
Mahindra & Mahindra 776 BUY 463,883 10,355 598 33.9 45.9 51.8 125.8 35.4 12.9 22.9 16.9 15.0 15.1 12.0 10.5 5.8 4.2 3.5 1.2 1.2 1.3 30.0 28.8 25.4 875 12.7 35.9
Maruti Suzuki 1,420 BUY 410,382 9,160 289 86.4 80.5 95.0 105.0 (6.9) 18.0 16.4 17.6 15.0 8.8 9.2 7.6 3.4 2.9 2.4 0.4 0.4 0.5 23.3 17.8 17.7 1,701 19.8 13.3
Tata Motors 1,300 ADD 837,084 18,685 644 27.4 125.8 148.1 (182.5) 359.4 17.7 47.5 10.3 8.8 16.0 7.2 6.0 5.4 3.1 2.3 1.0 0.4 0.4 8.7 9.3 10.4 1,420 9.2 106.4
Automobiles Cautious 2,710,318 60,498 277.7 77.8 17.4 26.0 14.6 12.5 14.0 9.4 7.9 5.7 4.0 3.1 1.1 0.9 1.0 21.9 27.2 24.8
Banks/Financial Institutions
Andhra Bank 148 BUY 71,926 1,605 485 21.6 24.0 26.7 60.1 11.5 11.1 6.9 6.2 5.6 — — — 1.6 1.4 1.2 3.4 3.8 4.2 26.0 24.1 22.6 210 41.6 6.4
Axis Bank 1,334 ADD 540,421 12,063 405 62.1 78.6 99.9 22.7 26.6 27.2 21.5 17.0 13.4 — — — 3.4 2.9 2.5 0.9 1.1 1.4 19.2 18.4 20.2 1,700 27.5 51.4
Bank of Baroda 900 BUY 328,884 7,341 366 83.7 103.0 121.2 37.3 23.1 17.7 10.8 8.7 7.4 — — — 2.4 2.0 1.6 1.7 2.1 2.4 24.4 24.7 24.0 1,250 38.9 9.8
Bank of India 437 ADD 229,641 5,126 526 33.1 56.3 63.2 (42.1) 70.2 12.2 13.2 7.8 6.9 — — — 1.8 1.5 1.3 1.6 2.7 3.1 14.2 21.3 20.4 580 32.8 18.2
Canara Bank 648 ADD 265,475 5,926 410 73.7 90.7 102.8 45.8 23.1 13.4 8.8 7.1 6.3 — — — 2.1 1.7 1.4 1.5 1.5 1.9 22.5 22.8 21.4 740 14.3 23.4
Corporation Bank 640 ADD 91,793 2,049 143 82.0 86.7 100.7 31.8 5.7 16.2 7.8 7.4 6.4 — — — 1.6 1.4 1.2 2.6 2.7 3.2 22.0 19.9 19.9 800 25.0 1.6
Federal Bank 393 ADD 67,242 1,501 171 27.2 34.7 47.2 (7.1) 27.7 35.9 14.5 11.3 8.3 — — — 1.4 1.3 1.2 1.3 1.6 2.2 10.3 12.0 14.7 530 34.8 7.7
HDFC 729 REDUCE 1,046,803 23,366 1,436 19.7 24.0 28.1 22.7 21.8 17.2 37.0 30.4 25.9 — — — 6.9 6.1 5.3 1.0 1.2 1.3 20.0 21.2 21.9 720 (1.3) 50.9
HDFC Bank 2,306 ADD 1,055,327 23,556 458 64.4 84.9 109.9 22.1 31.8 29.5 35.8 27.2 21.0 — — — 4.9 4.3 3.7 0.5 0.7 0.9 16.1 16.9 19.0 2,500 8.4 42.2
ICICI Bank 1,137 ADD 1,308,388 29,205 1,151 36.1 45.0 58.0 6.9 24.6 29.0 31.5 25.3 19.6 — — — 2.5 2.4 2.2 1.0 1.2 1.5 8.0 9.7 11.6 1,230 8.2 111.3
IDFC 178 ADD 260,170 5,807 1,458 8.4 9.6 11.5 44.9 14.1 20.4 21.3 18.6 15.5 — — — 3.7 2.4 2.0 0.7 1.0 1.3 16.6 15.7 14.6 220 23.3 27.1
India Infoline 83 BUY 25,911 578 312 8.1 7.5 8.8 59.2 (8.0) 17.1 10.2 11.1 9.5 — — — 1.6 1.4 1.1 3.8 1.9 2.5 14.7 13.3 14.3 130 56.4 5.2
Indian Bank 245 ADD 105,315 2,351 430 35.1 35.7 44.9 25.5 1.6 25.9 7.0 6.9 5.5 — — — 1.6 1.3 1.1 2.7 2.6 3.3 24.1 20.5 21.8 350 42.8 4.4
Indian Overseas Bank 146 BUY 79,486 1,774 545 13.0 16.8 24.1 (46.7) 29.8 43.2 11.2 8.7 6.0 — — — 1.3 1.1 1.0 2.4 2.6 2.9 9.6 11.6 15.0 200 37.1 5.1
J&K Bank 779 ADD 37,763 843 48 105.7 123.0 143.9 25.0 16.4 17.0 7.4 6.3 5.4 — — — 1.3 1.1 1.0 2.8 3.3 3.8 18.2 18.4 18.7 1,000 28.4 2.2
LIC Housing Finance 194 ADD 18,395 411 95 69.7 107.2 105.7 11.5 53.7 (1.4) 2.8 1.8 1.8 — — — 0.6 0.5 0.4 7.7 11.9 11.7 23.6 27.0 22.2 1,030 431.9 67.7
Mahindra & Mahindra Financial 728 NR 69,917 1,561 96 35.9 51.3 60.3 60.0 43.0 17.5 20.3 14.2 12.1 — — — 4.1 3.4 2.9 1.0 1.5 1.8 21.5 25.7 25.0 — — 5.4
Oriental Bank of Commerce 394 ADD 98,788 2,205 251 45.3 59.0 65.8 25.3 30.2 11.6 8.7 6.7 6.0 — — — 1.3 1.2 1.0 2.3 3.0 3.4 14.5 16.8 16.6 580 47.1 9.9
PFC 305 REDUCE 349,668 7,805 1,148 20.5 24.1 28.7 54.0 17.5 19.1 14.8 12.6 10.6 — — — 2.8 2.4 2.0 1.5 1.6 1.9 19.0 19.3 19.8 325 6.7 3.9
Punjab National Bank 1,216 BUY 383,392 8,558 315 123.9 139.8 165.9 26.4 12.9 18.6 9.8 8.7 7.3 — — — 2.3 1.9 1.6 1.8 2.3 2.8 26.2 24.2 23.9 1,500 23.4 10.8
Reliance Capital 655 REDUCE 161,198 3,598 246 13.7 13.0 14.5 (65.2) (4.7) 11.5 47.9 50.3 45.1 — — — 2.3 2.3 2.2 1.0 0.8 0.9 5.2 4.6 5.0 800 22.2 26.9
Rural Electrification Corp. 295 REDUCE 290,885 6,493 987 20.3 25.7 30.0 23.2 26.7 16.9 14.5 11.5 9.8 — — — 2.6 2.3 2.0 2.2 2.6 3.1 22.0 21.3 21.7 300 1.8 18.2
Shriram Transport 775 ADD 172,956 3,861 223 39.2 55.4 68.1 30.1 41.4 23.0 19.8 14.0 11.4 — — — 4.7 3.9 3.2 1.5 2.1 2.6 28.4 29.1 29.6 850 9.7 8.8
SKS Microfinance 646 BUY 47,577 1,062 74 26.9 35.5 55.9 61.1 31.9 57.4 24.0 18.2 11.5 — — — 5.0 2.4 2.0 — — — 21.7 18.0 19.3 950 47.1 23.7
SREI 110 NR 12,844 287 116 8.3 7.9 9.9 17.8 (4.8) 25.8 13.3 14.0 11.1 — — — 1.1 1.0 0.9 1.1 1.1 1.1 11.1 10.5 12.3 — — 6.6
State Bank of India 2,750 BUY 1,745,705 38,967 635 144.4 176.6 224.1 0.5 22.3 26.9 19.0 15.6 12.3 — — — 2.6 2.3 2.0 1.1 1.2 1.2 14.8 15.9 17.6 3,500 27.3 180.0
Union Bank 344 BUY 173,634 3,876 505 41.1 42.4 56.1 20.2 3.1 32.6 8.4 8.1 6.1 — — — 2.0 1.6 1.3 1.6 1.6 2.2 26.2 22.1 24.1 450 30.9 7.7
Yes Bank 309 BUY 104,821 2,340 340 15.0 21.0 26.6 46.7 40.2 26.6 20.6 14.7 11.6 — — — 3.4 2.8 2.3 0.5 0.7 0.9 20.3 21.0 22.0 400 29.6 17.4
Banks/Financial Institutions Attractive 9,144,325 204,114 15.0 23.8 22.2 18.1 14.6 12.0 — — — 2.8 2.4 2.1 1.2 1.4 1.7 15.5 16.6 17.5
Cement
ACC 1,076 REDUCE 202,234 4,514 188 83.2 56.4 63.6 47.9 (32.3) 12.9 12.9 19.1 16.9 7.0 9.0 7.3 3.2 2.8 2.5 2.5 2.2 2.2 29.3 17.5 17.6 940 (12.7) 11.6
Ambuja Cements 143 SELL 218,233 4,871 1,522 8.0 8.1 9.0 11.4 1.4 10.6 17.9 17.7 16.0 9.9 9.8 8.1 3.1 2.8 2.5 1.3 1.4 1.5 19.3 17.1 16.8 108 (24.7) 6.8
Grasim Industries 2,317 ADD 212,437 4,742 92 301.0 194.9 238.6 26.1 (35.2) 22.4 7.7 11.9 9.7 4.6 5.7 4.2 1.7 1.5 1.3 1.4 1.5 1.5 22.9 13.5 14.7 2,500 7.9 3.8
India Cements 105 SELL 32,161 718 307 10.0 5.3 7.9 (43.5) (47.6) 49.8 10.4 19.9 13.3 5.8 8.7 6.6 0.8 0.8 0.7 2.0 3.0 3.0 8.2 4.1 6.0 95 (9.3) 3.5
Shree Cement 2,009 BUY 70,002 1,563 35 208.0 152.4 239.2 19.0 (26.7) 56.9 9.7 13.2 8.4 4.7 5.4 3.1 3.8 3.1 2.3 0.5 0.5 0.5 48.0 26.0 31.8 2,400 19.4 0.8
UltraTech Cement 1,069 REDUCE 292,972 6,540 274 88.2 54.6 93.4 12.0 (38.1) 71.1 12.1 19.6 11.4 14.1 9.6 5.7 5.4 2.4 2.0 0.2 0.3 0.3 25.9 15.1 21.6 1,070 0.1 9.5
Cement Neutral 1,028,038 22,947 19.3 (18.3) 33.7 13.4 16.4 12.3 7.1 7.8 5.5 2.8 2.1 1.9 1.2 1.3 1.3 20.6 13.1 15.3
Price/BV (X) Dividend yield (%)
Source: Company, Bloomberg, Kotak Institutional Equities estimates
Sampl
e Rep
ort
KO
TAK INSTITUTIO
NAL EQ
UITIES RESEARCH 8
In
dia D
aily Sum
mary - D
ecemb
er 3
Ind
ia Daily Su
mm
ary - Decem
ber 31, 2010
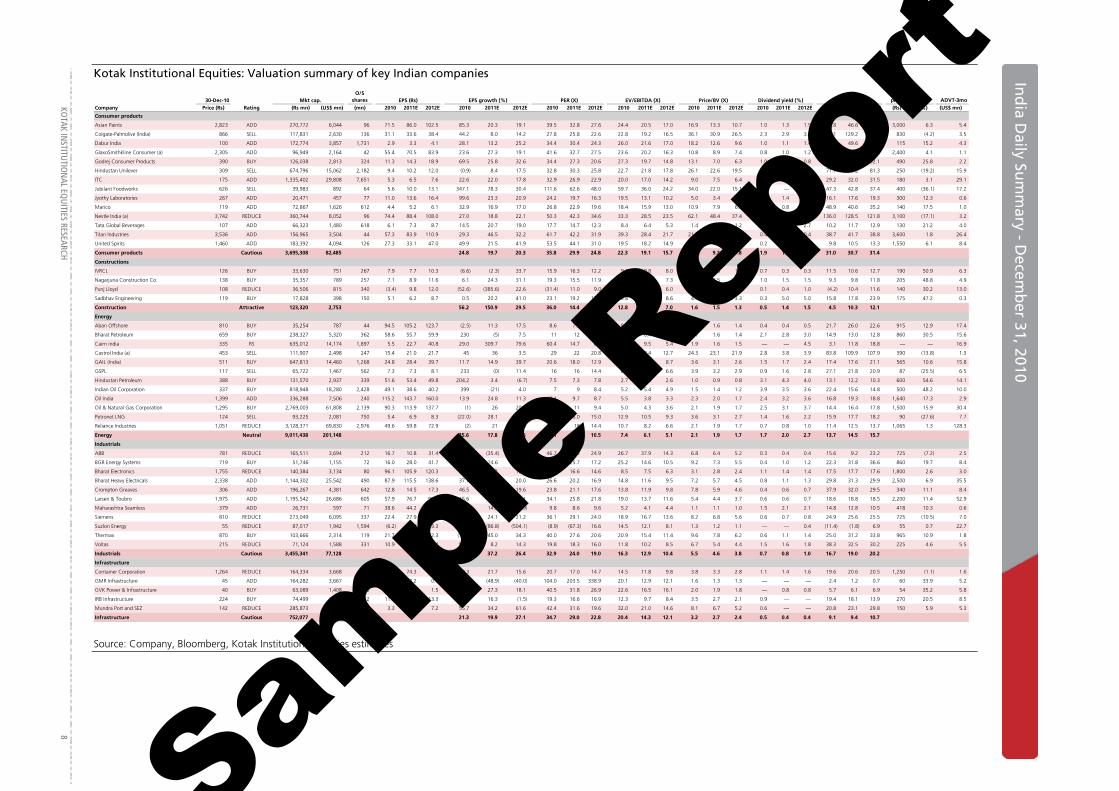
Kotak Institutional Equities: Valuation summary of key Indian companies
30-Dec-10 Mkt cap.O/S
shares EPS (Rs) EPS growth (%) PER (X) EV/EBITDA (X) Price/BV (X) RoE (%)Target price Upside ADVT-3mo
Company Price (Rs) Rating (Rs mn) (US$ mn) (mn) 2010 2011E 2012E 2010 2011E 2012E 2010 2011E 2012E 2010 2011E 2012E 2010 2011E 2012E 2010 2011E 2012E 2010 2011E 2012E (Rs) (%) (US$ mn)
Consumer products
Asian Paints 2,823 ADD 270,772 6,044 96 71.5 86.0 102.5 85.3 20.3 19.1 39.5 32.8 27.6 24.4 20.5 17.0 16.9 13.3 10.7 1.0 1.3 1.5 51.8 46.6 44.0 3,000 6.3 5.4
Colgate-Palmolive (India) 866 SELL 117,831 2,630 136 31.1 33.6 38.4 44.2 8.0 14.2 27.8 25.8 22.6 22.8 19.2 16.5 36.1 30.9 26.5 2.3 2.9 3.3 156.1 129.2 126.3 830 (4.2) 3.5
Dabur India 100 ADD 172,774 3,857 1,731 2.9 3.3 4.1 28.1 13.2 25.2 34.4 30.4 24.3 26.0 21.6 17.0 18.2 12.6 9.6 1.0 1.1 1.4 57.4 49.6 45.3 115 15.2 4.3
GlaxoSmithkline Consumer (a) 2,305 ADD 96,949 2,164 42 55.4 70.5 83.9 23.6 27.3 19.1 41.6 32.7 27.5 23.6 20.2 16.3 10.8 8.9 7.4 0.8 1.0 1.2 27.9 29.7 29.5 2,400 4.1 1.1
Godrej Consumer Products 390 BUY 126,038 2,813 324 11.3 14.3 18.9 69.5 25.8 32.6 34.4 27.3 20.6 27.3 19.7 14.8 13.1 7.0 6.3 1.0 0.8 0.8 44.6 33.5 32.1 490 25.8 2.2
Hindustan Unilever 309 SELL 674,796 15,062 2,182 9.4 10.2 12.0 (0.9) 8.4 17.5 32.8 30.3 25.8 22.7 21.8 17.8 26.1 22.6 19.5 2.5 2.7 3.2 71.1 80.2 81.3 250 (19.2) 15.9
ITC 175 ADD 1,335,402 29,808 7,651 5.3 6.5 7.6 22.6 22.0 17.8 32.9 26.9 22.9 20.0 17.0 14.2 9.0 7.5 6.4 2.9 1.6 1.7 29.2 32.0 31.5 180 3.1 29.1
Jubilant Foodworks 626 SELL 39,983 892 64 5.6 10.0 13.1 347.1 78.3 30.4 111.6 62.6 48.0 59.7 36.0 24.2 34.0 22.0 15.1 — — — 47.3 42.8 37.4 400 (36.1) 17.2
Jyothy Laboratories 267 ADD 20,471 457 77 11.0 13.6 16.4 99.6 23.3 20.9 24.2 19.7 16.3 19.5 13.1 10.2 5.0 3.4 2.9 1.7 1.4 1.8 16.1 17.6 19.3 300 12.3 0.6
Marico 119 ADD 72,867 1,626 612 4.4 5.2 6.1 32.9 16.9 17.0 26.8 22.9 19.6 18.4 15.9 13.0 10.9 7.9 6.0 0.6 0.8 0.9 48.9 40.6 35.2 140 17.5 1.0
Nestle India (a) 3,742 REDUCE 360,744 8,052 96 74.4 88.4 108.0 27.0 18.8 22.1 50.3 42.3 34.6 33.3 28.5 23.5 62.1 48.4 37.4 1.3 1.6 2.0 136.0 128.5 121.8 3,100 (17.1) 3.2
Tata Global Beverages 107 ADD 66,323 1,480 618 6.1 7.3 8.7 14.5 20.7 19.0 17.7 14.7 12.3 8.4 6.4 5.3 1.4 1.3 1.2 1.9 2.3 2.7 10.2 11.7 12.9 130 21.2 4.0
Titan Industries 3,536 ADD 156,965 3,504 44 57.3 83.9 110.9 29.3 46.5 32.2 61.7 42.2 31.9 39.3 28.4 21.7 21.3 14.9 10.6 0.4 0.3 0.4 38.7 41.7 38.8 3,600 1.8 26.4
United Spirits 1,460 ADD 183,392 4,094 126 27.3 33.1 47.0 49.9 21.5 41.9 53.5 44.1 31.0 19.5 18.2 14.9 4.9 4.4 3.9 0.2 0.1 0.2 9.8 10.5 13.3 1,550 6.1 8.4
Consumer products Cautious 3,695,308 82,485 24.8 19.7 20.3 35.8 29.9 24.8 22.3 19.1 15.7 11.1 9.2 7.8 1.9 1.6 1.8 31.0 30.7 31.4
Constructions
IVRCL 126 BUY 33,630 751 267 7.9 7.7 10.3 (6.6) (2.3) 33.7 15.9 16.3 12.2 9.1 9.8 8.0 1.8 1.6 1.5 0.7 0.3 0.3 11.5 10.6 12.7 190 50.9 6.3
Nagarjuna Construction Co. 138 BUY 35,357 789 257 7.1 8.9 11.6 6.1 24.3 31.1 19.3 15.5 11.9 10.1 8.8 7.3 1.6 1.5 1.3 1.0 1.5 1.5 9.3 9.8 11.8 205 48.8 4.9
Punj Lloyd 108 REDUCE 36,506 815 340 (3.4) 9.8 12.0 (52.6) (385.6) 22.6 (31.4) 11.0 9.0 20.6 6.5 6.0 1.2 1.1 1.0 0.1 0.4 1.0 (4.2) 10.4 11.6 140 30.2 13.0
Sadbhav Engineering 119 BUY 17,828 398 150 5.1 6.2 8.7 0.5 20.2 41.0 23.1 19.2 13.6 15.8 10.5 8.6 4.4 3.4 3.3 0.3 5.0 5.0 15.8 17.8 23.9 175 47.2 0.3
Construction Attractive 123,320 2,753 56.2 150.9 29.5 36.0 14.4 11.1 12.8 8.2 7.0 1.6 1.5 1.3 0.5 1.4 1.5 4.5 10.3 12.1
Energy
Aban Offshore 810 BUY 35,254 787 44 94.5 105.2 123.7 (2.5) 11.3 17.5 8.6 7.7 6.6 8.3 7.1 6.5 1.6 1.6 1.4 0.4 0.4 0.5 21.7 26.0 22.6 915 12.9 17.4
Bharat Petroleum 659 BUY 238,327 5,320 362 58.6 55.7 59.9 230 (5) 7.5 11 12 11.0 6.5 6.4 6.2 1.7 1.6 1.4 2.1 2.8 3.0 14.9 13.0 12.8 860 30.5 15.6
Cairn india 335 RS 635,012 14,174 1,897 5.5 22.7 40.8 29.0 309.7 79.6 60.4 14.7 8.2 47.5 9.5 5.4 1.9 1.6 1.5 — — 4.5 3.1 11.8 18.8 — — 16.9
Castrol India (a) 453 SELL 111,907 2,498 247 15.4 21.0 21.7 45 36 3.5 29 22 20.8 17.4 13.4 12.7 24.3 23.1 21.9 2.8 3.8 3.9 83.8 109.9 107.9 390 (13.8) 1.3
GAIL (India) 511 BUY 647,813 14,460 1,268 24.8 28.4 39.7 11.7 14.9 39.7 20.6 18.0 12.9 11.6 10.8 8.7 3.6 3.1 2.6 1.5 1.7 2.4 17.4 17.6 21.1 565 10.6 15.8
GSPL 117 SELL 65,722 1,467 562 7.3 7.3 8.1 233 (0) 11.4 16 16 14.4 8.0 7.9 6.6 3.9 3.2 2.9 0.9 1.6 2.8 27.1 21.8 20.9 87 (25.5) 6.5
Hindustan Petroleum 388 BUY 131,570 2,937 339 51.6 53.4 49.8 204.2 3.4 (6.7) 7.5 7.3 7.8 2.7 2.6 2.6 1.0 0.9 0.8 3.1 4.3 4.0 13.1 12.2 10.3 600 54.6 14.1
Indian Oil Corporation 337 BUY 818,948 18,280 2,428 49.1 38.6 40.2 399 (21) 4.0 7 9 8.4 5.2 5.4 4.9 1.5 1.4 1.2 3.9 3.5 3.6 22.4 15.6 14.8 500 48.2 10.0
Oil India 1,399 ADD 336,288 7,506 240 115.2 143.7 160.0 13.9 24.8 11.3 12.1 9.7 8.7 5.5 3.8 3.3 2.3 2.0 1.7 2.4 3.2 3.6 16.8 19.3 18.8 1,640 17.3 2.9
Oil & Natural Gas Corporation 1,295 BUY 2,769,003 61,808 2,139 90.3 113.9 137.7 (1) 26 20.9 14 11 9.4 5.0 4.3 3.6 2.1 1.9 1.7 2.5 3.1 3.7 14.4 16.4 17.8 1,500 15.9 30.4
Petronet LNG 124 SELL 93,225 2,081 750 5.4 6.9 8.3 (22.0) 28.1 20.2 23.0 18.0 15.0 12.9 10.5 9.3 3.6 3.1 2.7 1.4 1.6 2.2 15.9 17.7 18.2 90 (27.6) 7.7
Reliance Industries 1,051 REDUCE 3,128,371 69,830 2,976 49.6 59.8 72.9 (2) 21 21.8 21 18 14.4 10.7 8.2 6.6 2.1 1.9 1.7 0.7 0.8 1.0 11.4 12.5 13.7 1,065 1.3 128.3
Energy Neutral 9,011,438 201,148 35.6 17.8 21.6 15.1 12.8 10.5 7.4 6.1 5.1 2.1 1.9 1.7 1.7 2.0 2.7 13.7 14.5 15.7
Industrials
ABB 781 REDUCE 165,511 3,694 212 16.7 10.8 31.4 (35.2) (35.4) 190.2 46.7 72.3 24.9 26.7 37.9 14.3 6.8 6.4 5.2 0.3 0.4 0.4 15.6 9.2 23.2 725 (7.2) 2.5
BGR Energy Systems 719 BUY 51,746 1,155 72 16.0 28.0 41.7 32.2 74.6 49.1 44.8 25.7 17.2 25.2 14.6 10.5 9.2 7.3 5.5 0.4 1.0 1.2 22.3 31.8 36.6 860 19.7 8.4
Bharat Electronics 1,755 REDUCE 140,384 3,134 80 96.1 105.9 120.3 (7.4) 10.2 13.6 18.3 16.6 14.6 8.5 7.5 6.3 3.1 2.8 2.4 1.1 1.4 1.4 17.5 17.7 17.6 1,800 2.6 3.0
Bharat Heavy Electricals 2,338 ADD 1,144,302 25,542 490 87.9 115.5 138.6 37.7 31.4 20.0 26.6 20.2 16.9 14.8 11.6 9.5 7.2 5.7 4.5 0.8 1.1 1.3 29.8 31.3 29.9 2,500 6.9 35.5
Crompton Greaves 306 ADD 196,267 4,381 642 12.8 14.5 17.3 46.5 12.9 19.6 23.8 21.1 17.6 13.8 11.9 9.8 7.8 5.9 4.6 0.4 0.6 0.7 37.9 32.0 29.5 340 11.1 8.4
Larsen & Toubro 1,975 ADD 1,195,542 26,686 605 57.9 76.7 90.5 15.6 32.3 18.1 34.1 25.8 21.8 19.0 13.7 11.6 5.4 4.4 3.7 0.6 0.6 0.7 18.6 18.8 18.5 2,200 11.4 52.9
Maharashtra Seamless 379 ADD 26,731 597 71 38.6 44.2 39.3 7.7 14.3 (10.9) 9.8 8.6 9.6 5.2 4.1 4.4 1.1 1.1 1.0 1.5 2.1 2.1 14.8 12.8 10.5 418 10.3 0.6
Siemens 810 REDUCE 273,049 6,095 337 22.4 27.9 33.7 39.5 24.1 21.2 36.1 29.1 24.0 18.9 16.7 13.6 8.2 6.8 5.6 0.6 0.7 0.8 24.9 25.6 25.5 725 (10.5) 7.0
Suzlon Energy 55 REDUCE 87,017 1,942 1,594 (6.2) (0.8) 3.3 (185.4) (86.8) (504.1) (8.9) (67.3) 16.6 14.5 12.1 8.1 1.3 1.2 1.1 — — 0.4 (11.4) (1.8) 6.9 55 0.7 22.7
Thermax 870 BUY 103,666 2,314 119 21.7 31.5 42.3 (10.4) 45.0 34.3 40.0 27.6 20.6 20.9 15.4 11.4 9.6 7.8 6.2 0.6 1.1 1.4 25.0 31.2 33.8 965 10.9 1.8
Voltas 215 REDUCE 71,124 1,588 331 10.9 11.8 13.4 57.4 8.2 14.3 19.8 18.3 16.0 11.8 10.2 8.5 6.7 5.4 4.4 1.5 1.6 1.8 38.3 32.5 30.2 225 4.6 5.5
Industrials Cautious 3,455,341 77,128 0.3 37.2 26.4 32.9 24.0 19.0 16.3 12.9 10.4 5.5 4.6 3.8 0.7 0.8 1.0 16.7 19.0 20.2
Infrastructure
Container Corporation 1,264 REDUCE 164,334 3,668 130 61.1 74.3 85.9 0.3 21.7 15.6 20.7 17.0 14.7 14.5 11.8 9.8 3.8 3.3 2.8 1.1 1.4 1.6 19.6 20.6 20.5 1,250 (1.1) 1.6
GMR Infrastructure 45 ADD 164,282 3,667 3,667 0.4 0.2 0.1 (43.8) (48.9) (40.0) 104.0 203.5 338.9 20.1 12.9 12.1 1.6 1.3 1.3 — — — 2.4 1.2 0.7 60 33.9 5.2
GVK Power & Infrastructure 40 BUY 63,089 1,408 1,579 1.0 1.3 1.5 29.4 27.3 18.1 40.5 31.8 26.9 22.6 16.5 16.1 2.0 1.9 1.8 — 0.8 0.8 5.7 6.1 6.9 54 35.2 5.8
IRB Infrastructure 224 BUY 74,499 1,663 332 11.6 13.5 13.3 119.2 16.3 (1.5) 19.3 16.6 16.9 12.3 9.7 8.4 3.5 2.7 2.1 0.9 — — 19.4 18.1 13.9 270 20.5 8.5
Mundra Port and SEZ 142 REDUCE 285,873 6,381 2,017 3.3 4.5 7.2 55.7 34.2 61.6 42.4 31.6 19.6 32.0 21.0 14.6 8.1 6.7 5.2 0.6 — — 20.8 23.1 29.8 150 5.9 5.3
Infrastructure Cautious 752,077 16,787 21.3 19.9 27.1 34.7 29.0 22.8 20.4 14.3 12.1 3.2 2.7 2.4 0.5 0.4 0.4 9.1 9.4 10.7
Dividend yield (%)
Source: Company, Bloomberg, Kotak Institutional Equities estimates
Sampl
e Rep
ort

In
dia D
aily Sum
mary - D
ecemb
er 31, 2010
9
KOTAK IN
STITUTIO
NAL EQ
UITIES RESEARCH
Kotak Institutional Equities: Valuation summary of key Indian companies
30-Dec-10 Mkt cap.O/S
shares EPS (Rs) EPS growth (%) PER (X) EV/EBITDA (X) Price/BV (X) RoE (%)Target price Upside ADVT-3mo
Company Price (Rs) Rating (Rs mn) (US$ mn) (mn) 2010 2011E 2012E 2010 2011E 2012E 2010 2011E 2012E 2010 2011E 2012E 2010 2011E 2012E 2010 2011E 2012E 2010 2011E 2012E (Rs) (%) (US$ mn)
Media
DB Corp 266 BUY 48,248 1,077 182 10.6 12.5 14.5 286.5 17.2 16.2 25.0 21.3 18.4 13.9 11.9 10.3 7.4 5.9 4.9 0.8 1.1 1.5 40.3 31.0 29.2 320 20.5 0.3
DishTV 71 REDUCE 75,661 1,689 1,063 (2.5) (1.9) 0.4 (61.9) (25.7) (122.5) (28.4) (38.2) 169.8 93.0 34.8 15.8 18.4 35.7 29.5 — — — 249.0 (63.6) 19.0 57 (19.9) 5.7
Hindustan Media Ventures 182 BUY 13,348 298 73 2.5 9.6 11.3 NM 289.8 18.4 74.2 19.0 16.1 22.8 16.6 13.5 3.7 3.1 2.6 4.1 4.1 5.5 17.9 28.1 17.8 225 23.7 23.7
HT Media 145 NR 34,052 760 235 6.1 7.7 9.2 623.3 25.9 19.8 23.7 18.8 15.7 11.9 9.9 8.2 3.5 3.1 2.8 0.7 1.4 2.8 15.6 17.5 18.9 — — 0.8
Jagran Prakashan 130 BUY 39,150 874 301 5.8 6.9 7.8 92.0 18.3 12.4 22.3 18.8 16.7 13.4 11.0 9.8 6.4 5.8 5.3 2.7 3.1 3.8 30.0 32.2 33.0 150 15.4 0.5
Sun TV Network 524 REDUCE 206,656 4,613 394 13.1 18.3 22.7 44.0 39.7 24.1 40.1 28.7 23.1 22.8 16.6 13.5 10.7 8.9 7.5 1.4 1.4 1.9 28.3 34.2 35.5 450 (14.2) 2.4
Zee Entertainment Enterprises 145 REDUCE 125,715 2,806 869 5.3 5.4 6.8 26.6 0.7 25.4 27.0 26.9 21.4 19.9 17.3 13.2 3.2 3.0 2.9 0.9 1.0 1.2 12.9 11.8 13.9 135 (6.6) 13.5
Media Cautious 542,828 12,117 189.2 36.2 38.6 44.1 32.4 23.4 21.3 16.0 12.4 6.4 5.6 5.0 1.0 1.2 1.6 14.4 17.2 21.4
Metals & Mining
Coal India 308 ADD 1,945,756 43,432 6,316 15.2 17.8 20.8 363.0 16.8 16.7 20.2 17.3 14.8 12.2 9.9 8.6 7.1 5.6 4.5 1.1 1.7 2.0 40.4 36.4 34.0 345 12.0 23.7
Hindalco Industries 245 ADD 468,260 10,452 1,914 20.0 15.0 16.9 25.0 (25.1) 12.7 12.3 16.4 14.5 6.7 8.8 9.0 2.2 1.9 1.7 0.6 0.6 0.6 20.4 12.5 12.6 255 4.2 41.3
Hindustan Zinc 1,339 BUY 565,960 12,633 423 95.6 95.4 116.4 48.2 (0.2) 22.0 14.0 14.0 11.5 9.6 8.6 5.9 3.0 2.5 2.1 0.4 0.4 0.4 25.1 20.2 20.4 1,430 6.8 3.8
Jindal Steel and Power 722 REDUCE 672,072 15,002 931 38.2 45.7 56.2 16.9 19.4 23.1 18.9 15.8 12.8 12.9 10.6 7.9 6.0 3.9 3.0 0.2 0.3 0.3 37.7 30.3 26.8 625 (13.4) 22.8
JSW Steel 1,177 REDUCE 292,155 6,521 248 80.4 73.6 108.0 481.1 (8.5) 46.8 14.6 16.0 10.9 10.8 9.2 6.3 2.7 1.6 1.3 0.6 0.8 0.8 16.0 12.6 13.0 1,115 (5.3) 29.4
National Aluminium Co. 382 SELL 246,030 5,492 644 12.2 17.0 19.1 (37.2) 39.6 12.2 31.4 22.5 20.0 14.5 10.3 8.9 2.4 2.2 2.1 0.7 1.3 1.3 7.8 10.2 10.6 285 (25.4) 0.7
Sesa Goa 325 REDUCE 288,842 6,447 890 29.6 55.5 53.8 23.5 87.7 (3.0) 11.0 5.9 6.0 9.0 3.7 5.7 3.6 2.3 1.7 1.1 1.1 1.1 35.8 36.5 30.7 300 (7.6) 33.4
Sterlite Industries 189 BUY 634,344 14,159 3,362 12.0 13.7 18.3 2.8 13.9 33.5 15.7 13.8 10.3 10.1 8.3 5.2 1.7 1.5 1.3 0.5 0.5 0.5 12.9 11.8 13.9 200 6.0 27.2
Tata Steel 673 BUY 643,339 14,360 956 (3.5) 66.3 74.5 (103.6) (1,993.1) 12.4 (192.1) 10.1 9.0 12.1 6.5 6.0 2.8 2.0 1.7 1.1 1.1 — (1.5) 23.2 20.5 725 7.8 103.1
Metals & Mining Attractive 5,756,758 128,499 9.4 38.3 17.7 19.3 14.0 11.9 10.6 8.3 7.0 3.4 2.7 2.2 0.8 1.0 1.0 17.7 19.3 18.9
Pharmaceutical
Apollo Hospitals 470 BUY 60,457 1,349 129 10.9 15.3 20.5 28.8 40.2 33.6 42.9 30.6 22.9 20.7 14.5 11.4 3.6 3.4 2.9 — — — 8.3 10.7 13.1 580 23.5 1.0
Biocon 417 ADD 83,440 1,863 200 14.8 17.0 24.4 216.4 14.7 43.6 28.1 24.5 17.1 16.3 13.9 10.8 4.7 4.1 3.4 — — — 17.9 18.1 22.2 470 12.7 11.7
Cipla 369 REDUCE 296,318 6,614 803 13.7 14.0 16.6 38.1 1.9 19.2 26.9 26.4 22.2 19.3 17.8 15.1 5.0 4.4 3.8 0.5 0.7 0.7 21.1 17.6 18.2 295 (20.1) 16.1
Cadila Healthcare 773 REDUCE 158,363 3,535 205 24.7 33.9 39.3 66.9 37.2 16.1 31.3 22.8 19.7 20.2 15.5 13.4 9.7 7.2 5.7 0.6 0.9 1.0 36.0 36.4 32.3 600 (22.4) 1.4
Dishman Pharma & chemicals 153 ADD 12,460 278 81 14.4 15.8 20.7 (19.7) 9.7 30.7 10.6 9.7 7.4 8.6 7.6 5.9 1.6 1.4 1.2 — — — 15.5 15.1 17.0 210 37.1 0.8
Divi's Laboratories 647 REDUCE 84,467 1,885 131 26.1 27.4 38.4 (18.2) 5.1 40.3 24.8 23.6 16.8 18.2 17.6 11.9 5.6 4.8 4.0 — — — 24.7 21.9 26.1 700 8.2 3.0
Dr Reddy's Laboratories 1,685 REDUCE 286,213 6,389 170 48.0 68.4 72.2 48.1 42.6 5.5 35.1 24.6 23.3 19.4 14.0 13.1 7.6 6.0 4.9 0.7 0.5 0.5 22.2 27.0 22.9 1,150 (31.8) 16.3
GlaxoSmithkline Pharmaceuticals (a) 2,325 REDUCE 196,926 4,396 85 59.1 70.2 79.6 8.1 18.7 13.5 39.3 33.1 29.2 22.9 19.4 16.7 11.0 9.4 8.0 — — — 29.8 30.7 29.7 2,000 (14.0) 1.3
Glenmark Pharmaceuticals 353 NR 96,724 2,159 274 12.7 19.2 20.3 14.7 50.6 5.6 27.7 18.4 17.4 17.1 11.2 10.7 4.1 3.4 2.9 — — — 16.7 19.9 17.6 — — 7.6
Jubilant Life Sciences 279 BUY 44,320 989 159 26.5 17.5 25.2 49.0 (34.2) 44.1 10.5 16.0 11.1 8.2 11.2 8.3 2.0 2.0 1.7 0.7 0.7 0.9 26.3 13.7 17.1 350 25.4 1.9
Lupin 475 ADD 211,121 4,713 445 15.3 19.7 24.3 27.3 28.4 23.4 31.0 24.1 19.6 25.8 19.2 15.2 8.1 6.4 5.1 0.6 0.7 0.9 34.1 30.0 29.3 490 3.2 15.3
Piramal Healthcare 466 NR 97,400 2,174 209 22.4 4.1 8.8 29.7 (81.7) 113.0 20.8 113.4 53.2 15.2 (9.9) (11.6) 5.8 0.7 0.6 1.2 1.3 0.8 30.7 159.4 11.4 — — 7.8
Ranbaxy Laboratories 590 SELL 252,927 5,646 428 7.2 24.0 14.6 (128.9) 234.8 (39.4) 82.2 24.6 40.5 20.0 13.1 20.6 6.4 4.6 4.2 — 0.7 0.7 7.0 20.1 10.4 340 (42.4) 16.3
Sun Pharmaceuticals 482 BUY 499,625 11,152 1,036 13.0 18.0 19.6 (25.7) 38.2 8.8 37.0 26.8 24.6 29.6 20.0 16.5 5.9 4.9 4.1 0.6 0.6 0.6 17.2 20.7 19.0 482 (0.1) 8.7
Pharmaceuticals Cautious 2,380,763 53,142 45.3 25.4 11.5 32.3 25.7 23.1 20.0 15.4 13.6 5.9 3.9 3.4 0.4 0.5 0.5 18.4 15.3 14.6
Property
DLF 287 ADD 492,716 10,998 1,714 10.6 13.6 21.1 (60.1) 27.8 55.2 27.1 21.2 13.6 19.9 14.0 10.3 1.6 1.5 1.4 0.7 1.0 1.7 6.6 7.4 10.7 375 30.5 46.0
Housing Development & Infrastructure 189 ADD 78,249 1,747 415 15.9 21.6 28.7 (24.4) 35.5 32.9 11.8 8.7 6.6 8.8 8.4 4.8 1.1 0.9 0.7 1.4 2.7 2.8 10.0 11.1 12.7 310 64.4 32.1
Indiabulls Real Estate 132 RS 53,124 1,186 402 (0.4) 3.1 8.5 (134.9) (865.5) 178.9 (331.6) 43.3 15.5 (52.2) 58.3 17.3 0.5 0.5 0.4 — — — (0.2) 1.0 2.9 — — 28.3
Mahindra Life Space Developer 387 ADD 15,801 353 41 19.2 20.1 32.1 69.7 4.9 59.7 20.2 19.3 12.1 18.3 13.9 6.4 1.6 1.5 1.4 0.9 1.0 1.0 8.6 8.4 12.3 546 41.0 0.4
Oberoi Realty 262 BUY 86,392 1,928 330 13.7 20.1 30.4 57.1 46.9 51.3 19.2 13.0 8.6 16.9 8.5 4.6 4.6 2.5 2.0 0.1 0.4 0.6 27.7 24.8 25.4 334 27.5 23.7
Phoenix Mills 217 BUY 31,453 702 145 4.1 6.6 7.7 (16.7) 59.4 16.5 52.5 32.9 28.3 43.8 24.6 20.6 2.0 2.0 1.9 0.6 0.7 0.9 3.9 6.1 6.7 303 39.5 0.5
Puravankara Projects 109 REDUCE 23,317 520 213 6.8 7.4 9.0 0.6 8.6 21.8 16.0 14.8 12.1 18.5 15.9 11.6 1.6 1.5 1.3 1.8 1.8 1.8 10.2 10.3 11.5 124 13.5 0.2
Sobha Developers 325 BUY 31,876 712 98 14.1 16.3 22.8 (7.1) 16.2 39.7 23.1 19.9 14.2 17.4 13.8 9.9 1.8 1.7 1.5 0.3 0.4 0.5 9.7 8.9 11.3 408 25.5 1.8
Unitech 65 SELL 172,776 3,857 2,666 3.0 3.8 5.1 (58.8) 25.0 34.0 21.4 17.1 12.8 22.2 16.1 10.3 1.7 1.4 1.3 0.5 — 2.3 9.0 8.7 10.6 74 14.2 45.0
Property Cautious 985,703 22,002 (44.6) 39.0 49.9 25.0 18.0 12.0 19.2 13.8 9.1 1.5 1.3 1.2 0.7 0.9 1.6 5.9 7.3 10.0
Dividend yield (%)
Source: Company, Bloomberg, Kotak Institutional Equities estimates
Sampl
e Rep
ort

KO
TAK INSTITUTIO
NAL EQ
UITIES RESEARCH 10
In
dia D
aily Sum
mary - D
ecemb
er 3
Ind
ia Daily Su
mm
ary - Decem
ber 31, 2010
Kotak Institutional Equities: Valuation summary of key Indian companies
30-Dec-10 Mkt cap.O/S
shares EPS (Rs) EPS growth (%) PER (X) EV/EBITDA (X) Price/BV (X) RoE (%)Target price Upside ADVT-3mo
Company Price (Rs) Rating (Rs mn) (US$ mn) (mn) 2010 2011E 2012E 2010 2011E 2012E 2010 2011E 2012E 2010 2011E 2012E 2010 2011E 2012E 2010 2011E 2012E 2010 2011E 2012E (Rs) (%) (US$ mn)
Sugar
Bajaj Hindustan 122 SELL 23,432 523 191 (7.8) 4.9 12.7 (340.2) (162.7) 160.5 (15.8) 25.2 9.7 13.9 7.6 5.8 1.1 1.1 0.9 0.6 0.6 0.6 (7.0) 4.4 10.4 98 (20.0) 4.3
Balrampur Chini Mills 90 ADD 23,044 514 257 4.3 9.9 10.7 (44.3) 131.9 8.3 21.1 9.1 8.4 10.3 5.8 4.5 1.7 1.5 1.3 0.5 0.5 0.5 8.0 17.1 16.3 102 13.6 3.9
Shree Renuka Sugars 100 REDUCE 66,645 1,488 670 8.8 5.1 5.8 164.2 (42.4) 15.1 11.3 19.6 17.0 6.8 9.1 8.1 2.6 2.2 1.8 0.4 0.4 0.4 29.1 13.0 13.1 90 (9.5) 23.2
Sugar Cautious 113,121 2,525 14.7 24.5 32.3 20.5 16.5 12.5 9.1 7.7 6.4 1.9 1.7 1.4 0.5 0.4 0.4 9.2 10.0 11.5
Technology
HCL Technologies 459 REDUCE 317,021 7,076 690 17.5 23.1 28.7 0.2 32.0 24.1 26.2 19.9 16.0 12.8 11.8 9.5 4.5 4.0 3.4 0.9 1.3 1.3 19.3 21.5 23.1 440 (4.2) 8.2
Hexaware Technologies 117 BUY 16,800 375 144 9.3 5.1 10.4 127.7 (45.6) 104.3 12.5 23.0 11.3 6.9 15.5 7.8 2.0 1.8 1.6 0.9 0.9 0.9 17.8 8.2 15.0 125 6.9 4.5
Infosys Technologies 3,447 BUY 1,978,549 44,164 574 108.3 122.4 160.9 5.7 13.0 31.4 31.8 28.2 21.4 23.6 19.6 15.0 8.6 7.6 6.2 0.7 1.8 1.4 30.1 28.7 31.9 3,800 10.2 72.6
Mphasis BFL 673 SELL 141,816 3,166 211 43.6 51.8 48.9 207.6 18.8 (5.5) 15.4 13.0 13.8 12.4 11.1 9.7 6.0 4.3 3.4 0.5 0.6 0.7 48.1 38.6 27.4 610 (9.4) 6.1
Mindtree 533 REDUCE 21,948 490 41 52.2 27.6 40.6 294.3 (47.2) 47.4 10.2 19.4 13.1 8.8 10.6 7.1 3.3 3.0 2.5 0.4 0.2 0.8 35.2 16.2 20.8 500 (6.2) 0.6
Patni Computer Systems 473 REDUCE 63,011 1,406 133 36.6 40.9 36.7 36.4 11.8 (10.2) 12.9 11.6 12.9 6.5 7.3 6.2 1.7 2.2 1.9 0.6 14.0 1.6 18.2 17.4 15.9 435 (8.0) 6.1
Polaris Software Lab 175 SELL 17,462 390 100 15.4 19.5 21.2 16.9 27.1 8.5 11.4 9.0 8.3 5.6 7.0 5.5 2.0 1.7 1.5 2.0 2.1 2.2 18.6 20.5 19.1 190 8.5 2.8
Satyam Computer Services 66 REDUCE 77,616 1,733 1,176 2.5 2.7 4.1 (190.7) 7.2 55.0 26.6 24.8 16.0 12.3 12.4 7.7 4.1 4.2 3.9 — — — 58.5 16.9 25.4 70 6.1 22.1
TCS 1,170 BUY 2,290,315 51,123 1,957 35.1 43.4 53.2 32.8 23.6 22.5 33.3 27.0 22.0 25.5 19.8 15.6 10.9 9.0 7.4 1.7 1.5 1.8 37.6 36.6 36.9 1,250 6.8 39.0
Tech Mahindra 700 REDUCE 86,742 1,936 124 65.1 63.1 69.3 (9.6) (3.2) 9.8 10.7 11.1 10.1 8.7 9.2 8.3 3.0 2.5 2.1 0.5 0.3 0.3 34.5 25.8 23.5 735 5.0 4.1
Wipro 490 ADD 1,198,744 26,758 2,447 18.9 21.6 25.7 22.1 14.7 18.7 26.0 22.7 19.1 19.7 16.5 13.3 6.1 5.0 4.1 0.7 0.9 1.1 26.5 24.3 23.8 525 7.2 17.8
Technology Attractive 6,210,025 138,617 24.0 16.6 22.5 28.2 24.2 19.8 20.5 17.3 13.7 7.4 6.4 5.3 1.1 1.5 1.4 26.3 26.3 26.6
Telecom
Bharti Airtel 357 REDUCE 1,357,452 30,300 3,798 23.6 17.3 20.4 5.8 (26.9) 17.9 15.1 20.7 17.5 8.6 9.6 7.6 3.2 2.8 2.4 — — — 24.4 14.4 14.7 305 (14.7) 43.9
IDEA 68 REDUCE 224,551 5,012 3,300 2.7 1.6 0.9 (5.8) (42.7) (44.9) 24.9 43.4 78.8 8.5 10.1 8.5 2.0 1.9 1.8 — — — 7.2 4.5 2.6 55 (19.2) 7.9
MTNL 53 SELL 33,579 750 630 (15.6) (10.4) (9.1) (750.8) (33.7) (11.9) (3.4) (5.1) (5.8) 0.3 0.4 0.6 0.3 0.3 0.3 — — — (8.5) (6.1) (5.7) 50 (6.2) 2.6
Reliance Communications 138 SELL 295,247 6,590 2,133 21.8 7.0 9.2 (23.0) (67.7) 30.8 6.3 19.6 15.0 7.6 9.2 7.7 0.7 0.7 0.6 0.6 — — 11.0 3.4 4.3 125 (9.7) 22.1
Tata Communications 254 REDUCE 72,376 1,616 285 14.0 15.2 15.7 3.2 8.2 3.5 18.1 16.8 16.2 7.4 6.9 6.5 1.0 1.0 1.0 2.6 3.0 3.3 5.2 5.5 5.5 225 (11.4) 1.5
Telecom Cautious 1,983,206 44,268 (12.7) (40.0) 18.0 14.1 23.4 19.8 8.5 9.7 7.8 1.7 1.6 1.5 0.2 0.1 0.1 12.3 6.9 7.5
Utilities
Adani Power 131 ADD 285,035 6,362 2,180 0.8 3.5 19.0 NM 351.8 436.1 166.9 36.9 6.9 137.5 29.2 6.3 4.9 4.4 2.7 — — — 4.2 12.5 48.0 143 9.4 3.8
CESC 362 BUY 45,164 1,008 125 34.6 36.6 42.7 8.5 5.8 16.8 10.5 9.9 8.5 6.2 5.6 6.3 1.1 1.0 0.9 1.2 1.3 1.5 10.8 10.2 10.8 480 32.8 1.8
Lanco Infratech 63 BUY 150,673 3,363 2,405 2.1 3.6 4.9 46.6 67.4 36.8 29.4 17.6 12.8 16.0 10.3 7.7 4.5 3.6 2.8 — — — 17.4 21.0 22.5 80 27.7 6.8
NHPC 28 SELL 344,421 7,688 12,301 1.9 1.3 1.6 74.9 (28.2) 21.4 15.1 21.1 17.3 10.0 10.8 8.2 1.4 1.3 1.2 2.0 1.2 1.5 9.7 6.4 7.4 28 - 5.7
NTPC 202 ADD 1,667,645 37,224 8,245 10.5 10.4 12.0 6.8 (0.4) 14.7 19.3 19.4 16.9 14.7 14.9 13.2 2.6 2.4 2.2 1.9 1.8 2.0 14.1 13.0 13.7 195 (3.6) 15.2
Reliance Infrastructure 810 BUY 198,471 4,430 245 62.0 54.8 69.8 (1.0) (11.7) 27.4 13.1 14.8 11.6 12.9 10.7 8.1 1.0 0.9 0.9 0.9 1.1 1.3 6.5 7.2 9.1 1,060 30.8 20.2
Reliance Power 154 SELL 370,179 8,263 2,397 2.9 3.9 5.3 179.7 36.6 34.9 54.1 39.6 29.4 (364.6) 249.7 35.7 2.6 2.4 2.2 — — — 4.8 6.3 7.9 135 (12.6) 15.8
Tata Power 1,365 ADD 336,991 7,522 247 60.2 69.2 88.5 20.1 15.0 27.8 22.7 19.7 15.4 14.1 12.7 10.9 2.6 2.3 2.1 0.9 1.0 1.1 12.9 12.5 14.3 1,420 4.0 8.7
Utilities Cautious 3,398,579 75,861 22.0 4.3 40.1 21.8 20.9 14.9 16.3 16.0 11.3 2.3 2.1 1.9 1.3 1.2 1.4 10.4 10.0 12.7
Others
Havells India 392 ADD 48,955 1,093 125 6.1 23.2 28.9 141.3 278.2 24.5 63.9 16.9 13.6 17.8 11.2 9.0 11.5 7.1 4.8 0.5 0.6 0.7 14.3 52.1 42.4 425 8.3 3.3
Jaiprakash Associates 103 BUY 227,856 5,086 2,214 1.7 4.4 6.2 (12.7) 153.2 41.1 58.8 23.2 16.5 23.5 15.1 10.9 2.7 2.4 2.1 — — — 5.1 10.8 13.5 155 50.6 31.5
Jet Airways 733 BUY 63,306 1,413 86 (69.8) 44.7 93.9 (71.7) (164.1) 110.0 (10.5) 16.4 7.8 13.9 8.0 6.2 3.7 3.0 2.2 — — — — 20.1 32.2 1,220 66.4 23.7
Sintex 181 REDUCE 49,164 1,097 272 12.1 14.7 16.9 (49.6) 21.6 14.9 14.9 12.3 10.7 12.7 8.2 7.1 2.3 1.9 1.6 0.7 0.7 0.8 15.3 15.7 15.4 210 16.2 8.5
SpiceJet 78 BUY 31,494 703 403 2.5 6.0 9.2 (117.4) 136.6 53.5 30.8 13.0 8.5 36.1 7.4 5.0 (9.2) 6.9 3.8 — — — (15.9) 424.8 57.9 120 53.6 23.7
Tata Chemicals 389 REDUCE 94,712 2,114 243 26.4 27.6 35.6 (27.1) 4.5 29.0 14.7 14.1 10.9 7.3 6.4 4.9 2.0 1.8 1.5 2.3 2.4 2.4 16.0 17.3 19.4 370 (5.0) 6.9
United Phosphorus 172 BUY 79,594 1,777 462 11.9 12.9 17.6 18.1 8.4 36.6 14.5 13.4 9.8 7.9 7.2 5.6 2.7 2.3 1.9 1.1 1.1 1.1 19.1 18.3 20.8 220 27.8 10.0
Others 595,081 13,283 (539.8) 146.8 42.1 41.2 16.7 11.7 14.6 10.4 8.1 2.9 2.4 2.1 0.6 0.6 0.7 7.2 14.7 17.5
KS universe (b) 51,886,229 1,158,175 21.1 21.2 23.0 20.9 17.3 14.1 12.4 10.4 8.5 3.2 2.7 2.4 1.1 1.3 1.5 15.2 15.8 16.9
KS universe (b) ex-Energy 42,874,791 957,027 17.1 22.2 23.4 22.8 18.7 15.1 15.0 12.5 10.0 3.6 3.0 2.6 1.0 1.1 1.3 15.7 16.2 17.2
KS universe (d) ex-Energy & ex-Commodities 36,089,994 805,580 18.6 21.1 24.3 24.0 19.8 15.9 17.1 14.2 11.2 3.6 3.1 2.7 1.1 1.2 1.3 15.2 15.8 17.0
Notes:
(a) For banks we have used adjusted book values.
(b) 2010 means calendar year 2009, similarly for 2011 and 2012 for these particular companies.
(c) EV/Sales & EV/EBITDA for KS universe excludes Banking Sector.
(d) Rupee-US Dollar exchange rate (Rs/US$)= 44.80
Dividend yield (%)
Source: Company, Bloomberg, Kotak Institutional Equities estimates
Sampl
e Rep
ort

11 KOTAK INSTITUTIONAL EQUITIES RESEARCH
Disclosures
Kotak Institutional Equities Research coverage universeDistribution of ratings/investment banking relationships
Source: Kotak Institutional Equities As of September 30, 2010
* The above categories are defined as follows: Buy = We expect this stock to outperform the BSE Sensex by 10% over the next 12 months; Add = We expect this stock to outperform the BSE Sensex by 0-10% over the next 12 months; Reduce = We expect this stock to underperform the BSE Sensex by 0-10% over the next 12 months; Sell = We expect this stock to underperform the BSE Sensex by more then 10% over the next 12 months. These ratings are used illustratively to comply with applicable regulations. As of 30/09/2010 Kotak Institutional Equities Investment Research had investment ratings on 156 equity securities.
Percentage of companies covered by Kotak Institutional Equities, within the specified category.
Percentage of companies within each category for which Kotak Institutional Equities and or its affiliates has provided investment banking services within the previous 12 months.
11.5%
23.1%
32.1% 33.3%
3.2%5.1% 5.1%
0.6%0%
10%
20%
30%
40%
50%
60%
70%
BUY ADD REDUCE SELL
Ratings and other definitions/identifiers
Definitions of ratings
BUY. We expect this stock to outperform the BSE Sensex by 10% over the next 12 months.
ADD. We expect this stock to outperform the BSE Sensex by 0-10% over the next 12 months.
REDUCE. We expect this stock to underperform the BSE Sensex by 0-10% over the next 12 months.
SELL. We expect this stock to underperform the BSE Sensex by more than 10% over the next 12 months.
Our target price are also on 12-month horizon basis.
Other definitions
Coverage view. The coverage view represents each analyst’s overall fundamental outlook on the Sector. The coverage view will consist of one of the following designations: Attractive, Neutral, Cautious.
Other ratings/identifiers
NR = Not Rated. The investment rating and target price, if any, have been suspended temporarily. Such suspension is in compliance with applicable regulation(s) and/or Kotak Securities policies in circumstances when Kotak Securities or its affiliates is acting in an advisory capacity in a merger or strategic transaction involving this company and in certain other circumstances.
CS = Coverage Suspended. Kotak Securities has suspended coverage of this company.
NC = Not Covered. Kotak Securities does not cover this company.
RS = Rating Suspended. Kotak Securities Research has suspended the investment rating and price target, if any, for this stock, because there is not a sufficient fundamental basis for determining an investment rating or target. The previous investment rating and price target, if any, are no longer in effect for this stock and should not be relied upon.
NA = Not Available or Not Applicable. The information is not available for display or is not applicable.
NM = Not Meaningful. The information is not meaningful and is therefore excluded.
Sampl
e Rep
ort

Corporate Office Overseas Offices
Kotak Securities Ltd.
Bakhtawar, 1st Floor
229, Nariman Point
Mumbai 400 021, India
Tel: +91-22-6634-1100
Kotak Mahindra (UK) Ltd
6th Floor, Portsoken House
155-157 The Minories
London EC 3N 1 LS
Tel: +44-20-7977-6900 / 6940
Kotak Mahindra Inc
50 Main Street, Suite No.310
Westchester Financial Centre
White Plains, New York 10606
Tel:+1-914-997-6120
Copyright 2010 Kotak Institutional Equities (Kotak Securities Limited). All rights reserved.
1. Note that the research analysts contributing to this report may not be registered/qualified as research analysts with FINRA; and
2. Such research analysts may not be associated persons of Kotak Mahindra Inc and therefore, may not be subject to NASD Rule 2711 restrictions on communications with a subject company, public appearances and trading securities held by a research analyst account.
Kotak Securities Limited and its affiliates are a full-service, integrated investment banking, investment management, brokerage and financing group. We along with our affiliates are leading underwriter of securities and participants in virtually all securities trading markets in India. We and our affiliates have investment banking and other business relationships with a significant percentage of the companies covered by our Investment Research Department. Our research professionals provide important input into our investment banking and other business selection processes. Investors should assume that Kotak Securities Limited and/or its affiliates are seeking or will seek investment banking or other business from the company or companies that are the subject of this material and that the research professionals who were involved in preparing this material may participate in the solicitation of such business. Our research professionals are paid in part based on the profitability of Kotak Securities Limited, which include earnings from investment banking and other business. Kotak Securities Limited generally prohibits its analysts, persons reporting to analysts, and members of their households from maintaining a financial interest in the securities or derivatives of any companies that the analysts cover. Additionally, Kotak Securities Limited generally prohibits its analysts and persons reporting to analysts from serving as an officer, director, or advisory board member of any companies that the analysts cover. Our salespeople, traders, and other professionals may provide oral or written market commentary or trading strategies to our clients that reflect opinions that are contrary to the opinions expressed herein, and our proprietary trading and investing businesses may make investment decisions that are inconsistent with the recommendations expressed herein. In reviewing these materials, you should be aware that any or all of the foregoing, among other things, may give rise to real or potential conflicts of interest. Additionally, other important information regarding our relationships with the company or companies that are the subject of this material is provided herein.
This material should not be construed as an offer to sell or the solicitation of an offer to buy any security in any jurisdiction where such an offer or solicitation would be illegal. We are not soliciting any action based on this material. It is for the general information of clients of Kotak Securities Limited. It does not constitute a personal recommendation or take into account the particular investment objectives, financial situations, or needs of individual clients. Before acting on any advice or recommendation in this material, clients should consider whether it is suitable for their particular circumstances and, if necessary, seek professional advice. The price and value of the investments referred to in this material and the income from them may go down as well as up, and investors may realize losses on any investments. Past performance is not a guide for future performance, future returns are not guaranteed and a loss of original capital may occur. Kotak Securities Limited does not provide tax advise to its clients, and all investors are strongly advised to consult with their tax advisers regarding any potential investment.
Certain transactions -including those involving futures, options, and other derivatives as well as non-investment-grade securities - give rise to substantial risk and are not suitable for all investors. The material is based on information that we consider reliable, but we do not represent that it is accurate or complete, and it should not be relied on as such. Opinions expressed are our current opinions as of the date appearing on this material only. We endeavor to update on a reasonable basis the information discussed in this material, but regulatory, compliance, or other reasons may prevent us from doing so. We and our affiliates, officers, directors, and employees, including persons involved in the preparation or issuance of this material, may from time to time have “long” or “short” positions in, act as principal in, and buy or sell the securities or derivatives thereof of companies mentioned herein. For the purpose of calculating whether Kotak Securities Limited and its affiliates holds beneficially owns or controls, including the right to vote for directors, 1% of more of the equity shares of the subject issuer of a research report, the holdings does not include accounts managed by Kotak Mahindra Mutual Fund. Kotak Securities Limited and its non US affiliates may, to the extent permissible under applicable laws, have acted on or used this research to the extent that it relates to non US issuers, prior to or immediately following its publication. Foreign currency denominated securities are subject to fluctuations in exchange rates that could have an adverse effect on the value or price of or income derived from the investment. In addition, investors in securities such as ADRs, the value of which are influenced by foreign currencies affectively assume currency risk. In addition options involve risks and are not suitable for all investors. Please ensure that you have read and understood the current derivatives risk disclosure document before entering into any derivative transactions.
This report has not been prepared by Kotak Mahindra Inc. (KMInc). However KMInc has reviewed the report and, in so far as it includes current or historical information, it is believed to be reliable, although its accuracy and completeness cannot be guaranteed. Any reference to Kotak Securities Limited shall also be deemed to mean and include Kotak Mahindra Inc.
Sampl
e Rep
ort