3023083 gi p 225 cover - emis elibm: mathematical … · oliver wiegertiteratec gmbh ... stephan...
TRANSCRIPT

“Modellierung 2014” is the 14th event in a conference series focusing on a broad range of modeling topics from a variety of perspectives. With its emphasis on lively discussions and cross-fertilization of academia and industry, it provides a valuable platform to further the state of the art in topics such as modeling foundations, meth-odologies, applications, and tools. This volume contains contributions from the ref-ereed main program and the abstracts of the keynote talks.
ISSN 1617-5468ISBN 978-388579-619-0
Gesellschaft für Informatik e.V. (GI)
publishes this series in order to make available to a broad public recent findings in informatics (i.e. computer science and informa-tion systems), to document conferences that are organized in co-operation with GI and to publish the annual GI Award dissertation.
Broken down into• s eminars• pr oceedings• di ssertations• th ematicscurrent topics are dealt with from the vantage point of research and development, teaching and further training in theory and practice.The Editorial Committee uses an intensive review process in order to ensure high quality contributions.
The volumes are published in German or English.
Information: http://www.gi.de/service/publikationen/lni/
225
GI-EditionLecture Notes in Informatics
Hans-Georg Fill, Dimitris Karagiannis, Ulrich Reimer (Hrsg.)
Modellierung 2014
19.–21. März 2014 Wien
Proceedings
H-G
. Fill
, D. K
arag
ian
nis
, U. R
eim
er (
Hrs
g.):
Mo
del
lieru
ng
2014
3023083 GI_P_225 Cover.indd 1 25.02.14 11:29


Hans-Georg Fill,Dimitris Karagiannis,Ulrich Reimer (Hrsg.)
Modellierung 2014
19. - 21. März 2014Wien, Österreich
Gesellschaft für Informatik e. V. (GI)

Lecture Notes in Informatics (LNI) - ProceedingsSeries of the Gesellschaft für Informatik (GI)
Volume P-225
ISBN 978-3-88579-619-0ISSN 1617-5468
Volume EditorsPriv.-Doz. Dr. Hans-Georg Fill
Universität Wien, Forschungsgruppe Knowledge EngineeringWähringer Straße 29, 1090 Wien, AustriaEmail: [email protected]
Prof. Dr. Dimitris KaragiannisUniversität Wien, Forschungsgruppe Knowledge EngineeringWähringer Straße 29, 1090 Wien, AustriaEmail: [email protected]
Prof. Dr. Ulrich ReimerFHS St. Gallen, Hochschule für Angewandte WissenschaftenInstitut für Informations- und Prozess ManagementRosenbergstrasse 59, 9000 St.Gallen, SwitzerlandEmail: [email protected]
Series Editorial BoardHeinrich C. Mayr, Alpen-Adria-Universität Klagenfurt, Austria(Chairman, [email protected])Dieter Fellner, Technische Universität Darmstadt, GermanyUlrich Flegel, Hochschule für Technik, Stuttgart, GermanyUlrich Frank, Universität Duisburg-Essen, GermanyJohann-Christoph Freytag, Humboldt-Universität zu Berlin, GermanyMichael Goedicke, Universität Duisburg-Essen, GermanyRalf Hofestädt, Universität Bielefeld, GermanyMichael Koch, Universität der Bundeswehr München, GermanyAxel Lehmann, Universität der Bundeswehr München, GermanyPeter Sanders, Karlsruher Institut für Technologie (KIT), GermanySigrid Schubert, Universität Siegen, GermanyIngo Timm, Universität Trier, GermanyKarin Vosseberg, Hochschule Bremerhaven, GermanyMaria Wimmer, Universität Koblenz-Landau, Germany
DissertationsSteffen Hölldobler, Technische Universität Dresden, GermanySeminarsReinhard Wilhelm, Universität des Saarlandes, GermanyThematicsAndreas Oberweis, Karlsruher Institut für Technologie (KIT), Germany
© Gesellschaft für Informatik, Bonn 2014printed by Köllen Druck+Verlag GmbH, Bonn

Vorwort
Die derzeit im zweijährigen Rhythmus stattfindende Fachtagung „Modellierung“ isteine Plattform zur inhaltlichen Diskussion für eine große Anzahl von Fachgruppen inder Gesellschaft für Informatik (GI), die sich mit unterschiedlichsten Perspektiven desThemas Modellierung beschäftigen. Sie stellt somit ein zentrales Forum für denErfahrungsaustausch zu akademischen wie auch praxisbezogenenModellierungsansätzen dar.
Die Fachtagung „Modellierung“ umfasst traditionell ein wissenschaftliches Programmbegleitet durch Workshops, Tutorien sowie ein Praxisforum und einDoktorandensymposium. Dabei dienen die Workshops dazu, Spezialthemen derModellierung im Detail zu beleuchten, während in den Tutorien praktischeAnwendungen aktueller Modellierungsansätze vorgestellt werden. Den Tutoriums-Teilnehmerinnen und -Teilnehmern wird dadurch die Möglichkeit eröffnet, nicht nureinen theoretischen Einblick in die Modellierung zu bekommen, sondern den Einsatzder entsprechenden Werkzeuge und Methoden auch in Aktion zu erleben. Abgerundetwird das Programm durch ein Praxisforum zur Vorstellung der Anwendung undUmsetzung von Modellierungsmethoden, -techniken und -werkzeugen in derbetrieblichen Praxis sowie ein Doktorandensymposium zur Vorstellung von aktuellenDissertationsvorhaben.
Für das wissenschaftliche Programm der Modellierung 2014 wurden von insgesamt 57Einreichungen die besten 22 Beiträge ausgewählt. Dies entspricht einer Annahmequotevon 38,5%. Die Begutachtung erfolgte durch ein doppelt-blindes Beurteilungsverfahrenmit jeweils drei Gutachten pro Einreichung. Während des Auswahlprozesses bestandfür die Autorinnen und Autoren die Möglichkeit, zu den sie betreffenden GutachtenStellung zu nehmen, um so etwaige Missverständnisse ausräumen zu können. Dieakzeptierten Beiträge behandeln aktuelle wissenschaftliche Erkenntnisse zu einerbreiten Palette von Themen in den Bereichen Modellierungssprachen, -methoden und-ansätze, Prozessmanagement, sowie zur Modellierung im Software- und System-Engineering.
Im Rahmen der diesjährigen Tagung finden drei eingeladene Vorträge statt: Prof. Dr.Stefan Decker vom Digital Enterprise Research Institute zum Thema „Ontologies on theWeb: An Alternative Model“, Frank Moser von der International Atomic EnergyAgency zum Thema „IT in International Organizations“ sowie Prof. Dr. Dr. h.c.Heinrich C. Mayr zum Thema „Modellierung - Geschichte in und mit Folgen“.
Wir danken allen Vortragenden für ihre Beiträge und den Mitgliedern desProgrammkomitees und den weiteren Gutachterinnen und Gutachtern für diezeitgerechte Erstellung der Begutachtungen. Weiterhin bedanken wir uns bei allen ander Organisation der Tagung Beteiligten, insbesondere bei Xiulian Benesch für dieErstellung des Layout des Tagungsbandes.
Wien, St. Gallen, im März 2014Hans-Georg Fill, Dimitris Karagiannis, Ulrich Reimer

Sponsoren
Wir danken den folgenden Unternehmen für die Unterstützung der Modellierung 2014.
HILTIwww.hilti.com
MIDwww.mid.de
Novomaticwww.novomatic.com
WKWwww.wkw.at
WKOwww.wko.at
Partner
OMiLABwww.omilab.org
Universität Wienwww.univie.ac.at
Fakultät für Informatikwww.informatik.univie.ac.at
Gesellschaft für Informatikwww.gi.de
Österreichische Computer Gesellschaftwww.ocg.at
Schweizer Informatik Gesellschaftwww.s-i.ch

Tagungsleitung
Gesamtleitung Heinrich C. MayrProgrammkomitee Vorsitz Dimitris Karagiannis, Ulrich ReimerWorkshops Andreas Oberweis, Friedrich SteimannPraxisforum Heinz Züllighoven, Hans-Georg FillDoktorandInnen-Symposium Ulrich Frank, Heinrich C. MayrTutorien Stefan Strecker, Susanne LeistOrganisationskomitee Vorsitz Domenik Bork
Programmkomitee
Colin Atkinson Universität MannheimRuth Breu Universität InnsbruckJörg Desel Fernuniversität in HagenJürgen Ebert Universität KoblenzGregor Engels Universität PaderbornHans-Georg Fill Universität WienUlrich Frank Universität Duisburg-EssenHolger Giese Universität PotsdamMartin Glinz Universität ZürichMartin Gogolla Universität BremenUrsula Goltz Technische Universität BraunschweigMaritta Heisel Universität Duisburg-EssenWolfgang Hesse Ludwig-Maximilians-Universität MünchenHolger Hermanns Universität des SaarlandesMartin Hofmann Ludwig-Maximilians-Universität MünchenFrank Houdek Daimler AGHeinrich Hußmann Ludwig-Maximilians-Universität MünchenStefan Jablonski Universität BayreuthJan Jürjens Technische Universität Dortmund und
Fraunhofer ISSTGerti Kappel Technische Universität WienDimitris Karagiannis Universität WienRoland KaschekRalf KneuperChristian Kop Alpen-Adria-Universität KlargenfurtThomas Kühne Victoria University of WellingtonJochen Küster IBM ResearchSusanne Leist Universität RegensburgHorst Lichter RWTH AachenPeter Liggesmeyer Technische Universität KaiserslauternZhendong Ma Austrian Institute of TechnologyFlorian Matthes Technische Universität MünchenHeinrich C.Mayr Alpen-Adria-Universität KlagenfurtMirjam Minor Goethe-Universität-Frankfurt

Programmkomitee (Fortsetzung)
Friedericke Nickl Swiss Life DeutschlandMarkus Nüttgens Universität HamburgAndreas Oberweis Karlsruher Institut für TechnologieErich Ortner TECHNUMBarbara Paech Universität HeidelbergThorsten Pawletta Hochschule WismarJan Philipps Validas AGKlaus Pohl Universität Duisburg-EssenErik Proper Public Research Centre Henri Tudor
LuxembourgAlexander Pretschner Technische Universität MünchenUlrich Reimer Fachhochschule St. GallenWolfgang Reisig Humboldt-Universität BerlinRalf Reussner Karlsruher Institut für Technologie /FZIMatthias Riebisch Universität HamburgBernhard Rumpe RWTH AachenIna Schaefer Technische Universität BraunschweigBernhard Schätz fortiss GmbHPeter H. Schmitt Karlsruher Institut für TechnologieAndy Schürr Technische Universität DarmstadtElmar J. Sinz Universität BambergSteffen Staab Universität KoblenzFriedrich Steimann Fernuniversität in HagenSusanne Strahringer Technische Universität DresdenStefan Strecker Fernuniversität in HagenPeter Tabeling INTERVISTA AGGabriele Taentzer Philipps-Universität MarburgBernhard Thalheim Universität KielKlaus Turowski Otto-von-Guericke Universität MagedeburgAxel Uhl SAP AGGerd Wagner Brandenburgische Technische UniversitätMathias Weske Universität PotsdamOliver Wiegert iteratec GmbHAndreas Winter Universität OldenburgMario Winter Fachhochschule KölnRobert Winter Universität St. GallenHeinz Züllighoven Universität HamburgAlbert Zündorf Universität Kassel

Ergänzende Gutachter
Ralf AbrahamSascha AlberHauke BallerKristian BeckersThorsten BergerAlexander BergmayrJosef BlasiniGerald DaeubleAna DragomirMatthias FarwickAndreas GanserSebastian GerdesChristian GerthJens GuldenMatheus HauderFrank HilkenStefan HoferOliver HofrichterFlorian HölzlThomas IrgangPhilipp KalbPetra KaufmannAndreas KochMax E. KramerDilshod KuryazovSascha LityMalte Lochau
Sonja MaierDieter MayrhoferRene MeisAndre MoellePedram Mir Seyed NazariSietse OverbeekLars PatzinaDimitri PlotnikovSimon-Lennert RaeschChristian RitterSascha RothThomas RuhrothKarsten SallerThomas SantenAndreas ScharfEric Schulte-ZurhausenNorbert SeyffChristian SillaberKarsten SohrMatthias SpliethJoachim SternhuberJan SürmeliYibo WangMichael WernerPeter WiedmannDustin WüestGabriele Zorn-Pauli

Querschnittsfachausschuss Modellierung
Die Modellierung 2014 ist eine Arbeitstagung des QuerschnittsfachausschussesModellierung (www.gi-modellierung.de), in dem folgende GI-Fachgliederungenvertreten sind:
ASE (Automotive Software Engineering)EMISA (Entwicklungsmethoden für Informationssysteme und deren Anwendung)FoMSESS (Formale Methoden und Software Engineering für Sichere Systeme)ILLS (Intelligente Lehr- und Lernsysteme)MMB (Messung, Modellierung und Bewertung von Rechensystemen)OOSE (Objektorientierte Software-Entwicklung)PN (Petrinetze)RE (Requirements Engineering)ST (Softwaretechnik)SWA (Softwarearchitektur)MobIS (Modellierung betrieblicher Informationssysteme)WI-VM (Vorgehensmodelle für die betriebliche Anwendungsentwicklung)WM (Wissensmanagement)

Inhalt
Keynote
Stefan DeckerOntologies on the Web: An Alternative Model………….……………...…………... 13
Frank MoserIT in International Organizations.……………….……….…..…….………………... 14
Heinrich C. MayrModellierung - Geschichte in und mit Folgen.……………….……………………... 15
Modellierungssprachen, -methoden und -ansätze
Dirk van der Linden and Henderik A. ProperOn the accommodation of conceptual distinctions in conceptual modelinglanguages…………………………………………………………………………...…..... 17
Sebastian Bittmann and Oliver ThomasA theory of practice modelling - Elicitation of model pragmatics in dependenceto human actions…………………...……………………..……………….……….…... 33
Alexander Bock, Heiko Kattenstroth and Sietse OverbeekTowards a Modeling Method for Supporting the Management of OrganizationalDecision Processes…………….……………………………………………..….……... 49
Michael Derntl, Stephan Erdtmann, Petru Nicolaescu, Ralf Klamma andMatthias JarkeEchtzeitmetamodellierung im Web-Browser………....……..……………..………... 65
Christoph Seidl, Ina Schaefer and Uwe AßmannDeltaEcore-A Model-Based Delta Language Generation Framework…………… 81
Erik Burger and Aleksandar ToshovskiDifference-based Conformance Checking for Ecore Metamodels……….….….… 97
Marie-Christin Ostendorp, Jan Jelschen and Andreas WinterELVIZ: A Query-Based Approach to Model Visualization………………….……... 105
Modellierung im Prozessmanagement
Daniel Braunnagel, Florian Johannsen and Susanne LeistCoupling and process modeling: An analysis at hand of the eEPC……..….…..... 121
Sebastian Bittmann, Dirk Metzger, Michael Fellmann and Oliver ThomasAdditional Information in Business Processes: A Pattern-Based Integration ofNatural Language Artefacts………………………..………….…………………..…... 137
Tobias Schneider and Stefan JablonskiPODSL - Domänenspezifische Datenmodellierung auf Basis von Prozessen…... 153

Inhalt (Fortsetzung)
Marco Mevius, Erich Ortner and Peter WiedmannGebrauchssprachliche Modellierung als Grundlage für agilesGeschäftsprozessmanagement………………………..…………………………..….... 169
Michael Fellmann, Agnes Koschmider and Andreas SchoknechtAnalysis of Business Process Model Reuse Literature: Are Research ConceptsEmpirically Validated?………………………………………………….…………….... 185
Martin Schultz and Niels Mueller-WickopTowards Auditors’ Preferences on Documentation Formats in Business ProcessAudits………………………………………..………………………………….……….... 193
Niels Mueller-Wickop and Markus NüttgensConceptual Model of Accounts - Closing the Gap between Financial Statementsand Business Process Modeling…………………….…………………….…………... 209
Modellierung im Software- und System-Engineering
Erhan Leblebici, Anthony Anjorin and Andy SchürrA Catalogue of Optimization Techniques for Triple Graph Grammars………….. 225
Elmar J. SinzKonzeptuelle Modellierung der Zustandskonsistenz verteilter betrieblicherInformationssysteme………………………….…………………………....….………... 241
Gordon Cichon and Martin HofmannFormal Semantics of Synchronous Transfer Architecture………………...…..…... 257
Martin Gogolla, Lars Hamann, Frank Hilken, Mirco Kuhlmann andRobert FranceFrom Application Models to Filmstrip Models: An Approach to AutomaticValidation of Model Dynamics……….………………………………….…..…...…... 273
Philip Langer, Tanja Mayerhofer, Manuel Wimmer and Gerti KappelOn the Usage of UML: Initial Results of Analyzing Open UML Models………... 289
Qurat-ul-ann Farooq, Steffen Lehnert and Matthias RiebischAnalyzing Model Dependencies for Rule-based Regression Test Selection……... 305
Patrick Frey, Reinhard von Hanxleden, Christoph Krüger, Ulf Rüegg,Christian Schneider and Miro SpönemannEfficient Exploration of Complex Data Flow Models……………………….……... 321
Marianne Busch, Nora Koch and Martin WirsingSecEval: An Evaluation Framework for Engineering Secure Systems…………... 337
Ontologies on the Web: An Alternative Model
Stefan Decker
Digital Enterprise Research InstituteNational University of Ireland
IDA Business ParkLower DanganGalway, Ireland
Abstract
Ontologies have been promoted and used for knowledge sharing. Several models forrepresenting ontologies have been developed in the Knowledge Representation field, inparticular associated with the Semantic Web.
In my talk I will summarise developments so far, and will argue that the currently advo-cated approaches miss certain basic properties of current distributed information sharinginfrastructures (read: the Web and the Internet). I will present an alternative model aim-ing to support knowledge sharing and re-use on a global basis.
13

IT in International Organizations
Frank Moser
International Atomic Energy AgencyDepartment of Safeguards
Office of Information and Communication SystemsVienna International Centre
PO Box 1001400 Vienna, Austria
Abstract
In my presentation I will highlight 5 main IT challenges which I have identified over theyears as typical to International Organizations. These challenges are:
(i) alignment of business and IT,
(ii) innovation in static environments,
(iii) the end of the era of these big IT projects,
(iv) successful management and delivery of IT projects and
(v) the struggle in IT security.
My talk will be non-scientific and I will provide concrete examples to illustrate thesechallenges. A little bit of “modelling” from a practical point of view may be included.
14

Modellierung – eine Geschichte in und mit Folgen
Heinrich C. Mayr
Institut für Angewandte InformatikAlpen-Adria-Universität Klagenfurt
Abstract
Modellierung und Modellierungsmethoden sind (nicht nur) für die Informatik von ent-scheidender Bedeutung. Wir kommen nicht ohne sie aus, auch wenn sie nicht immergeliebt, häufig unterschätzt, und in der Praxis oft mit „das bringt nichts“ abgetan werden.
Immerhin wird die Modellierung aber vor allem in der deutschsprachigen Informatik seitvielen Jahren breit und mit einiger Systematik beforscht, gelehrt und auch betrieben.Zwar werden viele Konzepte regelmäßig „neu“ erfunden oder neu benannt, viele Fehlerimmer wieder gemacht und Vorurteile genüsslich ausgekostet. Doch es gibt Fortschritte:sowohl in der theoretischen Fundierung als auch in der Erkenntnis, was für die Praxisund in ihr nötig ist.
Der Vortrag wird ein Bild hiervon zeichnen – mit Schwerpunkt auf die jüngere Entwick-lung, etwa seit der ersten GI-Modellierungstagung. Das geht natürlich nicht ohne einpaar Rückgriffe auf das graue Mittelalter der frühen Informatik-Jahre und einer Skizzie-rung des Wesens der Modellierung und ihrer Dimensionen.
15


On the accommodation of conceptual distinctions in
conceptual modeling languages∗
Dirk van der Linden1,2,3 and Henderik A. Proper1,2,3
1 Public Research Centre Henri Tudor, Luxembourg, Luxembourg
[email protected], [email protected] Radboud University Nijmegen, the Netherlands
3 EE-Team, Luxembourg, Luxembourg†
Abstract: In this paper we are concerned with the degree to which modeling lan-guages explicitly accommodate conceptual distinctions. Such distinctions refer to theprecision and nuance with which a given modeling concept in a language can be in-terpreted (e.g., can an actor be a human, an abstraction, or a collection of things). Westart by elaborating on the notion of conceptual distinctions, while also providing alist of common modeling concepts and related distinctions that are relevant to enter-prise modeling. Based on this, we will then analyze a number of conceptual modelinglanguages to see whether they accommodate the explicit modeling of (potentially im-portant) conceptual distinctions – that is, whether they have specific language elementsto model conceptually distinct entities with. On basis of these findings we then furtherdiscuss how to ensure such different distinctions are captured in created models, howto know which of them to support in modeling languages, and where existing methodsfall short. We conclude by discussing what impact our findings may have on the use(and validation) of modeling languages.
1 Introduction
The creation of conceptual models, in particular when they represent a part of an en-
terprise, involves a myriad of stakeholders and informants, each of which has its own
background and views on the domain that is modeled. As a result, conceptual modeling
is considered to be an inter-subjective activity [PS01, Moo05], where modeling “ideally”
boils down to the representation of a shared social reality. Most concepts common to con-
ceptual modeling languages and methods (e.g., goal, process, resource, actor, etc.) can
be interpreted in a number of conceptually distinct, yet equally valid, ways. This is par-
tially reflected in the already large, and diverse, amount of terminology used by modeling
∗An initial version of this paper appeared as “Dirk van der Linden, Henderik A. Proper. Do conceptual
modeling languages accommodate enough explicit conceptual distinctions? Short Paper Proceedings of the 6th
IFIP WG 8.1 working conference on the Practice of Enterprise Modeling (PoEM 2013), CEUR-WS, 2013ӠThe Enterprise Engineering Team (EE-Team) is a collaboration between Public Research Centre Henri
Tudor, Radboud University, the University of Luxembourg and HAN University of Applied Sciences
(www.ee-team.eu)
17

languages and their users. For example, in the context of business processes, one may
choose to interpret actors as being human beings who take decisions and execute actions.
At the same time, however, interpreting them as being abstract agents or dedicated pieces
of hardware might be equally valid in another context. One could also choose to interpret
actors as being a collection of things that, together, execute some actions (e.g., an organiza-
tional department composed of many employees, a cluster of computers) instead of being
a single thing executing an act. Depending on the context of the domain to be modeled,
the stakeholders and other modelers we interact with, and the goal of the model itself, we
often choose among the different possible interpretations. These different interpretations
of the same concept can lead to a host of semantic considerations. For example, if an actor
is a human being, one can never be as sure that s/he will behave as expected compared to,
say, a computer. If an actor is seen as a composite entity (i.e., an organizational depart-
ment) the issue of the responsibility of the actions the department takes comes into play as
well, since in the end, a concrete, specific person needs to be held (legally and/or socially)
responsible. These considerations hold in the case of many of the common concepts. For
example, interpreting a resource as an immaterial thing (e.g., using a piece of information
as a resource) will require one to carefully distinguish between the actual resource and its
physical representation (e.g., the collection of paper and ink blobs).
It is important that such different interpretations can be modeled distinctly. It would not
do well for the overall clarity and semantic quality of a model if we conflate semantically
different interpretations (e.g., human beings, abstract entities and material objects) under
the same banner (e.g., ‘actor’) and pretend that they are one and the same thing. Yet,
this is often the case with modeling languages. Frequently, the designers of a modeling
language define a type (e.g., actor) and allow it to be instantiated with a wide diversity
of entities (humans, hardware, abstract and mathematical entities) which have no com-
mon ontological basis. Sometimes modeling languages do accommodate (some of) these
conceptual distinctions, but then do so only implicitly. That is, in their specification or
meta-model they assume a particular interpretation. As such, all instantiations of a model
are then implicitly assumed to abide by that interpretation (e.g., all actors in the given
model are assumed to be human things, all goals are assumed to be hard goals). An exam-
ple of a language doing so is the i* specification as found in the Aachen wiki [GHYA07],
which defines agents (the acting entities) as having “a concrete physical manifestation”.
This implicitly makes it semantically incorrect to use abstractions (e.g., agents as they are
commonly understood) and furthermore, perhaps ontologically incorrect to use composite
agents – market segments – as the composition itself is not physically manifested.
It is more useful if a modeling language accommodates such conceptual distinctions ex-
plicitly, to the extent needed in relation to its expected and planned use. That is, instead
of relying on the underlying semantics to define every concept they allow (or perhaps re-
quire), to use a notation that explicitly encodes information about our interpretation – and
do so by providing distinct notational elements for all the important different conceptual
distinctions. This can mean for instance, having exclusive (visual) elements to represent
such distinct concepts by (e.g., the amount of ‘stick puppets’ in in ArchiMate actor type
denoting whether it is a single actor or a collection of them). This is important from a
cognitive point of view as it improves the quality of the notation by ensuring there is no
18

notational homonymy. Many researchers have proposed methods and frameworks to an-
alyze the degree to which languages are complete in this sense [GW04, BJWW09], often
ontological in nature (e.g., UFO [GW10], Bunge-Wand-Weber [WW90] and their applica-
tions [FL03, GHW03]), although some have been criticized as being poorly suited when
applied to the information systems domain [WK05]. A major effort on this topic was un-
dertaken by e.g., Moody in his work on a general “physics of notation” [Moo09]. Several
modeling languages have been analyzed to estimate their cognitive quality in terms of this
framework (e.g. i* [MHM10], BPMN [GHA11], UCM [GAH11], and UML [MH09]).
However, most of these analyses are aimed at the semantics of the (visual) syntax, and
forego a more detailed analyses of the semantics of the individual elements of meaning
themselves. By this we mean that they analyzed the semantic quality of the formaliza-
tion of grammar or the syntax (i.e., which elements interoperate in what way), but spent
less attention to the question what the elements arranged by this syntax actually means
to the users of the language (e.g., what is this element called ‘agent’, what thing does it
really represent). From a quality perspective, important related issues are semiotic clar-
ity (one-to-one correspondence between semantic constructs and graphical symbols) and
perceptual discriminability (symbols should be clearly distinguishable) [Moo09]. This is-
sue comes into play more clearly with domain-specific modeling languages than it does
with general-purpose languages like UML, ER or ORM (even though these languages
were originally designed for specific purposes like software and database engineering) be-
cause they have more native specialized semantic elements (i.e., types) to represent the
important aspects from their domain by. It is thus important that these domain-specific
languages have the ability to explicitly express important semantic distinctions that might
arise in needed specific situations.
The goal of this work is not to provide detailed individual analyses of all the languages
involved, but to explore whether there is a trend in modeling languages to support enough
distinctions or not, and on basis of that argue what kinds of research and engineering efforts
are needed to deal with optimizing the conceptual completeness of modeling languages.
Hence the initial purpose of our work is to gain a deeper (empirical) understanding of
the issues and challenges involved, rather than ‘jumping’ to the creation/suggestion of
mechanisms to possibly deal with them. Therefore, the work reported on in this paper
specifically looks at the cognitive quality of a number of modeling languages and methods
in terms of the semiotic clarity of their semantic constructs. These constructs can be
both visual (for visual notations) and textual (for textual notations), but both require a
proper correspondence between semantic constructs and symbols used for them. We do
so in the context of Enterprise Modeling, as there are many conceptually different aspects
of enterprises that need to be modeled (e.g., goals, processes, rules). These are often
captured in specialized (domain-specific) languages, which reflect the different conceptual
landscapes of each aspect, and should thus be a good source of finding different kinds of
accommodated conceptual distinctions. To do so we will provide an initial (likely non-
exhaustive) overview of different aspects of enterprises that are explicitly modeled today,
and show to what degree relevant conceptual distinctions can be explicitly modeled in the
languages and methods used for them.
The rest of this paper is structured as follows. In Section 2 we introduce the different as-
19

pects and modeling languages we selected for our investigation. In Section 3 we introduce
the conceptual distinctions and analyze to what degree they are supported by the selected
languages. We discuss our findings and the consequences for modeling (languages) in
Section 4, and conclude with needed future work in Section 5.
2 Aspects of enterprises and associated languages
Enterprises are large socio-technical systems encompassing many aspects (e.g., business
processes, value exchanges, capabilities, IT artifacts, motivations, goals), which them-
selves are often the domain of specialized (groups of) people. As these models are pro-
duced by different people, often using different languages, integration is a vital step in
order to have a coherent picture of the enterprise [Lan04, KBJK03, DDB05]. Ensuring
that different conceptual distinctions are modeled explicitly is thus especially important
in this context, as much information can be lost in this integration step, leading to enter-
prise models that are no longer correct or complete in regards to the semantics intended
to be expressed (and possibly only done so implicitly) in the models made of each of the
distinct aspects. Traditionally processes and goals received a lot of attention in terms of
explicit models and dedicated modeling languages and frameworks, while recently more
and more aspects are being considered equally as important to deal with. Other aspects
such as motivations and goals, value exchanges, deployment and decision making now
have dedicated, often formally specified, modeling languages available. This increases
the amount of languages (ideally) capable of explicitly supporting conceptual distinctions
important to the individual aspects that are in use, but perhaps at the cost of fragmenting
the modeling landscape itself. Table 1 gives a brief overview of some current languages
and the aspects they are, or can be used for.
This increased amount of focus on specific aspects has thus, amongst other factors, led
to a plethora of modeling languages, methods and frameworks. Some were proposed or
designed solely by academia, some invented in industry, most of them having different fo-
cus and purpose. Some aspects have a large amount of dedicated languages differing only
slightly in their actual notation or specification (e.g., as evidenced by the large amount
of overlap between the notations used in goal modeling such as i*, GRL, KAOS, TRO-
POS, etc.). In order to have an overview of modeling languages from a wide array of
subjects, we selected a number of languages, both languages proposed in academia, and
languages widely used in industry for the different aspects listed in Table 1. We chose
these specific languages in order to have a diverse amount of of languages and notations,
while not necessarily ensuring an exhaustive list of all aspects or methods and languages.
Instead, our focus was on ensuring we included languages covering as many aspects as
possible, so as to be able to investigate potential issues with the accommodation of con-
ceptual distinctions as broadly as possible. Modeling languages that are typically used for
general purpose modeling such as UML, ER and ORM were not included as these lan-
guages themselves do not (and by design perhaps should not) contain specialized semantic
constructs for domain concepts (e.g., goal, process). A part of the selection for Table 1
was based on the languages integrated into the Unified Enterprise Modeling Language
20

Table 1: A cross-section of aspects of modern enterprises, and some modeling languages used, orusable to represent them.
Aspect of an Enterprise Related languages
Architecture ArchiMate [The12] (1.0, 2.0), ISO/DIS 19440, ARIS
(Business) Processes BPMN [Obj10b], (colored) Petri nets, IDEF3,
EPC [vdA99]
Design decision-making EA Anamnesis [PdKP12], NID [GP03], OMG DMN
(proposed, seemingly unfinished)
Deployment of IT artifacts ADeL [Pat10]
Goals & Motivations i*, GRL, KAOS [DvLF93], TROPOS [GMP03],
AMORE [QEJVS09], ArchiMate [The12] 2.0’s motiva-
tional extension, OMG BMM [Obj10a]
Management of IT artifacts ITML [FHK+09]
Strategy & Capability Maps TBIM [FDM13], OMG BMM [Obj10a], Capability
Maps [Sco09]
Value exchanges e3Value [GA03], REA-DSL [SHH+11], VDML (under
development)
(UEML) [ABH+10], which incorporates ARIS, BMM, BPMN, colored petri nets, GRL,
IDEF3, ISO/DIS 19440, KAOS, and some diagram types from UML.
3 Conceptual distinctions for aspects & languages
The different aspects that are focused on in enterprise modeling, typically have a number
of (not necessarily overlapping) specific conceptual distinctions, which are important to
be aware of. For example, a motivational model describing the things to be achieved
by an enterprise and the reasons for wanting to achieve them is likely to require more
detail (and thus fine-grained conceptual distinctions) for what goals are than, say, a model
describing the related process structure. Such distinctions can be for instance whether
goals absolutely have to be achieved, whether the ‘victory’ conditions for achieving it are
known, whether the goal itself is a physical thing to be attained or not, and so on. On
the other hand, a model describing the process undertaken to achieve a certain goal (e.g.,
bake a pizza) might require conceptual distinctions like whether the actors involved are
human entities or not, whether it is one or more actors responsible for ensuring the goal’s
satisfaction, and so on. Thus, not all conceptual distinctions that are relevant to one aspect
(and the modeling language used for them) will be as relevant (and necessary to model
explicitly) for other aspects.
In order to systematically talk about whether the selected modeling languages accom-
modate different conceptual distinctions we need both a set of common modeling con-
cepts and a set of distinctions to analyze. We base ourselves on an analysis of mod-
21

eling languages and methods commonly used in (enterprise) modeling as reported on
in [vdLHLP11], which resulted in a set of concepts common to most modeling languages,
and a set of conceptual dimensions which were often found to distinguish between spe-
cific interpretations. From this we take a set of common concepts shared between most
languages: ACTORS, EVENTS, GOALS, PROCESSES, RESOURCES, RESTRICTIONS and
RESULTS. For each of these concepts we look at whether one of the following conceptual
distinctions is relevant for that concept, namely whether something is considered to: natu-
rally occur (natural), be human (human), be a single thing or composed of multiple (com-
posed), be intentional or unintentional (intentional), be a logical necessity (necessary),
be physically existing (material), and whether something is well specified (specific). The
result of this step was the basis for Table 2. We started with a full list including each pos-
sible conceptual distinction for each concept, resulting in many different possible points
of analysis. We then went through all the concepts and removed the distinctions that we
deemed less relevant or interesting (e.g., whether a process is human, whether a result is
intentional, and so on), ending up with a list table in which each concept has a number of
potentially relevant distinctions. We then show for each concept-distinction combination
why it can be useful to be aware of this distinction, and what modeling language supports
doing so.
Table 2: This table gives an overview of a number of relevant conceptual distinctions for common modeling. For
each of the concepts, we list relevant conceptual distinctions, show what they are useful for, and what languages
support modeling them explicitly, might support it, or (where relevant) make a specific implicit interpretation.
Dimension Useful to . . . Supported by . . .
ACTOR
human Distinguish between actors that can be
more fickle than pure rational agents.
BPMN through the explicit use of a ‘Human Per-
former’ resource type, VDML does contain a ‘Per-
son’ subtype of Actor which is specified to be hu-
man, but does not distinguish in the visual notation
between types of Actors.
composed Distinguish whether an actual entity acts
or whether a group of them does, which
impacts responsibility judgments for ac-
tions
ArchiMate, TROPOS via ‘composite Actor’, some-
what as well with differentiation between ‘role’ and
‘position’, e3Value somewhat through differentiation
between actor and market segments, VDML distin-
guishes between an ‘actor’ being a singular partici-
pant, and modeling ‘collaboration’ or ‘participant’ as
potentially multiples.
material Know whether an actor physically inter-
acts with the world (and can thus be af-
fected by it directly – think hardware vs.
software)
i* assumes that an agent is an actor “with a concrete
physical manifestation” (iStar Wiki)
intentional Know whether an actor is considered an
explicit part of a system, i.e., is expected
to act or not on certain things, in contrast
to actors from outside the systems scope
which may act but were not regarded or
thought of to do so
Implicit in most languages, mentioned as such in
TBIM, depending on interpretation could be argued
to be explicit in OMG BMM with differentiation be-
tween internal and external influencer.
specific Knowing whether an actor is a specific
thing (i.e., an instantiation) or a general
thing (i.e., a role)
Supported by some (e.g., ArchiMate), through
type/instantiation dichotomy, explicit in TBIM by the
claim that an agent “represents a concrete organiza-
tion or person” ArchiMate, implicit in e.g., e3Value
and RBAC by automatic use of roles (types).
22
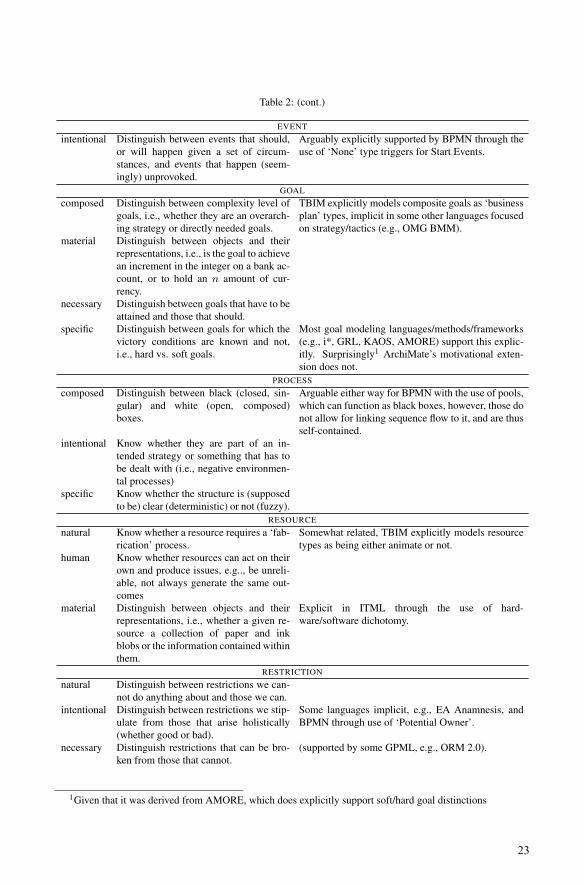
Table 2: (cont.)
EVENT
intentional Distinguish between events that should,
or will happen given a set of circum-
stances, and events that happen (seem-
ingly) unprovoked.
Arguably explicitly supported by BPMN through the
use of ‘None’ type triggers for Start Events.
GOAL
composed Distinguish between complexity level of
goals, i.e., whether they are an overarch-
ing strategy or directly needed goals.
TBIM explicitly models composite goals as ‘business
plan’ types, implicit in some other languages focused
on strategy/tactics (e.g., OMG BMM).
material Distinguish between objects and their
representations, i.e., is the goal to achieve
an increment in the integer on a bank ac-
count, or to hold an n amount of cur-
rency.
necessary Distinguish between goals that have to be
attained and those that should.
specific Distinguish between goals for which the
victory conditions are known and not,
i.e., hard vs. soft goals.
Most goal modeling languages/methods/frameworks
(e.g., i*, GRL, KAOS, AMORE) support this explic-
itly. Surprisingly1 ArchiMate’s motivational exten-
sion does not.
PROCESS
composed Distinguish between black (closed, sin-
gular) and white (open, composed)
boxes.
Arguable either way for BPMN with the use of pools,
which can function as black boxes, however, those do
not allow for linking sequence flow to it, and are thus
self-contained.
intentional Know whether they are part of an in-
tended strategy or something that has to
be dealt with (i.e., negative environmen-
tal processes)
specific Know whether the structure is (supposed
to be) clear (deterministic) or not (fuzzy).
RESOURCE
natural Know whether a resource requires a ‘fab-
rication’ process.
Somewhat related, TBIM explicitly models resource
types as being either animate or not.
human Know whether resources can act on their
own and produce issues, e.g.., be unreli-
able, not always generate the same out-
comes
material Distinguish between objects and their
representations, i.e., whether a given re-
source a collection of paper and ink
blobs or the information contained within
them.
Explicit in ITML through the use of hard-
ware/software dichotomy.
RESTRICTION
natural Distinguish between restrictions we can-
not do anything about and those we can.
intentional Distinguish between restrictions we stip-
ulate from those that arise holistically
(whether good or bad).
Some languages implicit, e.g., EA Anamnesis, and
BPMN through use of ‘Potential Owner’.
necessary Distinguish restrictions that can be bro-
ken from those that cannot.
(supported by some GPML, e.g., ORM 2.0).
1Given that it was derived from AMORE, which does explicitly support soft/hard goal distinctions
23

Table 2: (cont.)
specific Distinguish restrictions for which we
know when they are broken and not.
RESULT
natural Know whether a result requires some
kind of ‘fabrication’ process
material Distinguish between an object and its
representation, i.e. whether the physical
pizza or the status update in the IS saying
a pizza was baked is the result of a given
step in the pizza making process.
specific Know whether a result is (supposed to
be) clear (deterministic) or not (fuzzy).
Arguably supported in BPMN through the use of
‘None’ type End Events.
4 Discussion
Around half of the conceptual distinctions we analyzed were explicitly supported by at
least one modeling language, with some cases being arguable either way. Languages used
for specific aspects do seem to explicitly accommodate some basic (and often widely ac-
cepted) necessary conceptual distinctions. For example, the de facto used language for
process modeling, BPMN, has explicit support for differentiating between human and
non-human actors, which can be important to know for critical steps in a process. Most
modeling languages used for motivations and goals also accommodate the distinction be-
tween goals with well-specified victory conditions and those with vague or unknown con-
ditions by means of separate hard and soft-goal elements. These explicit distinctions in
the notation are likely correlated with the conceptual distinctions being widely accepted
as important and having become part of the basic way of thinking. However, taken over-
all, there does not seem to be a consistent or systematic pattern behind what language
explicitly accommodates (or lacks) which conceptual distinctions.
As such, there are a number of conceptual distinctions for which we found no explicit sup-
port by any modeling languages. For example, we found no support for explicitly model-
ing goals and results as being material things. It also did not seem possible to explicitly
model goals as being a logical necessity in the investigated languages. The distinction
whether results were things that naturally occurred or fabricated was also not supported.
When it comes to processes we found no support to model them explicitly as being in-
tentional, and distinguishing between specific (i.e., well-defined) processes and processes
more fuzzy in their structure. Modeling resources as being humans was also not supported,
while this is likely not an unthinkable interpretation – effective management of ‘human re-
sources’ being important for large enterprises. Finally, we found no explicit support for
modeling restrictions as naturally occurring and specific things. We will discuss some of
these distinctions in more detail.
24
4.1 Some unaccommodated conceptual distinctions
Surprisingly, we found no explicit support for differentiating between goals with vary-
ing levels of necessity and obligation. While many common methodologies (e.g., the
MoSCoW technique [CB94] of dividing requirements into must, should could, and would
haves) call for such distinctions, many modeling languages conflate them all into a single
kind of goal. Arguably in certain aspects it would make sense to make an implicit choice,
as in e.g., process modeling it is necessary for certain steps in a flow to be reached before
the flow continues, which can be seen as an analog to logically necessary goals. However,
goal models in dedicated languages seem not to make this distinction, even though there is
a strong focus on differentiating between hard and soft-goals, which seem correlated with
different levels of necessity (e.g., one cannot as certainly rely on a soft-goal to be achieved
compared to a hard-goal, especially for mission critical goals).
Another seemingly unaccommodated distinction is the necessity of restrictions, that is,
whether some restriction (e.g., a rule, principle, guideline) is an alethic condition that can-
not be broken or whether it is not and thus can be broken. While in the context of enterprise
modeling there is a strong differentiation of terminology used for different kinds of nor-
mative restrictions that can be considered breakable, or at least not strictly enforceable
(e.g., principles, guidelines, best practice), these often seem to be used outside of mod-
eling languages in their own approaches – e.g., architecture principles [PG10]. It seems
problematic that many languages used for aspects of enterprises, and languages used to
describe the actual enterprise architecture like ArchiMate do not have explicit notational
support for these different kinds of restrictions. Many models that are analyzed a pos-
teriori (e.g., when they are integrated in other models, and the original modelers are no
longer involved or available) then become difficult to interpret, as the notation of different
kinds of restrictions can be ambiguous and lead to situations where it is not clear whether
a restriction can be relaxed or not. Surprisingly the only language that seems to support
this conceptual distinction is ORM (in particular version 2), which supports the explicit
modeling of restrictions as being either alethic or deontic conditions through its visual
notation.
Another conceptual distinction that is typically not accommodated by most languages is
whether something is material or not. In particular, the material status of resources is
often defined in a conceptually ambiguous way. For example, in TROPOS, resources are
stated to be “physical or informational entities”, which makes it difficult to know whether
a modeled resource is the actual ‘object’ (e.g., some information) or its representation
(e.g., a collection of paper and ink blobs that represents that information). It is important
to be aware of this distinction as this has consequences for the way in which the resource
can be interacted with, and in what way it can be manipulated, and possibly consumed.
For example, if we have a process in which a human actor performs a certain task for
which they need clear instructions, we can see those instructions as being a vital resource.
Modeling them as the physical representation – a paper printout of the instructions – means
that this specific resource is only available to one actor. On the other hand, if we model
it as the actual informational object, it is available to more than just one actor at a time.
Furthermore, when a resource is material, it also has the possibility of being consumed.
25

For example, when we model the process of baking a pizza, some of the resources involved
(i.e., the ingredients) are consumed. It is important to be aware of this, as that means it is
necessary to keep track of stock levels, and perhaps optimization thereof via e.g., system
dynamics models.
Finally, a conceptual distinction that is not explicitly accommodated by many languages
is whether an actor is a human being or not. BPMN was the only language we analyzed
which explicitly supports it by having a notional element ‘Human Performer’ which is
only used for human actors (albeit called a resource in the BPMN jargon). It is important
to be aware of this, especially when responsibility comes into play, which is for instance
done in KAOS models, by making some agent responsible for some goals. However, the
actual responsibility for any given thing cannot, from a legal and social perspective be
placed on a non-human entity. At the end of the day (or chain of responsibility), there
is always a person held responsible (and accountable) for some given action. In the case
of software engineering, for example a programmer is held responsible for the downtime
caused by bugs, in the case of a building collapsing after a summer breeze the architect
is held responsible for not properly analyzing the environment and soil conditions, and so
on. When responsibility is modeled, it thus seems prudent to know whether an actor is the
actual responsible party or whether it defers its responsibilities to a different, human entity.
Another important aspect of human beings is that they are not necessarily rational and
reliable. Thus, when a given task or process depends on a specific human actor, it is quite
possible that the process is not performed as well as needed, or at all. As such, knowing
that a process involves human actors, a certain level of fault tolerance and redundancy
would be needed. Conflating human actors with non-human actors makes it far more
difficult to know where this is necessary, and could thus lead to models (and predictions
made with them, e.g., efficiency or execution time of a process) not holding true to the real
world situation.
4.2 Consequences
The overall lack of explicitly accommodated conceptual distinctions (of which there might
be more than just those we discussed) in many modeling languages are especially relevant
for enterprise modeling. It makes it much more difficult to ensure that integrated models
are valid (or complete) representations of the semantics intended by the original modelers,
as sometimes these modelers simply lack the notational elements to express important se-
mantics. While it is possible to ‘simply’ denote this information by annotating the models
with extra text, it would be a more ideal solution if modeling languages supported these
distinctions. Furthermore, while some languages do offer explicit notational support, their
specification or meta-model does not necessarily enforce correct use of these elements
(e.g., ArchiMate does not enforce correct distinction between composite and singular ac-
tors). There are many languages we analyzed which have an implicit interpretation of some
of the conceptual distinctions, sometimes specific (e.g., i*’s handling of agents as having a
concrete physical manifestation) sometimes vague (e.g., TROPOS’ handling of resources),
which further complicates matters, as this interpretation of the language might not be the
26
interpretation a modeler wishes to take for a given context. The fact that some languages
have semantics which are considered to remain vague (e.g., GRL [HSD06], i* [LFM11])
only adds to this. Most languages seem to have a well-defined and formalized semantics
of the syntax, while lacking much, if any, formalization of the semantics of the elements
of meaning themselves (e.g., EPC [Kin04]).
Thus, it seems necessary to stimulate a move towards more explicit focus on (formaliza-
tion of) the semantics of the elements of meaning of modeling languages. The lack of
coverage for some of the distinctions shown in Table 2 makes it clear that more work is
needed on extending the specification of relevant languages with the ability to explicitly
distinguish between these different conceptual understandings. This could, and perhaps
should, be done in accordance with the actual practitioners in the field, by investigating
what conceptual distinctions are important for them, and what they need to be able to ex-
plicitly model, instead of solely relying on analyzing languages with pre-existing reference
material like Bunge-Wand-Weber or UFO. It is important to not do this just once, but keep
up to date with the changing conceptual distinctions that the practitioners and stakeholders
have in order for our modeling languages to stay relevant and capable of representing to
the real world. Given the existence of a large number of different dialects of modeling
languages sometimes only differing slightly (e.g., i*, GRL, TROPOS for goal modeling),
it seems that supporting many different conceptual distinctions in a single notation would
be welcomed by many.
4.3 Needed next steps
One of the more important things that has to be done in order to deal with the issue of
lacking conceptual distinctions in modeling languages, from a research point of view, is to
ensure a detailed insight into what distinctions are conceptually relevant and important to
actual users of modeling languages (i.e., modelers) and a created model’s end-users (i.e.,
stakeholders). This might seem to be in contrast to what would intuitively be important
to find out: whether particular modeling languages accommodate enough conceptual dis-
tinctions. However, until we become aware of what is actually important to accommodate,
it would not make sense to analyze and criticize a modeling language’s quality in this re-
gard. Thus, we should focus on doing empirical work based on finding out what entities
(and with which properties they manifest) are vital to modelers and stakeholders for the
typical domains they model, and in doing so determine what the conceptual needs are for
domain-specific languages for particular domains (e.g., that goal modeling languages need
to at least explicitly distinguish between hard and soft goals, goals that have to be achieved
versus goals that ought to be achieved, and so on).
Much existing work, both research, and methods actually used to improve the conceptual
landscape of modeling languages lack this particular personal aspect – they tend to focus
on postulating a priori or analyzing only language specifications. While the (cognitive)
mapping approach that many of these frameworks (e.g., Bunge-Wand-Weber or UFO) use
in their analysis of the ontological completeness of a modeling language, they do so on
basis of data that is in itself not directly based on the actual people involved in the model-
27
ing process. The mapping approach (e.g., ensuring that each conceptually distinct element
is represented by a distinct element in the language) itself is the correct way to do this,
but the data for the conceptual elements needs to be tailored to the specific people from
the domain. This means that if we wish to analyze whether a goal modeling language is
conceptually or ontologically complete that we need to figure out which things are impor-
tant for the modelers and stakeholders to represent, and only then continue to the mapping
approach and determine whether the language does that correctly and completely. This
is important for a number of points. Firstly, many of the ontologies used for such map-
ping exercises are either solely or predominantly upper ontologies (i.e., the more abstract
conceptual elements and properties), which makes them less suited to speak about the con-
ceptual completeness of a domain-specific language, as with such a language one should
expect more lower ontology level conceptual elements to appear in the language. Where
such lower ontologies exist for particular domains, they can of course be used if found
to be an up-to-date representation of the conceptual needs of users in that domain. Fur-
thermore, many other mapping approaches (or integration efforts such as UEML) rely on
analyzing existing text corpuses or language specifications. As such specifications are not
necessarily a correct or complete representation of how the language is actually used or
abused, one cannot safely say that all the conceptual needs of a particular domain’s users
can always be found in the specification of the modeling languages they use.
Finally, it is important to be aware of the constantly changing conceptual landscapes that
modelers and stakeholders operate in. While a particular ontology might practically be
static (not being significantly updated in years), the concepts that become important to
modelers and stakeholders can appear and change much more quickly. For this reason
alone we should focus our efforts on a repeating empirical effort to elicit such conceptual
needs through research efforts. It is also important to keep in mind that in doing this, we
should not try to solve fundamental issues to do with the conceptualizations and repre-
sentations people have (e.g., is information actually a non-physical entity?), but ‘merely’
elicit represent them as accurately as we can.
This can be done by working with, and investigating the conceptual understanding of mod-
elers and stakeholders through experiments and observations adopting proven and well-
used protocols from cognitive science and (psycho)linguistics. While there are many dis-
cussions on the degree of conceptual information that we can discover through the use of
words as stimuli (see e.g., [MAG+11]), it is commonly accepted that finding the edges be-
tween concepts (i.e., where concepts would be considered distinct) can be done. Examples
of such experiments that can be done are for example categorization studies and feature
elicitation experiments (e.g., [BC87, Est03]). Categorization studies can reveal in detail
both the structure and typicality of particular concepts and to what degree certain elements
are considered members. For example, the answer to the question whether a human be-
ing is an actor gives us information whether it is considered an actor, but also whether
that judgment was made discretely (it being absolutely or absolutely not a member of the
category actor), or whether it was made in a graded fashion (a human being being some-
what of an actor). Especially in this later case eliciting the features people associate with
such concepts becomes interesting, as we can determine what the typical interpretation
for the concept is, what interpretations are also commonly used and accepted, and which
28
interpretations are only considered poor examples.
For example, when it comes to the concept actor we might find that there are many graded
judgments in an initial categorization experiment (i.e., many terms are considered only
actors to a certain degree). If we then use a large group of modelers to elicit features we
might find such things like “is human”, “is autonomous”, “part of a group”, “responsible
for its actions”, and so on. Investigating afterwards how typical, or common each of these
features are for the concept can give us a ranking for (sets of) features, which will show us
the most common (and conceptually distinct) interpretations. We might for instance find
that the two most occurring sets of features are that an actor is “an autonomous human
being responsible for its own actions”, and that it is “an physical machine making deci-
sions”. Based on that empirical data we can then deduce at least that modeling languages
involving actors should explicitly distinguish between human and non-human actors.
We are currently in the stage of performing a large-scale study employing these methods
(some preliminary results having been published in [vdL13]) in which we aim to figure out
the feature structure of the common modeling concepts used in Table 2. After this step we
will investigate the typicality of all these possible features. In doing so, we will produce
both an overview of all (conceptually relevant) features that modelers and stakeholders
might need in order to represent their domains correctly, and more importantly: an analysis
of how typical or common (and thus important) such features are to the concepts. With
such data gathered, a ranking list of what kind of conceptual distinctions must, should and
ideally would be supported by a modeling language can then be systematically produced.
Performing such work for different specialized groups (e.g., business process modelers,
goal modelers) and repeating it on regular intervals should lead to a situation where we
do not only have useful methods to ensure that a modeling language is conceptually and
ontologically complete, but that they can be based on tried and proven relevant personal
insights as well.
5 Conclusion and future work
We have discussed the importance of explicitly modeling conceptual distinctions and an-
alyzed a number of modeling languages to investigate what kind of distinctions they sup-
port. We showed that, while some conceptual distinctions are explicitly supported by
relevant modeling languages, there are still a large amount of potentially relevant distinc-
tions that are not accommodated, or implicitly interpreted in a specific way by modeling
languages. We proposed that research on active practitioners should be done regularly to
keep up to date with conceptual distinctions deemed relevant and important by modelers
and stakeholders alike. Our future work will involve a broader empirical investigation into
which conceptual distinctions are deemed important by practitioners. Based on these latter
insights, we would then be in a position to develop/select better strategies to deal with the
challenges of conceptual distinctions.
29

Acknowledgements.
This work has been partially sponsored by the Fonds National de la Recherche Luxem-
bourg (www.fnr.lu), via the PEARL programme.
References
[ABH+10] Victor Anaya, Giuseppe Berio, Mounira Harzallah, Patrick Heymans, RaimundasMatulevicius, Andreas L. Opdahl, Hervı Panetto, and Maria Jose Verdecho. The Uni-fied Enterprise Modelling Language–Overview and further work. Computers in In-dustry, 61(2):99 – 111, 2010. Integration and Information in Networked Enterprises.
[BC87] RobinA. Barr and LeslieJ. Caplan. Category representations and their implications forcategory structure. Memory & Cognition, 15(5):397–418, 1987.
[BJWW09] Andrew Burton-Jones, Yair Wand, and Ron Weber. Guidelines for empirical evalua-tions of conceptual modeling grammars. Journal of the Association for InformationSystems, 10(6), 2009.
[CB94] Dai Clegg and Richard Barker. Case method fast-track: a RAD approach. Addison-Wesley Longman Publishing Co., Inc., 1994.
[DDB05] Dursun Delen, Nikunj P. Dalal, and Perakath C. Benjamin. Integrated modeling:the key to holistic understanding of the enterprise. Communications of the ACM,48(4):107–112, 2005.
[DvLF93] Anne Dardenne, Axel van Lamsweerde, and Stephen Fickas. Goal-directed require-ments acquisition. Sci. Comput. Program., 20:3–50, April 1993.
[Est03] Z. Estes. Domain differences in the structure of artifactual and natural categories.Memory & cognition, 31(2):199–214, 2003.
[FDM13] Fabiano Francesconi, Fabiano Dalpiaz, and John Mylopoulos. TBIM: A Languagefor Modeling and Reasoning about Business Plans. Technical Report DISI-13-020,University of Trento. Department of Information Engineering and Computer Science,May 2013.
[FHK+09] Ulrich Frank, David Heise, Heiko Kattenstroth, Donald Ferguson, Ethan Hadar, andMarvin Waschke. ITML: A Domain-Specific Modeling Language for SupportingBusiness Driven IT Management. In Proc. of the 9th OOPSLA workshop on DSM,2009.
[FL03] Peter Fettke and Peter Loos. Ontological Evaluation of Reference Models Using theBunge-Wand-Weber Models. In AMCIS, volume 384, pages 2944–2955, 2003.
[GA03] Jaap Gordijn and JM Akkermans. Value-based requirements engineering: Exploringinnovative e-commerce ideas. Requirements engineering, 8(2):114–134, 2003.
[GAH11] Nicolas Genon, Daniel Amyot, and Patrick Heymans. Analysing the Cognitive Effec-tiveness of the UCM Visual Notation. In Frank Alexander Kraemer and Peter Her-rmann, editors, System Analysis and Modeling: About Models, volume 6598 of Lec-ture Notes in Computer Science, pages 221–240. Springer Berlin Heidelberg, 2011.
30

[GHA11] Nicolas Genon, Patrick Heymans, and Daniel Amyot. Analysing the Cognitive Ef-fectiveness of the BPMN 2.0 Visual Notation. In Brian Malloy, Steffen Staab, andMark Brand, editors, Software Language Engineering, volume 6563 of Lecture Notesin Computer Science, pages 377–396. Springer Berlin Heidelberg, 2011.
[GHW03] Giancarlo Guizzardi, Heinrich Herre, and Gerd Wagner. On the General OntologicalFoundations of Conceptual Modeling. In Stefano Spaccapietra, SalvatoreT. March,and Yahiko Kambayashi, editors, Conceptual Modeling (ER) 2002, volume 2503 ofLecture Notes in Computer Science, pages 65–78. Springer Berlin Heidelberg, 2003.
[GHYA07] Gemma Grau, Jennifer Horkoff, Eric Yu, and Samer Abdulhadi. i* Guide 3.0. Internet,August 2007.
[GMP03] Fausto Giunchiglia, John Mylopoulos, and Anna Perini. The tropos software devel-opment methodology: processes, models and diagrams. In Agent-Oriented SoftwareEngineering III, pages 162–173. Springer, 2003.
[GP03] Ya’akov Gal and Avi Pfeffer. A language for modeling agents’ decision making pro-cesses in games. In IFAAMAS’03, pages 265–272. ACM, 2003.
[GW04] Andrew Gemino and Yair Wand. A framework for empirical evaluation of conceptualmodeling techniques. Requirements Engineering, 9(4):248–260, 2004.
[GW10] Giancarlo Guizzardi and Gerd Wagner. Using the Unified Foundational Ontology(UFO) as a Foundation for General Conceptual Modeling Languages. In Theory andApplications of Ontology: Computer Applications, pages 175–196. Springer, 2010.
[HSD06] Patrick Heymans, Germain Saval, and Gautier Dallons. A template-based analysis ofGRL. Advanced Topics in Database Research, Volume V, 5:124, 2006.
[KBJK03] Harald Kuehn, Franz Bayer, Stefan Junginger, and Dimitris Karagiannis. EnterpriseModel Integration. In E-Commerce and Web Technologies, volume 2738 of LectureNotes in Computer Science, pages 379–392. Springer Berlin / Heidelberg, 2003.
[Kin04] Ekkart Kindler. On the semantics of EPCs: A framework for resolving the viciouscircle. In Business Process Management, pages 82–97. Springer, 2004.
[Lan04] Marc M. Lankhorst. Enterprise architecture modelling–the issue of integration. Ad-vanced Engineering Informatics, 18(4):205 – 216, 2004.
[LFM11] Lidia Lopez, Xavier Franch, and Jordi Marco. Making explicit some implicit i* lan-guage decisions. In Conceptual Modeling–ER 2011, pages 62–77. Springer, 2011.
[MAG+11] Barbara C. Malt, Eef Ameel, Silvia Gennari, Mutsumi Imai, and Asifa Majid. Dowords reveal concepts? In Proceedings of the 33rd Annual Conference of the Cogni-tive Science Society, pages 519–524, 2011.
[MH09] D. Moody and J.V. Hillegersberg. Evaluating the visual syntax of UML: An analysis ofthe cognitive effectiveness of the UML family of diagrams. Lecture Notes in ComputerScience, 5452:16–34, 2009.
[MHM10] D.L. Moody, P. Heymans, and R. Matuleviaius. Visual syntax does matter: Improv-ing the cognitive effectiveness of the i* visual notation. Requirements Engineering,15(2):141–175, 2010.
[Moo05] D.L. Moody. Theoretical and practical issues in evaluating the quality of concep-tual models: current state and future directions. Data & Knowledge Engineering,55(3):243–276, 2005.
31
[Moo09] Daniel L. Moody. The Physics of Notations: Toward a Scientific Basis for Con-structing Visual Notations in Software Engineering. IEEE Transactions on SoftwareEngineering, 35:756–779, 2009.
[Obj10a] Object Management Group. Business Motivation Model (BMM), Version 1.1. Inter-net, 2010.
[Obj10b] Object Management Group. Business Process Model and Notation (BPMN) FTF Beta1 for Version 2.0. Internet, 2010.
[Pat10] Susanne Patig. Modeling Deployment of Enterprise Applications. In Proc. CAISEForum, LNBIP 72, pages 253–256, 2010.
[PdKP12] G. Plataniotis, S. de Kinderen, and H.A. Proper. EA Anamnesis: Towards an approachfor Enterprise Architecture rationalization. In Sheridan Printing, editor, Proceedingsof the The 12th Workshop on Domain-Specific Modeling (DSM12). ACM DL, 2012.
[PG10] Erik Proper and Danny Greefhorst. The Roles of Principles in Enterprise Architecture.In Trends in Enterprise Architecture Research, volume 70 of LNBIP, pages 57–70.Springer, 2010.
[PS01] Anne Persson and Janis Stirna. Why Enterprise Modelling? An Explorative Study intoCurrent Practice. In Dittrich et al., editor, Advanced Information Systems Engineering,volume 2068 of LNCS, pages 465–468. Springer Berlin, 2001.
[QEJVS09] Dick Quartel, Wilco Engelsman, Henk Jonkers, and Marten Van Sinderen. A goal-oriented requirements modelling language for enterprise architecture. In EDOC’09,pages 3–13. IEEE, 2009.
[Sco09] J. Scott. Business Capability Maps – The missing link between business strategy andIT action. Architecture & Governance, 5(9):1–4, 2009.
[SHH+11] Christian Sonnenberg, Christian Huemer, Birgit Hofreiter, Dieter Mayrhofer, andAlessio Braccini. The rea-DSL: a domain specific modeling language for businessmodels. In CAiSE’11, pages 252–266. Springer, 2011.
[The12] The Open Group. ArchiMate 2.0 Specification. Van Haren Publishing, 2012.
[vdA99] Wil MP van der Aalst. Formalization and verification of event-driven process chains.Information and Software technology, 41(10):639–650, 1999.
[vdL13] Dirk van der Linden. Categorization of Modeling Language Concepts: Graded orDiscrete? In YanTang Demey and Herve Panetto, editors, On the Move to MeaningfulInternet Systems: OTM 2013 Workshops, volume 8186 of Lecture Notes in ComputerScience, pages 743–746. Springer Berlin Heidelberg, 2013.
[vdLHLP11] D. J. T. van der Linden, S. J. B. A. Hoppenbrouwers, A. Lartseva, and H. A. Proper.Towards an Investigation of the Conceptual Landscape of Enterprise Architecture. InT. Halpin et al., editor, Enterprise, Business-Process and Information Systems Model-ing, volume 81 of LNCS, pages 526–535. Springer Berlin Heidelberg, 2011.
[WK05] B. Wyssusek and H. Klaus. On the foundation of the ontological foundation of con-ceptual modeling grammars: the construction of the Bunge-Wand-Weber ontology. InJ. Castro and E. Teniente, editors, Proceedings of the CAiSE ’05 Workshops, volume 2,pages 583–593, 2005.
[WW90] Yair Wand and Ron Weber. Mario Bunge’s Ontology as a formal foundation for infor-mation systems concepts. Studies on Mario Bunge’s Treatise, Rodopi, Atlanta, pages123–149, 1990.
32
A theory of practice modelling - Elicitation of model
pragmatics in dependence to human actions
Sebastian Bittmann, Oliver Thomas
Information Management and Information Systems
University Osnabrueck
Katharinenstraße 3
49074 Osnabrueck
{sebastian.bittmann | oliver.thomas}@uni-osnabrueck.de
Der Geist der Forschers, der sich von der Erfahrung hat modellieren lassen, wird das
Spielfeld von geistigen Operationen, welche die Erfahrung in Modelle verwandeln und
andere geistige Operationen ermöglichen.
Umberto Eco
Abstract: Conceptual modelling is a constituting and popular theme in informationsystems research. With the proposal of different languages, concepts and methods,modelling has evolved to a sophisticated tool of systems design. With a focus on pro-viding concepts with more enriched semantics, even more specific approaches havebeen developed, such as business process modelling and enterprise modelling. Provid-ing a model often seems to be a means to an end, whether it is academic research orindustrial cases. However, if the reasons to construct a model goes beyond analyticalpurposes, then the respective model must serve a sense of pragmatism, respectivelyneeds to be utile with respect to the achievement of the different tasks an informationsystem has. Therefore, this paper aims at a more restrained definition of the generalmodelling term, while it is consentient to the constructivism of modelling. Thereby, amodel will be not seen as a solution, but a sophisticated manner to provide and evolveinformation. Having that in mind, such a conception of a model helps to purposefullycreate sophisticated and pragmatic models.
1 Introduction
Conceptual models offer a medium for communication that provides more semantics and
less ambiguity compared to natural language, without the restrictive nature of formal ap-
proaches. With the initial proposal by CHEN [Che76] that promoted data models as a
key-stone for systems development, more and more approaches were developed in order
to cover structure-, behaviour- and hierarchal-related issues of system, respectively infor-
mation systems [Rop78]. Promoting business process models, SCHEER [Sch00] focussed
on the integration between information about system structure, system hierarchy and sys-
tem behaviour. Focussing on business processes was motivated by the work of [HC06] as
33

Syntax
Semantics
PragmaticsWhatis?
Andwh
atdoes
itmean?
(Analytica
land
/orExplanativeTheorie
)
Figure 1: Procedural scope shift regarding the purpose of model creation
well as [DS90] that promoted the need for creating specifications of business processes for
a strategic advantage in enterprises. According to YU, such behaviour has one key driver
and these are goals of the respective executing actor [Yu99].
What can be identified from history is that generally a shift of concepts can be identi-
fied, which are either concentrated, mainly due to limitations of insights, to descriptions
of a structure, a behaviour or a hierarchy [Rop78]. Hence, there seems to be a shift in
required information, respectively required concepts for creating a sophisticated or per-
ceived as complete model. In accordance to that new modelling trends are initiated by
the introduction of new concepts that are initially defined by a rigid defined syntax and
successfully defined semantics. However, with such an entanglement to the field of semi-
otics, which is rather an analytical field [Eco86], the creation of a model out-focusses the
primarily needed relevance, to an outpaced conception of analytical pragmatism. Instead
of identifying pragmatics based on the defined syntax and semantics, initially for a rele-
vant model, pragmatics should focus on establishing required structures with respect to the
required task-completion of the information system, which can then be found in language.
Hence, in order to provide a sophisticated manner for enabling an interpreter for executing
meaningful actions, the initial required pragmatics are needed to be identified at first, as
depicted by the Figure 1.
Therefore this paper is considered with identifying the general nature of a model and
by doing so it tries to identify the previously identified shifts. The main contribution of
this paper is thereby the identification of the most important factor for creating a model,
which is the actual recipient. In accordance, the identification of the recipients’ needs
for a specific model decides about the models correctness, consistency, completeness and
comprehensibility [MDN09].
34

2 Research method
The particular scope of this paper surrounds the examination about the usage of a model
that goes beyond communicative reasons. Therewith, in particular the relation between
a model and a respective theory will be examined. With respect to the previous stated
idea of defining pragmatism as a basis for the creation of needed structures for a required
task-completion, the following defined research question aims to identify a relation to
characteristics of an information system for this definition. Respectively, it is assumed that
a model has a reciprocal relation to the general conception of a theory building process
[MS95], as it may be both, the result of and expedient to building processes. As these
theory building processes are performed by those that are at least temporarily part of an
information system, the following research question was defined to point the dependency
of modelling to theory building processes.
What is the proper modelling of an information system, if an information system is
conceived as a social system that is primarily constituted by its respective comprised
individuals?
ProblemDefinition
ResearchQuestion
ContextExamination
Character-istics ofModels
The TheoryBuildingProcess
Suggestionof an
Interrelation
Evaluation
Figure 2: Conceptualisation of the utilised research process
In order to examine the presented research thoroughly, the research process was imposed
as follows. Initially, the problem definition served as a basis for defining the research
question. Based from that research question, the respective context was examined, which
is mainly surrounded by two topics. Firstly, the theory building process was examined
with the focus on qualitative information that enables respective individuals to act prop-
erly in their surrounding information system. Secondly, characteristics of a model were
examined. The proposition of information was examined through the usage of a model
and modelling languages. As a result from both examinations, an interrelation will be
suggested that defines the usage of a model for proper theory building. With respect to
35

that it was identified that a model may be used as impetus for proper theory building, as
it may contain information that can’t be experienced within the information system. As
a theory is rather something intangible [GH13], the means for measuring a proper theory
building may be the possession of knowledge that enables the performance of meaningful
actions. Respectively these meaningful actions contribute to the achievement of the task
targeted by the information system. In order to finally evaluate the developed theory of
practice modelling, an argumentative approach was chosen [Fra06], combined with predi-
cate logic and natural deduction. In doing so, we can at least show that the given argument
is logically valid based on the given assumptions. Therewith, all the made assumptions are
explicated within this paper that finally lead to the following conclusion.
∀m, ∃i, h, a : Derivablehma ∧ Pragmaticia → Pragmaticim (1)
The given conclusion states that only a model (m) is pragmatic, if it is is possible to derive
actions (a) from that model, at least by one individual (h), that are pragmatic by means of
the achievement of the respective tasks within the information system (i). The proof will
be given in the latter of this paper. The research process is given by Figure 2. However,
with respect to the initial stated research questions, within this presented research it will
be proven that modelling generally depends on the recipient’s habitus, respectively the
actions, which the individual is capable of performing.
3 A humanistic purpose of models
3.1 A glance on the structure of action within information systems
Research artefacts are generally divided by four different classes; the method, the con-
struct, the model and the instantiation [MS95]. Since that, the importance of models
for research has been identified [HMPR04] as a model may state the structure of real-
ity and further, because a model, instead of a theory, may become completely materialised
[GH13].
Particularly the description of a model is measured theoretically by three different magni-
tudes; the syntax, the semantics and the pragmatism. Whilst clear definitions are available
for checking syntactical correctness, e.g. through meta-models or formal definitions, se-
mantics that go beyond formal or operative semantics have to be validated by the respective
recipients [LSS94]. Therewith, if a mapping between the modelled statement and the im-
plied action is not explicitly possible [CEK02], verification is not sufficient for proving
correctness. Additionally, pragmatics is given at most, if formal semantics are given and
the recipient is a machine-driven recipient [Sel03].
The materialisation by a model happens through the use of language, respectively with the
expression of a human that has formed certain ascertainment based on a theory building
process and tries to express these by means of language. So, the respective materialisation
of one’s statements are driven by the syntax of a language, respectively the concepts the
36

language offers and its interrelations, as well as the language’s semantics. Whereby, the
pragmatics of a language may be driven by the respective intentions, how the language
serves the individual to express itself [LSS94]. Hence, pragmatics of a language, are
external to it.
Therewith, several approaches have been identified for judging a model generally [LSS94],
or specific types of models [KDJ06, RMR10]. However, while a model would be able to
meet most of the criteria, the judgement about the pragmatic value is external by those
that are involved in the respective domain the model targets [Joa93, p. 248]. So with
the assumption that a theory is not expressible at all [GH13], further investigations about
whether a model may act as a support for the derivation of meaningful actions are obso-
lete. Generally, a model should be regarded as a set of information. Moreover if the model
requires the clarification of further information by extensive face-to-face communication,
the pragmatism of that particular model should be refuted based on the not-included in-
formation. This leads to the assumption that creating a model is not a problem-solving
process, as the only intention could be collection of information. Thereby, in order for a
model to be pragmatic, it needs those informations that are relevant and revealing to the
subject. If so, then a model is suited to contribute, as an impetus, to the theory building
process, even to one that refers to a design theory [Gre06]. Reflectively, the pragmatic
value of a model relies in its possibility to be used in a theory building process by its re-
cipients. In accordance to that the relevance relies in the needed contribution to the act, as
a possible theorizing about the respective reason for a certain act, which needs to be taken
in the second place.
So, if one wants to create a model about a respective information system, one must con-
sider the various components of the respective information system, which are the task, the
human and the technology [Hei01]. Therewith, as formalised by the following predicates,
an information system includes tasks (t), humans (h) and technology (c).
∀i, ∃t : Includesit (2)
∀i, ∃h : Includesih (3)
∀i, ∃c : Includesic (4)
So, with considering an information system as a partly social system, this respective infor-
mation system enables the performance of certain actions. Respectively these actions are
considered with the completion of the respective tasks (t). As, obvious, only those humans
that are part of the information system may perform those actions with the technology that
is available, again within the information system. Therewith it is possible to abstract from
individual humans and technology, to generally assume that there are actions that can be
performed within an information system for the achievement of the respective tasks.
∀t, ∃a : Finishesta (5)
37
Therewith, a modelling process should be restricted to those actions that can be perceived
as pragmatic, if it can be shown that actions can be performed within an information
system, which do not offer any utility, respectively pragmatic value. Therewith, if an
action does not contribute to any completion of any task, it is rather doubtful that one
should model anything that contributes to the execution of the respective action. However,
there will be definitely actions that do not contribute in any sense to the completion of the
respective information systems task.
∀i, t∃a : Includesit ∧ ¬Pragmaticia → ¬Finishesta1 (6)
∀i, t∃a : Finishesta → ¬Includesit ∨ Pragmaticia (7)
∀i, t∃a : ¬Includesit ∨ Pragmaticia (8)
As an information system definitely includes tasks (cf. assumption 2), with the application
of the disjunctive syllogism the following predicate is proven.
∀i, ∃a : Pragmaticia (9)
So, every information system comprises actions that are pragmatic. These actions should
stay in focus, as to promote such actions may be a pragmatic value that modelling could
offer. The main goal might be the fostering of social interactions between individuals,
as identified by WEBER [Web78] as the most important behaviour of individuals in so-
cial systems. With considering these identified pragmatic actions, the pragmatic value of
a model then depends on the possibility for transforming the provided information into
knowledge and certainly extends the recipients habitus [BN13, p. 214], respectively ex-
tends the available set of actions one can perform. Hence, any value of a model is a priori
restricted by the possible contribution it can make towards those tasks that are pragmatic,
and the prevention of those actions that are not pragmatic. So, one could infer, based on the
specificity of an information system for having different individuals, technology and tasks
that the set of meaningful actions differs also between the information systems. Therefore,
the respective information requirements differ as well. Accordingly, one could infer that
for each created model, at least one information system can be identified that does not
comprise the focussed task, technology or individual, in such a manner that the respective
model does not serve any pragmatic in that particular information system. So, it will be
assumed that
∀m, ∃i : ¬Pragmaticim (10)
With the definition of the acting that reflects a certain value for an information system,
further investigation within the upcoming section are considered with the theories that
enable a human to execute these valuable actions and what the role of a specific model is.
1For purposes of clarity, the quantifiers will not be excluded throughout the application of the natural deduc-
tion logic.
38

3.2 The conditional alignment between abstraction and theory building
A conceptual model represents a general conception of a domain [WMPW95]. More spe-
cific, to just any domain, an information model represents information that are considered
with a particular information system [Tho06, pp. 66-71]. While an information system
is still a vague term, and can consider any technological induced and task oriented so-
cial system, the term of enterprise model is considered with enterprises as special form
information systems [Fra12]. Conclusively, the more specific a specific system, the more
concrete needs the language to be to formulate expression within this particular domain.
Concepts needs to be less abstract and the transition from information provided by a model
to expertise must be completed with clearly a lower effort.
A special and specifically pragmatic example for the usage of models for the enabling
of certain actions is model driven engineering (MDE) [Ken02, Sel03]. In short; MDE
is considered with the creation of certain models that can be specifically understood by
machines and enable them to perform certain actions. These actions then achieve certain
tasks, which can be either required on their own or in support for additional actions ex-
ecuted by humans or again machines. The pragmatic value of MDE is that the required
amount of information is a priori known by the machine itself and in such a manner au-
tomatically rejects "incomplete" models. Hence, the modeller will be socialised by the
machine, as he will be in charge for fitting the respective models. Although, one could
barely speak from a social relation, the acting will be accordingly refined by the modeller.
So, because of the strictly defined information needs, the level of abstraction for models
that are going to get interpreted by machines can be checked consistently. The human,
respectively the modeller, has then to check that the performed actions correspond to the
initially set intentions.
Model
Modeller Recipient
Build
Evaluate
Theo
rize
Justify
Build
Evaluate
Theo
rize
Justify
Figure 3: Production and consumption of a model with respect to [MS95]
This process of “socialisation”, respectively the identification of the information needs of
a human recipient, is at a completely different scale, if a human is in charge of interpreting
the model. As language skills, experiences and time-to-adapt, among other magnitudes,
will be extremely different between several individuals, even if they share a common infor-
mation system. Therewith, the role of abstraction for a specific model drastically impacts
the required information that an individual needs to get through a model in order to en-
39

able the performance of a certain action. Thereby, as depicted by Figure 3, a model needs
to serve a theory building process of a recipient that hopefully enables the individual to
perform a meaningful action within its information system. The respective representation
of Figure 3 is rather idealistic, although it represents the ultimate goal of a sophisticated
model, especially an information model, to enable individuals to build at least partially a
proper theory based on the given insights of the model. However, as specific case studies
considered with conceptual modelling reveal, the pragmatic value of a model is considered
mainly with communicative reasons [HPV05].
Referencing to theories of argument, such as STEPHEN TOULMIN’S [Tou03], one could
infer that the informational content of a model is only convincing, if the information is
supported by grounds that help to establish a belief [BT13]. In accordance to that, the
transformation of a model into required knowledge is only possible for a human, if it
possesses certain grounds, from which the transformation can be initialised. Hence, the
level of abstraction needs to be in accordance to the knowledge or expertise a human
already possesses (cf. Figure 4).
Knowledge(Implicit and Explicit )
of recip ient
Explicated informativecontent expressed by
modeller
Possiblelevelof
expertise Levelof
Abstraction
Figure 4: Abstraction requirements for possible expertise extension through a model
So, in general, the following conception of the use and design of a conceptual model is
driven by the question what are the value of semantics and syntactical correctness, if a
model can be justified based on its impact, namely its enabling factor. Based on this dis-
cussion of the role of abstraction for the establishment of expertise by means of conceptual
models, the initially defined predicate model can be properly extended. Therewith, to ex-
press the relation properly the following predicate states that based on a model, an individ-
ual may derive a certain action. However, the possibility of derivation depends principally
on the individual or human that interprets the respective model, as the expertise differs
between individuals.
∃h,m, a : Derivablehma (11)
40

4 A modelling theory for the design of social contexts
4.1 A restrictive view on the effort for modelling
Conceptual modelling remains as a capstone in an engineering process, in which the pri-
mary goal is the creation of an artefact, respectively the conceptual model. However, while
during this process the respective designer can gather multiple requirements by means of
a requirements analysis from a multitude of stakeholders, the actual relation between the
conceptual models and the requirements needs to be validated. This is also the case, when
multiple designers are involved in the creation of one conceptual model, e.g. due to com-
plexity. The various theories must be aligned by the outcome of the conceptual modelling
process in order to ensure its validity. However, due to the social system the alignment
must happen in accordance with multiple individuals that a modeller will cope with. As-
suming that a model is created with a certain intention, the pragmatic relationship will be
established based on the respective actions the recipient derives [Web78, Joa93]. In that
relation, even a non-perceivable reaction, such as being “silent” is considered as an action
as well [Kur95].
Therewith, the support is mainly individual dependent, as the models should support the
reduction of complexity in order to promote meaningful actions [Luh91a]. Therewith, in
order to promote pragmatic actions, whereby pragmatism also refers to the acceptance
within a social system, the provision of information by means of a model follows the
respective dispersion of values throughout a social system [LB91]. Specifically as a model
will be stated and becomes materialised, the model reaches value only when the different
underlying theories of the respective individuals are particularly aligned. Hence, models
can act as manner to come to a common theory between two individuals. In accordance
to that, the respective model reaches epistemological value, if a recipient can assume that
by the model some belief is expressed that has been evaluated by a certain respective
peer group [BNK04, BN07] and the recipient can gain the needed information from the
respective model. Respectively, the particular model still has a strong subjective relation
to the respective peer group, but with grounding it on a common theory, the inference of
any value for upcoming individuals is possible. Hence, with respect to the cognitive effort
to interpret the model accordingly based on the individual’s experiences and background,
it is assumed that although a model may be pragmatic and the derivation of pragmatic
actions is possible, not every human will derive those actions (cf. assumption 12).
∀m, i, a,¬∀h : [Pragmaticim → Derivablehma] → Pragmaticia (12)
∀m, i, a, ∃h : ¬([Pragmaticim → Derivablehma] → Pragmaticia) (13)
∀m, i, a, ∃h : [¬Pragmaticim ∨Derivablehma] ∧ ¬Pragmaticia (14)
∀m, i, a, ∃h : [¬Pragmaticia ∧ ¬Pragmaticim] ∨ [¬Pragmaticia ∧Derivablehma] (15)
41

The disjunction enables the splitting of branches and it is possible to continue with the left
branch.
∀m, i, a : ¬Pragmaticia ∧ ¬Pragmaticim (16)
∀m, i, a : ¬Pragmaticia (17)
Respectively, a contradiction has been identified with respect to conclusion 9. Therewith,
the pursued left branch is false and the right branch must be true (according to the disjunc-
tive syllogism).
∀m,h, a, ∃i : Derivablehma ∧ ¬Pragmaticia (18)
Additionally, it will be a harder task to interpret a certain model by a human of another
information system, as this requires the model to have a certain level of abstraction [Tho06]
and thereby, the human to be cognitive-capable to turn this high-level information to any
value for the information system. To ensure such a proper derivation, or to at least reduce
the level of misinterpretation mostly, quality frameworks have been developed, e.g. for
the domain of business process modelling [LR13]. However, as examined in other works,
such as [SMWR10], highly creative work can’t be subject of being captured by means
of an explicit model. Respectively, work that requires tacit knowledge can be at least
supported by information provision [KPV03], but neither captured nor is solved simply
by means of a model. Thereby, one can infer that knowledge is existent in information
systems that can’t be supported by any modelling activity. So, it is assumed that not for
every pragmatic action, either a respective model is not pragmatic in that particular context
or the action can be derived from a particular model by at least one human (cf. assumption
19).
∃i, h,¬∀a, ∃m : ¬Pragmaticim ∨ [Pragmaticia → Derivablehma] (19)
∃i, h,¬∀a, ∃m : Pragmaticim → [Pragmaticia → Derivablehma] (20)
∃i, h, a,¬∃m : Pragmaticim → [Pragmaticia → Derivablehma] (21)
∃i, h, a, ∀m : ¬(Pragmaticim → [Pragmaticia → Derivablehma]) (22)
∃i, h, a, ∀m : Pragmaticim ∧ ¬[Pragmaticia → Derivablehma] (23)
∃i, h, a, ∀m : ¬[Pragmaticia → Derivablehma] (24)
42
∃i, h, a, ∀m : Pragmaticia ∧ ¬Derivablehma (25)
∃h, a, ∀m : ¬Derivablehma (26)
In accordance, there is at least one human existing that is not capable of deriving a unique
action from any model available.
4.2 The pragmatic implications of a model
In order to establish a conceptual model as a sophisticated manner for distributing infor-
mation, based on the previous given insights, a shift of the epistemological value of con-
ceptual models is required. However, the creation by one individual of a model, whether
it is conceptual or mentally held, still relies on well-established and identified cognitive
processes, such as discussed in [BNK04, BN07]. Moreover, the question occurs how com-
mon sense of a conceptual model is created between more than one individual. Therewith,
a focus on pragmatics with an elicitation of utility is required. So the pragmatics of a con-
ceptual model may be refereed as the possibility for deriving meaningful actions based on
the information offered by the conceptual model.
Unfortunate, such a proceeding needs contribution by more than two individuals that re-
ceive a model in isolation and without any discursive relation, as it needs to be ensured
that no information is exchanged that goes beyond the information content of a model.
Required exchanges of information between participants would reveal the respective con-
ceptual model as incomplete. While completion must not necessary refer to a conceptual
model that comprises all of the respective knowledge kept in a particular domain of focus.
However, it rather requires requirements at the level of abstraction a respective conceptual
model is characterised with. Hence, the level of abstraction must orientate towards to the
information needs of the respective recipient. As an interpreter will have a certain exper-
tise in a certain field that enables him to consume a specific model, this expertise must be
identified a priori and related with the level of abstraction of the respective model.
One particular example, for meeting such a rather pragmatic level of abstraction is MDE
[Sel03]. The level of abstraction must exactly meet the information needs of the respective
compiler that is in charge for generating software code based on or interpreting the model.
Therewith, certain assumptions are made based on the algorithms language capabilities,
as the compiler is only able to interpret the received model in one specific way without the
need for the consumption of further information beyond the model. This is possible, due
to the homogeneous creation of different machine actors, which are identical with respect
to their knowledge (or rather information) and their set of performable actions.
However, initiated by gained insights from a respective model, an individual needs to act,
as certainly, acting is the only manner an individual can seize in a social-system [Web78].
Additionally, a prerequisite for a proper acting is the development of a respective theory,
based on the given information that gives the individual to decide for its actions. This is
43

important, as certainly the individual may be capable of selecting between multiple ways
of performing an action as well as multiple actions. Thereby, the value of a model can be
judged by its possible contribution to the sense selection of the respective actions, as apart
from theories models can become material and provided to individuals [GH13].
While every human acts distinctively different, namely the possibilities for interpreting
a specific model are distinctive, over time and gained experiences, these interpretations
should follow a specific schema. While one could claim that on optimal and idealistic
circumstances, the interpretations of different individuals will become homogeneous over
time [BNK04], different and varying circumstances should be taken into account by means
of a specific by-the-human-offered creativity. In particular, that variation is something a
machine cannot contribute. Moreover, models include information that aim at the reduc-
tion of complexity in order for an individual to make decisions and to perform certain
actions in an information system [Luh91b]. In that sense, abstraction segregates between
the complexity that can be reduced based on the information provided by the model and
the decisions that can be made based on the individuals knowledge and expertise [LP13].
If these requirements are met and although unstable as well as volatile circumstances, the
derivation of sophisticated actions based on the information content is possible, a model
certainly becomes pragmatic.
With respect to the discussion in section 3.2 and based from the previous given insights,
abstraction in terms of practical modelling can be defined as the level of knowledge, which
needs to be possessed by the recipient in order to make the respective model applicable
[BC87]. With accordance to the identified “knowledge-doing gap” [PS99], a proper ab-
stracted model provides information that enables a human to perform a certainly described
action. Hence, an according level of abstraction would provide a specific individual with
the required information for turning his knowledge gained from the particular model into
actions.
Finally, the process of modelling for a pragmatic model cannot end by the respective "mod-
eller", as the model is required to evolve during various theory building phases by different
individuals. Commonly, these processes require a discourse between a domain expert and
the respective system analyst [HPV05, BC11], whereby the domain expert judges for prag-
matics and the system analyst tries to capture the meaningful action within a specific corset
of syntax and semantics. However, to reach for consensus, it is necessary to include any
exchanged information that has been discussed [HPV05], but not included by the respec-
tive model. This left-for-inclusion information then decides for a possible derivation and
the proper derivation of meaningful actions. Derived from the previous gained conclu-
sions, it is assumed that a model is not pragmatic at all, if one is not capable of deriving
any pragmatic action from that particular model or if no action is derivable by any human
in any information system at all (cf. assumption 28). This assumption derives from the
previous given conclusions 18 and 26 as well as the consideration of the initially stated
assumption 10 as illustrated below.
∃i, h, a, ∀m : [Derivablehma ∧ ¬Pragmaticia] ∨ ¬Derivablehma (27)
44
∃i, h, a, ∀m : ¬Pragmaticim → [Derivablehma∧¬Pragmaticia]∨¬Derivablehma (28)
5 Conclusion
∃i, h, a, ∀m : ¬Pragmaticim → [Derivablehma∧¬Pragmaticia]∨¬Derivablehma (29)
∃i, h, a, ∀m : ¬([Derivablehma ∧ ¬Pragmaticia] ∨ ¬Derivablehma) → Pragmaticim(30)
∃i, h, a, ∀m : ¬[Derivablehma ∧ ¬Pragmaticia] ∧Derivablehma → Pragmaticim (31)
∃i, h, a, ∀m : [¬Derivablehma ∨ Pragmaticia] ∧Derivablehma → Pragmaticim (32)
∃i, h, a, ∀m : [¬Derivablehma ∧Derivablehma] ∨ [Pragmaticia ∧Derivablehma]
→ Pragmaticim(33)
∃i, h, a, ∀m : Pragmaticia ∧Derivablehma → Pragmaticim (34)
∃i, h, a, ∀m : Derivablehma ∧ Pragmaticia → Pragmaticim (35)
∀m, ∃i, h, a : Derivablehma ∧ Pragmaticia → Pragmaticim (36)
!Therewith, it was shown that the pragmatic value strongly depends on the cognitive possi-
bilities of the interpreting human and the surrounding information system that marks the
possible set of actions. With respect to the initial stated research question, it was found that
the creation of a model, if it needs to be interpreted by a human, depends on the actions
that are able to be performed by the human. Thereby, a model needs to either respect these
actions or needs to contribute to an enhancement of the respective recipient’s habitus.
45
References
[BC87] Tom Bylander and B. Chandrasekaran. Generic tasks for knowledge-based reasoning:the "right" level of abstraction for knowledge acquisition. International Journal ofMan-Machine Studies, 26(2):231–243, 1987.
[BC11] Balbir S. Barn and Tony Clark. Revisiting Naur’s programming as theory buildingfor enterprise architecture modelling. In CAiSE’11 Proceedings of the 23rd inter-national conference on Advanced information systems engineering, pages 229–236,Berlin, Heidelberg, June 2011. Springer.
[BN07] Jörg Becker and Björn Niehaves. Epistemological perspectives on IS research: aframework for analysing and systematizing epistemological assumptions. InformationSystems Journal, 17(2):197–214, April 2007.
[BN13] Pierre Bourdieu and Richard Nice. Outline of a Theory of Practice (Cambridge Studiesin Social and Cultural Anthropology, 16). Cambridge University Press, 2013.
[BNK04] Jörg Becker, Björn Niehaves, and Ralf Knackstedt. Bezugsrahmen zur epistemologis-chen Positionierung der Referenzmodellierung. In Jörg Becker and Patrick Delfmann,editors, Referenzmodellierung SE - 1, pages 1–17. Physica-Verlag HD, 2004.
[BT13] Sebastian Bittmann and Oliver Thomas. An Argumentative Approach of ConceptualModelling and Model Validation through Theory Building. In J. vom Brocke, editor,DESRIST 2013, LNCS 7939, pages 242–257, Heidelberg, 2013. Springer.
[CEK02] Tony Clark, Andy Evans, and Stuart Kent. Engineering Modelling Languages: A Pre-cise Meta-Modelling Approach. In Ralf-Detlef Kutsche and Herbert Weber, editors,Fundamental Approaches to Software Engineering SE - 11, volume 2306 of LectureNotes in Computer Science, pages 159–173. Springer Berlin Heidelberg, 2002.
[Che76] Peter Pin-Shan Chen. The entity-relationship model—toward a unified view of data.ACM Transactions on Database Systems, 1(1):9–36, March 1976.
[DS90] T. H. Davenport and J. E. Short. The New Industrial Engineering : Information Tech-nology and Business Process Redesign. Sloan Management Review, 31(4):11–27,1990.
[Eco86] Umberto Eco. Semiotics and the Philosophy of Language (Advances in Semiotics).Indiana University Press, 1986.
[Fra06] Ulrich Frank. Towards a pluralistic conception of research methods in informationsystems research. Technical report, University Duisburg-Essen, Institute for ComputerScience and Business Information Systems (ICB), 2006.
[Fra12] Ulrich Frank. Multi-perspective enterprise modeling: foundational concepts, prospectsand future research challenges. Int. J. of Software & Systems Modeling, August 2012.
[GH13] Shirley Gregor and Alan Hevner. Positioning and Presenting Design Science Researchfor Maximum Impact, 2013.
[Gre06] Shirley Gregor. The nature of theory in information systems. MIS Quarterly,30(3):611–642, September 2006.
[HC06] Michael Hammer and James Champy. Reengineering the Corporation: A Manifestofor Business Revolution. HarperBusiness, revised up edition, 2006.
46

[Hei01] Lutz Heinrich. Wirtschaftsinformatik. Oldenbourg, München, Wien, 2. edition, 2001.
[HMPR04] Alan R. Hevner, Salvatore T. March, Jinsoo Park, and Sudha Ram. Design science ininformation systems research. MIS Quarterly, 28(1):75–105, March 2004.
[HPV05] Sjba Hoppenbrouwers, H A Proper, and T P Van Der Weide. A Fundamental Viewon the Process of Conceptual Modeling. In L Delcambre, C Kop, H C Mayr, J My-lopoulos, and O Pastor, editors, Proceedings of the 24th International Conference onConceptual Modeling, volume 3716 of Lecture Notes in Computer Science, pages 128–143. Springer, Berlin, Heidelberg, 2005.
[Joa93] Hans Joas. Pragmatism and Social Theory. University of Chicago Press, London,1993.
[KDJ06] John Krogstie, Vibeke Dalberg, and S. M. Jensen. Increasing the value of processmodelling and models. In Proceedings of 8th International Conference on EnterpriseInformation Systems ICEIS, pages 70–77, 2006.
[Ken02] Stuart Kent. Model Driven Engineering. In Michael Butler, Luigia Petre, and KaisaSere, editors, Integrated Formal Methods SE - 16, volume 2335 of Lecture Notes inComputer Science, pages 286–298. Springer Berlin Heidelberg, 2002.
[KPV03] Kaj U. Koskinen, Pekka Pihlanto, and Hannu Vanharanta. Tacit knowledge acquisitionand sharing in a project work context. International Journal of Project Management,21(4):281–290, May 2003.
[Kur95] Dennis Kurzon. The right of silence: A socio-pragmatic model of interpretation. Jour-nal of Pragmatics, 23(1):55–69, 1995.
[LB91] Thomas Luckmann and Peter L. Berger. The Social Construction of Reality: A Treatisein the Sociology of Knowledge (Penguin Social Sciences). Penguin, 1991.
[LP13] Roman Lukyanenko and Jeffrey Parsons. Reconciling Theories with Design Choicesin Design Science Research. In Jan Brocke, Riitta Hekkala, Sudha Ram, and MattiRossi, editors, Design Science at the Intersection of Physical and Virtual Design SE- 12, volume 7939 of Lecture Notes in Computer Science, pages 165–180. SpringerBerlin Heidelberg, 2013.
[LR13] Matthias Lohrmann and Manfred Reichert. Understanding Business Process Quality.In Michael Glykas, editor, Business Process Management SE - 2, volume 444 of Stud-ies in Computational Intelligence, pages 41–73. Springer Berlin Heidelberg, 2013.
[LSS94] O.I. Lindland, G. Sindre, and A. Solvberg. Understanding quality in conceptual mod-eling. IEEE Software, 11(2):42–49, March 1994.
[Luh91a] Niklas Luhmann. Soziologie als Theorie sozialer Systeme. In Soziologische Aufk-lärung 1 SE - 6, pages 113–136. VS Verlag für Sozialwissenschaften, 1991.
[Luh91b] Niklas Luhmann. Soziologische Aufklärung 1. VS Verlag für Sozialwissenschaften,Wiesbaden, 1991.
[MDN09] Parastoo Mohagheghi, Vegard Dehlen, and Tor Neple. Definitions and approaches
to model quality in model-based software development âAS A review of literature.Information and Software Technology, 51(12):1646–1669, December 2009.
[MS95] Salvatore T. March and Gerald F. Smith. Design and natural science research on in-formation technology. Decision Support Systems, 15(4):251–266, December 1995.
47

[PS99] Jeffrey Pfeffer and Robert Sutton. The Knowing-Doing Gap: How Smart CompaniesTurn Knowledge Into Action. 1999.
[RMR10] HajoA. Reijers, Jan Mendling, and Jan Recker. Business Process Quality Manage-ment. In Janvom Brocke and Michael Rosemann, editors, Handbook on Business Pro-cess Management 1 SE - 8, International Handbooks on Information Systems, pages167–185. Springer Berlin Heidelberg, 2010.
[Rop78] Günter Ropohl. Einführung in die allgemeine Systemtheorie. In Hans Lenk and GünterRopohl, editors, Systemtheorie als Wissenschaftsprogramm. Athenäum, Königstein,1978.
[Sch00] August-Wilhelm Scheer. ARIS-business process modeling. Springer, New York, 2edition, 2000.
[Sel03] B. Selic. The pragmatics of model-driven development. IEEE Software, 20(5):19–25,September 2003.
[SMWR10] Stefan Seidel, Felix M. Muller-Wienbergen, and Michael Rosemann. Pockets of cre-ativity in business processes, October 2010.
[Tho06] Oliver Thomas. Management von Referenzmodellen: Entwurf und Realisierung einesInformationssystems zur Entwicklung und Anwendung von Referenzmodellen. Logos,Berlin, 2006.
[Tou03] Stephen E. Toulmin. The Uses of Argument. Cambridge University Press, Cambridge,UK, updated edition, 2003.
[Web78] Max Weber. Economy and Society. University of California Press, Berkeley, LosAngeles, London, 1978.
[WMPW95] Yair Wand, David E. Monarchi, Jeffrey Parsons, and Carson C. Woo. Theoreticalfoundations for conceptual modelling in information systems development. DecisionSupport Systems, 15(4):285–304, December 1995.
[Yu99] Eric Yu. Strategic modelling for enterprise integration. In Proceedings of the 14thworld congress of the international federation of automatic control, 1999.
48
Towards a Modeling Method for Supporting theManagement of Organizational Decision Processes
Alexander Bock, Heiko Kattenstroth, Sietse Overbeek
Information Systems and Enterprise Modeling Research GroupInstitute for Computer Science and Business Information Systems
University of Duisburg-Essen, Universitätsstr. 9, 45141, Essen, Germany{ alexander.bock | heiko.kattenstroth | sietse.overbeek }@uni-due.de
Abstract: Today’s business environments necessitate effective and well-informedorganizational decision processes. To establish adequate environments for decisionprocesses in organizations, methods are advisable that promote the coordination ofthese processes, facilitate the implementation and maintenance of supportinginformation systems, and foster accountability as well as traceability oforganizational decisions. We investigate the potentials of an enterprise modeling-based approach for supporting the management of organizational decisionprocesses and propose conceptualizations for modeling constructs as enhancementsto existing enterprise modeling methods.
1 Introduction
Dynamic global markets, heterogeneous and quickly changing customer demands, andshort technology life cycles, among other economic challenges, increase the need fordecision support in organizations [TALS07, pp. 6–8]. Addressing this need, researchareas such as prescriptive decision theory and decision analysis as well as otherquantitatively oriented fields of business administration provide sophisticated formalmethods for analyzing particular decision situations [Ra70; BCK08]. Varioustechnological approaches and information systems (IS), such as businessintelligence (BI) systems, data warehouses (DW), and decision support systems (DSS),have been developed for supporting business stakeholders in making decisions. DSS areprimarily built to support selected problem areas. BI systems are intended to providecondensed information based on data gathered in data warehouses [TALS07, p. 90].Supporting and preparing managerial decisions through the provision of information,furthermore, is also an aim of the business functions and research areas of controllingand management accounting [Kü08, pp. 20, 48-49].
Organizational decisions in enterprises take place in a social, technological,informational, and environmental context [Ra77, pp. 20–33]. Consequently, improvingthe circumstances of organizational decision processes demands for multifacetedmeasures “addressing technology, information, organizational structure, methods, andpersonnel” [Da09, p. 120]. For example, from a technological perspective, it is necessaryto design DSS and BI systems in a manner that is actually oriented towardsorganizational decisions and problems [MH07, pp. 1034–1035]. From an organizationalperspective, it is necessary to specify organizational regulations to determine whichactors have the authority for making certain kinds of decisions [FGT12, pp. 147-148,
49
157-159]. From an informational perspective, it is necessary to satisfy information needsarising from decision problems in different units of an enterprise [Kü08, p. 189]. As anadditional challenge, implementing these measures requires collaboration andcommunication between stakeholders with different professional backgrounds and withdifferent perspectives on decisions. This demands for a common understanding ofcentral concepts. However, especially the term ‘decision’ is characterized by a broad anddiverse understanding in everyday language [Be96, pp. 201–202] and, notably, even inwide parts of dedicated literature on decisions [Th74, pp. 9–21].
Against this background, a methodical approach for supporting the management oforganizational decision processes is advisable. This includes the identification,documentation, coordination, and analysis of organizational decision processes. Suchsupport is not provided by the aforementioned approaches and tools. A promisingfoundation for the development of a corresponding method, however, can be found inthe area of enterprise modeling. This is mainly for four reasons. First, enterprisemodeling approaches, such as ARIS [Sc01], MEMO [Fr12], and ArchiMate [Th12],provide (domain-specific) modeling languages (DSML) for describing various aspects ofan enterprise. Among these aspects are organizational structures, business processes,goal systems, and IT landscapes. Second, these modeling languages are integrated toenable expressing and analyzing relations between different areas of an organization[Fr10, pp. 8–9]. Third, enterprise modeling methods typically offer illustrative graphicalnotations to foster an intuitive understanding of the models. Fourth, approaches such asMEMO [Fr12] are multi-perspective in that they provide different groups of stakeholderswith specific abstractions and views on their areas of concern within an enterprise. Wetherefore argue that a domain-specific modeling method that is integrated with anexisting enterprise modeling method represents a suitable foundation for describing,communicating, and analyzing organizational decision processes from multipleperspectives. An enterprise model-based approach thus promises to contribute to thelong term management of organizational decision processes. At the same time, itenriches the current state of the art in enterprise modeling. To the best of our knowledge,present enterprise modeling approaches do not provide dedicated modeling concepts fordescribing organizational decision processes.
The contribution of this paper is threefold: (1) We present the results of a terminologicalanalysis and reconstruction of the domain of organizational decision processes, (2) weinvestigate the potentials of an enterprise modeling-based method to support managingorganizational decision processes, and (3) we present the outline of such a method. Inthis paper, we focus particularly on requirements and language design issues. Thisrepresents a first step towards a comprehensive method for the dedicated management oforganizational decision processes. A process model, as the second constituent part of theintended modeling method, is part of future research. In Section 2, we present results ofa domain analysis. Section 3 elaborates on the purpose of the method and introducesrequirements it should satisfy. General prospects of an enterprise modeling approach forthe given purpose are envisioned in Section 4. In Section 5, we discuss issues anddecisions pertaining corresponding language concepts. A review of related work, whichbuilds on concepts and relations outlined before, is given in Section 6. Section 7provides concluding remarks and an overview of future research.
50

2 Domain Analysis
The development of a modeling method, and in particular the design of a domain-specific modeling language, requires to reconstruct key terms and semantics of thetargeted domain. For this purpose, pertinent literature in the field of organizationaldecision processes has been reviewed, analyzed, and interpreted. This sectionsummarizes key findings from a reconstruction of the terminology concerning thefundamental understanding of a decision (Section 2.1), decisions and decision processesin organizations (Section 2.2), as well as the relation to information systems andorganizational decision support (Section 2.3). The research fields considered in thefollowing analysis include business administration, organizational studies, psychology,prescriptive decision theory, and information systems (management).
2.1 Fundamental Understanding of the Concept of a Decision
The term ‘decision’ undergoes a highly varied use both in everyday language and inliterature. Remarkably, even a large number of publications specifically dealing withdecisions hardly elaborate on the underlying understanding of this term [Lu06, p. 123].Often, the term is introduced en passant and only in a rather concise manner [Be96,pp. 201–202]. To develop a more comprehensive understanding, different aspects relatedto the concept of a decision are discussed below.
The most common definition of a decision is that of a choice among alternatives [e.g.,Gä63, p. 22; Ra77, p. 1, Sc04, p. 54]. In wide parts of literature, and particularly ineconomics, business administration, and prescriptive decision theory, decisions areexclusively understood as choices [Ma99, p. 14]. Following this conception, a decisionconsequently presupposes the availability of at least two options to choose from. Asanother central characteristic of decisions, it is commonly suggested that decisions relateto subsequent courses of action of an individual [e.g., Si76, p. 4; MRT76, p. 246]. Thatis, a decision is considered to imply an act of commitment to perform a particular courseof action [Ki71, pp. 54; MRT76, p. 246]. Both the conception of a decision as a choiceand as a commitment portray a decision as an isolated mental act taking place at aspecific point in time. It is abstracted from how individuals arrive at this act. In thisregard, it is generally suggested that decisions are the result of dedicated decisionprocesses [e.g., Ki70, pp. 70–75; Si76, p. 4; Be96, pp. 200–207]. Despite its commonuse in literature of different research fields, only very few distinct definitions of the term’decision process’ can be found. Synthesizing various proposals in the literature, adecision process can be regarded as an abstraction of a number of different andpotentially temporally dispersed cognitive processes and activities of an individual,which eventually result in a decision. A remarkable diversity of prototypical descriptionsof decision processes are suggested in the literature [see Ki70, pp. 70–75]. Fourcommonly noted key elements have been identified. First, a decision process isordinarily assumed to be initiated by the perception of a stimulus, such as the perceptionor recognition of a problem, a specific situation, or a certain condition. A stimulus willhereinafter be understood as an individual’s initial perception of a problem [PB81,
51
p. 119]. If a number of possible courses of action are already available, and only onealternative may be realized, this is usually defined as a decision problem [GK05, p. 7].
Second, a decision process suggests some kind of pre-decision behavior in the course ofwhich an individual searches for, identifies, develops, and evaluates possible courses ofaction. It is often suggested that these activities primarily represent activities ofinformation processing. Many authors with both descriptive and prescriptive claimssuggest a specific sequence of these activities [e.g., PB81, p. 119; GK05, p. 66].However, empirical research stresses that the phases taking place in decision processescannot be assumed to occur in any strict order [Wi72; MRT76]. The assumption thatcourses of action are evaluated implies the existence of mental concepts of valuation. Inthis connection, concepts such as values or, most commonly, goals are invoked [e.g.,Ki70, p. 26; Si76, pp. 4–8]. Additionally, environmental factors are considered, whichmay result in different future states [e.g., BCK08, pp. 18–22]. According to traditionalconceptions in economic theories, ‘rational’ individuals have perfect knowledge ofavailable courses of action and their outcomes, and they pursue consistent goals [Si76,pp. 79ff.]. Contrarily, most recent descriptive theories of human decision makingacknowledge that there are limits to human knowledge and rationality [Ma99, p. 33].Third, a decision process involves a decision at one point. If different courses of actionhave been identified or developed, it is suggested that one of these alternative courses ofaction is chosen in this phase. However, it is also possible that only one potentialproblem solution is accepted without considering other alternatives [Br80, pp. 37–38;Ki70, p. 71]. Thus, in contrast to common definitions, a decision does not necessarilyhave to represent a choice. Fourth, and lastly, some authors suggest post-decisionbehavior, e.g., activities of assessment, feedback, learning, legitimation, or revision withrespect to the decision and the accepted course of action [e.g., Si77, p. 41]. In summary,it can be concluded that decisions are not isolated acts or choices, but rather result fromdynamic and iterative processes of assessing and developing possible courses of action.
2.2 Organizational Decisions
Organizational decisions and decision processes exhibit specific particularities. First, notevery individual or group of individuals as part of an organization is permitted to makeany kind of decision. Instead, certain organizational positions or units are assigned theauthorization to make organizational decisions that have internally or externally bindingimplications [e.g., FGT12, pp. 147, 157]. In case individuals involved in anorganizational decision process do not have the authority to legitimately or bindinglymake a decision, this decision may have to be authorized by a different organizationalunit, typically up in the organizational hierarchy [MRT76, pp. 259–260; Ki71, pp. 54–55]. Second, major parts of literature on business administration advocate the notion thatorganizational decisions are to be oriented towards goals, and that organizations defineand maintain organizational goal systems [e.g., He66; Sc04, p. 57]. Organizational goalsystems comprise a number of interrelated organizational goals, which are pursued in thelong term or for a certain period of time. It is argued that organizational goal systems canand should serve as a key orientation for decisions in enterprises [e.g., He66, pp. 22, 24].Third, decisions in business firms are typically decisions on the use and commitment ofscarce resources [e.g., Sc04, p. 57].
52

2.3 Information Systems and Organizational Decision Support
In recent decades, a variety of information system types have been developed andpropagated by academia and practice with the aim of supporting organizational decisionmaking. Business intelligence systems and decision support systems are two of the mostnotable types of IS in this context. BI systems are aimed at gathering business data fromdifferent sources such as internal information systems or external information providers,consolidating these data in specific centralized databases, and providing businessstakeholders with diverse means of observing, accessing, and analyzing these data[MH07]. The databases underlying BI systems are commonly referred to as datawarehouses. BI systems intend to provide information in terms of general businessfigures such as product sales structured by regions and periods. In contrast, DSS aretailored towards supporting specific problem areas [TALS07, p. 90]. For example, DSSmay offer information and implement analytical models for supporting problem areassuch as assessing investment options. In addition to IS (management), supplyingstakeholders in enterprises with information is of concern in research areas such asinformation management, controlling, and management accounting. A concept that isutilized in all these research areas is the concept of information need. Information needis commonly understood as a specification of type, amount, and quality of informationalresources, which are required to accomplish a task [Ho09, p. 309]. Küpper states thatinformation needs for a decision problem can be obtained by assessing givenalternatives, goals, and relations between them [Kü08, p. 183]. Diverse methods foridentifying business information needs have been developed [SWW11]. Informationneeds are relevant in the area of controlling to supply business stakeholders withappropriate information [Kü08, p. 189ff.; Ho09, p. 309ff.] as well as in the area of ISmanagement to design adequate IS, in particular BI systems [SWW11, pp. 37–38]. Theconcept of information need, hence, represents a link between decision processes andboth technological and organizational measures aimed at information provision. Torecapitulate, the semantic net in Figure 1 summarizes the key concepts and relationspointed out in this section.
may beregarded as a
to a particular
results from
is to bemade
between
initiated byconsciousperception
of a
may represent initialperception of a
may representinitial perception
of a
is a
make(s)
may bebroughtto a
reaction to a
reviews
demandsdevelopment oridentification ofone or several
holds severalimplies
identifies,develops,
and evaluatesone
or several
perceived by
constitute
has individual
value
comprises several
processesraises
may satisfy
affects
affects
entitles to makespecific assigned to
holds
assigns
mayprovide
may support
Choice
DecisionProblem
Stimulus
Alternative(s) Outcome(s)
Course ofAction
Mental Act ofCommitment
Problem
Goal(s)
OrganizationalGoal System
Organization
Decision MakingAuthority
Decision Individual(s)
(Decision Supporting)Information SystemInformationInformation
Need
DecisionProcess
EnvironmentalFactor
Figure 1: Semantic net of key concepts related to (organizational) decisions
53

3 Design Goals and Requirements
The modeling method presented in this paper is intended to be an instrument forsupporting the identification, documentation, coordination, and analysis oforganizational decision processes. It is supposed to stimulate and foster theimplementation of suitable organizational and technological measures for improving thebasis of decision making. In particular, models created with the prospective modelinglanguage should provide multiple perspectives on decision processes, such as anorganizational, a technological, and an informational perspective. Accordingly, theoverall design goal is to enhance present enterprise modeling approaches with constructsfor modeling organizational decision processes to enable a model-based and multi-perspective management of organizational decision processes.
The design of a modeling language demands to identify requirements for guiding thespecification of language concepts. Hence, based on the domain analysis presented inSection 2, we refine the stated goal by establishing domain-specific requirements themethod should satisfy. General requirements that a DSML should fullfill are discussedin, e.g., [Fr10]. At first, requirements relating to the particularities of conceptuallymodeling decision processes are discussed. Subsequently, requirements concerning theintegration of decision process models in the context of an enterprise (model) arespecified.
3.1 Requirements Concerning the Conceptualization of Decision Processes
The domain analysis has revealed several particularities of decisions and decisionprocesses that a corresponding modeling method has to consider. Conceptual modelinglanguages ordinarily focus on the type level, which abstracts from particular instances[e.g., Fr10]. A decision process instance may be regarded as a particular decisionprocess taking place in an organization, while a decision process type may be regardedas an abstraction of several similar decision process instances. Constructing anappropriate abstraction at the type level faces various challenges, though. First, adecision is characterized by the very fact that it is a reaction to a ’new‘ or partly’unknown‘ situation (see Section 2.1). The idea of aggregating several decisionprocesses to a type, hence, may compromise the very essence of the concept. Second,decision processes are characterized by the fact that their problem definitions are neitherfixed, nor entirely predictable over the course of a decision process. For example,decision processes initiated by similar problem perceptions might result in highlyheterogeneous decisions. At the same time, decisions that relate to similar courses ofaction might be the result of decision processes that are initiated by entirely differentproblem perceptions. Also, a decision process may often start with little more than avague perception of a problem. These observations indicate that different conceptions ofdecision process types are conceivable. A method for managing organizational decisionprocesses should thus provide a conception that is adequate to its purpose.
54
Req. 1 – Decision processes: The method should provide a purposeful specification ofthe semantics of decision process types as abstractions of substantially similar past,present, and possible future decision processes. The method should provide clearguidelines for constructing meaningful decision process types.
Decisions and decision processes are always the reaction to specific stimuli, i.e., initialperceptions of problems.
Req. 2 – Stimuli: The method should provide a concept for modeling stimuli, whichinitiate decision processes. It should be possible to link stimuli to concepts thatrepresent potential sources or triggers of stimuli, e.g., business performanceindicators or other kinds of incentives, threats, or opportunities.
Various studies have shown that both individual and organizational decision processesare iterative and also incremental in nature [e.g. Wi72; MRT76]. Activities in decisionprocesses do not follow strict schemes of phases.
Req. 3 – Iterativeness: The method should neither presume nor convey the impressionthat decision processes in organizations can be approached by following a strictscheme of phases or activities.
It is widely recognized that a traditional conception of rationality is neither suitable fordescribing human behavior, nor appropriate to human cognitive capabilities [Si76].
Req. 4 – Bounded rationality: The method should not build on unrealistic assumptionson human rationality and cognitive capabilities. It should neither be assumed thatindividuals in a decision process are generally aware of all possible courses of actionand their outcomes, nor that individuals have consistent goal and preference systemswith respect to these outcomes.
Different individuals in the social system of an enterprise may pursue different goals,which neither need to be congruent with each other, nor necessarily be conducive toorganizational goals [PB81, pp. 426ff.].
Req. 5 – Social systems: The method should take into account the fact that organizationaldecisions are made in social systems. To mitigate possible detrimental effects ofopportunistic behavior and to promote the reflective use of the method, it shouldstimulate deliberate justifications of decisions, and it should foster traceability aswell as accountability of decisions, e.g., with regard to possible negative side-effects.
The domain analysis has revealed a number of key concepts for describing formalizeddecision problems (see Section 2.1 and 2.3). To foster differentiated communicationabout key determinants of decision problems and to provide a basis for the specificationof formal decision models, these concepts should be considered by the modeling method.
Req. 6 – Key determinants: The method should provide concepts for modeling courses ofactions, goals, environmental states, and outcomes.
55

3.2 Requirements Concerning the Context of Organizational Decision Processes
To foster communication about decision processes and to support correspondinganalyses concerning, e.g., the personnel involved in decision processes or the supportprovided by IS, it is necessary to account for the organizational context.
Req. 7 – Organizational context: The method should allow for integrating decisionprocesses and related concepts in the context of an enterprise. This demands forintegration with other modeling languages, specifically languages for modelingorganizational structures, information systems, and goal systems.
Decision processes may result in measures that affect specific parts or elements of anorganization. For example, an organizational decision process may be concerned withrestructuring business processes, or it may be concerned with redefining its IT strategy.To enable analyses of presumable impacts and interrelations of decisions within anenterprise, it should be possible to model these relations.
Req. 8 – Decision impact: The method should allow for denoting those organizationalaspects or elements of an organization, e.g., business processes, IT resources, orstrategies, which are targeted or expected to be influenced by a decision process type.
Information has been found to be a key resource of decision processes, i.e., decisionprocesses raise information needs. Different technological approaches and businessfunctions aim at providing stakeholders with information (see Section 2.3). To supportthese business functions, there is need to align provided and needed information.
Req. 9 – Information needs: The method should allow for modeling information needsassociated with decision processes. It should be possible to link information needs toinformation provided by existing IS.
The method is aimed at supplying stakeholders in enterprises with references to decisionsupporting resources that are relevant to specific decision process types. Also, it isintended to support analyses on the appropriateness and possible expansions of thesesupportive means.
Req. 10 – Decision support: The method should allow for linking different supportivemeans, e.g., specific decision support systems, diagram types of modeling methods,or formal decision modeling approaches to a decision process.
The prospective application of a method that addresses these identified requirements isillustrated below.
4 Prospects of an Enterprise Modeling Approach
In this section, prospects of extending an enterprise modeling method with modelingconstructs for describing organizational decision processes are outlined. On the basis ofan exemplary application scenario, it is envisioned how conceptual models of
56
organizational decision processes could be integrated into existing enterprise models andwhich benefits are associated with such an approach. Considerations on the design ofmodelling concepts are discussed in the following section. Figure 2 presents an excerptof an enterprise model, which is augmented by a model of organizational decisionprocess types. The enterprise model describes selected aspects of a fictitious medium-sized mail order company that focuses on consumer products and operates on the basisof an online shop. The enterprise model is created using several DSML and notationsprovided by the enterprise modeling method MEMO [Fra12]. The shown excerpts do notpredetermine a specific enterprise modeling approach, though. New concepts can equallybe introduced to enterprise modelling approaches other than MEMO.
The scenario shows five partial models, all of which are located at the type level. First, agoal model is pictured in the top left part of the diagram. This model represents selectedgoals of the enterprise. Second, a model of the organizational structure is depicted in thetop right part of the diagram. Third, certain business process types that are selected froma business process map are shown in the second layer. Fourth, a model that depicts a setof decision process types along with corresponding stimuli and a detailed view on aparticular decision process type is part of the third layer. Fifth, and finally, a model ofselected information systems, the information they provide, and an exemplary modelshowing hardware and software used to realise the IS is part of the bottom layer of thediagram. Not every prospective analysis scenario needs to consider all aspects depictedin the given example simultaneously. As such comprehensive diagrams can reach aremarkable degree of complexity, common enterprise modeling methods often providemechanisms for fading in and out details in diagrams according to the user’s needs.
Selected relationships between elements of the enterprise model are explicitly modeledusing associations. These associations are found between, e.g., organizational units andbusiness processes. In particular, the augmented enterprise model points out how modelsof decision processes can be integrated with other models in the context of an enterprise.The given application scenario focuses on analyzing the context of the decision processtype ’Define Temporary Promotional Offer’ (see in Figure 2). Prior to specificanalyses, stakeholders with different professional backgrounds can gain an initialunderstanding of this decision process type by assessing its attributes and linkedconcepts. The attribute ‘General Aim’ points out that this decision process is generallyconcerned with specifying a promotional offer in terms of a product and a promotionalprice. As is expressed by the corresponding stimulus type (see ), this process isinitiated whenever need is perceived for attracting additional visitors to the online shopin the short term. Stimuli of this type occur ‘occasionally’, hence, the decision process isinitiated rather frequently. It is important to note here that the model describesabstractions of these occurences at type level, while particular stimuli perceived atspecific dates would be located at the instance level. Furthermore, it can be found thatthis decision process is to be oriented towards the goal to ’Maximize Shop Awareness’(see ) in the organizational goal system. With respect to this relationship, it is alsonoteworthy that the decision process should target the goal ’Attract at least 300 UniqueNew Visitors’ (see ). This represents a decision-specific goal, which is too specific tobe considered in the general organizational goal system. Yet, on the basis of decisionprocess models, even such goals can be managed and documented.
57

GoalSystem
Need forAttracting Visitorsin the Short Term
Business PerformanceIndicators Significantly
Below Goals
Online ShopPlatform O1
Sales Analytics IS
Maximize ShopAwareness
Maximize WebShop
Duration of Visitfor All Customers
Maximize Cross-SellingRate
Maintain 6% ROI
Purchase, Sales,and Orders
Head of Purchase,Sales, and Orders
Sales and OrdersAdvisor
IT
Shipping LogisticsAnalyst
BI Suite B1
i!
i
Transport DelayDissatisfactory
Estimated Orders
Average Orders perProduct Segment
iWeekly Visitors
Goal (Engagement goal,symbolic goal, decision-specific goal)
Software
IT hardwareresourceBusiness process type
Informationsystem
Legend
DecisionProcesses
OrganizationalStructure
Inform
ationSystem
s
Stock Manage-ment & Shipping
Head of StockMgmt. & Shipping
WarehouseSupervisor
Products Return Order Processing
Customer CareBusinessProcessesMap
Incoming Goods Reception
Assess Determinantsto BusinessPerformance
Select TransportCompany
Data CenterAdministrator
Potential NewProductIdentified
Assess and AdaptArray of Offered
Products
Attract at least 300Unique New Visitors
Detail
i
Decision process type
Information /Information need
Environmentalfactor
runson
requiresrunson
Solaris
Detail
Organizational unit
Position
Define TemporaryPromotional Offer
iAverage GuestDuration of Visit
iStandard Profit perProduct Segment
i!
Customer Trends
Sales AnalyticsSoftware 1.23SQL Server
Entitled to Authorize:Participation Due:Participation Suggested:
TrueTrueEssential
Valency:Common Frequency:Common Urgency:
ProblemOccasionalLow
Presumed Impact:General Aim:
LowSpecify a product andprice for a promotional...
Stimulus raises
i!Product Segment Attractivity
Supportive means
Presumed impact
Activity focus (search,problem solving)
may participatein
initiates
relevant to
providestriggers, similar to
12
3
5
7
triggers
Offered ProductProfitability
Dissatisfactory
4
6
Satisfaction 40%Perceived Utility Low
8
Figure 2: Illustration of an enterprise modeling approach to decision process modeling
Building on a general understanding of the decision process, an enterprise modelprovides the foundation for supporting various specific analyses. For example, amanager responsible for a certain organizational unit can analyse who is involved—andwho should be involved—in certain decision processes by analysing relationships fromdecision process types to organizational positions and roles (see ). In the scenario, itcan be found that the ‘head of purchase, sales, and orders’ as well as ‘sales and orders
58

advisors’ are commonly involved in the given decision process type. A responsiblemanager may find that the decision process lacks particular competencies and suggestthat a shipping logistics analyst should participate in the process as well. Also, it may beassessed to be inappropriate that sales and order advisors are entitled to authorize thefinal decision. Consequently, decision making authorities might be reassigned morestrictly, e.g., by demanding authorization by the head of the department. Taking adifferent perspective, IT experts can assess information needs raised by the decisionprocess type (see ) as well as information and support provided by existinginformation systems (see ). By tracing connections between information needs andinformation provided by IS, the appropriateness of supplied information can be assessedand deficits may be identified. For instance, it may be noted that the environmentalfactor ‘customer trends’ raises the need for information on current product segmentattractivities. Apparently, this demand is not addressed by any existing IS. This mightstimulate measures for adapting IS or establishing new IS meeting this demand. Also, ITexperts can assess whether information systems provide information that is not pivotal toany decision process type by identifying information that is not linked to any decisionprocess type. This supports evaluating costs and benefits of providing this information.Finally, it can be assessed whether it might make sense to establish additional decisionsupporting systems by comparing existing decision process types and available DSS. Forexample, it can be detected that the ‘sales analytics IS’ is regarded as a supportive meansfor the given decision process type. Its perceived utility, however, remains low (see ).In addition to these examples, various analyses taking further perspectives areconceivable. For example, a top level board of managers may assess whether the rightset of goals is targeted in different decision process types.
5 Considerations on Language Design
Based on the requirements analysis and the outlined vision of an enterprise modelingapproach, this section provides considerations on modeling concepts for describingorganizational decision processes. We present preliminary specifications of modelingconstructs as meta model excerpts using the MEMO meta modelinglanguage (MML) [Fra11]. The specifications are intended as working drafts for thefollowing discussion with and discursive evaluation by peers and domain experts. Toimprove readability, the meta model excerpts are split into several figures.
Based on the domain analysis, we suggest to clearly distinguish between languageconcepts for describing decision processes and decisions. Decision processes embraceall activities of treating detected problems, while decisions represent the final acts ofcommitment resulting from these processes. Consequently, decision processes areregarded as the prime concepts of interest for most prospective analyses. Toconceptually model decision processes, a purposeful conception of decision processtypes (Req. 1) is necessary. Various options are conceivable. First, it would be possibleto define decision process types as abstractions of decision processes that relate tosimilar problem areas. Second, it would be possible to specify them as abstractions ofdecision processes, which result in decisions on similar subjects. Third, it would bepossible to define decision process types as abstractions of decision processes, which are
59

initiated by similar stimuli (i.e., by similar initial problem perceptions). This conceptionrefines the first one. We propose to employ the third conception as a basis of abstraction.The first alternative remains unpractically vague, as it does not provide clear criteria forspecifying decision process types. The second alternative neither allows for modelingdecision process types that are initiated by vague stimuli, nor for modeling decisionprocess types that deal with heterogeneous decision subjects. For instance, consider thestimulus “business performance indicators significantly below goals”. This stimulusmight result in different decisions such as cutting of operations costs or investing intonew product developments. The third alternative, in contrast to the second one, allowsfor capturing decision process types that deal with such different decision subjects, sinceit focuses on the inital stimulus. Thereby, in contrast to the first conception, it alsoprovides a clear reference point for the construction of abstractions at the type level.
Building on this conception of decision process types, we suggest to describe a decisionprocess type in terms of a name and a generalAim (see Figure 3). The general aim shouldbriefly characterize the intent of a given decision process type. Different decisionprocesses may emphasize different activities, which can be specified using the attributecommonActivityFocus. Based on the domain analysis, we suggest that the auxiliary typeDecisionProcessFocusType can take the values ‚Problem Analysis‘, ‚Problem Solving‘,‚Search‘, and ‚Evaluation and Choice‘. The attribute presumedImpact of a decisionprocess type may be used to express the expected influence on business performance.
description : Stringjustification [1..*] : RationaleSpecdate : Date
Decisionname : StringgeneralAim : StringcommonActivityFocus : DecisionProcessFocusTypepresumedImpact : {low, medium, high}
DecisionProcessi
has resulted fromi
1..11..1
Figure 3: Conceptualization of ‘decision process’ and ‘decision’
With respect to the established design goals and requirements (see Section 3), modelingdecisions as final acts of commitment is primarily relevant for purposes of justification,and accountability (Req. 5). Therefore, it is suggested to specify ‘decision’ as anintrinsic1 concept (as expressed by the white ‚i‘ on the meta type in Figure 3). Thepurpose of this concept is to describe particular decisions (instances of a decision type).Attributes for specifying a general description, a justification for the respective decision(the auxiliary type ‚RationaleSpec‘ for modeling rationales is developed by [SFHK12]),as well as an attribute expressing the date that a particular decision has been made havebeen included. As decisions are solely modeled at the instance level, the associationbetween ‘Decision’ and ‘DecisionProcess’ is marked as being intrinsic as well. Atinstance level, one particular decision results from exactly one decision process instance.
A ‘stimulus’ represents a further key concept of the prospective language (Req. 2),especially since it is employed as a basis for the construction of decision process types.In addition to the generic attributes name and description and in accordance with, e.g.,[MRT76], it is propose that a stimulus can be characterized in terms of a valency. A
1 Intrinsic concepts, attributes, and associations are not instantiated at type level, but only at instance level (see[Fr11] for further discussion).
60

stimulus valency expresses the degree to which it is regarded as voluntary (an‚opportunity‘) or enforced by external pressure (a ‚crisis‘) to respond to a stimulus (seeFigure 4). Intermediate stimuli are regarded as an ordinary ‚problem‘. The degree towhich an immediate reaction is necessary can be expressed using the attributecommonUrgency, while the rate of its occurence may be specified using the attributecommonFrequency. At the instance level, the date a particular stimulus has been notedcan be documented (recorded). It is proposed that at type level each stimulus typeinitiates exactly one decision process type, while a decision process type may be initiatedby different stimuli (initiates). At the instance level, a decision process can only beinitiated by exactly one specific stimulus (intrinsic association ‘has initiated’). Hence,while the former association describes, which stimulus types can initiate which decisionprocess types, the latter can be instantiated only at instance level to document whichparticular stimulus has initiated which specific decision process. Furthermore, it isargued that a decision process may potentially trigger further stimuli. This relation ispurely optional. With respect to requirement 3, it has been chosen to deliberately refrainpermitting to model strict sequential relations within or between decision process types.
initiates
1..1
1..*
has initiated1..1
1..1 i
may trigger 0..*0..*
name : Stringdescription : Stringvalency : {opportunity, problem, crisis}commonFrequency : {exceptional, rare, occasional, frequent}commonUrgency : {low, medium, high}n recorded : Date
Stimulus
i ...
DecisionProcess
Figure 4: Conceptualization of ‘stimulus’
To enable multi-perspective analyses of organizational decision processes, it is necessaryto integrate the concepts of a decision and a decision process in the context of anenterprise (Req. 7). Figure 5 presents an initial integration with existing modelinglanguages of MEMO and it introduces further domain-specific concepts. Reusedmodeling concepts from existing modeling languages are marked by a colored rectangleattached to the meta type (as suggested in [Fra08]). Decision processes can be related tovarious organizational units (e.g., single units such as positions, boards, or committees)by means of the association ParticipationRelation. This relationship offers attributes fordocumenting and managing desired charactistics of this participation. It can be specifiedwhether a specific organizational unit may authorize the final decision(entitledToAuthorizeFinalDecision), and whether participation of a specific unit isregarded as mandatory or advisable (participationDue, participationSuggested). Forpurposes of documentation, at the instance level, it can be recorded that a specificorganizational unit has participated in a particular decision process (participatedIn).Similarly, the concept ‘decision’ can be linked to organizational units at instance level todocument the stakeholders who have authorized a particular decision(AuthorizationRelation). To enable analyses as outlined in Section 4, IS can be linkedwith decision processes in two different ways. First, the concept InformationNeed isoffered (Req. 9). Information needs can be raised by decision process types. Theassociation InformationNeedSatisfactionRelation can be used to express the degree towhich IS satisfy these needs. Second, the association SupportiveMeansRelation enablesto model that an IS represents a supportive means for a decision processes type (Req.10). Furthermore, key determinants for describing decision problems (Req. 6) can be
61

modeled using the concepts AbstractGoal (and its specializations), EnvironmentalFactorand CourseOfAction. It is suggested to relate these concepts to decision processesthrough a specific RelevanceRelation. The conceptualization of this relationship isintended to be augmented in future work.
...
i Decision
0..1
0..*
0..*
1..*
entitledToAuthorizeFinalDecision : BooleanparticipationDue : BooleanparticipationSuggested : Affirmationn participatedIn : Boolean
ParticipationRelation
0..1
0..*
0..1
0..*
Board Committee
1..* 1..*
SingleUnit
i1..1
perceivedDegreeOfSatisfaction : {low, medium, high}
InformationNeedSatisfactionRelation
1..1
1..1
0..*
0..*raises
0..*
name : Stringdescription : StringinformationSpecification : InformationSpec
InformationNeed
0..*
provides
0..*
0..*
0..*0..*
0..*i AuthorizesRelation
0..*
i
1..1
i
hasre-
sultedfrom
i
SymbolicGoal DecisionGoalEngagementGoal
presumedPredictability : {low, medium, high}
EnvironmentalFactorCourseOfAction
AbstractGoal
0..*
0..*
1..1
0..1
0..1
0..1
GOALML
ORGML RESML
ITML
...
DecisionProcess
RelevanceRelation
1..10..*
perceivedUtility : {low, medium, high}
SupportiveMeansRelation
Information
InformationSystem0..* 1..1
1..1
1..1
Figure 5: Further key concepts and integration in the context of an enterprise2
6 Related Work
Related work can roughly be categorized into two categories: Research on modelinglanguages for processes and research on formal decision modeling. The former focuseson dynamic abstractions, such as modeling languages for describing business processesor workflows. These languages typically offer branch elements, which divide a path ofexecution into several paths. Branch elements, in which only a subset of outgoing pathsmay be selected for further execution, are often directly or indirectly labeled as decisions[e.g., Ob11, p. 37]. The prime purpose of branching decisions is to serve as control flowelements. They are not intended to enable management of organizational decisionprocesses, since they neither model decisions as social processes involving differentactors, nor integrate these processes in the organizational and technological environmentof an enterprise. The latter category of related work, formal decision modelingapproaches, are proposed in the fields of prescriptive decision theory, appliedmathematics, and business administration. These approaches conceive a decision as achoice among given alternatives and develop mathematical-statistical means ofidentifying an ‘optimal’ alternative [Ra70; BCK08]. To this end, these approachesmathematically describe particular decision situations in terms of alternatives, goals,environmental states, and outcomes. Building on these formalizations, they providemethods for maximizing quantitative figures such as expected values or risk utilityvalues [Ra70; Ma99]. These approaches do not intend to support the documentation andanalysis of organizational decision processes beyond the scope of particular decisionsituations. They largely abstract from the organizational system decisions are embedded
2 Note that constraints such as ’a ParticipationRelation must be linked to exactly one SingleUnit, Board, orCommittee’ are omitted in the meta model. They are part of the full language specification as OCL statements.
62
in [Be96, p.212]. In particular, these proposals do not support assessing decisionprocesses in relation to, e.g., organizational units and IS. Overall, to the best of ourknowledge, there is no method directly comparable to the one elaborated in this paper.
7 Conclusions and Future Research
This paper investigates the potentials of an enterprise modeling approach to support themanagement of organizational decision processes and proposes corresponding modelingconstructs as enhancements to existing enterprise modeling methods. The assessmentindicates that enterprise models provide a suitable foundation for establishing andsupporting the dedicated management of organizational decision processes. For example,enterprise models allow for describing key determinants (Req. 6), represent theorganizational context (Req. 7), and provide the foundation to model information needsand supportive means (Req. 9 and 10). Extending the modeling language and providing aprocess model will be subject of future research. Also, as the targeted level of detail inmodeling is rather thorough, attention must be directed to assessing costs and benefits ofapplying the method. To tweak method economy, the set of used modeling conceptscould be reduced or the targeted level of detail could be adapted according to anorganization’s needs. Developing respective guidelines is part of future work as well.
In addition, the proposed approach promises to support at least two more advancedapplication areas. First, enterprise models enriched with details about decision processescan be used as the foundation for advanced management of decision process instances.On the basis of a suitable modeling tool, decision process instances could be monitoredand documented in real time. Second, a modeling environment may be used to enhanceexisting methods for identifying and managing information needs, because it allows todocument information needs beyond the scope of particular IS implementationprojects—which has been found to be a shortcoming of existing methods [SWW11].
References
[BCK08] Bamberg, G.; Coenenberg, A. G.; Krapp, M.: Betriebswirtschaftliche Entscheidungs-lehre. Vahlen, München, 2008.
[Be96] Becker, A.: Rationalität strategischer Entscheidungsprozesse. Ein strukturationstheore-tisches Konzept. Deutscher Universitätsverlag, Wiesbaden, 1996.
[Br80] Bretzke, W.-R.: Der Problembezug von Entscheidungsmodellen. Mohr, Tübingen, 1980.[Da09] Davenport, T. H.: Make Better Decisions. In Harvard Business Review, 2009, 87(11);
pp. 117–123.[FGT12] Frese, E.; Graumann, M.; Theuvsen, L.: Grundlagen der Organisation. Entscheidungs-
orientiertes Konzept der Organisationsgestaltung. Gabler, Wiesbaden, 2012.[Fr10] Frank, U.: Outline of a Method for Designing Domain-Specific Modelling Languages,
ICB Research Report 42, Universität Duisburg-Essen, Essen, 2010.[Fr11] Frank, U.: The MEMO Meta Modelling Language (MML) and Language Architecture.
2nd Edition. ICB Research Report 43, Universität Duisburg-Essen, Essen, 2011.[Fr12] Frank, U.: Multi-perspective enterprise modeling: foundational concepts, prospects and
future research challenges. In Software & Systems Modeling, 2012.
63

[Gä63] Gäfgen, G.: Theorie der wirtschaftlichen Entscheidung. Mohr, Tübingen, 1963.[GK05] Grünig, R.; Kühn, R.: Successful Decision-making. A Systematic Approach to Complex
Problems. Springer, Heidelberg, 2005.[He66] Heinen, E.: Grundlagen betriebswirtschaftlicher Entscheidungen. Das Zielsystem der
Unternehmung. Gabler, Wiesbaden, 1966.[Ho09] Horváth, P.: Controlling. Vahlen, München, 2009.[Ki70] Kirsch, W.: Entscheidungsprozesse. Erster Band: Verhaltenswissenschaftliche Ansätze
der Entscheidungstheorie. Gabler, Wiesbaden, 1970.[Ki71] Kirsch, W.: Entscheidungsprozesse. Dritter Band: Entscheidungen in Organisationen.
Gabler, Wiesbaden, 1971.[Lu06] Luhmann, N.: Organisation und Entscheidung. Verlag für Sozialwissenschaften, Wies-
baden, 2006.[Ma99] March, J. G.: Understanding How Decisions Happen in Organizations. In (March, J. G.
Ed.): The Pursuit of Organizational Intelligence. Blackwell, Malden, 1999; pp. 13–38.[MH07] March, S. T.; Hevner, A. R.: Integrated decision support systems: A data warehousing
perspective. In Decision Support Systems, 2007, 43(3); pp. 1031–1043.[MRT76]Mintzberg, H.; Raisinghani, D.; Théorêt, A.: The Structure of Unstructured Decision
Processes. In Administrative Science Quarterly, 1976, 21(2); pp. 246–275.[Ob11] Object Management Group: Business Process Model and Notation (BPMN). Version
2.0, 2011.[PB81] Pfohl, H.-C.; Braun, G. E.: Entscheidungstheorie. Normative und deskriptive Grundlagen
des Entscheidens. Verlag Moderne Industrie, Landsberg am Lech, 1981.[Ra70] Raiffa, H.: Decision Analysis. Introductory Lectures on Choices under Uncertainty.
Addison-Wesley, Reading, 1970.[Ra77] Radford, K. J.: Complex Decision Problems. An Integrated Strategy for Resolution.
Reston, Reston, 1977.[Sc01] Scheer, A.-W.: ARIS - Modellierungsmethoden, Metamodelle, Anwendungen. Springer,
Heidelberg, 2001.[Sc04] Schweitzer, M.: Gegenstand und Methoden der Betriebswirtschaftslehre. In (Bea, F. X.;
Friedl, B.; Schweitzer, M. Eds.): Allgemeine Betriebswirtschaftslehre. Band 1:Grundfragen. Lucius & Lucius, Stuttgart, 2004; pp. 23–82.
[Si76] Simon, H. A.: Administrative Behavior. A Study of Decision-Making Processes inAdministrative Organization. Free Press, New York, 1976.
[Si77] Simon, H. A.: The new science of management decision. Prentice-Hall, EnglewoodCliffs, 1977.
[SFHK12]Strecker, S.; Frank, U.; Heise, D.; Kattenstroth, H.: MetricM: A modeling method insupport of the reflective design and use of performance measurement systems. InInformation Systems and E-Business Management, 2012, 10(2); pp. 241–276.
[SWW11] Stroh, F.; Winter, R.; Wortmann, F.: Methodenunterstützung der Informationsbedarfs-analyse analytischer Informationssysteme. In WIRTSCHAFTSINFORMATIK, 2011,53(1); pp. 37–48.
[TALS07] Turban, E.; Aronson, J. E.; Liang, T.; Sharda, R.: Decision Support and BusinessIntelligence Systems. Pearson, Upper Saddle River, 2007.
[Th12] The Open Group: ArchiMate® 2.0 specification. Open Group Standard. Van Haren,Zaltbommel, 2012.
[Th74] Thomae, H.: Konflikt, Entscheidung, Verantwortung. Ein Beitrag zur Psychologie derEntscheidung. Kohlhammer, Stuttgart, 1974.
[Kü08] Küpper, H.-U.: Controlling. Konzeption, Aufgaben, Instrumente. Schäffer-Poeschel,Stuttgart, 2008.
[Wi72] Witte, E.: Field Research on Complex Decision-Making Processes - The Phase Theorem.In International Studies of Management & Organization, 1972, 72(2); pp. 156–182.
64

Echtzeitmetamodellierung imWeb-Browser
Michael Derntl, Stephan Erdtmann, Petru Nicolaescu, Ralf Klamma, Matthias Jarke
Lehrstuhl Informatik 5 – Informationssysteme und DatenbankenRWTH Aachen
Ahornstr. 5552056 Aachen, Deutschland
{derntl, erdtmann, nicolaescu, klamma, jarke}@dbis.rwth-aachen.de
Abstract: Modellierung ist ein integraler Bestandteil von Schaffensprozessen invielen Disziplinen. Der Modellierungsprozess wird durch vielfältige Tools unter-stützt, von denen jedoch die wenigsten eine gemeinsame Modellierung durch meh-rere Modellierer ermöglichen und die mittels offener Technologien und Protokollerealisiert sind. Um diese Lücke zu schließen, konzipieren wir in diesem Beitrag einFramework für Echtzeitmetamodellierung, das als Widget-basierte Anwendung re-alisiert wird und ausschließlich auf quelloffenen Programmbibliotheken und breitimplementierten Web-Technologien basiert. Der Beitrag berichtet über eine vorabdurchgeführte Technologiestudie, bei der ein Echtzeitmodellierungstool für einebestimmte Anwendung realisiert und erfolgreich evaluiert wurde. Das Metamodel-lierungsframework wurde durch Abstrahierung und Erweiterung der Technologie-studie auf Metamodellebene konzipiert und soll die Verbreitung von Echtzeitkol-laborationsfunktionen in Web-Anwendungen vorantreiben.
1 Einleitung
Modelle werden bedeutsam durch soziale Prozesse, bei denen die Perspektiven der Be-teiligten einen entscheidenden Einfluss haben [FK98]. Es ist weitgehend bekannt, dassder Erfolg von Informatikprojekten von Analyse- und Entwurfsprozessen abhängig ist,bei denen die Perspektiven möglichst aller Stakeholder berücksichtigt werden sollen.Modellierungstools unterstützen diese sozialen Schaffensprozesse. Die meisten existie-renden Modellierungstools unterstützen asynchrone Kollaboration, d.h. die Modelliererschicken sich ihre Entwürfe und Änderungen zu, um sie zu überarbeiten und zu integrie-ren. Um die mit asynchroner Überarbeitung verbundenen Einschränkungen zurückzu-drängen, setzen sich immer mehr Tools durch, die gleichzeitiges gemeinsames Modellie-ren unterstützen. Diese Idee der gemeinsamen Bearbeitung eines Dokuments mittelsComputerunterstützung ist schon seit der „Mutter aller Demos“ [Le94] von DouglasEngelbart vor fast einem halben Jahrhundert bekannt. Die technischen Voraussetzungen,um diese Idee auf breiter Basis mit Informations- und Kommunikationstechnologie um-setzen zu können, wurden jedoch erst seit etwa Mitte der 1990er Jahre mit der Verbrei-tung des World Wide Web und der Breitbandtechnologie geschaffen. Heute kann manzum Beispiel mit Google Docs, Office365 oder draw.io mit fast beliebig vielen anderen
65
Benutzern unabhängig von deren physischem Ort gemeinsam und gleichzeitig Texteeditieren, Zeichnungen oder Modelle erstellen. Solche technischen Fortschritte bringenviele neue Möglichkeiten zur Kollaboration über das Web, besonders in Disziplinen, indenen enge Zusammenarbeit ein Schlüssel zum Erfolg ist.
Wie eingangs erwähnt, spielt Modellierung für die Informatik eine fundamentale Rolleund gewinnt vor allem als kollaborative Tätigkeit an Bedeutung—siehe z.B. [RKV08].Aber auch in anderen Bereichen, wie etwa in der Geschäftsprozessmodellierung, istKollaboration mittels Computertools unumgängliche Praxis [Ri12]. Es gibt Modellie-rungstools, die kollaborative Modellierung in Echtzeit ermöglichen, sowohl am Desktopals auch im Web. Diese Tools reichen von sehr anwendungsspezifischen (z.B. das Kan-ban Tool1 für Projektmanagement im Team) bis zu völlig methodenfreien Exemplaren(z.B. draw.io, mit dem Symbole aus unterschiedlichen Modellierungssprachen ohnejegliche Einschränkungen kombiniert werden können). Es gibt jedoch, wie der Vergleichexistierender Ansätze später zeigen wird, keine Browser-basierten Tools, die mit einemMetamodellierungsansatz die Schaffung und Verwendung beliebiger Modellierungsnota-tionen mittels Echtzeitkollaboration unterstützen. Ein Framework für solche Tools vor-zustellen ist das funktionale Hauptziel dieses Beitrags.
Es existieren Programmbibliotheken von unterschiedlichen Anbietern, mit denen An-wendungsentwickler relativ mühelos Benutzerschnittstellenelemente in ihre Web-Anwendungen einbauen können, die es mehreren Benutzern erlauben, gleichzeitig aneinem gemeinsamen Dokument zu arbeiten. Der Begriff „Dokument“ als gemeinsamerstelltes digitales Produkt ist hier im weitesten Sinne gemeint; es kann sich dabei umein einfaches Textdokument, jedoch auch um ein virtuelles 3D-Modell eines Gebäudeshandeln. Die bekannteste dieser Programmierbibliotheken ist das Google Drive RealtimeAPI2, welches Mitte 2013 veröffentlicht wurde. Während dies sicherlich ein Anschub fürdie Entwicklung von mehrbenutzerfähigen Web-Anwendungen war, bringen solcheAngebote oft das Problem mit sich, dass sie vom Anbieter als Black Box dargebotenwerden. Entwickler, die solche Bibliotheken verwenden, übertragen damit alle funktio-nale—und gegebenenfalls auch inhaltliche—Kontrolle über das Funktionieren ihrerAnwendung an den Anbieter, in diesem Beispiel an Google. Der Anbieter kann jederzeitdie Programmierschnittstellen verändern, oder noch problematischer, plötzlich ersatzlosdas Angebot einstellen, wie die kürzlich erfolgte ersatzlose Entfernung des Google Rea-der gezeigt hat. Eine nachhaltige Lösung für Probleme dieser Art besteht darin, quellof-fene Programmierbibliotheken mit der Entwicklergemeinschaft zu teilen und die Infra-struktur auf ein Fundament zu stellen, das sich offener Technologien und Standardsbedient. Dies ist der nichtfunktionale Eckpfeiler des Frameworks in diesem Beitrag.
Dieser Beitrag ist wie folgt strukturiert. Im zweiten Abschnitt werden Begrifflichkeitenund Konzepte der Metamodellierung dargelegt und die Charakteristika von Echtzeitkol-laborationssystemen vorgestellt. Basierend auf diesen Eckpfeilern stellen wir im drittenAbschnitt eine Technologiestudie eines Echtzeitkollaborationssystems für einen konkre-ten Anwendungskontext vor, um auf Basis der technologischen und benutzerorientiertenImplikationen dieser Technologiestudie das System vom konkreten Anwendungskontext
1 http://kanbantool.com/2 https://developers.google.com/drive/realtime/
66

im vierten Abschnitt zu abstrahieren zu einem Metamodellierungsframework. DieseAbstrahierung ist der konzeptionelle Kern dieses Beitrags. Der fünfte Abschnitt grenztdas vorgestellte Framework von existierenden Ansätzen ab und der letzte Abschnitt fasstden Beitrag zusammen und gibt einen kurzen Ausblick auf zukünftige Forschung.
2 Theoretischer Hintergrund
2.1 Konzeptionelle Metamodellierung
Ein konzeptionelles Modell besteht aus Objekten und Beziehungen zwischen diesenObjekten [Ol07], welche den für den Modellierer relevanten System- bzw. Realitätsaus-schnitt repräsentieren. Für die Erstellung eines Modells wird vom Modellierer die dafürbestimmte Notation einer Modellierungssprache benutzt. Diese wiederum wird durch dasMetamodell definiert. Das „Diamantmodell“ der Metamodellierung [JKL09] schlägt vor,bei Metamodellierungstechniken die Aspekte Notation (welche Notationen werden be-nutzt um bestimmte System- und Umgebungsaspekte zu repräsentieren?), Ontologie(welchen Ontologien unterliegen der Systemdomäne?) und Prozess (welche Prozessebestimmen die Ableitung, Bewertung und Validierung von Modellen) zu unterscheiden,sowie den Zielaspekt, der die Entscheidungen in den ersten drei Aspekten bestimmt. DerSchwerpunkt des vorliegenden Beitrags liegt nach dieser Klassifikation auf der notation-sorientierten Metamodellierung, da wir Notationssysteme definieren wollen.
Jede Modellierungssprache hat eine (unter Umständen implizite) Syntaxdefinition, wel-che die Elemente und ihre Notation beschreibt, sowie eine Semantikdefinition, welchedie Bedeutung dieser Elemente beschreibt. Die Syntaxdefinition unterscheidet einenabstrakten und einen konkreten Teil. Der abstrakte Teil definiert die Elemente der Spra-che und deren Eigenschaften. Regeln zur Notation und Verwendung bzw. Zusammenset-zung dieser Elemente zu Modellen (die Modellierungsmethode) sind im konkreten Teildefiniert. Das Metamodell repräsentiert die abstrakte Syntax der Modellierungssprache,d.h. ein Element in einem Modell repräsentiert eine Instanz eines Elements im Metamo-dell. Da ein Metamodell ebenso ein Modell ist, kann es seinerseits durch ein Meta-Metamodell definiert werden. Durch Fortführung dieses Gedankenexperiments könnenbeliebige Metahierarchien von Modellen erzeugt werden. Ein Beispiel solcher Mehrebe-nen-Metamodellierungsarchitekturen ist die Meta Object Facility (MOF). Der Metamo-dellierungsansatz bietet auch die Basis für die Entwicklung von Graph-basierten Bear-beitungstools zur Erzeugung von Diagrammen.
Beim Modellerstellungsprozess unterscheidet man aus Benutzersicht zwei unterschiedli-che Bearbeitungsansätze, nämlich freihändiges und strukturiertes Bearbeiten [Mi07].Freihändiges Bearbeiten bietet dem Modellierer die Möglichkeit, alle verfügbaren Mo-dellelemente beliebig zu kombinieren, beispielsweise in der UML ein Klassensymbolmittels einer Kompositionsbeziehung mit einem Aktivitätssymbol zu verbinden. Diesermöglicht natürlich die Erstellung syntaktisch inkorrekter Modelle. Demgegenübererlaubt strukturiertes Bearbeiten dem Modellierer ausschließlich, ein korrektes Modell inein anderes korrektes Modell zu überführen durch eine Modellierungsoperation.
67
2.2 Echtzeitkollaborationssysteme
Ein Echtzeitkollaborationssystem ist eine Computeranwendung, die es einer Gruppe vonBenutzern ermöglicht, gleichzeitig an einem gemeinsamen Dokument zu arbeiten[EG89, Gr94]. Wir werden in diesem Beitrag den Fokus auf jene Echtzeitkollaborations-systeme legen, die örtlich verteilte Kollaboration ermöglichen und Internetprotokolle alsKommunikationsmedium verwenden. In einem Echtzeitkollaborationssystem wird jedeOperation eines Benutzers (z.B. das Einfügen einer Klasse in ein Klassendiagramm) zuallen anderen Benutzern propagiert, sodass dort der Eindruck entsteht, in Echtzeit ge-meinsam an einem Modell zu arbeiten. Ein solches System benötigt neben Mechanismenzur Propagierung von Operationen auch solche zur Wahrung der Konsistenz des Mo-dells. Um den Eindruck der Echtzeitkollaboration entstehen zu lassen, sollte ein solchesSystem nur geringe Latenz zwischen Ausführung einer Operation und der Darstellungdes Ergebnisses dieser Operation bei allen Benutzern aufweisen. Es wird daher übli-cherweise jede Operation zuerst unmittelbar lokal ausgeführt und danach bzw. nebenläu-fig an die Kollaborateure versendet, etwa mit einer Broadcastnachricht.
Herausforderungen. Die Umsetzung solcher Systeme trifft auf erhebliche Herausforde-rungen bei der Sicherstellung der Konsistenz der verteilten Modellkopien. Inkonsistenzkann nach [SE98] entweder durch Divergenz oder durch Kausalitätsverletzung entste-hen: Ausgehend von der Annahme, dass Operationen bei allen Kollaborateuren in Emp-fangsreihenfolge ausgeführt werden, tritt Divergenz dann auf, wenn die Reihenfolgenichtkommutativer Operationen an zwei empfangenden Stellen unterschiedlich ist, z.B.wenn während des Propagierens der Operation über das Netzwerk die Reihenfolge ver-tauscht wird. Die finalen Modellkopien der Kollaborateure sind dann nicht identisch.Kausalitätsverletzung tritt auf, wenn Operationen bei den Kollaborateuren in einer nicht-kausalen Reihenfolge ausgeführt werden. Ein Kollaborateur kann hierbei unter Umstän-den den Effekt einer Operation sehen, bevor er die Ursache dafür gesehen hat.
Konfliktbehandlung. Es gibt zwei grundlegende Kategorien von Möglichkeiten, dieseProbleme zu lösen, nämlich Konfliktvermeidung [XZS00] und Konfliktresolution[Su98]. Konfliktvermeidung verhindert, dass Konflikte auftreten, etwa indem mehrereBenutzer nicht gleichzeitig die gleiche Stelle im Dokument bearbeiten dürfen. Dies bie-tet Vorteile bezüglich Rechen- und Kommunikationsintensität, untergräbt jedoch dieGrundidee der Echtzeitkollaboration. Demgegenüber verhindern Ansätze zur Konfliktre-solution nicht, dass Konflikte auftreten, sondern sie lösen auftretende bzw. bereits aufge-tretene Konflikte durch geeignete Mechanismen auf. Eine der wichtigsten Konfliktreso-lutionstechniken, die heute in Verwendung sind—z.B. in Google Docs und ApacheWave—ist Operational Transformation (OT) [EG98, Su98]. OT ist eine Technik, welcheOperationsparameter anpasst, um Konflikte aufzulösen, z.B. die Verschiebung des Posi-tionsparameters einer Einfügeoperation bei einer „gleichzeitig“ auftretenden Löschope-ration. Um dies zu sicherzustellen, bedient sich ein OT-System aus zwei Funktionsgrup-pen, nämlich aus den Kontrollalgorithmen, die anhand einer gegebenen Operationsmen-ge entscheiden, welche Operationen eine Transformation benötigen, und den Transfor-mationsfunktionen, welche diese Transformationen anschließend durchführen. DerGroßteil der Forschung auf diesem Gebiet widmet sich Konflikten bei gleichzeitigerTextbearbeitung. Texte, die aus einer linearen Sequenz von Zeichen bestehen, sind ein-
68

fach zu adressieren. Sie sind logisch jedoch anders aufgebaut als Modelle, die multidi-mensionale logische Abhängigkeiten beinhalten können. Lösungen dafür existieren je-doch, z.B. in [Fa11] oder [SC02].
Architekturvarianten. Echtzeitkollaborationssysteme werden entweder mittels einerzentralisierten oder eine replizierten (dezentralen) Architektur realisiert. Die zentralisier-te Architektur [SC02] ist eine Client/Server-Architektur, in der alle Clients ihre Operati-onen an einen Server senden, der für die Dokumentstatusverwaltung und Konfliktresolu-tion zuständig ist. Im Gegensatz dazu folgt die replizierte Architektur den Prinzipieneines Peer-to-Peer-Netzwerks, in dem jeder Knoten eine Kopie des gemeinsamen Mo-dells hält, die lokalen Operationen mittels Broadcast verteilt und eigenständig für dieKonfliktresolution zuständig ist. Beide Architekturvarianten haben Vor- und Nachteile,wobei die replizierte Variante den entscheidenden Vorteil hat, dass es keinen „Flaschen-hals“ in der Kommunikation gibt.
3 Technologiestudie: SyncLD
Gesamtziel dieses Beitrags ist es, ein Framework für Echtzeitkollaboration an Metamo-dellen sowie Modellen zu entwerfen. Wie später im Abschnitt 4 beschrieben, können dieModellierungstools dabei aus dem Metamodellierungstool heraus instanziiert werden.Die Basis für das Modellierungstool als auch für das Metamodellierungstool ist ein Dia-grammeditor, der die Funktionen eines Echtzeitkollaborationssystems implementiert.Einen solchen Echtzeitdiagrammeditor haben wir als Technologiestudie für einen kon-kreten Anwendungsfall implementiert um zu ermitteln ob so eine Anwendung für Be-nutzer sinnvoll und auf Basis existierender offener Technologien machbar ist. Auf Basisder technischen und benutzerbezogenen Erkenntnisse dieser Technologiestudie wurdendie funktionalen Anforderungen für das Metamodellierungsframework definiert, das imfolgenden Abschnitt 4 beschrieben ist.
3.1 Anwendungskontext
In vielen Disziplinen ist die Verwendung von Kollaborationstools üblich, speziell inForschung und Entwicklung oder in der Wirtschaft. Es gibt jedoch auch viele Communi-ties, die „immun“ gegen solche Tools zu sein scheinen. Eine solche Community ist dieder Lerndesigner. Lerndesigner gestalten Lehr-/Lernprozesse, und obwohl professionel-les Lerndesign zumeist ein kollaborativer Prozess ist, haben sich unter den Lerndesig-nern entsprechende Tools nicht durchgesetzt [DSO11]. Dies gilt speziell für Europa, wodas in den USA stark professionalisierte instructional design als Disziplin nicht breit Fußgefasst hat. Aufgrund langjähriger öffentlicher Förderung ist in Europa jedoch die For-schung im Bereich Lerndesign sehr stark, speziell im Bereich der formalen Beschreibungvon Lehr-/Lernarrangements. Die einzige verfügbare umfangreiche formale Spezifikati-on für Lerndesign ist IMS Learning Design (IMS LD) [IMS03]. Diese Spezifikationerlaubt es Lerndesignern, ihre Lerndesigns als sogenannte Lerneinheiten formal undmaschinenlesbar mittels eines XML-Dialektes zu beschreiben. Eine Lerneinheit kanndabei eine ganze Lehrveranstaltung, ein Kurzseminar, oder aber auch eine Lernepisode
69

von wenigen Minuten sein. Die wichtigsten Konzepte des Metamodells von IMS LDsind in Abbildung 1 dargestellt. Das Metamodell wurde in Anlehnung an eine Theater-metapher mit Konzepten wie Akt (act), Rolle (role) und Auftritt (role-part) versehen.
Abbildung 1: Kern des IMS Learning Design Metamodells.
Natürlich schreiben Lerndesigner die XML-Datei, die ihre Lerneinheit beschreibt, nichtper Hand, sondern sie verwenden spezielle Autorentools. Die damit erzeugten Lernein-heiten können dann in beliebigen IMS-LD-kompatiblen Laufzeitumgebungen importiertund ausgeführt werden. Die meisten Autorentools sind Desktopprogramme, es gibt we-nige Web-Anwendungen dafür. Obwohl es Autorentools gibt, die Import und Export vonLerndesigns von bzw. zu diversen Onlinerepositorien ermöglichen, gab es bisher keinAutorentool, das Kollaboration in angenäherter Echtzeit unterstützt. Um diese Lücke zuschließen, haben wir ein Autorentool namens SyncLD (steht für „Synchrones Lernde-sign“) entwickelt, das Kollaboration mehrerer Lerndesigner an Lerneinheiten im Web-Browser ermöglicht. Die Implementierung erfolgte dabei derart, dass spätere Abstraktionvon der konkreten Anwendung IMS LD auf beliebige Metamodelle möglich ist (sieheAbschnitt 4). Die vollständigen technischen Details von SyncLD sind in [NDK13] be-schrieben. In den folgenden Unterabschnitten werden wir kurz die grundlegen Konzepteund Ergebnisse in einem Detailierungsgrad beschreiben, der es ermöglicht, die darauf-folgende Abstraktion auf die Metamodellierungsebene zu verstehen.
3.2 Systembeschreibung
SyncLD wurde als Widget-basierte Anwendung konzipiert. Ein Widget ist eine Anwen-dung, die einen wohldefinierten und typischerweise limitierten Funktionsumfang bietet,und die mit anderen Widgets zu einer komplexeren Anwendung zusammengefügt wer-den kann [Go11]. In SyncLD wurde dieser Benutzerschnittstellenansatz verwendet, da ereinerseits plattformunabhängig in allen gängigen Web-Browsern lauffähig ist, und nebendem SyncLD-Widget weitere Widgets, welche die Kollaboration unterstützen, einge-bunden werden können (z.B. Chat- oder Videokonferenz-Widgets).
Das IMS LD Metamodell wurde aktivitätsbasiert in SyncLD umgesetzt, d.h. den Kerndes Modells einer Lerneinheit bildet eine Folge von Aktivitäten, die visuell ähnlich ei-nem UML-Aktivitätsdiagramm dargestellt werden, und die dann mittels unterschiedli-
70

cher Registerkarten mit den anderen Elementen der Lerneinheit verknüpft werden kön-nen. Ein Beispiel dafür in SyncLD ist in Abbildung 2 zu sehen. Benutzer 1 (überlagertesBrowserfenster oben) modelliert die Aktivitäten, während der Benutzer 2 (unteres Brow-serfenster) gleichzeitig die Eigenschaften einer oder mehrerer dieser Aktivitäten ausfüllt.Durch diese Aufgabentrennung bei Echtzeitkollaboration können Modellierungsschritte,die sonst sequenziell durchgeführt werden müssen, parallel von mehreren Benutzerngleichzeitig erledigt werden, was den Modellierungsprozess effizienter und unter Um-ständen durch zusätzliche Kommunikation auch effektiver macht.
Abbildung 2: Browserfenster zweier kollaborierender Benutzer
Das Fundament der technischen Infrastruktur von SyncLD bildet das quelloffene ROLESDK3, eine Programmsammlung für Widget-basierte Web-Anwendungen. Das ROLESDK wurde deshalb ausgewählt, weil es eine Menge von Konzepten und Technologienbietet, die für SyncLD vorteilhaft sind, vor allem das Konzept der Widget-Spaces. EineInstanz eines Widget-Space bietet einen Container zum Darstellen von mehreren Wid-gets und ergänzt diesen um Schnittstellen für Kommunikation zwischen Widgets, Benut-zerverwaltung, –authentifizierung und –autorisierung, sowie Datenverwaltung. EineAnwendung, in der Funktionalität auf Widgets aufgeteilt ist, und in der mehrere Benut-
3 http://sourceforge.net/projects/role-project/
71

zer über unterschiedliche Instanzen dieser Widgets zusammenarbeiten, erfordert Kom-munikation zwischen den Widgets—die sogenannte Widget-zu-Widget-Kommunikation[Go11]. Diese umfasst einerseits lokale browserinterne Kommunikation zwischen denverschiedenen Widgets der Benutzeroberfläche, andererseits die globale browserüber-greifende Kommunikation zwischen Widgets unterschiedlicher Benutzer. Ein lokalesWidget agiert dabei als Gateway für den globalen Datenaustausch, indem eingehendeNachrichten über lokale Widget-zu-Widget-Kommunikation an die entsprechendenWidgets weitergeleitet werden. Das ROLE SDK beinhaltet eine Implementierung dieserWidget-zu-Widget-Kommunikationsmechanismen auf Basis von HTML5 Web Mes-saging [W3C11] und des Extensible Messaging and Presence Protocol (XMPP) [Sa11].Es ermöglicht Benutzerauthentifizierung und –autorisierung mittels OpenID und OAuth.
Für SyncLD wurde das quelloffene OpenCoWeb Operational Transformation (OT) En-gine API4 mit dem ROLE SDK integriert, um dezentral Konfliktresolution zu betreiben.Wenn ein Benutzer einer Modellierungssitzung beitritt, wird jeweils der Status der ge-meinsamen Sitzung repliziert. Die Clients propagieren mittels Broadcast deren Modellie-rungsoperationen an alle anderen Benutzer und die Konfliktresolution mittels OT wirdauf Empfängerseite auf dem dortigen Sitzungsreplikat durchgeführt. Eine Modellie-rungsoperation ist hier jede Änderung des Modells, sei es z.B. durch Einfügen einerAktivität, durch Auswahl einer Option in einer Dropdown-Box, oder durch Tippen bzw.Löschen eines Buchstabens in einem Textfeld.
3.3 Evaluierung
SyncLD wurde mit Partnern des Projects METIS5, das integrierte Lerndesignumgebun-gen entwickelt und im EU-Programm für lebenslanges Lernen mitfinanziert wird, evalu-iert. In fünf Sitzungen mit jeweils vier zusammenarbeitenden IMS LD Autoren, wur-den—teils durch eine nebenläufige Audiokonferenz unterstützt—die Funktionen desTools nach einem gegebenen Evaluierungsprotokoll getestet. Die detaillierten Evaluie-rungsergebnisse sind in [NDK13] zusammengefasst. Hier wollen wir jene Ergebnissehervorheben, die für das Metamodellierungsframework in Abschnitt 4 relevant sind.
Die Evaluierung hatte eine technische und eine benutzerorientierte Komponente. Dietechnische Systemevaluierung wurde durchgeführt, um zu prüfen, ob die Implementie-rung der Echtzeitfunktionen und vor allem der Konfliktlösung durch OT funktionieren.Das Ergebnis war, dass alle replizierten Kopien der Modelle kongruent waren. Die be-nutzerorientierte Evaluierung zeigte einerseits, dass die Teilnehmer die Web-basierteAutorenumgebung gegenüber einer Desktopanwendung bevorzugen und dass die Echt-zeitkollaboration als sehr nützliche Funktion empfunden wurde. Die Evaluierung zeigteaber auch durch Mehrfachnennung in den offenen Kommentaren der Teilnehmer, dassdie Kollaboration mit SyncLD zwei wesentliche Probleme hat. Erstens war den Model-lierern nicht immer klar, woran die anderen Modellierer im Moment arbeiten, was auchdurch einen zusätzlichen Kommunikationskanal wie einer Audiokonferenz nicht voll-ständig kompensiert werden konnte. Zweitens war den Benutzern nicht klar, wie Sie den
4 https://github.com/opencoweb/coweb-jsoe5 http://www.metis-project.org/
72

Autorenprozess mittels der Benutzerschnittstelle von SyncLD sinnvoll in einzelne Bear-beitungsschritte auftrennen sollten. In den Modellierungssitzungen hat ein Benutzerjeweils die Moderatorenrolle übernommen um die anderen Benutzer anzuleiten und dieSitzung zu steuern. Die Summe aus positiven und kritischen Rückmeldungen währenddieses Evaluierungsprozesses war die Ausgangsmotivation für die Konzeption des imnächsten Abschnitt vorgestellten Metamodellierungsframeworks. Die positiven Aspektesollten bei der Abstrahierung von der konkreten Anwendung (IMS LD Modelle) beibe-halten werden, um zugleich die kritisierten Aspekte durch geeignete Mechanismen imFramework auszubessern.
4 Framework für Echtzeitmetamodellierung
Kern des Frameworks in diesem Abschnitt ist ein Modellierungstool, das es ermöglicht,sich selbst mittels eines Metamodellierungsansatzes zu instanziieren um Modelle derdefinierten Sprachen gemeinsam in Echtzeit bearbeiten zu können. In den Unterabschnit-ten behandeln wir Anforderungen, Architektur und Implementierung des Frameworks.
4.1 Anforderungen
Die Anforderungen betreffen die zwei Hauptkomponenten des hier vorgestelltenFrameworks. Einerseits das Kollaborationstool, das kollaborative Modellierung naheEchtzeit ermöglichen soll, und den Kollaborationstoolgenerator, eine Instanz des Kolla-borationstools, der verwendet wird, um ein Kollaborationstool für eine bestimmte Mo-dellierungssprache zu erzeugen. Wie in Abbildung 3 illustriert, lassen sich mit den bei-den Hauptkomponenten des Frameworks die Rollen des Modellierungsprozesses assozi-ieren, welche die jeweiligen Komponenten benutzen. Im ersten Schritt generieren Meta-modellierer nach Spezifizierung der abstrakten und konkreten Syntax einer Modellie-rungssprache ein Kollaborationstool für diese Sprache, das die Modellierer dann zurBearbeitung von Modellen dieser Sprache verwenden können. Für das Kollaborations-tool wurden folgende Anforderungen definiert:
Modellierung: Ein Modellierer kann ein Graph-basiertes Diagramm als visuelle Re-präsentation einer definierten Modellierungssprache erstellen. Er kann Knoten undKanten hinzufügen, verschieben, löschen, sowie deren Eigenschaften bearbeiten.
Echtzeitkollaboration: Mehrere Modellierer können zusammen an einem gemeinsa-men Modell arbeiten unabhängig von ihrem physischen Ort. Die Änderungen jedesBenutzers werden dabei zu den anderen Benutzern propagiert, Konflikte aufgelöst,und visuell dargestellt.
Änderungshistorie: Eine Historie aller Änderungen wird gepflegt und allen Benut-zern dargestellt. Benutzer können Undo- und Redo-Funktionalität abrufen.
Awareness: Um die gemeinsame Modellierungssitzung besser moderieren zu können,sollen die Benutzer Awareness (ein Begriff aus der CSCW-Forschung [DB92]) überdie teilnehmenden Modellierer und deren aktuelle Aktionen erfahren. EntsprechendeInformation soll jederzeit sichtbar dargestellt werden.
73

Modellexport: Das Modell soll jederzeit, sofern es die Syntax der Modellierungsspra-che nicht verletzt, in maschinenlesbarer Form exportiert werden können. Für den Pro-totypen wird sich diese Anforderung auf einen Bildexport beschränken.
Der Kollaborationstoolgenerator ist eine Instanz des Kollaborationstools mit vorgegebe-ner Modellierungssprache. Er erbt damit dessen funktionale Anforderungen und erwei-tert diese wie folgt:
Metamodelldefinition: Metamodellierer sollen das Metamodell einer abstrakten Syn-tax einer visuellen Sprache, für die eine Instanz des Kollaborationstools erzeugt wer-den soll, mittels eines UML-Klassendiagramms definieren können.
Konkrete Syntaxdefinition: Die visuelle Erscheinung der Knoten und Kanten derModellierungssprache soll entweder durch eine einfache Formbeschreibungsspracheoder durch Auswahl vordefinierter Symbole definiert werden können.
Kollaborationstoolgenerator: Metamodellierer können jederzeit, sofern das definier-te Metamodell in einem korrekten Zustand ist, die Generierung eines Kollaborations-tools für dieses Metamodell anstoßen.
Abbildung 3: Anforderungen eingebettet im Metamodellierungsprozess.
4.2 Systemarchitektur
Die schematisch in Abbildung 4 dargestellte Architektur des vorgestellten Frameworksist unterteilt in eine Metamodellierungsebene (links im Bild) und eine Modellierungs-ebene (rechts im Bild). Konzeptionell unterscheiden sich die beiden Ebenen nur gering-fügig, da der Kollaborationstoolgenerator auf der Metaebene selbst eine Instanz desKollaborationstools ist. Daher wird im Folgenden zuerst die Umsetzung der Modellie-rungsebene erläutert, die analog für die Metamodellierungsebene gilt. Anschließend wirdauf Besonderheiten der Metamodellierungsebene eingegangen.
74

Abbildung 4: Architektur des Echtzeitmetamodellierungsframeworks
Die Architektur fußt grundlegend auf Technologien, die in SyncLD eingesetzt sind undim Abschnitt 3.2 beschrieben sind. In der Symbolik der Abbildung werden weiß gefüllteSymbole „wiederverwendet“, d.h. sie werden von SyncLD übernommen. Die grau ge-füllten Symbole werden darauf aufsetzend für das Framework neu implementiert. DasKollaborationstool lässt sich als Web- und Widget-basierte Anwendung plattform-unabhängig ohne Installations- oder Wartungsaufwand verwenden, was auch die Einbin-dung und Wiederverwendung des Tools in verschiedene Umgebungen ermöglicht. An-ders als bei SyncLD, das ebenfalls Widget-basiert realisiert wurde, werden hier die ver-schiedenen Komponenten der Benutzeroberfläche über mehrere Widgets verteilt, sodasszum einen der Benutzer diese individuell anpassen kann und zum anderen verschiedeneAnsichten des Modells parallel betrachtet werden können (siehe Abbildung 5). Nebenden üblichen Elementen eines graphischen Editors wie der Arbeitsfläche und einemWerkzeugpanel, erlaubt ein Objekteigenschaftenwidget die Manipulation der Attributeverschiedener Komponenten des in Bearbeitung stehenden Modells. Eingehend auf Be-nutzerwünsche während der SyncLD-Evaluierung sorgt ein Awarenesswidget für bessereOrientierung, indem es die ausgeführten Aktionen aller Kollaborateure darstellt.
In dem Framework liefert die Implementierung der globalen Widget-zu-Widget-Kommunikation im ROLE SDK so wie in SyncLD die Basis für Propagierung der loka-len Änderungen am Modell an die Kollaborateure. Für diesen Zweck wird wie in Syn-cLD eine replizierte Architektur mit Konfliktresolution basierend auf Operational Trans-formation (OT; s. Abschnitt 2.2) verwendet. Die Gefahr eines Flaschenhalses, die beieiner zentralisierten Architektur besteht, wird somit vermieden. Weiterhin kann durchdie Methode der Konfliktresolution jeder Benutzer jederzeit jeden Teil des Modellsuneingeschränkt bearbeiten, so wie man es von Einzelbenutzeranwendungen kennt. DerAspekt der größtmöglichen Freiheit im Bearbeitungsprozess wird auch bei der Wahl desBearbeitungsschemas verfolgt. Eine freihändige Bearbeitungsmöglichkeit des Modells
75

bildet die Grundlage. Es kann darauf aufbauend strukturiertes Bearbeiten realisiert wer-den durch situationsabhängige Einschränkung der erlaubten Modellierungsoperationen.
Abbildung 5: Mockup der Benutzerschnittstelle des Kollaborationstools.
Abbildung 6: Mockup der Benutzerschnittstelle des Kollaborationstoolgenerators.
Auf der Metamodellierungsebene wird die visuelle Modellierungssprache, für die einKollaborationstool erzeugt werden soll, definiert. Diese Definition umfasst die Beschrei-bung der abstrakten und konkreten Syntax. Erstere wird durch ein Metamodell beschrie-ben, das kollaborativ von mehreren Benutzern erstellt werden kann. Im Detail wird dafüreine in [Mi07] beschriebene Repräsentation des Metamodells, d.h. der Objekte und Be-ziehungen der Modellierungssprache, als UML-Klassendiagramm verwendet. Für dieSpezifikation der konkreten Syntax des Sprache bietet der Kollaborationstoolgeneratoreine zusätzliche Komponente für die Festlegung der visuellen Erscheinung der Objekteund Beziehungen des Notation mit Hilfe einer Formbeschreibungssprache wie SVG oderals Auswahl aus vordefinierten Formen ermöglicht (s. Abbildung 6).
4.3 Implementierung
Das Modellierungsframework wird clientseitig auf Basis der aktuellen Web-Technologien HTML5, CSS3 und JavaScript umgesetzt und orientiert sich an der Code-Basis des SyncLD Tools. Wie bei SyncLD basiert auch die Infrastruktur des Modellie-
76

rungsframeworks auf dem ROLE SDK bzw. insbesondere auf dem Konzept der Widget-Spaces. Als Operational Transformation Bibliothek wird die bereits beim SyncLD-Toolverwendete OpenCoWeb OT JavaScript Engine verwendet. Für die Benutzerauthentifi-zierung wird das vom ROLE SDK bereitgestellte entsprechende auf OAuth basierendeModul verwendet. Als Datenspeicher für die von den Benutzern erstellten Modelle sowiefür den mit dem Kollaborationstoolgenerator erzeugten Quellcode wird der über eineREST API zugreifbare Datenspeicher des ROLE SDK verwendet. Als Datenformat fürdie erzeugten Modelle dient dabei die JavaScript Objektnotation (JSON). Die Implemen-tierung des Frameworks ist noch nicht abgeschlossen; es sollten jedoch durch die voran-gegangene SyncLD-Technologiestudie in einem realen Anwendungsbereich und derstarken Anlehnung der Implementierung an diese Technologiestudie (vgl. Abbildung 4)bei der Fertigstellung keine unüberwindbaren Probleme auftreten.
5 Abgrenzung verwandter Ansätze
Wie in Tabelle 1 ersichtlich, wurden in den letzten Jahren diverse Ansätze und Toolsvorgeschlagen, die vergleichbare Eigenschaften im Schnittstellenbereich Modellierungund Echtzeitkollaborationssysteme haben, wie das von uns vorgeschlagene Framework.Die Spalten in der Tabelle entsprechen jenen aus dem Hauptziel (siehe die Einleitungdes Beitrags) und dem theoretischen Hintergrund (siehe Abschnitt 2) abgeleiteten er-wünschten Charakteristika.
Tabelle 1: Vergleich bestehender Ansätze im Hinblick auf die Zielcharakteristika des Frameworks.
Tool / FrameworkPlattform /
Sprache Dom
änen
-n
eutr
al
Met
amod
el-
lier
un
g
Ech
tzei
tkol
-la
bor
atio
n
Aw
aren
ess
Fre
ihan
db
e-ar
bei
tun
g
Str
uk
turi
erte
Bea
rbei
tun
g
Bro
wse
r-b
asie
rt
Qu
ello
ffen
MetaEdit+ [TPK07] Smalltalk X X X XADOxx [FK13] Gecko / C++ X X X XDiaMeta [Mi07] Java / EMF X X X X X[GBR12] Java / EMF X X X X XTiger [Eh05] Java / EMF X X XAToM³ [LVA04] Python X X X X XGenGED [BEW04] Java X X X XSyncLD [NDK13] ROLE SDK X X X XVorgestelltes Framework ROLE SDK X X X X X X X X
MetaEdit+ [TPK07] ist ein Tool, das die Definition einer Modellierungssprache ermög-licht und darauf aufbauend ein Bearbeitungstool für Modelle der definierten Sprachegeneriert. Domänenspezifische Sprachen können dabei graphisch als Metamodell defi-niert werden ohne jegliche Programmierkenntnisse. Das Bearbeitungstool ermöglicht dasGenerieren von Programmcode und Dokumentation aus den Modellen sowie die Simula-
77

tion des Modellverhaltens. Das Tool wurde in Smalltalk implementiert und ermöglichtden Benutzern sowohl freihändiges als auch strukturiertes Bearbeiten.
Eine der kommerziell erfolgreichsten Metamodellierungsplattformen ist ADOxx [FK13],das die Definition von beliebigen konzeptionellen Modellierungssprachen ermöglichtund ein Bearbeitungstool zur Verfügung stellt. Während MetaEdit+ eher auf den Soft-wareengineering-Prozess getrimmt ist, bietet ADOxx erweiterte Möglichkeiten etwa fürSimulation und Evaluation von Geschäftsprozessen. Die ADOxx Plattform basiert aufder Gecko UI Engine und unterstützt ebenso freihändiges wie strukturiertes Bearbeiten.
DiaMeta [Mi07] ist ein plattformunabhängiges Java-basiertes Framework für die Erzeu-gung von Diagrammeditoren für visuelle Sprachen. Es nutzt Metamodelle zur Spezifika-tion der Modellierungssprachen, wobei die abstrakte Syntax als Klassendiagram definiertwird. Das Framework basiert auf dem Eclipse Modeling Framework (EMF). Ebenfallsauf dem EMF bzw. seiner Modellierungsarchitektur Ecore basierend stellt Gallardo[GBR12] ein weiteres Tool zur Generierung von domänenunabhängigen Modellie-rungswerkzeugen vor. Im Gegensatz zu DiaMeta erlaubt es auch Echtzeitkollaboration.
Einen unterschiedlichen Ansatz zur Definition der Modellierungssprache wählt das TigerProject [Eh05]. Es bietet ein graphisches Tool zur Spezifikation einer Sprache durchSyntaxgrammatiken. Als Benutzerinteraktionsschema verfolgt es die Methode des struk-turierten Bearbeitens, wobei anwendbare gültige Operationen aus den Regeln der zuGrunde liegenden Graphgrammatik abgeleitet werden.
Das AToM³ Metamodellierungsframework [LVA04] erlaubt die Definition von Model-len auf Basis von unterschiedlichen Formalismen sowie die Transformation von Model-len in Modelle gleicher oder unterschiedlicher Formalismen. Basierend auf der Spezifi-kation eines Formalismus kann ein graphisches Tool generiert werden, das die visuelleBearbeitung von Modellen dieses Formalismus ermöglicht. GenGED [BEW04] gestattetebenfalls die graphische Definition von visuellen Sprachen zur Generierung von graphi-schen Editoren für die jeweilig zugrunde liegende Sprache. Modelle können sowohl freials auch strukturiert bearbeitet werden. Die Sprachspezifikation erfolgt mit Hilfe vonGrammatikregeln. Erstellte Modelle lassen sich mit dem Tool simulieren.
Wie der Vergleich in Tabelle 1 zeigt, ist das in dem Beitrag vorgestellte Framework fürEchtzeitmetamodellierung durch eine Kombination aus Eigenschaften alleingestellt. Diesbegründet sich die Unterstützung von Echtzeitkollaboration, Awareness über aktuelldurchgeführte Modellierungsoperationen anderer Benutzer, sowie die Lauffähigkeit imWeb-Browser ohne zusätzliche lokal installierte Programme (Spalte „Browser-basiert“).
6 Zusammenfassung
Dieser Beitrag stellte ein Framework vor, welches es ermöglicht, Echtzeitkollaborations-tools für beliebige konzeptionelle Modellierungssprachen zu generieren und als Widget-basierte Anwendung anzubieten. Modellierer und Metamodellierer können somit ohneSoftwareinstallation oder -wartung gemeinsam und gleichzeitig im Web-Browser an
78

Modellen und Metamodellen arbeiten. Wie der Vergleich bestehender Ansätze in diesemForschungsbereich zeigt, sind die Alleinstellungsmerkmale dieses Frameworks, dass esEchtzeitkollaboration im Web-Browser an Modellen und Metamodellen auf Basis offe-ner Web-Technologien, die in allen gängigen Browsern implementiert sind, ermöglichtund dabei vollständig mit quelloffenen Programmbibliotheken sowie mit Web-Technologien, die in allen gängigen Browsern implementiert sind, realisiert ist.
Das Framework basiert auf einer vorangehenden technologischen Machbarkeitsstudie,bei der ein Echtzeitmodellierungstool für eine Lerndesigner-Community implementiertund erfolgreich evaluiert wurde. Die detailliert im Beitrag vorgestellte technische Infra-struktur für die Echtzeitkommunikation und die dafür erforderliche Konfliktresolution,sowie die aus der Evaluation gewonnen Erkenntnisse dieser Technologiestudie bildendas gefestigte Fundament des Frameworks.
Das langfristige Ziel dieser Forschung ist es, den einfachen Einbau von Echtzeitkollabo-rationsfunktionen in allen Web-Anwendungen, bei denen dies sinnvoll ist, auf Basisoffener, interoperabler Technologien und Protokolle zu ermöglichen, ohne dabei aufBlack-Box-Lösungen kommerzieller Anbieter angewiesen zu sein.
Danksagungen
Diese Arbeit wurde mit Unterstützung der Europäischen Kommission finanziert durchdas Programm für lebenslanges Lernen im Projekt „METIS“ (531262-LLP-2012-ES-KA3-KA3MP – http://metis-project.org), sowie durch das 7. Rahmenprogramm im Pro-jekt „Learning Layers“ (318209 – http://learning-layers.eu). Die Verantwortung für denInhalt dieses Beitrags tragen allein die Verfasser; die Kommission haftet nicht für dieweitere Verwendung der darin enthaltenen Angaben.
Literaturverzeichnis
[BEW04] Bardohl, R.; Ermel, C.; Weinhold, I: GenGED–a visual definition tool for visualmodeling environments. In Pfaltz, J. L.; Nagl, M.; Böhlen, B. (Hrsg.): Applications ofGraph Transformations with Industrial Relevance. Springer, Berlin, 2004; S. 413–419.
[DSO11] Derntl, M.; Neumann, S.; Oberhuemer, P.: Opportunities and challenges of formalinstructional modeling for web-based learning. In: Proc. ICWL 2011, LNCS vol. 7048.Springer, Berlin, 2011; S. 253–262.
[DB92] Dourish, P.; Bellotti, V.: Awareness and coordination in shared workspaces. In: Proc.1992 ACM Conf. on Computer-supported Cooperative Work. ACM, New York, 1992;S. 107–114.
[Eh05] Ehrig, K. et al.: Generation of visual editors as eclipse plug-ins. In: Proc. 20thIEEE/ACM Int. Conf. on Automated Software Engineering. ACM, New York, 2005;S. 134–143.
[EG89] Ellis, C. A.; Gibbs, S. J.: Concurrency Control in Groupware Systems. In: Proc. ACMSIGMOD Int. Conf. on Management of Data. ACM, New York, 1989; S. 399–407.
[Fa11] Fatima, Z. et al.: Group editor using graphical operational transformation. In: Proc. 5th
Nat. Conf. on Computing for Nation Development. IndiaCOM 2011.
79

[FK13] Fill, H.-G.; Karagiannis, D.: On the conceptualisation of modelling methods using theADOxx meta modelling platform. In: Enterprise Modelling and Information SystemsArchitectures, 8(1), 2013.
[FK98] Floyd, C.; Klischewski, R.: Modellierung - ein Handgriff zur Wirklichkeit. Zursozialen Konstruktion und Wirksamkeit von Informatik-Modellen. In: Pohl, K.;Schürr, A.; Vossen, G. (Hrsg.): Modellierung '98. CEUR-WS.org, 1998.
[GBR12] Gallardo, J.; Bravo, C.; Redondo, M. A.: A model-driven development method forcollaborative modeling tools. Journal of Network and Computer Applications, 35(3),2012; S. 1086–1105.
[Gr94] Grudin, J: Computer-supported cooperative work: History and focus. Computer, 27(5),1994; S. 19–26.
[Go11] Govaerts, S. et al.: Towards Responsive Open Learning Environments: The ROLEInteroperability Framework. In: Proc. EC-TEL 2011. Springer, Berlin, 2011; S. 125-138.
[IMS03] IMS Global Learning Consortium: Learning Design Specification. 2003.http://www.imsglobal.org/learningdesign/
[JKL09] Jarke, M.; Klamma, R.; Lyytinen, K.: Metamodeling. In: Jeusfeld, M. A.; Jarke, M.;Mylopoulos, J. (Hrsg.): Metamodeling for Method Engineering. MIT Press, 2009; S.43-88.
[Le94] Levy, S.: Insanely Great: The Life and Times of Macintosh, the Computer thatChanged Everything. Penguin Books, New York, 1994.
[LVA04] de Lara, J.; Vangheluwe, H.; Alfonseca, M.: Meta-modelling and graph grammars formulti-paradigm modelling in AToM³. Software and Systems Modeling, 3(3), 2004; S.194–209.
[Mi07] Minas, M.: Generating meta-model-based freehand editors. Electronic Communi-cations of the EASST, 1, 2007.
[NDK13] Nicolaescu, P.; Derntl, M.; Klamma, R.: Browser-Based Collaborative Modeling inNear Real-Time. In: Proc. IEEE CollaborateCom 2013. IEEE, Los Alamitos, 2013.
[Ol07] Olivé, A.: Conceptual modeling of information systems. Springer, 2007.[Ri12] Rittgen, P.: The role of editor in collaborative modeling. In: Proc. SAC 2012. ACM,
New York, 2013; S. 1674-1679.[RKV08] Renger, M.; Kolfschoten, G. L.; de Vreede, G.-J.: Challenges in Collaborative
Modeling: A Literature Review. Lecture Notes in Business Information Processing,Volume 10, 2008; S. 61-77.
[Sa11] Saint-Andre, P.: RFC 6120: Extensible Messaging and Presence Protocol (XMPP):Core. 2011. http://xmpp.org/
[SC02] Sun, C.; Chen, D.: Consistency maintenance in real-time collaborative graphics editingsystems. ACM Transactions on Computer-Human Interaction, 9(1), 2002; S. 1–41.
[SE98] Sun, C.; Ellis, C.: Operational transformation in real-time group editors: issues,algorithms, and achievements. In: Proc. 1998 ACM Conf. on Computer SupportedCooperative Work. ACM, New York, 1998; S. 59–68.
[Su98] Sun, C. et al.: Achieving convergence, causality preservation, and intentionpreservation in realtime cooperative editing systems. ACM Transactions on Computer-Human Interaction, 5(1), 1998; S. 63–108.
[TPK07] Tolvanen, J.-P.; Pohjonen, R.; Kelly, S.: Advanced tooling for domain-specificmodeling: Metaedit+. In: Sprinkle, J.; Gray, J.; Rossi, M.; Tolvanen, J.-P. (Hrsg.): 7thOOPSLA Workshop on Domain-Specific Modeling, Finland, 2007.
[W3C11] W3C: HTML5 Web Messaging. 2011. http: //w3.org/TR/webmessaging/[XZS00] Xue, L.; Zhang, K.; Sun, C.: Conflict control locking in distributed cooperative
graphics editors. In: Proc. 1st Int. Conf. on Web Information Systems Engineering.IEEE, Los Alamitos, 2000; S. 401–408.
80

DeltaEcore—A Model-Based Delta Language
Generation Framework
Christoph Seidl1, Ina Schaefer2, Uwe Aßmann1
1Software Technology Group
Technische Universitat Dresden
[email protected], [email protected]
2Software Engineering Institute
Technische Universitat Braunschweig
Abstract: Software product lines (SPLs) and software ecosystems (SECOs) representfamilies of closely related software systems in terms of configurable variable assets.Delta modeling is an approach for capturing variability resulting from different con-figurations and for deriving concrete software products of an SPL or SECO throughtransformation. Even though the general concepts of delta modeling are language-independent, custom delta languages are required for all source languages, which aretedious to create and lack interoperability due to different implementation technologies.In this paper, we present a framework to automatically derive delta languages for textualor graphical languages given as EMOF-based meta models. We further illustrate howto automatically generate the syntax and large parts of the semantics of the deriveddelta language by inspecting the source language’s meta model. We demonstrate ourapproach by applying our implementation DeltaEcore to four selected source languages.
1 Introduction
Software product lines (SPLs) [PBvdL05] and software ecosystems (SECOs) [Bos09] are
approaches to reuse in the large where families of closely related software systems are
modeled in terms of configurable functionality often referred to as features. An SPL has a
closed variant space where the set of all possible features is explicitly known making it
(theoretically) possible to determine all valid variants of the SPL a priori [PBvdL05]. In
contrast, SECOs have an open variant space [Bos09] where not necessarily all features
are known by a central instance at any particular time. A configuration for one member
of the software family is represented by a valid subset of all possible features. In order to
derive a concrete software system for a configuration, a variability mechanism has to build a
variant from all realization parts related to the features present in the configuration. As most
software systems consist of multiple artifacts for different purposes (e.g., design models,
source code, configuration files, documentation material etc.), a variety of languages has
to be made subject to variability in SPLs and SECOs. With suitable meta models for the
81

respective languages, all these artifacts can uniformely be regarded as models allowing to
handle textual as well as graphical languages.
In our work, we chose the transformational variability mechanism delta modeling [SBB+10]
to represent variability due to its ability to handle both SPLs and SECOs as well as
configuration and evolution (see Section 2). Delta modeling alters a given base variant of
an SPL or SECO by adding, modifying and removing parts to transform the system into a
variant conforming to the provided configuration. In delta modeling, transformation steps
are described in a domain-specific language-dependent delta language, which restricts
transformation operations and which is closely tied to its source language, e.g., Delta
Java [SBB+10] as delta modeling language for Java.
With multiple different languages specifying a family of software systems (e.g., design
models, source code etc.), a variability mechanism needs to be applicable to all languages
whose artifacts are affected by different configurations. For delta modeling, this means that
all languages and their meta models need to have a respective delta language to alter them
programmatically. This is complex as a) many languages, in particular domain-specific
languages, do not have a pre-defined delta language and b) new languages may be introduced
and existing ones may be altered as part of system evolution requiring adaptation of the
respective delta language as well. Creating delta languages manually requires extensive
efforts and delta languages created by different developers often lack interoperability due
to different implementation technologies.
In our approach, we address the problems arising from manually creating delta languages.
We introduce a model-based framework to define delta languages for source languages with
an EMOF1-based meta model. We further define six types of standard delta operations and
illustrate how to analyze a source language’s meta model to derive large parts of the delta
operations for a suitable delta language. We generate syntax, semantics and tooling for
these delta languages including editor support, parsers and interpreters. The generated delta
languages seamlessly integrate into a common variant derivation mechanism so that they
can be used to create variants of an SPL or SECO and are fully interoperable with other
delta languages created with this framework.
This paper is structured as follows: Section 2 introduces delta modeling with its benefits and
limitations as well as a running example used throughout the paper. Section 3 explains our
delta language generation framework and illustrates how to derive suitable delta operations
from analyzing a source language’s meta model. Section 4 demonstrates the implementation
of these concepts in our tool DeltaEcore. Section 5 shows the feasiblity of our approach by
selected case studies before Section 6 discusses related work and Section 7 closes with an
outlook to future work.
1EMOF (Essential MOF) is a subset of the Meta-Object Facility (MOF) 2.0 standard for model-driven
engineering by the Object Management Group (OMG), see http://omg.org/mof
82

2 Delta Modeling
Delta modeling is an approach for capturing variability in software families and for deriving
individual products [SBB+10]. The general idea is to transform one valid variant of
the family into another variant realizing a different valid set of features by means of
adding, modifying or removing elements of the first variant. Within the approach, a delta
module is used to bundle the transformation operations associated with (part of) a particular
configurable unit of functionality or combinations thereof. The individual transformations in
a delta module are performed by application of delta operations, which are custom-defined
transformation procedures specified individually for each language. Within this paper, we
use the term source language for the original language (e.g., Java) and delta language for
the language in which delta modules containing delta operations are specified (e.g., Delta
Java [SBB+10]). A source language in delta modeling may be textual, graphical or in
any other representation. Delta languages are usually specified textually [SBB+10, DS11],
but there also are attempts to specify them graphically [HKM+13]. To derive a particular
product in delta modeling, a set of delta modules is brought into a suitable order and applied
by executing the respective delta operations sequentially.
To illustrate the concepts in this paper, we use the example of Software Fault Trees (SFTs)
applied in safety-critical software to successively decompose a root fault into logical
combinations of its constituent faults in order to determine causes for the root fault’s
appearance [Lev95]. An SFT is a tree consisting of gates representing logical and/or
operations as well as intermediate faults, which are refined further, and basic faults, which
are considered atomic. Basic faults are assigned an individual probability of occurrence,
which can be used to derive metrics for the likelihood of more complex faults activating.
Figure 1a) shows an example SFT.
ODF
Obstacle Detection Failsp=0.003
Robot CollisionRC
G2
Braking FailsBF
G1
RIM
Robot in Motionp=0.8
LFS
Low Friction Surfacep=0.02
b)a)
And/Or Gate
Basic/Intermediate Fault
Legend -parentFault*
-description : String
Figure 1: a) Example SFT. b) Meta model for SFTs.
When safety-critical software systems are created from a software family in the sense of
an SPL or SECO, the respective safety artifacts describing the system for analysis and
certification need to be altered equivalently to the system itself for different configura-
tions [SSA13, DL04]. Thus, when using delta modeling, languages such as SFTs need a
delta language to express variability. We chose SFTs as a running example as they demon-
strate many of the principal challenges in creating custom delta languages yet are sufficiently
83

comprehensible. Figure 1b) shows the meta model for SFTs we use throughout the paper.
The meta class SFTSoftwareFaultTree represents the root element of the SFT. In ad-
dition, SFTFault is the abstract base class for its specializations SFTBasicFault and
SFTIntermediateFault representing the respective faults. Finally, SFTGate repre-
sents logical gates with the respective logical operator of the enumeration SFTGateType.
In the meta model, we distinguish structural features of meta classes into references relating
elements to instances of meta classes and attributes having values with basic types, custom
data types or enumerations. Furthermore, we distinguish single-valued references having
an upper bound of one and many-valued references having an upper bound greater than one
resulting in a (possibly ordered) set of values.
1 delta "RefineObstacleDetection"
2 dialect <http://vicci.eu/ecosystem/sft/1.0>
3 requires <../core/RobotCollision.sft>
4 {
5 removeFaultFromFaultsOfGate(<ODF>, <G1>);
6 SFTIntermediateFault odf = new SFTIntermediateFault(id: "ODF",
7 name: "Obstacle Detection Fails");
8 addFaultToFaultsOfGate(odf, <G1>);
9
10 SFTGate g3 = new SFTGate(id: "G3", gateType: SFTGateType.AND);
11 setGateOfIntermediateFault(g3, odf);
12
13 addFaultToFaultsOfGate(new SFTBasicFault(id: "BSF",
14 name: "Bump Sensor Fails", probability: 0.003), g3);
15 addFaultToFaultsOfGate(new SFTBasicFault(id: "DSF",
16 name: "Distance Sensor Fails", probability: 0.0007), g3);
17 }
Listing 1: Example usage of DeltaSFT to alter SFTs in the course of variability.
In general, a delta language should provide operations to create new instances of all concrete
meta classes and to reference existing elements. DeltaSFT as delta language for SFTs
conforming to the presented meta model should further allow to add and remove faults
to/from the many-valued faults reference of gates as well as to set and unset the value
of the single-valued gate reference of intermediate faults. Furthermore, DeltaSFT has
to support modification of the attribute name for both fault trees and faults as well as
probability of basic faults and gateType of gates by assigning a new value. The
id of both faults and gates is closely related to the identity of the respective elements and,
thus, should not be subject to changes due to variability. An example of a delta module in
DeltaSFT is provided in Listing 1. It modifies an SFT capturing the causes for the collision
of a domestic robot. The basic variant of the SFT is loaded in l. 3 and modified in ll. 5–16 to
include fault propagation paths for an add-on distance sensor by applying delta operations
specific to the source language of SFTs.
The general concepts of delta modeling can be seen as a specialized form of model transfor-
mation [MVG06]. In contrast to a general model transformation engine, a delta language
only provides selected modification operations required for expressing variability. Opera-
tions that should not be performed as part of variability, such as changing IDs, are explicitly
prohibited by not providing the respective delta operations. Furthermore, operations may
be specified to respect the syntactical and semantical constraints of the source language,
e.g., by avoiding dangling references. Finally, variability engineers are not required to learn
84

or understand the full scope of a general model transformation engine but only that of the
reduced functionality of the delta language.
Delta modeling has multiple beneficial qualities when used as variability mechanism. For
one, it can handle configuration (variability in space) as well as evolution (variablity in
time) within a single notation [SBB+10, DS11] allowing both to derive products and to
modify the SPL or SECO in response to changed or new requirements. Furthermore, delta
modeling does not depend on a closed variant space as in SPLs but can deal with an open
variant space where not necessarily all configuration options are known in advance as found
in SECOs [Bos09, SA13], which is a discriminating difference to annotational variability
mechanisms [SRC+12] often used with SPLs.
These characteristics and the fact that the general concepts of delta modeling are language
independent make it a very suitable option for SPL and SECO development. However, for
a practical application of delta modeling to a particular language or meta model, an imple-
mentation of a custom delta language for its source language is required. Furthermore, a
variability modeling approach based on delta modeling is only applicable if all languages of
the SPL or SECO that are affected by variability support it. Even though implementations of
delta languages exist for source languages such as Java [SBB+10], Class Diagrams [Sch10],
Matlab/Simulink [HKM+13] or Component Fault Diagrams (CFDs) [SSA13], they are
currently incompatible with one another and less known languages need individual imple-
mentation of a delta language.
Creating a delta language manually for a specific source language or meta model is tedious
as not only the language’s syntax and semantics have to be devised but also the tooling
to create delta modules and derive product variants needs to be created. This results in a
number of problems: First, most languages do not possess a delta language as it would
have to be defined manually. Second, implementations lack robustness as reuse of common
technologies is not possible. Third, delta languages created by different developers lack
interoperability so that multiple tools are required to handle variability of different source
languages. Automatically generating delta languages on basis of a common framework may
address these problems. However, existing approaches [HHK+13] are limited to deriving
the syntax of delta languages for textual languages from grammars and cannot generate
their semantics or tooling for product derivation.
3 Delta Language Generation Framework
In this paper, we present a framework to create custom delta languages for source languages
given as EMOF-based meta models. Within our framework, we use information from
analyzing a source languages’s meta model to derive syntax and large parts of the semantics
for the model representation of a delta language with a concrete textual syntax. For this
purpose, we use two languages represented by meta models with concrete textual syntax:
1) The common base delta language, which provides functionality common to all delta
languages such as creating and referencing elements and 2) a delta dialect, which provides
delta operations specific to the source language. A delta language is created by combining
85

the common base delta language with a delta dialect specific to the respective source
language. This general architecture is illustrated in Figure 2.
Source Language
Framework
conforms
refers refersrefers
conforms
creates
Common Base Delta Language
Meta Meta Model
Delta Dialect
Meta Model
Delta Language
Model
Figure 2: Architecture of the delta language generation framework.
3.1 Common Base Delta Language
The common base delta language operates on the level of the meta meta model (EMOF)
using e.g., EReferences as elements, but not their instances in the meta model of the
source language, such as the reference faults of the meta class SFTGate in the meta
model for SFTs defined in Figure 1b). Hence, the common base delta language requires
no knowledge of the source language’s meta model so that it is provided entirely by the
framework. The common base delta language represents the skeleton of the custom delta
language that is to be created. Constructs defined by the common base delta language
include a) references to other delta modules or models (e.g., requires), b) dynamically
created constructors with named parameters to instantiate meta classes, c) references to
existing model elements (language dependent identifiers are possible), d) definition of
variables and constants and e) invokation of delta operations with arguments.
These constructs are available in all delta languages created using the framework, but can
be defined independently from the concrete source language. In order to avoid having to
define them for each delta language individually, we provide these constructs as part of the
framework and share them between different delta languages. As the common base delta
language is defined in a meta model, we are able to perform operations such as type checks
to ensure that the types of referenced objects, variables and parameters are compatible. We
further provide a concrete textual syntax with the meta model, which is used as basis for
the textual custom delta language when combining the common base delta language with a
delta dialect.
3.2 Delta Dialect
A delta dialect defines delta operations suitable to expressing variability for a particular
source language, e.g., to add faults as children of a gate for SFTs. Thus, a delta dialect is
the part of a custom delta language that ties to the meta model of a specific source language.
The delta language itself is created by combining the common base delta language with
the respective delta dialect for the source language. We specify the structure for delta
dialects using a meta model and further provide a concrete textual syntax (see Listing 2 in
86

Section 4). The custom delta language is created by dynamically introducing references
between the meta models of the common base delta language and the respective delta
dialect. Along with the resulting meta model, we provide a concrete textual syntax for the
resulting custom delta language that is synthesized from the textual syntax of the common
base delta language and the meta classes in the source language (see Listing 1 in Section 2).
Hence, delta modules may be specified textually and principally also in other forms, e.g.,
graphically.
3.3 Delta Operations
A delta dialect is specified for a particular source language by the users of our framework
by defining suitable delta operations for the source language. In our running example, we
illustrated the need for five types of operations: setting und unsetting the value of single-
valued references, adding and removing values of many-valued references and modifying
the value of attributes. We further identified the need for a sixth operation that can insert a
value into a many-valued reference at a specified position provided that the set of values
is ordered. Using these six types of operations, we define semantics for standard delta
operations used for variability modeling with EMOF-based models and illustrate how to
derive them from a source notation’s meta model. Furthermore, we also support developers
in creating custom delta operations with user-defined semantics to realize domain-specific
operations.
Set/Unset Delta Operations are used to alter the value of a single-valued reference. A set
delta operation assigns a new value to a specified single-valued reference, whereas an unset
delta operation replaces the current value with the default value for that reference as defined
in the meta model.
We derive set and unset operations from a source language’s meta model by collecting all
references in a set that are changeable and single-valued. For each reference in the set, we
define both a set and unset delta operation. The delta dialect for our running example in
Listing 2 in Section 4 contains definitions for two set delta operations (ll. 7/8, 20/21) and
two unset delta operations (ll. 9/10, 22).
Add/Insert/Remove Delta Operations are provided to manipulate the set of values of
many-valued references. An add operation appends a given element to the set of values
and a remove operation detaches it from the set. Thus, the semantics of a remove operation
is different from that in other approaches to delta modeling [SBB+10, DS11] where it
completely erases an element from the model whereas, in our case, the element is only
detached from the specified list of references. An insert operation places the element at a
certain position within the set of values, which is only sensible if the set is ordered.
We derive add, insert and remove delta operations in a similar way to set and unset delta
operations: We first collect a set of all references that are changeable and, in this case,
many-valued. As insert delta operations are only sensible for ordered sets of values, we
further exclude references that are marked as being unordered for this type of operation.
For each reference in the set, we create the respective delta operations. The delta dialect for
87

our running example in Listing 2 contains one add delta operation (l. 28) and one remove
delta operation (ll. 29/30). As none of the many-valued references of the meta model is
marked as being ordered, no insert delta operations are required.
Modify Delta Operations are used to alter the values of an attribute. In contrast to
manipulating referenced values, modification of attribute values is free of side effects
(e.g., automatically updated opposite references). Hence, we decided that users of a delta
language should be made aware of this difference so that we distinguish set and modify
delta operations. In consequence, modify delta operations have a different meaning from
that in other approaches to delta modeling [SBB+10, DS11] where they are used solely to
signal that the contents of a hierarchically decomposed element are being altered. We do
not require such a marker as we can use references to target elements directly even if they
are nested within a containment hierarchy.
We derive modify delta operations from the provided meta model by inspecting all of its
concrete (i.e., non-abstract) meta classes. For each of these meta classes, we iterate over
the attributes and collect those that are changeable and not marked as ID. We decided not
to allow modification of IDs by default as an identifier is tightly connected to the identity of
an element and, thus, should not be changed as part of variability modeling. Instead, the
element itself should be replaced. For each attribute in this set, we then generate a modify
delta operation. The delta dialect for our running example in Listing 2 defines seven modify
delta operations (ll. 11–18, 23–26, 31).
Custom Delta Operations are used to declare delta operations with user-defined domain-
specific semantics that could not be expressed using the generated delta operations. This
enables creators of a delta language to utilize knowledge of the semantics of the source
language to provide specifically tailored operations, e.g., to avoid dangling references
according to the constraints of the source language. As the semantics of these opera-
tions depends entirely on the behavior intended by the creator of the delta language, the
implementation to interpret the respective custom delta operations needs to be provided
manually.
We explicitly decided to not include two specific operations in the set of standard delta
operations that may have to be realized as custom delta operations: For one, we refrained
from defining a replace delta operation as it inherently depends on the semantics of the
source language whether elements of the exact same type, those compatible in the sense
of subtype polymorphism or semantically equivalent elements may be used as substitutes.
Furthermore, we did not define a standard delete delta operation that completely erases
an element from the model along with all its references as this operation would have too
many (potentially unintended) side effects to be sensible for variability modeling in general.
Hence, the element either has to be deleted step by step using standard delta operations
or a custom delta operation specific to the source language has to be defined, which may
be done for abstract meta classes to cover multiple concrete meta classes at once if no
fine-grained control is required.
88

4 Implementation
We have realized the concepts presented in this paper using Ecore from the Eclipse Modeling
Framework2 (EMF) as meta modeling notation supporting EMOF. Our implementation
is called DeltaEcore and is available for download at http://deltaecore.org. A
variety of tools exists for Ecore to create model representations of both textual and graphical
languages allowing DeltaEcore to target a wide range of source languages.
Delta Dialect NSource Language N
Delta Dialect 1
...
Source Language 1
...
Provided by FrameworkUser CreatedExternalCommonBase
DeltaLanguage
Delta
Parser
Editor
Support
Delt
aC
om
ple
ter
Delta
Sorter
Delt
aIn
terp
rete
r
Variant
Derivator
Delta EcoreSource Languages
Figure 3: Implementation components of DeltaEcore.
Figure 3 illustrates the main implementation components of DeltaEcore, which we reference
in the following using an italic type. Along with the Common Base Delta Language,
DeltaEcore provides Editor Support for the derived delta languages including syntax
highlighting, auto completion etc. as well as a Delta Parser to create a model representation
from the textual syntax of a delta language. Each delta module explicitly specifies which
models it alters and which other delta modules it depends on (if any) through a requires
relation. When applying a set of delta modules, the Delta Completer collects all models
to be altered and all (transitively) required delta modules, the Delta Sorter performs
topological sorting to establish a suitable application order for the delta modules, the Delta
Interpreter applies delta modules and their delta operations with the help of the generated
delta dialect specific interpreters and the Variant Derivator assembles all affected models to
store them as variant of the SPL or SECO. All these components are provided by DeltaEcore
so that merely a Delta Dialect for a Source Language has to be defined by users of the
framework in order to create a delta language. We use the steps described in Section 3.3 to
automatically generate standard delta operations for a specified source language. In our
implementation, we generate a model representation of these delta operations enabling us to
enforce type safety when combining a delta dialect with the common base delta language.
Listing 2 shows the textual representation of a delta dialect for SFTs conforming to the
meta model introduced in Figure 1b) as generated by DeltaEcore. When combining this
delta dialect with the common base delta language, DeltaSFT is created, which can be used
to specify variability for SFTs in delta modules such as the one depicted in Listing 1 of Sec-
tion 2. In the configuration section of the delta dialect, the meta model of the source
language is identified by specifying its URI as parameter to the metaModel key (l. 3).
Furthermore, it is possible to optionally provide a custom identifierResolver—a
Java class used to resolve references to elements within the meta model (l. 4). The default
implementation uses attributes flagged as ID in Ecore to resolve references. However, it may
be necessary to use custom identifiers such as with hierarchically structured models without
2http://eclipse.org/modeling/emf
89

1 deltaDialect {
2 configuration:3 metaModel: <http://vicci.eu/ecosystem/sft/1.0>;
4 identifierResolver: eu.vicci.ecosystem.sft.delta.SFTIdentifierResolver;
5
6 deltaOperations:7 setOperation setRootFaultOfSoftwareFaultTree(SFTFault value,
8 SFTSoftwareFaultTree[rootFault] element);
9 unsetOperation unsetRootFaultOfSoftwareFaultTree(
10 SFTSoftwareFaultTree[rootFault] element);
11 modifyOperation modifyNameOfSoftwareFaultTree(String value,
12 SFTSoftwareFaultTree[name] element);
13
14 modifyOperation modifyNameOfBasicFault(String value, SFTBasicFault[name] element);
15 modifyOperation modifyDescriptionOfBasicFault(String value,
16 SFTBasicFault[description] element);
17 modifyOperation modifyProbabilityOfBasicFault(Double value,
18 SFTBasicFault[probability] element);
19
20 setOperation setGateOfIntermediateFault(SFTGate value,
21 SFTIntermediateFault[gate] element);
22 unsetOperation unsetGateOfIntermediateFault(SFTIntermediateFault[gate] element);
23 modifyOperation modifyNameOfIntermediateFault(String value,
24 SFTIntermediateFault[name] element);
25 modifyOperation modifyDescriptionOfIntermediateFault(String value,
26 SFTIntermediateFault[description] element);
27
28 addOperation addFaultToFaultsOfGate(SFTFault value, SFTGate[faults] element);
29 removeOperation removeFaultFromFaultsOfGate(SFTFault value,
30 SFTGate[faults] element);
31 modifyOperation modifyGateTypeOfGate(SFTGateType value, SFTGate[gateType] element);
32 }
Listing 2: Textual representation of a delta dialect for SFTs.
unique identifiers. The characteristics of the identifiers depend on the source language so
that the implementation of the respective identifier resolver is delegated to the creator of
the delta language if the standard behavior does not suffice.
In the deltaOperations section (ll. 6–31), signatures for the delta operations provided
within the custom delta language are given. All six types of standard delta operations are sup-
ported using distinct keywords for the different types of operations (e.g., setOperation
or addOperation). In addition, it is possible to specify custom delta operations using
the keyword customOperation, which may have arbitrary parameters and require a
manual implementation of their semantics. In Listing 1, DeltaSFT is created by combining
the common base delta language with the delta dialect of Listing 2 using the dialect
keyword in l. 2.
When deriving standard delta operations, we synthesize names for the derived delta oper-
ations from the meta model of the source language to provide a naming convention, e.g.,
setRootFaultOfSoftwareFaultTree in Listing 2. However, these names may
be changed at will by creators of delta dialects. To guide the process of deriving delta
operations, we provide a graphical user interface allowing the deselection of undesired stan-
dard delta operations before generation. For all delta operations defined in a delta dialect,
implementation classes for an interpreter of the custom delta language are generated. With
the defined semantics of standard delta operations, it is possible to completely generate
90

the implementation for set/unset, add/insert/remove and modify delta operations. The
semantics of custom delta operations is not formally defined and, thus, their interpretation
needs to be implemented manually.
5 Case Study
In our case study, we evaluate the suitability of the concepts presented in this paper on
four different languages using our tool DeltaEcore: Software Fault Trees [Lev95] (SFTs),
Component Fault Diagrams [SSA13, KLM03] (CFDs), Checklists [Lev95] (CLs) and the
Goal Structuring Notation [KW04] (GSN). An example of SFTs was already presented in
Figure 1 and examples of CFDs, CLs and the GSN can be found in Figure 4. All these
languages stem from the area of certifying safety-critical systems, but they contain many
different features representing a wide range of languages. The abstract syntax of SFTs
is represented by a tree, that of CFD and CLs by a reducible graph and that of GSN by
a general graph. SFTs, CFDs and GSN have a graphical syntax, whereas CLs have a
textual syntax. Finally, the GSN may reference model elements from SFTs, CFDs and CLs
interconnecting the languages.
c)b)a)checklist "Test BS"
group "Surface"F1 "Wooden Floor"
x F2 "Carpet"x F3 "Concrete"
F4 "Wet Floor"
group "Speed"x S1 "Low Speed"
S2 "Regular Speed"S3 "High Speed"
Collision
Braking System (BS)
BrakingFails
Moving LowFrictionSurface
Obstacle Detector (OD)
Collision AvoidableCollision
Obstacle Moving
AND
OIW RIM LFS
Goal1Collisions have to be avoided
Strategy2Show that obstacledetection is working
Solution2CFD of obstacledetector
CFD for OD
Strategy1Show that brakingsystem is working
Solution1SFT and test ofbraking system
SFT for BS CL for BS test
Figure 4: Example of languages used in the case study: a) CFDs, b) CLs, c) GSN.
In particular, we consider three research questions: RQ1: Is it possible to generate custom
delta languages that are expressive enough to handle the required variability of the source
language? RQ2: Is our approach capable of dealing with scenarios where other than the
derived delta operations are required? RQ3: Are the generated methods sound (i.e., useful,
fit for purpose and non-redundant)?
For CFDs, a delta language was already presented as part of our previous work [SSA13].
For SFTs, CLs and GSN, we manually created the respective delta languages to have
a reference for comparison with delta languages generated by DeltaEcore. To answer
our research questions, we inspected the delta operations derived from the languages’
meta models and analyzed how complex the creation of custom delta operations and their
implementations is in terms of lines of code (LOCs).
We created delta languages for these source languages using DeltaEcore. In Table 1,
we provide metrics for the generated languages. The column “Generated” contains the
91

number of all generated delta operations, “Excess” counts those delta operations that are
redundant (e.g., providing access to an opposite reference), “Not Ideal” lists the number of
operations that were perceived as not being elegant for the intended purpose (e.g., setting
the bounding box for the graphical representation of an element instead of moving and
resizing it) and “Restrict” states the number of generated methods that had to be removed
in order to disallow access to model elements that should not be affected by variability
modeling. Finally, “Custom” lists the number of custom delta operations used in the delta
language and “LOC” states the number of lines of code required to implement their intended
semantics.
Source Language Generated Excess Not Ideal Restrict Custom LOC
SFT 15 2 0 0 0 0
CFD 39 12 2 17 6 31
CL 10 0 0 0 0 0
GSN 26 16 3 1 4 33
Table 1: Results of deriving delta dialects for the source languages of the case study.
The generated standard delta operations of all delta dialects were sufficient to handle
variability in the respective source languages with regard to our original expectations.
However, CFDs and GSN have a relatively large number of excess methods. This is mostly
due to the presence of multiple opposite references where delta operations were generated
for both the original and opposite reference creating redundancy. Furthermore, a large
number of delta operations of the delta dialect for CFDs had to be removed in order to
restrict access similarly to the original delta language for CFDs. However, we consider
13 of these 17 delta operations as being useful and merely had not included them in the
original delta language due to the implementation effort at the time. To realize additional
delta operations, CFDs required six and GSN four custom delta operations with 31 and 33
LOC respectively.
With regard to our research questions, we come to the following conclusions: Using
DeltaEcore, it was possible to completely generate delta languages for the respective
source languages that are expressive enough to handle variability resulting in a positive
answer to RQ1. Even though it was possible to alter all elements with the derived delta
operations, in some cases, providing more elegant delta operations was desirable. For
example, the generated delta operations to alter the visual appearance of CFD elements
suggested setting the bounding box of the element whereas the source language used
delta operations to move and resize the element, which seemed more intuitive to use.
Delta operations missing from the generated delta dialect could be realized by custom
delta operations and manual implementation of the semantics in the dialect interpreter.
Furthermore, access to elements considered immutable in the course of variability could
be restricted by omitting the respective delta operations resulting in a positive answer to
RQ2. The relatively large number of excess methods creates redundancy so that not all of
the generated delta operations are considered sound with respect to our research questions
resulting in a negative answer to RQ3. We will inspect how to reduce the number of
redundant methods especially with regard to opposite references.
92
Threats to validity of our case study mainly come from selection of the source languages.
Even though we used languages representing different characteristics, all four inspected
source languages stem from the same domain of safety-critical systems so that they may
not necessarily be representative for languages of other domains. Furthermore, the meta
models for all source languages were created by the authors of this paper and, thus, may
reflect a certain style of modeling. Finally, the inspected meta models are relatively small
in comparison to those for languages such as Java.
6 Related Work
Multiple publications exist that present individual delta languages for particular source
languages, such as for Java [SBB+10], Class Diagrams [Sch10], State Charts [LSKL12],
Component Fault Diagrams [SSA13], the architectural language MontiArc [HKR+11]
or Matlab/Simulink [HKM+13]. However, these delta languages are tightly integrated
with their source languages and, thus, serve as archtypes of syntax and semantics of delta
languages, but not as basis for generating custom delta languages for arbitrary meta models.
The work related closest to ours is that of Haber et al. [HHK+13] as it has the similar goal
to generate a delta language for a given source language. They derive the concrete syntax
for a custom delta language from a provided textual source language given as grammar by
means of grammar extension. In contrast, we analyze the source language’s abstract syntax
to generate a delta language external to the source language. We use a similar concept of a
common delta language. However, our common base delta language is represented as a
meta model, which allows operations such as type checking whereas their common delta
language merely consists of a grammar. In addition, their approach is limited to textual
source languages whereas ours targets meta models and, thus, can create delta languages for
models in textual, graphical or any other representation. Furthermore, their approach only
generates the syntax of a delta language whereas ours generates large parts of an interpreter
and an integration into a common variant derivation mechanism as well.
Another approach closely related to ours is that of Sanchez et al. [SLFG09] where a
framework may be used to define domain-specific languages for variability management in
a particular target meta model. In the extension of the work by Zschaler et al. [ZSS+10],
SPL technologies are bootstrapped to create a family of these languages. Similar to our
approach, the authors define modification operations external to the target meta model.
However, they do not provide defined semantics for standard operations, but have language
creators implement each operation using a general purpose model transformation language.
FeatureHouse [AKL13] is an approach for generalizing software composition by superim-
position for artifacts written in different languages. FeatureHouse can be seen as a language
workbench for feature-oriented variability modeling languages, which is similar to our
approach for delta-oriented variability modeling. However, FeatureHouse does not operate
on meta models of the source languages, but relies on the parse tree for the considered
language and the concept of feature structure trees (FSTs), which resemble abstract syntax
trees. The FSTs can be composed using a set of predefined operations with associated
93
semantics similar to the standard delta operations we provide. So far, FeatureHouse was
only used for textual languages while our approach is more generally applicable for textual
as well as for graphical languages.
The Common Variability Language (CVL) as a standardization effort for variability lan-
guages is closely related to our approach in that it has the goal to extend arbitrary MOF-
based models with a variability mechanism. CVL defines semantics of certain standard
operations that may be performed as part of variability modeling similar to our approach.
However, CVL utilizes an annotational variability mechanism that depends on a closed
variant space and, thus, may not be used with SECOs.
Besides approaches providing or generating languages to specifically handle variability,
there are also more general approaches to model transformation that can be utilized for
similar purposes. Rumpe and Weisemoller [RW11] generate a domain specific model
transformation language from the concrete syntax of a source language. However, their
focus is not on variability so that they do not provide standard variational operations with
defined semantics or a variant derivation mechanism.
In addition, there are multiple general purpose model transformation approaches of which
graph-based approaches are most suitable for variability modeling [CH06] with specifica-
tions such as QVT3 and languages targeting Ecore such as ATL4 or ETL5. However, the
use of general purpose model transformation engines to express variability is problematic.
Such languages are not tailored to the field of variability management with the result that
they may be too powerful and their syntax may be both unfamiliar to and overwhelming for
variability engineers. In contrast, a dedicated language for variability management, such as
a delta language, may offer operations specifically tailored to expressing variability in the
source language, e.g., to preserve consistency by avoiding dangling references.
7 Conclusion
In this paper, we presented a framework to create delta languages for source languages given
as EMOF-based meta models to express variability in SPLs and SECOs. We illustrated how
to derive syntax and semantics for custom delta languages from a source language’s meta
model. For this purpose, we defined semantics for six types of standard delta operations
and illustrated how to analyze an EMOF-based meta model of a source language to find
suitable instances of these operations. We used this information to define a delta dialect to
a common base delta language in order to create a custom delta language. The generated
delta languages are interoperable and integrate seamlessly into a common variant derivation
mechanism to create products of an SPL or SECO for multiple source languages.
The case study showed that DeltaEcore can be applied to languages with different char-
acteristics and that the automatically generated standard delta operations cover a wide
range of suitable delta operations. However, it also suggested that a large number of excess
3http://omg.org/spec/QVT/1.04http://eclipse.org/atl5http://eclipse.org/epsilon/doc/etl
94

delta operations is derived especially with opposite references. In our future work, we will
consider how to reduce this number and how to identify delta operations particularly useful
to variability engineers. We will further inspect how to integrate support for family-based
analyses into DeltaEcore to allow efficient processing and comparison of analyses on
multiple variants of an SPL or SECO. Finally, we plan to perform an industrial-scale case
study with partners from the automotive sector using our tool DeltaEcore.
Acknowledgments
This work was partially funded by the European Social Fund (ESF) and the Federal State
of Saxony within project VICCI #100098171.
References
[AKL13] Sven Apel, Christian Kastner, and Christian Lengauer. Language-Independent andAutomated Software Composition: The FeatureHouse Experience. IEEE Transactionson Software Engineering, 39(1):63–79, 2013.
[Bos09] Jan Bosch. From Software Product Lines to Software Ecosystems. In Proceedings ofthe 13th International Software Product Line Conference, SPLC, 2009.
[CH06] Krzysztof Czarnecki and Simon Helsen. Feature-Based Survey of Model TransformationApproaches. IBM Systems Journal, 45(3):621–645, 2006.
[DL04] Josh Dehlinger and Robyn Lutz. Software Fault Tree Analysis for Product Lines. InHigh Assurance Systems Engineering, 2004. Proceedings. Eighth IEEE InternationalSymposium on. IEEE, 2004.
[DS11] Ferruccio Damiani and Ina Schaefer. Dynamic Delta-Oriented Programming. InProceedings of the 15th International Software Product Line Conference, Volume 2,page 34. ACM, 2011.
[HHK+13] Arne Haber, Katrin Holldobler, Carsten Kolassa, Markus Look, Klaus Muller, BernhardRumpe, and Ina Schaefer. Engineering Delta Modeling Languages. In Proceedings ofthe 17th International Software Product Line Conference (SPLC), SPLC’13, 2013.
[HKM+13] Arne Haber, Carsten Kolassa, Peter Manhart, Pedram Mir Seyed Nazari, BernhardRumpe, and Ina Schaefer. First-Class Variability Modeling in Matlab/Simulink. InProceedings of the Seventh International Workshop on Variability Modelling of Software-intensive Systems, page 4. ACM, 2013.
[HKR+11] Arne Haber, Thomas Kutz, Holger Rendel, Bernhard Rumpe, and Ina Schaefer. Delta-oriented Architectural Variability Using MontiCore. In Proceedings of the 5th EuropeanConference on Software Architecture: Companion Volume, page 6. ACM, 2011.
[KLM03] Bernhard Kaiser, Peter Liggesmeyer, and Oliver Mackel. A New Component Conceptfor Fault Trees. In Proceedings of the 8th Australian Workshop on Safety CriticalSystems and Software-Volume 33. Australian Computer Society, Inc., 2003.
95

[KW04] Tim Kelly and Rob Weaver. The Goal Structuring Notation–A Safety Argument Notation.In Proceedings of the Dependable Systems and Networks Workshop on Assurance Cases,2004.
[Lev95] Nancy G Leveson. Safeware: System Safety and Computers. Addison-Wesley Longman,1995.
[LSKL12] Malte Lochau, Ina Schaefer, Jochen Kamischke, and Sascha Lity. Incremental Model-Based Testing of Delta-Oriented Software Product Lines. In Tests and Proofs, pages67–82. Springer, 2012.
[MVG06] Tom Mens and Pieter Van Gorp. A Taxonomy of Model Transformation. ElectronicNotes in Theoretical Computer Science, 152:125–142, 2006.
[PBvdL05] Klaus Pohl, Gunter Bockle, and Frank J. van der Linden. Software Product LineEngineering - Foundations, Principles and Techniques. Springer Berlin/Heidelberg,2005.
[RW11] Bernhard Rumpe and Ingo Weisemoller. A Domain Specific Transformation Language.In Proceedings of the Workshop on Models and Evolution (ME), 2011.
[SA13] Christoph Seidl and Uwe Aßmann. Towards Modeling and Analyzing Variability inEvolving Software Ecosystems. In Proceedings of the 7th International Workshop onVariability Modelling of Software-intensive Systems (VaMoS), VaMoS’13, 2013.
[SBB+10] Ina Schaefer, Lorenzo Bettini, Viviana Bono, Ferruccio Damiani, and Nico Tanzarella.Delta-Oriented Programming of Software Product Lines. In Software Product Lines:Going Beyond, pages 77–91. Springer, 2010.
[Sch10] Ina Schaefer. Variability Modelling for Model-Driven Development of Software ProductLines. In VaMoS, pages 85–92, 2010.
[SLFG09] Pablo Sanchez, Neil Loughran, Lidia Fuentes, and Alessandro Garcia. EngineeringLanguages for Specifying Product-Derivation Processes in Software Product Lines. InSoftware Language Engineering, pages 188–207. Springer, 2009.
[SRC+12] Ina Schaefer, Rick Rabiser, Dave Clarke, Lorenzo Bettini, David Benavides, GoetzBotterweck, Animesh Pathak, Salvador Trujillo, and Karina Villela. Software Diversity:State of the Art and Perspectives. STTT, 14, 2012.
[SSA13] Christoph Seidl, Ina Schaefer, and Uwe Aßmann. Variability-Aware Safety Analysis us-ing Delta Component Fault Diagrams. In Proceedings of the 4th International Workshopon Formal Methods and Analysis in Software Product Line Engineering (FMSPLE),FMSPLE’13, 2013.
[ZSS+10] Steffen Zschaler, Pablo Sanchez, Joao Santos, Mauricio Alferez, Awais Rashid, LidiaFuentes, Ana Moreira, Joao Araujo, and Uira Kulesza. VML*–A Family of Languagesfor Variability Management in Software Product Lines. In Software Language Engineer-ing, pages 82–102. Springer, 2010.
96

Difference-based Conformance Checking
for Ecore Metamodels
Erik Burger, Aleksandar Toshovski
Institute for Programme Structures and Data Organization
Karlsruhe Institute of Technology
Am Fasanengarten 5
76131 Karlsruhe, Germany
[email protected], [email protected]
Abstract: During modern model-driven development processes, generators and higher-order transformations are used to create metamodels with short life cycles. Sincethese metamodels often differ from each other only in small parts, instances as well asmetamodels may be re-used if the difference between them does not lead to a violationof instance conformance. Existing co-evolution approaches describe this conformancebased on change operators to a metamodel. Thus, they require that changes to themetamodels are carried out using special editors. To use this conformance for arbitrarilygenerated metamodels, we present a conformance validator for Ecore metamodels that isbased on difference-based analysis. The validator has been implemented as a plug-in forthe Eclipse framework. We demonstrate the completeness of our approach by coveringstate-of-the-art co-evolution change operators.
1 Introduction
In model-driven engineering, instances of metamodels represent entitites in the domain
of interest and are thus the primary artefacts which are modified during development of a
system. Metamodels, however, represent standards, such as UML, which are implemented
in specific modeling tools. Thus, metamodels usually stay stable during the development
process. When such a standard or tool evolves, a new version of a metamodel is issued,
and existing instances have to be migrated to valid instances of the new versions of the
metamodels. Since these evolution steps do not occur frequently and may affect a large
number of instances, migration scripts can be provided to adapt those instances. Metamodel
evolution mechanisms for automatic co-evolution of instances [BG10; HVW11] support a
semi-automatical migration process from one metamodel to another.
In advanced model-driven approaches, such as multi-view modeling [ASB10; Bur+13;
Bur13], metamodels, model-to-model transformations, and instances are generated on-
the-fly based on declarative definitions. Incremental changes to these definition lead to
incremental evolution of the generated metamodels. Thus, the life-cycles for metamodels
are considerably shorter. It is, however, desirable to re-use metamodels in such processes
for reasons of compatibility to existing tools, and for the development of graphical editors.
97

In this paper, we present a conformance relation for Ecore metamodels which expresses
that instances of one metamodel are also valid instances of another metamodel. This
conformance can be used in two ways: First, to determine if co-evolution efforts are
necessary for existing instances of a metamodel, and second, to determine whether existing
metamodels can be re-used in scenarios where metamodels are generated automatically. In
contrast to existing co-evolution methods [Bec+07; Wac07], which require a manual tracking
of edit operations, the conformance relation presented in this paper can be determined by a
difference-based analysis of two distinct metamodels or two versions of a metamodel. The
contribution of this paper is the definition of conformance as a set of rules using the Java
Drools1 rule engine, and a prototypical implementation based on EMF Compare [BP08]. To
evaluate the completeness of our approach, we show that the approach covers all operators of
the catalogue presented by Herrmannsdörfer in [HVW11]. We demonstrate the application
with an extension of the ModelJoin tool [Bur+13].
The rest of this paper is structured as follows: In section 2, we present the concept of the
conformance relation, followed by the technical realization in section 3. We evaluate the
conformance validation with the operator catalogue of Hermannsdörfer and a modelling
example in section 4. We conclude with a brief discussion of related work and prospects on
future work in section 5.
2 Concept
Incremental changes to metamodels do not necessarily break the compatibility to existing
instances, for example, if only additive changes are applied to the metamodels. Metamodels
can thus be re-used for multiple instances. This is especially beneficiary if graphical
representations and editors have been defined for a specific metamodel, since these would
have to be adapted as well otherwise. To exploit the compatibility of existing instances to
new versions of a metamodel, we define a conformance relation between metamodels:
Definition 1 (Conformance) Let MA, MB be metamodels and I(MA), I(MB) the sets of all
possible instances of MA and MB. Metamodel conformance is defined as
conforms(MA,MB)⇔ I(MA)⊆ I(MB)
To determine the conformance relation between two actual metamodels, we categorize
metamodel changes based on [BG10; HVW11]. These approaches describe the impact of
single or multiple changes to a MOF-based metamodel on existing instances. In these terms,
conformance of metamodels means that all changes that have to be applied to MA in order
to acquire MB are model-preserving [HVW11] / non-breaking [BG10]. The co-evolution
approaches mentioned above are, however, operator-based, i.e., they assume that a change
between two metamodels is expressed as a series of atomic changes. Edapt [HVW11], for
example, requires that the user expresses changes to metamodels as specific refactoring
steps using an Eclipse plug-in. If a metamodel is changed by any other than the Edapt
1http://www.jboss.org/drools/
98

Metamodel A
Metamodel B
Diff Engine
IDiff
operationType:OperationTypedifferenceType:DiffTypeleftResource:ResourceSetrightResource:ResourceSetparameter:StringoldValue:EObjectnewValue:EObjectoldParent:EObjectnewParent:EObject
diff description
Compliance
Validator
Figure 1: Concept for Determining the Conformance
editor, or generated by a declarative definition as in the example above, the approach is not
applicable.
To enable conformance checking between arbitrary metamodels independently of the tools
with which they were created, we present a difference-based approach for conformance
checking. The approach is displayed in Figure 1: A Diff Engine is used to determine the
diff between two existing metamodels. The calculated IDiff element serves as an input for
the Compliance Validator, which is based on a rule set that covers all possible changes to a
metamodel.
3 Technical Realization
We have implemented a prototypical Compliance Validator which checks if the conformance
relation holds for two Ecore metamodels. The architecture of the approach is displayed
in Figure 2. The main component Compliance Validator contains the logic for checking
the conformance relation of Definition 1. It has been implemented as an Eclipse plug-in.
Metamodels are persisted in a Metamodel Repository, which is used by the validator to
retrieve metamodels. The usage of this repository makes it possible to compare a metamodel
with several existing metamodels and to find a conforming metamodel in the repository.
We have implemented a simple file-based metamodel repository for this purpose. The Diff
Engine is used to determine the delta between two metamodels. We use EMF Compare for
UI Compliance Validator
Diff Engine
Compliance Policy Registry
Metamodel Repository
Figure 2: Component model for the Compliance Validator
99

Figure 3: Compliance and Diff Rate in an Eclipse UI view (showing default value −1)
this purpose. The policies for determining the conformity of two metamodels are saved in
the Compliance Policy Registry component, so users can adapt them and register custom
policies. We use the Rete-based Drools rule engine for the definition of the conformance
policies. The conformance check is implemented in Eclipse via a UI component.
We have analysed all possible changes to Ecore metamodels, based on the classification
of metamodel changes in [BG10] and [HVW11]. Since these works are based on MOF,
adaptations were necessary to take the differences between MOF and Ecore into account.
For each change type, we created a rule which describes whether a change type violates the
conformity of existing instance to the metamodel which is being changed. In total, we have
defined 24 rules which cover all model-preserving change types.
An example for a conformance rule is displayed in Listing 1: The rule analyses the impact
of the deletion of a structural feature from an EClass element. The IDiff element describes
the delta between two elements of the respective metamodels. The Java helper functions is-
PullUpFeature() and isParentAbstract() in the DroolsUtils library determine whether
the class in the old metamodel is abstract and whether the feature was moved to a superclass,
which influences the impact of the change. The then-clause of the rule is empty since we
use a listener to react on the firing of a rule.
rule "ReferenceChange EClass remove Attribute/Reference"
when diff: IDiff( operationType == OperationType.DELETE, differenceType ==
DiffType.REFERENCE, parameter=="eStructuralFeatures", DroolsUtils.
isPullUpFeature(oldValue,newValue,newParent)
then
end
Listing 1: Drools rule for deletion of an attribute/reference
The complete set of rules is not represented in this paper due to space restrictions. We refer
to the reader to [Tos13]2 for an extensive description of the rules and the validator.
If there are several metamodels in the Metamodel Repository which conform to the meta-
model which is being checked, a measure for the similarity of metamodels is calculated to
determine the metamodel with the lowest number of conflicts (see Figure 3): The compli-
ance rate is the number of changes which violate conformance, while the diff rate describes
the number of total changes. The user of the validator is furthermore presented a list of issues
which cause the inconformance, and can adapt the metamodel accordingly to re-validate it.
2http://sdqweb.ipd.kit.edu/publications/pdfs/toshovski2013a.pdf (in German)
100

4 Evaluation
Although the conformance relation (Defintion 1) is formally defined, we consider it imprac-
tical to formally prove the correctness of our implementation, since the Ecore metamodel
and MOF itself lack a formal basis which would be necessary for such a proof. Thus, we
follow the same approach as Herrmannsdörfer in [HVW11] and demonstrate the practical
completeness of our implementation by validating the coverage of the most frequent cases
of metamodel changes in practice.
Since the purpose of our conformance relation is twofold, we will evaluate two cases:
First, we will show that our conformance validator covers all the operations in the catalog
[HVW11], thus demonstrating that the conformance validation can be used for co-evolution
scenarios. Second, we will demonstrate the applicability of the conformance validator for
the re-use of metamodels in cases where instances and metamodels are generated from a
declarative definition. To this end, we have integrated the approach with the ModelJoin tool
[Bur+13] and checked the conformance of changes using a joined metamodel based on the
Palladio Component Model [BKR09] and a metamodel for simulation results.
4.1 Change Operators by Herrmannsdörfer et al.
In their 2011 publication [HVW11], Hermannsdörfer et al. have presented a catalog of
operators for the coupled evolution of metamodels and models, which covers common cases
of metamodel adaptations. The operators are divided into three groups: structural primitives,
none-structual primitives, and complex operations. Each operator is classified by the impact
it has on existing instances. For our conformance relation, the class of model-preserving
operators is of interest, since it describes the cases where no adaptation to existing instances
is necessary. The group of primitive operators can be described by single instances of the
IDiff element, while complex operators have to be describe as a set of IDiff elements.
To evaluate the completeness of the compliance validator, we wrote a JUnit test suite that
applied each of the change operations to an example metamodel and tested whether the
validator was able to detect the correct class of changes. For primitive operations, we created
the appropriate IDiff elements directly; for complex changes, we used Edapt to apply the
change to the example metamodel. The rule set of the conformance validator was able to
detect all the 61 operations of the catalog correctly.
4.2 ModelJoin views on the Palladio Component Model
The ModelJoin [Bur+13] tool generates custom metamodels and instances based on textual
queries (see Figure 4): Based on a query, an annotated target metamodel is synthesized
and a QVT-O transformation is generated automatically based on the annotations in the
target metamodel. Since every execution of a query leads to the generation of a query-
specific target metamodel, the re-usability of query results is limited if metamodel-specific
101

generated at compile time
generated at runtime
ModelJoinQuery
InputMetamodels
InputMetamodels
InputMetamodels
references
Input ModelsInput ModelsInput Models
«instance of»
Metamodel
Synthesis
Model-to-modelTransformation
references
TargetMetamodel
Transformation
Generation
Transformation
ExecutionJoin Result
«instance of»
Figure 4: Metamodel and transformation generation in ModelJoin (in FMC [KGT06] notation, from[Bur+13])
visualisations or further transformations are used. To enable the re-use of metamodels,
we have extended the ModelJoin tool by the conformance validator and the file-based
metamodel repository. If a query is executed, the conformance validator checks if there are
metamodels in the repository to which the newly synthesized metamodel conforms. If one
or more suitable metamodels are found, the user can choose one of these, so the join result
is generated as an instance of this metamodel. If no suitable metamodel is found, the user
can access the list of incompatible changes and either modify the query accordingly until
the synthesized metamodel conforms to one of the metamodels in the repository, or use the
synthesized metamodel, which is then added to the repository.
We have tested the compliance validator by varying ModelJoin queries on the Palladio Com-
ponent Model [BKR09] and the Sensor Framework metamodel, checking the conformance
against formerly created metamodels. Although these tests are not extensive enough to give
information about the percentage of cases in which metamodels can be re-used, our first
experiences indicate that additive changes profit from the conformance check. If a query
is amended with additional properties of the source metamodels, former queries and their
instances can still be used with the newly generated metamodel. This way, the user gets
feedback if additions to a query break the compatibility to queries which are already in use.
5 Related Work/Conclusion
Metamodel evolution adresses the compliance between different versions of a metamodel.
Several approaches support the analyses of metamodel changes by describing the changes
102

in a model-based format [Bec+07; BG10] and generating migration transformations auto-
matically [Cic+08]. Automatic derivation of this difference description has been proposed
in [DIP12] as a base for migration scripts, but without categorization of conformance.
The conformance relation presented in this paper can be seen as a special case of model
typing [SJ07]. Our state-based conformance check can be used for model type checking of
Ecore metamodels, which determines a subtype-relation between two metamodels.
In this paper, we have presented a conformance relation between Ecore metamodels which
expresses that all instances of one metamodel are valid instances of another metamodel.
This relation is useful either for the re-use of instances when metamodels evolve, or for the
re-use of metamodels in approaches where metamodels and instances are generated from
declarative definitions. The contribution of this paper is a difference-based compliance
validator which analyses Ecore metamodels for conformance based on a set of rules. The
advantage of a difference-based analysis is the independence from metamodelling tools
with which the metamodels under study are created.
In contrast to the change impact analysis of [BG10] and the classification of change
operators of [HVW11], the conformance validator only detects model-preserving changes
and does not provide means for resolving other changes that violate the conformance. In
future work, the rule set can be extended to differentiate between conflicts which have to be
resolved manually and those which can be fixed automatically.
The conformance validator is limited to Ecore-based metamodels and is thus tied to the EMF
framework. We do however not see this as a serious limitation due to the wide acceptance of
EMF and Eclipse in industry and research. As future work, the conformance validator can be
extended to support other metamodel repositories such as CDO3, Teneo4, or EMFStore5.
References
[ASB10] Colin Atkinson, Dietmar Stoll, and Philipp Bostan. “Orthographic Software
Modeling: A Practical Approach to View-Based Development”. In: Evaluation
of Novel Approaches to Software Engineering. Ed. by Leszek A. Maciaszek,
César González-Pérez, and Stefan Jablonski. Vol. 69. Communications in Com-
puter and Information Science. Berlin/Heidelberg: Springer, 2010, pp. 206–
219.
[Bec+07] Steffen Becker et al. “A Process Model and Classification Scheme for Semi-
Automatic Meta-Model Evolution”. In: Proc. 1st Workshop MDD, SOA und
IT-Management (MSI’07). GiTO-Verlag, 2007, pp. 35–46.
[BG10] Erik Burger and Boris Gruschko. “A Change Metamodel for the Evolution of
MOF-Based Metamodels”. In: Modellierung 2010, Klagenfurt, Austria, March
3http://www.eclipse.org/cdo4http://wiki.eclipse.org/Teneo5http://www.eclipse.org/emfstore
103

24-26, 2010. Ed. by Gregor Engels, Dimitris Karagiannis, and Heinrich C.
Mayr. Vol. P-161. GI-LNI. 2010.
[BKR09] Steffen Becker, Heiko Koziolek, and Ralf Reussner. “The Palladio component
model for model-driven performance prediction”. In: Journal of Systems and
Software 82 (2009), pp. 3–22.
[BP08] Cédric Brun and Alfonso Pierantonio. “Model Differences in the Eclipse
Modelling Framework”. In: UPGRADE The European J for the Informatics
Professional IX.2 (2008), pp. 29–34.
[Bur+13] Erik Burger et al. ModelJoin Technical Report. 2013. U R L: http://sdqweb.
ipd.kit.edu/publications/pdfs/burger2013modeljoin.pdf.
[Bur13] Erik Burger. “Flexible Views for View-Based Model-Driven Development”.
In: Proceedings of the 18th international doctoral symposium on Components
and architecture. WCOP ’13. Vancouver, British Columbia, Canada: ACM,
2013, pp. 25–30.
[Cic+08] Antonio Cicchetti et al. “Automating Co-evolution in Model-Driven Engi-
neering”. In: Proceedings of the 2008 12th International IEEE Enterprise
Distributed Object Computing Conference. EDOC ’08. Washington, DC, USA:
IEEE Computer Society, 2008, pp. 222–231.
[DIP12] Juri Di Rocco, Ludovico Iovino, and Alfonso Pierantonio. “Bridging state-
based differencing and co-evolution”. In: Proceedings of the 6th International
Workshop on Models and Evolution. ME ’12. Innsbruck, Austria: ACM, 2012,
pp. 15–20.
[HVW11] Markus Herrmannsdörfer, Sander D. Vermolen, and Guido Wachsmuth. “An
extensive catalog of operators for the coupled evolution of metamodels and
models”. In: Proceedings of the Third international conference on Software
language engineering. SLE’10. Berlin/Heidelberg: Springer, 2011, pp. 163–
182.
[KGT06] Andreas Knöpfel, Bernhard Gröne, and Peter Tabeling. Fundamental Modeling
Concepts: Effective Communication of IT Systems. Wiley, 2006.
[SJ07] Jim Steel and Jean-Marc Jézéquel. “On model typing”. English. In: Software
& Systems Modeling 6.4 (2007), pp. 401–413.
[Tos13] Aleksandar Toshovski. “Wiederverwendung von Metamodellen in ModelJoin-
Sichten”. MA thesis. Am Fasanengarten 5, 76131 Karlsruhe, Germany: Karl-
sruhe Institute of Technology (KIT), July 2013.
[Wac07] Guido Wachsmuth. “Metamodel Adaptation and Model Co-adaptation”. In:
ECOOP 2007 – Object-Oriented Programming. Ed. by Erik Ernst. Vol. 4609.
Lecture Notes in Computer Science. Springer Berlin Heidelberg, 2007, pp. 600–
624.
104
ELVIZ: A Query-Based Approach to Model Visualization
Marie-Christin Ostendorp, Jan Jelschen, Andreas Winter
University of Oldenburg
Germany
{ostendorp, jelschen, winter}@se.uni-oldenburg.de
Abstract: Visualization is an important technique for understanding and exploringcomplex models. To be useful, visualizations have to be specifically tailored towardsthe visualization task and the analyzed model. Many standard charts or graph-basedvisualizations exist, but need to be mapped to the concepts of the model under study.Existing model visualization tools often have predetermined visualization kinds andcontent, impeding reuse of standard visualizations for various purposes, or lacking theability to flexibly map source model concepts to different visualization elements.
This paper presents ELVIZ (”Every Language Visualization”), an approach to vi-
sualization, generic regarding both the source model, and the kind and content of thevisualization. ELVIZ applies model-driven engineering techniques both to transformarbitrary source models into the desired visualization models, and to generate saidmodel transformations from a query-based mapping of source model concepts to vi-sualization concepts. This cleanly decouples source and visualization meta-models,allowing to reuse and combine standard visualizations for various source models.
The ELVIZ approach is applied to scenarios from software visualization in softwa-re evolution and measuring energy consumption of mobile applications, using differentkinds of visualizations.
1 Motivation
Models are everywhere in computer science and software engineering, e.g. process mo-
dels, test models, or design models [Bez13]. To ease the understanding of these models, or
serve as a basis for communication, visualizations are very helpful. For example, to inves-
tigate code smells like too large classes in an existing software system a bar chart might
be very helpful: Instead of investigating the underlying code manually by regarding every
single class, a bar chart - in which each bar represents one class of the system and where
its height is set by the count of methods - is able to present the required information at one
glance. This bar-chart example will be used in Section 3.1 again to clarify the approach
presented in this paper using the model of a small software system as depicted in Figure 2
to generate the bar chart as presented in Figure 5c.
Many tools exist to generate such visualizations. However, the approaches often support
only a single kind of visualization, e.g. from using standard graphics like simple bar charts,
to elaborate visualizations like using a three-dimensional “city” to represent sets of cha-
racteristics of a model as properties of its buildings [WL07]. Which visualization is ap-
105

propriate depends on both the model under study, and the goals of the analysis task the
visualization is set to support. For instance, instead of visualizing the count of methods
per class to identify code smells, the aim of the visualization can be to show the percentual
distribution of the methods onto the different classes. In this case a pie diagram might be
more appropriate than a bar chart: Another visualization is needed but the visualization
content stays the same - the pieces should represent the classes and its size is set by the
count of methods of the particular class. Instead of generating a totally new visualization
or even taking another visualization tool into account, it would be more pleasant and time-
saving to reuse the specification of the visualization content for another visualization kind.
A reverse scenario might be that the content of the desired visualization changes e.g. vi-
sualizing the percentual distribution of the attributes onto the classes, but the visualization
kind - a pie diagram - stays the same. In this case the reusability of the visualization kind
is required.
So what is needed is an approach where visualization content and kind can be specified
separately, enabling independent reuse for different source models. This should be provi-
ded by ELVIZ (”Every Language Visualization”): ELVIZ is a generic, query-based model
visualization approach, using model-driven techniques to decouple source models, visuali-
zation models, and the tools used for rendering. In this context, rendering means layouting
the models content according to predefined visualization needs. Within ELVIZ, a model
can be of arbitrary structure, as long as this structure is rigidly defined by an appropria-
te meta-model. Queries over the source meta-model (expressed in an appropriate query
language) are used to define the concepts to be visualized - the visualization content. Vi-
sualization kinds i. e. the paradigms followed by concrete visualizations, are represented
by their meta-model. Queries can be associated with concepts of the visualization meta-
model, to form a mapping, which is automatically turned into a model transformation.
Once a visualization kind is specified by a meta-model and the appropriate renderer is
provided content, this specification can be reused for different source models in various
combinations with different specifications of the content via queries. So ELVIZ can be
seen as a framework to generate an appropriate visualization tool rather than a visualizati-
on tool itself.
In the following, ELVIZ is described in detail, starting with the presentation of related
work in Section 2. Section 3 clarifies ELVIZ with an illustrative example. In Section 4,
ELVIZ is applied to two different areas of application – to the field of software metrics
visualization, and to the field of power consumption of applications on mobile devices.
Section 5 summarizes the presented ELVIZ-approach and refers to possibilities to further
optimize and build upon it in the future.
2 Related Work
ELVIZ’s main use case is data visualization for software analysis in software evolution:
In the past various tools and approaches were published in this context: These include
graph-based visualization as for example”Tulip”[Aub01],
”da Vinci” [FW94],
”ASK-
Graphview” [AvHK06], and”GraphViz” as an Open source graph (network) visualization
106
project [EGK+01]. Apart from the approach to visualize models using graphs, there exist
visualization approaches especially developed for the field of software visualization: the
Unified Modeling Language is a well-known OMG-Standard to define models graphical-
ly [OMG06]. Lanza et. al presented visualizing software systems as”CodeCities” [WL07].
In these approaches, the kind and content of the visualization is predetermined. To get a
different visualization, the person creating the graphical representation has to get familiar
with these tools and approaches. In contrast to this, ELVIZ aims at leaving the choice for
a suitable graphical representation - including kind and content - to the person creating the
visualization. Thereby, ELVIZ is a framework to generate an appropriate visualization tool
rather than a visualization tool itself.
The BIRT framework presented by the Eclipse Foundation [Ecl14] is an eclipse plugin
able to visualize different contents with different kinds of visualization. BIRT is not ea-
sily expendable by new totally individual kinds of visualization as it has a limited range
of available report items. Furthermore BIRT can not easily be integrated into a larger
toolchain - e.g. extending for instance a metric calculation tool to visualize its results di-
rectly. In contrast ELVIZ aims at being easily extendable and should provide the possibility
to be integrated into a larger toolchain.
Therefore, ELVIZ is based on model-driven techniques [Ken02], to allow flexible and
automatic specification and generation of desired model visualizations.
Similar works on this kind of visualization generation by applying model-driven enginee-
ring to the field of model visualization were introduced [WW05] [BSFL06]. Wolff and
Winter [WW05] presented the transformation of Bauhaus Graphs into UML diagrams.
Both approaches applied MDE to automatically generate the visualizations. In contrast to
this, the ELVIZ approach aims at extending this procedure in that way that not only the
visualization is generated automatically but also the required transformation itself.
The ELVIZ-approach combines ideas from the field of graph technologies – especially the
idea of querying graphs [ERW08] with applying model driven engineering to the field of
information visualization [BSFL06]. to allow independent reuse of visualization content
and kind.
3 The ELVIZ-Approach
An overview of ELVIZ is depicted in Figure 1. Two major processes can be distinguished:
1) Generating a Visualization Tool to create a customized visualization tool, and 2) Exe-
cuting a Visualization Tool using this generated tool to produce visualizations of provided
models. The objective of the tool generation process lies in the construction of a reusa-
ble visualization tool for a new kind of visualization. This tool can be used to produce a
concrete graphical output for different source models. Both processes are briefly outlined
below, followed by more detailed explanations using an example in Section 3.1.
For the tool generation process, it is necessary to specify the input and output of the tool
to be generated: Therefore, the following steps have to be performed: First, the input has
107

sourcemeta-model
visualizationmeta-modelmeta-model
conformsto
conformsto
query-basedmapping
generate
transformation
1. extract 2. transform 3. rendersource model visualizationmodel
information
MDE
conformstoMDE
2. Executing the Visualization Tool
1. Generating a Visualization Tool
Figure 1: Overview of the ELVIZ-approach.
to be specified via the source meta-model. The graphical output has two parts to be speci-
fied: the kind of visualization, and its content. These two aspects are specified separately
from each other to allow separate reusability of these specifications for other tool gene-
rations, thereby reducing workload for generating a new tool. The kind of visualization
can be specified via the visualization meta-model, while the content is specified as query-
based mapping between the elements of the source meta-model and the elements of the
visualization meta-model. By associating a query over the source meta-model with each
concept of the visualization meta-model, a mapping is defined: This mapping describes
which elements of source models should be represented by which elements in graphical
representations.Defining queries is not necessarily easier than writing transformations. Ho-
wever, ELVIZ allows to manage queries and specfication of vizualization kinds separately,
enabling independent reuse, which is the real benefit. Furthermore queries do not limit the
possibilities for the contents of graphical representations [HE11].
ELVIZ assumes that input data is either readily available as models conforming to well-
defined meta-models, or that an appropriate fact extractor (e.g. a parser in case of source
code analysis) is provided to create such a representation from “plain” input data. Also,
besides the specification of the visualization via a visualization meta-model, a renderer
has to be available which creates the real graphical output conforming to the kind of vi-
sualization. Such a renderer has to be implemented only once for a given visualization
meta-model, though alternative realizations are possible. As last step, the source meta-
model, the mapping, and the visualization meta-model are used to automatically generate
the transformation making up the customized visualization tool.
Visualization tools generated in this way are used in the execution process. Here, the fol-
lowing steps have to be performed: extracting, transforming, and rendering the data. As
a first step, a source model is extracted from the input data to be visualized. This is a
pre-processing step; for example, if the input data consisted of a Java application to be vi-
sualized in a software evolution scenario, this step would correspond to parsing the source
code to create a representation on abstract syntax tree level. It yields a model represen-
tation conforming to the source meta-model, which is a prerequisite for the upcoming
108

transformation step. The next step takes a prior generated transformation, executes it, and
generates a visualization model fulfilling the mapping and conforming to the visualization
meta-model. In the last step, this model is finally transferred to an appropriate renderer to
create the actual graphical representation, e.g. as an image file.
An implementation of the ELVIZ approach has been created using the technological space
of TGraphs [ERW08] to represent models and meta-models. TGraph-based models can be
queried and transformed using the Graph Repository Query Language (GReQL) [ERW08]
and the Graph Repository Transformation Language (GReTL) [HE11], respectively. EL-
VIZ is not tied to these techniques, though. An alternative realization could, for example,
be implemented using ATL in OMG’s Model-Driven Architecture (MDA) [JK06, Sol03].
In this case ATL is used instead of GReTL and OCL replaces GReQL.
3.1 Example – Visualizing Software Metrics with Bar Charts
This example shows how a visualization tool, able to visualize properties and metrics of
java systems, is generated using ELVIZ (Section 3.1.1), and how to execute the generated
visualization tool to produce the graphical representation(Section 3.1.2).
package com.vizsave;public class Picture {
private Database database;public Picture() {…}public void edit() {…}public void save() {…}
}
package com.vizsave;public class Database {
public void initialize() {…}public void store(Picture p) {…}public void delete(Picture p) {…}public void get(Object Picturep) {…}
}
Figure 2: Source Code of the example system.
In this example scenario, a simple metric: the number of methods per class is to be visua-
lized. This can be represented appropriately by a bar chart, where bars represent classes,
and the height of each bar is determined by the number of methods. A small, fictitious
Java application to save images in a database is used in this example. It consists of two
classes the class”Database” to realize a database connection and the class
”Picture”. Each
contains a few methods, as indicated by the code snippets in Figure 2.
3.1.1 Generating a Visualization Tool
To generate the visualization tool, the input of the tool and the kind and content of the
desired visualization need to be specified.
Specifying the input. Since the input are Java software systems, an appropriate Java
meta-model is needed. For this simple example, a minimal meta-model is used, represen-
ting only those concepts carrying the information needed for the intended visualization
(Figure 3 left), and consists of three classes to represent packages, classes, and methods.
Their containment relationships are modeled with aggregation associations. Each class
also has a name attribute.
109

source meta-model visualization meta-model
constant valueconstant valueconstant value
12
3
4
5
6
7
8
Figure 3: Source meta-model, visualization meta-model and mapping between them.
Specifying the kind of visualization. In the example considered here, the number of
methods per class should be visualized as bar chart. The corresponding visualization meta-
model is shown on the right-hand side of Figure 3: A bar chart is represented by a Coor-
dinateSystem, with a name and labels for x-axis and y-axis. It consists of arbitrarily many
bars, each having a name and value determining the height of the bar. In the TGraph-based
ELVIZ implementation, visualization meta-models are created using GReTL, which is de-
signed to create target meta-models and models simultanously. It is also possible to use
pre-existing target meta-models, and the implementation could easily be extended to also
allow visualization meta-models to be specified using UML class diagrams, which can be
imported in standard XMI exchange file format.
Specifying the content of the visualization. The desired mapping is indicated by the
numbered arrows depicted in Figure 3. Each element of the visualization meta-model must
have its counterpart in the source meta-model. For instance, a separate bar chart should be
created for each package, which is ensured by mapping these two classes onto each other.
Each bar in a coordinate system stands for a Java class in the corresponding package, and
the value of the bar is set by the number of methods defined in that class. Therefore, the
calculation of the number of HasMethod incidences per class has to be specified as part
of the mapping to value-attributes of bars. To set a specific string as value for labels in the
desired graphical output, constant values can be used: For instance, to set the label on the
x-axis to “Classes”, the value of the x-axis attribute in class CoordinateSystem can be set
to the constant string”Classes”.
To realize this mapping, ELVIZ uses queries: queries are based on the source meta-model,
and are used to get specific elements out of the source model, or perform calculations over
110

it. By specifying a query for each concept of the visualization meta-model – as classes,
attributes and associations–, each query’s results can be used in a model transformation
to create instances or set attribute values in the target visualization model. In the TGraph-
based ELVIZ implementation, queries are expressed using GReQL. The GReQL queries
for the mapping of this example are shown in Figure 4, with numbers corresponding to
those depicted in Figure 3.
No. concept in visualizationmeta-model
GReQL-Query
CoordinateSystem from p: V{Package}with p.name="com.vizsave"
report p end
systemname from m: keySet(img_CoordinateSystem)reportMap m -> "Count of methods per Class" end
xaxis from m: keySet(img_CoordinateSystem)reportMap m -> "Classes" end
yaxis from m: keySet(img_CoordinateSystem)reportMap m -> "Count of methods" end
Contains from e: E{Contains}reportSet e, startVertex(e), endVertex(e) end
Bar from c: V{Class}, p: V{Package}with p-->{Contains}c and p.name="com.vizsave"report c end
name from m: keySet(img_Bar)reportMap m -> m.name end
value from m: keySet(img_Bar)reportMap m->count(from e: E{HasMethod}
with startVertex(e).name=m.namereport e end)
end
1
2
3
4
5
6
7
8
Figure 4: GReQL-Queries for the mapping shown in Figure 3.
GReQL queries usually start with a from-clause, specifying the domain of discourse: For
example, the GReQL query for the coordinate system (1) defines a variable p to range over
all nodes (vertices) of type Package. Constraints are specified in the with-clause. Here,
the with-clause specifies that only nodes with their name set to “com.vizsave” should be
considered. In the return-clause of the GReQL-query, the structure of the result returned for
each considered element of the domain is defined. In this case, this is just the node itself,
yielding a list of Package-nodes, which have the specified name. Note that this constraint
is for the example’s sake, and neither necessary, nor advisable, as binding to a specific
package name would needlessly impede reusability.
Another important construct in the GReQL-queries in Figure 4 are the keySet-function
and img -maps, used for instance in the GReQL query for the systemname attribute of
the coordinate system (2). The img -maps are provided by the transformation language
GReTL to refer to already established mappings. Here, the query’s domain of discourse
111

ranges over all elements already mapped to the coordinate system by the previous query,
i.e. packages named “com.vizsave”.
Generating the tool. The source meta-model, the visualization meta-model, and the
mapping are used to generate a model transformation embodying the desired visualiza-
tion. The target transformation language of the TGraph-based ELVIZ implementation is
GReTL [HE11]. GReTL expressions rely on GReQL queries, allowing to directly use the
queries specified in Figure 4 to transform models conforming to the source meta-model
into models conforming to the visualization meta-model. The following example shows a
GReTL rule to create a bar in the bar chart for each class contained in a specific package.
CreateVertexClass Bar <== from c: V{Class}, p: V{Package}
with p-->{Contains}c and
p.name="com.vizsave"
report c end;
This directly corresponds to Query (6) in Figure 4, associating it with a concept of the vi-
sualization meta-model. On the left-hand side, the CreateVertexClass command of GReTL
is used, to both create a new class in the visualization meta-model called Bar, and to crea-
te instances of this class for each element returned by the query on the right-hand side.
This query ranges over Classes and Packages, selecting those pairs, where the class is
contained in the package, and the package’s name is “com.vizsave”, and reporting the
classes. Each of these classes thereby becomes an archetype for an instance of class Bar.
Thus, the whole transformation can be generated automatically using information from
the mapping, source meta-model, and visualization meta-model: Internally, the transfor-
mation uses the GReTL API, to dynamically construct the required transformation code
as Java classes. GReTL can use existing target meta-models, but is also able to generate
target meta-models (schemas) and conforming target models (graphs) at the same time.
This means a visualization meta-model can be specified directly using GReTL. This will
then also provide the framework for the generator which will be able to create visualizati-
on tools, parameterized by a set of queries providing the mapping to a source meta-model.
To generate actual TGraphs for a specific source model, each visualization meta-model
concept needs such a GReQL-query, which will be included dynamically.
3.1.2 Executing a Visualization Tool
Transformations generated in the process described above essentially represent a visualiza-
tion tool tailored to specific needs dictated by the source data and the task to be supported.
This assumes that these transformations can integrate into an environment where data ex-
traction and visualization renderer tools are already present. The advantage of using ELVIZ
is that these tools have to be integrated only once, and then can be reused and recombined
for further visualizations. The three steps described in the following (and depicted in Fi-
gure 1) can therefore be performed automatically by the generated visualization toolchain.
Extract. As a preprocessing step, a source model suitable for further processing by mo-
del transformations has to be extracted from the input data. In the example, the input is Java
112

V2 Method
name = “initialize“
E1: HasMethod E2: HasMethod E3: HasMethod
E4:ContainsE5:Contains
V3 Method
name = “get“
V5 Class
name = “Picture“V1 Class
name = “Database“ V6 Packagename = “com.vizsave“
V4 Method
name = “store“
V7 Method
name = “delete“
V9 Method
name = “edit“
V10 Method
name = “save“
E6: HasMethod
E7: HasMethodE8: HasMethod
(a) The source model as TGraph.
V2 Barname = “Database“value=4.0
E1:Contains E2:Contains
V3 Barname = “Picture “value=2.0
V1 CoordinateSystem
systemname = “Count of methods per Class“xaxis=“classes“yaxis=“count of methods“
(b) The visualization model as TGraph. (c) Generated bar chart.
Figure 5: Source model, visualization model, and graphical representation.
code (Figure 2). A parser is used to extract the required information and creates a model
conforming to the source meta-model. ELVIZ assumes that such extractors are provided,
or that source data is already available as models, together with appropriate meta-models
they conform to. The model representation of the example is presented as TGraph in Figu-
re 5a. In this figure, certain characteristics of TGraphs become obvious. TGraphs consist of
nodes and directed edges. For example, the node V6 represents the package “com.vizsave”
of the example application. It has a type (Package) and an attribute (name). The edges
represent links between different nodes. For instance, V6 is connected with V1 by an ed-
ge of type Contains. This expresses that the class Database is contained in the package
“com.vizsave”.
Transform. The generated transformation is executed automatically. Based on the pro-
vided queries, mapped to visualization meta-model concepts, it produces the model shown
in Figure 5b. There is a single instance of CoordinateSystem, corresponding to the only
Java package of the source model. It contains two bars, one for each class. The values of
the bars (their height) is set to the number of methods defined in the corresponding classes,
four and two, respectively.
Render. As last step, the visualization model is rendered. ELVIZ requires a renderer for
each kind of visualization, i.e. for each visualization meta-model. A simple renderer for
bar charts to create the actual graphical representation has been implemented using the
JFreeChart library [Lim19]. Its output for the example program can be seen in Figure 5c.
113

4 Application of the ELVIZ-Approach
The example used in the previous section has been kept intentionally simple, to focus on
the principal concepts of ELVIZ. ELVIZ has been employed to different fields of appli-
cation, using more complex models. In this paper, three visualization scenarios from two
different domains are presented. The first domain is the visualization of software metrics
on a Java system, as in the previous example, however, an industry-scale Java meta-model
was used. A small Android application called GPSPrint serves as input data, and me-
trics are visualized in two different ways: using bar charts (Section 4.1), and using Code
Cities [WL07] (Section 4.2). The second application domain is that of energy-efficient ap-
plications. Here, the energy consumption of mobile applications, and its distribution across
different components of a mobile device is visualized using pie charts (Section 4.3).
4.1 Visualizing Software Metrics using Bar Charts
The amount of methods per class has been visualized for the GPSPrint App using the same
bar chart visualization meta-model as as presented previously, depicted on the right-hand
side of Figure 6. As source meta-model, a Java meta-model, developed in the context of
the SOAMIG project [FWE+12] is used. It consists of 86 node types and 67 edge types.
Figure 6 shows a small section of this meta-model on the left-hand side, containing those
concepts relevant for the metrics to be evaluated and visualized here.
part of source meta-model (SOAMIG) visualization meta-model
constant valueconstant valueconstant value
Figure 6: Source meta-model and mapping for the GPS Print Application.
The content of the desired bar chart should show the number of methods per class. The-
refore, the mapping has to be specified as shown in Figure 6 – each bar represents one
class of the GPSPrint Application, and the height of the bar is set by the number of me-
thods of each class. The result of this visualization is shown in Figure 7: three classes are
easily identifiable as containing considerably more methods than the average, GPSItem,
GPSPrint, and ViewItemList.
114

Figure 7: Bar chart of the number of methods per class for the GPSPrint Application.
4.2 Visualizing Software Metrics using Code Cities
A very different kind of visualization, also realizable using ELVIZ, are Code Cities. To
do this, an appropriate meta-model for this kind of visualization has been created, and
is shown in Figure 8a. A City consists of District with a districtname. Districts contain
Buildings, where each building is characterized by a name (buildingname), color (colorIn-
tensity), height and the length of its square base area (basesize).
The mapping is based on the Code City semantics presented by Lanza et. al [WL07]: a city
represents the whole code of an application (here GPSPrint). The districts represent the
packages, and the buildings stand for classes in these packages. The name of the building
is the name of the represented class. The color hue is set by the number of statements of
this class. Here, a linear color gradient is aimed at, represented by a real number between
zero and one. Alternatively, a set of possible colors could have been modeled using an
enumeration. The height is set by the number of methods, and the base size by the number
of attributes. The mapping contains corresponding queries, the most complex of which is
the one to set the color hue. It is shown below as GReQL expression:
let maxStatements :=
max(from m: keySet ( img_Building )
report numStatements(m)
end ) in
from m: keySet ( img_Building )
reportMap m -> (numStatements(m) / maxStatements)
end
115

(a) Meta-model for code
cities.
GPSPrint
Eula
Changelog
DegreeFormatter
ViewItemListOpenHelper
GPSItemGPSItem-Adapter
GPSItem-List
(b) Code city of the GPSPrint Application with a simplistic renderer
based on Java 3D (labels added in manual post-processing).
Figure 8: Code city meta-model and an actual code city rendering.
First, the let part of the query sets a variable maxStatements to the highest number of
statements encountered in a class. Classes are mapped to buildings in this visualization,
therefore the set of all classes can be obtained from the archetype of the mapping for
buildings. This is done by applying the keySet-function to img Building, which is a refe-
rence provided by GReTL to the already established buildings mapping. For each class,
the number of statements is calculated; GReQL’s max-function returns only the highest
of those values. Then, the actual mapping to color values is specified, associating each
building with a value between zero and one, by dividing the number of statements of the
corresponding class by the maximum number of statements. A renderer maps this value to
a continuous color gradient, e.g. from green, to yellow, to red, for low, medium, and high
values.
To ease understanding, and re-use functionality, this query uses the helper function num-
Statements to actually calculate the number of statements. Such functions can be specified
as part of the regular mappings, in a similar fashion, by associating a function name with
a query. Internally, it will be passed to the GReTL transformation producing the visualiza-
tion tool, making it available for use in all mapping queries. The query defining the helper
function is shown below:
using class:
count(class <--{frontend.java.HasTopLevelClassType}
-->{ˆfrontend.java.CallsMethod}*&{frontend.java.JavaStatement})
The using keyword is used to declare a parameter called class. The query assumes this to be
a node of type ClassType. A regular path expression yields all statements contained in this
class: first, an edge of type HasTopLevelClassType is traversed, leading to a JavaFile node.
From here, all paths of arbitrary length (denoted by an asterisk), ending at a JavaStatement
116

node, are considered, excluding those containing edges of type CallsMethod, which would
lead out of the class.
This application demonstrates that ELVIZ is also able to generate visualizations which are
very different from standard charts. The rendered code city image is shown in Figure 8b. A
simple renderer using Java3D places boxes in a grid to represent the buildings with given
base size and height, and uses the color attribute to paint them. A linear gradient starting at
bright green (zero), moving to yellow, and ending at deep red (corresponding to a value of
one). From the colors, it is immediately evident that most classes are small in their number
of statements, as most buildings are colored in slightly different shades of green. There is
one medium-sized class, ViewItemList, and the largest class, GPSPrint, which will always
be assigned a deep red color, as the mappings define the highest statement count occuring
to be the maximum number. Also, GPSPrint has a disproportionate number of attributes,
visible by its large base size, whereas ViewItemList has almost no attributes, but above-
average number of methods (height of the buildings). Due to the semantics chosen, some
classes are not depicted at all, because their base size (attributes) or height (methods) is set
to zero.
Using ELVIZ, this visualization model can be used with completely different input data,
given appropriate mappings, or only the mappings can be adjusted to change the seman-
tics of generated graphics. Also, other, more sophisticated renderers can be used, without
having to change the visualization meta-model or any mappings.
source meta-model visualization meta-model
constant value
Set by name ofreal componentclass
Figure 9: Source meta-model and mapping for GPSPrint concerning energy consumption.
117

4.3 Visualizing energy consumption using Pie Charts
To show that ELVIZ can not only be applied to the field of software visualization, ELVIZ
is applied to another field in this section – to visualize the energy consumption of smart-
phone applications: A problem of today’s smartphones is the limited battery time. This is
not only a problem caused by the limited hardware possibilities, but also by the code of the
applications [GJJW12]. It is possible to measure the energy consumption of mobile devi-
ces, and of applications running on them, using power profiles. A power profile provides
mean values of energy consumption for each component of a smartphone. By monitoring
the runtime of an application, and the state of the device’s components during this time,
the consumed energy for each component can be determined. This measurement method
has been applied to the GPSPrint Application to get detailed information about its energy
consumption. The results can be visualized using the ELVIZ approach, as well.
The source meta-model is shown in Figure 9 (left). A MobileDevice consists of different
components, like GPS, Bluetooth, and WiFi. Each of these components have a power con-
sumption. The desired kind of visualization is specified by a visualization meta-model: In
case of visualizing the energy consumption on a mobile device per component, a pie chart
is applicable. Pie charts show the relative distribution of the energy consumption per com-
ponent. Thus, as visualization meta-model, a meta-model for pie charts is specified, shown
on the right-hand side of Figure 9. A pie chart is modeled as a Pie with a piename, consis-
ting of arbitrarily many Pieces, which also have a name, and carry a value representing its
size in relation to the whole pie.
Figure 10: Bar chart for energy consumption of mobile components for GPSPrint.
As content of the visualization, it is desirable to have a pie chart where each piece repres-
ents one device component, and the size of the pie’s pieces is set by the measured energy
consumption of the corresponding component. The arrows between source and visualiza-
tion meta-model in Figure 9 indicate a mapping according to these requirements.
The rendered result for this visualization, based on measurement data from the GPSPrint
application running on an Android mobile phone, is shown in Figure 10. The renderer used
to create this image has been implemented using JFreeChart.
118

5 Conclusion and Future Work
In this paper, the ELVIZ approach has been presented: It is a new approach for generating
customized graphical representations of arbitrary source models by applying model-driven
engineering and graph querying techniques to the field of model visualization. The ELVIZ
approach is source-model-generic, and offers the possibility to create customized kinds
of visualizations. A major benefit of the ELVIZ approach lies in managing mappings and
visualization meta-models separately, enabling independent reuse: For example the same
content e.g. count of methods per class of a Java system can be reused for different visua-
lization kinds e.g. as pie or bar chart without any further effort.
An ELVIZ-based visualization tool is created in four steps: 1) Specifying the input format
using meta-models, or re-using an existing meta-model. Input data is assumed to be exis-
tent as models conforming to such a meta-model. Otherwise, an appropriate fact extractor
needs to be provided. 2) Specifying the kind of visualization, again, using a meta-model
defining the abstract syntax, e.g. bars in a bar chart. 3) Specifying the content of the visua-
lization using mappings based on queries. Queries depend only on the source meta-model
and can be re-used with different kinds of visualizations. 4) Generating the tool, using
as input a source meta-model, visualization meta-model, and a mapping. This is automa-
ted by ELVIZ, integrating those parts into a model transformation embodying the desired
visualization. For each visualization meta-model, an appropriate renderer is required to
provide actual graphical representations of visualization models.
The content can be defined separately from the kind of visualization by creating query-
based mappings between elements of source meta-models and elements of visualization
meta-models: Each element of a visualization meta-model has its counterpart in the sour-
ce meta-model. The exact elements to represent are extracted out of the source model by
specifying queries over the source model. Thereby, the specification of the kind of visua-
lization, and the mapping – embodying the content of the visualization – are reusable for
different source models and can be combined in different ways for different usage scenari-
os. Thus, the overall workload for creating a new graphical representation can be reduced.
Another advantage of the ELVIZ approach is, that it is not only generic concerning source
model, visualization kind, and visualization content, but also concerning to the implemen-
tation details of the approach. In this paper, one possible implementation, realizing the
ELVIZ approach in the technological space of TGraphs has been presented. The conceptu-
al architecture of ELVIZ can also be implemented using other technologies, such as using
ATL and related MDA techniques. Thereby, the ELVIZ approach is able to remain use-
ful for future projects, and to profit from future technologies in the field of model-driven
engineering and querying.
The capability of ELVIZ to specify new kinds and contents for model visualizations,
and to reuse and combine them, fits well with ongoing work on software evolution ser-
vices [JOMW13], aimed at enhancing interoperability of software evolution tools, and
easing their integration. In this area, ELVIZ fills the role of a universal visualization ser-
vice, required by many software analysis and reverse engineering activities, where it can
be integrated with other services to create customized toolchains. ELVIZ will be used as
visualization of a service-based metrics tool currently being developed.
119

Literature
[Aub01] D. Auber. Tulip. In Graph Drawing. Springer, 2001.
[AvHK06] J. Abello, F. van Ham and N. Krishnan. ASK-GraphView: A Large Scale Graph Visua-lization System. IEEE Transactions on Visualization and Computer Graphics. 12(5),2006.
[BSFL06] R. I. Bull, M. Storey, J.-M. Favre and M. Litoiu. An Architecture to Support ModelDriven Software Visualization. In 14th IEEE International Conference on ProgramComprehension, ICPC, Washington, 2006. IEEE.
[Bez13] J. Bezivin. Models Everywhere, http://modelseverywhere.wordpress.com (19-09-2013).
[Ecl14] Eclipse. BIRT Project Description and Scope, http://www.eclipse.org/birt/phoenix/project/description.php (09-01-2014).
[EGK+01] J. Ellson, E.R. Gansner, E. Koutsofios, S.C. North and G. Woodhull. Graphviz - OpenSource Graph Drawing Tools. In 9th International Symposium on Graph Drawing,LNCS 2265. Springer, 2001.
[ERW08] J. Ebert, V. Riediger and A. Winter. Graph Technology in Reverse Engineering. TheTGraph Approach. In 10th Workshop Software Reengineering., LNI 126, 2008.
[FWE+12] A. Fuhr, A. Winter, U. Erdmenger, T. Horn, U. Kaiser, V. Riediger and W. Teppe.Model-Driven Software Migration - Process Model, Tool Support and Application. InA. Ionita, M. Litoiu and G. Lewis, eds., Migrating Legacy Applications: Challengesin Service Oriented Architecture and Cloud Computing Environments, Hershey, PA,2012. IGI Global.
[FW94] M. Frohlich and M. Werner. Demonstration of the Interactive Graph-VisualizationSystem da Vinci. In R. Tamassia und I. Tollis, eds., Graph Drawing, LNCS 894.Springer, 1994.
[GJJW12] M. Gottschalk, M. Josefiok, J. Jelschen and A. Winter. Removing Energy Code Smellswith Reengineering Services. In U. Goltz et al., eds., 42. Jahrestagung der Gesellschaftfur Informatik e.V. (GI), LNI 208. Kollen, Bonn 2012.
[HE11] T. Horn and J. Ebert. The GReTL Transformation Language. In J. Cabot and E. Visser,eds., ICMT LNCS 6707. Springer, 2011.
[JOMW13] J. Jelschen, M.-C. Ostendorp, J. Meier and A. Winter. A Description Model for Soft-ware Evolution Services. 1er Congreso Nacional de Ingenierıa Informatica / Sistemasde Informacion, RIISIC, Cordoba, Argentina, 2013.
[JK06] F. Jouault and I. Kurtev. Transforming models with ATL. MoDELS’05, Berlin, Hei-delberg, 2006. Springer.
[Ken02] S. Kent. Model Driven Engineering. In Third International Conference on IntegratedFormal Methods, IFM, London, 2002. Springer.
[Lim19] Object Refinery Limited. JFreeChart, http://www.jfree.org/index.html(2013-09-19).
[OMG06] Object Management Group OMG. UML - Unified Modeling Language, www.uml.org (2013-09-06).
[Sol03] R. Soley. Richard Mark Soley. Model Driven Architecture: The Evolution of Object-Oriented Systems? In D. Konstantas et. al, eds., OOIS 2817 of LNCS. Springer, 2003.
[WL07] R. Wettel and M. Lanza. Visualizing Software Systems as Cities In Visualizing Soft-ware for Understanding and Analysis., IEEE, 2007.
[WW05] J. Wolff and A. Winter. Blickwinkelgesteuerte Transformation von Bauhaus-Graphennach UML. Softwaretechnik-Trends, 25(2), 2005.
120

Coupling and process modelingAn analysis at hand of the eEPC
Daniel Braunnagel, Florian Johannsen, Susanne Leist
Department of Management Information SystemsUniversity of Regensburg
Universitätsstraße 3193053 Regensburg
[email protected]@wiwi.uni-regensburg.de
Abstract: Business process modeling is a fundamental aspect in BPM initiatives.Being a central means of communication and documentation, both the quality andunderstandability of process models are decisive. However, the concept of processmodel quality is still not fully understood. The recent development has highlightedthe role of coupling in models. Coupling is expected to represent an importantdimension of quality for conceptual models. Still, contrary to software engineering,this perspective is hardly understood or adapted in form of metrics in processmodeling. Therefore, this work collects diverse coupling metrics in the field ofsoftware engineering and transfers them to the eEPC modeling language. Onceintroduced and formally specified, the metrics serve for a discussion on coupling,process model quality with respect to coupling, and for their implementation.
1 Introduction
Business process modeling has gained considerable attention in BPM initiatives in recentyears [MRv10;Be10;PSW08]. Process models help a business analyst in documentingand analyzing a company’s business processes properly [Be10]. Based on thoroughprocess documentation, improvement initiatives can be triggered whereas processsimulation may be used for identifying weaknesses in the current process design and forevaluating alternative should-be process designs [va10]. Further, process models serve asa means for communication between stakeholders and software developers [GL06].Therefore profound decisions on IT-investments are possible, indicating whethersoftware is to be developed individually or standard software is to be bought forsupporting a business process [Ag04;Be10]. Process models help to derive requirementssoftware has to meet in a systematic way [BRU00].
However the described benefits of process modeling become blurred in case the processmodels cannot be understood by its users (see [GL06;HFL12;BRU00]). A high qualityof the process models is thus decisive for BPM initiatives as well as for softwaredevelopment projects. Nevertheless, quality and understandability of process models arepoorly understood concepts yet (see [HFL12;Mo05]). A process model is a “construction
121
of the mind” which makes its quality hard to judge [Mo05]. As a consequence,evaluating conceptual models usually is an “art” and does not follow systematicguidelines [Mo05].
For assessing the quality of process models, a variety of quality dimensions, such ascomplexity, modularity, size or cohesion have been introduced and correspondingmetrics have been developed (see e.g. [Va07;Me08;GL07]). Further, top-downframeworks (see e.g. [BRU00]), pragmatic guidelines (see e.g. [Si08]) and empiricalstudies (see e.g. [Re11]) can be found as approaches for operationalizing process modelquality [MRv10]. Recently “coupling” has been presented as a quality dimension forbusiness process modeling (see [Va07;Va08;KZB10]). While “coupling” is a well-established quality characteristic in information systems development, research has onlyjust begun to investigate the “coupling” concept in the context of process model quality.
In the current understanding, coupling is generally defined as the connectedness ofelements. It is generally used as a means to improve the understandability andmaintainability of processes and respective models. [Va07] The actual way to achievethis goal, however, is subject to different implementations of the concept. As anexample, Vanderfeesten et al. use coupling on the one hand to evaluate the variety of aprocess. Therefore they analyze whether or not a process allows so many alternativesthat it becomes difficult to understand all of them [Va08]. On the other hand,Vanderfeesten et al. also use coupling as means to balance the alignment of parts of aworkflow between an overly flexible or rigid structure [VRv08]. The diversity ofavailable applications underlines the multiplicity of interpretations of the concept ofcoupling for process modeling.
In addition to the two above examples, a couple of further publications deal with thetopic of coupling in process modelling (see section 2.1). Even though each of thesepublications introduces another interpretation of coupling, the currently availableliterature does not cover the definition extensively. As a consequence the understandingof what constitutes the quality of a process model from the perspective of coupling islimited. Also the means to measure and control the understandability and maintainabilityof processes or process models respectively remain limited.
The objective of the current paper is therefore to supplement the range of interpretationsof coupling and its means of determining it by introducing new ways of measuringcoupling in the field of process modelling.
A thorough discussion and analysis as well as a practical application of coupling inprocess modeling require a detailed and precise interpretation. The preferred means ofthe available publications (see section 2.1) are metrics, which are described eitherformally or semi-formally. Their specification describes precisely which elements of aprocess model and which connections are taken into account and how inferences on thequality of models are made upon them. Consequently this work uses metrics as means ofintroducing new ways to measure coupling in process modeling. Further, since metricsare necessarily language-dependent and in order to retain an insightful level of detail wefocus on the modeling language eEPC.
122

The contributions of this paper are as follows. We supplement the current body ofknowledge on coupling in process modelling with further interpretations of the concept.We therefore continue the work of discovering new factors determining the quality ofprocesses and process models from the perspective of coupling. We provide precisedefinitions for each interpretation in the form of measures which are the means for athorough discussion of what constitutes coupling in process modelling and for measuringand controlling the quality of process models.
The paper is structured as follows: In the following section we provide an overview ofrelated work and basic terms. After introducing the methodology of transferring themetrics to EPC models (section 3), we present corresponding metrics in section 4.Section 5 explains the implementation of the metrics. The paper ends with a summary ofthe results, limitations and an outlook on future research.
2 Basics and Definitions
2.1 Coupling
The current literature on coupling in process modeling is preceded and influenced byliterature on software engineering [Va07]. There, coupling is operationalized in the formof metrics to predict measure and control the quality of software code and its conceptualmodels respectively. Each metric implicitly defines a particular interpretation ofcoupling. E.g. one definition focuses the graph representation of software systems, i.e.the way nodes are connected by arcs, whereas another definition uses information theoryto account for reused code [CK94]. Some further definitions can be found together withmultiple metrics interpreting each of them (see section 3).
In process modeling, Vanderfeesten et al. present a definition for the concept ofcoupling: “Coupling is measured by the number of interconnections among modules.Coupling is a measure for the strength of association established by the interconnectionsfrom one module of a design to another. The degree of coupling depends on howcomplicated the connections are and on the type of connections.” [Va07]. Here, couplingis generally considered as measurable and its key concept is the connections qualified byadditional concepts (e.g. number, strength, etc…). As a means to improve the quality ofconceptual models, reducing coupling is expected to improve the structure towards moreunderstandable models. [Va07]
This definition founded several coupling metrics in process modeling. E.g.Vanderfeesten et al. present the coupling metric CP evaluating all pairs of nodesaveraging their value over all pairs [VCR07]. Another metric by Vanderfeesten et al. isthe cross connectivity metric analyzing the number of different possible paths in aprocess model [Va08]. Other authors use already available metrics from softwareengineering as starting point for their work. E.g. Cardoso et al. transfer metricsdeveloped by Halstead (cf. [Ha77]) that use information theory to quantify code reuse[Ca06]. They further transfer metrics by McCabe (cf. [Mc76]) that quantify the paths
123

through a model [Ca06]. The fan-in/fan-out metric, quantifying branches, developed byHenry/Kafura (cf. [HK81]), is transferred by Mendling (cf. [Me06]) and Cardoso et al.(cf. [Ca06]). Although these metrics exist, they do not exhaust the definition byVanderfeesten et al. (cf. [Va07]). Further, the range of existing definitions alreadydemonstrates how vague the current understanding of coupling is and that an extensiverange of metrics with their precise definitions is necessary to render more precisely thecurrently fuzzy understanding. Further each distinctive metric introduces an additionalapplication scenario. We therefore continue the previous work by transferring furthermetrics.
2.2 EEPC modeling
Event-Driven Process Chains (EPCs) are a popular standard for business processmodeling [STA05;Me08]. EPC models can be extended by additional information indifferent views (e.g. data view, organization view, etc.) (see [STA05]) in which caseliterature then speaks of enhanced Event-Driven Process Chains (eEPCs). For the currentwork, relevant aspects of the eEPC can be formalized as follows (see [vOS05;Me08]).
An extended enhanced Event-Driven Process Chain (eEPC) is defined as weaklyconnected Graph 𝑔 = (𝑁,𝐴), fulfilling:1. The set of nodes N is the union set of the four disjoint sets E, F, C, P and R where
• E is the set of events 𝐸 = 𝐸𝑠 ∪ 𝐸𝑓 ∪ 𝐸𝑖 and 𝐸𝑠 ,𝐸𝑓 and 𝐸𝑖 are the disjoint sets of
start-, final- and intermediate events with |𝐸𝑠| ≥ 1 and �𝐸𝑓� ≥ 1.• 𝐹 ≠ ∅ is the set of functions.• 𝐶 is the set of connectors,• 𝑃 is the set of process interfaces.• 𝑅 is the set of resources, I encompasses the information elements: 𝐼 ⊆ 𝑅
2. Each arc a in 𝐴 ⊆ (𝐸 ∪ 𝐹 ∪ 𝐶 ∪ 𝑃 ∪ 𝑅) × (𝐸 ∪ 𝐹 ∪ 𝐶 ∪ 𝑅) connects two differentnodes:• |𝑛 ∙ | = 1 for each 𝑛 ∈ 𝐹 ∪ 𝐸𝑖 ∪ 𝐸𝑠 and |∙ 𝑛| = 1 for each 𝑛 ∈ 𝐹 ∪ 𝐸𝑖 ∪ 𝐸𝑓.• Resources are connected with undirected arcs.
3. Process interfaces have either an incoming or an outgoing arc: ∀𝑝 ∈ 𝑃: (|∙ 𝑝| = 1 ∧|𝑝 ∙ |= 0) ∨ (|∙ 𝑝| = 0 ∧ |𝑝 ∙ | = 1)A hierarchical eEPC 𝑒𝐸𝑃𝐶𝐻 = (𝐺, ℎ) is a set of eEPCs 𝑔 ∈ 𝐺 and a partial relationℎ:𝐷 → 𝐺 of the set D of decomposed functions or process interfaces in 𝑍:𝐷 ⊂⋃ (𝑃,𝐹)𝑔∈𝐺 . For a node 𝑑 ∈ 𝐷 where ℎ(𝑑) = 𝑔, g is called subprocess of d or processreferenced by d.
The above definition covers the notation which will be used later on. A more exhaustivedefinition of the eEPC modeling language can be found in [vOS05;Me08].
124

3 Methodology
Figure 1 summarizes our methodology. First, conducting a literature review, we searchfor already existing coupling metrics in both, software engineering and processmodeling. Second, we transfer discovered metrics from software engineering to processmodeling. This step is detailed in figure 2. The work ends with discussing the results.The conceptual approach behind this work is presented in [BJ13]. There we present theidea as well as the expected results of the transfer.
Figure 1: Methodology
For the review, the electronic databases Google Scholar, Computer.org, AISeL andEmerald Insight were queried (cf. [Co06;Vo09]). The hits, 46 peer-reviewed results wereconsidered as relevant on the basis of their title or abstract, consist of 32 conferencepapers, nine journal papers, four technical reports and one book. Five sources definedmetrics that are transferred and presented in this work. The remaining literature can begrouped as follows.
Use cases [Ar07;BLS01;BS98;CZ10;El01;Go10;HCN98;LC01;Ma09;MB07;Va07;WK08]
Not transferred [Al10;Bi10;Br98;BDW99;BDM97;Ch98;Gr09;GS08;HM95;JJ10;OTE06;Pe07;QLT06;QT09;RL92;SJ09]
Already specified [Ca06;HK81;VCR07;Va08]Redundant [CYB09;Kh09;KZB10;RH97;SS05;Új10]Transferred [AKC99;AKC01;CK94;GS06;Ka11;Me06;PM06;RV04]
Table 1: Grouped literature review results
A first group discusses use cases, resp. consequences of high coupling. E.g. [BS98]discuss relations of coupling and run-time failures in software. The second grouppresents metrics that cannot be transferred to process models. E.g. [Gr09] present anapproach involving runtime information which is not available in conceptual models.Third, sources discuss coupling metrics that were originally developed or transferred foreEPCs, (e.g. [Ca06;Me06;VCR07;Va08]). The existing metrics will be discussed morethoroughly in section 5. Finally, the fourth group of literature is redundant. Thesesources discuss metrics that are already part of the above groups. E.g. Khlif et al. transfermetrics to BPMN. We refer to the original description [Kh09]. A more detailedpresentation of transferred and not transferred metrics can be found in [BJ13].
The remaining metrics were transferred as shown in figure 2.
Figure 2: Transfer
1. Literature review 2. Transfer 3. Discussion
2.1 Identify concepts 2.2 Identify equivalent concepts 2.3 Reformulate metric
125

First, we identified the concepts of each metric’s variables. Then, equivalent concepts inthe eEPC notation were identified. Finally, the original concepts in the metric’sdefinition were replaced to reformulate the metric.
4 Coupling metrics in the context of eEPC modeling
4.1 Process Coupling
Reijers/Vanderfeesten present the Process Coupling metric (see [RV04]). Its objective isthe delineation of functions that are to be executed en block. Since overly large workunits turn processes inflexible and overly small work units increase the number ofhandovers making processes failure-prone, the balanced delineation of functions in aworkflow is a means for its improvement. The functions size is measured by the numberof connected information elements. [RV04]
Identify concepts. The metric was originally defined for a graph of nodes and arcsrepresenting information elements and operations respectively. The structure focuses theprocessing of information elements and is called information element structure. It isdelineated into partitions representing activities. The metric calculates the quotient of thenumber of activities actually coupled and the number of activities possibly coupled.Activities that involve one or more common information elements are considered as“coupled”. [RV04]
Identify equivalent concepts. To transfer the metric to eEPC modeling language, theprocedure in section 3 was used. First, involved concepts were identified which areinformation element, activity and operation. Equivalent concepts were identified usingthe original description. Information elements exist in both domains with similarmeaning. Activities express behavior and possess information elements as do functionsin eEPCs. Operations, expressing the way information elements are combined at a veryhigh level of detail, could not be matched with eEPC concepts. However, the calculationdoes not require them.
Reformulate metric. Adapted to the eEPC language and formalization from section 2.2,process coupling for eEPCs can be calculated as follows. The degree of ProcessCoupling k is the sum of coupled pairs of information elements divided by the maximumpossible number of pairs.
• 𝑘 = �∑ 𝑐𝑜𝑛𝑛𝑒𝑐𝑡𝑒𝑑 (𝑓𝑥,𝑓𝑦)𝑓𝑥,𝑓𝑦∈𝐹|𝐹|∗(|𝐹|−1) , |𝐹| > 10, 𝑒𝑙𝑠𝑒Functions are connected with each other if they share a common information element.
• 𝑐𝑜𝑛𝑛𝑒𝑐𝑡𝑒𝑑�𝑓𝑥, 𝑓𝑦� = �1, 𝑖𝑓 (𝑓𝑥, 𝑖𝑖) ∈ 𝐴 ∧ �𝑓𝑦 , 𝑖𝑖� ∈ 𝐴 ∧ �𝑓𝑥 ≠ 𝑓𝑦�0, 𝑒𝑙𝑠𝑒Application. The metric quantifies the interdependence of activities regardinginformation elements. To achieve a low degree of coupling, one reduces the number of
126

coupled pairs, i.e. splitting tasks in such a way that information elements are grouped inthe same function, or one increases the number of functions without introducing newpairs. A process with perfectly low coupling would use any information element onlyonce as in- or output. A process with perfectly high coupling would be such that everystep in a workflow depends on one and the same information. In such a process everystep would come to a halt in case this one information was missing or the one personprocessing the information was ill, indicating a highly inflexible process design.However, it remains difficult to interpret the difference of two values, e.g. what is theimpact of 10% more coupling? In summary, the metric has a special purpose, namely toquantify the dependency degree of process steps. It allows comparing different processdesigns and also gives a rough indication of how good or bad a design is regarding thecoupling of activities.
4.2 Coupling of a module, intramodule coupling of a module
Allen et al. present a pair of metrics, the coupling of a module and the intramodulecoupling of a module. They use information theory to quantify the amount ofinformation in the structure with a special focus on connections between eEPCs. Theauthors argue that the cognitive limitation of a model user is a reason formisunderstandings and erroneous application if the model exceeds this limit. Therefore,the measure is a means of controlling the amount of information in the presented model.[AKC01]
Identify concepts. The metrics focus a graph with modules that partition nodes. Nodesfrom different partitions can be connected. The coupling of a module assesses the graphstructure connecting different modules. Therefore, the graph is reduced to arcsconnecting nodes from different modules. Second, the arcs are used to build a predicatetable, i.e. the incidence pattern, for each node. Third, the relative frequency of eachpredicate is used to calculate its entropy. Finally, the entropy values are summed up. Thesecond metric, the intramodule coupling of a module, follows the same procedure witharcs connecting nodes within eEPCs.
Identify equivalent concepts. The transfer focuses the graphs of eEPCs. Accordingly,nodes in an eEPC, i.e. functions, connectors, resources, etc. are considered as nodeshere. Further, arcs from an eEPC are considered arcs here. Modules group nodes andarcs; therefore we use an eEPC for modules. However, the eEPC notation has no arcsbetween eEPCs. Therefore we propose using process references and decompositions asthe extension of the control flow, i.e. as arcs connecting eEPCs.
Reformulate metric. As a consequence of the previous step, the definition from section2.2 is extended in the context of this metric by arcs between eEPCs:𝐵 is the set of intermodule arcs:
• 𝐵𝑝 is the set of process references from eEPCs referencing each other.• 𝐵𝑒𝑠 is the set of pairs of decomposed function and start-events of the referenced
models.
127

• 𝐵𝑒𝑓 is the set of pairs of an end-event of a referenced eEPC and a decomposedfunction referencing the eEPC.
• Then 𝐵 is defined as: 𝐵 = 𝐵𝑝 ∪ 𝐵𝑒𝑠 ∪ 𝐵𝑒𝑓. Each tuple in 𝐵 is a directed arccalled intermodule arc.
• The intermodule sub-graph 𝑆𝑖∗ consists of all the nodes of a group of eEPCs andarcs connecting nodes from different eEPCs with nodes from an eEPC i.𝐼𝑛𝑐𝑖∗ is an incidence matrix of 𝑆𝑖∗: 𝐼𝑛𝑐𝑖∗ = �𝑖𝑛𝑐𝑛,𝑎� ∈ 𝑆𝑖∗ with 𝑖𝑛𝑐𝑛,𝑎 = �1, 𝑖𝑓 𝑛𝑖 ⊂ 𝑎0 𝑒𝑙𝑠𝑒
A pattern 𝑝𝑎𝑡𝑗 is a sequence of 0 and 1 of line vectors of the matrix. Its probability𝑃𝑟𝑜𝑏(𝑝𝑎𝑡𝑗) is its frequency over the number of distinct patterns.The information content of a sub-graph 𝑆𝑖∗is defined as:
• 𝐼(𝑆𝑖∗) = ∑ (− log2 𝑃𝑟𝑜𝑏(𝑝𝑎𝑡𝑗))𝑛𝑗=0Finally, the coupling of a module is defined as:
• 𝐶𝑜𝑢𝑝𝑙𝑖𝑛𝑔(𝑚|𝑀𝑆) = ∑ 𝐼(𝑆𝑖∗)𝑖∈𝑚The metric intramodule coupling of a module follows the same steps, although instead ofarcs connecting nodes from different eEPCs, with arcs connecting nodes from the sameeEPC for the intramodule sub-graph 𝑆𝑖°. The metric is defined as:
• 𝐼𝑛𝑡𝑟𝑎𝑚𝑜𝑑𝑢𝑙𝑒𝐶𝑜𝑢𝑝𝑙𝑖𝑛𝑔(𝑚𝑘|𝑀𝑆) = ∑ 𝐼�𝑆𝑖°�𝑖∈𝑚𝑘Application. The metrics build on information theory and calculates the entropy of arcsas means of their complexity. It is therefore an ambitious attempt to quantify thecognitive load imposed on a model reader. The authors explain that a simpler structure isbetter understandable and indicated by a lower metric value [AKC01]. The practicalapplication, however, is limited. For once, the metric does not account for the amount ofinformation stemming from the nodes semantics. Further, the metric is constructed in away that it is essentially driven by the number of nodes. Also, without any indicatorabout the actual cognitive limits of model readers, any calculated metrics value remainswithout reference and has therefore a weak indicational value. The metrics may thereforebe used to compare two alternative layouts but do not allow any inference to be drawnabout minimal, optimal or maximal values. Finally, a user will face trouble trying tounderstand what the metric actually does and why low values are important in this case.In summary, the metric is an interesting attempt to use information theory as a means ofassessing the complexity of conceptual models. Nonetheless, the lack of reference valuesand complicated construction make the metric difficult to apply.
4.3 CBO, RFC
Chidamber and Kemerer introduced the CBO and RFC metric for object-orientedsystems analyzing how classes are connected. They argue that highly connected classesare hardly reusable and difficult to change [CK94].
Identify concepts. The CBO metric counts the connections of one class with otherclasses, the RFC metric also considers the number of methods in the source class.
Identify equivalent concepts. These metrics (and the following one) use the conceptssoftware program, class, and method. Previously published literature transferred them in
128

[Va07] and [Kh09]. Further, [GR00] mapped eEPC constructs onto the ontology of[We97] and [EW05;EW09] mapped programming constructs onto [We97]. ThereforeWeber’s ontology is used as mediator to compare both domains. Table 2 summarizes thetransfer for the current context.
Method. The method in object-oriented programming expresses the behavior of classes[Ar06]. For their transfer to BPMN, Khlif et al. suggest the analogy to tasks. Further,Vanderfeesten et al. propose the analogy with operation elements. Since operations haveno equivalent in eEPCs, functions are the best fit (c.f. section 4.1). Ontological analysesof [GR00;EW05;EW09] suggest that functions have their ontological equivalents intransformations and therefore their object-oriented equivalent in operations. As before,the degree of detail of operations is not shown in eEPCs. The ontological equivalent ofmethods is lawful transformations, subsets of all possible transformations. Nonetheless,considering the lawfulness being negligible here, the analogy of method and function fitsclose enough. [Va07;Kh09]
Class. In object-orientation, classes group methods into logical units [Ar06]. Khlif et al.map classes onto processes and sub-processes [Kh09]. Vanderfeesten et al. relate classesto activities arguing along the hierarchy of methods and classes [Va07]. Consequently,we suggest the equivalence of classes and sub-processes, since activities are alreadymapped onto functions. The ontological analyses of Green/Rosemann andEvermann/Wand (see [GR00;EW05;EW09]) suggest that classes find their ontologicalequivalent in functional schemas. They describe the temporal order of states, as is alsodone by process models. The ontological concept of a “process”, as mentioned byGreen/Rosemann, could not be found. Therefore, the current mapping relates a classonto a sub-process diagram.
Software program. The software program is a set of classes [Ar06]. The concept isignored by Khlif et al. However, Vanderfeesten et al. argue along the hierarchy ofconcepts to map programs onto business processes. We follow their suggestion.[Va07;Kh09]
Object orientation eEPC notationSoftware program All eEPCs of a processClass Sub-process diagramMethod (private) FunctionMethod (public) /Interface Process interface, decomposition
Table 2: Conceptual mapping
Reformulate metric. CBO is calculated as the number of connections from one eEPC toanother eEPC.
• 𝐶𝐵𝑂 = |C ∪ P|RFC counts the number of process interfaces and decomposed functions plus the numberof functions in the eEPC.
• 𝑅𝐹𝐶 = |𝐶 ∪ 𝑃| + |𝐹|Application. The CBO metric quantifies the number of connections a model has withanother model. The RFC metric additionally takes the number of functions of a model
129

into account. Lower numbers indicate more readable models. The metrics fromChidamber/Kemrerer are well known and have been subject to empirical research (c.f.[HCN98]). Their application and interpretation is easy. They do, however, capture thecomplexity of the models only partly, e.g. they count the number of connections but donot evaluate them, and further do not incorporate all nodes, arcs and their meaningwithin models. Further, information about levels that constitute “easy” or “difficult”models is not available. In summary, the metrics are an easy and transparent way toanalyze the number of connections between eEPCs. Still, without any information aboutthe levels of the metric, the interpretation of a value is difficult. It remains to comparetwo alternative models.
4.4 Direct Coupling, Indirect Coupling, and Total Coupling
Gui/Scotts’ intention is to improve the CBO and RFC metric incorporating transitiverelations [GS08].
Identify concepts. The calculation takes three steps. First, the direct coupling betweentwo classes is calculated as the quotient of commonly used methods to all methods in thefirst class. Second, the indirect coupling between two classes is calculated as the productof all direct coupling values on the longest path in between. Finally, the total coupling iscalculated as the quotient of the sum of all indirect coupling values and the number ofpairs of classes.
Identify equivalent concepts. Building upon the metrics CBO/RFC, the transfer ofconcepts in table 2 can be used again. EEPCs are used for classes, references for publicmethods, and functions for private methods.
Reformulate metric. The direct coupling metric calculates the quotient of processreferences between two eEPCs g1 and g2 and the functions and process interfaces ineEPC g1. This is formalized:
• 𝐶𝑜𝑢𝑝𝐷(𝑔1, g2) = |𝐷𝑔1,𝑔2||𝐹𝑔1∪𝑃𝑔1|For a pair of eEPCs 𝑔1 and 𝑔2 connected by a path 𝜋 (the longest available), the indirectcoupling metric calculates the product of direct coupling values on the path:
• 𝐶𝑜𝑢𝑝𝑇(𝑔1,𝑔2,𝜋) = ∏ 𝐶𝑜𝑢𝑝𝐷(𝑔3,𝑔4)𝑔3,𝑔4∈𝜋The metric is aggregated over all eEPCs in a system calculating the average indirectcoupling among all eEPCs G:
• 𝑊𝑇𝐶𝑜𝑢𝑝 = ∑ 𝐶𝑜𝑢𝑝𝑇(𝑖,𝑗)𝑖,𝑗∈𝐺|𝐺|2−|𝐺|Application. The metrics extend the CBO metric by Chdiamber/Kemerer by paths overseveral connected eEPCs. It presents an indicator for the length of a process model andfor how many different eEPCs need to be referred to in order to understand all paths in aprocess, where shorter lengths (a lower value) indicate a lower complexity. The metric ismore sensitive than counting the number of eEPCs, since it takes into account which partof a process is reachable after all. I.e. a low value is reached if the parts are connectedlinearly so that a reader can follow the eEPCs in sequence. The value will rise if the parts
130

are connected in circles and a reader has to refer to eEPCs repeatedly to follow a paththrough the process.
4.5 Conceptual coupling
Poshyvanyk/Marcus present the conceptual coupling metric that uses semanticinformation to calculate how far methods in object-oriented programming refer to thesame semantic concept. A high semantic overlap indicates dependency causingcomplexity and should thus be avoided [PM06].
Identify concepts. The metric references information retrieval techniques to decomposea set of classes into semantic concepts. Poshyvanyk/Marcus combine vector spaceretrieval and latent semantic indexing on the source code of classes as text corpus. First,the source code of the methods is transformed into a term-method matrix showing thefrequency of a term in a method. Second, the matrix is transformed using latent semanticindexing, analyzing which terms are highly correlated forming a semantic concept. Thevalues allow the calculation of the distance of two classes, judging how close theirconcepts are (cf. [PM06]).
Identify equivalent concepts. The transfer takes special consideration of the authors’original intention. Therefore the transfer analyzes the role of the textual corpus. The roleof a method is taken by an eEPC, whereas, instead of a class, the calculation is done witha group of eEPCs from the same process. In place of the terms from the source code, theredefined metric uses node labels.
Reformulate metric. Calculating the metric begins with building the term-eEPC matrixshowing for each eEPC and each term its respective frequency. Second, a latent semanticanalysis is applied on the matrix, reducing the matrix to its main components. The firstmetric, the conceptual similarity between eEPCs, CSM, uses the cosine of the vectors oftwo eEPCs in the reduced matrix as measure of distance.
• 𝐶𝑆𝑀�𝑔𝑘 ,𝑔𝑗� = � 𝑔𝑘��′∗𝑔𝑗���𝑔𝑘�⎯��∗�𝑔𝑗���𝑖𝑓 𝑔𝑘��′∗𝑔𝑗���𝑔𝑘�⎯��∗�𝑔𝑗���
≥ 00 𝑒𝑙𝑠𝑒
The second measure is the similarity of an eEPC g with a group of eEPCs gg. Therefore,the average conceptual similarity of one eEPC with all eEPCs of the group is calculated:
• 𝐶𝑆𝑀𝑀𝑔�𝑔𝑖 ,𝑔𝑔𝑗� = ∑ 𝐶𝑆𝑀�𝑔𝑖,𝑔𝑗�𝑚𝑗∈𝑚𝑣𝑗|𝑔𝑗∈𝑔𝑔𝑗|Third, the conceptual similarity of an eEPC group with another eEPC group is calculatedas the average CSMMg of their eEPCs:
• 𝐶𝑆𝑀𝑔𝑀𝑔�𝑔𝑔𝑖 ,𝑔𝑔𝑗� = ∑ 𝐶𝑆𝑀𝑀𝑔(𝑔𝑖,𝑔𝑔𝑗)𝑚𝑖∈𝑚𝑣𝑖|𝑔𝑖∈𝑔𝑔𝑖|Finally, the conceptual coupling of an eEPC group can be calculated as the averagecoupling of a group with all other eEPC groups:
• 𝐶𝐶𝑀𝑔(𝑔𝑔𝑖) = ∑ 𝐶𝑆𝑀𝑔𝑀𝑔�𝑔𝑔𝑖,𝑔𝑔𝑗�𝑚𝑔𝑗∈𝑀𝐺 𝑛−1
131

Application. The conceptual coupling metric uses an information retrieval techniquethat discovers semantic concepts and evaluates the degree of redundancy in the concepts,resp. terms, among eEPCs. It therefore analyzes whether either nodes are labeledambiguously or similar tasks appear in different contexts and models. High valuesindicate a high semantic overlap, i.e. many common terms. The same terms reused indifferent contexts impair understandability. Our adaption does not define the construct ofa group of eEPCs strictly, since it depends on the use case. The groups should be formedby domain, i.e. groups of processes that are supposed to deal with the same terms or not,as for example eEPCs for processes that belong together.
5 Implementation
In the previous sections the metrics were presented, transferred, re-specified, and theircontribution to the assessment of process model quality was discussed. However, as canbe taken from the definition of some of the metrics, the complicated calculation of someof the metrics makes their practical application tedious. E.g. the conceptual couplingmetric requires a singular value decomposition of a term-model matrix over all termsused. As an application aid, we implemented the metrics of this work in the form of aPlug-In (see https://svn.win.tue.nl/trac/prom/browser/Packages/CouplingMetrics/) forProM. ProM is a framework offering several techniques for process mining and modelanalysis (cf. [va05]). The implementation assumes to find eEPC elements as defined butremains oblivious to their source format. To ensure the functionality, we also extendedthe EPML-Interface of ProM for eEPC elements that are required for the metrics.Contrary to proprietary formats such as ARIS-XML or VDX, EPML is a platform-independent XML-schema with a publicly available schema-definition (cf. [MN06]). Weused the plugin with twelve different eEPC models to gain a first impression about theapplicability of the metrics and the plugin. It showed that though the implementationproduced values for each metric and model, their application suffers from a lack ofreference. Thus it remains unclear how strong the effect onto the reader is if modelsperform e.g. 10% better or worse regarding a certain metric. Nonetheless, the metricsserve for the comparison of two models, giving a rough indication if one model performsbetter or worse than another in respect to a metric (c.f. [BJ13].).
6 Summary, limitations and outlook
This work discusses the topic of “coupling” in process modeling. Even though it isrecognized as an important quality dimension (see [Va07;VRv08]) for process models ithas not been explained in detail yet. Coupling metrics exist, especially in neighboringdisciplines such as software engineering, based on individual and heterogeneousperceptions of coupling, while the understanding of coupling in process modeling issparse and vague. Our research addresses this gap by analyzing and transferring ideas on“coupling” from the field of software engineering to gain a better understanding andapplication of this ill-defined concept. Thus our contribution is the transfer of a well-established means of controlling and managing quality from systems development to
132
process modeling. Therefore, our work supplements the metrics allowing themeasurement and management of the coupling of process models. Next to theirapplication, the metrics provide additional definitions of the concept of coupling. Theyconstitute elementary groundwork for the discussion of coupling in process models aswell as for the fuzzy concept of process model quality and understandability in general.
However, there are limitations. First, our understanding of coupling builds onpreliminary work on coupling (see section 3). Future developments regarding couplingmight bring new interpretations requiring our transfer to be repeated. Second, thetransfer was influenced by subjectivity regarding the interpretation of equivalentconcepts. However subjectivity was mitigated by two researchers conducting theprocedure and consolidating the results. Finally, we focused eEPCs to provide areasonable level of detail. The metrics’ interpretation will differ for other languages suchas e.g. BPMN or UML.
In future work, the metrics will be evaluated empirically. We will analyze which metrics,and thus underlying perspectives, influence process model understandability most. Basedon these insights, guidelines for producing process models that are easy to understand(regarding coupling) can be formulated. They will then be tested with practitioners andadapted to their specific needs.
7 References
[Ag04] Aguilar-Savén, R. S.: Business process modeling. In Int. J. of Production Economics 90(2), 2004; pp. 129–149.
[AKC99]Allen, E. B.; Khoshgoftaar, T. M.; Chen, Y.: Measuring coupling and cohesion. In : 6th
Int. Software Metrics Symp. METRICS. USA, 04.11. IEEE, 1999; pp. 119–127.[AKC01]Allen, E.; Khoshgoftaar, T.; Chen, Y.: Measuring Coupling and Cohesion of Software
Modules. In : 7th Int. Software Metrics Symp. METRICS. UK, 04.04. IEEE, 2001.[Al10] Allier, S.; Vaucher, S.; Dufour, B.; Sahraoui, H.: Deriving Coupling Metrics from Call
Graphs. In : 10th Working Conf. on Source Code Analysis and Manipulation. SCAM.Timisoara, Rumania, 12.- 13.09. IEEE, 2010; pp. 43–52.
[Ar06] Armstrong, D. J.: The quarks of object-oriented development. In Commun. ACM 49 (2),2006; pp. 123–128.
[Ar07] Arshad, F.; Khanna, G.; Laguna, I.; Bagchi, S.: Distributed Diagnosis of Failures in aThree Tier E-Commerce System. Purdue University (ECE Tech. Reports, 354), 2007.
[BRU00]Becker, J.; Rosemann, M.; Uthmann, C. von: Guidelines of Business Process Modeling.In (van der Aalst, W. M.; Desel, J.; Oberweis, A. Eds.): Business Process Management.Springer, Berlin, Heidelberg, 2000; pp. 241–262.
[Be10] Becker, J.; Thome, I.; Weiß, B.; Winkelmann, A.: Constructing a Semantic BusinessProcess Modelling Language for the Banking Sector. In EMISA 5 (1), 2010; pp. 4–25.
[BLS01] Beyer, D.; Lewerentz, C.; Simon, F.: Impact of Inheritance on Metrics for Size,Coupling, and Cohesion in Object-Oriented Systems. LNCS 2006, 2001; pp. 1–17.
[BS98] Binkley, A.; Schach, S.: Validation of the coupling dependency metric as a predictor ofrun-time failures and maintenance measures. In (Torii, K.; Futatsugi, K.; Kemmerer, R.A. Eds.): Proceedings of the 1998 Int. Conf. on Software Engineering. ICSE. Kyoto,Japan, 19.04-25.04. IEEE, 1998; pp. 452–455.
[Bi10] Birkmeier, D.: On the State of the Art of Coupling and Cohesion Measures for Service-
133
Oriented System Design. In (Santana, M.; Luftman, J. N.; Vinze, A. S. Eds.): 16th
Americas Conf. on Information Systems. ACIS. Lima, Peru, 12.08-15.08. AIS, 2010.[BJ13] Braunnagel, D.; Johannsen, F.: Coupling Metrics for EPC Models. In (Alt, R.; Franczyk,
B. Eds.): Int. Conf. on Wirtschaftsinformatik. WI2013. Leipzig, 27.02 - 01.03.2013,2013; pp. 1797–1811
[Br98] Briand, L. C.; Daly, J.; Porter, V.; Wust, J.: A comprehensive empirical validation ofdesign measures for object-oriented systems. In : 5th Int. Software Metrics Symposium.METRICS. Bethesda, USA, 20.03- 21.03. IEEE, 1998; pp. 246–257.
[BDW99]Briand, L. C.; Daly, J.; Wust, J.: A unified framework for coupling measurement inobject-oriented systems. In IEEE Trans. Software Eng. 25 (1), 1999; pp. 91–121.
[BDM97] Briand, L.; Devanbu, P.; Melo, W.: An Investigation into Coupling Measures for C++.In (Adrion, R. W.; Fuggetta, A.; Taylor, R. N.; Wasserman, A. I. Eds.): Proc. of the 19th
Int. Conf. on Software Engineering. ICSE. USA, 17- 23.05.1997; pp. 412–432.[Ca06] Cardoso, J.; Mendling, J.; Neumann, G.; Reijers, H. A.: A Discourse on Complexity of
Process Models. LNCS 4103, 2006; pp. 117–128.[CYB09]Chen, J.; Yeap, W. K.; Bruda, S. D.: A Review of Component Coupling Metrics for
Component-Based Development. In : WRI World Congress on Software Engineering.WCSE. Xiamen, China, 19.05.2009 - 21.05.2009. WRI, 2009; pp. 65–69.
[CK94] Chidamber, S. R.; Kemerer, C. F.: A Metrics Suite for Object Oriented Design. In IEEETrans. Software Eng. 20 (6), 1994; pp. 476–493.
[Ch98] Cho, E. S.; Kim, C. J.; Kim, S. D.; Rhew, S. Y.: Static and Dynamic Metrics forEffective Object Clustering. In : 5th Asia-Pacific Software Engineering Conf. APSEC.Taipei, Taiwan, 02.12-04.12. IEEE, 1998; pp. 87- 85.
[CZ10] Chowdhury, I.; Zulkernine, M.: Can complexity, coupling, and cohesion metrics be usedas early indicators of vulnerabilities? In (Shin, S. Y.; Ossowski, S.; Schumacher, M.;Palakal, M. J.; Hung, C.-C.; Chowdhury, I.; Zulkernine, M. Eds.): Proc. o. Symposiumon Applied Computing. SAC. Sierre, Schweiz, 22.- 26.03. ACM, 2010; pp. 1963–1969.
[Co06] Cooper, H. M.: Synthesizing research. 3rd ed. SAGE, Thousand Oaks, USA, 2006.[El01] El-Emam, K.: Object-Oriented Metrics: A Review of Theory and Practice. NRC-CNRC
(NRC, 44190), 2001.[EW05] Evermann, J.; Wand, Y.: Ontology based object-oriented domain modelling: fundamental
concepts. In Requirements Eng 10 (2), 2005; pp. 146–160.[EW09] Evermann, J.; Wand, Y.: Ontology Based Object-Oriented Domain Modeling. In Journal
of Database Management 20 (1), 2009; pp. 48–77.[Go10] González, L. S.; Rubio, F. G.; González, F. R.; Velthuis, M. P.: Measurement in business
processes: a systematic review. In BPMJ 16 (1), 2010; pp. 114–134.[Gr09] Green, P.; Lane, P. ; Rainer, A.; Scholz, S. B.: An Introduction to Slice-Based Cohesion
and Coupling Metrics. University of Hertfordshire (Technical Report, 488), 2009.[GR00] Green, P.; Rosemann, M.: Integrated Process Modeling. In Information Systems and E-
Business Management 25 (2), 2000; pp. 73–87.[GL06] Gruhn, V.; Laue, R.: Adopting the Cognitive Complexity Measure for Business Process
Models. In: 5th IEEE Int. Conf. on Cognitive Informatics. ICCI. Beijing, 2006. IEEE,2006; pp. 236–241.
[GL07] Gruhn, V.; Laue, R.: Approaches for Business Process Model Complexity Metrics. In(Abramowicz, W.; Mayr, H. C. Eds.): Technologies for Business Information Systems.Springer, Berlin, 2007; pp. 13–24.
[GS06] Gui, G.; Scott, P. D.: Coupling and cohesion measures for evaluation of componentreusability. In (Diehl, S.; Gall, H.; Hassan, A. E. Eds.): Proc. o. Int. Workshop on MiningSoftware Repositories. MSR. Shanghai, China, 22.-23.03. ACM, 2006; pp. 18–21.
[GS08] Gui, G.; Scott, P. D.: New Coupling and Cohesion Metrics for Evaluation of SoftwareComponent Reusability. In : 9th Int. Conf. for Young Computer Scientists. ICYCS.Zhang Jia Jie, China, 18.11. IEEE, 2008; pp. 1181–1186.
134

[Ha77] Halstead, M. H.: Elements of software science. Elsevier, New York, 1977.[HCN98]Harrison, R.; Counsell, S.; Nithi, R.: Coupling metrics for object-oriented design. In : 5th
Int. Software Metrics Symp.. METRICS. USA, 20-21.03. IEEE, 1998; pp. 150–157.[HK81] Henry, S.; Kafura, D.: Software Structure Metrics Based on Information Flow. In IEEE
Trans. Software Eng. 7 (5), 1981; pp. 510–518.[HM95] Hitz, M.; Montazeri, B.: Measuring coupling and cohesion in object-oriented systems. In
: Proc. of 3rd Int. Symp. on Applied Corporate Computing. Mexico, 25. – 27.10.1995.[HFL12] Houy, C.; Fettke, P.; Loos, P.: Understanding Understandability of Conceptual Models.
LNCS 7532, 2012; pp. 64–77.[JJ10] Joshi, P.; Joshi, R.: Microscopic coupling metrics for refactoring. In : 10th Working Conf.
on Source Code Analysis and Manipulation. SCAM. Timisoara, Rumania, 12.- 13.09.IEEE, 2010; pp. 145–152.
[Ka11] Kazemi, A.; Azizkandi, A. N.; Rostampour, A.; Haghighi, H.; Jamshidi, P.; Shams, F.:Measuring the Conceptual Coupling of Services Using Latent Semantic Indexing. In(Jacobsen, H.-A.; Wang, Y.; Hung, P. Eds.): IEEE Int. Conf. on Services Computing.SCC. Washington, USA, 04.06-09.06. IEEE, 2011; pp. 504–511.
[Kh09] Khlif, W.; Makni, L.; Zaaboub, N.; Ben-Abdalla, H.: Quality metrics for businessprocess modeling. In (Revertia, R.; Mladenov, V.; Mastorakis, N. Eds.): Proceedings ofthe 9th WSEAS Int. Conf. on Applied computer science. WSEAS ACS'. Genua, Italien,17.10.2009. World Scientific and Engineering Academy and Society, 2009; pp. 195–200.
[KZB10]Khlif, W.; Zaaboub, N.; Ben-Abdalla, H.: Coupling metrics for business processmodeling. In WSEAS TRANSACTIONS on COMPUTERS 9 (1), 2010; pp. 31–41.
[LC01] Lee, A.; Chan, C. H. C.: An Exploratory Analysis of Semantic Network Complexity forData Modeling Performance. In : 5th Pacific Asia Conf. on Information Systems. PACIS.Seoul, Korea, 20. - 22.05.2001. AIS, 2001.
[Ma09] Markovic, I.; Hasibether, F.; Sukesh, J.; Nenad, S.: Process-oriented Semantic BusinessModeling. In (Hansen, R. H.; Karagiannis, D.; Fill, H.-G. Eds.): Business Services:Konzepte, Technologien, Anwendungen. Wirtschaftsinformatik. Wien, 25.02- 27.02.Österreichische Computer Gesellschaft, 2009; pp. 683–694.
[Mc76] McCabe, T.: A Complexity Measure. IEEE Trans. Softw. Eng. 2 (4) 1976; pp.308–320.[Me06] Mendling, J.: Testing Density as a Complexity Metric for EPCs. Vienna University of
Economics and Business Administration (Technical Report, JM-2006-11-15), 2006.[Me08] Mendling, J.: Metrics for process models. Springer, Berlin, 2008.[MN06] Mendling, J.; Nüttgens, M.: EPC markup language (EPML). In Information Systems and
E-Business Management (4), 2006; pp. 245–263.[MRv10]Mendling, J.; Reijers, H. A.; van der Aalst, W. M.: Seven process modelling guidelines
(7PMG). In Information and Software Technology 52 (2), 2010; pp. 127–136.[MB07] Meyers, T. M.; Binkley, D.: An empirical study of slice-based cohesion and coupling
metrics. In ACM Trans. Softw. Eng. Methodol. 17 (1), 2007; pp. 1–27.[Mo05] Moody, D. L.: Theoretical and practical issues in evaluating the quality of conceptual
models. In Data & Knowledge Engineering 55 (3), 2005; pp. 243–276.[OTE06] Orme, A.; Tao, H.; Etzkorn, L.: Coupling metrics for ontology-based system. In IEEE
Software 23 (2), 2006; pp. 102–108.[Pe07] Perepletchikov, M.; Ryan, C.; Frampton, K.; Tari, Z.: Coupling Metrics for Predicting
Maintainability in Service-Oriented Designs. In : 18th Australian Software EngineeringConf. ASWEC. Melbourne, Australia, 10.04- 13.04. IEEE, 2007; pp. 329–430.
[PSW08]Polyvyanyy, A.; Smirnov, S.; Weske, M.: Process Model Abstraction. In : EnterpriseDistributed Object Computing Conf. EDOC. Munich, 15.09-19.09. IEEE, 2008.
[PM06] Poshyvanyk, D.; Marcus, A.: The Conceptual Coupling Metrics for Object-OrientedSystems. In : 22nd IEEE Int. Conf. on Software Maintenance. ICSM. Philadelphia, USA,24.09- 27.09. IEEE, 2006; pp. 469–478.
[QLT06] Qian, K.; Liu, J.; Tsui, F.: Decoupling Metrics for Services Composition. In (Lee, R.;
135
Ishii, N. Eds.): Proc. o. t. 5th Annual IEEE/ACIS Int. Conf. on Computer and InformationScience. ICIS-COMSAR. Honolulu, Hawaii, 10.07- 12.07. IEEE; AIS, 2006; pp. 44–47.
[QT09] Quynh, P.; Thang, H.: Dynamic coupling metrics for service-oriented software. In Int. J.on Computer Science Engineering (3), 2009; pp. 282–287.
[RL92] Rajaraman, C.; Lyu, M.: Reliability and maintainability related software coupling metricsin C++ programs. In : 3rd int. symposium on software reliability engineering. ISSRE.Research Triangle Park, USA, 07.10- 10.10. IEEE, 1992; pp. 303–311.
[Re11] Recker, J.; Rosemann, M.; Green, P.; Indulska, M.: Do ontological deficiencies inmodeling grammars matter? In MISQ 35 (1), 2011; pp. 57–79.
[RV04] Reijers, H. A.; Vanderfeesten, I. T.: Cohesion and coupling metrics for workflow processdesign. LNCS 3080, 2004; pp. 290–305.
[RH97] Rosenberg, L.; Hyatt, L.: Software quality metrics for object-oriented environments. InCrosstalk Jounal 10 (4), 1997.
[SS05] Sandhu, P. S.; Singh, H.: A Critical Suggestive Evaluation of CK Metric. In: Pacific AsiaConf. on Information Systems. PACIS. Bangkok, Thailand, 07.- 10.07.2007. AIS, 2005.
[STA05] Scheer, A.-W.; Thomas, O.; Adam, O.: Process Modeling Using Event-Driven ProcessChains. In (Dumas, M.; van der Aalst, W. M.; Hofstede, A. T. Eds.): Process-awareinformation systems. John Wiley and Sons, 2005; pp. 119–146.
[Si08] Silver, B., 2008: Ten tips for effective process modeling. BPMInstitute.org. Availableonline at http://www.bpminstitute.org/resources/articles/bpms-watch-ten-tips-effective-process-modeling, checked on 9/10/2013.
[SJ09] Sunju, O.; Joongho, A.: Ontology Module Metrics. In : 2009 IEEE Int. Conf. on e-Business Engineering. ICEBE. Macau, China, 21.10-23.10. IEEE, 2009; pp. 11–18.
[Új10] Újházi, B.; Ferenc, R.; Poshyvanyk, D.; Gyimóthy, T.: New Conceptual Coupling andCohesion Metrics for Object-Oriented Systems. In : 10th Working Conf. on Source CodeAnalysis and Manipulation. SCAM. Timisoara, Rumania, 12.- 13.09. IEEE, 2010.
[va10] van der Aalst, W. M.; Nakatumba, J.; Rozinat, A.; Russell, N.: Business ProcessSimulation. In (Vom Brocke, J.; Rosemann, M. Eds.): Handbook on Business ProcessManagement 1. Springer, Berlin, Heidelberg, 2010; pp. 313–318.
[va05] van Dongen, B.; Medeiros, A. de; Verbeek, H.; Weijters, A.; van der Aalst, W. M.: TheProM Framework. LNCS 3536, 2005; pp. 444–454.
[vOS05] van Hee, K. M.; Oanea, O.; Sidorova, N.: Colored Petri Nets to Verify Extended Event-Driven Process Chains. LNCS 3760, 2005; pp. 183–201.
[Va07] Vanderfeesten, I. T.; Cardoso, J.; Mendling, J.; Reijers, H. A.; van der Aalst, W. M.:Quality Metrics for Business Process Models. In (Fischer, L. Ed.): BPM and workflowhandbook. Future Strategies, Lighthouse Point, USA, 2007; pp. 179–191.
[VCR07]Vanderfeesten, I. T.; Cardoso, J.; Reijers, H. A.: A weighted coupling metric for businessprocess models. CEUR Workshop Proceedings 247, 2007; pp. 41–44.
[Va08] Vanderfeesten, I. T.; Reijers, H. A.; Mendling, J.; van der Aalst, W. M.; Cardoso, J.: Ona quest for good process models. LNCS 5047, 2008; pp. 480–494.
[VRv08] Vanderfeesten, I.; Reijers, H.; Aalst, W. M.: Evaluating workflow process designs usingcohesion and coupling metrics. In Computers in industry 59 (5), 2008; pp. 420–437.
[Vo09] Vom Brocke, J.; Simons, A.; Niehaves, B.; Riemer, K.; Plattfaut, R.; Cleven, A.: On theImportance of Rigour in Documenting the Literature Search Process. In (Newell, S.;Whitley, E. A.; Pouloudi, N.; Wareham, J.; Mathiassen, L. Eds.): 17th European Conf. onInformation Systems, ECIS 2009. ECIS. Verony, Italy, 2009; pp. 2206–2217.
[WK08] Wahler, K.; Küster, J. M.: Predicting Coupling of Object-Centric Business ProcessImplementations. LNCS 5240, 2008; pp. 148–163.
[We97] Weber, R.: Ontological foundations of information systems. Coopers & Lybrand,Melbourne, 1997.
136

Additional Information in Business Processes:
A Pattern-Based Integration of Natural Language Artefacts
Sebastian Bittmann, Dirk Metzger, Michael Fellmann, Oliver Thomas
Information Management and Information Systems
University of Osnabrueck
Katharinenstr. 3, 49074 Osnabrueck
{sebastian.bittmann | dirk.metzger | michael.fellmann | oliver.thomas}@uni-osnabrueck.de
Abstract: Business process modelling initiatives frequently make use of semi-formalmodelling languages for depicting the business processes and their control flows. Whilethese representations are beneficial for the analysis, simulation and automatic execu-tion of processes, they are not necessarily the best option to communicate processknowledge required by employees to execute the process. Hence, textual process rep-resentations and their transformation to semi-formal models gain importance. In thispaper, a pattern-based modelling approach positioned in between the two extremes ofinformal text and semi-formal process models is derived. The patterns offer a basis fora seamless integration of natural language and business process models. In particularthe business process modelling patterns, which have to rely on human interactions arefocussed. For those patterns an integrated representation of information that supportthe manual execution is developed. The approach fosters the contribution by employ-ees of the operative business, since it does not rely on classical modelling paradigms,but uses natural language for modelling business processes.
1 Introduction
At present, a multitude of different methods and languages exist for the purposeful spec-
ification of business processes in companies such as BPMN, UML-AD and EPC. Busi-
ness process models gained such an importance that understanding them is relevant for a
plethora of stakeholders, not just process experts. Regardless whether these stakeholders
are considered with planning, execution or just auditing with respect to their own require-
ments, the representation given by a business process model has to be understood by di-
verse stakeholders. Unfortunately, although the (semi-)formal representation offered by
current business process modelling languages is sufficient to be used as a basis for pro-
cess execution in Workflow Management Systems (WfMS) [JNF+00], human stakehold-
ers involved in the processes still seem to have ambiguous interpretations of these models
[MAA10]. Information that is satisfactory for machines to interpret business process mod-
els may not be sufficient for the interpretation and act of learning driven by humans. Every
socio-technological system has its special needs regarding information requirement for the
purposeful execution of business processes, which is highly dependent on the interaction
between the individuals and their collaboration. Therefore such processes of human inter-
137

action should be supported and fostered by collaborative methods that enable these human
to define their own required representation of business process models.
In this paper, an approach will be discussed that reflects the previously described assump-
tions. More precisely, a relation between process knowledge captured in business process
models and natural language representations of process relevant information will be re-
vealed. Such information is called "Natural Language Artefact" (NLA). It will be shown
how to enrich NLAs using annotated text to represent basic control flow patterns of busi-
ness process modelling languages. The overall approach aims at the amalgamation of
(semi-)formal process models with natural text representations in order to empower peo-
ple from the operative business to contribute to purposefully described business process
models.
The remainder of the paper is structured as follows. At first in section 2, the relationship
between business process models and natural language artefacts will be discussed. Fol-
lowing, business process modelling patterns will be introduced in section 3 that act as a
basis for our approach. Next in section 4 the mapping between these patterns and natural
language text will be described. The mapping will be discussed in the following section 5
and the paper ends with a conclusion.
2 Business Process Modelling and the Relation Towards Unique In-
formation Needs of Socio-Technological Systems
2.1 Relation Between Business Processes and Natural Language Artefacts
Business process models generally provide a holistic overview about the processes exe-
cuted by an enterprise in order to satisfy its business related purpose [vdA04]. Unfortu-
nately, such a holistic overview is less suited, when it comes to the actual execution of a
business process [Swe13]. The inclusion of multiple paths for various alternatives, excep-
tions or situations requiring error-handling, which are important for analyses and simula-
tive reasons, raises the complexity for a single individual to understand the procedures and
further to filter its required information.
Moreover, execution instructions of business processes for humans are usually not stated
by means of business process models [LA94]. So, it would not be sufficient to enrich
a business process model with more details to capture all relevant information. Conse-
quently, individuals are usually dependent on additional instructions. Regardless whether
these instructions are transcribed in documents or only communicated orally, in the latter,
they will be referenced as a Natural Language Artefact (NLA). There can be two reasons
identified for the requirement of NLAs, next to a business process model. First, activities
documented in business process model are usually depicted in an aggregated manner. Al-
though an activity should use terms the individuals are familiar with, initial instructions
are needed in order to build up an understanding for the used terms. Second, important
and more enterprise-specific information can not always be captured through a business
process model. For example, the use of a specialised information systems developed for
specific purposes of a company, may require additional information.
138

In conclusion, there are two points of criticism for using process models as instructions:
First, it was argued that business process model include a certain amount of information,
which is unrelated for the human actor. Second, additional information that is required by
the human actor remains unconsidered by business process models and it is necessary to
capture this knowledge by additional NLAs.
Through Figure 1 such a relation between
Parcel Service
Office
Account Manager
Order Received
Check Order
Order Accepted
Order declined
Inform aboutDeclinedOrder
CheckReceipt ofOrder
Send Bill
DeliverOrder
Order Processing Finished
NLA
NLANLA
NLA
NLA
CheckAvailabilities
NLA
Decide onOrder
Figure 1: Exemplary Business Processes withCorresponding NLAs
a business process model and the relevant
NLAs for its execution is exemplified. Within
the business process model there are three
different roles required for the execution
of the business process. Each of these roles
has to rely on different NLAs for the ex-
ecution of its relevant part. However, the
business process model is not sufficient to
support the roles with the needed infor-
mation. For example the business process
model only states that the received order
has to be checked by the account manager,
but it does not state by means of which cri-
teria the order has to be checked and when
the order should be declined or accepted.
Hence, the account manager has to rely on
further information, which specify what
these criteria are, how they are mapped to
the received order and when he should ac-
cept the order or decline it. Such informa-
tion can be offered through NLAs, which
are often either documented or commu-
nicated orally in seminars or through co-
workers. It may be the case that the ac-
count manager does not have to rely on
such NLAs, because he developed tacit knowl-
edge about when to accept or decline an
order, which can not be formalised [KPV03,
KB02]. However, there should be at least
a basis for learning such tacit knowledge
for the case that new account managers
have to be trained. One solution would
be that experienced account managers in-
struct the new employees. In this case, in-
formation that goes beyond the business
process model would be offered orally. Since
the availability of experienced employees is not always given, transcribed NLAs should
be preferred, but only if they are integrated with the respective business process model.
139
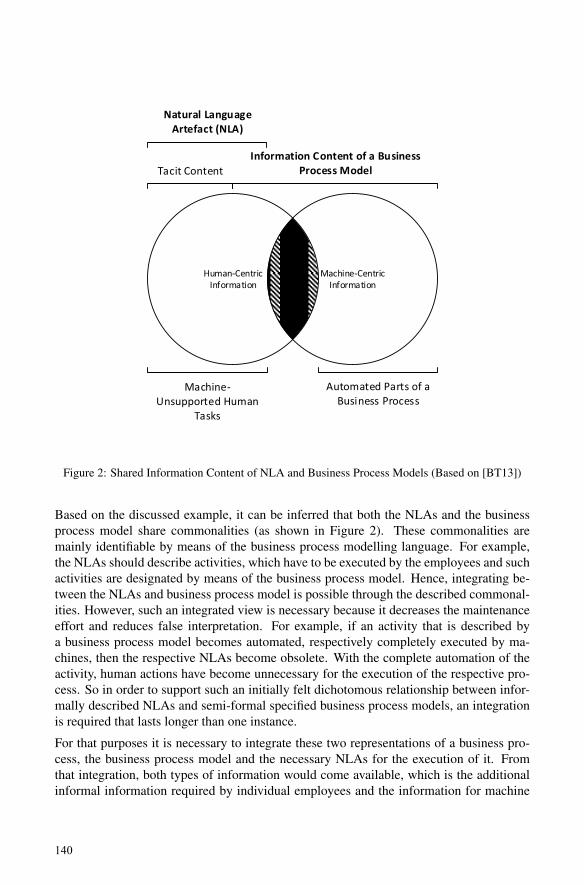
Human-CentricInformation
Machine-CentricInformation
semi-autom
ated
tasks
Automated Parts of aBusiness Process
Machine-Unsupported Human
Tasks
Information Content of a BusinessProcess ModelTacit Content
Natural LanguageArtefact (NLA)
Figure 2: Shared Information Content of NLA and Business Process Models (Based on [BT13])
Based on the discussed example, it can be inferred that both the NLAs and the business
process model share commonalities (as shown in Figure 2). These commonalities are
mainly identifiable by means of the business process modelling language. For example,
the NLAs should describe activities, which have to be executed by the employees and such
activities are designated by means of the business process model. Hence, integrating be-
tween the NLAs and business process model is possible through the described commonal-
ities. However, such an integrated view is necessary because it decreases the maintenance
effort and reduces false interpretation. For example, if an activity that is described by
a business process model becomes automated, respectively completely executed by ma-
chines, then the respective NLAs become obsolete. With the complete automation of the
activity, human actions have become unnecessary for the execution of the respective pro-
cess. So in order to support such an initially felt dichotomous relationship between infor-
mally described NLAs and semi-formal specified business process models, an integration
is required that lasts longer than one instance.
For that purposes it is necessary to integrate these two representations of a business pro-
cess, the business process model and the necessary NLAs for the execution of it. From
that integration, both types of information would come available, which is the additional
informal information required by individual employees and the information for machine
140
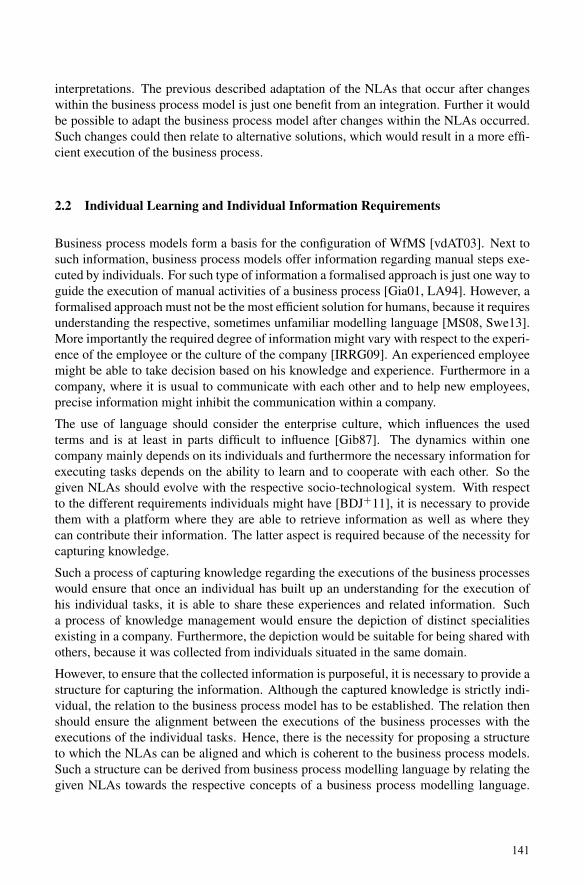
interpretations. The previous described adaptation of the NLAs that occur after changes
within the business process model is just one benefit from an integration. Further it would
be possible to adapt the business process model after changes within the NLAs occurred.
Such changes could then relate to alternative solutions, which would result in a more effi-
cient execution of the business process.
2.2 Individual Learning and Individual Information Requirements
Business process models form a basis for the configuration of WfMS [vdAT03]. Next to
such information, business process models offer information regarding manual steps exe-
cuted by individuals. For such type of information a formalised approach is just one way to
guide the execution of manual activities of a business process [Gia01, LA94]. However, a
formalised approach must not be the most efficient solution for humans, because it requires
understanding the respective, sometimes unfamiliar modelling language [MS08, Swe13].
More importantly the required degree of information might vary with respect to the experi-
ence of the employee or the culture of the company [IRRG09]. An experienced employee
might be able to take decision based on his knowledge and experience. Furthermore in a
company, where it is usual to communicate with each other and to help new employees,
precise information might inhibit the communication within a company.
The use of language should consider the enterprise culture, which influences the used
terms and is at least in parts difficult to influence [Gib87]. The dynamics within one
company mainly depends on its individuals and furthermore the necessary information for
executing tasks depends on the ability to learn and to cooperate with each other. So the
given NLAs should evolve with the respective socio-technological system. With respect
to the different requirements individuals might have [BDJ+11], it is necessary to provide
them with a platform where they are able to retrieve information as well as where they
can contribute their information. The latter aspect is required because of the necessity for
capturing knowledge.
Such a process of capturing knowledge regarding the executions of the business processes
would ensure that once an individual has built up an understanding for the execution of
his individual tasks, it is able to share these experiences and related information. Such
a process of knowledge management would ensure the depiction of distinct specialities
existing in a company. Furthermore, the depiction would be suitable for being shared with
others, because it was collected from individuals situated in the same domain.
However, to ensure that the collected information is purposeful, it is necessary to provide a
structure for capturing the information. Although the captured knowledge is strictly indi-
vidual, the relation to the business process model has to be established. The relation then
should ensure the alignment between the executions of the business processes with the
executions of the individual tasks. Hence, there is the necessity for proposing a structure
to which the NLAs can be aligned and which is coherent to the business process models.
Such a structure can be derived from business process modelling language by relating the
given NLAs towards the respective concepts of a business process modelling language.
141

Moreover, the relation between the NLAs and the business process modelling concepts
should include a further tier, which are business process modelling patterns. This further
tier is motivated by the required coherency of a description regarding the achievement of
a certain goal, which requires the execution of multiple, succeeding activities. So the co-
herency of the respective activities should be transposed to the NLAs. Additional, only
those patterns that are human-centric invoke the necessity for including additional instruc-
tions by means of NLAs. Human-centric relates to the necessity of the participation of
humans in order to execute the part of the processes that is captured by a pattern.
3 Human-Centric Business Process Modelling Patterns
Business process models provide information for two different kinds of recipients. First,
they provide information for an automatic execution. Such information are then interpreted
by WfMS, which are in charge for the distribution of relevant documents and the execution
of respective tasks. Second, and more important for the presented approach, business
process models provide information, which guide the execution performed by humans.
Hence, they provide information for decision-making, task accomplishment, collaboration
with others and more. Therefore a distinction between those parts that require a human
interpretation from those that can be interpreted by machines is needed. Unfortunately,
such a distinction is not possible on the level of the modelling language. The concepts
of a modelling language are important to both, humans and machines. For example, the
concept of an activity is relevant to both, because activities exist that are executed by
humans and machines. Thus a separation regarding the human and non-human recipient
is needed to sought on a more aggregated level. An appropriate level of distinction can be
achieved through the use of business process modelling patterns.
In [Aal03] the authors define several control flow patterns from which business process
models are constructed. With respect to these patterns, a distinctive selection of those pat-
terns that are more relevant for a human interpretation can be made. Thereby, those pat-
terns that might require an additional instructions through NLAs were identified through
a expert group. Patterns used to represent processes with manual work or to represent
decisions requiring human judgement were considered more likely to require additional
documentation. Hence these patterns are more important for the presented approach than
patterns used to represent machine-executable parts of process models. This is due to the
fact that our approach aims at combining structured process knowledge (control flow) with
additional textual information for humans (incorporated in NLAs).
For example, a multi-choice pattern (see Table 1 No. 6) in a process can require a list
of regulations and applicable laws described in natural language to decide which options
should be executed. In contrast, a pattern that merges different branches (see Table 1 No.
5) of a logical control flow without any synchronisation or blocking such as a simple merge
may seem like an execution of a sequence after a decision. It does hence not require addi-
tional documentation.
142

Table 1: Relevance of Natural Language Text Instructions for the Execution of Specific BusinessProcess Patterns
No. Pattern Abbrevation Relevant for NLAs
1. Sequence SEQ Yes, in order to provide instructions for man-
ual or partly-manual executed activities.
2. Parallel Split No, because the execution of parallel activities
either requires the activities to be executed by
multiple individuals or in a sequence.
3. Synchronisation Sync Yes, when the manual decision for succeeding
is required.
4. Exclusive Choice XOR Yes, if the decision making process can not be
formalised.
5. Simple Merge No, because this merge is rather technical and
the succeeding activity can only be triggered
once.
6. Multi Choice OR Yes, if the decision making process can not be
formalised.
7. Synchronising
Merge
SyMe Yes, when the manual decision for succeeding
is required.
8. Multi Merge No, because the multi merge refers to multiple
execution without a synchronisation of these.
9. Discriminator No, as the succession is automatically con-
ducted on arrival.
10. Arbitrary Cycles No, because multiple iterations can rely on the
same instructions.
11. Implicit Termination No, because a signalling a termination will be
done through other mediums than the textual
instructions.
12.-
15.
Multiple Instances
(Several Patterns)
No, because multiple executions can rely on
the same set of instructions.
16. Deferred Choice No, because no extra construct is necessarily
needed to depict deferred choices (see [Aal03,
p. 30]).
17. Interleaved Parallel
Routing
IPR Yes, because the actor must be instructed about
his freedom of choice in executing.
18. Milestone No, milestones are necessary for managerial
aspects, not for the actual execution.
19. Cancel Activity No, because after the cancellation no more in-
structions are necessary that relate to the initial
business process.
20. Cancel Case No, same reason as above (cf. No. 19).
Numbers correspond to [Aal03]
143
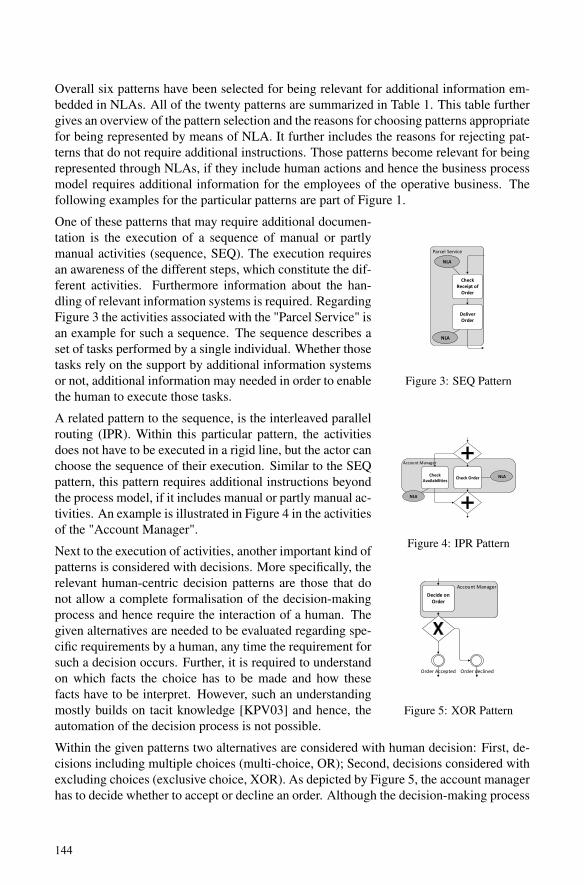
Overall six patterns have been selected for being relevant for additional information em-
bedded in NLAs. All of the twenty patterns are summarized in Table 1. This table further
gives an overview of the pattern selection and the reasons for choosing patterns appropriate
for being represented by means of NLA. It further includes the reasons for rejecting pat-
terns that do not require additional instructions. Those patterns become relevant for being
represented through NLAs, if they include human actions and hence the business process
model requires additional information for the employees of the operative business. The
following examples for the particular patterns are part of Figure 1.
One of these patterns that may require additional documen-
Parcel Service
CheckReceipt ofOrder
DeliverOrder
NLA
NLA
Figure 3: SEQ Pattern
tation is the execution of a sequence of manual or partly
manual activities (sequence, SEQ). The execution requires
an awareness of the different steps, which constitute the dif-
ferent activities. Furthermore information about the han-
dling of relevant information systems is required. Regarding
Figure 3 the activities associated with the "Parcel Service" is
an example for such a sequence. The sequence describes a
set of tasks performed by a single individual. Whether those
tasks rely on the support by additional information systems
or not, additional information may needed in order to enable
the human to execute those tasks.
A related pattern to the sequence, is the interleaved parallel
Account Manager
Check Order NLACheckAvailabilities
NLA
Figure 4: IPR Pattern
routing (IPR). Within this particular pattern, the activities
does not have to be executed in a rigid line, but the actor can
choose the sequence of their execution. Similar to the SEQ
pattern, this pattern requires additional instructions beyond
the process model, if it includes manual or partly manual ac-
tivities. An example is illustrated in Figure 4 in the activities
of the "Account Manager".
Next to the execution of activities, another important kind of
Account Manager
Order Accepted Order declined
Decide onOrder
Figure 5: XOR Pattern
patterns is considered with decisions. More specifically, the
relevant human-centric decision patterns are those that do
not allow a complete formalisation of the decision-making
process and hence require the interaction of a human. The
given alternatives are needed to be evaluated regarding spe-
cific requirements by a human, any time the requirement for
such a decision occurs. Further, it is required to understand
on which facts the choice has to be made and how these
facts have to be interpret. However, such an understanding
mostly builds on tacit knowledge [KPV03] and hence, the
automation of the decision process is not possible.
Within the given patterns two alternatives are considered with human decision: First, de-
cisions including multiple choices (multi-choice, OR); Second, decisions considered with
excluding choices (exclusive choice, XOR). As depicted by Figure 5, the account manager
has to decide whether to accept or decline an order. Although the decision-making process
144
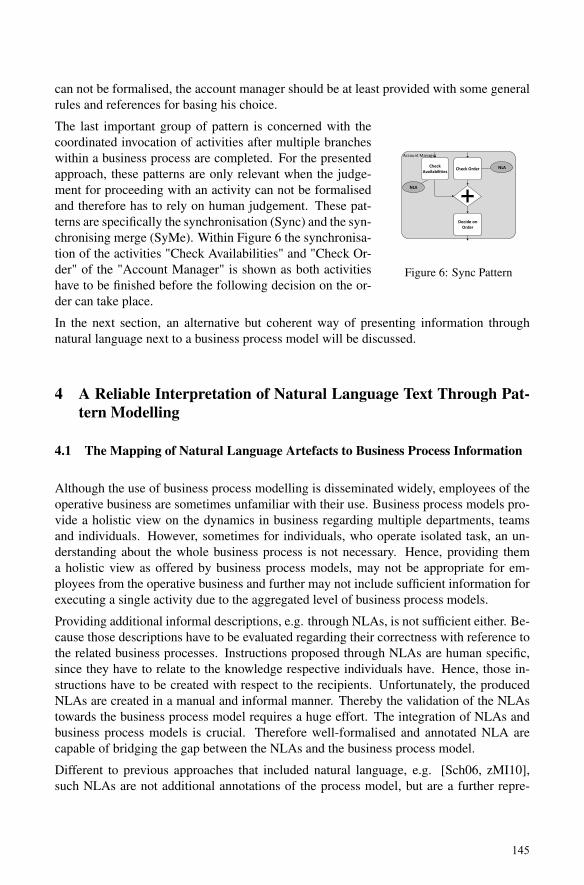
can not be formalised, the account manager should be at least provided with some general
rules and references for basing his choice.
The last important group of pattern is concerned with the
Account Manager
NLA
NLA
CheckAvailabilities Check Order
Decide onOrder
Figure 6: Sync Pattern
coordinated invocation of activities after multiple branches
within a business process are completed. For the presented
approach, these patterns are only relevant when the judge-
ment for proceeding with an activity can not be formalised
and therefore has to rely on human judgement. These pat-
terns are specifically the synchronisation (Sync) and the syn-
chronising merge (SyMe). Within Figure 6 the synchronisa-
tion of the activities "Check Availabilities" and "Check Or-
der" of the "Account Manager" is shown as both activities
have to be finished before the following decision on the or-
der can take place.
In the next section, an alternative but coherent way of presenting information through
natural language next to a business process model will be discussed.
4 A Reliable Interpretation of Natural Language Text Through Pat-
tern Modelling
4.1 The Mapping of Natural Language Artefacts to Business Process Information
Although the use of business process modelling is disseminated widely, employees of the
operative business are sometimes unfamiliar with their use. Business process models pro-
vide a holistic view on the dynamics in business regarding multiple departments, teams
and individuals. However, sometimes for individuals, who operate isolated task, an un-
derstanding about the whole business process is not necessary. Hence, providing them
a holistic view as offered by business process models, may not be appropriate for em-
ployees from the operative business and further may not include sufficient information for
executing a single activity due to the aggregated level of business process models.
Providing additional informal descriptions, e.g. through NLAs, is not sufficient either. Be-
cause those descriptions have to be evaluated regarding their correctness with reference to
the related business processes. Instructions proposed through NLAs are human specific,
since they have to relate to the knowledge respective individuals have. Hence, those in-
structions have to be created with respect to the recipients. Unfortunately, the produced
NLAs are created in a manual and informal manner. Thereby the validation of the NLAs
towards the business process model requires a huge effort. The integration of NLAs and
business process models is crucial. Therefore well-formalised and annotated NLA are
capable of bridging the gap between the NLAs and the business process model.
Different to previous approaches that included natural language, e.g. [Sch06, zMI10],
such NLAs are not additional annotations of the process model, but are a further repre-
145
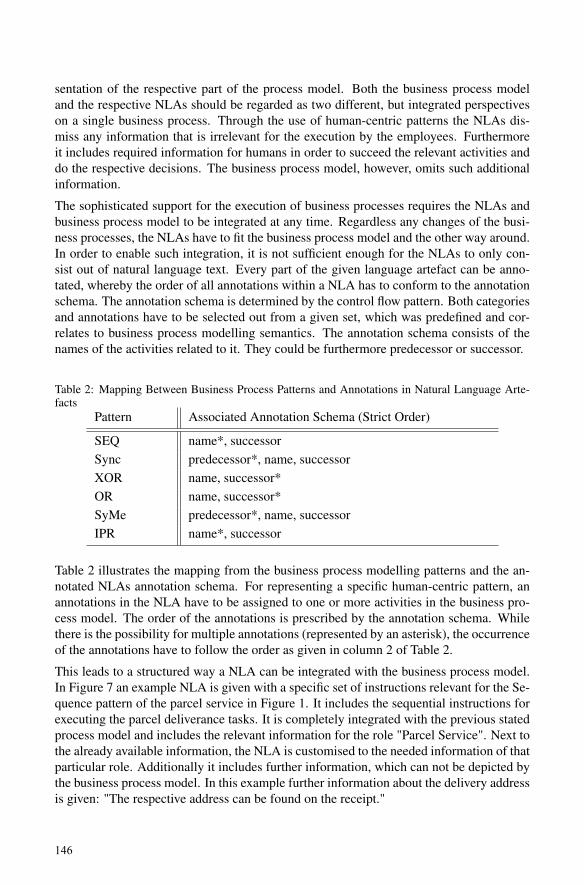
sentation of the respective part of the process model. Both the business process model
and the respective NLAs should be regarded as two different, but integrated perspectives
on a single business process. Through the use of human-centric patterns the NLAs dis-
miss any information that is irrelevant for the execution by the employees. Furthermore
it includes required information for humans in order to succeed the relevant activities and
do the respective decisions. The business process model, however, omits such additional
information.
The sophisticated support for the execution of business processes requires the NLAs and
business process model to be integrated at any time. Regardless any changes of the busi-
ness processes, the NLAs have to fit the business process model and the other way around.
In order to enable such integration, it is not sufficient enough for the NLAs to only con-
sist out of natural language text. Every part of the given language artefact can be anno-
tated, whereby the order of all annotations within a NLA has to conform to the annotation
schema. The annotation schema is determined by the control flow pattern. Both categories
and annotations have to be selected out from a given set, which was predefined and cor-
relates to business process modelling semantics. The annotation schema consists of the
names of the activities related to it. They could be furthermore predecessor or successor.
Table 2: Mapping Between Business Process Patterns and Annotations in Natural Language Arte-facts
Pattern Associated Annotation Schema (Strict Order)
SEQ name*, successor
Sync predecessor*, name, successor
XOR name, successor*
OR name, successor*
SyMe predecessor*, name, successor
IPR name*, successor
Table 2 illustrates the mapping from the business process modelling patterns and the an-
notated NLAs annotation schema. For representing a specific human-centric pattern, an
annotations in the NLA have to be assigned to one or more activities in the business pro-
cess model. The order of the annotations is prescribed by the annotation schema. While
there is the possibility for multiple annotations (represented by an asterisk), the occurrence
of the annotations have to follow the order as given in column 2 of Table 2.
This leads to a structured way a NLA can be integrated with the business process model.
In Figure 7 an example NLA is given with a specific set of instructions relevant for the Se-
quence pattern of the parcel service in Figure 1. It includes the sequential instructions for
executing the parcel deliverance tasks. It is completely integrated with the previous stated
process model and includes the relevant information for the role "Parcel Service". Next to
the already available information, the NLA is customised to the needed information of that
particular role. Additionally it includes further information, which can not be depicted by
the business process model. In this example further information about the delivery address
is given: "The respective address can be found on the receipt."
146

After the acceptance of an order, an orderreceipt will be created. Within the activity„Check Receipt of Order“, the respectiveitems will be collected based on that receipt.Following, within the activity „Deliver Order“the parcel should be delivered. The respectiveaddress can be found on the receipt. Theexecution of the activity results in the „OrderProcessing Finished“ Event.
name
name
successor
Pattern
Figure 7: Exemplary Natural Language Artefact with Annotations
Natural Language ArtefactBusiness Process Model
Parcel Service
Check Receipt ofOrder
Deliver Order
Order Processing Finished
NLA (ParcelService)
NLA (ParcelService)
After the acceptance of an order, an orderreceipt will be created. Within the activity„Check Receipt of Order“, the respectiveitems will be collected based on that receipt.Following, within the activity „Deliver Order“the parcel should be delivered. The respectiveaddress can be found on the receipt. Theexecution of the activity results in the „OrderProcessing Finished“ Event.
name
name
successor
Pattern
Figure 8: Exemplary Integration Between the Natural Language Artefact with Annotations and theBusiness Process Model
The given NLA with the annotations is completely integrated with the business process
model. The overall relation is exemplary illustrated in the following Figure 8. Therefore
the sequence pattern of the example process in Figure 1 for the "Parcel Service" is used.
This pattern is associated with the NLA itself whereas the different activities within the
pattern are associated with the annotations in the NLA. Consequently, the successor of the
pattern which is the concluding "Order Processing Finished" event is also associated with
the annotation in the NLA.
As illustrated through the previous example, it can be inferred that an NLA can be ex-
tended by means of natural language without loosing the integration to the business process
model. So additional information could be included, as long as the annotations and asso-
ciated categories of the NLA are consistent. The natural language text can be extended,
adapted or replaced regarding the specific requirements the respective employees might
have, without jeopardising the integration with the associated business process model.
The following section will generalize the associations between the elements of the business
process model and the annotations, the patterns and the NLA in a integrated meta model.
147

4.2 The Meta Model
Business Process Model (BPMN)ModelElement
Message-FlowObject Scope
Pool
ScopeObject
Lane Sequence-Connector GatewayMappableObject
Activity EventAnnotation
Predecessor
Name
Successor
Pattern
NLA
* 1*
1
*
1
* *
Figure 9: Integrated Meta Model Based on [Mül11]
A more generalized view of the presented approach will be given through a meta model.
This consists of the meta model of BPMN as the widely used and in this paper applied
modelling language for business process models and a meta model of the NLA annota-
tions. The BPMN meta model is based on [Mül11]. As previously presented the annota-
tion are subdivided in three types: the predecessor, the name and the successor. The given
annotation generally is then associated with the activity as used in the BPMN business
process model as well as with the NLA itself. In Addition, the NLA is associated with the
different Pattern which consists of one or more ScopeObjects such as Activities, Events,
Gateways or Connectors. The Figure 9 shows a slightly adapted part of the BPMN meta
model of Mueller and the added elements with the association between them.
Altogether the presented association between formalized written Natural Language Arte-
facts (NLAs) and business process models demonstrate an sophisticated way of dealing
with the lack of tacit knowledge in business process models for the manual execution.
5 Discussion
Other approaches such as [zMI10] integrated two different semi formal languages (SRML
and BPMN) to gain advantages. However, the need for teaching employees another lan-
guage downgrades this approach for the presented idea. Regarding the idea of having
different information for different user groups is as well considered by [BDD+04]. They
propose to integrate different information into the business process model and show only
the needed information for the particular user group. This approach might be a solution for
the presented problem though the use of elements of the specific modeling language limit
the possible expressions. Furthermore approaches like [LMP12] and [FMP11] aim at the
148

transformation of business process models to natural language or the other way around but
miss the integration of information that is not represented in business process models as
stated in Figure 2. In Addition, a more general approach for wikis and the integration with
conceptual modeling languages has been made by [GRS12]. However, their presented idea
links the additional information (the wiki pages) based on an ontology instead of based on
patterns. Another idea for linking wikis with ontologies was presented by [Sch06].
Using the presented approach it becomes possible to structure language artefacts accord-
ing to annotations, which are derivable from respective modelling language. The structure
of the natural language text enables some valuable advantages for business process mod-
elling. First, by the structure of a NLA, the relation towards a business process model can
be identified and revealed. Therefore the structure of an annotated NLA is coherent to a
business process modelling language. Second, although coherent to a modelling language,
the annotated NLAs can be enriched with further information. Adding further information
towards a NLA does not jeopardise its formal semantics. Bridging logical gaps, adding
more detailed instructions and including preferences as well as experiences is completely
harmless to the structure of the NLA. The structure fully relies on the annotation.
Furthermore, next to other approaches, the presented approach does not include natural
text to a model description, but it integrates two different perspectives. The process model
and the NLA are coherently integrated, so that changes towards the model has implications
to the NLA and the other way around. Hence an NLA, or a set of NLAs, is a further
representation of a business process, which is more specific to operative business, since
they enable to provide specific instructions for different individuals.
Changes regarding the business process model do have consequences regarding the NLAs.
Reconsidering Figure 1, the automatic processing of order and availability checking and
judging for its acceptance, would result in an disassociation of the account manager with
the "Check Order" and "Check Availabilities" activities. This would implicitely cause the
irrelevance of the respective NLA, which previously have instructed the account manager
in checking incoming orders. So if constructs are removed from the business process
model, then the NLAs that are in relation to these constructs could be either shortened or
removed completely.
Further, if a business process model is enriched with further constructs, then this enables
the creation of new NLAs. These new NLAs then relate to the new constructs of a busi-
ness process model, which form one of the specific patterns. Such a relation between the
two perspectives supports the operative execution of business processes, since unrelated
instructions are removed and the business process model will be automatically enriched
with the occurrence of new NLA that follow a specific structure.
Such benefits have been achieved through the use of a further tier, which is represented
through the human-centric business process modelling patterns. In the presented approach
any NLA has to be associated to a specific human-centric process pattern (cf. Section 3).
Hence, on the one hand an automatic derivations based on the patterns of the required
NLAs for a process model as well as the need for alter NLAs after changes within the
process model are possible. On the other hand, due to the integration, adaptations of
process models can be derived by means of the related NLAs.
149

6 Conclusion and Future Work
In this paper it was shown, how to establish a purposeful integration between business
process models and semi-structured natural language text, respective annotated NLAs.
The relation identified was based on the assumption that natural language text is required
when humans have to interact and that different NLAs are useful for different actors of
a business process. Therefore an integrated relation between multiple annotated NLAs,
which uniquely concentrate on a set of task executed by a specific actor and the respective
business process model was established.
In conclusion, with the presented approach it becomes possible to execute business pro-
cesses with WfMS and whenever necessary, provide the human actors with NLAs that are
coherent to the business process model as well as tailored to the specific informational
needs. The coherency enables the NLA and the process model to exist in a synchronised
manner. Whenever changes occur on one side, the other side can be adapted automat-
ically. Furthermore, the adaptiveness of NLAs enables the provision of a unique set of
comprehensive information specific to a socio-technological system. Additionally, the use
of NLAs enables the employee of the operative business to contribute to such specifica-
tions, because of the possibility to contribute information and experience by means of
natural language.
Future research directions will concentrate on different paths. First, the contribution to-
wards NLAs by actors of the operative business requires the purposeful guidance and
support. Although such a consideration of actors might contain an innovation potential,
methods should be developed which guide the extraction of the respective knowledge. The
use of social media techniques, e.g. rating systems, could improve this extraction. Second,
with an increasing relevance of enterprise wikis, e.g. [BMNS11], the presented approach
could be generally applicable for collaborative enterprise modelling through the use of
enterprise wikis. The presented approach could be used for structuring enterprise wikis
and further gain information, namely conceptual models, from those wikis. Within such
a conceptualisation, every annotated NLA corresponds to exactly one wiki page from an
enterprise wiki. Furthermore it would be possible to describe an excerpt of an enterprise
model that is constituted by multiple constructs with one wiki page, which corresponds
to a specific pattern. Recently proposed semantic wikis, e.g. [KVV06, BGS+11, Sch06],
could support this form of enterprise wikis through enabling semantically enriched an-
notations and categories for wiki pages. Third, by enabling the use of annotated NLAs
through semantic enterprise wikis, integrating between WfMS and those wikis could en-
rich the execution of business processes. Semantic enterprise wiki could provide their
already contained and annotated NLAs to a WfMS, whenever the necessity occurs for ex-
ecuting a specific human-centric task. Fourth, empirical investigation will be undertaken,
which try to evaluate the benefits of collaborative enterprise modelling through annotated
NLAs. These empirical investigations could be both, experiments and case studies with
partners in practice. In general, the investigation would try to find out the efficiency gain
the approach offers, both in execution as well as innovating the business processes.
150

Acknowledgement
The research and development presented in this paper is part of the WISMO project and
is funded by the German Federal Ministry of Education and Research (BMBF) within the
framework concept "KMU-innovativ" (grant number 01|S012046B).
References
[Aal03] W.M.P. van Der Aalst. Workflow patterns. Distributed and Parallel Databases, 14(1):5–51, 2003.
[BDD+04] Jörg Becker, Patrick Delfmann, Alexander Dreiling, Ralf Knackstedt, and DominikKuropka. Configurative Process Modeling–Outlining an Approach to increased Busi-ness Process Model Usability. In Proceedings of the 15th IRMA International Confer-ence, 2004.
[BDJ+11] Giorgio Bruno, Frank Dengler, Ben Jennings, Rania Khalaf, Selmin Nurcan, MichaelPrilla, Marcello Sarini, Rainer Schmidt, and Rito Silva. Key challenges for enablingagile BPM with social software. Journal of Software Maintenance and Evolution: Re-search and Practice, 23(4):297–326, June 2011.
[BGS+11] Michel Buffa, Fabien Gandon, Peter Sander, Catherine Faron, and Guillaume Ereteo.SweetWiki: a semantic wiki, August 2011.
[BMNS11] Sabine Buckl, Florian Matthes, Christian Neubert, and ChristianM. Schweda. ALightweight Approach to Enterprise Architecture Modeling and Documentation. InPnina Soffer and Erik Proper, editors, Information Systems Evolution, volume 72 ofLecture Notes in Business Information Processing, pages 136–149. Springer, 2011.
[BT13] Sebastian Bittmann and Oliver Thomas. An Argumentative Approach of ConceptualModelling and Model Validation through Theory Building. In J. vom Brocke, editor,DESRIST 2013, LNCS 7939, pages 242–257, Heidelberg, 2013. Springer.
[FMP11] Fabian Friedrich, Jan Mendling, and Frank Puhlmann. Process Model Generation fromNatural Language Text. In Haralambos Mouratidis and Colette Rolland, editors, Ad-vanced Information Systems Engineering, volume 6741 of Lecture Notes in ComputerScience, pages 482–496. Springer Berlin Heidelberg, 2011.
[Gia01] George M. Giaglis. A Taxonomy of Business Process Modeling and Information Sys-tems Modeling Techniques. International Journal of Flexible Manufacturing Systems,13(2):209–228, 2001.
[Gib87] Allan A. Gibb. Enterprise Culture - Its Meaning and Implications for Education andTraining. Journal of European Industrial Training, 11(2):2–38, December 1987.
[GRS12] Chiara Ghidini, Marco Rospocher, and Luciano Serafini. Conceptual Modeling inWikis: a Reference Architecture and a Tool. In eKNOW 2012, The Fourth InternationalConference on Information, Process, and Knowledge Management, pages 128–135, Va-lencia, Spain, 2012.
[IRRG09] Marta Indulska, Jan Recker, Michael Rosemann, and Peter Green. Business ProcessModeling: Current Issues and Future Challenges. In Pascal Eck, Jaap Gordijn, andRoel Wieringa, editors, Advanced Information Systems Engineering, volume 5565 ofLecture Notes in Computer Science, pages 501–514. Springer Berlin Heidelberg, 2009.
151

[JNF+00] N. R. Jennings, T. J. Norman, P. Faratin, P. O’Brien, and B. Odgers. Autonomousagents for business process management. Applied Artificial Intelligence, 14(2):145–189, February 2000.
[KB02] Brane Kalpic and Peter Bernus. Business process modelling in industry - the powerfultool in enterprise management. Computers in Industry, 47(3):299–318, March 2002.
[KPV03] Kaj U. Koskinen, Pekka Pihlanto, and Hannu Vanharanta. Tacit knowledge acquisitionand sharing in a project work context. International Journal of Project Management,21(4):281–290, May 2003.
[KVV06] Markus Krötzsch, Denny Vrandecic, and Max Völkel. Semantic MediaWiki. In 5thInternational Semantic Web Conference, ISWC 2006, pages 935–942. Springer, 2006.
[LA94] F. Leymann and W. Altenhuber. Managing business processes as an information re-source. IBM Systems Journal, 33(2):326–348, 1994.
[LMP12] Henrik Leopold, Jan Mendling, and Artem Polyvyanyy. Generating Natural LanguageTexts from Business Process Models. In Jolita Ralyte, Xavier Franch, Sjaak Brinkkem-per, and Stanislaw Wrycza, editors, Advanced Information Systems Engineering, vol-ume 7328 of Lecture Notes in Computer Science, pages 64–79. Springer Berlin Heidel-berg, 2012.
[MAA10] Carlos Monsalve, Alain April, and Alain Abran. Representing Unique StakeholderPerspectives in BPM Notations. In 2010 Eighth ACIS International Conference onSoftware Engineering Research, Management and Applications, pages 42–49. IEEE,2010.
[MS08] Jan Mendling and Mark Strembeck. Influence Factors of Understanding Business Pro-cess Models. In Lecture Notes in Business Information Processing, volume 7, pages142–153. 2008.
[Mül11] J. Müller. Strukturbasierte Verifikation Von BPMN-Modellen. Vieweg Verlag, Friedr, &Sohn Verlagsgesellschaft mbH, 2011.
[Sch06] Sebastian Schaffert. IkeWiki: A Semantic Wiki for Collaborative Knowledge Manage-ment. In 15th IEEE International Workshops on Enabling Technologies: Infrastructurefor Collaborative Enterprises (WETICE’06), pages 388–396. IEEE, 2006.
[Swe13] KeithD. Swenson. Position: BPMN Is Incompatible with ACM. In Marcello Rosa andPnina Soffer, editors, Business Process Management Workshops, volume 132 of LectureNotes in Business Information Processing, pages 55–58. Springer Berlin Heidelberg,2013.
[vdA04] W.M.P. van der Aalst. Business Process Management: A personal view. BusinessProcess Management Journal, 10(2):135–139, 2004.
[vdAT03] W.M.P. van der Aalst and A. H. M. Ter Hofstede. Business Process Management: ASurvey. In Proceedings of the 1st International Conference on Business Process Man-agement, volume 2678 of LNCS, pages 1–12, 2003.
[zMI10] Michael zur Muehlen and Marta Indulska. Modeling languages for business processesand business rules: A representational analysis. Information Systems, 35(4):379 – 390,2010.
152
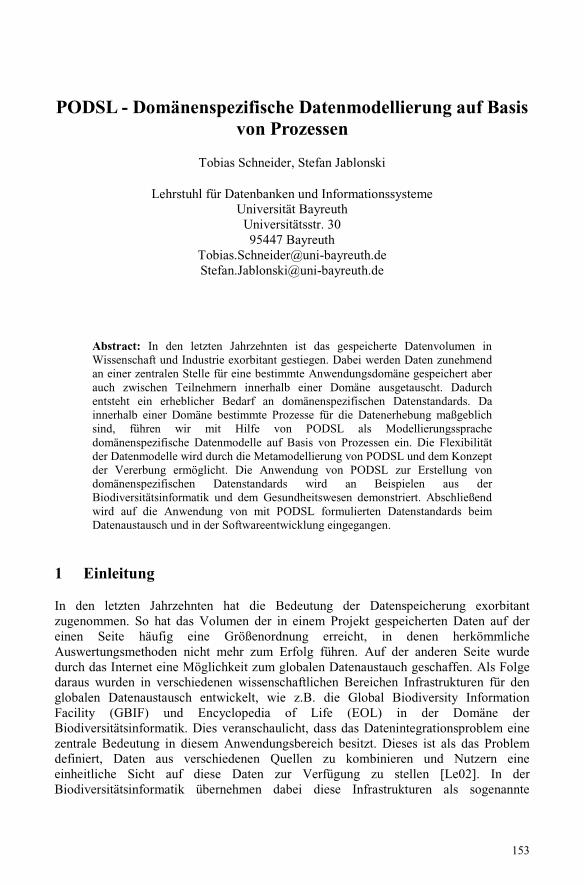
PODSL - Domänenspezifische Datenmodellierung auf Basisvon Prozessen
Tobias Schneider, Stefan Jablonski
Lehrstuhl für Datenbanken und InformationssystemeUniversität Bayreuth
Universitätsstr. 3095447 Bayreuth
[email protected]@uni-bayreuth.de
Abstract: In den letzten Jahrzehnten ist das gespeicherte Datenvolumen inWissenschaft und Industrie exorbitant gestiegen. Dabei werden Daten zunehmendan einer zentralen Stelle für eine bestimmte Anwendungsdomäne gespeichert aberauch zwischen Teilnehmern innerhalb einer Domäne ausgetauscht. Dadurchentsteht ein erheblicher Bedarf an domänenspezifischen Datenstandards. Dainnerhalb einer Domäne bestimmte Prozesse für die Datenerhebung maßgeblichsind, führen wir mit Hilfe von PODSL als Modellierungssprachedomänenspezifische Datenmodelle auf Basis von Prozessen ein. Die Flexibilitätder Datenmodelle wird durch die Metamodellierung von PODSL und dem Konzeptder Vererbung ermöglicht. Die Anwendung von PODSL zur Erstellung vondomänenspezifischen Datenstandards wird an Beispielen aus derBiodiversitätsinformatik und dem Gesundheitswesen demonstriert. Abschließendwird auf die Anwendung von mit PODSL formulierten Datenstandards beimDatenaustausch und in der Softwareentwicklung eingegangen.
1 Einleitung
In den letzten Jahrzehnten hat die Bedeutung der Datenspeicherung exorbitantzugenommen. So hat das Volumen der in einem Projekt gespeicherten Daten auf dereinen Seite häufig eine Größenordnung erreicht, in denen herkömmlicheAuswertungsmethoden nicht mehr zum Erfolg führen. Auf der anderen Seite wurdedurch das Internet eine Möglichkeit zum globalen Datenaustauch geschaffen. Als Folgedaraus wurden in verschiedenen wissenschaftlichen Bereichen Infrastrukturen für denglobalen Datenaustausch entwickelt, wie z.B. die Global Biodiversity InformationFacility (GBIF) und Encyclopedia of Life (EOL) in der Domäne derBiodiversitätsinformatik. Dies veranschaulicht, dass das Datenintegrationsproblem einezentrale Bedeutung in diesem Anwendungsbereich besitzt. Dieses ist als das Problemdefiniert, Daten aus verschiedenen Quellen zu kombinieren und Nutzern eineeinheitliche Sicht auf diese Daten zur Verfügung zu stellen [Le02]. In derBiodiversitätsinformatik übernehmen dabei diese Infrastrukturen als sogenannte
153

Megascience-Plattformen die wichtige Aufgabe der Langzeitarchivierung von Daten[THR12].
All diesen Systemen ist gemein, dass Sie von einer Vielzahl von Anwendern genutztwerden, die innerhalb derselben Anwendungsdomäne arbeiten. Die Anforderungendieser Projekte an die Datenspeicherung sind dabei sehr unterschiedlich. Dies führt zuDatenverlusten bei zentralen Plattformen zur Datenspeicherung. Darüber hinaus sind dieAnwendungsdomänen einem steten Wandel unterworfen, der sich in kontinuierlichenÄnderungen der Anforderungen an ein zentrales Datenschema widerspiegelt. Eineweitere Herausforderung ist die große und sich ständig ändernde Anzahl an Teilnehmerneiner Plattform. Die Motivation zur Teilnahme an einer Plattform zum Datenaustauschist im Allgemeinen bei den jeweiligen Teilnehmern sehr unterschiedlich, da diese ausder Perspektive ihres jeweiligen Projekts Daten erheben, sammeln, speichern oderauswerten möchten. Diese Projekte haben meistens nur gemein, dass sie derselbenAnwendungsdomäne angehören und eine gemeinsame Infrastruktur nutzen. DieInfrastruktur gibt ein Datenschema vor, das von allen Teilnehmern des Systemsverwendet werden muss. Aufgrund der Teilnehmerstruktur werden solcheInfrastrukturen im Folgenden als offen bezeichnet, wohingegen Infrastrukturen miteinem eingeschränkten und stabilen Teilnehmerkreis als geschlossen bezeichnet werden.
Offene Infrastrukturen stellen besondere Herausforderungen an die Datenintegration. Soist es möglich, dass Daten falsch interpretiert werden, wenn die Speicherung der Datenmöglich ist, aber die Daten in einen anderen Kontext gesetzt werden und somit einBedeutungswandel stattfindet. Um dieses Problem zu lösen, wurde eine Reihe vondomänenspezifischen Datenstandards entwickelt wie z.B. ABCD und DwC für dieBiodiversitätsinformatik [TD09] oder aber die HL7-Standards für klinischeInformationssysteme [HL13]. Die Entwicklung von domänenspezifischen Standards istzeitaufwändig, da sie nicht zuletzt von subjektiven Meinungen von einzelnenTeilnehmern und Organisationen geprägt ist [Mo05]. In der Praxis ist aber diemangelhafte Umsetzung von Anforderungen im Bezug auf das Datenschema der Grundfür das Scheitern vieler Projekte [Mo05]. Eine weitere Schwierigkeit ergib sich aus demProblem der alternativen Datenmodelle [MS94] nach dem ein gegebenesModellierungsproblem auf verschiedene Weise gelöst werden kann. Damit ist dasDatenschema die Schlüsselstelle eines Datenstandards und maßgeblich für dieBewertung und Nutzbarkeit eines Standards zum Datenaustausch.
Als Lösung für diese Herausforderung bietet sich die Analyse der Prozesse in derAnwendungsdomäne an. Die Entwicklung von Datenmodellen aus Prozessmodellenwurde in der Dissertation „Domänenspezifische Evaluation und Optimierung vonDatenstandards und Infrastrukturen“ [Sc13] ausführlich vorgestellt und dient alsGrundlage für die folgenden Ausführungen. Die Prozessmodellierung als Grundlage derAnalyse der Anforderungen an ein Datenmodell bietet den Vorteil, dass die Darstellungin Prozessen zunächst einen einfachen Zugang zu dieser komplexen Problemstellungermöglicht [Sc13]. Des Weiteren sind Prozesse gut verständlich und als Technik weitverbreitet und akzeptiert. Darüber hinaus werden innerhalb einer Anwendungsdomänebestimmte Prozesse regelmäßig ausgeführt. Wenn bei diesen Prozessen Daten erhobenwerden, ist es von entscheidendend, dass die Anforderungen an die Datenerhebung im
154

Schema eines Datenstandards repräsentiert sind. Durch die Strukturierung in Prozessenkönnen die Anforderungen klar strukturiert werden und in ein Datenschema für dieAnwendungsdomäne übertragen werden. Spezialinteressen von Domänenexpertenwerden durch die Prozessmodellierung erkennbar und können diskutiert werden [Sc13].Die Entwicklung eines Datenstandards aus einem Prozessmodell folgt der in Abbildung1 dargestellten Vorgehensweise. Dazu wird die Entwicklung eines Datenschemas auseinem Prozessmodell in Abschnitt 2 mit Hilfe der perspektivenorientiertenProzessmodellierung (POPM) [JB96] eingeführt.
Abbildung 1: Modellierungspfad bei der Entwicklung eines domänenspezifischen Datenstandards
In Abschnitt 3 werden weitere Anforderungen an einen domänenspezifischenDatenstandard und Konzepte zur Lösung dieser Herausforderungen mit der ProcessOriented Data Schema Language (PODSL) eingeführt. In Abschnitt 4 wird dasMetamodell von PODSL eingeführt, welches die Modellierungssprache für dieErzeugung von Datenschemata ist. Die Erstellung von Datenschemata mit PODSL wirdin Abschnitt 5 für die Domäne der Biodiversität und den Krankenhausbereichdemonstriert. Ein Ausblick auf die Nutzung von mit PODSL entwickeltenDatenschemata in Infrastrukturen und in der Softwareentwicklung wird in Abschnitt 6vorgenommen. In Abschnitt 7 werden die Ergebnisse aus den vorangegangenenAbschnitten zusammengefasst und es wird ein Ausblick auf zukünftige Entwicklungengegeben.
2 Von der Prozessmodellierung zur Datenmodellierung
In diesem Abschnitt wird die Entwicklung von Datenschemata auf Basis von Prozesseneingeführt. Dazu soll zunächst mit POPM eine bewährte Prozessmodellierungssprachevorgestellt werden. POPM konnte sehr gute Ergebnisse in der praktischen Anwendung inder Domäne der Biodiversitätsinformatik [Sc13] und in Krankenhäusern aufweisen[FJS07]. Anschließend wird die Ermittlung der Anforderungen an die Datenspeicherungaus Prozessen demonstriert und mit der aspektorientierten Datenmodellierung eineMethode zur Entwicklung von Datenschemata auf Basis von Prozessen eingeführt.
2.1 Prozessmodellierung mit POPM
Im Rahmen der perspektivenorientierte Prozessmodellierung (POPM) [Ja95] wird einProzess durch verschiedene Perspektiven definiert. Wenn ein Prozess modelliert wird,werden Antworten auf die Fragen Was?, Wer?, Womit?, Wie? und Wann? gesucht. DieAntworten auf diese Fragen werden in Form von Perspektiven in das Modelleingebracht. Die Perspektiven stehen dabei orthogonal zueinander [JB96]. Somitüberlappen sich die Informationen der Perspektiven nicht. In POPM werden folgendeBasisperspektiven definiert [Ja95] [JB96]:
155

• Funktionale Perspektive (Was?): Beschreibt die funktionalen Einheiten einesProzesses, die ausgeführt werden sollen.
• Datenorientierte Perspektive (Womit?): Beschreibt, wo innerhalb einesProzesses Daten erzeugt oder aber konsumiert werden. Im Rahmen dieserPerspektive können neben Daten, die in Dokumenten erfasst werden, auchphysische Erzeugnisse verstanden werden.
• Organisatorische Perspektive (Wer?): Beschreibt, wer für die Ausführung desProzesses verantwortlich ist. Dies muss nicht zwangsläufig eine natürlichePerson sein, sondern kann auch eine Organisation oder aber eine Maschine sein[Bu98].
• Operationale Perspektive (Wie?): Beschreibt die Werkzeuge, die bei derAusführung eines Prozesses verwendet werden.
• Verhaltensorientierte Perspektive (Wann?): Diese Perspektive legt fest, inwelcher Reihenfolge die Prozesse innerhalb eines Prozessmodells ausgeführtwerden sollen.
Die Auflistung der Perspektiven ist nicht abschließend. Nach denModellierungsanforderungen der Domäne können weitere Perspektiven wie z.B. dieKausalitätsperspektive (Warum?) eingeführt werden [JB96].
2.2 Ermittlung der Anforderungen an die Datenspeicherung aus Prozessen
Die Erfassung von Daten ist das Ergebnis eines Prozesses der Datenaufnahme. Soentstehen im Rahmen der Biodiversitätsinformatik die Daten nicht einfach durch dasFüllen von Datenstrukturen, sondern werden in Begehungen erhoben. In Rahmen einerBegehung analysiert ein Biologe beispielsweise die Vegetation einer Wiese und erstelltdadurch eine Artenliste, welche die taxonomischen Bezeichnungen der identifiziertenFundobjekte enthält. Zur Demonstration der Ableitung von Anforderungen an dasSchema soll folgender Prozess (Abbildung 2) aus der Biodiversitätsinformatik betrachtetwerden:
Prozess der Geländekartierung: Ein Kartierer ist auf der Suche nach biologischenObjekten z.B. nach Pilzen in einem zuvor definierten Gebiet. Hat er einen Pilz gefunden,dokumentiert er die taxonomische Bezeichnung des Fundes sowie den Ort und Zeitpunktder Kartierung.
In Abbildung 2 wird in der datenorientierten Perspektive deutlich, dass in jedemProzessschritt mit PED1 ein Dokument benötigt wird, welches das Ergebnis desProzesses speichert. Elemente der datenorientierten Perspektive zur Speicherung desProzessergebnisses werden als ProcessExecutionDocument (PED) bezeichnet.
Die konkrete Ausführung des Prozesses führt zu einer Aussage wie:
Josef Simmel hat am 27.3.2012 um 14.12 Uhr ein bestimmtes biologisches Objekt alsQuercur robur (Eiche) identifiziert, welches sich an den GPS Koordinaten 49.4628332,11.3526638 befindet.
156

Abbildung 2: Prozess der Geländekartierung
Dementsprechend muss ein PED über ein Datenschema verfügen, welches die bei derProzessausführung entstehenden Daten erfassen kann. Im konkreten Beispiel kann amProzessmodell aus der organisatorischen Perspektive abgelesen werden, dass der Namedes Kartierers ein solches Datum ist. Analog dazu kann au der funktionalen Perspektivein den Subprozessen abgeleitet werden, dass im Schema des PED Felder zur Erfassungvon Zeit und Ort benötigt werden. Durch die Prozessperspektiven werden somitAnforderungen an das Schema eines PED spezifiziert. Für die Entwicklung vondomänenspezifischen Datenstandards folgt daraus, dass sobald die Prozesse einerDomäne formuliert sind auch die Anforderungen an den Datenstandard bekannt sind.
2.3 Aspektorientierte Dokumentenmodellierung
Im vorangegangenen Abschnitt wurde gezeigt, dass sich die Anforderungen an einDatenschema direkt aus einem Prozessmodell ableiten lassen. In diesem Abschnitt wirdeine strukturierte Methode zur Erstellung von Schemata eingeführt, welche auf derZerlegung eines Prozesses in Perspektiven beruht. Dazu werden den Prozessperspektivenim Schema des PED thematisch unabhängige Bereiche gegenübergestellt, die dieSpeicherung der Daten bei der Prozessausführung zur Aufgabe haben. Diese Bereichewerden als Dokumentenaspekte bezeichnet.
Definition: Ein Dokumentenaspekt eines PED ist ein Bereich des Schemas zureindeutigen Speicherung von Daten eines bestimmten Themenbereichs, der orthogonalzu allen anderen Dokumentenaspekten eines PEDs steht [Sc13].
Orthogonal bedeutet in diesem Zusammenhang, dass sich die Aspekte nicht überlappen,also eine thematisch disjunkte Gliederung eines Dokumentes ermöglichen. Die Auswahlder Aspekte ist dabei von der betrachteten Domäne und der Art der Prozesse dieserDomäne abhängig.
157

Folgende Aspekte konnten in Projekterfahrungen für die die Domäne derBiodiversitätsinformatik identifiziert werden [Sc13]:
• Funktionaler Aspekt: Speicherung der Primärdaten. Das sind die Daten zudessen Zweck der Prozess der Datenerhebung ausgeführt wurde (z.B. Datenvon Messungen, taxonomische Bestimmungen).
• Organisatorischer Aspekt: Speicherung des Verantwortlichen derProzessausführung
• Operationaler Aspekt: Speicherung der verwendeten Werkzeuge undHilfsmittel
• Datenorientierter Aspekt: Speicherung von Referenzen auf andere Daten undDokumente, die während eines Erhebungsprozesses erfasst wurden oderSpeicherung von Referenzen auf physische oder virtuelle Objekte desErhebungsprozesses (z.B. Mitnahme von Belegen, Multimediaobjekte, externeDaten)
• Temporaler Aspekt: Speicherung des Zeitpunkts der Prozessausführung• Lokaler Aspekt: Speicherung des Ausführungsorts• Verhaltensorientierter Aspekt: Im Verhaltensorientierten Aspekt wird die
zeitliche Abfolge zwischen Prozessen erfasst. Somit werden in diesem Aspektverschiedene Aussagen mit ihrer zeitlichen Reihenfolge verknüpft.
Abbildung 3: Orthogonale Zerlegung eines PED´s nach Aspekten
Den Dokumentenaspekten sind die elementaren Fragen nach Was?, Wer?, Wie?, Wann?und Wo? zugeordnet (Abbildung 3). Die Auflistung der Dokumentenaspekte ist analogzu den Prozessperspektiven nicht abschließend. Je nach Anwendungsdomäne kann esnotwendig sein, weitere Dokumentenaspekte aufzunehmen. Um die Daten einerProzessausführung in einem PED zu speichern, sind folgende Regeln einzuhalten[Sc13]:
• Für jede Prozessperspektive muss ein korrespondierender Dokumentenaspektexistieren.
• Der lokale und temporale Dokumentenaspekt muss existieren, um denZeitpunkt und der Ort der Prozessausführung abzubilden.
158

Diese Anforderungen an ein PED sind zur Erfassung eines Prozesses notwendig, da einunvollständiges Schema zu Datenverlust führt und somit für die Dokumentation einesProzesses ungeeignet ist. Damit ist das PED das zentrale Dokument zur Speicherung derAusführung eines Prozesses und Grundlage für die Speicherung der Prozessausführungin der Metastruktur von PODSL.
2.4 Genauigkeit der Erfassung der Prozessausführung
Es genügt nicht nur, dass alle Prozessperspektiven in einem Dokumentenaspektrepräsentiert sind. Diese Repräsentation muss auch mit einer bestimmten Genauigkeiterfolgen, damit das Schema des PED den Prozess ausreichend erfassen kann. Ein PEDzur Erfassung des Prozesses der Geländekartierung findet sich in Abbildung 4. DasSchema des PED´s enthält für alle Prozessperspektiven aus Abbildung 2Dokumentenaspekte zur Aufnahme der Daten. Das Schema des PED´s kann dieseDokumentenaspekte nicht mit der erforderlichen Genauigkeit erfassen, da die Uhrzeitder Prozessausführung nicht erfasst wurde. Diese gehört aber zu den Anforderungen derGeländekartierung. Die Anforderungen des Prozesses an das Dokument zur Erfassungdes Prozesses sind damit nicht vollständig erfüllt.
Abbildung 4: Beispieldatensatz mit einem Mangel im temporalen Dokumentenaspekt [Sc13]
Die klare Untergliederung eines PED´s in Dokumentenaspekte ermöglicht es, dieseFehler im Design zu identifizieren. Die erforderliche Genauigkeit muss dabei durchInteraktion mit Domänenexperten ermittelt werden, wobei das Prozessmodell alsDiskussionsgrundlage dient.
3 Anforderungen an einen domänenspezifischen Datenstandardund Umsetzung in PODSL
Kernaufgabe eines domänenspezifischen Datenstandards ist der Datenaustauschzwischen den verschiedenen Teilnehmern einer offenen Infrastruktur innerhalb einerDomäne. Durch diesen Anwendungshintergrund wird eine Reihe von Anforderungendefiniert, die ein domänenspezifischer Datenstandard in diesem Kontext erfüllen muss.Im folgenden Abschnitt werden die wichtigsten Anforderungen diesbezüglich aufgeführtund mit den Modellierungskonzepten von PODSL gelöst. Für weitere Anforderungenund ihre Lösung mit PODSL wird auf [Sc13] verwiesen.
159
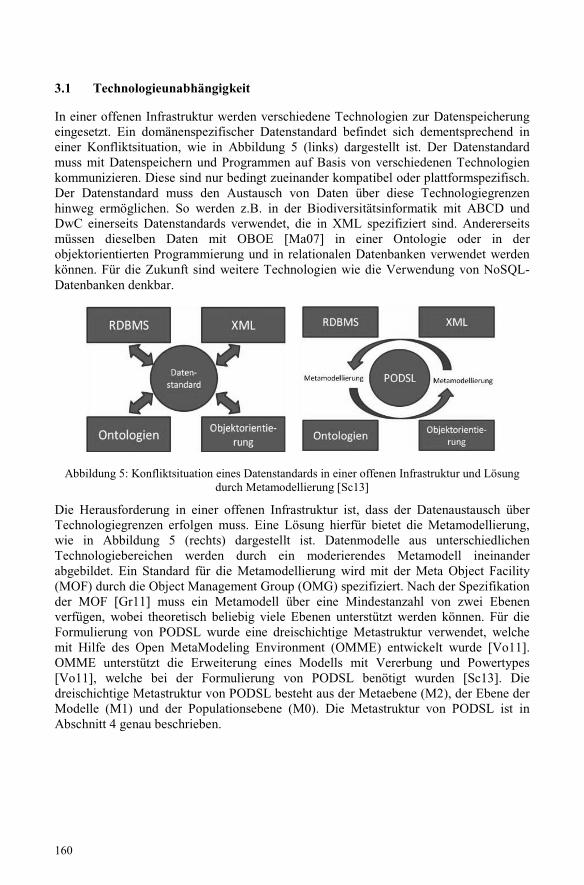
3.1 Technologieunabhängigkeit
In einer offenen Infrastruktur werden verschiedene Technologien zur Datenspeicherungeingesetzt. Ein domänenspezifischer Datenstandard befindet sich dementsprechend ineiner Konfliktsituation, wie in Abbildung 5 (links) dargestellt ist. Der Datenstandardmuss mit Datenspeichern und Programmen auf Basis von verschiedenen Technologienkommunizieren. Diese sind nur bedingt zueinander kompatibel oder plattformspezifisch.Der Datenstandard muss den Austausch von Daten über diese Technologiegrenzenhinweg ermöglichen. So werden z.B. in der Biodiversitätsinformatik mit ABCD undDwC einerseits Datenstandards verwendet, die in XML spezifiziert sind. Andererseitsmüssen dieselben Daten mit OBOE [Ma07] in einer Ontologie oder in derobjektorientierten Programmierung und in relationalen Datenbanken verwendet werdenkönnen. Für die Zukunft sind weitere Technologien wie die Verwendung von NoSQL-Datenbanken denkbar.
Abbildung 5: Konfliktsituation eines Datenstandards in einer offenen Infrastruktur und Lösungdurch Metamodellierung [Sc13]
Die Herausforderung in einer offenen Infrastruktur ist, dass der Datenaustausch überTechnologiegrenzen erfolgen muss. Eine Lösung hierfür bietet die Metamodellierung,wie in Abbildung 5 (rechts) dargestellt ist. Datenmodelle aus unterschiedlichenTechnologiebereichen werden durch ein moderierendes Metamodell ineinanderabgebildet. Ein Standard für die Metamodellierung wird mit der Meta Object Facility(MOF) durch die Object Management Group (OMG) spezifiziert. Nach der Spezifikationder MOF [Gr11] muss ein Metamodell über eine Mindestanzahl von zwei Ebenenverfügen, wobei theoretisch beliebig viele Ebenen unterstützt werden können. Für dieFormulierung von PODSL wurde eine dreischichtige Metastruktur verwendet, welchemit Hilfe des Open MetaModeling Environment (OMME) entwickelt wurde [Vo11].OMME unterstützt die Erweiterung eines Modells mit Vererbung und Powertypes[Vo11], welche bei der Formulierung von PODSL benötigt wurden [Sc13]. Diedreischichtige Metastruktur von PODSL besteht aus der Metaebene (M2), der Ebene derModelle (M1) und der Populationsebene (M0). Die Metastruktur von PODSL ist inAbschnitt 4 genau beschrieben.
160
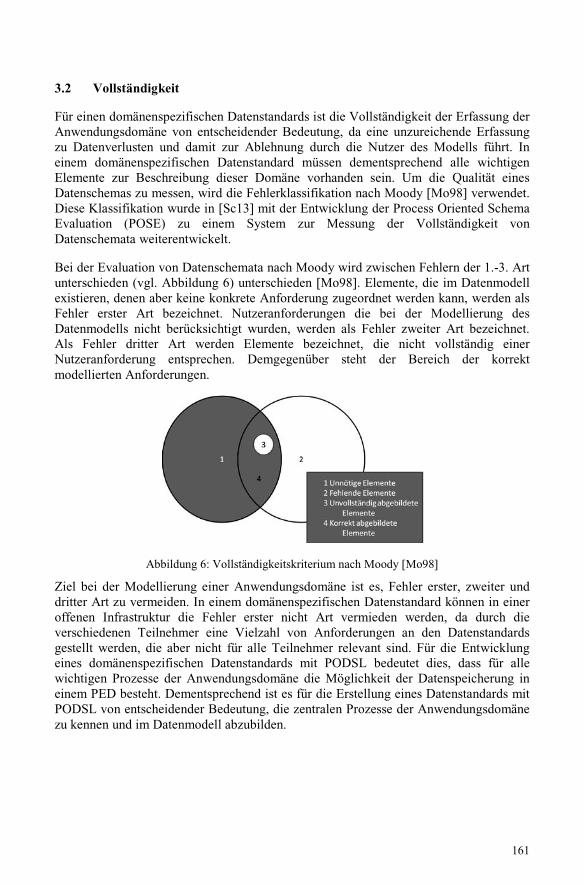
3.2 Vollständigkeit
Für einen domänenspezifischen Datenstandards ist die Vollständigkeit der Erfassung derAnwendungsdomäne von entscheidender Bedeutung, da eine unzureichende Erfassungzu Datenverlusten und damit zur Ablehnung durch die Nutzer des Modells führt. Ineinem domänenspezifischen Datenstandard müssen dementsprechend alle wichtigenElemente zur Beschreibung dieser Domäne vorhanden sein. Um die Qualität einesDatenschemas zu messen, wird die Fehlerklassifikation nach Moody [Mo98] verwendet.Diese Klassifikation wurde in [Sc13] mit der Entwicklung der Process Oriented SchemaEvaluation (POSE) zu einem System zur Messung der Vollständigkeit vonDatenschemata weiterentwickelt.
Bei der Evaluation von Datenschemata nach Moody wird zwischen Fehlern der 1.-3. Artunterschieden (vgl. Abbildung 6) unterschieden [Mo98]. Elemente, die im Datenmodellexistieren, denen aber keine konkrete Anforderung zugeordnet werden kann, werden alsFehler erster Art bezeichnet. Nutzeranforderungen die bei der Modellierung desDatenmodells nicht berücksichtigt wurden, werden als Fehler zweiter Art bezeichnet.Als Fehler dritter Art werden Elemente bezeichnet, die nicht vollständig einerNutzeranforderung entsprechen. Demgegenüber steht der Bereich der korrektmodellierten Anforderungen.
Abbildung 6: Vollständigkeitskriterium nach Moody [Mo98]
Ziel bei der Modellierung einer Anwendungsdomäne ist es, Fehler erster, zweiter unddritter Art zu vermeiden. In einem domänenspezifischen Datenstandard können in eineroffenen Infrastruktur die Fehler erster nicht Art vermieden werden, da durch dieverschiedenen Teilnehmer eine Vielzahl von Anforderungen an den Datenstandardsgestellt werden, die aber nicht für alle Teilnehmer relevant sind. Für die Entwicklungeines domänenspezifischen Datenstandards mit PODSL bedeutet dies, dass für allewichtigen Prozesse der Anwendungsdomäne die Möglichkeit der Datenspeicherung ineinem PED besteht. Dementsprechend ist es für die Erstellung eines Datenstandards mitPODSL von entscheidender Bedeutung, die zentralen Prozesse der Anwendungsdomänezu kennen und im Datenmodell abzubilden.
161
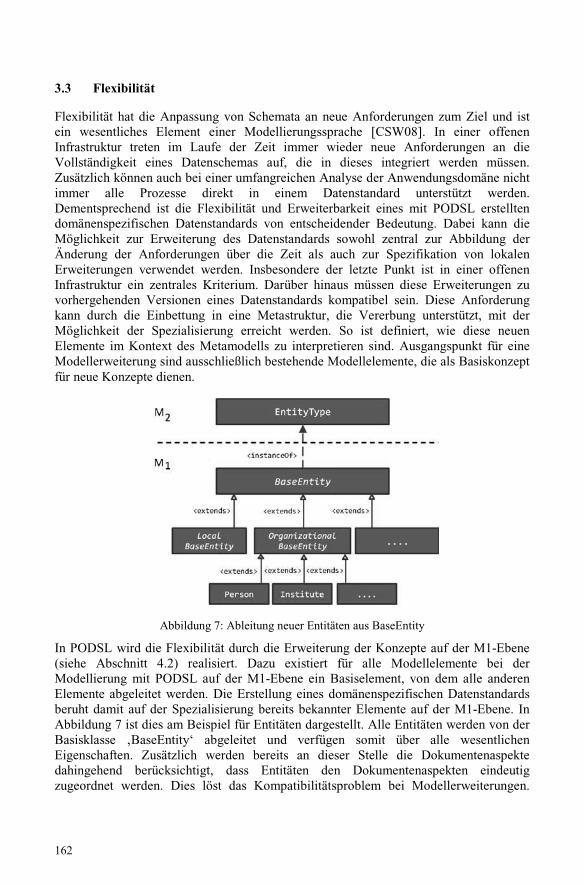
3.3 Flexibilität
Flexibilität hat die Anpassung von Schemata an neue Anforderungen zum Ziel und istein wesentliches Element einer Modellierungssprache [CSW08]. In einer offenenInfrastruktur treten im Laufe der Zeit immer wieder neue Anforderungen an dieVollständigkeit eines Datenschemas auf, die in dieses integriert werden müssen.Zusätzlich können auch bei einer umfangreichen Analyse der Anwendungsdomäne nichtimmer alle Prozesse direkt in einem Datenstandard unterstützt werden.Dementsprechend ist die Flexibilität und Erweiterbarkeit eines mit PODSL erstelltendomänenspezifischen Datenstandards von entscheidender Bedeutung. Dabei kann dieMöglichkeit zur Erweiterung des Datenstandards sowohl zentral zur Abbildung derÄnderung der Anforderungen über die Zeit als auch zur Spezifikation von lokalenErweiterungen verwendet werden. Insbesondere der letzte Punkt ist in einer offenenInfrastruktur ein zentrales Kriterium. Darüber hinaus müssen diese Erweiterungen zuvorhergehenden Versionen eines Datenstandards kompatibel sein. Diese Anforderungkann durch die Einbettung in eine Metastruktur, die Vererbung unterstützt, mit derMöglichkeit der Spezialisierung erreicht werden. So ist definiert, wie diese neuenElemente im Kontext des Metamodells zu interpretieren sind. Ausgangspunkt für eineModellerweiterung sind ausschließlich bestehende Modellelemente, die als Basiskonzeptfür neue Konzepte dienen.
Abbildung 7: Ableitung neuer Entitäten aus BaseEntity
In PODSL wird die Flexibilität durch die Erweiterung der Konzepte auf der M1-Ebene(siehe Abschnitt 4.2) realisiert. Dazu existiert für alle Modellelemente bei derModellierung mit PODSL auf der M1-Ebene ein Basiselement, von dem alle anderenElemente abgeleitet werden. Die Erstellung eines domänenspezifischen Datenstandardsberuht damit auf der Spezialisierung bereits bekannter Elemente auf der M1-Ebene. InAbbildung 7 ist dies am Beispiel für Entitäten dargestellt. Alle Entitäten werden von derBasisklasse ‚BaseEntity‘ abgeleitet und verfügen somit über alle wesentlichenEigenschaften. Zusätzlich werden bereits an dieser Stelle die Dokumentenaspektedahingehend berücksichtigt, dass Entitäten den Dokumentenaspekten eindeutigzugeordnet werden. Dies löst das Kompatibilitätsproblem bei Modellerweiterungen.
162

Wenn in einer offenen Infrastruktur ein Teilnehmer eine lokale Erweiterung vornimmt,kann beim Datenaustausch stets auf eine Basisklasse zurückgegriffen werden. Darüberhinaus ist durch die Ableitung aus existierenden Strukturen für einen Teilnehmer derInfrastruktur die lokale Erweiterung eines anderen Teilnehmers leicht integrierbar.
3.4 Data Provenance
Unter Data Provenance sind alle Informationen zu verstehen, welche die Historie einesDatensatzes (beliebiger Technologie) beginnend bei der Originalquelle erfassen[SPG05]. Demnach wird mit Data Provenance nicht nur die Herkunft eines Datensatzeserfasst, sondern auch alle Transformationen, die ein Datensatz durchläuft. DataProvenance ist ein unverzichtbares Mittel für die Identifikation von Datensätzen und beider Identifikation von Fehlern durch Datentransformationen oder bei derDatenintegration. Die Unterstützung von Data Provenance in einemdomänenspezifischen Datenstandard hat das Ziel, Strukturen zur Verwaltung vonHerkunft, Versionen und Veränderungen an Datensätzen zu erfassen.
Dazu muss ein Datensatz eindeutig identifiziert werden können. Da domänenspezifischeDatenstandards mit PODSL zum Datenaustausch in einer offenen Infrastrukturverwendet werden sollen, ist es erforderlich, Datensätze auf globaler Ebene zuidentifizieren. Dazu werden Elemente der M2 und M1-Ebene über Identifier in der fürOMME üblichen Form [Vo11]
model:/repository/Modell/Konzeptname
referenziert. Datensätze auf M0-Ebene müssen global eindeutig referenzierbar sein undwerden durch Identifier der Form
repository/ObjectID
identifiziert, wobei für die ObjectID ein Universally Unique Identifier (UUID)verwendet wird. Die Referenzierbarkeit von Elementen reicht in einer offenenInfrastruktur allerdings nicht aus, um Data Provenance zu realisieren. Zusätzlich müssendie Urheberschaft der Daten und alle Transformationen von Datensätzen dokumentiertwerden.
163
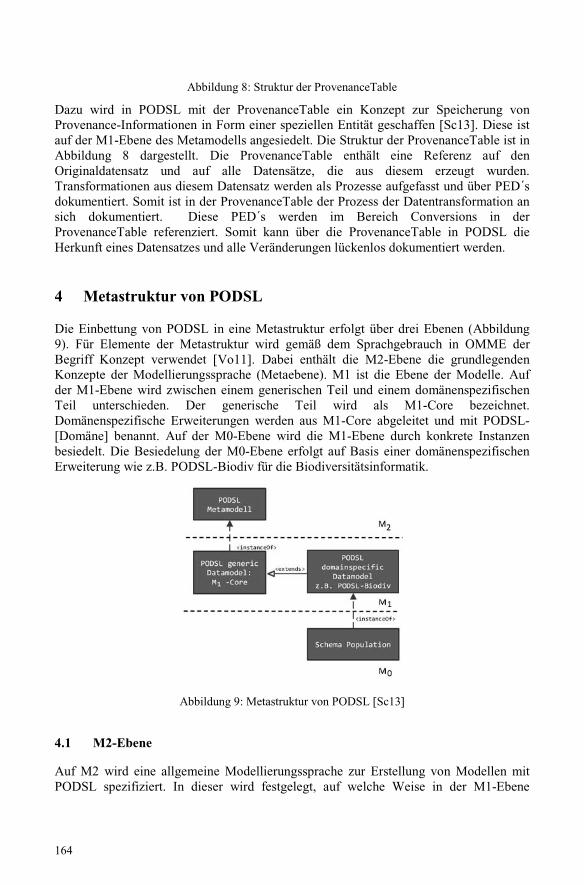
Abbildung 8: Struktur der ProvenanceTable
Dazu wird in PODSL mit der ProvenanceTable ein Konzept zur Speicherung vonProvenance-Informationen in Form einer speziellen Entität geschaffen [Sc13]. Diese istauf der M1-Ebene des Metamodells angesiedelt. Die Struktur der ProvenanceTable ist inAbbildung 8 dargestellt. Die ProvenanceTable enthält eine Referenz auf denOriginaldatensatz und auf alle Datensätze, die aus diesem erzeugt wurden.Transformationen aus diesem Datensatz werden als Prozesse aufgefasst und über PED´sdokumentiert. Somit ist in der ProvenanceTable der Prozess der Datentransformation ansich dokumentiert. Diese PED´s werden im Bereich Conversions in derProvenanceTable referenziert. Somit kann über die ProvenanceTable in PODSL dieHerkunft eines Datensatzes und alle Veränderungen lückenlos dokumentiert werden.
4 Metastruktur von PODSL
Die Einbettung von PODSL in eine Metastruktur erfolgt über drei Ebenen (Abbildung9). Für Elemente der Metastruktur wird gemäß dem Sprachgebrauch in OMME derBegriff Konzept verwendet [Vo11]. Dabei enthält die M2-Ebene die grundlegendenKonzepte der Modellierungssprache (Metaebene). M1 ist die Ebene der Modelle. Aufder M1-Ebene wird zwischen einem generischen Teil und einem domänenspezifischenTeil unterschieden. Der generische Teil wird als M1-Core bezeichnet.Domänenspezifische Erweiterungen werden aus M1-Core abgeleitet und mit PODSL-[Domäne] benannt. Auf der M0-Ebene wird die M1-Ebene durch konkrete Instanzenbesiedelt. Die Besiedelung der M0-Ebene erfolgt auf Basis einer domänenspezifischenErweiterung wie z.B. PODSL-Biodiv für die Biodiversitätsinformatik.
Abbildung 9: Metastruktur von PODSL [Sc13]
4.1 M2-Ebene
Auf M2 wird eine allgemeine Modellierungssprache zur Erstellung von Modellen mitPODSL spezifiziert. In dieser wird festgelegt, auf welche Weise in der M1-Ebene
164

modelliert werden kann. Die zentralen Konzepte der M2-Ebene von PODSL sind inAbbildung 10 dargestellt. Die Modellierung der Dokumentenaspekte ist dabei auf derEbene der Relation angesiedelt, in welchen Entitäten mit anderen Entitäten in einembestimmten Dokumentenaspekt in Beziehung gesetzt werden.
Abbildung 10: Schema der M2-Ebene von PODSL [Sc13]
4.2 M1-Ebene
Bei der M1-Ebene von PODSL wird zwischen der generischen Komponente M1-Coreund den domänenspezifischen Erweiterungen PODSL-[Domäne] unterschieden. Im M1-Core Modell von PODSL werden Konzepte spezifiziert, welche in verschiedenenDomänen verwendet werden können. Dies sind z.B. Konzepte wie BaseEntity undBaseProcessExecutionDocument und davon abgeleitete generische Konzepte. So ist z.B.die ProvenanceTable in M1-Core über Zwischenschritte von BaseEntity abgeleitet.Darüber hinaus sind grundlegende Konzepte wie Person in M1-Core spezifiziert. AufBasis der Konzepte von M1-Core werden die domänenspezifischen Erweiterungen durchSpezialisierung der Konzepte aus M1-Core gebildet. Die weitere Spezialisierung erfolgtauf Basis dieser domänenspezifischen Konzepte.
4.3 M0-Ebene
Auf der M0-Ebene werden konkrete Datensätze als Instanzen der Entitäten derdomänenspezifischen Datenstandards auf M1-Ebene gebildet. Die M1-Ebene dient alseine logische Struktur für die Anwendungsdomäne. Daten sollen möglichst leicht inandere Formate konvertiert und integriert werden können. Die Persistenz der Datenfindet in der Praxis in Datenbanken, XML, Strukturen der objektorientiertenProgrammierung und Ontologien statt.
165

5 Domänenspezifische Erweiterungen von M1-Core
Für die Entwicklung einer domänenspezifischen Erweiterung müssen die Prozesse derAnwendungsdomäne analysiert werden. Dies konnte im Rahmen des IBF-Projektes fürdie Domäne der Biodiversitätsinformatik erfolgen. Die Modellierung der wichtigstenProzesse der Biodiversitätsinformatik wurde in [Sc13] vorgenommen. Auf Grundlagedieser Prozesse wurden Entitäten und PED´s aus M1-Core abgeleitet. Kennzeichnend fürdie Domäne der Biodiversitätsinformatik sind Spezialisierungen von Entitäten zurBeschreibung von Orten, Personen, Taxa und Messungen an biologischen Objekten, wieauch in Abbildung 2 am „Prozess der Geländekartierung“ zu erkennen ist. Daskorrespondierende PED in PODSL-Biodiv ist nachfolgend aufgelistet:
concept BaseMonitoring extends BaseProcessExecutionDocument{identifier=BaseMonitoringIdentifier;object=ObservationObjectRelation;relation= ScientistRelation,ExecutionTimeRelation,ExecutionLocalityRelation}
Durch die Ableitung von „BaseProcessExecutionDocumnent“ erbt das PED„BaseMonitoring“ grundlegende Eigenschaften von PED`s, die z.B. DataProvenanceermöglichen. Als „object“ wird eine Relation vorgeschrieben, welche eine Beziehungzum Kartierungsobjekt herstellt. Die Subprozesse sind über weitere Relationenabgebildet, die Aspekten zugeordnet sind, die den Perspektiven desKartierungsprozesses entsprechen. Für den Prozessverantwortlichen sieht diereferenzierte Relation folgendermaßen aus:
concept ScientistRelation extends ResponsibleRelation{role="Scientist as a Gatherer in a process";aspect=OrganizationalAspect;identifier=ResponsibleGathererRelationIdentifier;target=Scientist;}
Dabei kann im PED spezifiziert werden, welche Anforderungen an die Genauigkeit eineEntität erfüllen muss. So ist für die Geländekartierung nicht jede Person automatischqualifiziert, sondern nur Wissenschaftler. In PODSL-Biodiv gibt es dementsprechend einKonzept „Scientist“, das von „Person“ abgeleitet wird.
Auf Basis dieser Erkenntnisse wurde PODSL-Biodiv als domänenspezifischerDatenstandard für die Biodiversitätsinformatik entwickelt und im IBF-Projektumfangreich getestet. Es konnten alle im IBF-Projekt identifizierten Prozesse inPODSL-Biodiv erfasst werden. Zusätzlich umfasst PODSL-Biodiv den in derBiodiversität etablierten Datenstandard DarwinCore (DwC). Damit erfasst PODSL-Biodiv die Anforderungen des IBF-Projektes vollständig und zusätzliche weiteretypische Prozesse der Biodiversitätsinformatik, so dass PODSL-Biodiv zur Anwendungin Projekten im Biodiversitätsbereich gut geeignet ist. Sollten zusätzliche Anforderungenauftreten werden durch Spezialisierung aus bekannten Konzepten die vollständigeErfassung wieder hergestellt. Über PODSL-Biodiv wird damit für die Domäne derBiodiversität über eine prozessorientierte Sichtweise ein umfangreiches Datenmodell zurVerfügung gestellt.
166

Ein weitere Anwendungsdomäne für PODSL sind sie Prozesse in Krankenhäuser, die in[FJS07] erhoben werden konnten. Auf Basis dieser Prozesse können imorganisatorischen Dokumentenaspekt wichtige Rollen in dieser Domäne wie Arzt,Pfleger, Verwaltungsangestellter und Patient identifiziert und weiter spezialisiertwerden. Domänenspezifische Prozesse sind in dieser Domäne z.B. die Aufnahme undEntlassung eines Patienten, die Untersuchung eines Patienten mit Subprozessen wieAnamnese. Die Datenmodellierung mit PODSL wird in einem aktuellen Projekt desLehrstuhls mit dem Klinikum Bayreuth intensiv getestet.
6 Ausblick
Im folgenden Abschnitt wird beschrieben, wie mit PODSL erstellt Datenstandards in derPraxis genutzt werden können. Dies ist zum einen die Erstellung von Mappings beimDatenaustausch – zum anderen die Verwendung in Softwareprodukten zur individuellenAnpassung.
Hintergrund der Entwicklung von domänenspezifischen Datenstandards mit PODSL istihre Anwendung in Infrastrukturen zum Datenaustausch. Dabei weisen mit PODSLentwickelte domänenspezifische Datenschemata aufgrund ihrer Flexibilität erheblicheVorteile gegenüber anderen Datenmodellen auf. Zusätzlich wird in PODSL DataProvenance bereits direkt im Datenschema berücksichtigt. Dies ist in der Domäne derBiodiversitätsinformatik besonders wichtig, da hier heterogene Daten über globaleInfrastrukturen wie z.B. dem GBIF oder dem LTER-Netzwerk ausgetauscht werden.
Ein weiterer Vorteil der Anwendung von PODSL ist die Möglichkeit einer besserenNutzeranpassung in Softwareprodukten. Durch die Ableitung aus Basisklassen mitPODSL können lokale Erweiterungen besser in Oberflächen eingebunden werden.Zusätzlich können durch (semi-)automatische Softwareentwicklung grafischeOberflächen erzeugt werden, die direkt aus dem Datenmodell abgeleitet werden. Dazuwird für eine Anwendung eine Reihe von protypischen Oberflächen zu Verfügunggestellt und diese durch die Datenstruktur von PODSL angepasst. Dies ermöglicht dieeinfache Erzeugung von nutzerspezifischen Oberflächen und Anwendungen.
7 Fazit
Die Prozesse einer Anwendungsdomäne enthalten bereits alle Anforderungen an einendomänenspezifischen Datenstandard. Diese bilden die Grundlage für dieDatenmodellierung. Mit der aspektorientierten Datenmodellierung wurde eine Methodeeingeführt, mit der die Erstellung von Schemata für Datenstandards auf Basis vonProzessen erfolgt. Die Nutzung eines domänenspezifischen Datenstandards ist mit hohenAnforderungen an die Technologieunabhängigkeit, Vollständigkeit, Flexibilität und DataProvenance verbunden. Mit PODSL wurde eine Methode zur Entwicklungdomänenspezifischer Datenstandards eingeführt, die diesen Anforderungen gerecht wird.In der praktischen Anwendung werden mit PODSL entwickelte Datenstandards beim
167

Datenaustausch in einer offenen Infrastruktur und als Grundlage für die Entwicklungvon Anwendungen genutzt. Dabei ist PODSL für die individuelle Anpassung vonSoftwareprodukten ein hervorragendes Werkzeug, da sich Oberflächen direkt aus derDatenstruktur generieren lassen. Durch mit PODSL erstellte Datenstandards könnendementsprechend die Herausforderungen einer offenen Infrastruktur gelöst werden.
8 Literaturverzeichnis
[Bu98] Bussler, C., Organisationsverwaltung in Workflow-Management-Systemen. 1998: Dt.Univ.-Verlag.
[CSW08]Clark, T., P. Sammut, and J. Willans, Applied metamodelling: a foundation for languagedriven development. 2008.
[FJS07] Faerber, M., S. Jablonski, and T. Schneider. A Comprehensive Modeling Language forClinical Processes. In ECEH. 2007.
[Gr11] Group, O.M. Meta Object Facility (MOF) Core Specification Version 2.4.1. OMGAvailable Specification 2011 [cited 2013 10-October-2013]; Available from:http://www.omg.org/spec/MOF/2.4.1/.
[HL13] International, H.L.S. Introduction to HL7 Standards. 2013 12-October-2013]; Availablefrom: http://www.hl7.org/implement/standards/index.cfm?ref=nav.
[Ja95] Jablonski, S. Functional and behavioral aspects of process modeling in WorkflowManagement Systems. in Proceedings of the ninth Austrian-informatics conference onWorkflow management: challenges, paradigms and products: challenges, paradigms andproducts. 1995: R. Oldenbourg Verlag GmbH.
[JB96] Jablonski, S. and C. Bussler, Workflow management: modeling concepts, architectureand implementation. 1996.
[Le02] Lenzerini, M. Data integration: A theoretical perspective. in Proceedings of the twenty-first ACM SIGMOD-SIGACT-SIGART symposium on Principles of database systems.2002: ACM.
[Ma07] Madin, J., et al., An ontology for describing and synthesizing ecological observationdata. Ecological informatics, 2007. 2(3): p. 279-296.
[Mo98] Moody, D.L., Metrics for evaluating the quality of entity relationship models, inConceptual Modeling–ER’98. 1998, Springer. p. 211-225.
[Mo05] Moody, D.L., Theoretical and practical issues in evaluating the quality of conceptualmodels: current state and future directions. Data & Knowledge Engineering, 2005.55(3): p. 243-276.
[MS94] Moody, D.L. and G.G. Shanks, What Makes a Good Data Model? Evaluating theQuality of Entity Relationship Models, in Proceedings of the13th InternationalConference on the Entity-Relationship Approach. 1994, Springer-Verlag. p. 94-111.
[Sc13] Schneider, T., Domänenspezifische Evaluation und Optimierung von Datenstandardsund Infrastrukturen. 2013, Dissertation, University of Bayreuth.
[SPG05] Simmhan, Y.L., B. Plale, and D. Gannon, A survey of data provenance techniques.Computer Science Department, Indiana University, Bloomington IN, 2005. 47405.
[TD09] TDWG. TDWG Standards. 2009 12-October-2013]; Available from:http://www.tdwg.org/standards/.
[THR12] Triebel, D., G. Hagedorn, and G. Rambold, An appraisal of megascience platforms forbiodiversity information. MycoKeys, 2012. 5: p. 45-63.
[Vo11] Volz, B.W., Werkzeugunterstützung für methodenneutrale Metamodellierung. 2011,Dissertation, University of Bayreuth.
168

Gebrauchssprachliche Modellierung als Grundlage füragiles Geschäftsprozessmanagement
Marco Mevius1, Erich Ortner2, Peter Wiedmann3
HTWG Konstanz1 / TECHNUM2 /Axon Active AG Schweiz3
Brauneggerstr. 551/ Lindauer Str. 692/Landsbergerstr. 3943
784621/42 Konstanz / 812413 Mü[email protected]
Abstract: Zur Ausführung von Handlungen im Rahmen von kollaborativenProzessen mit menschlichen Akteuren ist eine effektive und effizienteKommunikation notwendige Voraussetzung. Existierende Methoden undModellierungssprachen entsprechen dieser Anforderung nur unzureichend. DieFolge ist, dass die modellierten Prozesse häufig nicht den gewünschten Prozessender Prozessbeteiligten entsprechen. Eine gebrauchssprachliche Modellierung bietetdie Grundlage zur signifikanten Verbesserung der Kommunikation, Interaktionsowie des gegenseitigen Verständnisses der Prozessbeteiligten. BPM(N)Easy1.2
repräsentiert eine innovative Methode auf Basis einer gebrauchssprachlichenModellierung von Prozessen mit dem Ziel einer durchgängigen Unterstützung desProzessmanagements und wird im Rahmen des Papiers motiviert und präsentiert.
1 Einleitung
Existierende Methoden und Modellierungssprachen zum Prozessmanagementadressieren den effizienten und effektiveren Umgang mit bestehenden und neuenProzessen. Beispielsweise wird die Erreichung von ex ante definiertenUnternehmenszielen und korrespondierenden Kennzahlen unterstützt. Aus Sicht derNatur- und Sozialwissenschaften bezeichnen Prozesse gerichtete Abläufe vonGeschehendem [Mi95]. [Ob96] definiert Prozesse als eine Menge von manuellen,teilautomatisierten oder automatisierten Aktivitäten. Diese Aktivitäten (z.B.Handlungen) werden durch Ressourcen (auch Akteure genannt) ausgeführt. KomplexeWechselbeziehungen von Aktivitäten stellen spezifische Anforderungen an dieGestaltung von Prozessen. Beispielsweise setzen organisationsübergreifende Prozesseeinen hohen Grad von Flexibilität voraus, da Anwender und IT-Experten unmittelbarüber Unternehmensgrenzen hinweg effizient kollaborieren müssen [ABH09]. Auch diezunehmende Virtualisierung und der steigende Anteil von mobilen Komponenteninnerhalb von IT-Infrastrukturen erfordert Transparenz und ein gemeinsamesVerständnis, um die Vorteile neuer Technologien und Paradigmen wie beispielsweiseCloud Computing [MG11] erfolgreich nutzen zu können. Zu berücksichtigen ist, dassinnerhalb der Phasen des traditionellen Prozessmanagements, der Modellierung,Implementierung, Ausführung und Optimierung der Prozesse (vgl. [We10]), kein
169

Ungleichgewicht entstehen darf. [Br73] beschreibt das Problem des sogenanntenModellmonopols. Modellieren Anwender initial ein für sie aussagekräftiges Modell,entstehen häufig Asymmetrien im Rahmen von Abstimmungsprozessen mit den für dietechnische Umsetzung verantwortlichen IT-Experten. Auch die Auswahl einer adäquatenModellierungssprache ist von zentraler Bedeutung für ein erfolgreichesProzessmanagementprojekt. In [Aa13] wird die Modellierungssprache als wesentlicherBestandteil des Prozessmanagements beschrieben, wobei zwischen formalen,konzeptuellen und ausführbaren Modellierungssprachen unterschieden wird. Wird dieausgewählte Modellierungssprache nicht von allen Prozessbeteiligten korrektinterpretiert, können erhebliche Missverständnisse und daraus folgende Fehler auftreten.Zur Lösung der hier skizzierten Problemstellungen stehen die Kommunikation,Interaktion und das Verständnis aller Beteiligten im Fokus der gebrauchssprachlichenModellierung von Prozessen. Die Gebrauchssprache (vgl. [He06]) wird über das gesamteProzessmanagement als Kommunikationsmittel unter den Beteiligten genutzt und dieProzessmodelle gemeinsam iterativ und inkrementell erstellt und verfeinert.
Der Beitrag präsentiert aus Sicht der sprachbasierten Informatik den Begriff dergebrauchssprachlichen Modellierung. Die Kommunikation, Interaktion und dasVerständnis zwischen Anwendern und IT-Experten wird hinsichtlich der Konstellationzwischen Orthosprache, Gebrauchssprache, Modellierungssprache undProgrammiersprache beschrieben. Der Name BPM(N)Easy1.2 setzt sich aus BPM(Business Process Management) und der Business Process Modeling and Notationzusammen und bezeichnet eine innovative Methode, die hochqualitative Prozesseanstrebt und eine Vorgehensweise, eine einfache Modellierungssprache und dengezielten Einsatz von Werkzeugen spezifiziert. BPM(N)Easy1.2 repräsentiert eineWeiterentwicklung von BPM(N)Easy [Me12][Me13]. Der Einstieg in dasProzessmanagement mit BPM(N)Easy1.2 ist variabel, wobei die Synchronisation undInteraktion aller Prozessbeteiligten hohe Priorität besitzt.Der Beitrag ist folgendermaßen gegliedert. In Abschnitt 2 werden zunächst verwandteArbeiten vorgestellt. Darauf aufbauend wird in Abschnitt 3 der Begriff dergebrauchssprachlichen Modellierung erläutert. Abschnitt 4 skizziert die Anwendung undErgebnisse der Methode BPM(N)Easy1.2. Der Beitrag schließt mit einer kurzenZusammenfassung und einem Ausblick auf eine weiterführende Forschungsarbeit.
2 Einordnung und Literaturreview
Die unmittelbare Verknüpfung der (menschlichen) Sprache mit digitalen Anwendungenist grundsätzliches Ziel der sprachbasierten Informatik [He06]. Der Einsatz vonrationalen Sprachen unterstützt diese Verknüpfung mit Hilfe von Grammatik undSemantik, sodass die natürliche (menschliche) Sprache für die digitale Verarbeitung undEntwicklung eingesetzt werden kann [He06]. Rational bezeichnet eine aus der Praxisrekonstruierte Sprache (vgl. [He06]). Die adäquate Unterstützung menschlicher Akteure(humaner Ressourcen) bei der Ausführung von Handlungen durch passgenaueAnwendungen ist das Ergebnis davon. Soll ein Anwendungssystem (z.B. eine komplexeUnternehmenssoftware) eingeführt oder individuell entwickelt werden, müssen dieAnforderungen der zukünftigen Anwender gesammelt und aus fachlicher Sicht
170

möglichst vollständig beschreiben werden [OS96]. Ziel sollte dabei das Erlangen eineswechselseitigen Verständnisses von Anwendern und IT-Experten sein.
Unter einem Anwendungssystem wird nach Ortner folgender Aufbau verstanden:
Abbildung 1: Anwendungssystem in Anlehnung an Ortner [Or12].
In Abbildung 1 finden sich sowohl reale, als auch mentale/digitale Bestandteile wieder.Träger umfassen Gegenstände z.B. Kraftfahrzeuge, welche mit Hardware verbundensind. Diese Hardware ist z.B.: ein Navigationssystem, welches sich in einemKraftfahrzeug [Fi13] befindet. Die weiteren realen Bestandteile, Menschen undHandlungen, bilden die obersten zwei Schichten. Handlungen beschreiben dabei diereale Nutzung des entwickelten Anwendungssystems durch den Menschen. Diementalen/digitalen Bestandteile, Daten und Programme beschreiben Produkte, die digitalzu Verfügung stehen z.B.: Datenbanken oder Betriebssysteme. Als mentaler Bestandteilbildet das Wissen die Grundlage, um eine Aktivität korrekt lösen zu können z.B. umfasstes die Regeln einer doppelten Buchhaltung [Fi13]. Im Kontext dieses Beitrags ist dieVerknüpfung zwischen Prozessen und Menschen (erste und zweite Ebene von oben, vgl.Abb.1) von besonderer Relevanz, wobei die Modellierung von Prozessaktivitäteninsbesondere fokussiert wird.
Es existieren eine Reihe von verschiedenen Ansätzen zum Prozessmanagement. [We10]stellt beispielsweise ein hierarchisches Ebenenmodell vor, dass das Prozessmanagementvon der Geschäftsstrategie bis zu den implementierten Prozessen beschreibt. [AHW03]sieht im Prozessmanagement die Erweiterung des traditionellen Workflowmanagement(vgl. [Ob96]) um die Phase der Analyse. Einen agilen Ansatz zum Prozessmanagementführt Meziani ein. Die AGILIPO Methode „AGILe busIness PrOcess“ [MS11]beschreibt einen Bottom-Up Ansatz, welcher die Integration der Software-Systeme mitdem gesamten organisatorischen Wissen anstrebt. Für die Automatisierung vonProzessen werden die Prinzipien der agilen Software-Entwicklung zugrunde gelegt.Zudem wird bei AGILIPO eine kooperative Modellierung und Implementierungangestrebt und der Einsatz von sozialen Plattformen vorgeschlagen. Die Vorgehensweiseermöglicht die inkrementelle Modellierung und spontane Änderung von Prozessen zurLaufzeit. In [Sc10] wird eine Methode dargestellt, die vorschlägt Aktivitäten nichtkonkret an Services zu binden, sondern an Anforderungen, um so die agile Modellierungvon Prozessen signifikant zu vereinfachen. In [Fl10] wird die Methode des
171

Subjektorientiertes Business Process Managements (S-BPM) vorgestellt. Dabei steht dasSubjekt, also die einzelne humane Ressource, im Vordergrund des Prozessmanagements.Die S-BPM eigene Modellierungssprache fokussiert auf eine natürlichsprachlicheErfassung von Prozessen.
Ein signifikantes Defizit aller dargestellten Methoden ist die fehlende intuitiveZugänglichkeit für Anwender und IT-Experten und die damit ungenügende betrieblicheAnwendbarkeit und Durchgängigkeit im Rahmen von Prozessmanagementprojekten(vgl. dazu die Studien [Ko10] und [Be12]). Zum Management von Prozessen und derenAnwendungssystemen wird daher eine Methode benötigt, welche die Idee derdurchgängigen Unterstützung der Anwender berücksichtigt. Nach Ortner sollen „ganze“Anwendungssysteme die Anwender über die eigentliche IT hinaus unterstützen. [Fi13]beschreibt dies als ein ganzheitliches Unternehmensmodell.
Abbildung 2: Bestandteile einer Methode [Or12].
Die Abbildung 2 beschreibt die grundsätzlichen Bestandteile einer Methode. EineMethode besteht aus einer Vorgehensweise, Sprache und einem Werkzeug [Or12]. Dieim Rahmen dieses Beitrags dargestellte Grundlage der gebrauchssprachlichenModellierung und die exemplarisch eingeführte Methode BPM(N)Easy1.2 folgen demnormativ konstruktiven Ansatz und sind aus realen Problemstellungen der betrieblichenAnwendung heraus motiviert. Ein problemorientiertes Vorgehen im Rahmen derkonstruktiven Wissenschaftstheorie [Lo87] ist Grundlage für die Entwicklung vonBPM(N)Easy1.2 gewesen.
172

3 Gebrauchssprachliche Modellierung
Die Beziehungen zwischen Gebrauchssprachen, Modellierungssprachen undProgrammiersprachen werden durch eine Mensch-Orientierung und Mittel-Orientierunghergestellt. Zur Erläuterung des Begriffs der Gebrauchssprache dient Abbildung 3.
Abbildung 3: Einordnung der Gebrauchssprache.
Der in [Sc97] beschriebene Fachentwurf setzt drei Sprachen voraus, welche in derAbbildung die untere Ebene bilden. Diese Sprachtypen stehen in einerWechselbeziehung (repräsentiert durch gerichtete Kanten in Abbildung 3) und müssenmiteinander „in Einklang“ gebracht werden, um die Entwicklung einesqualitätsgesicherten Anwendungssystems auf Basis einer erfolgreichen Kommunikationzu gewährleisten. Die dazu übergeordnete Ebene – der Rekonstruktionsprozess –beschreibt die Phase in der alle Begriffe der Sprachen ermittelt, präzisiert und stabilisiertwerden [Sc97]. Die oberste Ebene und zentrale Instanz bildet die Orthosprache (vgl.[Lo74]). Diese beschreibt eine gemeinsame Sprache und dient als „Sprach-Repository“aller Anwendungen, wobei die Prozessbeteiligten diese Sprache nicht vollständigbeherrschen müssen.
In Anlehnung an [Sc97] können drei Sprachtypen wie folgt unterschieden werden:
1. Die Fachsprache des Anwenders (Gebrauchssprache) als problemorientiertes Mittel,seine Wünsche an ein zu entwickelndes Anwendungssystem dem Entwickler gegenüberzu kommunizieren.2. Die Fachsprache des BPM-Experten (Diagrammsprachen wie z.B. Business ProcessModel and Notation (BPMN) [OM11]) als lösungsorientiertes sprachliches Mittel, dieWünsche des Anwenders gegenüber den IT-Experten durch Modelle verständlich zumachen.3. Die Fachsprache des IT-Experten (Programmiersprachen wie z.B. Java), um damit dieImplementierung zu realisieren.
173

Dieser Beitrag fokussiert insbesondere auf die Menschorientierung und den Einsatz vonGebrauchssprachen. Nach [Bu11] hängt die Qualität der (grafischen) Darstellung einesModells von der Modellierungserfahrung der Modellierenden ab. ImProzessmanagement werden Prozessmodelle überwiegend arbeitsteilig erstellt. DieUnterschiede der Sprachkompetenz der Prozessbeteiligten führen zur Erhöhung derFehleranfälligkeit, insbesondere durch Missverständnisse oder Akzeptanzprobleme.Dieser Problematik entgegenwirkend muss die Verbindung zwischen Medial –undRealwelt vereinfacht werden.
Abbildung 4: Mental-realweltliche Verbindung in Anlehnung an [Or12].
Die auf Ebene der Sprachhandlungen veranlassten Handlungen werden im realweltlichenTeil ausgeführt und durch die medialweltliche Ebene überwacht (vgl. Abbildung 4).Dieser Vorgang des „Steuerns und Befolgens“ findet immer in einer bestimmtenUmgebung (vgl. Abbildung 4) statt, in welcher unterschiedliche Voraussetzungengegeben sein können. Die freie Entscheidbarkeit aller Prozessbeteiligten im Dialog unddem damit verbundenen Input (vgl. Pfeilrichtung in Abbildung 4) ist zusätzlich zubeachten [Or12]. In Hinblick auf das Prozessmanagement wird die Verbindung der zweiEbenen (mediale und reale Ebene) durch den Einsatz der Gebrauchssprachlichkeitsignifikant verbessert, da ein erhöhtes Verständnis des Modelles und dessen Ausprägung(Instanziierung) erreicht werden kann. [Wo12] beschreibt zusätzlich zu Modell undAusprägung, Situationen „in denen unklare, mangelhafte, fehlende Orientierung dasHandeln blockiert“. Diese Orientierungslosigkeit kann durch verbessertegebrauchssprachliche Kommunikation häufig behoben werden. Ein der Modellierungzugrundeliegende Begriffsmodell [Or12] dient als Grundlage der gebrauchssprachlichenModellierung.
174
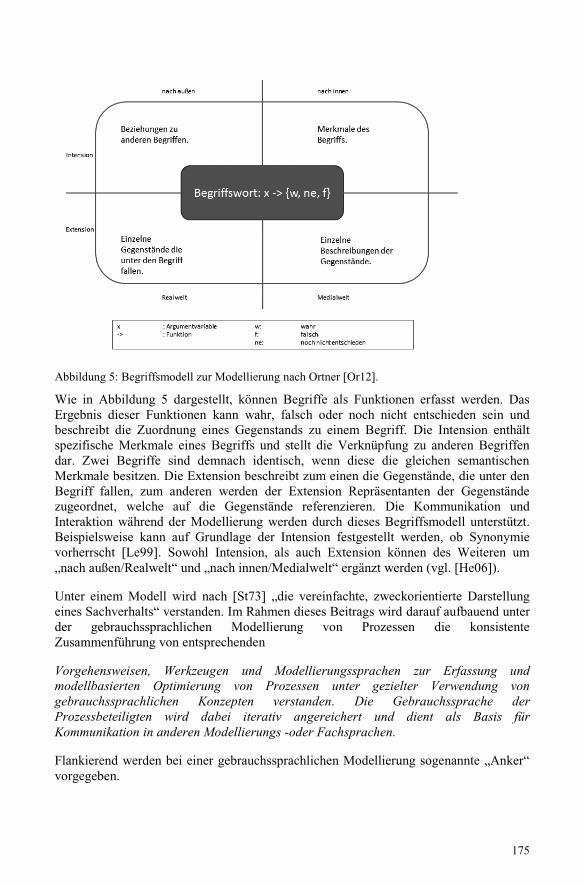
Abbildung 5: Begriffsmodell zur Modellierung nach Ortner [Or12].
Wie in Abbildung 5 dargestellt, können Begriffe als Funktionen erfasst werden. DasErgebnis dieser Funktionen kann wahr, falsch oder noch nicht entschieden sein undbeschreibt die Zuordnung eines Gegenstands zu einem Begriff. Die Intension enthältspezifische Merkmale eines Begriffs und stellt die Verknüpfung zu anderen Begriffendar. Zwei Begriffe sind demnach identisch, wenn diese die gleichen semantischenMerkmale besitzen. Die Extension beschreibt zum einen die Gegenstände, die unter denBegriff fallen, zum anderen werden der Extension Repräsentanten der Gegenständezugeordnet, welche auf die Gegenstände referenzieren. Die Kommunikation undInteraktion während der Modellierung werden durch dieses Begriffsmodell unterstützt.Beispielsweise kann auf Grundlage der Intension festgestellt werden, ob Synonymievorherrscht [Le99]. Sowohl Intension, als auch Extension können des Weiteren um„nach außen/Realwelt“ und „nach innen/Medialwelt“ ergänzt werden (vgl. [He06]).
Unter einem Modell wird nach [St73] „die vereinfachte, zweckorientierte Darstellungeines Sachverhalts“ verstanden. Im Rahmen dieses Beitrags wird darauf aufbauend unterder gebrauchssprachlichen Modellierung von Prozessen die konsistenteZusammenführung von entsprechenden
Vorgehensweisen, Werkzeugen und Modellierungssprachen zur Erfassung undmodellbasierten Optimierung von Prozessen unter gezielter Verwendung vongebrauchssprachlichen Konzepten verstanden. Die Gebrauchssprache derProzessbeteiligten wird dabei iterativ angereichert und dient als Basis fürKommunikation in anderen Modellierungs -oder Fachsprachen.
Flankierend werden bei einer gebrauchssprachlichen Modellierung sogenannte „Anker“vorgegeben.
175

Abbildung 6: Anker auf Basis der Gebrauchssprachlichkeit.
Die in Abbildung 6 spezifizierten Anker beschreiben die primären Ziele dergebrauchssprachlichen Modellierung. Prozesse sind grundsätzlich unterBerücksichtigung hoher Qualitätsanforderungen zu erfassen, auszuführen und zuoptimieren. Die Synchronisation und Interaktion aller Prozessbeteiligten besitzt einehohe Priorität, um das frühzeitige Verständnis und Erkennen von Fehlern gewährleistenzu können.
4 Gebrauchssprachlichkeit in der Anwendung – Agiles BPM mitBPM(N)Easy1.2
Die Kommunikation und das Verständnis der Prozessbeteiligten über Erfassung,Implementierung, Ausführung und Optimierung von Prozessen stehen im Fokus derMethode BPM(N)Easy1.2. Folgende Grundlagen und Verknüpfungen zu dergebrauchssprachlichen Modellierung liegen der Methode zugrunde:
Gebrauchssprachen, Modellierungssprachen und Programmiersprachen:Die gemeinsame Gebrauchssprache wird über das gesamte Prozessmanagementals Kommunikationsmittel unter den Prozessbeteiligten genutzt. Müssen, zumBeispiel zur Implementierung eines zu automatisierenden Prozesses,gebrauchssprachlich formulierte Inhalte in eine Programmiersprache überführtwerden, geschieht dies über ein agiles Vorgehen und der damit fokussiertengebrauchssprachlichen Interaktion und Synchronisation.
Medial –und Realwelt:Durch die iterative und inkrementelle Vorgehensweise im Rahmen vonBPM(N)Easy1.2. wird die mentale/digitale Steuerungsebene enger an die Ebenedes Befolgens gebunden. Mensch-seitige Fehlinterpretationen können schnellererkannt und behoben werden.
176

Begriffe und AnkerDer Umgang mit Begriffsdefekten wie Synonymen, Homonymen,Äquipollenzen, Vagheiten und falschen Bezeichnern, wird durch diegebrauchssprachliche Modellierung intuitiv unterstützt. Eine Überführung inandere Modellierungs – oder Fachsprachen ist aufgrund des iterativ steigendenProzessverständnisses aller Prozessbeteiligten erheblich vereinfacht. Dievorgegebenen Anker beschreiben dabei die Perspektiven der Betrachtung.Beispielsweise schafft der Anker „Synchronisation“ die organisatorische Basisfür eine strukturierte und angemessene Abstimmung aller Prozessbeteiligten.
Die Abbildung 7 veranschaulicht die Vorgehensweise von BPM(N)Easy1.2 [MW13]:
Abbildung 7: Darstellung der Vorgehensweise von BPM(N)Easy1.2
BPM(N)Easy1.2 besteht aus zwei miteinander verbundenen Zyklen. Der erste Zyklus führtModellierung und Implementierung zusammen. Der zweite Zyklus wird zur Analyse undOptimierung der Prozesse kontinuierlich durchlaufen. Das fortlaufende Durchführendieses Zyklus sorgt für die durchgehende Dokumentation von Anforderungen undgemeinsamen Verbesserungsideen. Der Ablauf der Zyklen kann folgendermaßenbeschrieben werden:
1. Sobald ein gebrauchssprachliches BPMNEasy1.2 Modell erfasst wurde und/oderim gebrauchssprachlichen Kurzgeschichten-Katalog Anforderungen für dieModellierung eines Prozesses oder einer Änderung an einem Prozess vorhandensind, kann der Zyklus gestartet werden.
2. Die bei einer Paarmodellierung zugewiesenen Anwender widmen sich währendder technischen Implementierung der Prozesse anderen Tätigkeiten (z.B.Kennzahlendefinitionen oder Training).
3. Bei jeder Synchronisation in Bezug auf die Qualität wird geprüft, ob alleselektierten Anforderungen mittels der anwendbaren oder ausführbarenProzessmodelle und/oder der lauffähigen implementierten Prozessapplikationenrealisiert worden sind (z.B. durch Live-Demonstrationen oderProbedurchläufe).
177
Synchronisation
Die Durchführung der Synchronisation zwischen Anwendern und IT-Experten in kurzen,vorabdefinierten Zeitintervallen (Time-Boxes) ist von zentraler Bedeutung. Der inAbbildung 7 dargestellten Aktivitäten „BPMNEasy1.2-Modelle“, „Kurzgeschichten“ und„BPMN 2.0 Modelle“ ist eine Synchronisation vorangestellt. Diese Synchronisationführt zu einer fortwährend engen Zusammenarbeit aller Prozessbeteiligten, wobei diejeweiligen aktuellen Prozesse (z.B. bereits implementierte ausführbare Prozesse) mit denZielprozessen verglichen werden können. Falls Anforderungen während dieses Zyklusgeändert oder nicht vollständig umgesetzt worden sind, werden diese in einem weiterenZyklus wieder aufgenommen. Zusätzlich wird innerhalb der Synchronisation geprüft, obdie Rekonstruktion der Aussagen aller Prozessbeteiligter, im Sinne des Begriffsmodellszur Modellierung, erfolgreich war. Die Anzahl der zu durchlaufenen Iterationszyklen,wird ex ante nicht fest vorgeschrieben und ergibt sich als projektspezifischer Parameter.
Interaktion
Im Rahmen von Planungstreffen werden Teams für die Paarmodellierung definiert. DasPlanungstreffen ist Teil der Synchronisation und wird vor den in Abbildung 7dargestellten Aktivitäten „BPMNEasy1.2-Modelle“, „Kurzgeschichten“ und „BPMN 2.0Modelle“ durchgeführt. Hierbei wird die Expertise geteilt, sodass in jedem TeamAnwender und IT- Experten interagieren. Die Teams wählen die zu bearbeitendenModelle und gebrauchssprachlichen Kurzgeschichten im Pull-Prinzip aus. Im Falle derAnreicherung eines bestehenden BPMNEasy1.2 Modells werden die Kurzgeschichtenausgewählt, die im nächsten zu durchlaufenden Zyklus realisiert werden sollen. DieKurzgeschichten werden möglichst aus einem Themengebiet selektiert, sodass sichinnerhalb der Zyklen die Beteiligten mit einer einheitlichen Aufgabenstellungbeschäftigen. Im Planungstreffen werden bereits Aufwandsschätzungen abgegeben. Ausder Umsetzung des Pull-Prinzips, im Rahmen von selbstorganisierten Teams resultierteine Aufgabenlimitierung und Kompetenzzuteilung, da alle Prozessbeteiligten die für siepassenden Kurzgeschichten selbständig selektieren. Auf diese Weise wird dieMotivation der Teammitglieder signifikant erhöht. Zudem wird durch die Team-organisation die agile Beantwortung von Verständnisfragen ermöglicht, da eine engeVerbindung der Beteiligten entsteht. Sowohl die Anwender als auch die IT-Expertenwerden durch diese Vorgehensweise über den vollständigen Ablauf der Prozesserfassung–und implementierung eingebunden und vernetzt. Mögliche Trainingseinheiten währendeiner Iteration stabilisieren diese Vernetzung.
Qualität
BPM(N)Easy1.2 spezifiziert drei sogenannte „Quality Gates“. Quality Gates (vgl. [Sa08])definieren im Gegensatz zu klassischen Qualitätsanalysen, wie beispielsweiseAnwendertests kurz vor Produktivsetzung, frühzeitig definierte Zeitpunkte zurQualitätssicherung auf Basis definierter Qualitätsmodelle. Diese Qualitätsmodellewerden durch standardisierte Kommunikation in Form von gebrauchssprachlichenFragen angewendet (vgl. [GMW14]). Unkoordinierte Qualitätsprüfungen oderunzureichende Kommunikation der Beteiligten werden signifikant reduziert. Die
178

Abbildung 7 zeigt diese Quality Gates als „Stern-Symbole“. Im Rahmen des Prozess-Monitorings werden Prozesse kontinuierlich auf Basis von definierten Kennzahlenanalysiert. Die identifizierten Optimierungspotentiale werden durch Anpassung derBPMNEasy1.2 Modelle oder durch Ergänzung des gebrauchssprachlichenKurzgeschichtenkatalogs initialisiert (vgl. Abbildung 7). Eine notwendige Bedingung ist,dass nach jedem Iterationszyklus ein anwendbarer Prozess realisiert ist. Am Ende vonIteration n der BPM(N)Easy1.2 Vorgehensweise steht ein Anwendungssystem zurVerfügung, welches die definierten Anforderungen möglichst vollständig abdeckt.
Rollenkonzept
Die beschriebene Vorgehensweise wird bei BPM(N)Easy1.2 von festgelegten Rollendurchlaufen. Die Rollen verfeinern die zwei Gruppen von Anwendern und IT-Experten(vgl. Tabelle 1).
Tabelle 1: Beschreibung des BPM(N)Easy1.2 Rollenkonzepts.
Das Rollenkonzept gewährleistet eine strukturierte Abarbeitung der ausgewähltenProzessmodelle und gebrauchssprachlichen Kurzgeschichten, wobei einProzessbeteiligter auch mehrere Rollen annehmen kann.
Die Sprache BPMNEasy1.2
Das Elementset von BPMNEasy1.2 verfügt über eine, im Vergleich zu anderen grafischenModellierungssprachen, kompakte Anzahl und ist intuitiv sowohl von Anwendern alsauch von IT Experten zu beherrschen, ohne dass, wie in [DRS12] beschrieben,aufwendige Modellierungssprachen betreffende Akzeptanztests mit denProzessbeteiligten durchgeführt werden müssen. Das Elementset wurde unmittelbar ausden Bedürfnissen von Anwendern in unterschiedlichen betrieblichen Projekten herausabgeleitet und validiert. Den an der Prozessmodellierung beteiligten Personen wird dasVerständnis durch die Gebrauchssprachlichkeit signifikant erleichtert, indemBPMNEasy1.2 lediglich Elemente zulässt, welche in einer Alltagssprache allgemeinbekannt sind und intuitiv symbolisiert werden können (vgl. [MW13]). BPMN liegt nichtoffiziell als vollformalisierte Sprache vor [Is12]. Die Darstellung von BPMNEasy1.2 wirddaher ebenso auf eine präzise Beschreibung beschränkt.
179
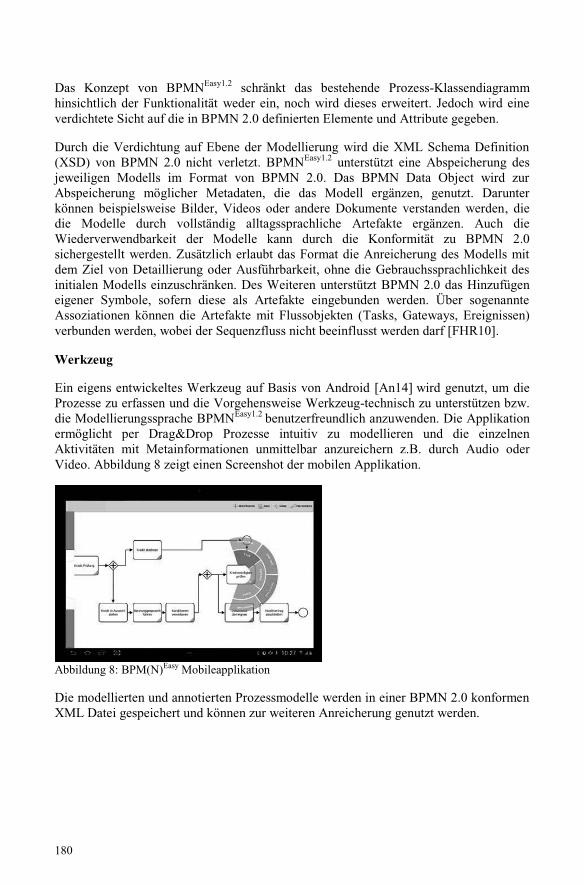
Das Konzept von BPMNEasy1.2 schränkt das bestehende Prozess-Klassendiagrammhinsichtlich der Funktionalität weder ein, noch wird dieses erweitert. Jedoch wird eineverdichtete Sicht auf die in BPMN 2.0 definierten Elemente und Attribute gegeben.
Durch die Verdichtung auf Ebene der Modellierung wird die XML Schema Definition(XSD) von BPMN 2.0 nicht verletzt. BPMNEasy1.2 unterstützt eine Abspeicherung desjeweiligen Modells im Format von BPMN 2.0. Das BPMN Data Object wird zurAbspeicherung möglicher Metadaten, die das Modell ergänzen, genutzt. Darunterkönnen beispielsweise Bilder, Videos oder andere Dokumente verstanden werden, diedie Modelle durch vollständig alltagssprachliche Artefakte ergänzen. Auch dieWiederverwendbarkeit der Modelle kann durch die Konformität zu BPMN 2.0sichergestellt werden. Zusätzlich erlaubt das Format die Anreicherung des Modells mitdem Ziel von Detaillierung oder Ausführbarkeit, ohne die Gebrauchssprachlichkeit desinitialen Modells einzuschränken. Des Weiteren unterstützt BPMN 2.0 das Hinzufügeneigener Symbole, sofern diese als Artefakte eingebunden werden. Über sogenannteAssoziationen können die Artefakte mit Flussobjekten (Tasks, Gateways, Ereignissen)verbunden werden, wobei der Sequenzfluss nicht beeinflusst werden darf [FHR10].
Werkzeug
Ein eigens entwickeltes Werkzeug auf Basis von Android [An14] wird genutzt, um dieProzesse zu erfassen und die Vorgehensweise Werkzeug-technisch zu unterstützen bzw.die Modellierungssprache BPMNEasy1.2 benutzerfreundlich anzuwenden. Die Applikationermöglicht per Drag&Drop Prozesse intuitiv zu modellieren und die einzelnenAktivitäten mit Metainformationen unmittelbar anzureichern z.B. durch Audio oderVideo. Abbildung 8 zeigt einen Screenshot der mobilen Applikation.
Abbildung 8: BPM(N)Easy Mobileapplikation
Die modellierten und annotierten Prozessmodelle werden in einer BPMN 2.0 konformenXML Datei gespeichert und können zur weiteren Anreicherung genutzt werden.
180

Betriebliche Anwendung
BPM(N)Easy1.2 wurde im Rahmen von Anwendungsprojekten verschiedenerUnternehmen (Anwender und IT Dienstleister) im Rahmen eines Labors am KonstanzerInstitut für Prozesssteuerung1 evaluiert. Folgende Ergebnisse können u.a. festgehaltenwerden.
Iterationen
BPM(N)Easy1.2 schreibt keinen festen Zeitraum für das Durchlaufen einer Iteration vor. Inder betrieblichen Anwendung etablierte sich ein zwei Wochen Rhythmus. Der erste Tageiner Iteration wurde dabei zur Synchronisation genutzt, also zur Abnahme dervorausgegangenen Iteration (falls vorhanden) und zur Erarbeitung und Diskussion derweiteren BPMNEasy1.2 Modelle und gebrauchssprachlichen Kurzgeschichten. Diereduzierte Darstellung einer Kurzgeschichte in zwei gebrauchssprachlichen Sätzenunterstützte eine für die beteiligten Rollen adäquate Formulierung der Anforderungen.Eine erhebliche Effizienzsteigerung (bis zu 60%) bei der Modellierung der Prozessekonnte festgestellt werden. Außerdem hat sich der vorgeschlagene Ansatz einerPaarmodellierung als festes Bindeglied zwischen Anwendern und IT Experten als sehrpraktikabel erwiesen. Es konnte ebenfalls festgestellt werden, dass der BPM(N)Easy-Masterim Rahmen von zweiwöchigen Teammeetings bei der Auswahl der Kurzgeschichtenberaten soll.
BPMNEasy1.2 schließt die Lücke zwischen den Gebrauchssprachen und anderensemantischen Modellierungssprachen. In den Projekten konnte sofort ab der erstenIteration des Erfassungszyklus, eine präzise gemeinsame Verständnisgrundlage durchgebrauchssprachliche BPMNEasy1.2 –Modelle geschaffen werden, die anschließend beiBedarf komplexere BPMN 2.0 Modelle überführt wurden. Hierfür konnten dievollständig alltagssprachliche Metadaten in die Repräsentanzen des BPMN 2.0Standards übertragen werden, ohne den Anwender damit zu „belasten“.
Anreicherung der Prozessmodelle
Die im ersten Schritt erstellten BPMNEasy1.2 Modelle förderten bei den Prozessbeteiligtendas Verständnis der realen Prozesse. Durch die Möglichkeit an einzelne Aktivitätenvollständig alltagssprachliche Metadaten oder Kurzgeschichten in Gebrauchssprache„anzuheften“, konnte eine schnelle und für alle Prozessbeteiligten hochwertigeSpezifikation der Zielprozesse entwickelt werden. Abbildung 9 zeigt diese Erweiterungexemplarisch für einen Ausschnitt eines Innovationsprozess. Der Ausschnitt beinhaltetdas Startevent des Prozesses und zwei Aktivitäten (Tasks), welche gekoppelt mitZwischenereignissen, einer Verzweigung (Gateway) und weiteren Metadaten dieHandlungen der einzelnen Ressourcen beschreiben. Es wird dabei in manuelle (vgl.Abbildung, grüne Umrandung), teilautomatisierte (vgl. Abbildung, blaue Umrandung)und automatisierte (rote Umrandung) Aktivitäten unterschieden. Beispielsweise wird dieerste Aktivität von demjenigen Prozessbeteiligten ausgeführt, welcher eine Idee imRahmen einer Innovation erfassen möchte. Zur Erfassung nutzt dieser eine Software,
1 http://bpmcloud.in.htwg-konstanz.de/BpmCloud/index.php
181

welche eine Teilautomatisierung ermöglicht. Des Weiteren, zum besseren Verständnisder Beschreibung, wurde an diese Aktivität ein Video hinzufügt, welches ein konkretesBeispiel einer solchen Erfassung zeigt.
Abbildung 9: Auszug aus einem BPMNEasy1.2 „Innovationsprozess“.
Besondere Anmerkungen oder Interviews konnten einfach an einzelne Aktivitäten„angeheftet“ werden. Die „Anheftungen“ werden in der Abbildung 9 symbolisch durcheine „Aktivität-zu-Tabelle“ Verbindung dargestellt.
Ein zentrales Ergebnis der Projekte im Rahmen des Labors ist, dass sich durch denEinsatz einer vollständig auf Gebrauchssprache basierende Vorgehensweise mit imRahmen von Sprints erstellten „fühlbaren“ Prozessapplikationen und derkorrespondierenden Erhebung von Metadaten, ein erheblicher Akzeptanzgewinn beiAnwendern und IT-Experten erreicht werden kann. Die Anwender schätzen die Güte derProjektverlaufe und der konkreten Ergebnisse (z.B. der Prozessmodelle oderAnwendungsmodule) wesentlich höher ein, als in vergleichbaren Projekten unter Einsatzvon traditionellen Methoden.
5 Zusammenfassung und Ausblick
Der Beitrag konkretisiert den Begriff der gebrauchssprachlichen Modellierung vonProzessen. Eine auf der Gebrauchssprache basierenden Modellierung von Prozessen hatdas Ziel die Verständlichkeit der Prozessmodelle und die Kommunikation für alleProzessbeteiligten wesentlich zu erhöhen. Im Vergleich zu rein phasenorientiertenMethoden schlägt die im Beitrag vorgestellte Methode BPM(N)Easy1.2 eineVorgehensweise vor, welche das Gestalten von Prozessen auf Basis von agilen Wertenpräferiert. Die gebrauchssprachliche Modellierungssprache BPMNEasy1.2 dient dabei zurschnellen und einfachen Erfassung von Prozessmodellen. BPMNEasy1.2 beschränktBPMN auf gebrauchssprachliche Modellierungselemente, lässt eine Anreicherung derElemente durch vollständig alltagssprachliche Metadaten (z.B. Audiodatei, Video) zu,erhält zugleich den BPMN Standard und gestaltet somit die werkzeugunterstützteProzessaufnahme intuitiv und die Ergebnisse weiterverwendbar.
182

Die vorgestellte Methode wird zukünftig im Rahmen des initialisierten Projekts „SmartCity Konstanz“ weiter evaluiert. Einen besonderen Schwerpunkt wird dabei dieunmittelbare Integration von nicht IT-affinen Bürgern bei der gebrauchssprachlichenModellierung von Prozessen bilden.
Literaturverzeichnis
[Aa13] van der Aalst, Wil M.P.: Business Process Management: A Comprehensive Survey.Hindawi Publishing Corporation ISRN Software Engineering Volume 2013,http://dx.doi.org/10.1155/2013/507984.
[ABH09] Abelein, U.; Becker, A.; Habryn, F.: Towards a Holistic Framework for Describing andEvaluating Business Benefits of a Service Oriented Architecture.13th IEEE EnterpriseDistributed Object Computing Conference Workshops, Auckland, 2009.
[AHW03]van der Aalst, W. M. P.; ter Hofstede, A. H. M.; Weske, M.: Business ProcessManagement: A Survey, In: van der Aalst, W. M. P; ter Hofstede, A. H. M.; Weske, M.(Hrsg.): Proc. Intl. Conf.on Business Process Management (BPM 2003), Lecture Notesin Computer Science, Vol. 2678, S. 112. Springer Verlag, Berlin, 2003.
[An14] Android operating system. 2014. http://developer.android.com/index.html, abgerufen am15.01.2014.
[Be12] BearingPoint GmbH, Business Process Management-Studie 2012 Stärkung derProzessorientierung im Unternehmen durch nachhaltige Optimierung der Prozess- undIT-Landschaft, 2012.
[Br73] Braten, S.: Model monopoly and communication: Systems theoretical notes ondemocratization. In Acta Sociologica, 16-2, 1973.
[Bu11] Burmester, L.: Adaptive Business-Intelligence-Systeme, DOI 10.1007/978-3-8348-8118-2_3,Vieweg+Teubner Verlag Springer Fachmedien Wiesbaden GmbH, 2011.
[DRS12] Delfmann, P.; Rosemann, M.; Schwegmann, A.: Vorbereitung der Prozessmodellierung,in Becker, J.; Kugeler, M.; Rosemann, M (Hrsg.): Prozessmanagement, 7.Auflage,Springer Gabler Verlag, Berlin Heidelberg, 2012.
[FHR10] Freund, J.; Henninger, T. ;Rücker, B.: Praxishandbuch BPMN. inklusive BPMN 2.0.Hanser, München [u.a.], 2010.
[Fi13] Fischer, M.: Logikbasierte Prozessmodellierung: Ein ereignisorientierter Ansatz zurkontinuierlichen Modellierung und Qualitätssicherung von Geschäftsprozessen. VerlagDr. Kovac, Hamburg, 2013.
[Fl10] Fleischmann, A.: What is S-BPM?. S-BPM ONE – Setting the Stage for Subject-Oriented Business Process Management Communications in Computer and InformationScience Volume 85, 2010, S. 85-106, 2010.
[GMW14]Gebhart, M.; Mevius, M.; Wiedmann, P.: Application of Business Process QualityModels in Agile Business Process Management, In: Proceeding of the Sixth InternationalConference on Information, Process, and Knowledge Management eKNOW 2014,Barcelona 2014, (angenommen).
[He06] Heinemann, E.: Sprachlogische Aspekte rekonstruierten Denkens, Redens und Handelns– Aufbau einer Wissenschaftstheorie der Wirtschaftsinformatik. Gabler Verlag,Wiesbaden, 2006.
[Is12] Istoan, P.: Defining Composition Operators for BPMN. Software Composition LectureNotes in Computer Science Volume 7306, S. 17-34, 2012.
[Ko10] Komus, A.: BPM Best Practice Die wichtigsten Erkenntnisse aus aktuellen PraxisStudien Auf dem Weg zu einem ganzheitlichen BPM 2010,http://www.komus.de/fileadmin/downloads/public/2010-DSAG-BPM.pdf, abgerufen am15.01.2014.
183

[Le99] Lehmann, F.: Fachlicher Entwurf von Workflow-Management-Anwendungen.B.G.Teubner Verlag, Stuttgart, 1999.
[Lo74] Lorenzen, P.: Konstruktive Wissenschaftstheorie, suhrkamp taschenbuch wissenschaft,93, Frankfurt am Main, 1974.
[Lo87] Lorenzen, P.: Lehrbuch der konstruktiven Wissenschaftstheorie. BI-Wissenschaftsverlag,Mannheim,1987.
[MG11] Mell, P.; Grance, T.:The NIST Definition of Cloud Computing. Recommendations of theNational Institute of Standards and Technology,http://csrc.nist.gov/publications/nistpubs/800-145/SP800-145.pdf, 2011.
[Me12] Mevius, M.; et al: BPM(N)Easy - Agiles cloud- und servicebasiertesGeschäftsprozessmanagement. In: Schmietendorf, A. (Hrsg.): Proc. 7. WorkshopBewertungsaspekte Serviceorientierter Architekturen der GI Fachgruppe Software-Messung und -Bewertung ISBN: 978-3-8440-1411-2 - Shaker Verlag GmbH. November2012.
[Me13] Mevius, M.; Stephan, R.; Wiedmann, P.: An Innovative Approach for agile BusinessProcess Management, In: Proceeding of the Fifth International Conference onInformation, Process, and Knowledge Management eKNOW 2013, Nice 2013.
[MW13] Mevius, M.; Wiedmann, P.: BPM(N)Easy1.2 –Gebrauchssprachliche Gestaltung IT-basierter Prozesse. BSOA 2013. 8. Workshop „Bewertungsaspekte service- undcloudbasierter Achitekturen“ der GI Fachgruppe „Software-Messung und -Bewertung“,2013.
[Mi10] Minor, M.: Assistenzsysteme für agile Geschäftsprozesse. Trier : Universität Trier (FBIV, Wirtschaftsinformatik II), 2010.
[Mi95] Mittelstraß, J.: Enzyklopädie Philosophie und Wissenschaftstheorie. Band 3, MetzlerVerlag. Stuttgart, 1995.
[MS11] Meziani, R; Saleh, I.: Towards a Collaborative Business Process ManagementMethodology. International Conference on Multimedia Computing and Systems(ICMCS). 2011.
[Ob96] Oberweis, A.: Modellierung und Ausführung von Workflows mit Petri-Netzen. Teubner-Reihe Wirtschaftsinformatik, B.G. Teubner Verlag, 1996.
[OM11] OMG: Business Process Model and Notation (BPMN). Version 2.0.http://www.omg.org/spec/BPMN/2.0, abgerufen am 15.01.2014.
[Or12] Ortner, E.: Semantisch normierte Anwendungssysteme und die >>eingeschränkteFreiheit<< der IT-Nutzer. In Mittelstraß, J.: Zur Philosophie Paul Lorenzens. mentisVerlag, Münster, 2012.
[OS96] Ortner, E.; Schienmann, B.: Normative language approach a framework forunderstanding. Conceptual Modeling — ER '96, Lecture Notes in Computer ScienceVolume 1157, 1996, pp 261-276.
[Sa08] Salger, F.; et al.: Comprehensive Architecture Evaluation and Management in LargeSoftware-Systems, 4th International Conference on the Quality of SoftwareArchitectures, 2008.
[Sc97] Schienmann, B.: Objektorientierter Fachentwurf: ein terminologiebasierter Ansatz fürdie Konstruktion von Anwendungssystemen. B.G. Teubner Verlag, Stuttgart, 1997.
[Sc10] Schnabel, F. et al.: Empowering Business Users to Model and Execute BusinessProcesses. BPM 2010 International Workshops and Education Track, Hoboken, NJ,USA, September 13-15, 2010, Revised Selected Papers. S. 433-448. 2010.
[St73] Stachowiak, H.: Allgemeine Modelltheorie. Wien. 1973.[We10] Weske, M.: Business Process Management: Concepts, Languages, Architectures,
Springer Verlag, Berlin New York, 2010.[Wo12] Wohlrapp, H.: Für ein neues pragmatisches Denken. In Mittelstraß, J.: Zur Philosophie
Paul Lorenzens. mentis Verlag, Münster, 2012.
184
Analysis of Business Process Model Reuse Literature:Are Research Concepts Empirically Validated?
Michael Fellmann1, Agnes Koschmider2, Andreas Schoknecht2
1 Institute for Information Managementand Corporate Governance
Osnabrück UniversityKatharinenstr. 3, D-49074 Osnabrück
2 Institute AIFBKarlsruhe Institute of Technology (KIT)
Building 05.20D-76128 Karlsruhe
Abstract: Business process modeling is a highly manual task. The effort ofbusiness process modeling might be reduced if process modelers are provided withthe option of reusing existing process model assets instead of creating new modelsfrom scratch. Numerous research efforts thus have been focused on the reuse ofexisting model assets leading to a great variety of methods, models, algorithms andtools. However, up to now, the state of empirical evidence in respect to provenpositive effects using these approaches is largely unclear. We therefore fill this gapby systematically analysing the available publications. Our paper contributes to theunderstanding of business process model reuse and consequently also to theknowledge base regarding process model reuse.
1 Introduction
Business process modeling is often considered to be a time-consuming and error pronetask. Typically, business process modelers capture the process knowledge of domainworkers in a business process model, i.e. process modelers interview domain expertsinvolved in a business process about their tasks and the execution order of those tasks.Thereby, the business process model is usually constructed from scratch through variousinterview techniques [GEW09] without considering existing processes in a repository.The same applies for the redesign of business process models. For the design of to-beprocesses existing knowledge in process models is seldom utilized in practice [KP06].By providing a rich repository of business process models a modeler is no longerrestricted to his or her own thoughts and ideas but can obtain new insights from othermodels. A modeler might be able to incorporate parts or whole process models into herown model in order to find a suitable solution for her problem. For example, when a newprocess model variant is needed she might find a suitable process model in a repository,which she can reuse. Consequently, a repository of process models and efficienttechniques, which allow exploiting the process models, is a suitable solution. It is alsoclaimed that business process model reuse reduces modeling time and errors, increasesmodel quality and flexibility [AC11], [Ho10]. Given the situation that business processmodel reuse is not commonly used, its positive effects and empirical evidence have to bestudied. A large amount of literature related to business process model reuse has been
185
published which points, from a research point of view, to an already solved problem, butit remains to be investigated if the claimed positive effects of business process modelreuse are validated.
Compared to available literature reviews on business process model reuse (e.g.,[FG2012]) the added value of this paper is to question if process model reuse is reallybeneficial (by questioning the empirical validation of these proclaimed positive effects).Particularly, the goals that are pursued by reuse publications and the extent of theirempirical analysis regarding these goals have been analyzed. We also analyzed if thesepublications empirically validate the positive effects of business process model reusesuch as a reduction of modeling time and modeling errors or an increase of modelquality. These investigations should clarify if a gap between the goals of a reusepublication and its empirical validation exists. To come up with answers, the followingquestions are considered:
RQ1: How many papers on business process model reuse provideempirical insights?
RQ2: What goals are pursued in the area of business process modelreuse?
RQ3: Which positive effects are empirically validated in area ofbusiness process model reuse?
To answer RQ1, relevant research papers have been investigated with respect to thecriterion if they provide an empirical analysis of their approach. Regarding RQ2 themotivating goals described in the literature are analyzed and categorized, i.e. what arethe reasons for suggesting a new business process model reuse approach. RQ3 shouldelucidate if positive effects concerning the stated goals are empirically validated.
To provide answers for RQ1-RQ3 the paper is structured as follows: The literaturereview process is summarized in Section 2. The results from the literature analysis aredescribed in Section 3. The paper ends with a summary and an outlook on futureresearch directions.
2 Literature selection
The review presented in this section gives an overview on research works related tobusiness process model reuse and serves as the foundation of our analysis regardingRQ1-3. To classify related literature we define a taxonomy for business process modelreuse (see Figure 1). Fundamentally, research on business process model reuse can beclassified in empirical research (i.e. describing and explaining existing phenomena instudies or theories) and in research where new assets are designed and suggested (i.e. theresults are normative or prescriptive). The latter category can be further refined in thetechnical artifact (architecture, framework or repository) and method. Within the methodcategory we distinguish four sub-categories: (1) abstraction (encompassing works
186

relating to patterns, reference models or meta-models), (2) selection (describingapproaches related to retrieval and similarity of models), (3) specialization (works thatelaborate on the configuration, customization or adaptation of models) and (4)integration (describing the composition of models out of fragments and modules). Toeach of these categories, we assigned keywords reflecting the categories' content (cf. therectangles with dotted border to the right of the categories), which we used during theliterature search process.
Figure 1: Categories of business process model reuse literature.
This taxonomy has been derived from a wide range of concept categorizations (e.g., forsoftware reuse, life-cycle models and model reuse). The Method branch corresponds tothe categorization of software reuse (see [Kr91]).
To validate this categorization we also browsed available literature e.g., review onbusiness process model reuse [FG2012]. The paper of [FG2012] considers the followingfive categories: SOA, Pattern, Ontology/Reasoning, Variants/PL and others. From ourpoint of view, the categories used in [FG2012] limit the number of related papers (in[FG2012] only 52 papers were considered). Keywords of each category have beendefined individually according to assets that are reused. Therefore, the categoriesproposed in [FG2012] are not further considered.
Methodology: To collect and retrieve appropriate literature, we applied WEBSTER andWATSON's approach [WW02]. The scope of the literature review cannot be described asexhaustive. Business process model reuse is also complementary to a wide body ofresearch streams, e.g., version management, compliance management, process variants.Besides, literature generally addressing but not directly focusing on business processmodel reuse (e.g., process model similarity for compliance or variance management orservice-oriented composition) is not further considered.
Three authors received the task to search for literature on process model reuse. Thequery terms were restricted to the categories of our business process model reusetaxonomy and no time restriction was applied. The literature review process consisted ofthe following three steps adopted from WEBSTER and WATSON [WW02].
187

First, research databases such as IO-PORT.NET and ISI WEB OF KNOWLEDGE
(which considers ACM, IEEE, SPRINGER LINK) were browsed and thefollowing query terms were used ("business process", "process model","process modeling", "business process model") AND ("reuse", "model reuse")AND category/category keyword. We also used synonyms for the categorykeywords where applicable (e.g., query and search as synonyms for retrieval).For instance, a valid query was "process modeling" AND "model reuse" AND"pattern".
Second, GOOGLE SCHOLAR was used to widen the search scope. Therebyidentical query terms were used. Results published but not meeting scientificcriteria (e.g. working reports on personal homepages) were excluded fromfurther examination.
Third, a backward search was conducted. Every paper, found during the firsttwo steps, was analyzed with respect to relevance. Only papers explicitlymentioning reuse were further considered. Eventually, 92 out of 143 researchpapers fulfilled the criteria (no duplicate entry, research focus on process modelreuse) and were further considered.
Name Category description Related literature
Abstraction
Research publications classified into this category are related to referencemodeling, meta models or patterns. Thus, this work abstracts from concretemodels and presents findings for more general cases specifically addressingreuse aspects, e.g. [58, 74].
[ 1, 2, 6, 8, 10, 16, 23, 28,34, 43, 48, 57, 59, 60, 70,71, 72, 73, 74, 75, 78, 79,80, 81, 82, 84, 89 ]
Architecture
Research publications classified into this category are understood accordingto [24] as an organization of processes and related elements to enable reuseof processes. In essence, an architecture description contains all elementsthat are necessary to enable and facilitate reuse of processes.
[ 3, 11, 14, 24, 35, 63,66, 74, 76, 78, 87, 92 ]
EmpiricismResearch publications classified into this category cover empirical studiesabout e.g. factors influencing the reuse of process models [33] or theadoption of related concepts in practice.
[ 32, 33 ]
Framework
Research publications classified into this category have two differentmeanings. On the one hand it refers to mechanisms that are needed anduseful to support and enable reuse of process models. On the other hand aframework can be a description of a process model or a part thereof whichallows reusing this process (part) in other process models.
[ 11, 22, 25, 49, 50,51, 55, 61, 70, 86 ]
Integration Research publications classified into this category refer to the reuse of partsof process models, e.g. the reuse of certain process fragments, e.g. [46, 47]. [ 5, 18, 46, 47, 67, 68, 90 ]
RepositoryResearch publications classified into this category refer to specifications ofcomponents that compose a process repository for the storage of processdescriptions, e.g. [62].
[ 17, 19, 20, 26, 27, 29,41, 47, 69, 85, 88 ]
Selection Research publications classified into this category refer to retrieval andsimilarity related methods for the reuse of process models, e.g. [3].
[ 3, 36, 37, 52, 54, 62,83, 85, 91 ]
SpecializationResearch publications classified into this category refer to the adaption orcustomization of process models to reuse an existing model with changesdue to some reasons, e.g. [39, 40].
[ 4, 7, 9, 12, 15, 30, 31,38, 39, 40, 44, 45, 53,56, 64, 65, 77 ]
Table 1: Categorization of business process model reuse literature.
188

Afterwards, the search results were collected and duplicate entries removed. The samethree authors that performed the search read the selected papers and assigned them to acategory individually. If a paper was assigned to several categories, the assignment wasdiscussed until consensus was achieved. The low number of relevant literature can beexplained due to the use of the query term "reuse," which highly limits the result list.Research works are classified in most cases into one category only, except for someworks (e.g., [3] or [70]), which addressed several reuse issues. Papers published by sameauthors in different years (e.g., as a conference or journal paper) were counted once.Four research works – [13, 21, 42, 58] – are not mentioned in Table 1 as they describegeneral methods and procedures of how to apply model reuse. A complete overview ofthe categories and their corresponding literature can be found in Table 1, while a list ofliterature references can be obtained online due to space limitations (seehttp://semreuse.aifb.kit.edu/downloads/Literature_Review_Modellierung2014.pdf).
3 Analysis of the literature
In order to give an answer to the research questions RQ1-3 and hence to assess the stateof empirical research, we have manually analyzed all the literature mentioned in Section2, which is in total 92 papers. The analysis of the papers comprised reading each paperand extracting the required information to answer our research questions. In case of anyroom for interpretation we discussed the issues within the team of three researchers untilconsensus has been reached. In the following, we report on our results.
Quantifying empirical research in process model reuse: Regarding RQ1 „How manypapers on business process model reuse provide empirical insights?“ our result is that 16papers from 92 investigated papers comprise empirical studies. This calculates to anamount of 21 % of the papers containing empirical investigations. It can thus beconcluded that the overall amount of empirical research in the core categories forbusiness process model reuse is quite small.
Goals pursued by researchers in the business process model reuse field: In order toanswer RQ2 “What goals are pursued in the area of process model reuse?” we haveinvestigated the contribution of all 92 research papers carefully. The contribution of apaper, i.e. what is achieved by the research described in the paper, has subsequently beenreformulated as a goal of the paper, using a verb at the beginning. For example, “designtool support for reuse” would be the goal of a paper elaborating on the design of asystem capable of recommending model elements. If the goal has not been on our list,we added the goal and added the numerical value “1” for the amount of papers. If thegoal was already on our list, we added “+1”. Figure 2 summarizes the goals weidentified in all 92 analyzed papers and also the amount of papers supporting therespective goal. As it can easily be seen, most of the research work is centered onimprovements of reuse. The authors of the corresponding papers thereby envisionmethods and models describing the improvement of reuse approaches such as proceduralmodels, frameworks for reuse and other artifacts. The goal pursued second most by theauthors is the improvement of tool support for reuse. That is pursued by even slightlymore papers than the goal of developing dedicated methods for reuse.
189

Figure 2: Goals pursued in the core business process model reuse literature.
In contrast to the first goal Improve reuse which also comprises papers containingmethodological aspects, papers supporting the goal Develop method devise proceduresthat have been designed from the ground up for reuse purposes – i.e. they do not aim atincremental improvements but rather at specialized new methods.
The next goals when reading Figure 2 from left to right are Improve process modelingand Improve reference modeling. Authors supporting these goals strongly anchor theirwork in the existing body of knowledge concerning semi-formal process modeling andreference modeling. The following goals are diverse in nature and resemble to a longtail. Regarding RQ2 it hence can be concluded that most papers pursue goals that are ona rather abstract level describing artifacts such as methods and models, aim at animproved tool support or focus reuse-centered improvements of modeling approaches.Besides this, there is a great spectrum of diverse goals each pursued by one paper.
Goals that are validated in an empirical setting: Regarding RQ3 “Which positiveeffects are empirically validated in area of business process model reuse” we firstanalyzed the papers to detect all contained empirical analyses (bottom-up approach).Second, we examined the papers if they contain broad claims on positive effects ofprocess model reuse and checked in a third step if these claims are substantiatedsystematically by an empirical or non-empirical analysis (top-down approach).
As the result of our bottom-up analysis, we detected 16 papers out of 92 that contain anempirical analysis (see also RQ1). In summary, the 16 papers evaluate (1) the efficacy ofautomatic pattern detection, understandability, consistency, correctness, modelmanagement, acceptance issues and the technical quality in terms of time and memoryconsumption – all the claims in respect to these goals are validated by conductingexperiments, (2) the relevance of patterns by an analysis of a collection of more than 200process models, which is contained in two separate papers, (3) the technical quality of anapproach for storing process models conducting an experiment using 595 EPC modelsfrom the SAP R/3 reference model and 248 EPC models from IBM’s BIT library, (4) therequired adjustments when reusing models and the impact of reuse on model quality
190

using an experiment, (5) granularity issues of reuse by conducting a comparative study,(6) the feasibility of the proposed approach by implementing a prototype or conductingcase studies. Surprisingly, although tool development is the ultimate goal of manyefforts, none of the empirical analyses of these prototypes is based on user experiments.Regarding RQ3 it can be concluded that there is a low number of papers addressing theempirical analysis of goals. Moreover and quite alarmingly, experiments with end-usersseem to be largely neglected.
To conduct our top-down analysis, we specifically analyzed the abstract and motivationsections of all papers to detect broad claims on positive effects that are used to motivatethe research conducted in the paper. If such claims were present, we analyzed whetherthey are supported by an (non-)empirical analysis. Thereby we identified that reductionof modeling time, reduction of errors in process models, general statements on thepositive correlation between business process model reuse and model quality, as well asa gain of modeler productivity were the most often mentioned broad claims on positiveeffects of process model reuse in these papers. Reduction of errors thereby refers to e.g.the elimination of concrete modeling errors like misspellings or incorrect use of themodeling language syntax while the general model quality aspect is concerned about e.g.layout of models or suitable decomposition of big models into smaller ones. 46 out of the92 considered papers mentioned one or more of the aforementioned positive effectswhile in the other half no positive effects were mentioned. The results of thisinvestigation can be found in Figure 3.
Figure 3: Number of papers considering positive effects of their approach.
Most frequently the reduction of modeling time needed to construct a process model ismentioned as a positive effect of business process model reuse (42 times). However,only 8 papers out of 42 provide an empirical validation of that claim (19%). Another 14papers (33%) provide other kinds of investigations regarding the efficacy of theapproach, which do not directly relate to the general claim of reducing modeling time ordo not provide an empirical analysis (e.g. they describe a research prototype and relatedscenarios possibly leading to the reduction of modeling time [TCN11] but do notmeasure any kind of concrete modeling time). The same observation holds for the othereffects: In every effect category (time reduction, error reduction, quality improvementand productivity gain) only few papers provide an empirical validation while a fewothers provide other kinds of validations. But still most papers do not provide anyvalidation regarding their claimed positive effects. Overall 78 statements regarding the
191

four positive effects can be found in the literature but only 13 statements (17%) wereempirically validated. Another 22 statements (28%) were validated without explicitempirical focus, which means that 55% of the stated positive effects were not validatedin any way. To sum up this aspect of our literature analysis, a large amount of researchwork has been published – however, without any empirical investigation regarding thepositive promises of business process model reuse.
4 Conclusion and outlook
Since there is a great variety of research available regarding reuse in business processmodelling, we have investigated the state of empirical evidence in respect to the positiveeffects accompanied by these approaches. To do so, we systematically investigated theproposed approaches, which led to the consideration of 92 research papers. Regardingour research questions RQ1-3 we have to state that while there are numerous approachesdevising methods and models for reuse or design tool support, there is a lack ofempirical research to substantiate the positive effects attributed to the approaches andtools. Regarding the more general, broad claims on positive effects (e.g. regarding time,effort and quality), it has to be stated that a validation in this respect is almostcompletely missing. We hence come up with the following conclusions andrecommendations. Firstly, we suggest the community of BPM researchers to do moreempirical research in terms of evaluating the positive effects of their approaches.Secondly, we encourage researchers to investigate the effects of their approaches in amore holistic way.
6 References
[AC11] Aldin, L.; de Cesare, S.: A literature review on business process modelling: newfrontiers of reusability. Enterpise Information Systems, 5(3), pp. 359-383, 2011.
[FG2012] Fantinato, M.; Gimenes, I. M. de Souza; Rocha, R. dos Santos; Thom, L. H.; Toledo,M. B. Felgar de: A Survey on Reuse in the Business Process Management Domain.Int. J. Business Process Integration and Management, 6(1), pp. 52-76, 2012.
[GEW09] Grosskopf, A.; Edelman, J.; Weske, M.: Tangible Business Process Modeling –Methodology and Experiment Design. In S. Rinderle-Ma, S. Sadiq, F. Leymann(Eds.), Proceedings of BPM 2009 International Workshops, pp. 489-500, Ulm, 2009.
[Ho10] Holschke, O.: Impact of Granularity on Adjustment Behavior in Adaptive Reuse ofBusiness Process Models. In R. Hull, J. Mendling, S. Tai (Eds.), Proceedings of the8th BPM conference (BPM 2010), pp. 112-127, Hoboken, 2010.
[KP06] Klein, M.; Petti, C.: A handbook-based methodology for redesigning businessprocesses. Knowledge and Process Management, 13(2), pp. 108-119, 2006.
[Kr91] Krueger, C. W.: Software reuse. ACM Comp. Surveys, 24(2), pp. 131-183, 1992.
[TCN11] Tran, H. N., Coulette, B., Narbonne, D.: Automatic Reuse of Process Patterns inProcess Modeling. In Proceedings of the 2011 ACM Symposium on AppliedComputing, pp. 1431-1438, 2011.
[WW02] Webster, J.; Watson, R. T.: Analyzing the Past to Prepare for the Future: Writing aLiterature Review. MIS Quarterly, 26(2), pp. xiii-xxiii, 2002.
192

Towards Auditors’ Preferences on Documentation Formats
in Business Process Audits
Martin Schultz, Niels Mueller-Wickop
Chair of Information SystemsUniversity of HamburgMax-Brauer-Allee 60
22765 Hamburg(martin.schultz | niels.mueller-wickop)@wiso.uni-hamburg.de
Abstract: Internal and external auditors play an increasingly important role forbuilding up trust and confidence in today’s economic cycle. To ensure effectiveand efficient audits, current audit standards demand from auditors to gain an in-depth understanding of the clients’ business processes. In this context, seminal re-search results indicate that type and number of documentation formats have a sig-nificant impact on audit effectiveness and efficiency. However, audit standards donot define type and number of documentation formats and little research attentionhas been paid to this selection problem with regard to a process modeling supportfor auditors. To close this gap, we conducted an online survey among auditors withexpertise in process auditing. With the answers of 370 participants we derive prev-alent preferences on type and number of documentation formats for particular auditconcepts and analyze factors influencing the format decision. The results provide auseful basis for developing a domain specific modeling language for process auditswhich is currently lacking.
1 Introduction
The enactment of the Sarbanes-Oxley Act in 2002 (SOx) and subsequent SOx-type lawsin several countries around the world sets a strong focus in the audit domain on the in-ternal controls system (ICS) an organization has to implement in its business processesin order to ensure compliance to active legislation. In current audit practice the clients’business processes along with embedded controls are considered as integrated auditobject instead of auditing single control means. Therefore, process audits are today oneof the central audit procedures for external and internal auditors. In this regard, auditstandards demand from auditors to gain an in-depth understanding of the business pro-cesses in order to derive a comprehensive audit result for an organization [IAA09].However, auditing a business process is a complex task as a large amount of informationneed to be collected, integrated and analyzed. Diverse sources need to be consideredaffecting several stakeholders on different organizational levels [Ma00]. Nowadays,auditors base their collection and evaluation of relevant information on several funda-mentally different documentation formats ranging from flexible, less structured narra-
193

tives over structured aids like questionnaires or matrices to graphical formats such asflowcharts or organizational charts [BJJ07][Pu89]. In this regard, audit standards do notimpose binding requirements for documentation formats although research results indi-cate that the format of audit relevant information significantly influence auditors’ effec-tiveness and efficiency [BMW09]. However, auditors consider the advantages and dis-advantages of different formats. For instance, especially external auditors set their focuson audit efficiency to cope with the increasing competitive pressure. Therefore, theyoften rely on less time-consuming documentation formats like narratives [BW04]. This,of course, has implications for the audit effectiveness, especially in light of prior re-search results showing that a more elaborate flowchart representation facilitates the auditof a business process and hereby increases the audit effectiveness [BHT09]. Althoughaudit related issues receive increasing attention in academia and practice in recent years,there is still a lack of methods and corresponding software solutions to comprehensivelyannotate, analyze, and simulate business processes in the course of business processaudits [RWS10] [Sa11]. This is especially surprising in view of the large amount ofinformation to be considered in business process audits and the resulting high cognitiveload for auditors. Up to now, no comprehensive research on the most supportive presen-tation format(s) for audit-relevant information has been conducted in order to reduce thishigh cognitive load. Initial research in this area indicates that different presentation for-mats are suitable for different information needed in the course of a process audit[BMW09]. However, the most supportive presentation formats for single audit conceptshas not yet been investigated. In this context, an audit concept constitutes informationabout real world objects needed to conduct a process audit (cf. section 2).
Addressing this gap we conduct an online survey with 370 auditors in order to gaindeeper insights into the preferences of external and internal auditors regarding the typeand number of documentation formats for particular audit concepts. Moreover, we ana-lyze the actual usage of business process modeling languages (BPML) in the audit do-main as flowcharts seem particularly suitable in the context of process audits [BHT09].These results form a basis for the development of an integrated presentation of relevantinformation in the course of a business process audit.
The remainder of this paper is structured as follows: the next section gives an overviewof the related research work and background information. Section 3 describes the appliedresearch method by providing details on the questionnaire design and the targeted popu-lation. Section 4 presents the research results. The paper ends with a conclusion, limita-tions, and implications for future research work.
2 Background and Related Research
The presentation of information has bothered mankind for more than 40,800 years: firstcave paintings were found as early as that [PHG12], ever since different kinds of infor-mation had to be presented in one way or another. Thereby, finding the “right” way ofpresenting information or the best possible presentation format is a difficult task. Theaudit-relevant information investigated here has been a research object for quite sometime. For instance, Pacioli and Paganini first fully described the double-entry bookkeep-
194

ing in 1523 using T-accounts [PP23]. Audit-related literature from the last century main-ly focuses on the support of analytical audit procedures (e.g. risk assessment, financialratios and relationships) as they were the method of choice at that time. Already in 1979Moriarity examined a multidimensional graphic technique for describing the financialstatus of a firm. He shows that schematic faces are useful means for communicatingfinancial information in some cases [Mo79]. Pointing in the same direction with hisresearch, Kaplan examined the effect of presentation formats on values expected byauditors in analytical audit procedures [Ka88]. Another stream of research investigatedthe effect of audit documentation formats on the amount of data collected in the courseof an audit, see for instance [Pu89].
In 1997, the business risk audit approach was introduced by Bell [Be97]. As a result,research focus shifted from documentation formats for analytical audit procedures to-wards the most supportive presentation formats for the new audit approach [BW04]. Oneof the results of this research was that after adopting the new audit approach auditorssignificantly more often use narratives instead of other formats (e.g. questionnaires,matrices). Two reasons coming along with the use of narratives were responsible for thischange: first, the perceived improvement of audit efficiency; second, the high flexibilityof narratives that fits well to the new audit approach.
The penultimate reform took place with the enactment of the Sarbanes-Oxley Act (Sox)of 2002 [So02]. As one result, the company’s ICS gained a central role in the appliedaudit approaches. Consequentially, researchers focused on the most supportive docu-mentation format for internal controls. Already in 1999, Bierstaker presented a survey onpreferred internal control documentation formats and their combinations that auditorscommonly use [Bi99]. Results depict that approximately 88 percent of the auditors usenarratives, 60 percent questionnaires, 46 percent flowcharts, and 37 percent an internalcontrol matrix as documentation format for their audit assignments. In a next step Bier-staker and Brody examined whether the documentation format affects auditors perfor-mance [BB01]. Contrary to their expectation the documentation format did not affectperformance. However, the auditing experience had an impact on the performance, re-gardless of the documentation format used. In contrast to these findings the next investi-gation on different commonly used formats and the effect of auditors experience re-vealed that auditors who utilize an internal control questionnaire more likely identifyinternal control design weaknesses than auditors who prepare a narrative. Therefore, itcan be concluded that the use of questionnaires and narratives have an impact on audi-tors performance in identifying internal control design weaknesses [BT06]. In 2007Bierstaker et al. examined factors that influence the choice of type and number of differ-ent formats for documenting internal controls [BJJ07]. This publication draws a moredifferentiated picture of the topic as it not only considers the auditor’s expertise but alsothe clients’ information technology (IT) complexity and firm size. They found that highIT complexity positively correlates with a higher probability of using flowcharts. Still,auditors most likely use narratives followed by questionnaires.
Just recently a slow shift from the pure internal controls perspective towards a strongerprocess orientation can be noticed in the audit domain. Again, along with this shift re-searchers started to analyze ways to support this business process-oriented perspective.
195

In this field of research a long-discussed representation format for processes areflowcharts respectively flow diagrams. Bradford et al. evaluated the use of diagrammingtechniques in accounting education and practice [BRR07]. Specially concentrating oninternal auditors, Andrews investigated how modeling language diagrams can help tovisualize organization's business processes with regard to audit-relevant aspects [An07].Another study showed that flowcharts increase the auditor’s ability to identify missingcontrols in a business process [BHT09].
However, there have been two factual shortcomings regarding audit-relevant informationin the context of a business process audit. First, a comprehensive assessment of whichaudit concepts should be presented in which presentation format(s) had not been under-taken. As a matter of fact, research predominantly focused on single aspects of the do-main, rather than drawing a full picture. Second, up to now all research work has basedon requirements that have been derived primarily from reviews of relevant literature,audit standards and frameworks (e.g. [COSO13]). Domain experts or stakeholders havenot been comprehensively involved. In order to close this gap, the authors conductedexpert interviews [SMN12] and a quantitative online survey by which twelve audit con-cepts were identified as relevant for a process audit [MSP13]. Table 1 depicts these con-cepts along with short descriptions that were derived from expert interview statements.
Table 1: Short Description of analyzed Audit Concepts [SMN12]
Concept Short Description provided in the online survey
Controls Procedure that aims at preventing/ detecting an undesirable event or result,e.g. manual/ automated, preventative/ detective
Process Flow Sequence of interdependent or linked activities e.g. purchase-to-pay,warehousing, order-to-cash.
Risks A threat of an event with negative effects, e.g. system breakdown, mis-statement, fraud.
Data Any type of electronic or paper-based input or output of a process activity,e.g. invoices, vouchers, contracts, reports.
InformationSystems
Any combination of information technology and people's activities thatsupport operations, management and decision making, e.g. ERP-Systems
Audit Objec-tives
Overarching goal of an audit. It can be broken down into more detailedassertions or control objectives, e.g. reliability of financial statements,compliance of a process.
Organization Any organizational unit, e.g. department, role, employee.Standards&Regulations
Legislative rules or commonly accepted standards providing requirements/guidelines for processes or their results, e.g. GAAP, Sox, COSO.
Audit Results Result of a performed audit. It refers to a process and/ or individual con-trols and comprises assessments of design and operating effectiveness.
Materiality “Information is material if its omission or misstatement could influencethe economic decisions of users taken on the basis of the financial state-ments” ISA 320 [IFAC10].
FinancialStatements
Reports about an organization's financial results and conditions like bal-ance sheet and income statement.
BusinessObjectives
A specific result that an organization aims to achieve within a time frameand with available resources, e.g. profit.
196

As presented before, seminal research work regarding documentation formats in theaudit domain could be identified only for a small number of these concepts. One possibleexplanation for this limitation is that only recently the focus of auditors has been laid onbusiness processes and related audit concepts. Furthermore, the business process auditapproach is comparatively new.
3 Research Method
The paper at hand applies a quantitative research method as it collects and analyses datafrom an online survey focusing on internal and external auditors with expertise in pro-cess audits. It complements prior empirical research results regarding audit concepts andtheir relations in the context of business process audits. These were derived from semi-structured expert interviews [SMN12] and the analysis of the first part of this onlinesurvey [MSP13]. This paper deals with the analysis of the second survey part.
Online surveys are a well-established method that is widely used for data collection notonly in information systems research [PLM04]. For preparing the questionnaire andconducting the online survey the authors follow the process proposed by Lumsden andMorgan [LM05]. It comprises six steps: 1) define the research question; 2) divide theresearch question into sub-categories; 3) determine and profile the target audience; 4)design and implement the content; 5) pilot the questionnaire; 6) administer the question-naire. The following sections describe the activities in each step.
3.1 Research Question and Questionnaire Content
The survey presented here is of descriptive nature. The purpose of a descriptive survey isto find out what situations, events, attitudes or opinions occur in a population [PK93]. Inparticular, this survey aims at presenting new insights into the audit domain regardingthe current usage of BPMLs and existing preferences among auditors for the documenta-tion format of audit relevant concepts in a process audit. This question is divided intothree sub-categories: 1) usage of modeling languages; 2) satisfaction with the usedBPMLs; and 3) documentation format preferences for audit-relevant concepts.
To each sub-category appropriate questions are assigned and the logical structure of thequestionnaire is derived based on the relationships between these sub-categories. Thequestionnaire starts with an invitation text which explains the nature of the survey,demonstrates third-party trustworthiness, and defines an incentive (a free copy of theresearch results). Subsequently, personal questions are asked as presenting them at theend of a questionnaire may result in an increased drop-out rate [ANP03] [SFE02]. Table2 gives a simplified overview of the questionnaire structure.
197

Table 2: Questionnaire Structure
Part Topic Ques.
1 Respondent’s organization, role, work experience Q1-Q51. Which sector is your company operating in?2. How many employees work at your company?3. How many employees primarily work in the department for process audits?4. What is your job title?5. How many years of experience do you have in process auditing?
2 Usage of process modeling languages Q66. Which process modeling language(s) do you currently use to prepare/ depict
audit-relevant business processes?3 Satisfaction with the used process modeling language(s) Q7
7. How satisfied are you with the process modeling language(s) you use?4 Documentation format preferences for audit-relevant concepts Q8
8. Which formats should be used to document audit-relevant concepts in thecontext of a business process audit?
3.2 Questionnaire Design1
In academia a plethora of guidelines exist on the design of questionnaires. These guide-lines rest upon a wide range of seminal research work and encompass recommendationsfor technical aspects of the survey implementation, the design and layout as well aslanguage-related aspects [MSB08] [LM05]. As an online survey is self-administeredand the authors have no control of the completion, the design of the questionnaire is ofvital importance for the quality of the survey data [Be10]. The design of the question-naire presented here is preponderantly based on the guidelines of Morrison et al. 2008[MSB08] and Lumsden and Morgan [LM05]. By carefully following these relevantguidelines, the questionnaire contributes to reduce measurement errors (deviation of theanswers of respondents from their true values on the measure) and the non-response rate(which leads to non-observation errors as intended measurements cannot be carried out)to a minimum [Co00] [Be10].
To avoid a high non-response or drop-out rate due to technical problems the support ofmultiple platforms and browsers is crucial for the quality of an online survey [Be10].The implementation of this questionnaire addresses this aspect by solely utilizing stand-ard HTML and a minimal usage of java script. In order to arrange the completion of thequestionnaire as flexible as possible for the respondents, it is possible to interrupt and re-enter the survey [Ba03] [Sm97] [Li10]. Furthermore, the questionnaire presented hereestablishes a clear navigation path by indicating the start of each section and each ques-tion with sub-headings in order to allow for a comfortable and well-structured comple-tion. All questions and answer options are arranged and grouped according to commonreading patterns [MSB08]. For all questions (except the questions regarding respond-ents’ characteristics) a “Don’t Know” response option is provided in order to distinguishbetween respondents who chose a particular answer option and respondents who do not
1 This section is based on the published results of the first part of the survey [MSP13].
198

know/are not willing to provide an answer. Such an answer option increases the reliabil-ity of the survey data and reduces the number of drop-outs [SFE02].
The response option for question seven (satisfaction with BPML) is implemented as aseven-options Likert-Scale ranging from “very unsatisfied” to “very satisfied”. Likert-Scales are frequently used for measuring constructs in surveys as they are easy to con-struct and administer [Ba03]. With a seven-options Likert-Scale a “Middle Option” isprovided. Seminal research results attribute a positive effect on the reliability and validi-ty of the survey data to such a middle option [Li10]. Question eight offers a matrix withthe list of the twelve audit relevant concepts (cf. section 2) on the y-axis and possiblerepresentation formats on the x-axis. A short description of each concept is given toensure a common understanding among the respondents. Answer options for the docu-mentation format are “narratives”, “tabulated/structured”, “graphical”, and “no docu-mentation” as these are the preponderantly used formats in the audit domain [BJJ07].The answer options on both axes are randomly sorted to reduce the effect of answeroptions order [Li10]. In general, guidelines on questionnaires dissuade from using such amatrix question. However, the particular nature of the participants allows the usage ofthis question type as auditors are familiar with tables and matrices [MSB08].
With regard to language aspects, the questionnaire considers several recommendationsregarding the length of questions (should not exceed 16 to 20 words [Br86] [Op00]), thetype of questions (no double-barreled and no negative questions are used to reduce thelevel of complexity [ANP03]), the wording of a question (formulated in a simple waywith simple grammar [DTB98] [SFE02], complex questions are broken down to a seriesof simple questions [MSB08]).
With a first version of the questionnaire a pilot test was carried out by carefully applyingthe guidelines defined by [ANP03] [Gr02] [LM05] [Ba03]. In total, the questionnairewas checked with eight test persons knowledgeable in process audits and/ or surveyresearch. Based on the test results several adjustments were made especially regarding amore precise wording of the questions.
3.3 Population, Sampling and Data Collection2
This survey defines individuals knowledgeable in process audits and with working expe-rience as internal or external auditors as target population. Due to an easier access to thetarget group the survey – in a first step - is limited to German-speaking countries. How-ever, in our understanding this limitation is not likely to have an influence on the validityof the results for the audit domain in general since international audit standards forceauditors to use homogeneous approaches worldwide, e.g. [IFAC10]. Moreover, the de-scriptive statistics on our respondents reveal that most of them work for large (audit)companies and therefore are confronted with diverse regulatory requirements of all im-portant markets and regions world-wide. In terms of working experience the surveycovers the operational (auditors conducting process-audit field work) as well as the man-agement perspective (senior auditors responsible for audit planning and supervision).
2 This section is based on the published results of the first part of the survey [MSP13].
199
To attract participants for our survey we utilized social and professional networks (e.g.XING), distributed invitations to members of large auditor associations (e.g. DIIR, ISA-CA), and post in subject-related online forums. Additionally, the Top 25 German auditcompanies3 (based on [Lu12]) were contacted and we separately invited the internalaudit departments of the Top 100 German companies to participate. The described ap-proach constitutes a non-probabilistic method to select respondents (survey type: unre-stricted self-selected survey) [Co00]. The analyses in Section 4 consider this fact andespecially pay respect to the validity of the findings for the target population. However,the purposeful distribution of invitations comprehensively covers the targeted populationas the approach does not systematically exclude any sub-group. This results in a lowcoverage error (mismatch between the target population and the sample frame) [Co00].Therefore, in our opinion the survey results reasonably reflect the current preferences ondocumentation formats in the audit domain.
The questionnaire was placed online for two months starting from October 15th untilDecember 15th, 2012. A total of 463 respondents, participated. 370 respondents com-pleted all four question parts.4 These responses are the basis for our analyses.
4 Analysis and Results
4.1 Demographic Characteristics of Respondents
Table 3 presents descriptive statistics of the respondents and their organizations that arederived from the first section of the questionnaire. These statistics comprise the processaudit experience (in years) and the job position of the respondents as well as the size(number of employees, number of employees in process audit department) and sector oftheir organizations. As the following analyses use these variables an understanding oftheir distribution among the respondents is beneficial. The distribution of the variablessector and size of the organization is especially noteworthy due to the uneven distribu-tion. Hence, for sector analyses all respondents are grouped: the group of external audi-tors encompasses all respondents from audit companies, whereas the group of internalauditors includes all the remaining respondents. In terms of organization’s size only thesize of the process audit department is used as a proxy for the frequency of processesaudits in the organization. From our point of view, this variable better reflects the rele-vance of process audits for an organization than simply the size of an organization.
3 Including Deloitte, E&Y, KPMG, PwC, and BDO4 For comparison only, this number of respondents clearly exceeds the minimum sample size for a populationof 10,000 individuals [BKH01].
200

Table 3: Characteristics of Respondent's Organization/ Respondent [MSP13]
Aspect Values # of Respondents Percentage
Sector
Audit companyConsultingService sectorProduction sector
26386930
71 %2 %19 %8 %
Number of employees incompany
< 250250 - 1,000> 1,000
1721
332
5 %6 %89 %
Number of employees inprocess audit department
< 1010 - 30> 30
6528
277
17 %8 %75 %
Job title
AuditorSenior AuditorHead Internal Audit/ PartnerInternal Controls responsible
160147576
43 %40 %15 %2 %
Process audit experience(in years)
< 22 - 45 - 10> 10
9395
11567
25 %26 %31 %18%
4.2 Usage of Process Modeling Languages in the Audit Domain
The second and third part of the questionnaire deals with the usage of BPMLs in theaudit domain, more precisely their usage in the context of process audits. The partici-pants are asked whether they use a BPML in a process audit and if yes which languagethey prefer. Answer options are widely known BPML which are discussed in the BPMdomain [MTJ10]. Multiple answers are possible. The analysis reveals that only 23% ofthe respondents use a BPML when conducting a process audit (cf. Figure 1). 52 of theserespondents use a specific software/ language for describing a business process underaudit but none of the common BPMLs (group Other). Among the commonly knownBPMLs the event-driven process chain (EPC) is most frequently chosen by the respond-ents (36). This corresponds to prior research results as this survey is limited to German-speaking countries where the EPC is especially widespread (cf. section 3.3) [Kr10]. Theother common BPMLs are only used by a minority of the respondents (less than 2%).
Figure 1: Usage of process modeling languages in the context of process audits
201

25 of the 52 respondents who do use a BPML but not a common one (group Other inFigure 1) state in a free-text field which software/ language they use for representingbusiness processes. Most of these respondents indicate a firm specific language/ software(10) followed by narratives in MS Word/ Excel/ Powerpoint (5). Other software/ lan-guages mentioned are process mining-software (2), ADONIS (2), VSM (1), MS Visio/Access (1), entity relationship diagram (1), standards (COBIT, ITIL, BPM) (1), ARIS(1), and flowcharting according to DIN 66001 (1).
In a second step the study examines the influence of the factors sector (internal or exter-nal auditors), size of the department dedicated to process audits, and the audit experi-
ence of the respondents on the usage of a BPML. We utilize the Chi-Square and Cramer-V test (α = 0.05 and degree of freedom (df) = 1)5 in order to assess whether the frequen-cy of responses on the BPML usage significantly differs depending on the influencingfactors. The analysis shows significant but weak dependencies for the sector (Chi2 =13.86; Cramer-V = 0.194) and the department size (Chi2 = 6.091; Cramer-V = 0.128).Accordingly, BPMLs are more often used by internal auditors and in smaller processaudit departments. The factor audit experience shows no significant association with theBPML usage.
Those respondents who use a BPML (99, in Figure 1 multiple answers are allowed) areasked how satisfied they are with the usage in their everyday audit practice (seven-options Likert-Scale ranging from “very unsatisfied” to “very satisfied”). Based on theanswers given the median, 0.25-Quartile, and 0.75-Quartile is calculated. The median ofthe answers is “rather satisfied” (5) with a small interquartile range from “neither/ nor”(4) to “satisfied” (6).
In summary, the results indicate that BPMLs are not widespread in current process auditpractice. Moreover, when using a BPML auditors rather rely on firm specific languages/software or standard office software (e.g. MS Word/ Excel/ Powerpoint) instead ofcommon BPMLs. This might indicate that common BPMLs do not sufficiently meetauditors’ requirements for annotating and analyzing audit-relevant concepts in a processmodel [Sa11] [Ca06]. However, auditors using a language/ software for modeling busi-ness processes are rather satisfied. Especially worth mentioning, BPMLs are more oftenused by internal auditors and in smaller process audit departments. This might indicatethat external auditors and organizations with a larger process audit department/ higherprocess audit frequency focus on audit efficiency and therefore refrain from using moretime-consuming documentation formats like process models. This interpretation is con-sistent with previous research results [BJJ07][BW04][Ho99].
4.3 Number of Documentation Formats for Key Audit Concepts
The fourth part of the questionnaire focuses on existing preferences among auditorsregarding documentation formats of audit relevant concepts. The participants are askedto indicate for each audit concept the documentation format that is most supportive toconduct a comprehensive process audit. The survey permits multiple answers for each
5 IBM SPSS Statistics Version 21.0.0.0 is used as analysis software.
202
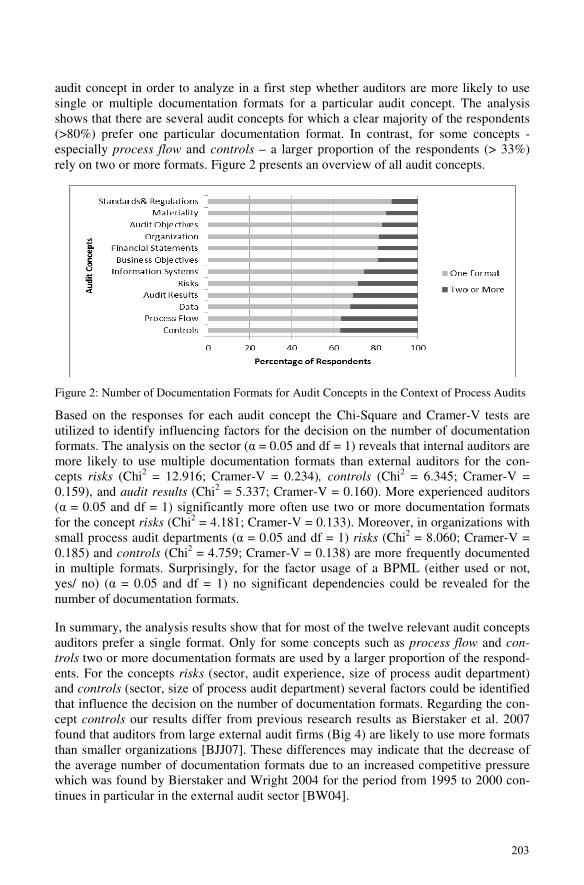
audit concept in order to analyze in a first step whether auditors are more likely to usesingle or multiple documentation formats for a particular audit concept. The analysisshows that there are several audit concepts for which a clear majority of the respondents(>80%) prefer one particular documentation format. In contrast, for some concepts -especially process flow and controls – a larger proportion of the respondents (> 33%)rely on two or more formats. Figure 2 presents an overview of all audit concepts.
Figure 2: Number of Documentation Formats for Audit Concepts in the Context of Process Audits
Based on the responses for each audit concept the Chi-Square and Cramer-V tests areutilized to identify influencing factors for the decision on the number of documentationformats. The analysis on the sector (α = 0.05 and df = 1) reveals that internal auditors aremore likely to use multiple documentation formats than external auditors for the con-cepts risks (Chi2 = 12.916; Cramer-V = 0.234), controls (Chi2 = 6.345; Cramer-V =0.159), and audit results (Chi2 = 5.337; Cramer-V = 0.160). More experienced auditors(α = 0.05 and df = 1) significantly more often use two or more documentation formatsfor the concept risks (Chi2 = 4.181; Cramer-V = 0.133). Moreover, in organizations withsmall process audit departments (α = 0.05 and df = 1) risks (Chi2 = 8.060; Cramer-V =0.185) and controls (Chi2 = 4.759; Cramer-V = 0.138) are more frequently documentedin multiple formats. Surprisingly, for the factor usage of a BPML (either used or not,yes/ no) (α = 0.05 and df = 1) no significant dependencies could be revealed for thenumber of documentation formats.
In summary, the analysis results show that for most of the twelve relevant audit conceptsauditors prefer a single format. Only for some concepts such as process flow and con-
trols two or more documentation formats are used by a larger proportion of the respond-ents. For the concepts risks (sector, audit experience, size of process audit department)and controls (sector, size of process audit department) several factors could be identifiedthat influence the decision on the number of documentation formats. Regarding the con-cept controls our results differ from previous research results as Bierstaker et al. 2007found that auditors from large external audit firms (Big 4) are likely to use more formatsthan smaller organizations [BJJ07]. These differences may indicate that the decrease ofthe average number of documentation formats due to an increased competitive pressurewhich was found by Bierstaker and Wright 2004 for the period from 1995 to 2000 con-tinues in particular in the external audit sector [BW04].
203
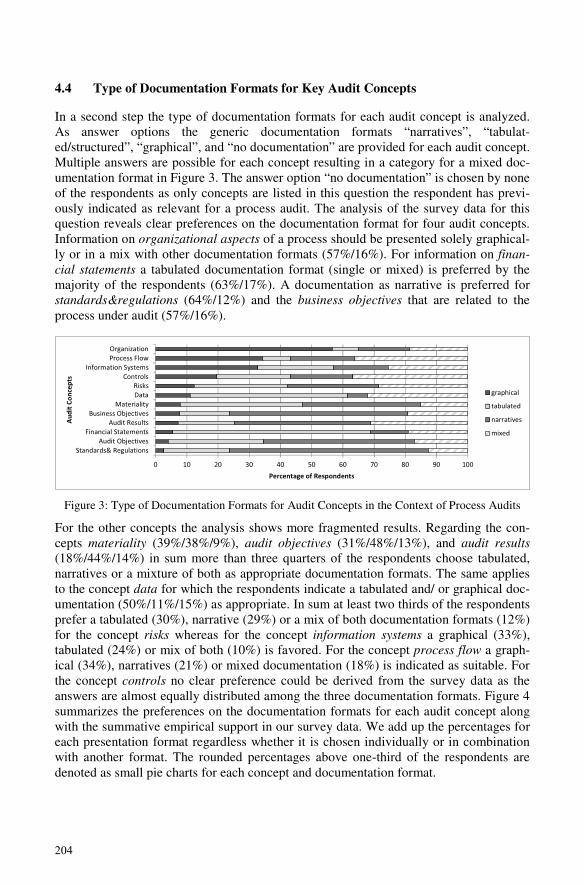
4.4 Type of Documentation Formats for Key Audit Concepts
In a second step the type of documentation formats for each audit concept is analyzed.As answer options the generic documentation formats “narratives”, “tabulat-ed/structured”, “graphical”, and “no documentation” are provided for each audit concept.Multiple answers are possible for each concept resulting in a category for a mixed doc-umentation format in Figure 3. The answer option “no documentation” is chosen by noneof the respondents as only concepts are listed in this question the respondent has previ-ously indicated as relevant for a process audit. The analysis of the survey data for thisquestion reveals clear preferences on the documentation format for four audit concepts.Information on organizational aspects of a process should be presented solely graphical-ly or in a mix with other documentation formats (57%/16%). For information on finan-
cial statements a tabulated documentation format (single or mixed) is preferred by themajority of the respondents (63%/17%). A documentation as narrative is preferred forstandards®ulations (64%/12%) and the business objectives that are related to theprocess under audit (57%/16%).
0 10 20 30 40 50 60 70 80 90 100
Standards& RegulationsAudit Objectives
Financial StatementsAudit Results
Business ObjectivesMateriality
DataRisks
ControlsInformation Systems
Process FlowOrganization
Percentage of Respondents
AuditC
oncepts
graphical
tabulated
narratives
mixed
Figure 3: Type of Documentation Formats for Audit Concepts in the Context of Process Audits
For the other concepts the analysis shows more fragmented results. Regarding the con-cepts materiality (39%/38%/9%), audit objectives (31%/48%/13%), and audit results
(18%/44%/14%) in sum more than three quarters of the respondents choose tabulated,narratives or a mixture of both as appropriate documentation formats. The same appliesto the concept data for which the respondents indicate a tabulated and/ or graphical doc-umentation (50%/11%/15%) as appropriate. In sum at least two thirds of the respondentsprefer a tabulated (30%), narrative (29%) or a mix of both documentation formats (12%)for the concept risks whereas for the concept information systems a graphical (33%),tabulated (24%) or mix of both (10%) is favored. For the concept process flow a graph-ical (34%), narratives (21%) or mixed documentation (18%) is indicated as suitable. Forthe concept controls no clear preference could be derived from the survey data as theanswers are almost equally distributed among the three documentation formats. Figure 4summarizes the preferences on the documentation formats for each audit concept alongwith the summative empirical support in our survey data. We add up the percentages foreach presentation format regardless whether it is chosen individually or in combinationwith another format. The rounded percentages above one-third of the respondents aredenoted as small pie charts for each concept and documentation format.
204

Materiality
Financial Statements
Audit Results
Standards&Regulations
Audit Objectives
Business ObjectivesData
Information Systems
OrganizationRisks
Controls
Process Flow
Audit ConceptsDocumentation Format
Graphical
Tabulated
Narratives
Audit Concepts
=1/3 =1/2 =2/3 =3/4
Figure 4: Summarized Preferences for Documentation Formats of Audit Concepts
For each audit concept we utilize the Chi-Square and Cramer-V test (α = 0.05 and df =3) in order to assess whether the frequency of responses for particular documentationformats significantly differ depending on the respondents’ sector (internal or externalauditor), process audit experience, size of the process audit department, and the usage ofa BPML. For these analyses all respondents with more than one chosen documentationformat for a single concept are grouped in the category “mixed”. With regard to thesector the analysis shows significant but weak dependencies for the concepts risks (Chi2
= 13.50; Cramer-V = 0.24) and process flow (Chi2 = 9.54; Cramer-V = 0.196). For risks
external auditors tend to prefer working with tables whereas internal auditors favor amixture of tables and narratives. Concerning the process flow external auditors signifi-cantly more often mark tables or narratives as appropriate presentation format. In con-trast, internal auditors more frequently rely on a graphical documentation of the process
flow. The size of the process audit department is associated with the choice of the docu-mentation format for the concept risks (α = 0.05 and df = 3). Respondents from an or-ganization with a large process audit department prefer tables compared to a preferenceon a mixed format for small departments. Regarding the respondents’ process audit ex-perience and the BPML usage the analysis reveals no further significant dependencies.
In summary, it can be concluded that among our respondents clear preferences on thedocumentation formats exist for several concepts. These might be considered when itcomes to software/ method development for the audit domain. For process audits allaudit concepts mentioned above are considered as relevant. This calls for an integratedrepresentation. The identified preferences may help to find a suitable integration forauditors. An obvious starting point for integrating audit-relevant information is the pro-cess flow as it links all relevant audit concepts.
5 Conclusion and Future Research
The important role of auditors for our economy has become evident to the general publicafter a series of financial scandals occurred. However, at the same time these scandalsunderline that there is room for improvement in the current audit practice. Accordingly,topics related to a more comprehensive method/ software support for auditors gainedmomentum in academia and practice in recent years. Thereby, a focus is set on the audit
205

of business processes as this is an important audit type for current audit approaches. Inthis regard, we conducted an online survey among internal and external auditors knowl-edgeable in business process audits to gain new insights into the usage of BPMLs andpreferences on documentation formats in the audit domain. Our results show that alt-hough there is a strong focus on business processes in the current audit practice BPMLsare not widely used by auditors to document the flow of a process. Moreover, whenmodeling a business process auditors more likely rely on firm specific languages/ toolsinstead of commonly known BPMLs. We interpret this as an indicator for a gap betweenthe range of functions of common BPMLs and auditors’ specific requirements. Regard-ing the documentation formats we identified clear preferences for the audit conceptsorganizational aspects (graphical), financial statements (tabulated), stand-
ard®ulations (narratives) whereas for other concepts mixed documentation formatsare preferred (e.g. process flow, risks). Furthermore, our results show that among re-spondents external auditors more likely focus on audit efficiency as they rely on fewerand less time-consuming documentation formats than internal auditors for several auditconcepts such as risks and process flow.
The survey was limited to German speaking countries and participants were primarilyfrom large companies. Extending the population regarding both aspects might revealfurther insights as cultural difference may have an impact. Additionally, a non-probabilistic method was used to select survey participants. However, by applying perti-nent guidelines for survey design and distribution we believe that our results portray acommon understanding of documentation formats in the audit domain. The survey re-sults support the development of a more comprehensive software support respectively adomain specific modeling language for complex audit tasks like process audits. They canbe used as a basis to better address auditors’ requirements in terms of informationpresentation. Topics related to these aspects remain at the top of our research agenda.Yet, due to the relatively few prior research work on documentation formats in the auditdomain, future research work is needed to complement the gained insights. From a be-havioral perspective it is beneficial to investigate the influence of audit firm policies orthe documentation of previous audits on the choice of number/ type of documentationformats [BJJ07]. In addition, the effect on the audit efficiency and effectiveness of dif-ferent documentation formats for each audit concept would be of high value for auditors.In the long run, not only auditors would benefit from increased audit effectiveness andefficiency but all stakeholders of the global economy.
References
[An07] Andrews, C.P.: Drawing a map of the business: universal Modeling Language dia-grams can help internal auditors visualize their organization’s business processes. In-ternal Auditor. 64, 2007; pp. 55–58.
[ANP03] Andrews, D., Nonnecke, B., Preece, J.: Electronic Survey Methodology: A Case Studyin Reaching Hard-to-Involve Internet Users. International Journal of Human-ComputerInteraction. 16, 2003; pp. 185–210.
[Ba03] Baker M.J.: Data Collection - Questionnaire Design. The Marketing Review. 3, 2003;pp. 343–370.
206
[BB01] Bierstaker, J.L., Brody, R.G.: Presentation format, relevant experience and task per-formance. Managerial Auditing Journal. 16, 2001; pp. 124–129.
[Be10] Bethlehem, J.: Selection Bias in Web Surveys. International Statistical Review. 78,2010; pp. 161–188.
[Be97] Bell, T.B.: Auditing Organizations Through a Strategic-systems Lens: The KPMGBusiness Measurement Process. KPMG Peat Marwick LLP, Montvale N.J. 1997.
[BHT09] Bierstaker, J.L., Hunton, J.E., Thibodeau, J.C.: Do Client‐Prepared Internal ControlDocumentation and Business Process Flowcharts Help or Hinder an Auditor’s Abilityto Identify Missing Controls? AUDITING: A Journal of Practice & Theory. 28, 2009;pp. 79–94.
[Bi99] Bierstaker, L.: Internal Control Documentation: Which Format is Preferred? The Audi-tors Report. 22, 1999.
[BJJ07] Bierstaker, J., Janvrin, D., Jordan Lowe, D.: An Examination of Factors Associatedwith the Type and Number of Internal Control Documentation Formats. Advances inAccounting. 23, 2007; pp. 31–48.
[BKH01] Bartlett, J.E., Kotrlik, I.J.W., Higgins, C.C.: Organizational Research: DeterminingAppropriate Sample Size in Survey Research. Information Technology, Learning, andPerformance Journal. 19, 2001; pp. 43–50.
[BMW09] Bryant, S., Murthy, U., Wheeler, P.: The Effects of Cognitive Style and FeedbackType on Performance in an Internal Control Task. Behavioral Research in Accounting.21, 2009; pp. 37–58.
[Br86] Brislin, R.W.: The wording and translation of research instruments. In: Lonner, W.J.and Berry, J.W. (eds.) Field methods in cross-cultural research. pp. 137–164. SagePublications, Inc, Thousand Oaks, CA, US, 1986.
[BRR07] Bradford, M., Richtermeyer, S.B., Roberts, D.F.: System diagramming techniques: Ananalysis of methods used in accounting education and practice. Journal of InformationSystems. 21, 2007; pp. 173–212.
[BT06] Bierstaker, J.L., Thibodeau, J.C.: The effect of format and experience on internalcontrol evaluation. Managerial Auditing Journal. 21, 2006; pp. 877–891.
[BW04] Bierstaker, J.L., Wright, A.: Does the adoption of a business risk audit approachchange internal control documentation and testing practices? International Journal ofAuditing. 8, 2004; pp. 67–78.
[Ca06] Carnaghan, C.: Business process modeling approaches in the context of process levelaudit risk assessment: An analysis and comparison. International Journal of Account-ing Information Systems. 7, 2006; pp. 170–204.
[Co00] Couper, M.P.: Review: Web Surveys: A Review of Issues and Approaches. The PublicOpinion Quarterly. 64, 2000; pp. 464–494.
[COSO13] COSO: Internal Control - Integrated Framework, http://www.coso.org, 2013.[DTB98] Dillman, D.A., Tortora, R.D., Bowker, D.: Principles for Constructing Web Surveys.
SESRC Technical Report. 1998; pp. 98–150.[Gr02] Gräf, L.: Assessing Internet Questionnaires: The Online Pretest Lab. in: Bernad Ba-
tinic, Ulf-Dietrich Reips, Michael Bosnjak (eds.): Online Social Sciences. Hogrefe &Huber Publishing, Wiesbaden, 2002.
[Ho99] Houston, R.W.: The effects of fee pressure and client risk on audit seniors’ time budgetdecisions. Auditing: a journal of practice & theory. 18, 1999; pp. 70–86.
[IAA09] IAASB: ISA 315 - Identifying and Assessing the risks of Material Misstatementthrough Understanding the Entity and its Environment. International Auditing and As-surance Standards Board, 2009.
[IFAC10] International Federation of Accountants (IFAC): Handbook of Inter. Quality Control,Auditing, Review, Other Assurance, and Related Services Pronouncements. 2010.
[Ka88] Kaplan, S.: An Examination of the Effect of Presentation Format on Auditors’ Ex-pected Value Judgments. Accounting Horizons. 1988; pp. 90–95.
207

[Kr10] Kruczynski, K.: Business process modelling in the context of SOA – an empiricalstudy of the acceptance between EPC and BPMN. World Review of Science, Technol-ogy and Sustainable Development. 7, 2010; pp. 161–168.
[Li10] Lietz, P.: Research into questionnaire design: A summary of the literature. Internation-al Journal of Market Research. 52, 2010.
[LM05] Lumsden, J., Morgan, W.: Online-questionnaire design: establishing guidelines andevaluating existing support. 2005.
[Lu12] Lünendonk: Führende Wirtschaftsprüfungs- und Steuerberatungs-Gesellschaften inDeutschland 2011. 2012.
[Ma00] Maijoor, S.: The Internal Control Explosion. International Journal of Auditing. 4,2000, pp. 101–109.
[MTJ10] Mili, H., Tremblay, G., Jaoude, G.B., Lefebvre, É., Elabed, L., Boussaidi, G.E.: Busi-ness process modeling languages: Sorting through the alphabet soup. ACM Comput.Surv. 43, 2010; pp. 4:1–4:56.
[Mo79] Moriarity, S.: Communicating Financial Information Through MultidimensionalGraphics. Journal of Accounting Research. 17, 1979, pp. 205–224.
[MSB08] Morrison, R.L., Stokes, S.L., Burton, J., Caruso, A., Edwards, K.K., Harley, D.,Hough, C., Hough, R., Lazirko, B.A., Proudfoot, S.: Writing and Revising Question-naire Design Guidelines. U.S. Census Bureau. 2008.
[MSP13] Mueller-Wickop, N., Schultz, M., Peris, M.: Towards Key Concepts for Process Au-dits – A Multi-Method Research Approach. Proceedings of the 10th ICESAL, Utrecht,The Netherlands, 2013; pp. 70–92.
[Op00] Oppenheim, A.N.: Questionnaire Design, Interviewing and Attitude Measurement.Continuum International Publishing Group, 2000.
[PHG12] Pike, A.W.G., Hoffmann, D.L., García-Diez, M., Pettitt, P.B., Alcolea, J., Balbín,R.D., González-Sainz, C., Heras, C. de las, Lasheras, J.A., Montes, R., Zilhão, J.: U-Series Dating of Paleolithic Art in 11 Caves in Spain. Science. 336, 2012; 1409–1413.
[PK93] Pinsonneault, A., Kraemer, K.L.: Survey research methodology in management infor-mation systems: an assessment. Journal of Management Information Systems. 1993;pp. 75–105.
[PLM04] Palvia, P., Leary, D., Mao, E., Midha, V., Pinjani, P., Salam, A.F.: Research Method-ologies in MIS: An Update. Communications of the Association for Information Sys-tems. 14, 2004.
[PP23] Pacioli, L., Paganini, P.: Summa de arithmetica geometria. Proportioni: et proportion-alita.. [By L. Pacioli]. per esso Paganino di nouo impressa (1523).
[Pu89] Purvis, S.E.C.: The effect of audit documentation format on data collection. Account-ing, Organizations and Society. 14, 1989; pp. 551–563.
[RWS10] Racz, N., Weippl, E., Seufert, A.: A Frame of Reference for Research of IntegratedGovernance, Risk and Compliance. In: Decker, B. and Schaumüller-Bichl, I. (eds.)Communications and Multimedia Security. Springer, Heidelberg, 2010; pp. 106–117.
[Sa11] Sadiq, S.: A Roadmap for Research in Business Process Compliance. In: Abramowicz,W., Maciaszek, L., and Węcel, K. (eds.) Business Information Systems Workshops.Springer, Berlin Heidelberg, 2011; pp. 1–4.
[SFE02] Schonlau, M., Fricker, R.D., Elliott, M.N.: Conducting research surveys via e-mail andthe web. Rand, Santa Monica, CA, 2002.
[Sm97] Smith, C.B.: Casting The Net: Surveying an Internet Population. Journal of Computer-Mediated Communication. 3, 1997.
[SMN12] Schultz, M., Mueller-Wickop, N., Nuettgens, M.: Key Information Requirements forProcess Audits – an Expert Perspective. Proceedings of the 5th International Workshopon Enterprise Modelling and Information Systems Architectures (EMISA), Vienna,Austria, 2012; pp. 137–150.
[So02] Sarbanes, P.S., Oxley, M.G.: Sarbanes-Oxley Act of 2002. 745, 66, 2002.
208

Conceptual Model of Accounts
Closing the Gap between Financial Statements andBusiness Process Modeling
Niels Müller-Wickop, Markus Nüttgens
University of HamburgMax-Brauer-Allee 60, Hamburg
{niels.mueller-wickop | markus.nuettgens}@wiso.uni-hamburg.de
Abstract: A comprehensive understanding of business processes is crucial for anin-depth audit of a company’s financial reporting and regulatory compliance.Recent major financial scandals impressively demonstrate the insufficiency oftoday’s audit methods. The most discussed method for improving the current stateof things are process audits because well-controlled business processes lead tocorrect preparation, presentation, and disclosure of financial statements. In anattempt to improve the support of business process auditors, we present aconceptual model to close the gap between processes and their financial impacts.This conceptual model introduces accounts and associated booking-items makingfinancial impacts visible. It is then integrated into the meta-model of a businessprocess modeling language, namely the extended event-driven process chain.Moreover, this paper demonstrates an exemplary implementation with notationalelements supporting the visualization of financial impacts. The paper ends with aquestionnaire-based expert evaluation revealing that the proposed artifact ispositively assessed overall.
Keywords: Conceptual Model of Accounts, Financial Impacts, eEPC Extension,BPML Extension
1 Introduction
Enterprise Resource Planning Systems (ERP) are complex and integrated systems usedin most organizations worldwide. By now, organizations are strongly dependent on thesesystems since they not only manage the majority of data, but also support nearly all ofthe business processes. Along with the automation, the complexity of processesincreases. In most countries worldwide, auditors are obliged by law to audit businessprocesses relevant to financial reporting. For instance, the International Standards onAuditing (ISA) 315.81 require that: “(…) the auditor should obtain an understanding ofthe information system, including the related business processes, relevant to financialreporting (...)” [IFAC10]. Correctness of annual statements is vital to the business worldas for instance investment decisions are based on them. However, widely recognized
209

cases of corporate fraud and bankruptcy including Enron (2001), MCI WorldCom(2002), Satyam (2009), and Olympus (2011) demonstrate the inability of auditors toprovide reasonable assurance over financial statements. In order to master this challenge,auditors apply the following three approaches: 1. Business risk audit [Be97] 2. Technicalsupport of auditors [BD03] 3. Process audit [Ru03]. However, only the first method isfully implemented in current audit approaches. Technical support of auditors is stilllagging behind since documentation and mass-data analysis are broadly supported bytools while other tasks mostly remain unsupported (e.g. calculation of materiality for“material classes of transactions” [Re01] or scoping of relevant processes). Especially,the third method – process audits – lacks support. This method demands a supportiverepresentation of business processes [Bo11] as auditors provide assurance increasinglybased on business processes [HK10]. In his roadmap for research in business processcompliance, Sadiq noted that “tools and methods are needed to annotate, enhance,analyze and simulate business models with compliance and risk modeling elements”[Sa11]. Based on the assumption that well-controlled business processes lead to correctpreparation, presentation, and disclosure of financial statements, the most discussedmethod for improving the current state are process audits. That is because processesdetermine the financial statements. Therefore, it is of great importance for auditors tolink financial impacts of processes to the financial statements in order to give assuranceover financial statements. Moreover, in order to focus on relevant processes only, socalled material processes need to be identified. Relevance (or materiality in this case) isdefined as a certain predetermined threshold. This threshold is expressed in monetaryunits. Until now the link between processes and their financial impacts was not existentand therefore only vague knowledge about the actual connection between processes andtheir activities on the one side and financial impacts on the other side existed. Thisresults in selection of irrelevant processes (from an audit perspective). In the end,supreme process compliance checking technics are of no use if applied to the wrong/notmaterial processes. This aspect has been widely neglected by the academic communityuntil now, leaving a significant gap. Consequently, Alencar et al. call to close themissing link between business processes and financial statements [Al08]. Thedevelopment of Financial Process Mining (FPM) constitutes a first step towards closingthis gap [GM10a], [GM10b] – capable of automatically mining processes andcorresponding financial flows from ERP data. However, the results of FPM are graphs indatabases, not being appropriately graphically represented. Kharbili noted that agraphical notation for modeling compliance, like financial impacts of processes, willhelp endorse existing audit approaches [Kh08]. FPM does not fulfill this requirement. Asa result, the deplorable state of affairs persists in which auditors are still not able to closethe gap between business processes and the financial statements of a company. Thus, athorough detection of faulty processes is still not possible and accounting scandals aswell as misguided investments are still likely.
To close this gap, the paper at hand presents a conceptual model of accounts as a basisfor linking business processes and accounts. Recent research confirms that accounts areamong the most important concepts in the course of process audits [Sc12], [Mu13]. Theconceptual model represents a possible extension to existing business process modeling
210

languages (BPML) to incorporate financial flows in process models. Thus, financialimpacts of business processes become evident, supporting the auditor in his everydaywork and enabling him to provide a higher level of assurance. This, in turn, results in asmaller likelihood of corporate fraud or even bankruptcy.
The financial impacts of business processes in focus here logically require the utilizationof a modeling language for visualizing business processes. Business process modelinglanguages (BPML) have been developed for this purpose. However, no existing BPMLcombines process flows with financial impacts respectively postings to accounts. Thelatter represent financial impacts in the world of accounting: every activity in anorganization with a financial impact mandatorily results in a posting to one to manyaccounts. For this reason, the paper at hand uses the expressions “financial impact” and“posting/booking to accounts” synonymously. In order to set a sound and broadfoundation for a rigorous extension of BPMLs, this paper presents a conceptual model ofaccounts as a first step. Second, as an evaluation regarding the feasibility, the conceptualmodel will be inserted into the meta-model of one of the most widely spread BPMLs[MN06], [Pe08], [Aa99], namely eEPC [Ke92]. By this means, processes posting toaccounts become evident and accordingly their financial impact. In conclusion, anexample will evaluate the feasibility of the proposed extension.
The next section provides background information and describes related research, whileSection 3 presents the conceptual model of accounts. Subsequent sections make use ofthis to extend the eEPC meta-model and introduce new notational elements. Section 6presents an example process. The following section describes the results of thequestionnaire-based evaluation. The paper ends with a conclusion and implications forfuture research work.
2 Background and Related Research
Due to the objective of this paper, the following paragraphs present a brief summary ofconceptual modeling, BPML extensions, and first attempts to integrate accounts intoBPM approaches. The literature review is based on a pivotal review. Due to restrictionsin space this research work restrains from describing the approach in detail (for detailsplease refer to [Br09], [LE06], and [WW02b]).
Conceptual modeling has been one of the core tasks within the information systems fieldfor over 30 years. It involves the domain-specific construction of models for certainphenomena [WW02a]. Among other purposes, the facilitation of understanding andcommunication between stakeholders is most important [Si04]. Early approachesprimarily focus on the organization’s data. For instance, Smith and Smith introduced thenotion of generalization in database modeling according to the concept of strictinheritance in 1977 [SS77]. These initial approaches only consider processes as far asthey interact with data [Re09]. This covers only half of the paper´s purpose: accountentries can be understood as data. However, their corresponding processes need to betaken into account as well in order to fully cover the extent of process audits. In recenttimes, the application range of conceptual modeling has broadened. Uses now
211

comprehensively include processes and their diverse in- and outputs, leading to the socalled process-aware perspective on information systems [Du05]. This broaderperspective on conceptual modeling – including associated processes – is the foundationfor the conceptual modeling of business processes, namely process modeling whichforms the basis to this work [Re09].
Business process modeling is characterized by numerous fields of application which arepromising in business practices. Consequently, research on business process modelinghas attracted increasing attention in academia for the last 20 years. However, the long-discussed possible insufficient expressiveness of modeling languages [RD07] and thelack of coverage of all requirements demands the utilization of extensions. Theunderlying literature review comprises noteworthy BPML extensions in the field ofcompliance. There were great expectations that within the scope of compliance incombination with BPML extensions, similar approaches would already have beenpublished. These could have been used as a blueprint to the approach presented here.Unfortunately no such work could be identified. The literature review identified 55relevant articles focusing on BPML extensions. In order to evaluate these articles, thereview considered three categories - Type, Language, and Topic. The latter two did notinclude subcategories, whereas Type comprises meta-model extensions and notationalextensions. Regarding the objective of this paper, the category of Type is of greatimportance. This is because auditors need suitable graphical representation (notationalelements) along with a rigorous and sound implementation that is comprehensible forthird parties (meta-model). The category of Languages is of relevance because of thegreat differences between the usability and expressiveness of BPMLs [RD07]. However,in the course of research presented here, the category Topic is most interesting. A total of29 articles focus on non-functional extensions, 18 make functional extensions theirobjective, and 5 map one BPML to others. Within functional extensions, the majority ofpublications add either configurable modeling elements, or new classes of connectors.Another well- represented group of functional extensions propose semantics for thelanguages, whereas non-functional extensions consider all kind of performance aspects(e.g. lead time), quality requirements (e.g. data quality), resource aspects (e.g.responsibility of departments), and compliance aspects. The last group of extensionsprimarily focus on the security and controls of processes [AW10], [AW11], [Fr12],[Mi08], [Ro07], [Sc10], [WS07]. From an audit perspective, the latter aspects are closelyrelated to the topic of financial impacts of processes. Controls often require theconsideration of financial flows. However, the integration has been neglected so far. Inother words, the integration of financial accounts has not been considered in BPMLextensions.
Apart from that, accounts are only rarely discussed in business process management(BPM) literature. The two most recognizable publications are those by Karagiannis et al.[Ka07] and vom Brocke et al. [Br11]. Besides those publications, Namiri et al. consideraccounts but only the portion of it that interacts with process controls [NS08] [NS07].They call to “identify all relevant business processes that affect those (significantaccounts) accounts” [NS08]. Yet, they do not describe how to identify significantaccounts. The publication by Karagiannis et al. takes a controls-focused complianceperspective as well. They state, that “some accounts affect financial reporting and
212

therefore also need to be controlled”. Vom Brocke et al. primarily focus on process-oriented accounting. Both publications form a basis for the paper at hand. However, theyremain on an abstract level, incorporating the concept of accounts into meta-models onlydefining accounts as an abstract object without sub-concepts. Therefore, the followingsection proposes a conceptual model of accounts with sub-concepts. In addition, anextension to the eEPC meta-model including modeling instructions and an example forthe missing concept of accounts is given.
Besides the afore-mentioned publications further research was taken into account:(Everest & Weber 1977) (Wand & Weber 2002) (Shahwan 2011)( McCarthy 1979)(McCarthy 2003) (Du & Wang 2011). But again, their work can only be used as afoundation for two reasons: firstly, financial aspects are incorporated in their models buton a data centric perspective (mostly ER-models) rather than on a process oriented view(e.g. EPCs). Secondly, although their work is object oriented the central object ismissing (bookings / account entries). As has already pointed out, this suggestion forimprovement has been integrated in the paper at hand.
3 Conceptual Model of Accounts
Accountants worldwide use the concept of accounts for their everyday work. Virtuallyall booking techniques base on accounts, e.g. double-entry book keeping or fiscalaccounting. Consequently, the concept of accounts and corresponding sub-concepts arehighly standardized [El85]. This standardized – and to the authors knowledge only –representation of accounts is used as a basis. As this paper aims at closing the gapbetween business process modeling and financial impacts, it takes advantage of thisstandardization by introducing a conceptual model of accounts in the context of BPMLs.As vom Brocke and Buddendick call for reusable conceptual models [BB96], theconceptual model presented here facilitates reuse by clearly indicating on how asubsequent integration into different BPMLs is possible. This is achieved by introducingconnection classes to BMPLs within the conceptual model, viz. Group and Data. MostBPMLs readily provide these classes. For this reason, the conceptual model of accountsuses theses as connection classes.
Figure 1 depicts the general structure of accounts in as UML class diagram [OMG11b].The conceptual model incorporates the classes Account, DebitAndCredit, AccountEntry,and Balance. Furthermore, the model depicts the general BPML concepts of Group andData.
213

Account
accountNo: IntegeraccountName: StringisOpenItemAccount: BooleanisPnLAccount: Boolean
AccountEntry
amount: Double
DebitAndCredit
GroupName: stringisDebit: Boolean
Balance
sumOfBalance: DoubleisDebitBalance: Boolean
10..*
0..*
Debit
Credit
1
CreditSide
DebitSide
CreditBalance
DebitBalance
1
1
1
1 1
1
1
1
CreditSide
Group
Data
Figure 1: Conceptual Model of Accounts
Accounts are groups including two DebitAndCredit groups. Thus, both (sub-) conceptsresp. classes are child classes of Group. These classes have attributes according to theirusage in the accounting domain. Accounts own names (attribute: accountName), aunique identifier (attribute: accountNumber), are either involved in open item accountingor not (attribute: isOpenItemAccount), and are either profit and loss or balance sheetaccounts (attribute: isPnLAccount). The DebitAndCredit class provides a name(attribute: GroupName) and a boolean value defining its being a debit or credit group(attribute: isDebit). Each Account exactly contains one credit and one debit group. Thesedebit and credit groups include none to many so-called account entries (class:AccountEntry). Account entries are bookings or, in technical terms: entries in thedatabase of a system. Therefore, an account entry will be a child class of Data. Nearlyall BPMLs include the concept of Data. AccountEntry owns the attribute amount (=value of the account). In addition, the conceptual model adds a credit and a debit balance(class: Balance) for the quick recognition of the transaction volume of each account.Balance again is a child class of Data and has the attributes sumOfBalance andisDebitBalance.
4 Extending the eEPC Meta-Model
This section demonstrates how to implement the concept of accounts into a BMPL as afirst evaluation regarding feasibility. For that purpose, the approach extends the eEPC,one of the two most widespread BPMLs (the other being BPMN by now [OMG11a]).The approach is generalizable and therefore transferable to other BPML. In order toextend the eEPC in a sound and rigorous way, the extension proposes a meta-modelextension. Moreover, this approach can be understood as a manual for the transfer of theextension to other BPMLs.
This paper uses the most recognized and comprehensive meta-model of the eEPCpublished by Korherr et al. [KL07] due to the fact that no standardization committee is incharge for the (e)EPC and no standardized meta-model is provided by the firstpublications of the eEPC. It is derived from the ARIS House meta-model [SN00].
214

Figure 2 depicts the eEPC meta-model (light classes) including the proposed concept ofaccounts (dark classes). As Section 3 already described, the conceptual model ofaccounts has two connection classes: Group and Data. The eEPC meta-model providesone of these two necessary classes – but the concept of Groups is not yet implemented ineEPCs. Moreover, the literature review revealed that until now no extension of the EPCwith the concept of Groups has been implemented.
For this reason, the concept of Groups is implemented in the meta-model as a first step.Following the BPMN2.0 Standard [OMG11a], these groups provide a visual mechanismto cluster elements of the eEPC without affecting the process flow. They offer thepossibility to include one to many elements of all provided eEPC elements. Groups areoften used to highlight certain areas of a model without providing additionalfunctionality. The grouped elements can be separated for reporting and in-depth analysispurposes. In order to implement these properties Group is an aggregation of the classEPC and it is associated with the classes Function and Event (“is grouped in”).Additionally, it is the parent class to Account and DebitAndCredit. Thereby, theextension is halfway integrated. The second connection to the eEPC meta-model is theimplementation of the classes AccountEntry and Balance as child classes ofInformationObject, which represents the class Data of the conceptual model of accountsin the eEPC meta-model. This linkage ensures the connection between functions (part ofthe process) and account entries, thereby ensuring the visibility of financial impacts ofprocesses. This two-staged approach is transferable to other BPML. It represents arigorous way of implementing the proposed concept of accounts into meta-models. Thisin turn ensures an unambiguous usage of the new (sub-) concepts. Moreover, the generalconcept of Groups is usable in eEPCs.
215

eEPC
Elementary
Function
Function
Event
start:Boolean
intermediate:Boolean
end:Boolean
trigger:Boolean
Complex
Function
ControlFlow
Connector
ProcessGoal
Organizational
Structure
GoalConnector
Organisation
Role
Organisational
Unit
Additional
ProcessObject
Information
Object
Deliverable
Input/Output
Flow
Connector
DataFlow
Connector
Organizational
Flow
Connector
Flow
Connector
Logical
Operator
XOR
OR
AND
Account
accountNo:Integer
accountName:String
isOpenItemAccount:Boolean
isPnLAccount:Boolean
AccountEntry
amount:Double
DebitAndCredit
groupName:string
isDebit:Boolean
Balance
sumOfBalance:Double
isDebitBalance:Boolean
1
0..*
0..*
Debit
Credit
1
CreditSide
DebitSide
CreditBalance
DebitBalance
1..*
1..*
1..*
1..*
1..*
1..*
1..*
0..*
0..*
0..*
Group
1..*
0..*
2..*
predecessor
predecessor
sucessor
sucessor
event
0..1
1..2
2
3..*
0..2
0..*
isassignedto
refinedby
isconnectedwith
isconnected
with
1..*
0..*
refinedby
1
1..*isconnected
with
1
1..*isconnected
with
1
1..*isconnected
with
SubGoals
1..*
0..*
1
1..*isconnected
with
1..*
1..*
0..1
11
1 1
11
11
hastofulfil
isconnected
with
isgroupedby
isgroupedby
Figure 2: Extended eEPC Meta-Model
216

5 Extending the eEPC Notation
As eEPCs constitute a graphical modeling language [Aa99], a notational extension isnecessary. Groups are new notational elements in eEPCs. The extension proposes boxeswith doted and solid lines for their representation. Account entries as well as credit anddebit balances are represented by the same notational elements as information objects inorder to keep the look-and-feel of eEPCs. However, every information object in anaccount group either represents a debit or credit balance and every information object ina debit or credit group is an account entry. For details please refer to Table 1.
Table 1: New and modified eEPCs Elements
ParentClass
Symbol Description
Gro
up
AccountBased on the attribute isPnLAccount each account displayswhether it is a profit and loss account (PnL sign in the topright corner) or a balance sheet account (BS sign in the topright corner). Furthermore, depending on the value of theattribute isOpenItemAccount, the frame of an account is eitherdoted (= account involved in open item accounting) or solid(= account not involved in open- item accounting).
Credit / DebitThe Debit and Credit groups have two attributes, the firstbeing isDebit, defining if it’s a debit or credit group. Exactlyone of each group is always part of an Account. The secondattribute defines the name (groupName).
Info
rmat
ion
Obj
ect
AccountEntriesAccount entries always display the attribute amount,representing the value of each item.
DebitBalance / CreditBalanceThe DebitBalance and CreditBalance information objects areassociated with one function. They display the amount of allassociated debit or credit items. As the associated functionneeds updating the balance each time a posting is done, it firstqueries the previous amount. Hence, the association is a two -sided arrow.
217
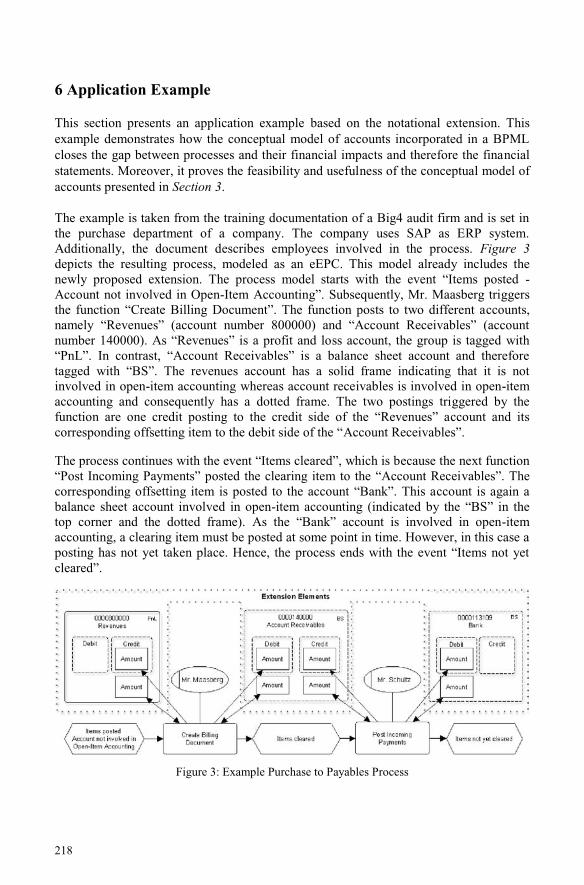
6 Application Example
This section presents an application example based on the notational extension. Thisexample demonstrates how the conceptual model of accounts incorporated in a BPMLcloses the gap between processes and their financial impacts and therefore the financialstatements. Moreover, it proves the feasibility and usefulness of the conceptual model ofaccounts presented in Section 3.
The example is taken from the training documentation of a Big4 audit firm and is set inthe purchase department of a company. The company uses SAP as ERP system.Additionally, the document describes employees involved in the process. Figure 3depicts the resulting process, modeled as an eEPC. This model already includes thenewly proposed extension. The process model starts with the event “Items posted -Account not involved in Open-Item Accounting”. Subsequently, Mr. Maasberg triggersthe function “Create Billing Document”. The function posts to two different accounts,namely “Revenues” (account number 800000) and “Account Receivables” (accountnumber 140000). As “Revenues” is a profit and loss account, the group is tagged with“PnL”. In contrast, “Account Receivables” is a balance sheet account and thereforetagged with “BS”. The revenues account has a solid frame indicating that it is notinvolved in open-item accounting whereas account receivables is involved in open-itemaccounting and consequently has a dotted frame. The two postings triggered by thefunction are one credit posting to the credit side of the “Revenues” account and itscorresponding offsetting item to the debit side of the “Account Receivables”.
The process continues with the event “Items cleared”, which is because the next function“Post Incoming Payments” posted the clearing item to the “Account Receivables”. Thecorresponding offsetting item is posted to the account “Bank”. This account is again abalance sheet account involved in open-item accounting (indicated by the “BS” in thetop corner and the dotted frame). As the “Bank” account is involved in open-itemaccounting, a clearing item must be posted at some point in time. However, in this case aposting has not yet taken place. Hence, the process ends with the event “Items not yetcleared”.
Figure 3: Example Purchase to Payables Process
218

The experts confirmed the following advantages (see Section 7) demonstrated in theexample:
1. All accounts posted to by the process are evident. This is accomplished by theunambiguous link between functions and items, which again are clearly assigned toaccounts.
2. Activities with a financial impact are visible. Again, this is caused by the linkbetween functions and items. Each function linked to an information object in anaccount group (= accounting item) has a financial impact.
7 Evaluation
Venable et al. present a comprehensive framework for the selection of an evaluationmethod [Ve12]. A choice was made based on this framework: having a socio-technicalartifact potentially relevant for diverse stakeholders and planning on the evaluation withdifferent methods, a naturalistic ex-post evaluation strategy appears appropriate. As afirst step, 17 domain experts were consulted with a questionnaire-based survey. Theselection of domain experts followed the purposeful sampling approach described byPatton for the selection of experts. A combination of type five “Typical Case Sampling”and six “Stratified Purposeful Sampling” was used [Pa90], p. 182. Thereby, two criteriadefined the sampling population. First, the individual must be familiar with processaudits. The expertise required for process audits combines accounting as well as processknowledge, both of which are needed to evaluate the BPML extension presented here.Second, the sampling procedure defined persons with a work experience of more thanfive years in the business process audit domain as experts. For further information on theexperts please refer to [Sc12]
The questionnaire presented four statements and asked the expert to evaluate it on a five-option Likert-Scale along with a detailed narrative description of their assessment. Eachstatement examined a characteristic of the BPML extension. The questionnaire inquiredon the following characteristics:
1. Completeness: The business process model comprises all relevant information in thecontext of financial impacts on accounts.
2. Suitability: The artifact corresponds to a mutual understanding of accounts.3. Usability: Improvement compared to the current state regarding the representation of
financial impacts on accounts – regardless if current practice includes graphicalmodels or not.
4. Perceived added value: The expert was asked to give his expert opinion on thesuspected added value.
The survey revealed that all 17 experts assessed the artifact positively overall. Regardingthe characteristic completeness, a few experts mentioned notational aspects that could beadded (indicator for active/ passive accounts, distinction between profit and lossaccounts, ledger type of the account, chart of account, and currency). As these only
219

constitute minor changes, the next evaluation cycle might consider them. Their inclusionwill be based on an investigation into the balance between provided information and theconcomitant possible cognitive overload. Assessing the characteristic suitability, allexperts emphasized the explicit presentation of accounts and the linkage tocorresponding processes. Regarding the characteristic usability, two experts made thesuggestion to distinguish between account types, not based on different group colors (asin the first draft) but rather on signs. This suggestion was implemented. The lastcharacteristic - perceived added value – is possibly the most subjective one. However, itseemed promising to receive a first feedback of possible users and their perception of thepossible value added. To our full satisfaction, the experts rated this category alsopositively. They stated that the applied accounting procedure becomes more obvious anda general view is provided by the BPML extension. According to the experts, the latterwill provide a good starting point for process audits.
8 Limitations and Future Work
The evaluation of this research work implies certain limitations. As the evaluation ofSection 7 only represents an explorative first step, the next evaluation cycle will focusspecific characteristics in more detail. The starting point will be the application of acomprehensive evaluation framework for the usability of modeling languages, e.g.Schalles et al. [Sc11]. Different shortcomings of the questionnaire- based evaluationshould be resolved by utilizing this framework. The objective is to tackle the followingopen questions and therefore existing limitations:
1. How much information is too much in this particular application scenario? Auditorsdemand supplementary information to business process managers in the usual sense.For this reason, previous investigations on the best possible ratio of information arepartly inappropriate.
2. Business processes can become very complex structures. The extension needs to betested with regards to large models.
3. The questionnaire only raised expert opinions based on an example process. Apossible expansion of the evaluation is towards the everyday work of auditors. Thisway the characteristic perceived added value could be determined in an inartificialenvironment.
4. The eEPC extension forms only one of the possible BPML extensions. Other BPMLscould be extended and results could be benchmarked.
Tackling these open questions in the future would contribute to a further understandingof the topic at hand.
9 Conclusion
The goal of this research was to close the gap between financial statements andprocesses by making financial impacts of transactions visible. By doing so auditors, are
220
supported in their everyday work and enabled providing a higher level of assurance inbusiness process audits, resulting in a smaller likelihood of corporate fraud or evenbankruptcy.
As no existing BPML combines process flows with financial impacts respectivelybookings on accounts, a literature review was carried out in order to examine BPMLextensions and the topic of accounts in BPM. It was established that none of theextensions would close the gap between financial impacts and processes. Regarding thetopic of accounts in BPM, two publications could be identified. However, both remainon an abstract level not proving sub-concepts for the application in the everyday work ofauditors. Consequently, this paper proposed a conceptual model of accounts in order tocombine the process flow of BPML and the financial impact of bookings. This modelprovides two connection classes in order to integrate the general conceptual model inBPMLs. To demonstrate the feasibility and to evaluate the proposed extension, weintegrated it into a well-known and wide-spread BPML, viz. eEPC. We utilized themeta-model proposed by Korherr et al. and integrated the conceptual model of accountsinto it for this reason. The implementation ensures that accounts always include onedebit and one credit side. Moreover, functions of the underlying process are enabled tobook items to accounts. This assures a connection between functions and itemsrespectively accounts. Notably, nearly all experts emphasized the improved visibility offinancial impacts of processes enabled by this extension.
The contribution of this paper is threefold. First, a conceptual model of accounts withconnection classes to most BPMLs is proposed. Second, an exemplary integration in theeEPC is presented. This implementation is to be understood as an exemplary instructionon how to implement the extension to other BPMLs. Moreover, it demonstrates thefeasibility of the extension. Finally, this paper presents an evaluation based on fourdifferent characteristics, confirming the usefulness of the conceptual model of accountsas an extension to an existing BPML.
Literature
[Aa99] Van der Aalst, W.M.P.: Formalization and verification of event-driven process chains.Inf. Softw. Technol. 41, 10, 639–650, 1999.
[Al08] Alencar, P. et al.: Business Modeling to Improve Auditor Risk Assessment: AnInvestigation of Alternative Representations. Proceedings of the 14th AnnualInternational Symposium on Audit Research, ISAR. pp. 30–31, 2008.
[AW10] Awad, A., Weske, M.: Visualization of Compliance Violation in Business ProcessModels. In: Rinderle-Ma, S. et al. (eds.) Business Process Management Workshops. pp.182–193, Springer, Berlin / Heidelberg, 2010.
[Aw11] Awad, A. et al.: Visually specifying compliance rules and explaining their violations forbusiness processes. J. Vis. Lang. Comput. 22, 1, 30–55, 2011.
[BB96] Vom Brocke, J., Buddendick, C.: Reusable conceptual models–requirements based onthe design science research paradigm. Proceedings of the 1st International Conference onDesign Science Research in Information Systems and Technology (DESRIST 2006),Claremont. pp. 576–604, 2006.
221

[BD03] Braun, R.L., Davis, H.E.: Computer-assisted audit tools and techniques: analysis andperspectives. Manag. Audit. J. 18, 9, 725–731, 2003.
[Be97] Bell, T.B.: Auditing Organizations Through a Strategic-systems Lens: The KPMGBusiness Measurement Process. KPMG Peat Marwick LLP, Montvale N.J., 1997.
[Bo11] Boritz, J.E. et al.: The Effects of Business Process Representation Type on theAssessment of Business and Control Risk: Diagrams Versus Narratives. SSRNELibrary., 2011.
[Br09] Vom Brocke, J. et al.: Reconstructing the giant: on the importance of rigour indocumenting the literature search process. Proceedings of the 17th European conferenceon information systems (ECIS), 2009.
[Br11] Vom Brocke, J. et al.: Linking Accounting and Process-aware Information Systems–Towards a Generalized Information Model For Process-oriented Accounting,Proceedings of the 19th European conference on information systems (ECIS), 2011.
[Du05] Dumas, M. et al.: Process-Aware Information Systems: Bridging People and SoftwareThrough Process Technology. John Wiley & Sons, 2005.
[El85] Ellerman, D.P.: The Mathematics of Double Entry Bookkeeping. Math. Mag. 58, 4, 226–233, 1985.
[Fr12] Friedenstab, J. et al.: Extending BPMN for Business Activity Monitoring. Proceedings ofthe 45th Hawaii International Conference on System Science (HICSS). pp. 4158–4167,2012.
[GM10a] Gehrke, N., Mueller-Wickop, N.: Basic Principles of Financial Process Mining AJourney through Financial Data in Accounting Information Systems. Proceedings of the16th Americas Conference on Information Systems (AMCIS 2010). , Lima, Peru, 2010.
[GM10b] Gehrke, N., Mueller-Wickop, N.: Rekonstruktion von Geschaeftsprozessen imFinanzwesen mit Financial Process Mining. Proceedings of the Informatik, 2010.
[HK10] Heese, K., Kreisel, H.: Prüfung von Geschäftsprozessen. Wirtschaftsinformatik. 63, 18,907–919, 2010.
[IFAC10 International Federation of Accountants (IFAC): Handbook of International QualityControl, Auditing, Review, Other Assurance, and Related Services Pronouncements,2010.
[Ka07] Karagiannis, D. et al.: Business Process-Based Regulation Compliance: The Case of theSarbanes-Oxley Act. 15th IEEE Int. Requir. Eng. Conf. 2007 RE 07. 315 –321, 2007.
[Ke92] Keller, G. et al.: Semantische Prozeßmodellierung auf der Grundlage EreignisgesteuerterProzeßketten (EPK). Universität des Saarlandes, Saarbrücken, Germany, 1992.
[Kh08] Kharbili, M.E. et al.: Business Process Compliance Checking: Current State and FutureChallenges. Presented at the MobIS, 2008.
[KL07] Korherr, B., List, B.: Extending the EPC with performance measures. Proceedings of the2007 ACM symposium on Applied computing. pp. 1265–1266, 2007.
[LE06] Levy, Y., Ellis, T.J.: A systems approach to conduct an effective literature review insupport of information systems research. Informing Sci. Int. J. Emerg. Transdiscipl. 9,181–212, 2006.
[Mi08] Milanovic, M. et al.: Combining Rules and Activities for Modeling Service-BasedBusiness Processes. Enterprise Distributed Object Computing Conference Workshops,2008 12th. pp. 11 –22, 2008.
[MN06] Mendling, J., Nüttgens, M.: EPC markup language (EPML): an XML-based interchangeformat for event-driven process chains (EPC). Inf. Syst. E-Bus. Manag. 4, 3, 245–263,2006.
[Mu13] Mueller-Wickop, N. et al.: Towards Key Concepts for Process Audits – A Multi-MethodResearch Approach. Presented at the 10th International Conference on EnterpriseSystems, Accounting and Logistics (ICESAL 2013) , Utrecht, The Netherlands, 2013.
[NS07] Namiri, K., Stojanovic, N.: Pattern-Based Design and Validation of Business ProcessCompliance. In: Meersman, R. and Tari, Z. (eds.) On the Move to Meaningful Internet
222

Systems 2007: CoopIS, DOA, ODBASE, GADA, and IS. pp. 59–76, Springer, Berlin /Heidelberg, 2007.
[NS08] Namiri, K., Stojanovic, N.: Towards a formal framework for business processcompliance. Multikonferenz Wirtsch. GITO-Verl. Berl. 24–27, 2008.
[OMG11a] OMG (Object Management Group): Business Process Model and Notation(BPMN) - version 2.0, 2011.
[OMG11b] OMG (Object Management Group): Unified Modeling Language (UML)Specification 2.4.1, 2011.
[Pa90] Patton, M.Q.: Qualitative Evaluation and Research Methods. SAGE Publications, 1990.[Pe08] Pedrinaci, C. et al.: Semantic Business Process Management: Scaling Up the
Management of Business Processes. Presented at the, 2008.[RD07] Recker, J.C., Dreiling, A.: Does it matter which process modelling language we teach or
use? An experimental study on understanding process modelling languages withoutformal education. ACIS Proceedings. , Toowoomba, 2007.
[Re01] Rezaee, Z. et al.: Continuous auditing: the audit of the future. Manag. Audit. J. 16, 3,150–158, 2001.
[Re09] Recker, J.C. et al.: Business process modeling: a comparative analysis. J. Assoc. Inf.Syst. 10, 4, 333–363, 2009.
[Ro07] Rodríguez, A. et al.: A BPMN Extension for the Modeling of Security Requirements inBusiness Processes. IEICE - Trans Inf Syst. E90-D, 4, 745–752, 2007.
[Ru03] Russell, J.: The process auditing techniques guide. ASQ Quality Press, Milwaukee,2003.
[Sa11] Sadiq, S.: A Roadmap for Research in Business Process Compliance. In: Abramowicz,W. et al. (eds.) Business Information Systems Workshops. pp. 1–4, Springer, Berlin /Heidelberg, 2011.
[Sc10] Schleicher, D. et al.: Compliance scopes: Extending the BPMN 2.0 meta model tospecify compliance requirements. Service-Oriented Computing and Applications(SOCA), 2010 IEEE International Conference on. pp. 1–8, 2010.
[Sc11] Schalles, C. et al.: Usability of Modelling Languages for Model Interpretation: AnEmpirical Research Report. Wirtsch. Proc. 2011. 787–796, 2011.
[Sc12] Schultz, M. et al.: Key Information Requirements for Process Audits – an ExpertPerspective. Proceedings of the 5th International Workshop on Enterprise Modelling andInformation Systems Architectures (EMISA). pp. 137–150 , Vienna, Austria, 2012.
[Si04] Siau, K.: Informational and Computational Equivalence in Comparing InformationModeling Methods. J. Database Manag. 15, 1, 73–86, 2004.
[SN00] Scheer, A.-W., Nüttgens, M.: ARIS Architecture and Reference Models for BusinessProcess Management. In: Aalst, W. van der et al. (eds.) Business Process Management.pp. 376–389, Springer, Berlin / Heidelberg, 2000.
[SS77] Smith, J.M., Smith, D.C.P.: Database Abstractions: Aggregation and Generalization. J.ACM Trans. Database Syst. 2, 2, 105–133, 1977.
[Ve12] Venable, J. et al.: A Comprehensive Framework for Evaluation in Design ScienceResearch. In: Peffers, K. et al. (eds.) Design Science Research in Information Systems.Advances in Theory and Practice. pp. 423–438, Springer, Berlin / Heidelberg, 2012.
[WW02a]Wand, Y., Weber, R.: Research commentary: information systems and conceptualmodeling—a research agenda. Inf. Syst. Res. 13, 4, 363–376, 2002.
[WW02b]Watson, R.T., Webster, J.: Analyzing the past to prepare for the future: Writing aliterature review. MIS Q. 26, 2, xiii–xxiii, 2002.
[WS07] Wolter, C., Schaad, A.: Modeling of task-based authorization constraints in BPMN.Proceedings of the 5th international conference on Business process management. pp.64–79, Springer, Berlin / Heidelberg, 2007.
223

A Catalogue of Optimization Techniques for
Triple Graph Grammars
Erhan Leblebici∗1, Anthony Anjorin∗1, Andy Schurr2
1Technische Universitat Darmstadt
Graduate School of Computational Engineering, Germany
{leblebici, anjorin}@gsc.tu-darmstadt.de
2Technische Universitat Darmstadt
Real-Time Systems Lab, Germany
Abstract: Bidirectional model transformation languages are typically declarative, be-ing able to provide unidirectional operationalizations from a common specificationautomatically. Declarative languages have numerous advantages, but ensuring run-time efficiency, especially without any knowledge of the underlying transformationengine, is often quite challenging.
Triple Graph Grammars (TGGs) are a prominent example for a completely declar-ative, bidirectional language and have been successfully used in various applicationscenarios. Although an optimization phase based on profiling results is often a neces-sity to meet runtime requirements, there currently exists no systematic classificationand evaluation of optimization strategies for TGGs, i.e., the optimization process istypically an ad-hoc process.
In this paper, we investigate the runtime scalability of an exemplary bidirectionalmodel-to-text transformation. While systematically optimizing the implementation,we introduce, classify and apply a series of optimization strategies. We provide in eachcase a quantitative measurement and qualitative discussion, establishing a catalogueof current and future optimization techniques for TGGs in particular and declarativerule-based model transformation languages in general.
1 Introduction and Motivation
In a Model Driven Engineering (MDE) context, the bidirectionality of model transfor-
mations is a crucial requirement for important tasks such as refactoring, evolution, and
supporting the co-existence of different engineering artifacts [CFH+09]. Bidirectional
model transformation languages are typically declarative and enable a high-level specifi-
cation, which is then suitably operationalized for various application scenarios including
forward/backward transformations, and propagation of incremental updates.
∗Supported by the ’Excellence Initiative’ of the German Federal and State Governments and the Graduate
School of Computational Engineering at TU Darmstadt.
225

Triple Graph Grammars (TGGs) [KLKS10] are a prominent example for a rule-based
bidirectional language and have been successfully applied in real-world scenarios [GHN10,
HGN+13]. Declarative languages such as TGGs have numerous advantages, but meeting
runtime efficiency requirements can be quite challenging for both TGG tool developers and
transformation designers working with TGGs. Although an optimization phase based on
profiling results is, therefore, often a necessity, there currently exists no systematic classi-
fication and description of optimization techniques for TGGs in particular and declarative
rule-based model transformation languages in general.
In this paper, we investigate the runtime scalability of an exemplary model-to-text round-
trip implemented with TGGs. We take our example from the domain of textual Domain
Specific Language (DSL) development and establish a DSL for describing the persistency
layer of a mobile application.
Our contribution is to establish a catalogue for TGG optimization techniques, useful for
both TGG tool developers and transformation designers, by:
• Identifying the TGG as a bottleneck in our transformation chain. This is an impor-
tant result and motivation for our optimization techniques as a typical model-to-text
transformation consists of several complex components and it is a priori unclear
what exactly must be optimized. We use standard, mature parser and unparser tech-
nology (ANTLR [Par07] and StringTemplate [Par04], respectively) to provide a re-
alistic comparison. This is presented together with our running example in Sect. 2.
• Suggesting a generic format for presenting current and future optimization tech-
niques for TGGs (Sect. 3).
• Systematically applying a series of diverse optimization techniques to our TGG im-
plementation with a quantitative measurement of improvement in runtime and a
qualitative analysis in each case. The optimization techniques are demonstrated in
Sect. 4 – 7 using our suggested presentation format.
We conclude with a brief review of related work in Sect. 8 and future work in Sect. 9.
2 Running Example
Our application scenario is taken from the domain of textual DSL development, and re-
quires a model-to-text round-trip which is implemented with TGGs. The goal is to es-
tablish a compact textual DSL with which an end-user can describe the persistency layer
of a mobile application. The DSL is used to generate Java and Objective-C code for
Android and iOS platforms, respectively, from a common specification increasing pro-
ductivity and maintainability. Our round-trip scenario is part of an industrial coopera-
tion, simplified for presentation purposes, and comprises besides bidirectional transfor-
mations with TGGs, also unidirectional transformations with Story Driven Modelling1
(SDMs) [FNTZ00]. Using our framework2, the transformation chain depicted in Fig. 1 can
1A unidirectional model transformation language via programmed graph transformation.2http://www.emoflon.org/
226
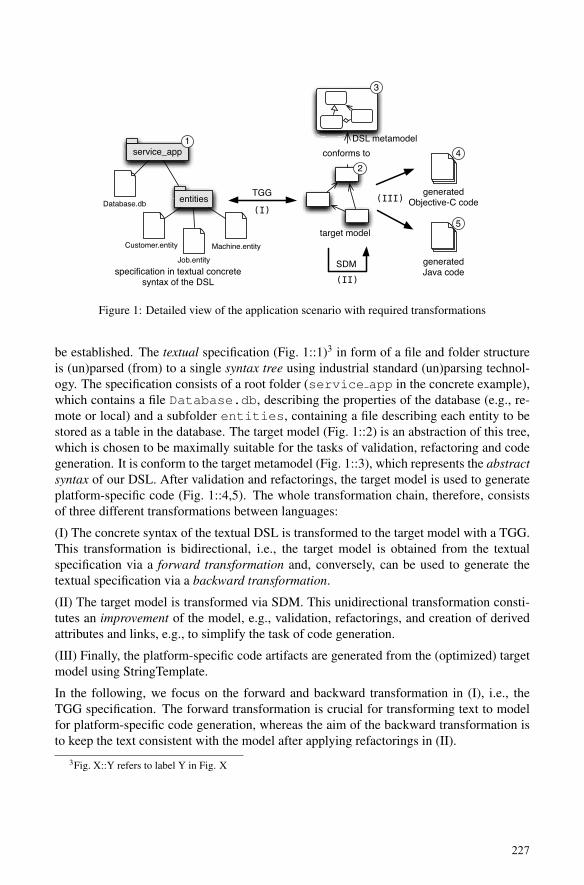
service_app
entitiesDatabase.db
Customer.entityJob.entity
Machine.entity
specification in textual concretesyntax of the DSL
target model
generatedObjective-C code
generatedJava code
DSL metamodel
TGG
SDM
1
2
3
4
5(I)
(II)
(III)
conforms to
Figure 1: Detailed view of the application scenario with required transformations
be established. The textual specification (Fig. 1::1)3 in form of a file and folder structure
is (un)parsed (from) to a single syntax tree using industrial standard (un)parsing technol-
ogy. The specification consists of a root folder (service app in the concrete example),
which contains a file Database.db, describing the properties of the database (e.g., re-
mote or local) and a subfolder entities, containing a file describing each entity to be
stored as a table in the database. The target model (Fig. 1::2) is an abstraction of this tree,
which is chosen to be maximally suitable for the tasks of validation, refactoring and code
generation. It is conform to the target metamodel (Fig. 1::3), which represents the abstract
syntax of our DSL. After validation and refactorings, the target model is used to generate
platform-specific code (Fig. 1::4,5). The whole transformation chain, therefore, consists
of three different transformations between languages:
(I) The concrete syntax of the textual DSL is transformed to the target model with a TGG.
This transformation is bidirectional, i.e., the target model is obtained from the textual
specification via a forward transformation and, conversely, can be used to generate the
textual specification via a backward transformation.
(II) The target model is transformed via SDM. This unidirectional transformation consti-
tutes an improvement of the model, e.g., validation, refactorings, and creation of derived
attributes and links, e.g., to simplify the task of code generation.
(III) Finally, the platform-specific code artifacts are generated from the (optimized) target
model using StringTemplate.
In the following, we focus on the forward and backward transformation in (I), i.e., the
TGG specification. The forward transformation is crucial for transforming text to model
for platform-specific code generation, whereas the aim of the backward transformation is
to keep the text consistent with the model after applying refactorings in (II).
3Fig. X::Y refers to label Y in Fig. X
227

2.1 Implementation with TGGs
TGGs are a rule-based, declarative technique for specifying the simultaneous evolution
of two models, together with an additional correspondence model for traceability. The
set of rules thus describes a language of triples of related models (graphs) in a generative
manner, hence the term triple graph grammar. A TGG can be best viewed as a consistency
relation on triples of source, correspondence and target models in the following manner:
a triple of connected source, correspondence and target models is consistent, if and only
if it can be generated with a sequence of rules of the TGG. The advantage of specifying
such a high-level consistency relation is that numerous operational transformations can
be automatically derived: A forward transformation parses a source model and creates
a correspondence and target model such that the resulting triple is consistent, while a
backward transformation parses a target model and creates a correspondence and source
model. As a single specification is used for the derivation, the forward and backward
transformations are always consistent with each other.
Specifying a TGG starts with declaring the semantic equivalence between the different
concepts of the source and target languages. In practice, this is accomplished with a TGG
schema, a metamodel triple of the source, correspondence and target domains as depicted
in Fig. 2. The source metamodel on the left is a simple tree with concepts for Folders,
Files and Nodes. The target metamodel consists of an abstract Database type, with
Local and Remote as concrete subtypes with additional attributes (not shown explic-
itly). Databases contain arbitrary many Entities (e.g., customer, job, machine),
which in turn contain Properties (e.g., name, address, id). The extends relation
between two Entities is used to enable reuse of entity specifications, i.e., an entity
can extend existing entities and, by doing so, combine and extend their properties. The
correspondence metamodel in the middle, with types depicted as hexagons to differentiate
them visually from source and target types, specifies which source and target elements are
related, e.g., that a File is semantically equivalent to either a Database or an Entity
(both concepts are specified with individual files in the textual DSL, cf. Fig. 1).
Folder
File
Node
DatabaseLocal
Remote
Entity
Property
FileToDatabase
FileToLocal FileToRemote
FileToEntity
NodeToProperty
NodeToEntity
TreeElement
Text
source
1
folder 1
file 0 ..*
fi le 1
rootNode 1
parentNode
1children
0 ..*
entity 0 ..*
parentFolder 1
subFolder 0..*
extends 0..*
target1
target
1
source1 target 1
source1target
1
source1 property 0 ..*
Figure 2: TGG schema for the model-to-text scenario
228

Declarative TGG rules are used to define the actual language of the TGG, i.e., the set
of model triples consisting of connected source, correspondence and target models, which
can be created by using the specified rules. A TGG rule consists of context elements (black
without any markup) stating the pre-condition, which must hold in order to apply the rule,
and created elements (green with a “++” markup) stating the post-condition, which must
hold after the rule is applied. TGGs are declarative as the user does not specify how this
should be achieved (no explicit order of rule application is given).
Figure 3 depicts one of the TGG rules required to implement our scenario. This rule maps
the extends reference between two Entities to a Node (named SUPER TOKEN)
with a child Node representing the name of the extended Entity. This rule requires the
two Entities and their related Files as context. The attribute constraint eq(ex-
tendedName.name, entity2.name) requires that the name of the created node
extendendedName in the tree be equal to the name of the extended entity entity2
in the model. The complete set of TGG rules consists of 5 rules.
entityName1: Node
extendsNode : Nodename == "EXTENDS_TOKEN"
superNode : Nodename := "SUPER_TOKEN"
++
extendedName : Node
++
entityFile1 :File
entityFolder :Folder
entityFile2 :File
entityName2 :Node
entity1 :Entity
fileToEntity1 :FileToEntity
entity2 :Entity
fileToEntity2 :FileToEntity
{eq(extendedName.name, entity2.name)}name
name
target
source
targetsource
++
extends
rootNode
file
file
folder
folder
file
filerootNode
parentNode++ children
parentNode++ children
parentNode
children
Figure 3: TGG rule creating an extends relationship and corresponding tree structure
2.2 Runtime Measurements
Runtime results for this initial implementation are depicted in Fig. 4. All measurements
were repeated 10 times (the median is shown in the plot) and executed on Windows 7
x64 with an Intel i5-3550 (3.30 GHz) processor and 8 GB memory. The x-axis shows the
number of elements in the target model and ranges from 1000 to 20000. The black vertical
dashed line is used here and in the rest of the paper to indicate a change in step size (a
change from 1000 to 10000 in Fig. 4). The y-axis shows the time required for each single
transformation in seconds using a logarithmic scale. Confidence intervals are not depicted
as there was practically no significant difference between measurements.
229
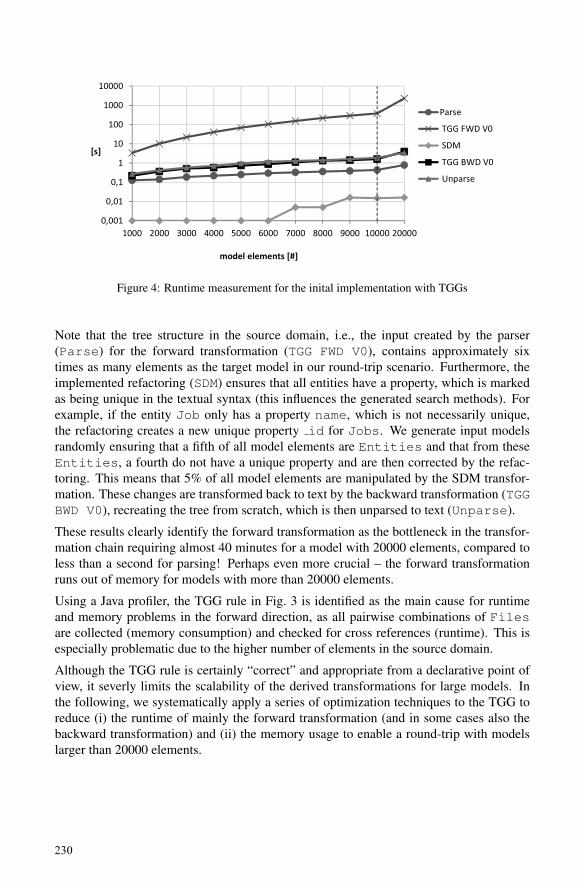
0,001
0,01
0,1
1
10
100
1000
10000
1000 2000 3000 4000 5000 6000 7000 8000 9000 10000 20000
[s]
model elements [#]
Parse
TGG FWD V0
SDM
TGG BWD V0
Unparse
Figure 4: Runtime measurement for the inital implementation with TGGs
Note that the tree structure in the source domain, i.e., the input created by the parser
(Parse) for the forward transformation (TGG FWD V0), contains approximately six
times as many elements as the target model in our round-trip scenario. Furthermore, the
implemented refactoring (SDM) ensures that all entities have a property, which is marked
as being unique in the textual syntax (this influences the generated search methods). For
example, if the entity Job only has a property name, which is not necessarily unique,
the refactoring creates a new unique property id for Jobs. We generate input models
randomly ensuring that a fifth of all model elements are Entities and that from these
Entities, a fourth do not have a unique property and are then corrected by the refac-
toring. This means that 5% of all model elements are manipulated by the SDM transfor-
mation. These changes are transformed back to text by the backward transformation (TGG
BWD V0), recreating the tree from scratch, which is then unparsed to text (Unparse).
These results clearly identify the forward transformation as the bottleneck in the transfor-
mation chain requiring almost 40 minutes for a model with 20000 elements, compared to
less than a second for parsing! Perhaps even more crucial – the forward transformation
runs out of memory for models with more than 20000 elements.
Using a Java profiler, the TGG rule in Fig. 3 is identified as the main cause for runtime
and memory problems in the forward direction, as all pairwise combinations of Files
are collected (memory consumption) and checked for cross references (runtime). This is
especially problematic due to the higher number of elements in the source domain.
Although the TGG rule is certainly “correct” and appropriate from a declarative point of
view, it severly limits the scalability of the derived transformations for large models. In
the following, we systematically apply a series of optimization techniques to the TGG to
reduce (i) the runtime of mainly the forward transformation (and in some cases also the
backward transformation) and (ii) the memory usage to enable a round-trip with models
larger than 20000 elements.
230
3 Generic Structure of an Optimization Technique
In this section, we propose a structure for presenting (TGG) optimization techniques, in-
spired by [GHJV95]. This is then used consequently in ensuing Sect. 4 – 7 to present a
series of concrete optimization techniques. As our catalogue is far from complete, this
structure is meant to be used for presenting future techniques and to be extended as neces-
sary, possibly also for specific (TGG) engines.
Each optimization technique is presented in 8 parts:
Name: A descriptive name for the optimization technique used to identify and refer to
it. In the following Sect. 4 - 7, the title of the section states the name of the respective
optimization technique.
Intent: A brief description of the main idea and goal of the technique.
Motivation (forces): Reasons and arguments why a specific optimization technique is
advantageous and particularly effective in the context of TGGs.
Target User: We consider the target user to be either: (i) A TGG tool developer who un-
derstands and has access to the underlying TGG engine, and is able to implement generic,
problem-independent optimizations, or (ii) A transformation designer, who is a domain
expert in the relevant application field and can implement problem-specific optimizations.
Mechanics: A schematic description of how the technique is to be applied.
Example: An exemplary transformation showing how the technique is applied and giving
quantitative measurement results with a qualitative discussion.
Consequences: A discussion of applicability, limitations and scope of the optimization
technique. In what cases is the technique particularly effective and when not.
Extensions: A discussion of possible variations and generalizations of the optimization
technique, and a comparison with other related techniques that are either alternatives or
which can be successfully combined with the presented technique.
4 Progressive, Domain-Driven Determination of Rule Applicability
Intent: The pre-condition of a TGG rule must hold, i.e., all context elements must be
present and all attribute constraints must hold, for the rule to be applied. This is also the
case for the operational rules (forward, backward) derived automatically from the TGG
rule. In case of a forward4 rule, however, the context in the source domain is extended to
cover all source elements in the TGG rule. This is because a forward rule parses a given
source model and creates new elements only in the correspondence and target models.
At runtime, a forward transformation is realized by determining an appropriate sequence
of forward rule applications. This involves the main task of checking if a rule can be
applied to translate a certain element in the source model. To improve efficiency, this rule
4Arguments for backward rules are analogous.
231

applicability check can be performed progressively by checking applicability first in the
source domain, and then, only for successful cases, extending the check to all domains.
Motivation (forces): Navigating from input model elements to correspondence and output
model elements involves larger patterns and navigating inter-model references, possibly in
an inverse direction to their actual navigability. This is a costly operation and is per-
formed unnecessarily if input model elements already violate the source domain-specific
pre-conditions of the rule. Filtering out rules as early as possible is, therefore, an important
means of reducing runtime.
Target User: TGG tool developers who should implement a progressive, domain-driven
sequence of rule applicability checks, and transformation designers who should support
this optimization by preferring domain-specific pre-conditions over cross-domain pre-
conditions wherever possible.
Mechanics: According to [KLKS10], an operational rule is said to be appropriate if its
precondition is satisfied with respect to the input domain and applicable, if its complete
precondition (over all domains) is satisfied. In our framework, operational rules derived
from a TGG specification are decomposed into an appropriateness check, an applicability
check, and a perform transformation. In this manner, appropriateness checks are used to
filter all rules before applying applicability checks and finally applying the chosen rule
with the perform transformation.
In the process of this rule decomposition, the attribute constraints of a TGG rule are ana-
lyzed and decomposed analogously, depending on if they can be solved completely in the
input domain, or not. Due to local variables used to link constraints, this is a non-trivial
analysis and must be conservative in some cases.
Example: The sole attribute constraint in the TGG rule depicted in Fig. 3 requires that
the name of the created Node (extendedName) be equal to the name of the extended
Entity (entity2). In case of a forward transformation, this cross-domain constraint
defeats the optimization as all possible pairs of Files (entityFile1 and entity-
File2) fulfill the precondition in the source domain and only the applicability check can
choose the correct match via the attribute constraint. In this case, however, the attribute
constraint can be reformulated and restricted to the source domain without changing the
semantics of the rule. Requiring the name equality already within the tree structure, i.e.,
with eq(extendedName.name, entityName2.name), would filter all pairs of
Files that do not reference each other and eliminate invalid matches already with the ap-
propriateness check before performing further pattern matching in the applicability check.
This is an example for a small change that has a considerable impact on runtime and mem-
ory consumption as can be seen from our measurements depicted in Fig. 5. With identical
axes and experiment setup as for Fig. 4, the runtime for the initial version of the TGG for-
ward transformation is displayed in the plot as TGG FWD V0. The improved version with
the reformulated constraint, which makes the TGG rule conducive for the mentioned op-
timization via decomposition of the rule, is displayed as TGG FWD V1. All other curves
are optimizations discussed in ensuing sections. The results show that, firstly, the runtime
of the transformation has been considerably reduced from about 40 minutes to 37 sec-
onds, and secondly, that the transformation now runs in about 4 minutes for 50000 model
232

0,1
1
10
100
1000
10000
[s]
model elements [#]
TGG FWD V0
TGG FWD V1
TGG FWD V2
TGG FWD V3
Figure 5: Runtime measurements for the first three optimizations
elements and a bit more than an hour for 200000 model elements. The main reason for
this improvement is that far fewer partial matches have to be stored, which reduces mem-
ory consumption and avoids memory trashing. As a final remark, note that this change is
problem-specific and requires domain knowledge of the transformation designer to decide
how to reformulate constraints in a semantics-preserving manner.
Consequences: Our results show that it is advantageous to eliminate inappropriate matches
in an early phase of rule application. The overall complexity of the underlying TGG algo-
rithm increases, however, due to the intermediate steps and additional rule decomposition.
This is unnecessary when only cross-domain dependencies play a role in rule applicability,
i.e., it is impossible to reformulate constraints as in our running example. Furthermore,
the optimization technique implies that runtime can actually be improved if the transforma-
tion designer provides additional context information, which is actually redundant from a
declarative point of view. This behaviour is neither intuitive nor expected for users without
prior experience with constraint solvers.
Extensions: As the pattern matching process is separated into two sequential steps, partial
matches from the appropriateness check can be reused in the applicability check to further
improve efficiency (tradeoff of memory for runtime performance). Furthermore, user-
defined costs for attribute constraints together with a unified handling of attribute and
graph constraints can be used to determine an optimal search plan for pattern matching.
5 Caching and Indexing of Derived Graph Properties
Intent: The amount of pattern matching required for performing appropriateness checks
can be substantially reduced by caching derived graph properties in the input model, e.g.,
attribute values or relations between nodes.
Motivation (forces): Caching of derived information in a model is, in general, highly
non-trivial as certain but not all changes to the model require updating the cache. As a
233
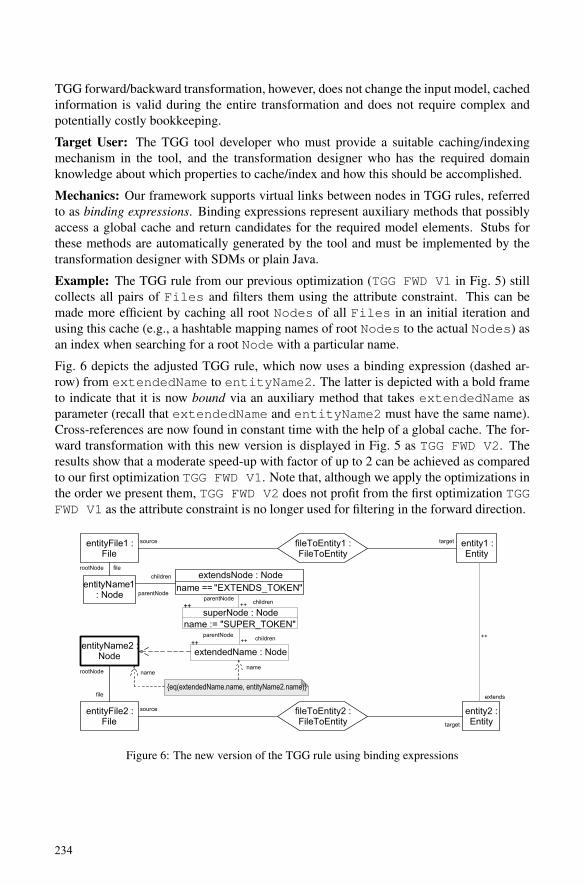
TGG forward/backward transformation, however, does not change the input model, cached
information is valid during the entire transformation and does not require complex and
potentially costly bookkeeping.
Target User: The TGG tool developer who must provide a suitable caching/indexing
mechanism in the tool, and the transformation designer who has the required domain
knowledge about which properties to cache/index and how this should be accomplished.
Mechanics: Our framework supports virtual links between nodes in TGG rules, referred
to as binding expressions. Binding expressions represent auxiliary methods that possibly
access a global cache and return candidates for the required model elements. Stubs for
these methods are automatically generated by the tool and must be implemented by the
transformation designer with SDMs or plain Java.
Example: The TGG rule from our previous optimization (TGG FWD V1 in Fig. 5) still
collects all pairs of Files and filters them using the attribute constraint. This can be
made more efficient by caching all root Nodes of all Files in an initial iteration and
using this cache (e.g., a hashtable mapping names of root Nodes to the actual Nodes) as
an index when searching for a root Node with a particular name.
Fig. 6 depicts the adjusted TGG rule, which now uses a binding expression (dashed ar-
row) from extendedName to entityName2. The latter is depicted with a bold frame
to indicate that it is now bound via an auxiliary method that takes extendedName as
parameter (recall that extendedName and entityName2 must have the same name).
Cross-references are now found in constant time with the help of a global cache. The for-
ward transformation with this new version is displayed in Fig. 5 as TGG FWD V2. The
results show that a moderate speed-up with factor of up to 2 can be achieved as compared
to our first optimization TGG FWD V1. Note that, although we apply the optimizations in
the order we present them, TGG FWD V2 does not profit from the first optimization TGG
FWD V1 as the attribute constraint is no longer used for filtering in the forward direction.
entityName1: Node
extendsNode : Nodename == "EXTENDS_TOKEN"
superNode : Nodename := "SUPER_TOKEN"
++
extendedName : Node++
entityFile1 :File
entityFile2 :File
entityName2 :Node
entity1 :Entity
fileToEntity1 :FileToEntity
entity2 :Entity
fileToEntity2 :FileToEntity
{eq(extendedName.name, entityName2.name)}
parentNode
children
parentNode++ children
parentNode++ children
filerootNode
rootNode
file
++
extends
source target
namename
source
target
Figure 6: The new version of the TGG rule using binding expressions
234

Compared to TGG FWD V1, the runtime improvement is especially noticeable for mid-
sized models (10000 to 50000 model elements). Apparently, the pairwise matching of
Files is not the critical factor for smaller models. In case of larger models, other issues
such as pattern matching, more specifically navigating to other domains, become more
time consuming and outweigh the positive effects of the optimization.
Consequences: Determining what to cache requires problem-specific knowledge in gen-
eral. In our example for instance, the speed-up provided by the cache depends on the num-
ber of extends relations between entities. In the worst case scenario, using the cache
for very large models can actually be slower if exactly one extends relations is used, i.e.,
the time is spent for lazily filling the cache, which is only used once. It is also important
to remember that a cache represents a trade-off of memory for runtime.
A further issue is that TGG rules get more abstract the more binding expressions are used.
Details are hidden behind virtual links that do not really describe how the search is per-
formed. This can reduce the overall readability of the rules if used excessively.
Extensions: Similar to attribute constraints as discussed in the previous section, binding
expressions can be weighted with a user-defined cost function and uniformly handled as
constraints by the search plan generator. For straightforward cases, the TGG tool could de-
termine if an index should be built over a certain attribute value (e.g., name in our running
example), creating and implementing an appropriate binding expression automatically.
6 Static Analysis of TGG Rules
Intent: A static analysis of the TGG rules can be performed to extract information about
the dependencies and structure of the rules. This can be exploited to improve performance.
Motivation (forces): Results and techniques from the mature field of graph transforma-
tions can be used to analyze the structure of and dependencies between TGG rules.
Target User: TGG tool developers who must provide a static analysis at compile time to
generate additional artifacts to support the transformation process.
Mechanics: A concrete technique is to obtain a global view of dependencies between
rules and types via a precedence analysis [LAVS12a], which can be used to optimize the
order in which elements of the source model are processed. The goal is to avoid arbitrary
choices by the algorithm and a consequent recursion stack.
Another strategy is to construct rule filter tables using the types of created elements in
TGG rules and attribute constraints that compare attributes of nodes to constant values.
These tables can be used at runtime to filter rule candidates in constant time before running
the appropriateness checks.
Example: Applying a rule filter table for our running example, we were able to speed-
up the translation by about 10% as depicted in Fig. 5 (TGG FWD V3). Although this is
moderate compared to the previous optimizations, note that this optimization is “free-of-
charge” at transformation time and is applicable for all TGGs, i.e., is a generic optimization
235

and is not problem-specific. Furthermore, depending on the concrete example, the speed-
up obtained by using filter tables can be much more, especially for rules with large patterns
and models with few types and many attribute constraints.
Consequences: Generating additional information from a TGG specification prolongs the
compilation process, hindering an agile development/test/debug workflow especially for
large TGGs. A more critical issue is that the table lookup must be much faster than the
saved effort of pattern matching. Especially if the filters are not able to exclude any rules,
this might actually slow down the translation process if too much computation is involved.
Extensions: The goal of reducing the effort of checking rule applicability for a large
number of rules is closely related to incrementally updating matches in the context of
incremental pattern matching. Existing results and techniques [VD13] show that a Rete
network can be constructed from all rules and used to avoid redundant pattern matching
completely. This can be seen as a generalization of our rule filter tables and is future work.
A related approach is using model sensitive search plans [VDWS13] to exploit information
collected from the models (especially the input model) during the transformation process.
A final approach is using static analysis techniques from graph transformations to paral-
lelize (i) the rule applicability checks, and (ii) independent transformation steps [IM12].
7 Incremental Updates
Intent: In case of an existing triple of relatively large source, correspondence and target
models, a “small” update to the source model (target analogously) typically affects only
a “small” subset of the correspondence and target models. Propagating these changes by
incrementally adapting the existing models can be potentially much more efficient than
recreating the models from scratch.
Motivation (forces): The consistency relation described by a TGG can be used not only to
derive forward and backward transformations, which create output models from scratch,
but also to realize incremental updates. Changes to the source model can be propagated
incrementally to an existing target model in this case. Only the relevant parts of the triple
are traversed and manipulated as required to restore consistency.
Target User: TGG tool developers who must implement an appropriate incremental TGG
algorithm, and the transformation designer who must decide if an incremental propagation
of changes is necessary and feasible in a certain application scenario.
Mechanics: Given the changes applied to the input model, a TGG incremental algorithm
has to (i) compute the complete set of input model elements S that must be re-transformed
as they depend on, e.g., deleted elements, (ii) revoke the rule applications used to transform
S, i.e., delete related elements in the correspondence and output domains, and (iii) re-
transform all elements in S by invoking the forward transformation on the existing triple.
This is typically achieved by exploiting additional information such as dependencies be-
tween the correspondence links, or transformation protocols recorded during the transfor-
236

mation. The crucial point is that all steps must be independent of the total size of the
models involved and only depend on the size of the change and transitively affected ele-
ments. The latter is typically a much smaller set than the total number of elements.
In practice, a critical component for realizing incremental updates is a change recognition
mechanism, which can either be a model diff that compares two versions of a model, or an
online change detector that records all changes in a notification-based environment.
Example: With the same setup and environment as for the measurement in Fig. 5, the
runtime measurement results for our incremental TGG algorithm [LAVS12b] are depicted
in Fig. 7. In the plot on the left, the refactoring described in Sect. 2 (recall that 5% of all
model elements are manipulated) was performed directly in the textual syntax and prop-
agated with our incremental forward TGG transformation TGG FWD V4. To provide a
comparison, the optimized batch (non-incremental) forward transformation is displayed
in the plot as TGG FWD V3. To simulate a situation where offline change recognition is
necessary, the textual syntax was changed offline and re-parsed to yield a new tree with the
refactoring applied. This is then compared to the old version of the tree via a diff mech-
anism, to identify the differences which are then propagated incrementally to the existing
correspondence and target models. To show the actual cost of offline change recognition,
the sum of diff and incremental algorithm is displayed in the plot as Diff + TGG FWD
V4. Note that we had to implement a specialized tree diff as generic model diffs such as
EMF compare were much too inefficient. Our results show that the incremental algorithm
is considerably faster than the optimized batch transformation with less than half a second
compared to almost three seconds for 5000 model elements.5 A speed-up factor of about 7
- 13 remains constant for all model sizes. For a model size of up to 10000, the total cost of
diff plus synchronization is less than for the batch transformation with 1.3s as compared to
2.6s for 5000 model elements. This, however, reduces progressively and the advantage of
the incremental algorithm is defeated by the cost of calculating the changes with the diff
algorithm. This is to be expected as the tree diff is not incremental and does not exploit
information from previous runs.
0,01
0,1
1
10
100
1000
10000
[s]
model elements [#]
TGG FWD V3Diff + TGG FWD V4TGG FWD V4
0,01
0,1
1
10
100
1000
[s]
model elements [#]
TGG BWD V3
TGG BWD V4
Figure 7: Runtime measurements for the incremental TGG implementation
5Recall that the elements in the tree are roughly 6 times as many as in the model.
237

The plot on the right compares the batch and incremental modes for the backward trans-
formation. In this case, the refactoring is applied with SDMs on the model and propagated
back to the tree and textual syntax using our incremental TGG algorithm TGG BWD V4.
To simulate a situation where an online change recognition is possible, the SDM refactor-
ing transformation additionally creates the appropriate deltas for the incremental propaga-
tion, i.e., there is no need for a model diff. The backward batch transformation is displayed
in the plot as TGG BWD V3. The results show that both modes are much more efficient
in the backward direction. This is to be expected as the model is smaller, better typed,
and suitably connected, i.e., it is easier to create the larger, weakly typed tree structure
than to parse it. Nonetheless, the incremental algorithm enables a moderate speed-up with
0,5s compared to 1,5s (a factor of 3) for 10000 model elements and slightly less for larger
models with 81s compared to 137s (a factor of 1.7) for 200000 model elements.
Consequences: Although online change recognition is more efficient and less error-prone,
an application scenario might require offline changes to be handled.6 In such a case,
naıve diff algorithms might not scale and it can be quite challenging to deal with change
recognition correctly and efficiently. We have focussed with our experiments on efficiency
arguments for incremental updates. A further, possibly even more important argument is
infomation loss. In many application scenarios, there is irrelevant information in one or
both domains, which cannot be reconstructed from the model in the other domain. In such
cases, updates must be handled incrementally to ensure correct results.
Extensions: Handling a set of concurrent changes, i.e., changes to both source and target
models requires conflict resolution and is currently not supported by our incremental TGG
algorithm. This is, however, often the case in practice and is important future work. Fi-
nally, our current incremental TGG algorithm is rather conservative and can be improved
by further analyses to accurately determine the exact set of transitively affected elements.
8 Related Work
There exist various bidirectional transformation languages. For a survey and a detailed
discussion, we refer to [Ste08, CFH+09]. In this context, efficiency has, however, not yet
received as much attention as, e.g., formal properties, although it is crucial for the prac-
tical feasibility of a bidirectional language as certain minimal runtime requirements often
must be met. Depending on the application scenario, this might even outweigh all other
advantages that a bidirectional, declarative language has to offer. With our contribution
we try to close this gap for TGGs and demonstrate that it is indeed possible to optimize
the derived transformations as required. Our results are TGG specific but the core ideas
and techniques can be transferred to other (especially rule-based) languages.
Giese et. al [GH09] and Lauder et. al [LAVS12b] both lay emphasis on efficiency as the
main argument for an incremental TGG algorithm. In practice, however, especially when
changes have transitive effects (e.g., a root element is changed), or change recognition is
particularly difficult, supporting incrementality is not the sole way of improving efficiency.
6This is currently the case in an ongoing industrial application.
238

In such cases, other optimization techniques as presented in this paper are necessary.
The numerous optimization techniques in the mature field of graph transformations mostly
concern the pattern matching process [VAS04, VDWS13, GSR05], and discuss diverse
strategies for optimal search plan generation. These results have served as a major source
of inspiration, and we have already adapted ideas that are especially effective for TGGs.
Finally, the parallel execution of independent transformation steps as proposed in [IM12]
is an optimization technique that is currently rarely used in practice, but can be potentially
very powerful for TGGs when combined with a suitable dependency analysis.
9 Conclusion and Future Work
In this paper, we have proposed a format for presenting current and future TGG optimiza-
tion techniques. We have used this format to discuss four concrete optimization tech-
niques, demonstrating each of them on our running example, which is part of an industrial
application where a textual DSL requiring a model-to-text round-trip is used to specify
the persistency layer of mobile applications for different target platforms. Our runtime
measurements show that an optimization factor of about 300 (complete transformation) to
500 (incremental with 5% change size) can be achieved in the bottleneck of our scenario,
namely the forward, i.e., text-to-model, transformation with TGGs. More crucially, the
optimizations have enabled round-trips with larger model sizes by reducing memory con-
sumption. Our proposed catalogue of optimization techniques should serve as a guideline
for both TGG tool developers and transformation designers when efficiency issues threaten
to outweigh the advantages of TGGs.
As future work, we plan to implement and investigate the various extensions to each tech-
nique as already discussed in the paper. To improve the validity of our measurement
results, we plan to establish a transformation zoo of diverse TGG examples, which can
serve as a benchmark that covers important aspects of various application scenarios.
References
[CFH+09] Krzysztof Czarnecki, John Nathan Foster, Zhenjiang Hu, Ralf Lammel, Andy Schurr,and James Terwilliger. Bidirectional Transformations: A Cross-Discipline Perspective.In Richard F. Paige, editor, Proc. of ICMT 2009, volume 5563 of LNCS, pages 260–283.Springer, 2009.
[FNTZ00] Thorsten Fischer, Jorg Niere, Lars Torunski, and Albert Zundorf. Story Diagrams: ANew Graph Rewrite Language Based on the Unified Modeling Language and Java. InHartmut Ehrig, Gregor Engels, Hans-Jorg Kreowski, and Grzegorz Rozenberg, editors,Proc. of TAGT 1998, volume 1764 of LNCS, pages 157–167. Springer, 2000.
[GH09] Holger Giese and Stephan Hildebrandt. Efficient Model Synchronization of Large-Scale Models. Technical report, Hasso-Plattner Institute, University of Potsdam, 2009.
239
[GHJV95] Erich Gamma, Richard Helm, Ralph Johnson, and John Vlissides. Design Patterns.Addison Wesley, 1995.
[GHN10] Holger Giese, Stephan Hildebrandt, and Stefan Neumann. Model Synchronizationat Work : Keeping SysML and AUTOSAR Models Consistent. In Andy Schurr,Claus Lewerentz, Gregor Engels, Wilhelm Schafer, and Bernhard Westfechtel, editors,Festschrift Nagl, pages 555–579. Springer, 2010.
[GSR05] Leif Geiger, Christian Schneider, and Carsten Reckord. Template- and ModelbasedCode Generation for MDA-Tools. In Proc. of the 3rd International Fujaba Days, pages57–62, 2005.
[HGN+13] Frank Hermann, Susann Gottmann, Nico Nachtigall, Benjamin Braatz, GianluigiMorelli, Alain Pierre, and Thomas Engel. On an Automated Translation of SatelliteProcedures Using Triple Graph Grammars. In Keith Duddy and Gerti Kappel, editors,Proc. of ICMT 2013, volume 7909 of LNCS, pages 50–51. Springer, 2013.
[IM12] Gabor Imre and Gergely Mezei. Parallel Graph Transformations on Multicore Systems.In Victor Pankratius and Michael Philippsen, editors, Proc. of MSEPT 2012, volume7303 of LNCS, pages 86–89. Springer, 2012.
[KLKS10] Felix Klar, Marius Lauder, Alexander Konigs, and Andy Schurr. Extended TripleGraph Grammars with Efficient and Compatible Graph Translators. In Andy Schurr,Claus Lewerentz, Gregor Engels, Wilhelm Schafer, and Bernhard Westfechtel, editors,Festschrift Nagl, volume 5765 of LNCS, pages 141–174. Springer, 2010.
[LAVS12a] Marius Lauder, Anthony Anjorin, Gergely Varro, and Andy Schurr. BidirectionalModel Transformation with Precedence Triple Graph Grammars. In Antonio Vallecillo,Juha-Pekka Tolvanen, Ekkart Kindler, Harald Storrle, and Dimitris Kolovos, editors,Proc. of ECMFA 2012, volume 7349 of LNCS, pages 287–302. Springer, 2012.
[LAVS12b] Marius Lauder, Anthony Anjorin, Gergely Varro, and Andy Schurr. Efficient ModelSynchronization with Precedence Triple Graph Grammars. In Hartmut Ehrig, GregorEngels, Hans-Jorg Kreowski, and Grzegorz Rozenberg, editors, Proc. of ICGT 2012,volume 7562 of LNCS, pages 401–415. Springer, 2012.
[Par04] Terence John Parr. Enforcing Strict Model-View Separation in Template Engines. InStuart I. Feldman, Mike Uretsky, Marc Najork, and Craig E. Wills, editors, Proc. ofWWW 2004, pages 224 – 233. ACM, 2004.
[Par07] Terence John Parr. The Definitive ANTLR Reference: Building Domain-Specific Lan-guages. The Pragmatic Bookshelf, 2007.
[Ste08] Perdita Stevens. A Landscape of Bidirectional Model Transformations. In RalfLammel, Joost Visser, and Joao Saraiva, editors, Proc. of GTTSE 2008, volume 5235of LNCS, pages 408–424. Springer, 2008.
[VAS04] Attila Vizhanyo, Aditya Agrawal, and Feng Shi. Towards Generation of Efficient Trans-formations. In Gabor Karsai and Eelco Visser, editors, Proc. of GPCE 2004, volume3286 of LNCS, pages 298–316. Springer, 2004.
[VD13] Gergely Varro and Frederik Deckwerth. A Rete Network Construction Algorithm forIncremental Pattern Matching. In Keith Duddy and Gerti Kappel, editors, Proc. ofICMT 2013, volume 7909 of LNCS, pages 125–140. Springer, 2013.
[VDWS13] Gergely Varro, Frederik Deckwerth, Martin Wieber, and Andy Schurr. An Algorithmfor Generating Model-Sensitive Search Plans for EMF Models. In Zhenjiang Hu andJuan de Lara, editors, Proc. of ICMT 2012, volume 7307 of LNCS, pages 224–239.Springer, 2013.
240

Konzeptuelle Modellierung der Zustandskonsistenzverteilter betrieblicher Informationssysteme
Elmar J. Sinz
Universität BambergLehrstuhl für Wirtschaftsinformatik,
insbes. Systementwicklung und DatenbankanwendungFakultät Wirtschafsinformatik und Angewandte Informatik
96047 [email protected]
Abstract: Betriebliche Informationssysteme werden üblicherweise als verteilteSysteme realisiert. Sie bestehen aus mehreren Teilsystemen, jedes von ihnennimmt während der Ausführung unterschiedliche Zustände an. Damit stellt sich dieFrage nach der Zustandskonsistenz des gesamten Systems. Diese kann z. B. ver-letzt werden, wenn eines der Teilsysteme den von ihm erwarteten Dienst nicht wiegeplant erbringt. Der Beitrag geht davon aus, dass die Zustandskonsistenz durchkonzeptuelle Modellierung wesentlich unterstützt werden kann, dies aber von denverbreiteten Ansätzen zur Modellierung von Informationssystemen vernachlässigtwird. Am Beispiel des SOM-Ansatzes wird ein Beitrag zur Schließung dieser For-schungslücke vorgeschlagen. Der Anwendungsbezug ergibt sich z. B. im Hinblickauf das verbreitete Paradigma der serviceorientierten Architekturen.
1 Einführung
Konzeptuelle Modelle stellen ein wichtiges Hilfsmittel zur Analyse und Gestaltung be-trieblicher Informationssysteme (IS), dem informationsverarbeitenden Teilsystem einerUnternehmung, dar. In der Praxis zeichnen sich IS durch eine immer größere Reichweiteund Komplexität aus. Gleichzeitig werden sie in hohem Maße als verteilte Systeme rea-lisiert. Dies erfordert wiederum einen hohen Integrationsgrad der Aufgaben und der sieunterstützenden Anwendungssysteme [FeSi13, 237ff].
Konzeptuelle Modelle erfassen Struktur- und Verhaltensmerkmale eines IS aus der fach-lichen Sicht der Aufgabenebene. Die Aufgabenträgerebene steht ebenso wie die Fragenach der konkreten Ausgestaltung der Aufgabenträger bei der konzeptuellen Modellie-rung nicht im Vordergrund. Die Unterscheidung zwischen der Aufgaben- und der Auf-gabenträgerebene macht Freiheitsgrade bezüglich der Gestaltung eines IS, z. B. hinsicht-lich unterschiedlicher Automatisierungsgrade und -formen, sichtbar und unterstützt dielaufende Abstimmung zwischen „Business“ und „IT“. Ganzheitliche konzeptuelle Mo-delle bilden somit eine wichtige Grundlage für ein von allen Beteiligten getragenes
241

Fachverständnis der Aufgabenebene des IS sowie für die Identifikation von Gestaltungs-optionen auf der Aufgaben- und Aufgabenträgerebene.
Typischerweise werden bei der konzeptuellen Modellierung sowohl struktur- als auchverhaltensorientierte Sichten auf das IS erfasst. Strukturorientierte Sichten werden insbe-sondere in Form von Datenschemata (z. B. im Entity-Relationship-Modell ERM[Chen76] oder im Strukturierten Entity-Relationship-Modell SERM [Sinz88]) oder inForm von objektorientierten Klassenschemata (z. B. UML-Klassendiagramme[UML11]) modelliert. Verhaltensorientierte Sichten beziehen sich auf den Ablauf vonAufgaben (je nach Modellierungssprache auch Funktionen, Aktionen, Prozessschritteoder Aktivitäten). Sie werden z. B. in Form von Ereignisgesteuerten Prozessketten[Nütt13], UML-Aktivitätsdiagrammen, UML-Sequenzdiagrammen oder BPMN-Diagrammen [BPMN11] spezifiziert.
Bemerkenswert ist, dass die Sicht auf die Zustände eines IS und auf Konsistenzbedin-gungen für diese Zustände im Rahmen der konzeptuellen Modellierung kaum Beachtungfindet. Dies ist insofern verwunderlich, als IS aufgrund ihrer Verteiltheit (zu verteiltenSystemen siehe [Ens78]) aus einer Vielzahl von interagierenden Teilsystemen und Sys-temkomponenten bestehen, deren lokale Zustände aus globaler Systemsicht konsistent zuhalten sind. Die relevanten Zustände eines IS und die zugehörigen Konsistenzbedingun-gen betreffen somit fachliche Fragen, die auf der Aufgabenebene zu beantworten sind,wofür sich konzeptuelle Modelle als unterstützendes Hilfsmittel anbieten. KonzeptuelleZustandsmodelle liefern darüber hinaus wichtige Anforderungen für die Gestaltung derZustandskonsistenz auf der Aufgabenträgerebene, z. B. mithilfe von (verteilten) Daten-banktransaktionen und Transaktionsdiensten.
Der vorliegende Beitrag geht von der Arbeitshypothese aus, dass konzeptuelle Modellevon Zuständen und zugehörigen Konsistenzbedingungen einen wichtigen Beitrag zurganzheitlichen fachlichen Analyse und Gestaltung verteilter IS und damit zur Beherr-schung ihrer Komplexität leisten können. Konzeptuelle Zustandsmodelle treten dabei als„dritte Sicht“ neben die strukturorientierte Sicht und die Ablaufsicht auf IS. Ebenso wiedie Ablaufsicht zielt auch die Zustandssicht auf Verhaltenseigenschaften eines IS.
Ein Beispiel ist das verteilte System Reisebuchungssystem, bestehend aus den Teilsys-temen Agentur, Flugline, Autovermietung und Hotel. Unterstellt man, dass nur eine voll-ständige Reise akzeptiert wird und dass die Buchung in der Reihenfolge Flug, Mietwa-gen und Hotel erfolgt, so sind aus konzeptueller Sicht die Schritte zu beschreiben, dieauf Agentur, Fluglinie und Autovermietung durchzuführen sind, wenn in der Zielstadtdas gewünschte Hotel nicht verfügbar ist und auch kein alternatives Hotel gefundenwerden kann. Auch kann die Zustandssicht Hinweise für eine Umgestaltung des Ge-schäftsprozesses geben, indem z. B. der Erwartungswert für die Durchführbarkeit einergewünschten Buchung oder die Stornierungskosten und –fristen für eine Fehlbuchungberücksichtigt werden.
Im Folgenden wird ein Ansatz zur konzeptuellen Modellierung der Zustandskonsistenzvon IS, d. h. der Modellierung relevanter Zustände und zugehöriger Konsistenzbedin-gungen, vorgeschlagen. Ziel ist es, bereits auf konzeptueller Modellebene Aussagen über
242

die Konsistenz von Systemzuständen eines verteilten IS treffen und Anforderungen zuderen Erreichung gezielt erfassen zu können. Hierzu gehören die Sichtbarmachung kon-sistenter und nicht-konsistenter Systemzustände sowie die Identifikation von Maßnah-men zur Erreichung konsistenter Zustände. Als Forschungsansatz dient eine deduktiveAnalyse auf der Grundlage von Systemtheorie und Kybernetik. Der Ansatz wird anhandder SOM-Methodik ([FeSi90, [FeSi91), [FeSi95], [FeSi13]) ausgeführt.
Der weitere Beitrag gliedert sich wie folgt: In Abschnitt 2 werden Grundlagen der Mo-dellierung und der Konsistenzsicherung von Systemzuständen vorgestellt. Der Ansatzzur Modellierung der Zustandskonsistenz betrieblicher Informationssysteme wird inAbschnitt 3 entwickelt. Abschnitt 4 führt den Ansatz anhand der Fallstudie „Reisebu-chung“ durch. Abschnitt 5 widmet sich der Diskussion des vorgestellten Ansatzes.
2 Grundlagen der Modellierung und Konsistenzsicherung von Zu-ständen
2.1 Modellierung von Systemzuständen
Systemtheoretische Grundlagen der Modellierung von Zuständen finden sich insbeson-dere im Systemtyp endlicher Automat. Ein endlicher Automat kann eine endliche Mengevon Zuständen annehmen. Durch einen Stimulus (Eingabe) geht das System von einemVorzustand in einen Nachzustand über und erzeugt eine Reaktion (Ausgabe). Handelt essich um einen endlichen Automaten mit einer diskreten Zustandsmenge und einer über-schaubaren Anzahl von Zuständen, so kann das Verhalten des Automaten in Form einesZustandsüberführungsgraphen (Systemtyp Zustandsraum-System) beschrieben werden[FeSi13, 13ff].
Ein weiterer Systemtyp ist das Petri-Netz. Ein Petri-Netz umfasst eine Menge von Zu-ständen und Übergängen, welche die Knoten des Petri-Netzes bilden und die durch ge-richtete Kanten zu einem bipartiten Graphen verbunden sind. Den Zuständen könnenMarken (Token) zugeordnet werden. Durch Schalten von Übergängen werden Markenaus den Vorzuständen eines Übergangs entfernt und Nachzustände markiert. Im Gegen-satz zu einem Zustandsüberführungsgraphen, bei dem der aktuelle Systemzustand injeweils genau einem Knoten lokalisiert werden kann, wird der Systemzustand einesPetri-Netzes durch seine aktuelle (in der Regel mehrelementige) Menge von Marken undderen Verteilung auf die Zustandsknoten definiert [Reis10].
Ausdrucksmittel zur Modellierung von Zuständen auf Basis der beiden Systemtypenfinden sich in einer Reihe von Modellierungssprachen. Angesichts der weiten Verbrei-tung der Unified Modeling Language (UML) wird exemplarisch der UML-Zustandsautomat (state machine) kurz angesprochen. Diese Diagrammart erlaubt einedifferenzierte Modellierung von Zuständen und Übergängen eines Teilsystems (behavio-ral state machine) sowie eine Modellierung des Nutzungsprotokolls von Systemschnitt-stellen (protocol state machine) [UML11, 535ff]. Der zugrunde liegende Systemtyp istder endliche Automat. Zustände können aus einfacheren Zuständen zusammengesetztsein. Teilzustände zusammengesetzter Zustände lassen sich Regionen (regions) zuord-
243
nen. Damit können Teil-Zustandsautomaten mit nebenläufigen Zustandsübergängengebildet werden. Das Gesamtsystem wird damit als Petri-Netz darstellbar.
Eine konzeptuelle, semantische Modellierung von Systemzuständen auf der Aufgaben-ebene von IS ist in Wissenschaft und Praxis jedoch nur wenig verbreitet. Zustandsmo-delle werden überwiegend auf der Aufgabenträgerebene und hier meist nur für kleinereTeil-Anwendungssysteme oder IT-Infrastrukturkomponenten genutzt. Dadurch bleibenwichtige Analyse- und Gestaltungspotenziale für IS ungenutzt.
2.2 Transaktionskonzept und Transaktionsmodelle
Das aus dem Bereich der Datenbanksysteme bekannte Transaktionskonzept definierteine Transaktion als eine Folge von Operationen auf einer Datenbasis, welche einenkonsistenten Zustand der Datenbasis in einen wiederum konsistenten Zustand überführt[Reut87, 405]. Die Eigenschaften von Transaktionen werden im ACID-Prinzip zusam-mengefasst: Eine Transaktion ist nicht unterbrechbar, sie wird nach dem Alles-oder-nichts-Prinzip durchgeführt (Atomicity), sie wahrt die Konsistenz der Datenbasis (Con-sistency), mehrere Instanzen von Transaktionen laufen ohne gegenseitige Beeinflussungab (Isolation) und die durch eine Transaktion bewirkten Veränderungen der Datenbasissind dauerhaft (Durability).
Die Operationen einer Transaktion sind durch eine sogenannte Kontrollsphäre geschützt[GrRe93, 174]. Eine Kontrollsphäre lässt sich als Instanz eines abstrakten Datentypsinterpretieren. Der Aufruf einer Operation an der Schnittstelle des abstrakten Datentypsführt zu einer Operationsfolge in dessen Innerem, die nach dem Alles-oder-nichts-Prinzip ausgeführt wird. Erst nach vollständiger Durchführung der Operationsfolge wirdüber die Schnittstelle ein Ergebnis nach außen bekannt gemacht.
Jedes transaktionsgeschützte System ist aus Sicht seiner Kontrollsphären in Form vonHierarchien abstrakter Datentypen darstellbar. Bei einfachen (flachen) Transaktionenbesteht die Hierarchie nur aus dem Wurzelknoten. Bei höheren Transaktionsmodellen,wie genesteten Transaktionen und Mehrebenen-Transaktionen [GrRe93, 195ff] sind dieHierarchien als Baumstruktur ausgeprägt.
Bei genesteten Transaktionen sind die Kontrollsphären der abstrakten Datentypen ver-schachtelt, d. h. jeder Wurzelknoten umschließt die ihm nachgeordneten Knoten. Dasbedeutet, dass kein Blattknoten oder Wurzelknoten eines Teilbaums isoliert in den Zu-stand dauerhaft übergehen kann (Commitment), sondern nur gemeinsam mit dem Wur-zelknoten des gesamten Baumes. Bis zum Ende dieser Wurzeltransaktion kann somit dasgesamte System von Transaktionen zurückgesetzt werden.
Bei Mehrebenen-Transaktionen sind die Kontrollsphären der abstrakten Datentypennicht verschachtelt. Jede Transaktion eines Blattknotens kann isoliert in den Zustanddauerhaft übergehen, das gleiche gilt für die Transaktion einer Teilbaum-Wurzel, wennalle nachgelagerten Transaktionen abgeschlossen sind. Da dauerhaft gewordene Trans-aktionen nicht mehr zurückgesetzt werden können, erfordert das Modell der Mehrebe-nen-Transaktionen die Installation von kompensierenden Transaktionen, welche imFehlerfall die Wirkung einer bereits dauerhaft abgeschlossenen Transaktion aufheben.
244

Wichtig ist, dass die Konsistenz des gesamten Systems aus konzeptueller Sicht durcheine Menge von ACID-Transaktionen definiert wird. Erweiterungen des ACID-Prinzips,z. B. Brewer’s CAP-Theorem [Tiwa11, 174f], wonach ein System stets nur zwei der dreiEigenschaften Consistency, Availability und Partion Tolerance erfüllen kann, sind keineFrage der Gestaltung der Aufgabenebene, sondern betreffen die Aufgabenträgerebene.
2.3 IT-Unterstützung der Zustandskonsistenz
Hilfsmittel zur Unterstützung von Zustandskonsistenz liegen in höheren Programmier-sprachen in Form von Sprachelementen zur Ausnahmebehandlung vor (z. B. in Java dertry-catch-Block). Tritt bei der Ausführung des try-Blocks ein Ausnahmeereignis ein, sowird ein nachfolgender catch-Block ausgeführt, der dieses Ausnahmeereignis behandelt.
Diese rudimentäre Form der Ausnahmebehandlung weist keinerlei Bezug zum Transak-tionskonzept auf. Zur Unterstützung der Ausführung von Transaktionen in Anwendungs-systemen werden spezielle Funktionskomponenten eingesetzt, die als Transaktionsma-nager [GrRe93, 21] bezeichnet werden. Transaktionsmanager werden entweder von derSystemsoftware (z. B. Datenbankverwaltungssysteme) oder von der Middleware in Formvon Transaktionsdiensten (z. B. Java Transaction Service JTS) bereitgestellt. JTS stelltTransaktionsdienste speziell für verteilte Anwendungssysteme bereit. Standardmäßigwerden flache Transaktionen, optional auch genestete Transaktionen unterstützt.
Workflow-Sprachen wie WS-BPEL gehen davon aus, dass der Einsatz von ACID-Transaktionen mit einem gemeinsamen Commitment am Ende der Wurzeltransaktion fürWorkflows nur bedingt möglich ist, da die zugehörigen Prozessinstanzen eine längereLaufzeit aufweisen können, so dass die Transaktionseigenschaft der Isolation nicht odernur eingeschränkt garantiert werden kann [OAS07, 117ff]. WS-BPEL weicht daher aufdas Konzept der Mehrebenen-Transaktion aus und unterstützt das Prinzip der Kompen-sation durch die Konzepte Scope und Compensation Handler.
3 Ein Ansatz zur Modellierung der Zustandskonsistenz betrieblicherInformationssysteme
Im Folgenden wird der im Mittelpunkt der Arbeit stehende Ansatz zur Modellierung vonSystemzuständen und deren Konsistenzbedingungen vorgestellt und diskutiert. Die Ent-wicklung des Ansatzes erfolgt auf der Grundlage von Geschäftsprozessmodellen gemäßder SOM-Methodik ([FeSi90], (FeSi91], [FeSi95], [FeSi13, 194ff]). Die SOM-Methodikist wegen ihrer strikten Objektorientierung in besonderer Weise für eine konzeptuelleZustandsmodellierung geeignet. Kern dieser Objektorientierung sind gekapselte betrieb-liche Objekte, die lose gekoppelt sind und mithilfe von betrieblichen Transaktionenkoordiniert werden. In Bezug auf die Zustandsmodellierung sind folgende Eigenschaftenbedeutsam: Objekte besitzen jeweils ihren eigenen Objektspeicher (ihr „fachliches Ge-dächtnis“) und kapseln ihre Zustände. Es gibt keine gemeinsamen Zustände mehrererObjekte aufgrund eines gemeinsamen Objektspeichers. Eine betriebliche Transaktionzwischen zwei Objekten führt zu abgestimmten Zustandsübergängen der an der Transak-tion beteiligten Objekte. Jeder Zustandsübergang eines Objekts stellt eine ACID-
245

Transaktion dar. Durch die synchrone Kopplung der beiden Zustandsübergänge zweierObjekte in einer betrieblichen Transaktion werden diese zu einer ACID-Transaktionvereinigt.
Der Modellierungsansatz wird zunächst in Abschnitt 3.1 anhand eines einfachen Bei-spiels entwickelt. Anschließend erfolgt in Abschnitt 3.2 die nähere methodische Fundie-rung.
3.1 Konzeptuelle Modellierung der Zustandskonsistenz auf Basis der SOM-Methodik
Abbildung 1 zeigt in der linken und in der mittleren Spalte das Interaktionsschema(Strukturorientierte Leistungs- und Lenkungssicht) und das Vorgangs-Ereignis-Schema(verhaltensorientierte Ablaufsicht) für ein einfaches Geschäftsprozessmodell gemäßSOM-Methodik. Beide Sichten sind auf einer aggregierten (obere Zeile) und einer detail-lierten (untere Zeile) Zerlegungsebene dargestellt. In der rechten Spalte kommt als „drit-te Sicht“ das konzeptuelle Modell der Zustände und ihrer Konsistenzbedingungen (ver-haltensorientierte Zustandssicht) in Form eines Zustandsschemas hinzu. Auch dieseswird auf den beiden genannten Zerlegungsebenen dargestellt.
Abbildung 1: Interaktionsschema und Vorgangs-Ereignis-Schema gemäß SOM-
Methodik, ergänzt um Zustandsschema
Das Interaktionsschema der aggregierten Ebene zeigt die Leistungs- und Lenkungssichtdes Geschäftsprozessmodells. Diese umfasst eine Leistungstransaktion Güterdistributi-on, die von dem betrieblichen Diskursweltobjekt Handelsbetrieb zu dem betrieblichenUmweltobjekt Kunde führt. Auf der detaillierten Ebene wird diese Leistungstransaktionnach dem Verhandlungsprinzip in eine Anbahnungstransaktion Produktinfo, eine Ver-einbarungstransaktion Auftrag und eine Durchführungstransaktion Lieferung zerlegt.
246

Neben den Interaktionsschemata der beiden Zerlegungsebenen sind die korrespondieren-den Vorgangs-Ereignis-Schemata dargestellt. Auf der aggregierten Ebene besteht derAblauf des Geschäftsprozesses im Versenden eines Leistungspaketes Güterdistributiondurch die Aufgabe GD> des Objekts Handelsbetrieb sowie im Entgegennehmen diesesLeistungspakets durch die Aufgabe >GD des Objekts Kunde. Auf der detaillierten Ebenewerden die drei Teiltransaktionen Produktinfo, Auftrag und Lieferung sequenziell durch-geführt.
Jede Durchführung eines Geschäftsprozesses wird durch ein initiales Ereignis (Ge-schäftsvorfall) ausgelöst. Im detaillierten Vorgangs-Ereignis-Schema in Abbildung 1besteht das initiale Ereignis im Auslösen einer Durchführung der Aufgabe A> des Ob-jekts Handelsbetrieb. Die Aufgabe A> führt gemeinsam mit der Aufgabe >A von Kundedie Transaktion Produktinfo durch. Wichtig ist, dass beide Aufgaben nur gemeinsam dieTransaktion ausführen können, d. h. die Transaktion ist nur dann erfolgreich abgeschlos-sen, wenn beide Aufgaben vollständig durchgeführt wurden.
An dieser Stelle werden die Zusammenhänge zwischen betrieblichen Transaktionen undkonsistenzerhaltenden Zustandsübergängen betrieblicher Objekte sichtbar: Die betriebli-che Transaktion Produktinfo wird gemeinsam von den beiden Aufgaben A> und >Adurchgeführt. Die beiden Aufgaben operieren auf dem Speicher der Objekte Handelsbe-trieb bzw. Kunde. Jede der beiden Aufgabendurchführungen stellt eine ACID-Transaktion (siehe Abschnitt 2.2) dar und führt zu einem konsistenzerhaltenden Zu-standsübergang im jeweiligen Objekt. Durch eine Aufgabendurchführung geht der Spei-cher des jeweiligen betrieblichen Objekts von einem konsistenten Vorzustand in einenwiederum konsistenten Nachzustand über. Anhand der betrieblichen Transaktion Pro-duktinfo sind die beiden Aufgabendurchführungen gekoppelt, d. h. die beiden ACID-Transaktionen können nur gemeinsam durchgeführt werden. Mit anderen Worten, ihrebeiden Kontrollsphären sind durch eine umfassende Kontrollsphäre miteinander verbun-den. In analoger Weise erfolgen gekoppelte Aufgabendurchführungen für die Transakti-onen Auftrag und Lieferung.
In der „dritten Sicht“, dem Zustandsschema, steht nun die Entwicklung der Zustände deran einem Geschäftprozess beteiligten Objekte im Vordergrund. Im Zustandsschema deraggregierten Ebene gehen die Objekte Handelsbetrieb und Kunde bei der Durchführungder Aufgaben GD> bzw. >GD von einem Startzustand in einen konsistenten Folgezu-stand über. Diese Nachzustände der Aufgabendurchführungen werden mit dem Namender Aufgabe bezeichnet, d. h. der Zustand GD> ist der Nachzustand der Durchführungder Aufgabe GD>. Da die beiden Aufgabendurchführungen GD> und >GD durch diebetriebliche Transaktion Güterdistribution gekoppelt sind, gehen die Objekte Handels-betrieb und Kunde synchron in die Zustände GD> bzw. >GD über.
Auf der aggregierten Ebene führt die Durchführung des Geschäftsprozesses in den Ob-jekten Handelsbetrieb und Kunde lediglich zu jeweils einem Zustandsübergang undfolglich einem zugehörigen Folgezustand, welcher gleichzeitig den Endzustand desjeweiligen Objekts im Rahmen der jeweiligen Geschäftsprozessdurchführung darstellt.Auf der detaillierten Ebene besteht die Durchführung des Geschäftsprozesses aus dreiTeiltransaktionen, welche in drei Aufgabenpaaren der Objekte Handelsbetrieb und Kun-
247
de ausgeführt werden. Auf den Startzustand der Objekte folgt somit eine Sequenz vondrei Nachzuständen, die aufgrund der gekoppelten Aufgabendurchführungen (Zustands-übergänge) synchron erreicht werden.
Jeder Nachzustand einer transaktionsbezogenen Aufgabendurchführung stellt einenkonsistenten Zwischen- oder Endzustand des jeweiligen betrieblichen Objekts in Bezugauf die aktuelle Instanz einer Geschäftsprozessdurchführung dar. Ein konsistenter End-zustand des gesamten betrieblichen Systems in Bezug auf die aktuelle Geschäftsprozess-instanz wird dann erreicht, wenn alle an der Geschäftsprozessdurchführung beteiligtenbetrieblichen Objekte einen Endzustand erreicht haben. Ist dies nicht der Fall, d h. esbefinden sich zwei oder mehrere betriebliche Objekte nicht in einem Endzustand, soliegt bezüglich der Ausführung der jeweiligen Geschäftsprozessinstanz ein inkonsisten-ter Zustand vor. Die Ausführung des Geschäftsprozesses muss in diesem Fall fortgesetzt,oder wenn dies nicht möglich ist, rückabgewickelt werden.
Zum Beispiel könnte bei dem Beispiel in Abbildung 1 die Situation eintreten, dass dieLieferung der beauftragten Güter nicht durchgeführt werden kann. In diesem Fall kannder gekoppelte Zustandsübergang von >V nach D> in Handelsbetrieb und von V> nach>D in Kunde nicht vollzogen werden. Der Ausführungszustand des betrieblichen Sys-tems ist in Bezug auf die vorliegende Geschäftsprozessinstanz inkonsistent, da zwar eingültiger Auftrag vorliegt, dieser aber nicht ausgeführt werden kann. In diesem Fall ist esnotwendig, die Zwischenzustände der Objekte sukzessive in Startzustände zurückzufüh-ren und damit die Wirkungen der durchgeführten betrieblichen Transaktionen bzw. ihrerzugehörigen ACID-Transaktionen zu kompensieren.
Um dies zu ermöglichen ist im konzeptuellen Zustandsschema bei Handelsbetrieb einkompensierender Zustandsübergang Auftrag stornieren von >V nach A> vorzusehen, dermit einem korrespondierenden Zustandsübergang bei Kunde von V> nach >A gekoppeltist. Weiter ist in Handelsbetrieb ein Zustandsübergang Produktinfo zurückziehen von A>zum Startzustand und gekoppelt damit bei Kunde ein Übergang von >A zum Startzu-stand vorzusehen, welcher z. B. die übersandten Produktinformationen als ungültig er-klärt. Nach der Durchführung dieser beiden Zustandsübergänge sind die Wirkungen derunvollständig ausgeführten Geschäftsprozessinstanz kompensiert und das betrieblicheSystem befindet sich wiederum in einem konsistenten Zustand.
Die kompensierenden Zustandsübergänge lassen sich als inverse Transaktionen (Produk-tinfo zurückziehen als inverse Transaktion zu Produktinfo) interpretieren. Diese inversenTransaktionen müssen allerdings mit semantischem Bezug zum jeweiligen Geschäfts-prozessmodell spezifiziert werden. Sie sind somit nicht einfach technischer Natur, son-dern Gegenstand der konzeptuellen Modellierung. Zum Beispiel kann die zu Produktinfoinverse Transaktion im einen Fall darin bestehen, dass die Produktinformationen gegen-über dem Kunden als ungültig erklärt werden, im anderen Fall in einer leeren Transakti-on, welche die übersandten Produktinformationen unverändert beim Kunden belässt.
3.2 Methodische Fundierung und Ausführungsmodell von Zustandsschemata
Die in Abschnitt 3.1 verwendeten Modellbausteine zur Darstellung von Zustandssche-mata sind in Abbildung 2 in Form einer Legende zusammengefasst. Der Zustandsraum
248
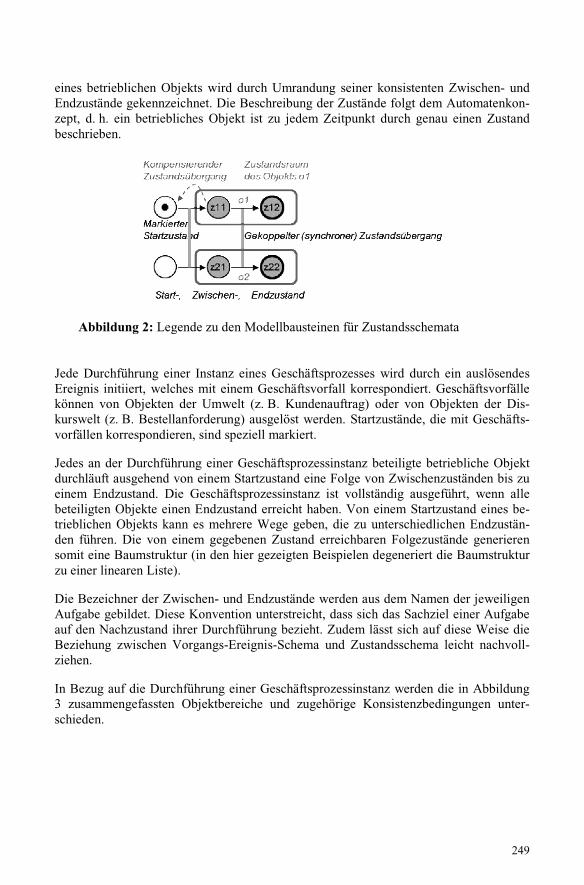
eines betrieblichen Objekts wird durch Umrandung seiner konsistenten Zwischen- undEndzustände gekennzeichnet. Die Beschreibung der Zustände folgt dem Automatenkon-zept, d. h. ein betriebliches Objekt ist zu jedem Zeitpunkt durch genau einen Zustandbeschrieben.
Abbildung 2: Legende zu den Modellbausteinen für Zustandsschemata
Jede Durchführung einer Instanz eines Geschäftsprozesses wird durch ein auslösendesEreignis initiiert, welches mit einem Geschäftsvorfall korrespondiert. Geschäftsvorfällekönnen von Objekten der Umwelt (z. B. Kundenauftrag) oder von Objekten der Dis-kurswelt (z. B. Bestellanforderung) ausgelöst werden. Startzustände, die mit Geschäfts-vorfällen korrespondieren, sind speziell markiert.
Jedes an der Durchführung einer Geschäftsprozessinstanz beteiligte betriebliche Objektdurchläuft ausgehend von einem Startzustand eine Folge von Zwischenzuständen bis zueinem Endzustand. Die Geschäftsprozessinstanz ist vollständig ausgeführt, wenn allebeteiligten Objekte einen Endzustand erreicht haben. Von einem Startzustand eines be-trieblichen Objekts kann es mehrere Wege geben, die zu unterschiedlichen Endzustän-den führen. Die von einem gegebenen Zustand erreichbaren Folgezustände generierensomit eine Baumstruktur (in den hier gezeigten Beispielen degeneriert die Baumstrukturzu einer linearen Liste).
Die Bezeichner der Zwischen- und Endzustände werden aus dem Namen der jeweiligenAufgabe gebildet. Diese Konvention unterstreicht, dass sich das Sachziel einer Aufgabeauf den Nachzustand ihrer Durchführung bezieht. Zudem lässt sich auf diese Weise dieBeziehung zwischen Vorgangs-Ereignis-Schema und Zustandsschema leicht nachvoll-ziehen.
In Bezug auf die Durchführung einer Geschäftsprozessinstanz werden die in Abbildung3 zusammengefassten Objektbereiche und zugehörige Konsistenzbedingungen unter-schieden.
249
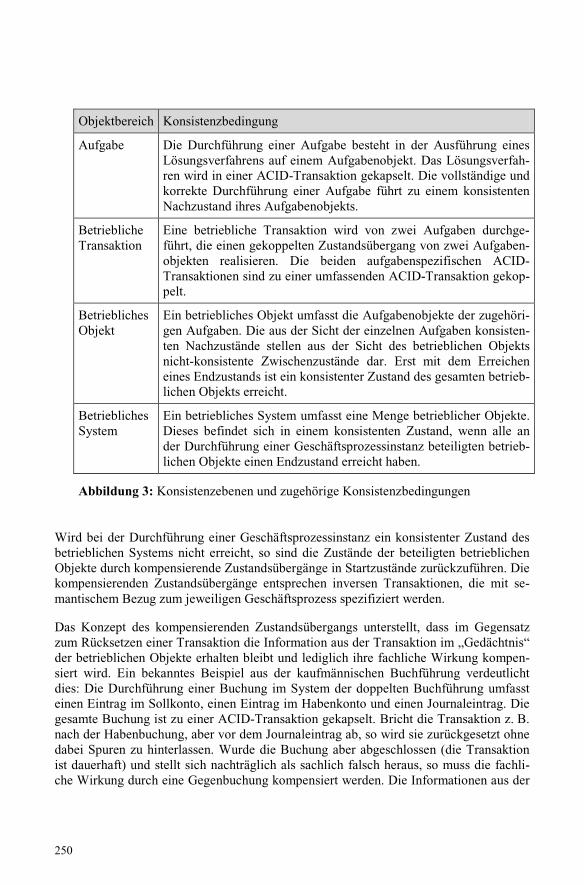
Objektbereich Konsistenzbedingung
Aufgabe Die Durchführung einer Aufgabe besteht in der Ausführung einesLösungsverfahrens auf einem Aufgabenobjekt. Das Lösungsverfah-ren wird in einer ACID-Transaktion gekapselt. Die vollständige undkorrekte Durchführung einer Aufgabe führt zu einem konsistentenNachzustand ihres Aufgabenobjekts.
BetrieblicheTransaktion
Eine betriebliche Transaktion wird von zwei Aufgaben durchge-führt, die einen gekoppelten Zustandsübergang von zwei Aufgaben-objekten realisieren. Die beiden aufgabenspezifischen ACID-Transaktionen sind zu einer umfassenden ACID-Transaktion gekop-pelt.
BetrieblichesObjekt
Ein betriebliches Objekt umfasst die Aufgabenobjekte der zugehöri-gen Aufgaben. Die aus der Sicht der einzelnen Aufgaben konsisten-ten Nachzustände stellen aus der Sicht des betrieblichen Objektsnicht-konsistente Zwischenzustände dar. Erst mit dem Erreicheneines Endzustands ist ein konsistenter Zustand des gesamten betrieb-lichen Objekts erreicht.
BetrieblichesSystem
Ein betriebliches System umfasst eine Menge betrieblicher Objekte.Dieses befindet sich in einem konsistenten Zustand, wenn alle ander Durchführung einer Geschäftsprozessinstanz beteiligten betrieb-lichen Objekte einen Endzustand erreicht haben.
Abbildung 3: Konsistenzebenen und zugehörige Konsistenzbedingungen
Wird bei der Durchführung einer Geschäftsprozessinstanz ein konsistenter Zustand desbetrieblichen Systems nicht erreicht, so sind die Zustände der beteiligten betrieblichenObjekte durch kompensierende Zustandsübergänge in Startzustände zurückzuführen. Diekompensierenden Zustandsübergänge entsprechen inversen Transaktionen, die mit se-mantischem Bezug zum jeweiligen Geschäftsprozess spezifiziert werden.
Das Konzept des kompensierenden Zustandsübergangs unterstellt, dass im Gegensatzzum Rücksetzen einer Transaktion die Information aus der Transaktion im „Gedächtnis“der betrieblichen Objekte erhalten bleibt und lediglich ihre fachliche Wirkung kompen-siert wird. Ein bekanntes Beispiel aus der kaufmännischen Buchführung verdeutlichtdies: Die Durchführung einer Buchung im System der doppelten Buchführung umfassteinen Eintrag im Sollkonto, einen Eintrag im Habenkonto und einen Journaleintrag. Diegesamte Buchung ist zu einer ACID-Transaktion gekapselt. Bricht die Transaktion z. B.nach der Habenbuchung, aber vor dem Journaleintrag ab, so wird sie zurückgesetzt ohnedabei Spuren zu hinterlassen. Wurde die Buchung aber abgeschlossen (die Transaktionist dauerhaft) und stellt sich nachträglich als sachlich falsch heraus, so muss die fachli-che Wirkung durch eine Gegenbuchung kompensiert werden. Die Informationen aus der
250

ursprünglichen Buchung und der Gegenbuchung bleiben jedoch in den Konten und imJournal dauerhaft erhalten.
4 Fallbeispiel: Reisebuchung
Ein Kunde beauftragt eine Agentur (Reisebüro) mit der Buchung einer Reise. Die zubuchenden Leistungen umfassen Flug, Mietwagen und Hotel. Nur wenn alle drei Be-standteile gebucht werden können, ist das Sachziel der Reisebuchung erreicht. Das Inter-aktionsschema des Geschäftsprozesses ist in Abbildung 4 dargestellt. Es umfasst diebetrieblichen Objekte Kunde (Umweltobjekt) sowie Agentur, Fluglinie, Autovermietungund Hotel (Diskursweltobjekte). Beauftragungen werden durch Vereinbarungstransakti-onen (V), die zugehörige Leistungserbringung in Form von Durchführungstransaktionen(D) modelliert. Die lose gekoppelten und mithilfe von betrieblichen Transaktionen koor-dinierten Objekte stellen ein verteiltes System dar.
Abbildung 4: Interaktionsschema (IAS) für das Beispiel Reisebuchung
Das zugehörige Vorgangs-Ereignis-Schema zeigt Abbildung 5. Die Bezeichner der Auf-gaben der betrieblichen Objekte sind aus den Namen der Transaktionen abgeleitet, wel-che diese Aufgaben durchführen. Zum Beispiel wird die Transaktion V: Reisebuchungs-auftrag durch die Aufgabe RA> („Senden Reisebuchungsauftrag“) von Kunde und >RA(„Empfangen Reisebuchungsauftrag“) von Agentur durchgeführt. Aufgaben innerhalbeines Objekts werden durch objektinterne Ereignisse verknüpft (z. B. >FB und MA> imObjekt Agentur). Auf diese Weise werden Reihenfolgebeziehungen zwischen Transakti-onen hergestellt. Jedes objektinterne Ereignis korrespondiert mit dem Nachzustand einervorausgehenden Aufgabendurchführung und dem Vorzustand der folgenden Aufgaben-durchführung (im genannten Beispiel korrespondiert das objektinterne Ereignis mit demNachzustand der Aufgabe >FB und dem Vorzustand der Aufgabe MA>).
AgenturKunde
D: Reisebuchung
Fluglinie
Autover-mietung
Hotel
V: Reisebuchungsauftrag
V: Flugbuchungsauftrag
D: Flugbuchung
V: Mietwagenbuchungsauftrag
D: Mietwagenbuchung
V: Hotelbuchungsauftrag
D: Hotelbuchung
251

Abbildung 5: Vorgangs-Ereignis-Schema (VES) für das Beispiel Reisebuchung
Abbildung 6: Zustandsschema für das Beispiel Reisebuchung
Abbildung 6 zeigt das Zustandsschema als „dritte Sicht“ für das Beispiel Reisebuchung.Das initiale Ereignis ist die Auslösung eines Reisebuchungsauftrags durch Kunde. Die-ses Ereignis führt zu einem gekoppelten, synchronen Zustandsübergang der Objekte
252

Kunde und Agentur im Rahmen der Durchführung der Transaktion Reisebuchungsauf-trag. Die diese Transaktion ausführenden Aufgaben RA> und >RA hinterlassen gleich-namige Zwischenzustände der Objekte Kunde und Agentur. Die Reisebuchung ist voll-ständig durchgeführt, wenn die Objekte Kunde, Agentur, Fluglinie, Autovermietung undHotel in ihren Endzuständen angekommen sind.
Wird dieser globale Zustand nicht erreicht oder soll die vollständig abgeschlossene Rei-sebuchung storniert werden (etwa innerhalb vorgesehener Rücktrittsfristen), so müssendie Zustände der an der Durchführung der Geschäftsprozessinstanz beteiligten betriebli-chen Objekte in ihre jeweiligen Startzustände zurückgeführt werden. Dies erfolgt durchdie Auslösung und Durchführung kompensierender Zustandsübergänge. Jeder dieserkompensierenden Zustandsübergänge wirkt wie eine inverse Transaktion und besteht inder Rückabwicklung eines gekoppelten Zustandsübergangs zweier betrieblicher Objekte.Es ist ausreichend, wenn eines der beiden betrieblichen Objekte den kompensierendenZustandsübergang auslöst, weil es das andere Objekt aufgrund der synchronen Kopplung„mitnimmt“. Wichtig ist, dass das Zustandsschema für jeden gekoppelten Zustandsüber-gang einen kompensierenden Zustandsübergang bei mindestens einem der beiden Objek-te vorsieht. Diese Spezifikation der kompensierenden Zustandsübergänge in geeigneterForm und mit semantischem Bezug zum jeweiligen Geschäftsprozess ist der wesentlicheMehrwert, der durch das Zustandsschema erreicht wird.
Zielzustand Startzustand Aktion
RB> >HB Kunde storniert abgeschlossene Reisebuchung. Inner-halb der Rücktrittsfrist mit der Rückabwicklung begin-nen, sonst keine Aktion.
>HB HA> Hotelbuchung gegenüber dem Hotelier stornieren, ggf.alternativen Hotelier suchen und Prozess fortsetzen.
HA> >MB Mit der Mietwagenbuchung fortsetzen.
>MB MA> Mietwagenbuchung gegenüber dem Mietwagenanbieterstornieren, ggf. Alternative suchen und Prozess fortset-zen.
MA> >FB Mit der Flugbuchung fortsetzen.
>FB FA> Flugbuchung gegenüber dem Fluganbieter stornieren,ggf. Alternative suchen und Prozess fortsetzen.
FA> >RA Mit der Reisebuchung fortsetzen.
>RA leer Reisebuchungsauftrag gegenüber dem Kunden stornie-ren.
Abbildung 7: Aktionen des Teilsystems Agentur zur Rückabwicklung von Reisebu-
chungsaufträgen
253

Zum Beispiel ergeben sich für das betriebliche Objekt Agentur die in Abbildung 7 ge-zeigten Anforderungen. Stornierungskosten und -fristen werden hierbei nicht betrachtet.Diese könnten z. B. die Gestaltung des Geschäftsprozesses beeinflussen, z. B. die Rei-henfolge von Flug-, Mietwagen- und Hotelbuchung.
Abbildung 8: Geschäftsprozessabbruch im Zustandsschema für das Beispiel Reise-
buchung
Angenommen, in einer Instanz des Geschäftsprozesses Reisebuchung ist die Hotelbu-chung nicht ausführbar und der Prozess auch nicht mit einer alternativen Hotelbuchungabschließbar, dann ist die Rückabwicklung einzuleiten. Wie Abbildung 8 zeigt, befindensich zu diesem Zeitpunkt die Objekte Fluglinie und Mietwagen in ihrem Endzustand, dieObjekte Agentur und Hotel im Zustand HA> bzw. >HA und das Objekt Kunde im Zu-stand RA> nach Erteilung des Reisebuchungsauftrags. Die sich daraus ergebende Kon-trollsphäre ist als gefärbte Fläche hinterlegt; sie umfasst die Menge der von der Rückab-wicklung betroffenen Zustände.
Dass die Hotelbuchung nicht ausführbar ist, wird vom Objekt Hotel erkannt; dieses Ob-jekt löst den kompensierenden Zustandsübergang Hotelbuchungsauftrag stornieren aus,wodurch es selbst in den Startzustand, das Objekt Agentur in den Zustand >MB über-geht. Nun liegt es am Objekt Agentur, welches die drei Teilbuchungen koordiniert, denÜbergang Mietwagenbuchung stornieren auszulösen, wodurch es selbst in den ZustandMA>, das Objekt Autovermietung in den Zustand >MA übergeht. Autovermietung löstdanach Mietwagenbuchungsauftrag stornieren aus, überführt dabei sich selbst in denStartzustand und Agentur in den Zustand >FB. Es folgt in gleicher Weise die Stornie-rung der Flugbuchung und schließlich das Stornieren des Reisebuchungsauftrags durchdie Agentur gegenüber dem Kunden. Damit sind alle betrieblichen Objekte in Bezug aufdie Durchführung der aktuellen Geschäftsprozessinstanz in ihren Startzustand zurückge-führt.
254
5 Diskussion des vorgestellten Ansatzes zur Zustandsmodellierung
Es stellt sich die Frage, welchen Mehrwert die Zustandssicht als „dritte Sicht“ neben derStruktursicht und der Ablaufsicht für die konzeptuelle Modellierung von IS beisteuert.Das Zustandsschema
• visualisiert für die einzelnen betrieblichen Objekte die während der Durchfüh-rung eines Geschäftsprozessinstanz auftretenden Zwischen- und Endzustände,
• beschreibt mit semantischem Bezug zum jeweiligen Geschäftsprozessmodelldie kompensierenden Zustandsübergänge, die im betrieblichen System notwen-dig bereitzustellen sind,
• spezifiziert Folgen von kompensierenden Zustandsübergängen, die geeignetsind, um die betrieblichen Objekte aus jedem beliebigen Zustand heraus in ei-nen global konsistenten Zustand rückführen zu können.
Die kompensierenden Zustandsübergänge beschreiben einen wesentlichen Teil der Aus-führungssemantik eines Geschäftsprozessmodells und können daher nur mit fachlichemBezug zu diesem spezifiziert werden. Aus diesem Grund sind die im Zustandsschemazusätzlich bereitgestellten Spezifikationen konzeptueller Natur und fördern die Analyseund Gestaltung der Aufgabenebene eines verteilten IS. Hier ist insbesondere die Verbin-dung des Konzepts der betrieblichen Transaktion mit dem aus der Datenbanktechnikbekannten ACID-Transaktionskonzept hilfreich.
Darüber hinaus stellt das Zustandsschema Anforderungen an die Gestaltung der Aufga-benträgerebene bereit. Gerade mit Bezug zu serviceorientierten Anwendungssystemen,die ggf. teilweise erst zur Laufzeit aus Diensten konfiguriert werden, kann erwartet wer-den, dass die damit einhergehende Komplexität ohne konzeptuelle Zustandsmodelle nurschwer beherrschbar sein dürfte. Zum Beispiel ist ein Dienst nur dann in einem verteiltenAnwendungssystem einsetzbar, wenn er gleichzeitig die notwendigen Kompensationenbereitstellt. Insofern sollte die konzeptuelle Zustandsmodellierung einen nennenswertenBeitrag zum Entwurf und zur Implementierung zuverlässiger verteilter Anwendungssys-teme liefern können.
Zustandsschemata behandeln die Zustandskonsistenz von IS auf der Aufgabenebene.Bezüglich der Gestaltung der Aufgabenträgerebene bestehen erhebliche Freiheitsgrade.Idealerweise sollten die Objekte eines verteilten IS durch transaktionsgeschützte verteilteAnwendungssysteme unterstützt werden. Inwieweit die einzelnen Teilanwendungssys-teme unter der Kontrolle eines Transaktionsmanagers ablaufen oder ob Kompensations-funktionen implementiert werden müssen, inwieweit die Transaktionskonzepte (verteil-ter) Datenbanksysteme eingesetzt werden usw. sind dabei Fragen der Anwendungssys-tem-Architektur und der IT-Infrastruktur (z. B. transaktionsorientierte Middleware).
Bezüglich der Spezifikation workflow-basierter betrieblicher Anwendungssysteme istinsbesondere zu untersuchen, welchen Nutzen die Zustandsschemata für die (modellge-triebene) Spezifikation von Workflows bieten. Workflow-Sprachen scheinen hierfürgünstige Voraussetzungen zu bieten, da sie eine Differenzierung von Teilsystemen undeine Beschreibung der Interaktion zwischen Teilsystemen unterstützen.
255

Literaturverzeichnis
[BPMN11] Business Process Model and Notation (BPMN), Version 2.0, 2011-01-03.http://www.omg.org/spec/BPMN/2.0/PDF/ (Abruf am 2013-10-09)
[Chen76] Chen, P.P.-S.: The Entity-Relationship Model – Toward a Unified View of Data. In:ACM Transactions on Database Systems, Vol. 1, No. 1 (1976), pp. 9-36
[Ens78] Enslow P.H.: What is a ‚Distributed‘ Data Processing System? In: IEEE Computer,Vol. 11, No. 1, January 1978, pp. 13-21
[FeSi90] Ferstl, O.K.; Sinz E.J.: Objektmodellierung betrieblicher Informationssysteme imSemantischen Objektmodell (SOM). In: WIRTSCHAFTSINFORMATIK 32 (1990) 6,S. 566-581
[FeSi91] Ferstl, O.K.; Sinz E.J.: Ein Vorgehensmodell zur Objektmodellierung betrieblicherInformationssysteme im Semantischen Objektmodell (SOM). In WIRTSCHAFTSIN-FORMATIK 33 (1991) 6, S. 477-491
[FeSi95] Ferstl, O.K.; Sinz E.J.: Der Ansatz des Semantischen Objektmodells (SOM) zur Mo-dellierung von Geschäftsprozessen. In: WIRTSCHAFTSINFORMATIK 37 (1995) 3,S. 209-220
[FeSi13] Ferstl, O.K.; Sinz E.J.: Grundlagen der Wirtschaftsinformatik. 7. Auflage, Oldenbourg,München 2013
[GrRe93] Gray, J.; Reuter, A.: Transaction Processing: Concepts and Techniques. MorganKaufmann, San Mateo, California 1993
[LoSc87] Lockemann, P.C.; Schmidt J.W.: Datenbank-Handbuch. Springer, Berlin 1987[Nütt13] Nüttgens, M.: EPK. In: Kurbel, Karl; Becker, Jörg; Gronau, Norbert; Sinz, Elmar;
Suhl, Leena (Herausgeber): Enzyklopädie der Wirtschaftsinformatik – Online-Lexikon. Siebte Auflage. München : Oldenbourg, 13.9.2013.http://www.enzyklopaedie-der-wirtschaftsinformatik.de (Abruf: 2013-10-08).
[OAS07] OASIS Web Services Business Process Execution Language Version 2.0, OASISStandard, 11 April 2007. http://docs.oasis-open.org/wsbpel/2.0/wsbpel-v2.0.pdf (Abrufam 2013-10-09)
[Reut87] Reuter, A.: Maßnahmen zur Wahrung von Sicherheits- und Integritätsbedingungen. In[LoSc87], S. 390-479
[Reis10] Reisig, W.: Petri-Netze. Modellierungstechnik, Analysemethoden, Fallstudien. Viewegund Teubner, Wiesbaden 2010
[Sinz88] Sinz E.J.: Das Strukturierte Entity-Relationship-Modell (SER-Modell). In: Angewand-te Informatik, Band 30, Heft 5 (1988), S. 191-202
[Tiwa11] Tiwari S.: Professional NoSQL. Wiley, Indianapolis 2011[UML11] OMG Unified Modeling Language (OMG UML), Superstructure, Version 2.4.1, 2011-
08-06. http://www.omg.org/spec/UML/2.4.1/Superstructure/PDF/ (Abruf am 2013-10-09)
256

Formal Semantics of Synchronous Transfer Architecture
Gordon Cichon, Martin Hofmann
Institut fur Informatik
Ludwig-Maxilimilians-Universitat Munchen
Oettingenstr. 67
81669 Munchen
Abstract: This paper explores the use of formal verification methods for complex andhighly parallel state machines. For this purpose, a framework named SynchronousTransfer Architecture (STA) is being used.
STA is a generic framework for digital hardware development that contains VLIW,FPGA, and hardwired ASIC architectures as corner cases. It maintains a strictly de-terministic system behavior in order to achieve substantial savings in hardware costs,thus enabling systems with high clock speed, low power consumption and small diearea. The high degree of parallelism requires a diligent development methodology toavoid implementation errors. Consequently, formal verification is the methodology ofchoice for reliable verification.
The contribution of this paper is a formal semantics for the STA hardware archi-tecture framework. This semantics is then used for the formal verification of an opti-mized parallel implementation of Fast Fourier Transformation (FFT) on STA. This isachieved using a combination of the semantics and symbolic evaluation.
1 Introduction
Synchronous Transfer Architecture [Cic04, CRS+04b] is an architectural framework for
the design of special purpose hardware which is used to assist the main processor at de-
manding computational tasks in small devices such as mobile phones or car electronics,
e.g. in advanced driver assistance systems (ADAS). Typical tasks to be offloaded to such
specialized hardware are signal processing algorithms such as FFT and filtering, algo-
rithms for error-correcting codes (Reed-Solomon, Viterbi), graphics and image processing,
and generic linear algebra (solving equation systems, least mean squares (LMS), singular
value decomposition (SVD), Kalman).
Traditionally, such components are implemented either as 1) application specific integrated
circuit (ASIC): hardwired circuitry is fast but costly to develop and verify; or as 2) field-
programmable gate array (FPGA): reconfigurable logical circuits are still reasonably fast
and less expensive to develop than ASIC, but costly to deploy due to high power consump-
tion and chip area; or as 3) digital signal processor (DSP): traditional DSPs do not offer
much parallelism, while state-of-the-art microprocessors have a rather high overhead for
runtime parallelization of sequential code.
257
Synchronous transfer architecture (STA) is an architectural framework designed for trad-
ing off among the three extremes described above. It allows a fine-grained tradeoff be-
tween cost of development and deployment on the one hand, and performance and power
consumption on the other. Additionally, and more importantly, STA relies on statically
determined parallelism which can considerably save hardware resources, and facilitates
simulation and verification.
STA is a collection of DSP components such as arithmetic logic unit (ALU), floating point
units, register files and memories, which are dynamically reconfigured. This reconfigura-
tion process can be regarded as a highly parallel assembly program that is read from an
instruction memory. All the components of an STA system operate synchronously and
in parallel. The assembly language facilitates the dispatch of simultaneous commands to
each of these units. Thus, the pipelining policy is exposed at the instruction set architec-
ture. As a result, the highly parallel STA programs may be difficult to understand for a
human reviewer. Thus, rigorous verification is essential as in the case of FPGA and ASIC.
On the other hand, due to the relatively high abstraction level of assembly language, com-
pared to register transfer language (RTL), rigorous verification is considerably easier than
for those.
This paper substantiates the claim that STA facilitates formal verification by providing a
formal semantic model of STA and using this model to give a formal functional verification
of an industrial-strength implementation of Fast Fourier Transform (FFT).
This paper considers a low-power hardware accelerator with a floating point adder and a
floating point multiplier. These two functional units operate in parallel with several integer
units (e.g. ALU) that maintain indices and loop counters and with the memories. Thus, it
serves as an example about how to deal with a high level of parallelism in such systems.
The FFT implementation considered in this paper completes in 5844 clock cycles. This
means near-optimal utilization of the employed floating point processing units. It is the
same level of performance that might be expected from a super-scalar microprocessor.
However, the STA system does not consume hardware resources for dynamic scheduling,
branch prediction, and so on. The STA system is a relatively frugal architecture that con-
sumes about the same area and power as a traditional 32-bit RISC micro-controller, with
higher performance. At the same time, the lack of dynamic scheduling makes the architec-
ture strictly deterministic, and thus much more favorable for safety-critical applications.
After describing more details about the STA framework, this paper will present a formal
semantic model of STA. This model takes the form of a mathematical function mapping a
configuration and its initial memory to its final memory contents. An implementation of
this function in a functional programming language (i.e. OCAML) renders it executable.
Besides providing a simulator of the STA, this function can be evaluated semantically us-
ing symbolic arithmetic expressions, rather than actual values. This allows us to compute
the result of the FFT in the form of a vector of symbolic arithmetic expressions.
These expressions can be proven to be indeed equal to the mathematical specification of
the FFT by employing automated symbolic algebra.
258

2 Related work
Related work can be categorized into two different areas: formal equivalence checking of
hardware at different levels of abstraction, and formal verification of pipeline implemen-
tations.
2.1 Formal Equivalence Checking
Formal equivalence checking is based on hardware models that are represented as finite
state machines (FSM). These finite state machines can either be implemented on the ab-
straction levels of silicon geometry, netlists of register transfer level (RTL). The purpose
of formal verification is mainly to prove the equivalence of the different models at various
abstraction levels.
Formal equivalence checking is also widespread in the EDA (electronic design automa-
tion) community. Almost every EDA vendor offers tools to establish formal equivalence
at different abstraction levels [SY, ADK08].
Formal equivalence checking can be performed either by binary decision diagrams (BDDs)
[Bry86, BD94] or by Boolean satisfiability (SAT) solvers [BCCZ99]. [BD02] uses integer
linear programming (ILP) to verify hardware design. This is an alternative to SAT solvers.
The system is described on register transfer level (RTL) as combinational logic that is
interpreted as a function that operates on bit vectors.
Bluespec [Arv03, AN08] presents a new hardware description approach based on func-
tional programming. This enables the methodology present in these logic programming
languages to be applied to hardware systems. Like in our approach, Bjesse chooses the
implementation of an FFT algorithm [Bje99]. However, his target architecture is FPGA,
while this paper explores STA.
Furthermore, this paper relies on the assumption that the FFT algorithm itself is function-
ally correctly specified (as given in [Cap01, Gam02]), and that the numerical stability is
provided (as given in [AT04]). These implementation-independent properties of the FFT
algorithm have been described in literature previously.
A very common implementation of such FSMs are sequential synchronous circuits (SSC).
As it will be explained below, synchronous transfer architectures (STA) are a special case
of such SSCs. Consequently, the methodology to ensure correctness of the lower abstrac-
tion layers of their implementation can be applied to STAs right away. In fact, an important
basis for the verification of STAs is the assumption that their correct implementation is ver-
ified using formal equivalence checks. In other words, formal verification of STAs relies
on the availability of the methods in this related work to be carried out thoroughly.
As noted, once formal reasoning on FSMs is taking place, it is obvious to also verify
certain analytical properties of them. This leads us to the second large area for formal
verification: the verification of pipeline processors, as described in the following sub-
section.
259

2.2 Pipeline Verification
A large class of system implementations are parallel processors. These are implemented
using pipelining and super-scalar scheduling. The conceptual model of these machines is
very simple: an ordered sequence of instructions that are supposed to be carried out one
after each other. On the other hand, their actual implementation in hardware is a different
story.
Intelligent hardware units take a sequential instruction stream, figure out at run-time which
parts of it can be carried out in parallel, and carry them out such that this parallelism
remains virtually invisible.
This is a huge challenge for hardware implementation. Besides consuming large amounts
of resources (die area, electrical power), these systems are very complex and consequently
error-prone and hard to verify. Consequently, formal verification has become essential in
order to ensure their correctness.
Here are some examples of this approach:
The most recent relevant work has been done by teams at IBM [MBP+04, Cam97], DEC
[BBJR97], and Intel [KSKH04]. Industrial strength work in formal verification of micro-
processor designs have been performed at Intel [KGN+09], and Centaur [SDSJ11].
Verification of a scalar pipelined RISC processor with the PVS theorem prover is described
in [Cyr94]. The processor used is relatively simple as it does not have the sophisticated
control of a super-scalar design. Verification of such processors with a focus on the control
part and using binary decision diagrams (BDDs) is described in [BD94].
[SJ] describes a framework for verifying a pipelined microprocessor whose implementa-
tion contains precise exceptions, external interrupts, and speculative execution using the
ACL2 theorem prover. The use of Isabelle by Hewlett-Packard in the design of the HP
9000 line of servers’ Runway bus lead to the discovery of a number of bugs uncaught by
previous testing and simulation [Cam97].
[Bey07] describes formal verification of a cache memory and its integration into an ARM
compatible microprocessor called VAMP. It includes an instruction set architecture (ISA)
model down to gate-level verification, and the Cambridge ARM model [Fox03] for for-
malization of this ISA.
[BBM+07] describes full formal verification of the Infineon Tricore processor. It does
not only check the correctness of specific properties of the design. It also checks for
completeness, i.e. whether all possible input scenarios are covered.
3 Synchronous Transfer Architecture (STA)
The Synchronous Transfer Architecture (STA) [Cic04, CRS+04b] is an architectural frame-
work that enables the design of high-performance, low-power reconfigurable hardware
systems. STA aims to shift the effort for the execution of parallel operations from hard-
260

ware to software.
STA is focused on simplicity and aimed to avoid implementation bottlenecks of super-
scalar processors and is thus efficient in hardware. It requires neither local queues for
collecting operands, nor a controller that determines when exactly an operation is to be
started. In a predictable execution environment, the STA approach triggers the execution
of operations explicitly by supplying control signals from its configuration. In contrast to
traditional FPGAs, the configuration can change on a per-cycle basis, thus enabling more
effective resource sharing.
(a) Modules (b) Machine Description (UML)
Figure 1: Synchronous Transfer Architecture (STA)
Figure 1(a) shows the architectural framework of STA. The processor is split into an arbi-
trary number of modules, each with arbitrary input and output ports. To facilitate hardware
synthesis and timing analysis, it is required that all output ports be buffered. Each input
port is connected to a design-dependent set of output ports, as shown in Figure 2(a). For
each computational resource, its STA configuration contains the control signals (opcode)
for the functional unit and the multiplexer controls the sources of all input ports and asso-
ciated immediate fields. (A multiplexer is an electronic device that selects one of several
input signals, which one is dependent on a control signal, and forwards it to its output
signal.)
Figure 1(b) shows an UML diagram of a STA architecture. A STA core consists of a set of
modules. Each module can be either a functional unit performing some computation, or it
can be a state module, i.e. a register file or memory. This subdivision enables one to target
STA systems with compilers [Cic04, CRS+04a].
In [Cic04], it is demonstrated how arbitrary hardware architectures can be reformulated as
STA. This is performed by subdividing the existing hardware modules into their functional
and state-specific portion. Figure 2(a) shows all input multiplexers together forming the
interconnection matrix between the output and input ports. This system constitutes the
synchronous data flow network. The switching matrix may implement arbitrary connec-
tions depending on the application, performance, and power-saving requirements.
In the example shown in Figure 2(a), it can also be seen that this interconnection matrix
does not need to be fully populated. For example, the input ports of the functional units
261

only have connections to one read port of the register file, not to all three of them.
(a) STA: Interconnection Network (b) Block Diagram
Figure 2: Raccoon
The connection from each output of any functional unit to a write port of a register file
is mandatory. While there is a connection from the output of the multiplier to the input
of the adder, there is no direct connection from the output of the adder to the input of the
multiplier. Operands that need to go this path needs to be routed through the register file.
By this reduced inter-connectivity, the complexity of the interconnection network can be
reduced from O(n2)
to a lower complexity class, in case of highly parallel architectures
with a large number of functional units.
4 Raccoon Arithmetic Accelerator
The FFT algorithm that is formally verified in this paper is implemented on a specific
STA implementation: the Raccoon Arithmetic’s Accelerator. Figure 2(b) shows a block
diagram of the architecture.
It is a small example design, architected to match the die area and power consumption of
simple RISC 32-bit embedded micro-controllers, while offering a higher performance.
Raccoon is a simple floating point accelerator with one floating point adder and one float-
ing point multiplier. Around these, there are additional modules that are designed to sup-
port the computational resources running at maximum throughput. These resources are:
integer arithmetic (ALU, multiplier, barrel shifter, conditional unit), logical unit, register
files at word and bit level, data memory, instruction memory.
262
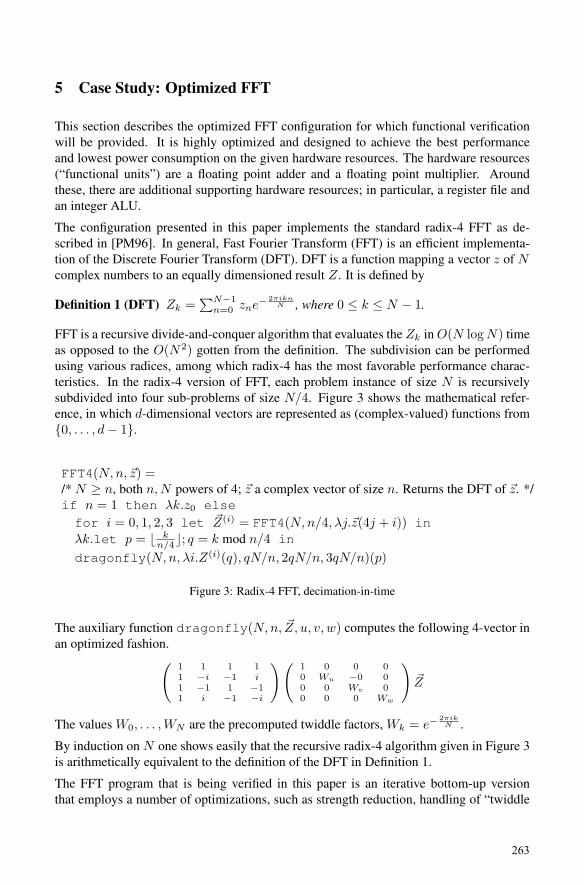
5 Case Study: Optimized FFT
This section describes the optimized FFT configuration for which functional verification
will be provided. It is highly optimized and designed to achieve the best performance
and lowest power consumption on the given hardware resources. The hardware resources
(“functional units”) are a floating point adder and a floating point multiplier. Around
these, there are additional supporting hardware resources; in particular, a register file and
an integer ALU.
The configuration presented in this paper implements the standard radix-4 FFT as de-
scribed in [PM96]. In general, Fast Fourier Transform (FFT) is an efficient implementa-
tion of the Discrete Fourier Transform (DFT). DFT is a function mapping a vector z of Ncomplex numbers to an equally dimensioned result Z. It is defined by
Definition 1 (DFT) Zk =∑N−1
n=0 zne− 2πikn
N , where 0 ≤ k ≤ N − 1.
FFT is a recursive divide-and-conquer algorithm that evaluates the Zk in O(N logN) time
as opposed to the O(N2) gotten from the definition. The subdivision can be performed
using various radices, among which radix-4 has the most favorable performance charac-
teristics. In the radix-4 version of FFT, each problem instance of size N is recursively
subdivided into four sub-problems of size N/4. Figure 3 shows the mathematical refer-
ence, in which d-dimensional vectors are represented as (complex-valued) functions from
{0, . . . , d− 1}.
FFT4(N,n, Mz) =/* N ≥ n, both n,N powers of 4; Mz a complex vector of size n. Returns the DFT of Mz. */
if n = 1 then λk.z0 else
for i = 0, 1, 2, 3 let MZ(i) = FFT4(N,n/4, λj.Mz(4j + i)) in
λk.let p = - kn/4+; q = k mod n/4 in
dragonfly(N,n, λi.Z(i)(q), qN/n, 2qN/n, 3qN/n)(p)
Figure 3: Radix-4 FFT, decimation-in-time
The auxiliary function dragonfly(N,n, MZ, u, v, w) computes the following 4-vector in
an optimized fashion.(1 1 1 11 −i −1 i1 −1 1 −11 i −1 −i
)(1 0 0 00 Wu −0 00 0 Wv 00 0 0 Ww
)MZ
The values W0, . . . ,WN are the precomputed twiddle factors, Wk = e−2πikN .
By induction on N one shows easily that the recursive radix-4 algorithm given in Figure 3
is arithmetically equivalent to the definition of the DFT in Definition 1.
The FFT program that is being verified in this paper is an iterative bottom-up version
that employs a number of optimizations, such as strength reduction, handling of “twiddle
263
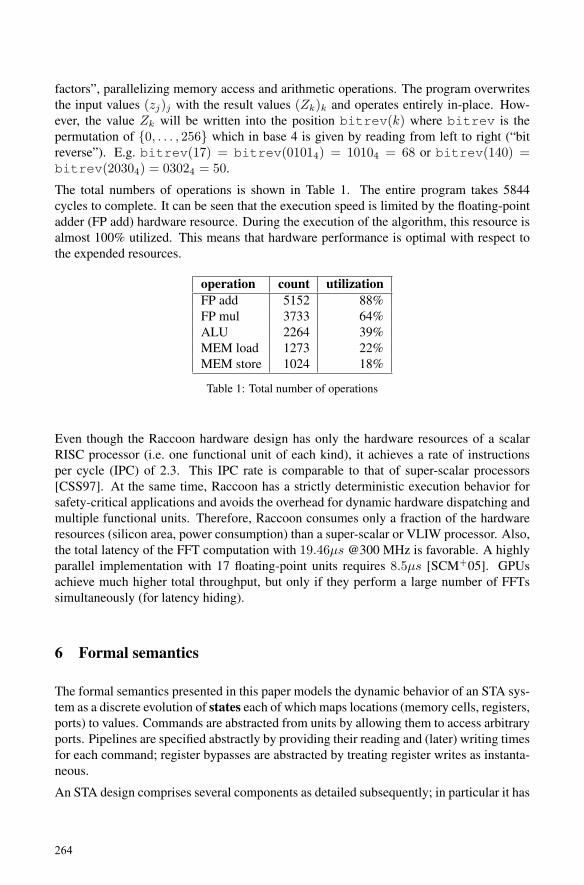
factors”, parallelizing memory access and arithmetic operations. The program overwrites
the input values (zj)j with the result values (Zk)k and operates entirely in-place. How-
ever, the value Zk will be written into the position bitrev(k) where bitrev is the
permutation of {0, . . . , 256} which in base 4 is given by reading from left to right (“bit
reverse”). E.g. bitrev(17) = bitrev(01014) = 10104 = 68 or bitrev(140) =bitrev(20304) = 03024 = 50.
The total numbers of operations is shown in Table 1. The entire program takes 5844
cycles to complete. It can be seen that the execution speed is limited by the floating-point
adder (FP add) hardware resource. During the execution of the algorithm, this resource is
almost 100% utilized. This means that hardware performance is optimal with respect to
the expended resources.
operation count utilization
FP add 5152 88%
FP mul 3733 64%
ALU 2264 39%
MEM load 1273 22%
MEM store 1024 18%
Table 1: Total number of operations
Even though the Raccoon hardware design has only the hardware resources of a scalar
RISC processor (i.e. one functional unit of each kind), it achieves a rate of instructions
per cycle (IPC) of 2.3. This IPC rate is comparable to that of super-scalar processors
[CSS97]. At the same time, Raccoon has a strictly deterministic execution behavior for
safety-critical applications and avoids the overhead for dynamic hardware dispatching and
multiple functional units. Therefore, Raccoon consumes only a fraction of the hardware
resources (silicon area, power consumption) than a super-scalar or VLIW processor. Also,
the total latency of the FFT computation with 19.46µs @300 MHz is favorable. A highly
parallel implementation with 17 floating-point units requires 8.5µs [SCM+05]. GPUs
achieve much higher total throughput, but only if they perform a large number of FFTs
simultaneously (for latency hiding).
6 Formal semantics
The formal semantics presented in this paper models the dynamic behavior of an STA sys-
tem as a discrete evolution of states each of which maps locations (memory cells, registers,
ports) to values. Commands are abstracted from units by allowing them to access arbitrary
ports. Pipelines are specified abstractly by providing their reading and (later) writing times
for each command; register bypasses are abstracted by treating register writes as instanta-
neous.
An STA design comprises several components as detailed subsequently; in particular it has
264

sets of locations, values, and commands, as detailed below in Specifications 1, 2, 3 below.
These have been called specifications rather than definitions since they specify a format
rather than a mathematical object.
Specification 1 (Locations) The set of ports is written as port. It comprises output
ports of STA units, such as memories, ALUs, floating point units, register files, etc. Ports
are volatile in that values written to them are readable only in the same time slot they are
written. A special port pc represents the program counter and another port done helps
detecting program termination. The set of registers is denoted by reg, while the set of
(data) memory addresses is denoted by addr. All these sets are assumed to be pairwise
disjoint and define the set of locations by loc = port ∪ reg ∪ addr.
Specification 2 (Values) The set of values is written as value, comprising bits, integers,
memory addresses (addr), program locations, floating point values, etc. value is lifted
and thus contains a special value ⊥ representing undefinedness. For example, all ports
and registers contain ⊥ at the beginning of execution.
The choice of these sets of course depends on the particular STA design to be modeled as
do the operations to be defined later on.
Definition 2 (States) A state is a function σ : loc → value representing the contents
of all locations, i.e., memory cells, registers and ports.
Specification 3 (Commands) command denotes the set of commands which comprise the
following four kinds:
• Operations are quintuples written oper(srcs,dest,rdts,wrt,opn), where
srcs ⊆ port and dest : loc and rdts : srcs → N (reading times) and
wrt ∈ N (writing time) and opn : (srcs → value) → value (execution func-
tion). It is required that wrt > rdts(p) for all p ∈ srcs. The idea is that if this
command is issued at time t0 then each port s ∈ srcs is read at time t0+rdts(s)yielding value vs. Then, at time t0 + wrt the result opn(λs.vs) is written into
dest.
• Register Writes are pairs written regwr(src,dest) where src ∈ port and
dest ∈ reg; when such a command is issued then the value of src is instantly
written into the register dest. In practice, the value can be written only one step
later, but bypasses ensure that the effect is the same.
• Memory loads are written load(src,dest, t1, t2, t3) where src,dest ∈ portand t1, t2 < t3. When the load command is issued at time t0, the following activities
take place on the ports: At time t0 + t1 a value v is read from the port src; at time
t0 + t2 a value v′ is read from memory address v and written at time t0 + t3 to port
dest.
265

• Memory stores are written store(src,dest, t1, t2, t3) where src,dest ∈ portand t1, t2 < t3. The command is assumed to be issued at time t0. At time t0 + t1 a
value v is read from the port src; at time t0 + t2 a value v′ is read from port destand then v is written into memory address v′ at time t0 + t3.
In any of these commands attempting to look up an undefined value will result in an un-
defined overall result. In a particular STA design only a small subset of the possible com-
mands will be available. (This semantics includes all mathematical functions on values.
Not all of these are actually realized in a concrete STA design.)
Example 1 (Integer Addition) For example the integer addition statement
salu.add sreg.r1 decoder.imm
that adds the contents of sreg.r1 and decoder.imm and places the result into salu.xis represented as
oper( {sreg.r1,decoder.imm},salu.x,[sreg.r1 /→ 0,decoder.imm /→ 0], 1,op)
where op(f) = f(sreg.r1) ⊕ f(decoder.imm) and ⊕ is 32 bit integer addition.
(f is a function from srcs (here sreg.r1, decoder.imm) to values according to the
definition ”Commands”, which will be given later.) To be precise, this statement is being
modeled as several operations; the one just given and the other ones setting appropriate
flags. As Chapter 5 of [COR+95] explains, this a common way for modeling machine
instructions as arbitrary functions.
Definition 3 (Histories) A history h is a function from negative integer numbers (-1,-2,-
3,. . . ) to states. It represents the previous few states that are relevant for the evaluation of
a command. Most states (and in particular all but finitely many) of the states in a history
will be everywhere undefined. Attempting to access an undefined value will as usual result
in an error. The set of histories is written as hist.
Definition 4 (Updates) An update is a finite partial function loc → value∪loc. The
set of updates is written as update. u ⊕ u′ denotes the union of two updates if it is a
partial function again; otherwise u ⊕ u′ is undefined. An update u with )(u) ⊆ valueis normal.
Lemma 1 The partial function resolve : update → update normalizes an update
by resolving all indirections recursively by:
resolve(u) =
{u, if u is normal;
resolve(u′)⊕ [l /→ resolve(u′)(l)], if u = [l /→ l′]⊕ u′
Proof 1 This function is undefined if any of the lookups resolve(u′)(l) or if the recur-
sion does not terminate. resolve can be efficiently implemented by checking the graph
spanned by the l /→ l′ mappings for acyclicity.
266

Definition 5 (Semantics of commands) The semantics of a command c is now given as
a function "c! from histories to updates as follows:
"oper(srcs,dest,rdts,wrt,opn)!(h)= {[dest /→ opn(λs.h(rdts(s)− wrt)(s)]}
Thus, the values of each source s ∈ srcs can be found at position rdts(s)−wrt in the
history.
Example 2 For example, if s is read at time 5 (after issuing the command) and the des-
tination is written at time 7 (after issuing the command) then at the time the destination
is written the value of the source 2 time steps earlier is relevant, hence position -2 in
the history. This latency is always fixed and STA cannot handle operations with variable
latency.
The remaining semantic definitions are now self-explanatory. We put
"regwr(src,dest)!(h) = [src /→ dest]
and "load(src,dest, t1, t2, t3)!(h) = [dest /→ v]
where v = h(t2 − t3)(a) and a = h(t1 − t3)(src). Finally,
"store(src,dest, t1, t2, t3)!(h) = [l /→ v]
where v = h(t1 − t3)(src) and l = h(t2 − t3)(dest).
Definition 6 (Programs) A program is a function P : {1, . . . , N} → P(command)where N is some integer, the length of the program. The idea is that when pc (pro-
gram counter) has value n then the commands in P (n) are simultaneously issued Δfetch
time-steps later and—at their writing times they attempt to write into their respective desti-
nations. Δfetch is a fixed parameter modeling the delay involved in fetching and decoding
commands.
Example 3 In the Raccoon architecture, there is Δfetch = 2.
If another command attempts to write the same location no matter when it was issued then
this constitutes a conflict and leads to an error.
Definition 7 This is being modeled by using queues containing pairs (c, i) with c a com-
mand and i ∈ N modeling the number of time-steps until c writes into its destination
(“fires”). The function adv : queue → P(command)× queue splits off all commands
in a queue whose i value is zero and decrements the i-values of the remaining ones.
A reasonable program will contain at each group of commands one command that alters
the program counter (typically by incrementing it). In practical assembly level programs
only the non-incrementing pc-operations, e.g. jumps are explicitly written.
267

Step function. Our aim is to define a function step which takes a program P , a time
t, a function Σ : {0, . . . , t − 1} → store and a queue q. It returns an updated queue q′
and a store σ representing the contents of locations at time t.
Advance We begin by advancing the current queue, thus write (cs, q1) = adv(q). So
cs are the commands that fire now. With cs’ = P (Σ(t− 1)(pc)), the updated queue is
being formed as q′ = q1 ∪ {(c, i) | c ∈ cs’, i = Δfetch + tc}. Here, tc is the time when
command c fires, e.g., tc = 1 for salu.add. The tc are parameters of the architecture
being modeled.
Update Given cs and Σ we can compute the updates that will take place as
u = resolve(⊕c∈cs
"c!(λiλl.Σ(t+ i)(l))
Note that there is the possibility of errors due to conflict. Also note that i is a negative
number here.
Finally—if no error has occurred so far—the update is being applied to form σ(l) = v if
l /→ v ∈ u. If l is a memory address or a register, σ(l) = Σ(t−1)(l) retains the previously
stored values. Otherwise, σ(l) = ⊥ makes the result undefined.
Summarizing, we have
step(P, t,Σ, q) = (q′, λl.
u(l) l ∈ domu
Σ(t− 1)(l) t > 0, l a memory address or register
⊥ else
)
where q′ and u are defined as above.
Complete evaluation. Now, given an initial store σ0, a sequence of stores is defined
by σt and queues qt by q0 = {} and (σt, qt) = step(P, i, λt′.σt′ , qt−1) for t > 0.
σ = eval(P, σ0) designates the complete evaluation up to σ = σt where t is the earliest
time when σt(done) = true. If no such t exists or errors have occurred anywhere on
the way then eval(P, σ0) is undefined.
This concludes the description of our semantics; it comprises thirteen specifications and
definitions. The semantics has been validated by implementing it in OCAML and com-
paring its outcomes on several example programs with the outputs produced by real STA
hardware as well as the outputs produced by an existing System C simulation of STA. The
next section gives the announced application of the semantics to the formal verification of
the FFT implementation.
268
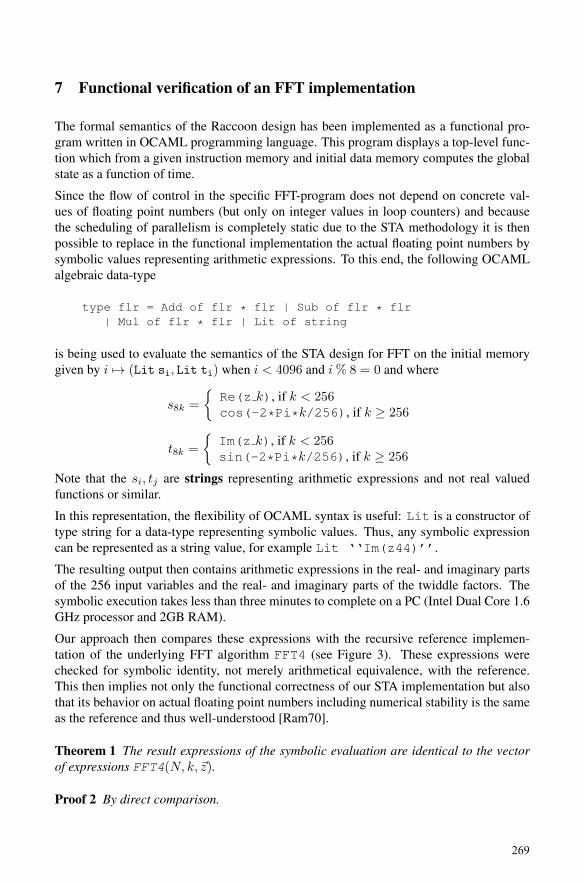
7 Functional verification of an FFT implementation
The formal semantics of the Raccoon design has been implemented as a functional pro-
gram written in OCAML programming language. This program displays a top-level func-
tion which from a given instruction memory and initial data memory computes the global
state as a function of time.
Since the flow of control in the specific FFT-program does not depend on concrete val-
ues of floating point numbers (but only on integer values in loop counters) and because
the scheduling of parallelism is completely static due to the STA methodology it is then
possible to replace in the functional implementation the actual floating point numbers by
symbolic values representing arithmetic expressions. To this end, the following OCAML
algebraic data-type
type flr = Add of flr * flr | Sub of flr * flr
| Mul of flr * flr | Lit of string
is being used to evaluate the semantics of the STA design for FFT on the initial memory
given by i /→ (Lit si, Lit ti) when i < 4096 and i% 8 = 0 and where
s8k =
{Re(z k), if k < 256cos(-2*Pi*k/256), if k ≥ 256
t8k =
{Im(z k), if k < 256sin(-2*Pi*k/256), if k ≥ 256
Note that the si, tj are strings representing arithmetic expressions and not real valued
functions or similar.
In this representation, the flexibility of OCAML syntax is useful: Lit is a constructor of
type string for a data-type representing symbolic values. Thus, any symbolic expression
can be represented as a string value, for example Lit ‘‘Im(z44)’’.
The resulting output then contains arithmetic expressions in the real- and imaginary parts
of the 256 input variables and the real- and imaginary parts of the twiddle factors. The
symbolic execution takes less than three minutes to complete on a PC (Intel Dual Core 1.6
GHz processor and 2GB RAM).
Our approach then compares these expressions with the recursive reference implemen-
tation of the underlying FFT algorithm FFT4 (see Figure 3). These expressions were
checked for symbolic identity, not merely arithmetical equivalence, with the reference.
This then implies not only the functional correctness of our STA implementation but also
that its behavior on actual floating point numbers including numerical stability is the same
as the reference and thus well-understood [Ram70].
Theorem 1 The result expressions of the symbolic evaluation are identical to the vector
of expressions FFT4(N, k, Mz).
Proof 2 By direct comparison.
269

Interestingly, the symbolic evaluation revealed a bug in an earlier version of the STA de-
sign for FFT that could not be found by testing alone. In fact the buggy version read an
output port one cycle too late. But this did not lead to an observable error since the actual
hardware is currently such that result values remain readable at output ports until they are
explicitly overwritten.
8 Conclusion and Future Work
This paper presents the first formal semantic model of the STA architectural framework.
By applying this framework on a specific architecture, we have performed formal verifica-
tion of a computationally intensive and highly parallel algorithm, the FFT, using symbolic
evaluation. We have also shown that the presented semantic model is suitable as simulator
for the architecture; a simulator that is specified in a functional language.
This verification approach is one important contribution to enable shifting effort of schedul-
ing and parallelizing execution for computationally intensive accelerators from run-time
into design-time. This shift contributes to better performance, lower power-consumption
and better safety of run-time systems. This gain is performed at the expense of higher
effort at design-time.
We have chosen a case study with an algorithm that is computationally intensive and does
not have a data-dependent control flow. As a next step, we will consider applications with
a data-dependent control flow. For example a dot product with variable vector length. This
non-trivial control flow will require to reason about a loop invariants and a fix-point in the
semantic model.
As the feasibility of our approach has been shown, we plan to apply it on STA systems
with an even higher degree of parallelism in the future. This will be systems with a greater
number of functional units, like several floating point units of each kind. This will be both
independently operating units, like they are used on an FPGA or wide VLIW processor,
and uniformously operating units, like a SIMD system.
The semantics defined in this paper has a rather operational flavor; it is supposed to be
fairly close to the actual architecture and thus is not further validated here. It would be
possible to prove it sound against even more low level semantic models that represent
pipelines, wires, the decoding process, etc. This can be achieved using the formal equiva-
lence checking approach that is being discussed in the related-work section.
Having said that, we can use our semantics to rigorously justify more high level seman-
tics that might be more useful for reasoning by invariants: A fix-point semantics will be
specified by a continuous operator "P ! on the domain of functions N → store. This"P !(Σ) extracts all commands at all times simultaneously and fires them all at once at
the right times and locations. In this way, queues are not needed and it should be easier
to establish properties of programs with data-dependent control flow using invariants. We
plan to justify such fix-point semantics and its application to reasoning.
Proofs about fix-point semantics might be supported by using a computer-aided theorem-
270
prover, like PVS, Coq, Isabelle, and the like. For a specific class of programs, a SMT
solver might be the best choice because of its guaranteed determinism.
References
[ADK08] Arvind, Nirav Dave, and Michael Katelman. Getting Formal Verification into DesignFlow. In Proc. FM ’08, pp. 12–32, Springer, 2008.
[AN08] Arvind and Rishiyur S. Nikhil. Hands-on Introduction to Bluespec System Verilog(BSV) (Abstract). In MEMOCODE, pp. 205–206. IEEE, 2008.
[Arv03] Arvind. Bluespec: A language for hardware design, simulation, synthesis and verifica-tion. In MEMOCODE, pages 249–. IEEE, 2003.
[AT04] Behzad Akbarpour and Sofiene Tahar. A Methodology for the Formal Verification ofFFT Algorithms in HOL. In [HM04], pages 37–51.
[BBJR97] Gabriel P. Bischoff et al. Formal Implementation Verification of the Bus Interface Unitfor the Alpha 21264 Microprocessor. In ICCD, pages 16–24, 1997.
[BBM+07] Jrg Bormann, Sven Beyer, Adriana Maggiore, Michael Siegel, Sebastian Skalberg, TimBlackmore, and Fabio Bruno. Complete Formal Verification of TriCore2 and OtherProcessors. In Design Verification Conference (DVCon), 2007.
[BCCZ99] Armin Biere, Alessandro Cimatti, Edmund M. Clarke, and Yunshan Zhu. SymbolicModel Checking without BDDs. In Rance Cleaveland, editor, TACAS, volume 1579 ofLecture Notes in Computer Science, pages 193–207. Springer, 1999.
[BD94] Jerry R. Burch and David L. Dill. Automatic verification of Pipelined MicroprocessorControl. In David L. Dill, editor, CAV, LNCS 818, pp. 68–80. Springer, 1994.
[BD02] Raik Brinkmann and Rolf Drechsler. RTL-datapath verification using integer linearprogramming. In In Proc. VLSI Design Conf., pages 741–746, IEEE, 2002.
[Bey07] Sven Beyer. Putting it all together: formal verification of the VAMP. PhD thesis, 2007.
[Bje99] Per Bjesse. Automatic Verification of Combinatorial and Pipelined FFT. In NicolasHalbwachs and Doron Peled, editors, CAV, volume 1633 of Lecture Notes in ComputerScience, pages 380–393. Springer, 1999.
[Bry86] Randal E. Bryant. Graph-Based Algorithms for Boolean Function Manipulation. IEEETrans. Comput., 35(8):677–691, August 1986.
[Cam97] Albert Camilleri. A hybrid approach to verifying liveness in a symmetric multi-processor. In Elsa Gunter and Amy Felty, editors, TPHOLS, LNCS 1275, pages 49–67.1997.
[Cap01] Venanzio Capretta. Certifying the Fast Fourier Transform with Coq. In Richard J. Boul-ton and Paul B. Jackson, editors, TPHOLs, volume 2152 of Lecture Notes in ComputerScience, pages 154–168. Springer, 2001.
[Cic04] Gordon Cichon. A Novel Compiler-Friendly Micro-Architecture for Rapid Develop-ment of High-Performance and Low-Power DSPs. PhD thesis, Technische UniversitatDresden, Germany, 2004.
271

[COR+95] Judy Crow, Sam Owre, John Rushby, Natarajan Shankar, , and Mandayam Srivas. ATutorial Introduction to PVS. In Workshop on Industrial-Strength Formal SpecificationTechniques, Boca Raton, Florida, April 1995.
[CRS+04a] Gordon Cichon et al. Compiler Scheduling for STA-Processors. In Proc. (PAR-ELEC’04), Dresden, Germany, September 2004.
[CRS+04b] Gordon Cichon et al. , Pablo Robelly, Hendrik Seidel, Emil Matus, Marcus Bronzel,and Gerhard Fettweis. Synchronous Transfer Architecture (STA). In Proc.(SAMOS’04), pages 126–130, Samos, Greece, July 2004.
[CSS97] Yuan C. Chou, Daniel P. Siewiorek, and John Paul Shen. A Realistic Study on Mul-tithreaded Superscalar Processor Design. In Christian Lengauer, Martin Griebl, andSergei Gorlatch, editors, Euro-Par, LNCS 1300, pages 1092–1101. 1997.
[Cyr94] David Cyrluk. Microprocessor Verification in PVS - A Methodology and Simple Ex-ample. Technical report, SRI International, 1994.
[Fox03] Anthony C. J. Fox. Formal Specification and Verification of ARM6. In David A. Basinand Burkhart Wolff, editors, TPHOLs, LNCS 2758, pages 25–40. 2003.
[Gam02] Ruben Gamboa. The Correctness of the Fast Fourier Transform: A Structured Proof inACL2. Formal Methods in System Design, 20(1):91–106, 2002.
[HM04] Alan J. Hu and Andrew K. Martin, editors. Proc. FMCAD 2004, Austin, Texas, USA,November 15-17, 2004, Proceedings, LNCS 3312. 2004.
[KGN+09] Roope Kaivola, et al. Replacing Testing with Formal Verification in Intel CoreTM i7Processor Execution Engine Validation. In Ahmed Bouajjani and Oded Maler, editors,CAV, LNCS 5643, pp. 414–429. 2009.
[KSKH04] Zurab Khasidashvili, Marcelo Skaba, Daher Kaiss, and Ziyad Hanna. Theoreticalframework for compositional sequential hardware equivalence verification in presenceof design constraints. In ICCAD, pages 58–65. IEEE Computer Society / ACM, 2004.
[MBP+04] Hari Mony, et al. Scalable Automated Verification via Expert-System Guided Trans-formations. In [HM04], pages 159–173.
[PM96] J.G. Proakis and D.G. Manolakis. Digital signal processing: principles, algorithms,and applications. Prentice Hall, 1996.
[Ram70] George Ramos. Roundoff error analysis of the fast Fourier transform. Technical ReportSTAN-CS-70-146, Stanford University, February 1970.
[SCM+05] Hendrik Seidel, Gordon Cichon, et al. Development and Implementation of a 3.6GFLOP/s SIMD-DSP using the Synopsys Toolchain. In Fourteenth Annual SynopsysUsers Group Europe, Munich, Germany, May 2005.
[SDSJ11] Anna Slobodova, Jared Davis, Sol Swords, and Warren A. Hunt Jr. A flexible formalverification framework for industrial scale validation. In Satnam Singh, Barbara Job-stmann, Michael Kishinevsky, and Jens Brandt, editors, MEMOCODE, pages 89–97.IEEE, 2011.
[SJ] Jun Sawada and Warren A. Hunt Jr. Processor Verification with Precise Exceptions andSpeculative Execution.
[SY] Erik Seligman and Itai Yarom. Best known methods for using Cadence ConformalLEC at Intel.
272

From Application Models to Filmstrip Models:
An Approach to Automatic Validation of Model Dynamics
M. Gogolla1, L. Hamann1, F. Hilken1∗, M. Kuhlmann1, R. France2
1 {gogolla,lhamann,fhilken,mk}@informatik.uni-bremen.de2 [email protected]
Abstract: Efficient model validation and verification techniques are strong in the anal-ysis of systems describing static structures, for example, UML class diagrams andOCL invariants. However, general UML and OCL models can involve dynamic as-pects in form of OCL pre- and postconditions for operations. This paper describes theautomatic transformation of a UML and OCL model with invariants and pre- and post-conditions into an equivalent model with only invariants. We call the first model (withpre- and postconditions) the application model and the second model (with invariantsonly) the filmstrip model, because a sequence of system states in the application modelbecomes a single system state in the filmstrip model. This single system state can bethought of as being a filmstrip presenting snapshots from the application model withdifferent logical time stamps. Pre- and postconditions from the application model be-come invariants in the filmstrip model. Providing a proper context, the text of the pre-and postconditions can be used in the filmstrip model nearly unchanged. The filmstripmodel can be employed for automatically constructing dynamic test scenarios and forchecking temporal properties.
1 Introduction
As a paradigm for software development model-driven engineering (MDE) is gaining
more and more attention. Models and model transformations are cornerstones in mod-
eling languages like UML and transformation languages like QVT (see [RJB04] and more
recent versions of UML at OMG). In model-based approaches, the Object Constraint Lan-
guage (OCL) [WK03, CG12] can be employed for expressing class constraints and op-
eration contracts, thus UML and OCL plays a central role in MDE. For a given UML
and OCL model it is of central interest to validate and to verify static and dynamic model
properties in the design phase before an actual implementation starts.
A variety of model validation and verification approaches is currently available [CPC+04,
Jac06, CCR07, TJ07, BW08, ABGR10, RD11]. However, these usually concentrate on
structural aspects, for example, consistency between the UML class model and OCL class
invariants. This paper puts forward an approach for the validation and verification of dy-
namic model properties which are determined by OCL operation contracts in form of pre-
∗This work was partially funded by the DFG under grant GO 454/19-1.
273
and postconditions. We propose to transform a given UML and OCL model which com-
pletely describes an application in terms of invariants and pre- and postconditions into
a model which only has invariants and which represents system dynamics by so-called
filmstrips. We call the first model the application model and the second one the filmstrip
model. Whereas in the application model system dynamics is expressed by going from
state to state with intermediate operation calls, system dynamics is characterized in the
filmstrip model by introducing explicit objects representing the application model states
and explicit objects representing the calling of an operation. The pre- and postconditions
of the operations are expressed by invariants in the filmstrip model, hence the semantics
of them is transformed into invariants – bound to the classes representing the model dy-
namics – and then the pre- and postconditions are removed from the operations. Complete
dynamic scenarios become available in a single structure.
Filmstrip models can then be validated with techniques originally designed for structural
analysis. We have recently [KG12] designed and implemented a so-called model validator
which translates UML and OCL models into relational logic [Jac06, TJ07] (which in turn
is realized through SAT solvers) and interprets found results on the level of relational logic
back in terms of UML and OCL. The model validator is part of the UML-based Specifi-
cation Environment (USE) [GBR07] developed in our group since a number of years. It
allows us now to validate properties for model dynamics. A resulting filmstrip describes
a complete run through the model and accordingly properties like the occurrence of op-
eration patterns can be checked in the filmstrip with OCL expressions. Furthermore, the
approach enables to check properties like constraint independence or consistency (under-
stood as in [GBR07]) for invariants and pre- and postconditions. We are not aware of
approaches which formally describe UML and OCL model dynamics in terms of pre- and
postconditions and which automatically construct scenarios representing system execution
runs at the modeling level.
The rest of the paper is structured as follows. In Section 2 we present the basic idea of
filmstripping in terms of a simple example. Section 3 explains the transformation from
the application model to the filmstrip model. Section 4 shows how to explore properties
of dynamic scenarios. Section 5 discusses related work, before we end with concluding
remarks and future work in Section 6.
2 The Basic Idea
Application model. We start with an ordinary UML model consisting of a class diagram
with any number of classes, attributes, associations, and operations. The class diagram is
enriched by OCL constraints in form of class invariants and operation pre- and postcon-
ditions. The invariants restrict the possible system states, i.e., the valid object diagrams.
The operation pre- and postconditions determine the valid system dynamics in form of
state transitions. Currently, we assume that a transition is induced by a single call to an
operation. We call this model the application model in order to emphasize that the com-
plete application is described in that model and in order to distinguish it from the filmstrip
model introduced later.
274

Figure 1: Example application (Left) and filmstrip (Right)model at design (Top) and run-time (Bottom).
Example. In the upper left of Fig. 1 we show the class diagram of our example application
model describing marriages and divorces of persons. In Fig. 2, the usage of OCL for
making the UML model more precise is captured: there is one operation with return value
which is defined by an OCL expression, and there are five OCL constraints for the model,
namely one invariant and for each operation without return value one precondition and one
postcondition.
The lower left of Fig. 1 shows an example scenario for the run-time development of the
application model in terms of a UML sequence diagram. In this scenario, the operation
pre- and postconditions are valid and the invariant is satisfied directly before and after
the operation calls. This can be traced by the command line protocol in Fig. 3 where in
addition to the information in the sequence diagram the constraint evaluation is explicitly
shown.
275
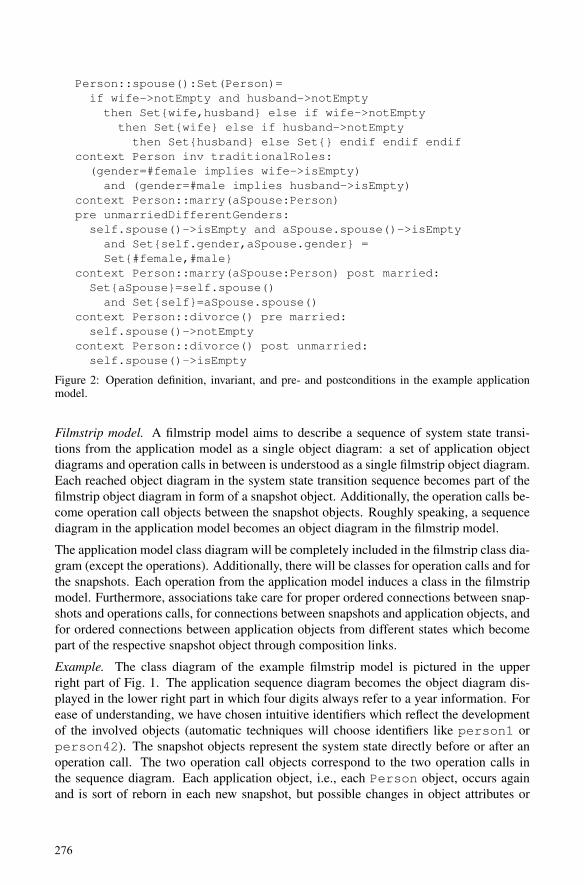
Person::spouse():Set(Person)=
if wife->notEmpty and husband->notEmpty
then Set{wife,husband} else if wife->notEmpty
then Set{wife} else if husband->notEmpty
then Set{husband} else Set{} endif endif endif
context Person inv traditionalRoles:
(gender=#female implies wife->isEmpty)
and (gender=#male implies husband->isEmpty)
context Person::marry(aSpouse:Person)
pre unmarriedDifferentGenders:
self.spouse()->isEmpty and aSpouse.spouse()->isEmpty
and Set{self.gender,aSpouse.gender} =
Set{#female,#male}
context Person::marry(aSpouse:Person) post married:
Set{aSpouse}=self.spouse()
and Set{self}=aSpouse.spouse()
context Person::divorce() pre married:
self.spouse()->notEmpty
context Person::divorce() post unmarried:
self.spouse()->isEmpty
Figure 2: Operation definition, invariant, and pre- and postconditions in the example applicationmodel.
Filmstrip model. A filmstrip model aims to describe a sequence of system state transi-
tions from the application model as a single object diagram: a set of application object
diagrams and operation calls in between is understood as a single filmstrip object diagram.
Each reached object diagram in the system state transition sequence becomes part of the
filmstrip object diagram in form of a snapshot object. Additionally, the operation calls be-
come operation call objects between the snapshot objects. Roughly speaking, a sequence
diagram in the application model becomes an object diagram in the filmstrip model.
The application model class diagram will be completely included in the filmstrip class dia-
gram (except the operations). Additionally, there will be classes for operation calls and for
the snapshots. Each operation from the application model induces a class in the filmstrip
model. Furthermore, associations take care for proper ordered connections between snap-
shots and operations calls, for connections between snapshots and application objects, and
for ordered connections between application objects from different states which become
part of the respective snapshot object through composition links.
Example. The class diagram of the example filmstrip model is pictured in the upper
right part of Fig. 1. The application sequence diagram becomes the object diagram dis-
played in the lower right part in which four digits always refer to a year information. For
ease of understanding, we have chosen intuitive identifiers which reflect the development
of the involved objects (automatic techniques will choose identifiers like person1 or
person42). The snapshot objects represent the system state directly before or after an
operation call. The two operation call objects correspond to the two operation calls in
the sequence diagram. Each application object, i.e., each Person object, occurs again
and is sort of reborn in each new snapshot, but possible changes in object attributes or
276

use> !create charles:Person
use> !set charles.gender:=#male
use> !create diana:Person
use> !set diana.gender:=#female
use> check
checking invariant ‘Person::traditionalRoles’: OK.
use> !openter diana marry(charles)
precondition ‘unmarriedDifferentGenders’ is true
use> !insert (diana,charles) Marriage
use> !opexit
postcondition ‘married’ is true
use> check
checking invariant ‘Person::traditionalRoles’: OK.
use> !openter charles divorce()
precondition ‘married’ is true
use> !delete (charles.wife,charles) Marriage
use> !opexit
postcondition ‘unmarried’ is true
use> check
checking invariant ‘Person::traditionalRoles’: OK.
Figure 3: Command line protocol of application model example sequence diagram.
association ends become effective in the result snapshot. The rebirth is recorded through
appropriate predecessor-successor aggregation links displayed with unfilled diamonds on
the predecessor side. The filmstrip object diagrams (following throughout the paper) will
always follow the same layout principles as used in Fig. 1: Snapshot and OpC objects
are placed in the left, Person objects in the right, and Marriage links will always have
a diagonal orientation from south-west to north-east.
Temporal object properties. Because in the filmstrip object diagram a complete application
state chain is available, the temporal development of application objects together with their
attribute and association end values can be traced and inspected. Temporal properties of
operation call sequences can be checked. Assumptions about valid and invalid sequences
and properties can be expressed.
Example. In the lower right of Fig. 1 an OCL query is stated and evaluated in the pre-
sented filmstrip object diagram. The OCL query searches for Person objects which later
become married to a husband and after that become divorced by checking that the previ-
ous husband does not posses a spouse in a later snapshot. The operation incarnations
yields the ordered set of objects representing the newer materializations of the argument
Person object. For example, the expression charles1977.incarnations() =
OrderedSet{charles1981, charles1996} will hold in the example.
Automatic checking of scenarios. In the literature, various approaches for the automatic
construction of object diagrams for a given UML and OCL class diagram have been put
forward. These techniques can be employed for the filmstrip model. Now, automatically
277

Application model Filmstrip model
class → 1 : 1 → application class
∗ class Snapshot
attribute → 1 : 1 → attribute
operation (no return value) → Δ → operation call class
operation self object → Δ → operation call class attribute
operation parameter → Δ → operation call class attribute
operation (with return value) → 1 : 1 → operation in application class
association → 1 : 1 → application association
∗ composition (Snapshot, application class)
∗ composition (Snapshot, operation call class)
∗ composition (operation call class, Snapshot)
∗ aggregation (application class, application class)
operation definition → 1 : 1 → operation definition
class invariant → 1 : 1 → application class invariant
∗ operation self object and parameter invariants
∗ filmstrip invariants
operation precondition → Δ → operation call class invariant
operation postcondition → Δ → operation call class invariant
Symbol explanation: → 1 : 1 → model element is included without changes
∗ new model element is created
→ Δ → model element is included with changes applied
Figure 4: Overview on transformation from application model to filmstrip model.
constructing a filmstrip object diagram means for the application model to construct a
sequence diagram. Thus these techniques offer ways to automatically construct scenarios
which check issues about the system dynamics.
Example. Consider again the filmstrip object diagram in the lower right of Fig. 1. This
was the representation of a valid sequence diagram in the application model where all con-
straints were satisfied. One can now either manually or automatically introduce changes,
i.e., mutants [AS05, AV10], in the filmstrip object diagram and check whether the modi-
fied object diagram still corresponds to a valid sequence diagram in the application model.
For example, if we change in the filmstrip object diagram the gender attribute values
to diana1981.gender = #male and charles1981.gender = #female and
exchange the association ends in the Marriage link, we can ask whether all OCL con-
straints in the corresponding application model sequence diagram would still be satisfied.
3 Transforming Application Models to Filmstrip Models
Transformation of application to filmstrip models. Fig. 4 gives a more systematic overview
for the transformation. It displays in the left the source, in the right the target model el-
ements, and in the middle an indication how the target and the source are related. The
model elements are classified from top to bottom into elements connected to classes, ele-
ments connected to associations, and OCL descriptions.
278
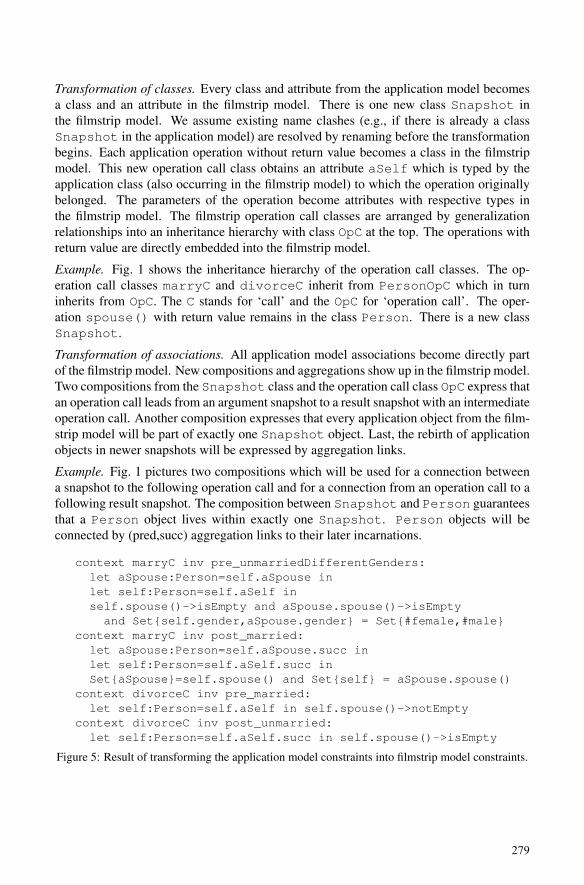
Transformation of classes. Every class and attribute from the application model becomes
a class and an attribute in the filmstrip model. There is one new class Snapshot in
the filmstrip model. We assume existing name clashes (e.g., if there is already a class
Snapshot in the application model) are resolved by renaming before the transformation
begins. Each application operation without return value becomes a class in the filmstrip
model. This new operation call class obtains an attribute aSelf which is typed by the
application class (also occurring in the filmstrip model) to which the operation originally
belonged. The parameters of the operation become attributes with respective types in
the filmstrip model. The filmstrip operation call classes are arranged by generalization
relationships into an inheritance hierarchy with class OpC at the top. The operations with
return value are directly embedded into the filmstrip model.
Example. Fig. 1 shows the inheritance hierarchy of the operation call classes. The op-
eration call classes marryC and divorceC inherit from PersonOpC which in turn
inherits from OpC. The C stands for ‘call’ and the OpC for ‘operation call’. The oper-
ation spouse() with return value remains in the class Person. There is a new class
Snapshot.
Transformation of associations. All application model associations become directly part
of the filmstrip model. New compositions and aggregations show up in the filmstrip model.
Two compositions from the Snapshot class and the operation call class OpC express that
an operation call leads from an argument snapshot to a result snapshot with an intermediate
operation call. Another composition expresses that every application object from the film-
strip model will be part of exactly one Snapshot object. Last, the rebirth of application
objects in newer snapshots will be expressed by aggregation links.
Example. Fig. 1 pictures two compositions which will be used for a connection between
a snapshot to the following operation call and for a connection from an operation call to a
following result snapshot. The composition between Snapshot and Person guarantees
that a Person object lives within exactly one Snapshot. Person objects will be
connected by (pred,succ) aggregation links to their later incarnations.
context marryC inv pre_unmarriedDifferentGenders:
let aSpouse:Person=self.aSpouse in
let self:Person=self.aSelf in
self.spouse()->isEmpty and aSpouse.spouse()->isEmpty
and Set{self.gender,aSpouse.gender} = Set{#female,#male}
context marryC inv post_married:
let aSpouse:Person=self.aSpouse.succ in
let self:Person=self.aSelf.succ in
Set{aSpouse}=self.spouse() and Set{self} = aSpouse.spouse()
context divorceC inv pre_married:
let self:Person=self.aSelf in self.spouse()->notEmpty
context divorceC inv post_unmarried:
let self:Person=self.aSelf.succ in self.spouse()->isEmpty
Figure 5: Result of transforming the application model constraints into filmstrip model constraints.
279

Transformation of OCL descriptions. The transformation of OCL descriptions will be
divided into the handling of (a) operation definitions for operations with return value and
invariants, (b) operation preconditions, and (c) operation postconditions.
Transformation of operation definitions and invariants. Operation definitions with OCL
for operations with return values and invariants can become part of the filmstrip model
unchanged.
Example. The definition for op. spouse() and for invariant traditionalRoles
from Fig. 2 can be directly incorporated into the filmstrip model without change in com-
parison to the application model.
Transformation of preconditions. An application model precondition is transformed into
a filmstrip model invariant. OCL operation preconditions in the application model can
use a variable self (referring to the object on which the operation is called) and the
operation parameters. These variable names have to be introduced and have to be assigned
through the OCL let construct accordingly so that the original precondition text fits to
the filmstrip invariant context.
Example. In Fig. 5 the filmstrip invariant pre unmarriedDifferentGender rep-
resents the marry precondition. The variables self and aSpouse are assigned with
let expressions so that they afterwards refer to the Person object on which the op-
eration is called and the parameter aSpouse: self=self.aSelf and aSpouse=
self.aSpouse. This redefinition of self and aSpouse allows us to use the precon-
dition text of the original application model precondition.
Transformation of postconditions. The self variable and the operation parameters have
to be modified in postconditions analogously to the precondition. But expressions in post-
conditions refer to evaluations after an operations has been executed. Therefore, the self
variable and the operation parameters have to refer to the snapshot after operation execu-
tion. This is realized by adding to the expression the role expression succ. This means to
evaluate the respective expression in the snapshot after the operation execution. Accessing
precondition values has to be done if in the postcondition the OCL modifier @pre is used.
Example. In Fig. 5 the filmstrip invariant post married represents the marry post-
condition. The variables self and aSpouse are here in the postcondition additionally
modified with the succ role so that they refer to the Person object on which the op-
eration is called and the parameter aSpouse in the snapshot after operation execution:
self=self.aSelf.succ and aSpouse=self.aSpouse.succ. If a postcondi-
tion would refer to a value at operation precondition time as in self.gender@pre=
self.gender (for example, as a postcondition for marry or for divorce in order to
require that these operations do not change the gender attribute) this would lead to an
additional use of the role pred: self.pred.gender=self.gender.
Invariants for self objects and parameters. A bunch of filmstrip-specific invariants has
to be added to the model in order to make it work properly. The values of the attribute
aSelf for the object on which the operation is called and the values of the attributes for
the operation parameters must come from the snapshot before the operation execution.
280
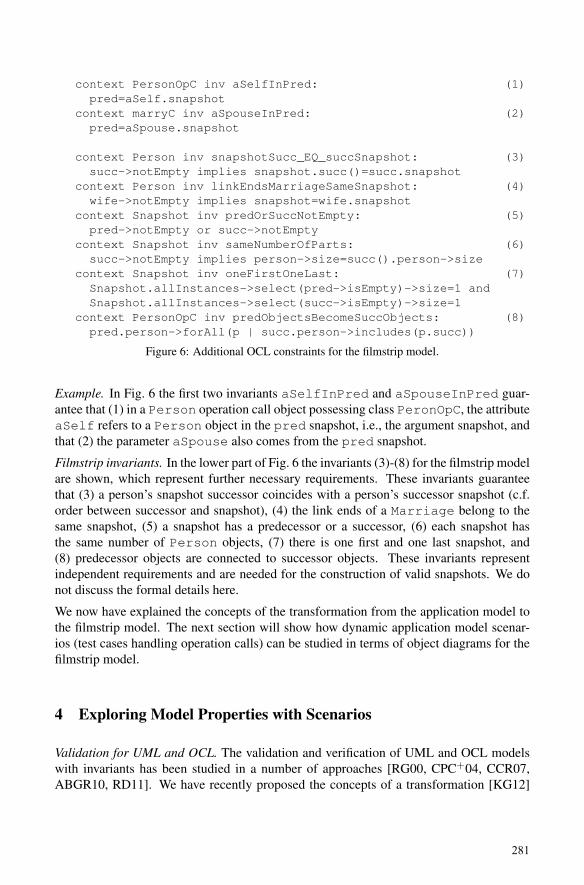
context PersonOpC inv aSelfInPred: (1)
pred=aSelf.snapshot
context marryC inv aSpouseInPred: (2)
pred=aSpouse.snapshot
context Person inv snapshotSucc_EQ_succSnapshot: (3)
succ->notEmpty implies snapshot.succ()=succ.snapshot
context Person inv linkEndsMarriageSameSnapshot: (4)
wife->notEmpty implies snapshot=wife.snapshot
context Snapshot inv predOrSuccNotEmpty: (5)
pred->notEmpty or succ->notEmpty
context Snapshot inv sameNumberOfParts: (6)
succ->notEmpty implies person->size=succ().person->size
context Snapshot inv oneFirstOneLast: (7)
Snapshot.allInstances->select(pred->isEmpty)->size=1 and
Snapshot.allInstances->select(succ->isEmpty)->size=1
context PersonOpC inv predObjectsBecomeSuccObjects: (8)
pred.person->forAll(p | succ.person->includes(p.succ))
Figure 6: Additional OCL constraints for the filmstrip model.
Example. In Fig. 6 the first two invariants aSelfInPred and aSpouseInPred guar-
antee that (1) in a Person operation call object possessing class PeronOpC, the attribute
aSelf refers to a Person object in the pred snapshot, i.e., the argument snapshot, and
that (2) the parameter aSpouse also comes from the pred snapshot.
Filmstrip invariants. In the lower part of Fig. 6 the invariants (3)-(8) for the filmstrip model
are shown, which represent further necessary requirements. These invariants guarantee
that (3) a person’s snapshot successor coincides with a person’s successor snapshot (c.f.
order between successor and snapshot), (4) the link ends of a Marriage belong to the
same snapshot, (5) a snapshot has a predecessor or a successor, (6) each snapshot has
the same number of Person objects, (7) there is one first and one last snapshot, and
(8) predecessor objects are connected to successor objects. These invariants represent
independent requirements and are needed for the construction of valid snapshots. We do
not discuss the formal details here.
We now have explained the concepts of the transformation from the application model to
the filmstrip model. The next section will show how dynamic application model scenar-
ios (test cases handling operation calls) can be studied in terms of object diagrams for the
filmstrip model.
4 Exploring Model Properties with Scenarios
Validation for UML and OCL. The validation and verification of UML and OCL models
with invariants has been studied in a number of approaches [RG00, CPC+04, CCR07,
ABGR10, RD11]. We have recently proposed the concepts of a transformation [KG12]
281

Person_min = 9
Person_max = 9
Snapshot_min = 3
Snapshot_max = 3
marryC_min = 0
marryC_max = 0
divorceC_min = 2
divorceC_max = 2
Figure 7: Generated object diagram with two divorce calls and gender frame condition.
into relational logic [Jac06] on the basis of Kodkod [TJ07]. The transformation has been
implemented and integrated as a so-called model validator within our UML and OCL tool
USE [GBR07]. Through the automatic construction of object diagrams for filmstrip mod-
els, it is possible to prove that within a given particular search space certain operation call
sequences are allowed or impossible to be executed. The approach has a decent potential to
show general properties like constraint independence or consistency by finding examples
or to show the opposite through counterexamples. Constructing a scenario where all con-
straints are valid and all operations have been executed once means to prove consistency
of the invariants and the pre- and postconditions.
Configuration. The finite search space for object diagrams has to be described by config-
urations setting lower and upper bounds for the number of objects to be considered in a
class and (optionally) for the number of links in an association, among other parameters.
Additionally, OCL constraints may be loaded for the object diagram generation in order
to achieve object diagrams with particular properties. Such loaded invariants may also be
so-called frame conditions [BMR95]. A frame condition states which elements should not
change within a transition from a source state to a target state.
Example. The object diagram in Fig. 7 is the result of calling the model validator with the
displayed configuration and by additionally loading an invariant that guarantees that the
attribute gender does not change for a single person from snapshot to snapshot, a so-
called frame condition. All application invariants and all filmstrip invariants are satisfied
in this object diagram. Basically, this object diagram corresponds in terms of the appli-
cation model to a sequence diagram with two directly following calls for the operation
divorce. This object diagram validates resp. invalidates the divorce postcondition
which is too weak: The divorce postcondition on the one hand takes care of removing
the Marriage link between person5 and person2, but on the other hand it does allow
that the divorce operation inserts an additional Marriage link between person3 and
person4 in the result snapshot of the first divorce call. Roughly speaking, this object
282

diagram points to the fact that according to the pre- and postconditions of divorce a
valid implementation could remove the Marriage link specified in the precondition and
in addition insert another Marriage link, however, not a marriage for the self object
as this is excluded by the divorce postcondition.
Dynamically loaded invariants. Additional invariants may be loaded during the validation
process. These invariants are observed during the object diagram generation process as
ordinary model invariants. These loaded invariants may be used to drive the object diagram
generation into a particular direction, e.g., for specifying frame conditions or for asserting
that objects or links with particular properties exist. These invariants may also be used to
configure the (imaginary) sequence diagram from the application model, e.g., for requiring
that certain operations are called in the first place or that one operation must be followed
by another one.
Example. The invariants in Fig. 8 are the dynamically loaded invariants which we employ
for our example. The first three are frame conditions which basically state that marry and
divorce do not change the attribute gender, and that marry and divorce do not
change any Marriage link except the link specified in the precondition of the respective
operation. The next two invariants determine the order of the applied operation: the in-
variant firstCallMarry requires that the operation marry takes place first, whereas
the invariant firstCallDivorce requires divorce to happen first. The invariant
noDirectReMarry forbids scenarios where a couple directly marries again after it has
been divorced.
context PersonOpC inv noGenderChange:
pred.person->forAll(p | p.gender=p.succ.gender)
context marryC inv noSpouseChangeExcept:
let except=Set{aSelf,aSpouse} in
(pred.person-except)->forAll(p | p.spouse()=p.succ.spouse())
context divorceC inv noSpouseChangeExcept:
let except=Set{aSelf}->union(aSelf.spouse()) in
(pred.person-except)->forAll(p | p.spouse()=p.succ.spouse())
context Snapshot inv firstCallMarry:
first().succ.oclIsTypeOf(marryC)
context Snapshot inv firstCallDivorce:
first().succ.oclIsTypeOf(divorceC)
context Person inv noDirectReMarry:
spouse()->notEmpty and succ.spouse()->isEmpty implies
succ.succ.spouse()<>spouse().succ.succ->asSet
Figure 8: Dynamically loaded invariants.
Example. The four different object diagrams in Fig. 9 (please check the nitpicking differ-
ences) show validation results with the same configuration, but with different loaded in-
variants in each case. The configuration requires exactly 9 Person objects, 3 Snapshot
objects, 1 marryC object and 1 divorceC object. The two left object diagrams were
achieved by dynamically loading invariant firstCallMarry, whereas for the two right
283

Figure 9: Four different generated object diagrams with three snapshots.
Figure 10: Generated larger object diagram with OCL queries exploring system state properties.
284

object diagrams the invariant firstCallDivorce was added. The two upper object
diagrams had no frame condition loaded, whereas for the two lower ones all three frame
conditions were added. Note that in the two upper object diagrams gender changes
take place spontaneously whereas the gender attribute does not change in the two lower
object diagrams.
Scenario property analysis. The approach allows to construct larger object diagrams and
to check properties of operation sequences with OCL expressions. One can express with
OCL expressions expected properties of operation call sequences. In the case of unex-
pected results one can again use OCL to trace the reason for the unforeseen finding.
Example. The configuration for the object diagram in Fig. 10 required exactly 7 snapshots
and 21 persons. The configuration was liberal with respect to the operation calls and
allowed between 0 and 6 objects for marryC and divorceC. All frame conditions were
loaded and the invariant noDirectReMarry was added in order to make the object
diagram more interesting. The first OCL expression in the right checks whether after a
divorce call always a marry call follows. The second OCL expression in the right
(exchanging the two operations) checks whether after a marry call always a divorce
call follows. The result of the first one is true, the result of the second one is false. In
order to understand the result false, the third OCL expression retrieves the ‘bad guys’
which violate the specified condition. The achieved result, the marryC object marryc4
and its behavior is detailed with the following two OCL expressions.
Pseudo-Temporal OCL queries. It is possible to state complex queries on a filmstrip object
diagram. Such queries can explore the complete scenario and can systematically collect
information in the scenario execution order. We call such a query a pseudo-temporal
OCL query, because on the one hand information from different points in time from the
application model is collected. On the other hand this is (currently) not done with explicit
temporal language features but with plain OCL elements.
5 Related Work
Filmstripping: Filmstripping in connection with models is not new. As far as we know,
the notion was coined nearly twenty years ago in [DW95] and later became an ingredient
of the Catalysis approach. In that paper, a filmstrip was understood as a ‘series of super-
posed snapshots illustrating the evolution of a system’s state through [a] scenario’. Later
[GK98] took up the filmstrip idea and employed filmstrips as part of three-dimensional
visualizations within software design. Inspired by the modeling of system dynamics using
an explicit signature for Time and a reflexive (predecessor,successor) ordering on Time
as proposed in [Jac06] for relational logic and Alloy, the approach in [KG08] used the
reflexive Time ordering in a UML and OCL context and employed central ideas for film-
strips. Analogously to our current proposal, [YFR08] sketched a transformation from an
application model to a filmstrip model (called snapshot model there), however the basic
links (the aggregation links between Person objects in our examples) for representing
incarnations of application objects were not present in that approach. Filmstrips have also
been recognized as a helpful device for functional testing [Cla09].
285
Validation: As already mentioned in the introduction, a number of analysis techniques
exist for UML and OCL models. One of the first approaches emphasizing the importance
of validation for UML and in particular OCL was [RG00]. [CPC+04] extended these ideas
and focussed on validating metamodels. Further approaches rely on different technological
cornerstones like logic programming and constraint solving [CCR07], relational logic and
Alloy [ABGR10] or term rewriting with Maude [RD11]. In contrast to our proposal, these
approaches either do not support full OCL (e.g., higher-order associations [ABGR10] or
recursive operation definitions [CCR07] are not supported) or do not facilitate full OCL
syntax checks [RD11]. The aim of the work in [BW08] is not semi-automatic model val-
idation, but interactive proof support for OCL. [MRR11a, MRR11b] supports analysis of
structural models by extending the language for describing object diagrams with negative
examples and by defining class diagram features directly in terms of the relational logic
language Alloy. Negative conditions in object diagrams can be expressed in our approach
in OCL. Both approaches do not handle OCL or other forms of pre- and postconditions.
Temporal OCL: We have coined the notion of pseudo-temporal OCL expression above.
However, a number of extensions of OCL allow for temporal operators. A nice detailed
comparison can be found in [KT12]. [CT01] concentrated on temporal business rules
without giving a full semantic definition. [ZG03] defined the classical linear time tem-
poral operators without going into a possible implementation. [FM04] focussed on the
integration of time bounds in connection with temporal constructs. [SE09] defined tem-
poral OCL operators intended to be used for more general metamodels than UML-like
ones. [KT12] sketched an implementation of temporal OCL on the basis of Eclipse
MDT/OCL. [ALAFR13] takes TOCL expressions and evaluates them in state transition
systems – a similar form of filmstrip models using a more relational database-like ap-
proach. [BGKS13] introduces a CTL based extension of OCL. In contrast to these ap-
proaches our pseudo-temporal OCL expressions rely on our explicit filmstrip model and
are plain OCL expressions. Future work might consider ways to disguise these plain OCL
queries in temporal clothes and could integrate ideas from the mentioned proposals.
6 Conclusion
We have proposed a transformation from an application model with pre- and postcon-
ditions to an equivalent filmstrip model in which system dynamics is explicitly repre-
sented through snapshot and operation call objects in a single object diagram. Automatic
techniques for constructing system states can be employed to validate dynamic features.
Properties like consistency between the invariants and the pre- and postconditions can be
checked in a finite system state search space. Further properties like the occurrence of
operation call patterns can be explored with OCL.
Future work has to consolidate the approach with larger cases studies. The current user
options and interface must be improved in a number of ways, for example, by offering fur-
ther solutions after a first one for a given configuration has been found. Existing proposals
for extending OCL with temporal operators can be implemented because found object di-
agrams in the filmstrip model correspond to complete execution runs in the application
286

model. The efficiency of the search process must be improved, for example, by exploring
further optimizations for the generated relational logic formulas and by utilizing options
of the underlying SAT solvers. As our approach currently only implicitly covers object
generation and destruction, this has to be studied further. Last but not least, one can ex-
tract from the found filmstrip object diagrams, where the operation pre- and postconditions
are valid, proposals for the implementation of operations in terms of atomic system state
change commands covering link generation and destruction and attribute manipulation.
References
[ABGR10] Kyriakos Anastasakis, Behzad Bordbar, Geri Georg, and Indrakshi Ray. On Chal-lenges of Model Transformation from UML to Alloy. Software and System Modeling,9(1):69–86, 2010.
[ALAFR13] Mustafa Al-Lail, Ramadan Abdunabi, Robert B. France, and Indrakshi Ray. An Ap-proach to Analyzing Temporal Properties in UML Class Models. In MoDeVVa ’13,2013.
[AS05] Bernhard K. Aichernig and Percy Antonio Pari Salas. Test Case Generation by OCLMutation and Constraint Solving. In QSIC 2005, pages 64–71. IEEE Computer Soci-ety, 2005.
[AV10] Luciano C. Ascari and Silvia Regina Vergilio. Mutation Testing Based on OCL Spec-ifications and Aspect Oriented Programming. In Sergio F. Ochoa, Federico Meza,Domingo Mery, and Claudio Cubillos, editors, SCCC 2010, pages 43–50. IEEE Com-puter Society, 2010.
[BGKS13] Robert Bill, Sebastian Gabmeyer, Petra Kaufmann, and Martina Seidl. OCL meetsCTL: Towards CTL-Extended OCL Model Checking. In OCL ’13, 2013.
[BMR95] Alexander Borgida, John Mylopoulos, and Raymond Reiter. On the Frame Problem inProcedure Specifications. IEEE Trans. Software Eng., 21(10):785–798, 1995.
[BW08] Achim D. Brucker and Burkhart Wolff. HOL-OCL: A Formal Proof Environmentfor UML/OCL. In Jose Luiz Fiadeiro and Paola Inverardi, editors, FASE 2008,LNCS 4961, pages 97–100. Springer, 2008.
[CCR07] Jordi Cabot, Robert Clariso, and Daniel Riera. UMLtoCSP: A Tool for the FormalVerification of UML/OCL Models using Constraint Programming. In R. E. Kurt Stire-walt, Alexander Egyed, and Bernd Fischer, editors, ASE 2007, pages 547–548. ACM,2007.
[CG12] Jordi Cabot and Martin Gogolla. Object Constraint Language (OCL): A DefinitiveGuide. In Marco Bernardo, Vittorio Cortellessa, and Alphonso Pierantonio, editors,Proc. 12th Int. School Formal Methods for the Design of Computer, Communicationand Software Systems: Model-Driven Engineering, pages 58–90. Springer, Berlin,LNCS 7320, 2012.
[Cla09] Tony Clark. Model Based Functional Testing Using Pattern Directed Filmstrips. InDimitris Dranidis, Stephen P. Masticola, and Paul A. Strooper, editors, AST 2009,pages 53–61. IEEE, 2009.
[CPC+04] Dan Chiorean, Mihai Pasca, Adrian Carcu, Cristian Botiza, and Sorin Moldovan. En-suring UML Models Consistency Using the OCL Environment. ENTCS, 102:99–110,2004.
[CT01] Stefan Conrad and Klaus Turowski. Temporal OCL Meeting Specification Demandsfor Business Components. In Unified Modeling Language: Systems Analysis, Designand Development Issues, pages 151–165. IGI Publishing, 2001.
287

[DW95] Desmond D’Souza and Alan Wills. Catalysis. Practical Rigor and Refinement: Ex-tending OMT, Fusion, and Objectory. Technical report, http://catalysis.org, 1995.http://catalysis.org/publications/papers/1995-catalysis-fusion.pdf.
[FM04] Stephan Flake and Wolfgang Muller. Past- and Future-Oriented Time-Bounded Tem-poral Properties with OCL. In SEFM 2004, pages 154–163. IEEE Computer Society,2004.
[GBR07] Martin Gogolla, Fabian Buttner, and Mark Richters. USE: A UML-Based Specifica-tion Environment for Validating UML and OCL. Science of Computer Programming,69:27–34, 2007.
[GK98] Joseph Gil and Stuart Kent. Three Dimensional Software Modeling. In Koji Torii,Kokichi Futatsugi, and Richard A. Kemmerer, editors, ICSE 1998, pages 105–114.IEEE Computer Society, 1998.
[Jac06] Daniel Jackson. Software Abstractions: Logic, Language, and Analysis. The MITPress, Cambridge, Massachusetts, 2006.
[KG08] Mirco Kuhlmann and Martin Gogolla. Modeling and Validating Mondex ScenariosDescribed in UML and OCL with USE. Formal Aspects of Computing, 20(1):79–100,2008.
[KG12] Mirco Kuhlmann and Martin Gogolla. From UML and OCL to Relational Logic andBack. In Robert France, Juergen Kazmeier, Ruth Breu, and Colin Atkinson, edi-tors, Proc. 15th Int. Conf. Model Driven Engineering Languages and Systems (MoD-ELS’2012), pages 415–431. Springer, Berlin, LNCS 7590, 2012.
[KT12] Bilal Kanso and Safouan Taha. Temporal Constraint Support for OCL. In KrzysztofCzarnecki and Gorel Hedin, editors, SLE 2012, LNCS 7745, pages 83–103. Springer,2012.
[MRR11a] Shahar Maoz, Jan Oliver Ringert, and Bernhard Rumpe. CD2Alloy: Class DiagramsAnalysis Using Alloy Revisited. In Jon Whittle, Tony Clark, and Thomas Kuhne,editors, MoDELS, LNCS 6981, pages 592–607. Springer, 2011.
[MRR11b] Shahar Maoz, Jan Oliver Ringert, and Bernhard Rumpe. Modal Object Diagrams. InMira Mezini, editor, ECOOP 2011, LNCS 6813, pages 281–305. Springer, 2011.
[RD11] Manuel Roldan and Francisco Duran. Dynamic Validation of OCL Constraints withmOdCL. ECEASST, 44, 2011.
[RG00] Mark Richters and Martin Gogolla. Validating UML Models and OCL Constraints.In Andy Evans and Stuart Kent, editors, Proc. 3rd Int. Conf. Unified Modeling Lan-guage (UML’2000), pages 265–277. Springer, Berlin, LNCS 1939, 2000.
[RJB04] James Rumbaugh, Ivar Jacobson, and Grady Booch. The Unified Modeling LanguageReference Manual, 2nd Edition. Addison Wesley, 2004.
[SE09] Michael Soden and Hajo Eichler. Temporal Extensions of OCL Revisited. InRichard F. Paige, Alan Hartman, and Arend Rensink, editors, ECMDA-FA 2009,LNCS 5562, pages 190–205. Springer, 2009.
[TJ07] Emina Torlak and Daniel Jackson. Kodkod: A Relational Model Finder. In OrnaGrumberg and Michael Huth, editors, TACAS 2007, LNCS 4424, pages 632–647.Springer, 2007.
[WK03] Jos Warmer and Anneke Kleppe. The Object Constraint Language: Getting YourModels Ready for MDA. Addison Wesley, Reading, Massachusetts, 2003.
[YFR08] Lijun Yu, Robert B. France, and Indrakshi Ray. Scenario-Based Static Analysisof UML Class Models. In Krzysztof Czarnecki, Ileana Ober, Jean-Michel Bruel,Axel Uhl, and Markus Volter, editors, MoDELS 2008, LNCS 5301, pages 234–248.Springer, 2008.
[ZG03] Paul Ziemann and Martin Gogolla. OCL Extended with Temporal Logic. In ManfredBroy and Alexandre Zamulin, editors, 5th Int. Conf. Perspectives of System Informat-ics (PSI’2003), pages 351–357. Springer, Berlin, LNCS 2890, 2003.
288

On the Usage of UML:
Initial Results of Analyzing Open UML Models
Philip Langer, Tanja Mayerhofer, Manuel Wimmer, Gerti Kappel
Business Informatics Group
Vienna University of Technology
langer, mayerhofer, wimmer, [email protected]
Abstract: While UML is recognized as the de-facto standard in modeling softwaresystems, it is at the same time often criticized for being too large and complex. To beable to evolve UML to overcome this criticism, evidence is needed about which partsof UML are actually used. In this respect, a few studies exist that investigate whichdiagram types of UML are commonly used. However, to the best of our knowledge, innone of these studies, evidence is provided about which modeling concepts of UMLare used. Thus, we quantitatively analyze UML models to determine on a fine gran-ularity level the usage frequency of the modeling concepts provided by UML. In thispaper, we present initial results of our analysis of 121 open UML models and compareour findings with the results reported in related studies about the usage of UML.
1 Introduction
The first official version of UML (version 0.8) has been proposed already 19 years ago in
1995 [BM98]. Since then, UML underwent several extensive changes leading to the latest
version UML 2.4.1 at the time of writing and UML 2.5 is underway. Especially, with the
advent of UML 2.0, the language introduces several additional modeling concepts leading
to a family of modeling languages usable for different modeling domains [Kob99]. On the
one hand, UML is acknowledged as being the de-facto standard in modeling software sys-
tems and empirical evidence exists that UML is adopted by the industry (e.g., [HWRK11]).
However, on the other hand, UML is often criticized for being too large and too complex
mitigating its understandability and adoption [FGDTS06].
To be able to identify a concise core of UML that allows a smooth introduction to the lan-
guage, evidence is needed about which parts of UML are actually most frequently used.
The identification of a concise core of UML might ease the process of learning UML and
weaken the barriers to entry for adopting UML in industry. Vendors of UML modeling
tools and of UML-based tools, such as code generation frameworks, could focus on in-
creasing the quality of their tools for this core of UML. Based on the knowledge which
parts of UML are extensively used, which are scarcely or never used, and which are often
extended using UML’s language inherent extension mechanism UML profiles, can also
help in further evolving UML by discarding unused parts, improving or clarifying the
scarcely used parts and enhancing the often extended parts.
289

Only a few studies investigate the usage of UML [BBB+11] by analyzing the usage fre-
quency of the different diagram types of UML in literature, teaching materials, and tutori-
als, as well as the frequency in which they are supported by UML tools (e.g., [RLRC13])
or by performing surveys or interviews with practitioners (e.g., [DP06, Pet13]). These
studies indicate that certain diagram types are more frequently used than others. However,
to the best of our knowledge, in-depth and fine-grained analyses about the usage frequency
of UML’s modeling concepts, and not only of certain diagram types, are missing so far.
In this paper, we address this lack of a fine-grained study about the usage frequency of
UML’s modeling concepts. In particular, we quantitatively analyze 121 UML models
that are publicly available on the Web and present initial results towards answering the
following research questions (RQ):
RQ1: What is the usage frequency of UML’s sublanguages? As UML comprises ac-
tually a family of languages, we investigate the usage frequency of these sublanguages
and also compare our results with those of other existing studies dealing with the usage
frequency of the diagram types provided by UML.
RQ2: What is the usage frequency of UML’s modeling concepts? Furthermore, we
analyze the usage frequency of the modeling concepts provided by UML’s sublanguages.
To the best of our knowledge, this question has not been investigated by existing studies.
RQ3: What is the usage frequency of UML profiles? In our analysis, we also investigate
the usage frequency of UML profiles—UML’s language-inherent extension mechanism.
Again, to the best of our knowledge, this question has not been investigated before.
The remainder of this paper is structured as follows. In the next section, we provide an
overview of related studies on the usage of UML and summarize their findings. In Sec-
tion 3, we document the model acquisition and analysis process of our study. In Section 4,
we present the results of our study and compare them with the results obtained by related
studies. Finally, we discuss the threats to the validity of our results in Section 5 and we
conclude the paper with an outlook on future work in Section 6.
2 Related Work
A survey on existing studies on the usage of UML in general may be found in [BBB+11].
Please note that we focus on the usage frequency of UML’s modeling concepts in this pa-
per and we do not intend to compute metrics about comprehensibility and design quality
of UML models as it is done in [NC08, GPC09, MSZJ04]. Thus, we summarize studies
related to the usage frequency of UML’s modeling concepts and report on language usage
studies for domain-specific modeling languages (DSMLs). Finally, we highlight limita-
tions of existing UML usage studies and how we address these limitations in this paper.
Studies on the usage of UML. There are several studies aiming to answer, besides others,
the question: what is the usage frequency of the different UML diagram types? Dobing
and Parsons [DP06] have been one of the first studying the how and why of using UML.
They focused on questions to which extent a UML diagram type is used and subsequently
290

relate the results to the complexity of UML. They collected their data between 2003 and
2004 based on an online survey. Grossman et al. [GAM05] also investigated the adoption
and the usage of UML in the software development community by an online survey. They
conclude that there is a wide diversity of opinions regarding UML. Furthermore, a more
recent study done by Hutchinson et al. [HWRK11] also investigates the question on used
modeling languages by using an online survey yielding that 85% of the survey participants
use UML as modeling language.
A very recent study on the usage of UML in practice is reported by Petre in [Pet13]. The
study is based on interviews with professional software developers and five patterns on
UML usage are identified. In the context of this study, the developers have been also
asked about the usage of the different diagram types.
A different data acquisition method concerning the sources of information is used by Reg-
gio et al. [RLRC13]. Instead of surveys or interviews, different kinds of teaching and
training material are investigated, as well as UML tools. Based on this set of different
resources, the usage frequency of UML diagram types is determined.
Table 1 summarizes the results of the mentioned studies by stating the three most used
UML diagram types as given by the corresponding studies.
While the mentioned studies use surveys, interviews, or analyses of teaching materials,
training materials, and UML tools to collect the data for concluding about the usage of
UML, only a few studies exist that analyze models for this purpose. In [OC13], Osman
and Chaudron analyze ten open source repositories for determining the usage of UML dia-
grams in addition to other questions, such as model and code co-evolution. They conclude
that UML class diagrams are used in the studied open source projects, but other diagrams
are scarcely used.
Concerning the usage of UML profiles, Pardillo [Par10] used a manual approach analyzing
existing literature on UML profiles to identify the current practices in defining them. He
concludes that the majority of profiles is defined for class diagrams and only a few profiles
are defined for the behavioral part of UML.
Studies on the usage of DSMLs. Two studies about language usage are presented by
Tairas and Cabot in [TC13]. In particular, two DSMLs are analyzed by collecting different
usage statistics, such as the instantiation frequency of metaclasses. A similar approach is
followed by Kusel et al. [KSW+13] where the subject of investigation is the application
frequency of reuse mechanisms of the ATLAS Transformation Language (ATL). Finally,
Williams et al. [WZM+13] discuss through a corpus-based analysis of metamodels defined
in Ecore how metamodels look like by computing several different metrics.
Rank Dobing & Parsons
[DP06]
Grossman et al.
[GAM05]
Reggio et al.
[RLRC13]
Petre
[Pet13]
Hutchinson et al.
[HWRK11]
1 Class Diagram Use Case Diagram Class Diagram Class Diagram Class Diagram
2 Use Case Diagram Class Diagram Activity Diagram Sequence Diagram Activity Diagram
3 Sequence Diagram Sequence Diagram Sequence Diagram Activity Diagram Use Case Diagram
Table 1: Most used UML diagram types reported in literature.
291
Going beyond the state-of-the-art. Several papers aim to uncover the how and why UML
is used by utilizing different data acquisition methods and analysis approaches. However,
there is currently a lack of fine-grained quantitative studies investigating a larger corpus of
UML models. Such studies are needed in order to answer more detailed research questions
concerning how UML is used from a language perspective. Currently, the usage of UML
is discussed on diagram level granularity, only. But, for instance, the usage frequency
of modeling concepts has not been explored to the best of our knowledge. Thus, we
aim in this paper for a fine-grained quantitative study in the spirit of [LKR05, KSW+13,
TC13, WZM+13] based on a corpus of open UML models to answer additional research
questions on the usage of UML.
3 Study Design
As an infrastructure for our analysis, we chose to use the UML modeling tool Enterprise
Architect1 (Version 9.0, Ultimate Edition) of the company Sparx Systems—which is one
of the most popular UML modeling tools2 and supporting UML 2.4.1. The main reason for
this choice is our long-standing research collaboration with Sparx System’s global partner
SparxSystems Software GmbH Central Europe who supports us in this study.
The corpus of analyzed models consists of open UML models, which are publicly available
on the Web and which have been created with Enterprise Architect. However, in ongoing
work we are currently also analyzing—by the same means as described in the following—
open UML models that have been created with other modeling tools.
In the remainder of this section we first describe how the analyzed UML models have been
retrieved from the Web and provide general figures about these models, and we second
explain the model analysis process used in our study3.
3.1 Data Set
For retrieving publicly accessible UML models from the Web that have been created with
Enterprise Architect, we used the file type search provided by the search engine of Google,
which enables to search for files with specific file extensions. Thus, for searching Enter-
prise Architect models, we used the search string filetype:eap. We carried out this
search twice, once in December 2012 and once in April 2013 resulting in 151 UML mod-
els. By investigating the URLs of the websites hosting these 151 models and reviewing the
models’ content, we identified twelve duplicates and 17 revisions of retrieved UML mod-
els, as well as one empty model. After filtering these models, we analyzed the remaining
121 UML models regarding their usage of UML’s modeling concepts.
1http://www.sparxsystems.com/products/ea/index.html2http://list.ly/list/2io-popular-uml-modeling-tools3Please refer to http://www.modelexecution.org/?page_id=982 for additional information
about the design of our study.
292

59134
332
0 200 400 600 800 1000120014001600180020002200240026002800300032003400360038004000
model size (number of elements)
2 3903
9 1247 2007
0 200 400 600 800 1000 1200 1400 1600 1800 2000 2200 2400 2600 2800 3000
model lifespan (days)
1 2955
model lifespan (days)
Figure 1: Size and lifespan of the analyzed UML models.
About half of the models (54%) have been retrieved from open source software reposito-
ries, namely google code, assembla, and github. About a quarter of the models (28%) has
been retrieved from project websites which use the software project management system
trac, and 18% have been retrieved from other sources. By manually reviewing the models’
content, we found out that they are also mainly concerned with software-related aspects of
the modeled systems.
To characterize the retrieved models, we determined their size in terms of the number of
elements contained by the models, as well as the lifespan of the models in terms of days
between the creation date and the last modification date of the models (cf. Figure 1).
As can be seen in the boxplot of the sizes of the analyzed models, depicted at the top of
Figure 1, the smallest model contained two elements, while the largest model contained
3903 elements. The average number of elements (arithmetic mean) contained by the an-
alyzed UML models is 385 and the median number is 134, the first quartile is 59 and the
third quartile is 332. Thus, our data set does not contain very huge models (companies
report on models comprising tens of thousands of elements [KPP08]), but they are on av-
erage of reasonable size for being considered useful for analyzing the usage frequency of
UML’s modeling concepts.
The boxplot of the lifespans of the analyzed models, depicted at the bottom of Figure 1,
shows, that the minimal lifespan of the analyzed models is one day while the maximal
lifespan is 2955 days (i.e., about eight years). The average lifespan (arithmetic mean) of
the analyzed models is 1083 days (i.e., about three years) and the median value for the
lifespan is 1247 days (i.e., 3.4 years), the first quartile is 9 days and the third quartile is
2007 days (i.e., 5.5 years). This data shows that on average the models have been created
and maintained for a considerable period of time.
3.2 Data Analysis
Enterprise Architect provides an API, as well as a scripting environment that can be used to
directly access the content of UML models. Using the API and the scripting environment,
293

35(78%)
22(88%)
21(58%)
1(50%)
6(75%)
2(10%)
2(100%)
7(37%)
0(0%)
4(67%)
6(60%)
4(80%)
1(11%)
4(80%)0
51015202530354045
Num
bero
fmetaclasses
Language unit
Number of not considered metaclassesNumber of considered metaclasses
Figure 2: Number of metaclasses (considered / not considered in the analysis) per language unit.
we developed a script that iterates over all elements contained by a model and determines
for each element its type, as well as whether a stereotype is applied on the element. The
type of a model element corresponds to the instantiated UML metaclass. We regard each
non-abstract metaclass defined in the metamodel of UML as a modeling concept of UML.
We assigned each of these metaclasses to exactly one UML language unit, that is the
language unit to which the package containing the respective metaclass is assigned to by
the UML standard [Obj11, page 7–8]. Please note that we could not include all UML
metaclasses in our analysis because they are either not explicitly represented in Enterprise
Architect (e.g., the metaclass LiteralBoolean is represented as simple String), or they are
not available at all in Enterprise Architect (e.g., the metaclass ReduceAction). Figure 2
depicts the number of metaclasses assigned to the respective language units, as well as
the number of metaclasses which have been considered in the analysis and the number
of metaclasses which have not been considered. In summary, 115 of 193 non-abstract
metaclasses defined in the metamodel of UML are considered in our analysis.
As output of the script, we obtain an XML file that contains the information how often
each modeling concept is used by the analyzed UML model and how often each modeling
concept is extended by stereotype applications. Based on this data, it is possible to de-
termine for each analyzed UML model the size of the model in terms of contained model
elements, the usage frequency of UML’s language units, the usage frequency of UML’s
modeling concepts, and the usage frequency of UML profiles. We calculate the respective
figures using an additional Java program which aggregates the data captured in the XML
files obtained for the analyzed models.
4 Analysis Results
In this section, we present the analysis results based on our corpus of open UML models
structured according to the research questions RQ1-34.
4More detailed results can be found at http://www.modelexecution.org/?page_id=982.
294
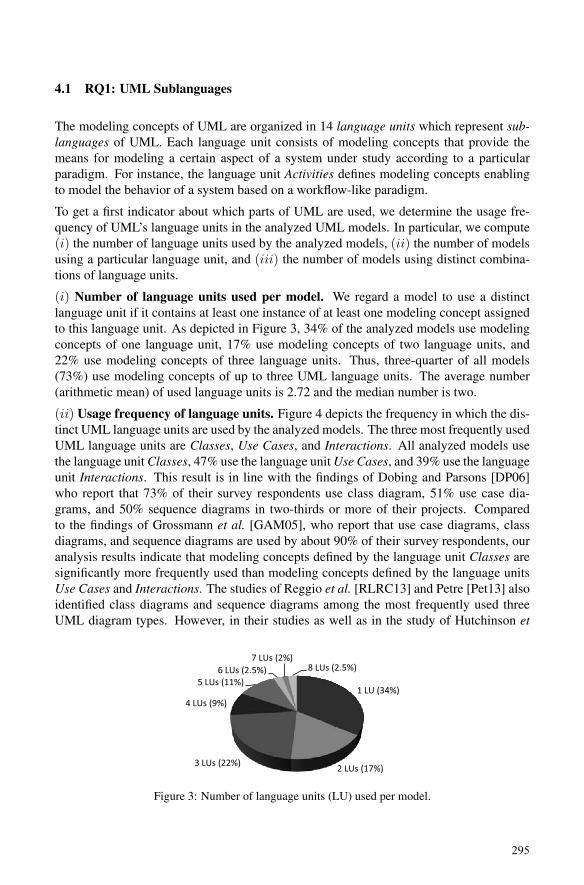
4.1 RQ1: UML Sublanguages
The modeling concepts of UML are organized in 14 language units which represent sub-
languages of UML. Each language unit consists of modeling concepts that provide the
means for modeling a certain aspect of a system under study according to a particular
paradigm. For instance, the language unit Activities defines modeling concepts enabling
to model the behavior of a system based on a workflow-like paradigm.
To get a first indicator about which parts of UML are used, we determine the usage fre-
quency of UML’s language units in the analyzed UML models. In particular, we compute
(i) the number of language units used by the analyzed models, (ii) the number of models
using a particular language unit, and (iii) the number of models using distinct combina-
tions of language units.
(i) Number of language units used per model. We regard a model to use a distinct
language unit if it contains at least one instance of at least one modeling concept assigned
to this language unit. As depicted in Figure 3, 34% of the analyzed models use modeling
concepts of one language unit, 17% use modeling concepts of two language units, and
22% use modeling concepts of three language units. Thus, three-quarter of all models
(73%) use modeling concepts of up to three UML language units. The average number
(arithmetic mean) of used language units is 2.72 and the median number is two.
(ii) Usage frequency of language units. Figure 4 depicts the frequency in which the dis-
tinct UML language units are used by the analyzed models. The three most frequently used
UML language units are Classes, Use Cases, and Interactions. All analyzed models use
the language unit Classes, 47% use the language unit Use Cases, and 39% use the language
unit Interactions. This result is in line with the findings of Dobing and Parsons [DP06]
who report that 73% of their survey respondents use class diagram, 51% use case dia-
grams, and 50% sequence diagrams in two-thirds or more of their projects. Compared
to the findings of Grossmann et al. [GAM05], who report that use case diagrams, class
diagrams, and sequence diagrams are used by about 90% of their survey respondents, our
analysis results indicate that modeling concepts defined by the language unit Classes are
significantly more frequently used than modeling concepts defined by the language units
Use Cases and Interactions. The studies of Reggio et al. [RLRC13] and Petre [Pet13] also
identified class diagrams and sequence diagrams among the most frequently used three
UML diagram types. However, in their studies as well as in the study of Hutchinson et
1 LU (34%)
2 LUs (17%)3 LUs (22%)
4 LUs (9%)
5 LUs (11%)6 LUs (2.5%)
7 LUs (2%)8 LUs (2.5%)
Figure 3: Number of language units (LU) used per model.
295
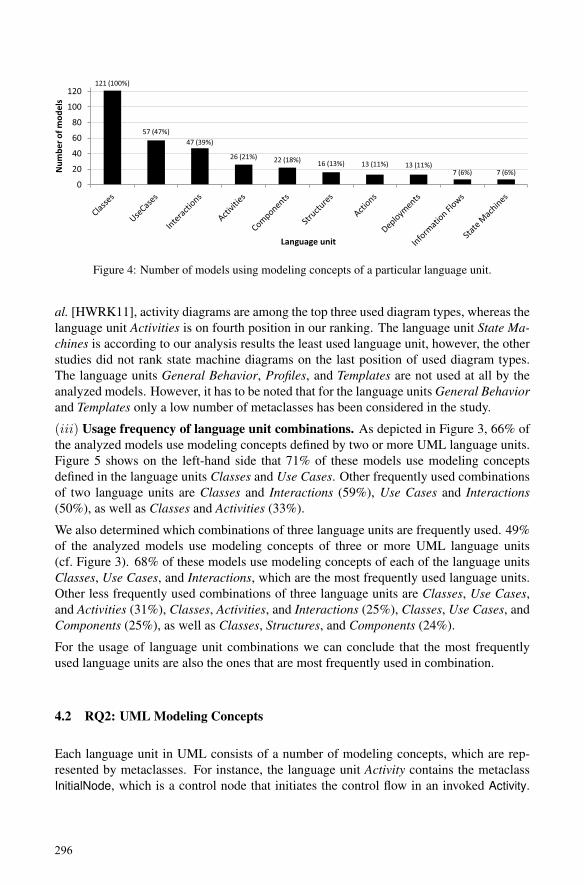
121 (100%)
57 (47%)47 (39%)
26 (21%) 22 (18%) 16 (13%) 13 (11%) 13 (11%)7 (6%) 7 (6%)
0
20
40
60
80
100
120
Num
bero
fmod
els
Language unit
Figure 4: Number of models using modeling concepts of a particular language unit.
al. [HWRK11], activity diagrams are among the top three used diagram types, whereas the
language unit Activities is on fourth position in our ranking. The language unit State Ma-
chines is according to our analysis results the least used language unit, however, the other
studies did not rank state machine diagrams on the last position of used diagram types.
The language units General Behavior, Profiles, and Templates are not used at all by the
analyzed models. However, it has to be noted that for the language units General Behavior
and Templates only a low number of metaclasses has been considered in the study.
(iii) Usage frequency of language unit combinations. As depicted in Figure 3, 66% of
the analyzed models use modeling concepts defined by two or more UML language units.
Figure 5 shows on the left-hand side that 71% of these models use modeling concepts
defined in the language units Classes and Use Cases. Other frequently used combinations
of two language units are Classes and Interactions (59%), Use Cases and Interactions
(50%), as well as Classes and Activities (33%).
We also determined which combinations of three language units are frequently used. 49%
of the analyzed models use modeling concepts of three or more UML language units
(cf. Figure 3). 68% of these models use modeling concepts of each of the language units
Classes, Use Cases, and Interactions, which are the most frequently used language units.
Other less frequently used combinations of three language units are Classes, Use Cases,
and Activities (31%), Classes, Activities, and Interactions (25%), Classes, Use Cases, and
Components (25%), as well as Classes, Structures, and Components (24%).
For the usage of language unit combinations we can conclude that the most frequently
used language units are also the ones that are most frequently used in combination.
4.2 RQ2: UML Modeling Concepts
Each language unit in UML consists of a number of modeling concepts, which are rep-
resented by metaclasses. For instance, the language unit Activity contains the metaclass
InitialNode, which is a control node that initiates the control flow in an invoked Activity.
296

57 (71%)
47 (59%)
40 (50%)
26 (33%)
0 20 40 60 80
Classes,UseCases
Classes,Interactions
UseCases,Interactions
Classes,Activities
Number of models
Combina
tionof
2langua
geun
its
40 (68%)
18 (31%)
15 (25%)
15 (25%)
14 (24%)
0 20 40 60
Classes,UseCases,Interactions
Classes,UseCases,Activities
Classes,Activities,Interactions
Classes,UseCases,
Components
Classes,Structures,Components
Number of models
Combina
tionof
3langua
geun
itsFigure 5: Number of models using a particular combination of language units.
1 (100%) 2 (100%) 4 (100%)
5 (83%) 17 (81%)
5 (71%) 15 (68%) 4 (67%)
2 (50%)
4 (11%)
0%
20%
40%
60%
80%
100%
Components InformationFlows
Use Cases StateMachines
Classes Interactions Activities Deployments Structures Actions
Language unit
Figure 6: Proportion of used metaclasses among all considered metaclasses per language unit.
When creating a UML model, these metaclasses are instantiated and populated with prop-
erty values. The number of metaclasses in the language units vary significantly ranging
from one metaclass in the language unit Models up to 45 metaclasses in Actions.
In this section, we analyze the usage frequency of these metaclasses. In particular, (i)we identify the proportion of metaclasses that are actually used among all considered
metaclasses. To also consider how often they are used, we further analyze (ii) in how
many models each metaclass is used, and the number of instances of each metaclass in
comparison to the number of all model elements of the respective language unit. Here, we
focus on the most frequently used language units Classes, Interactions, and Use Cases.
(i) Used metaclasses versus unused metaclasses. Figure 6 depicts the proportion of
metaclasses that are actually used (i.e., at least one instance exists) among all considered
metaclasses in the respective language unit. According to this data, the language units
Components, Information Flows, and Use Cases seem to be the most concise ones, as all
metaclasses introduced in these language units are actually used in the considered models.
For the language unit State Machines, we also observe a high proportion of used meta-
classes among all metaclasses: 83% of the metaclasses are instantiated at least once. We
may also highlight the language unit Classes. This language unit contains significantly
297
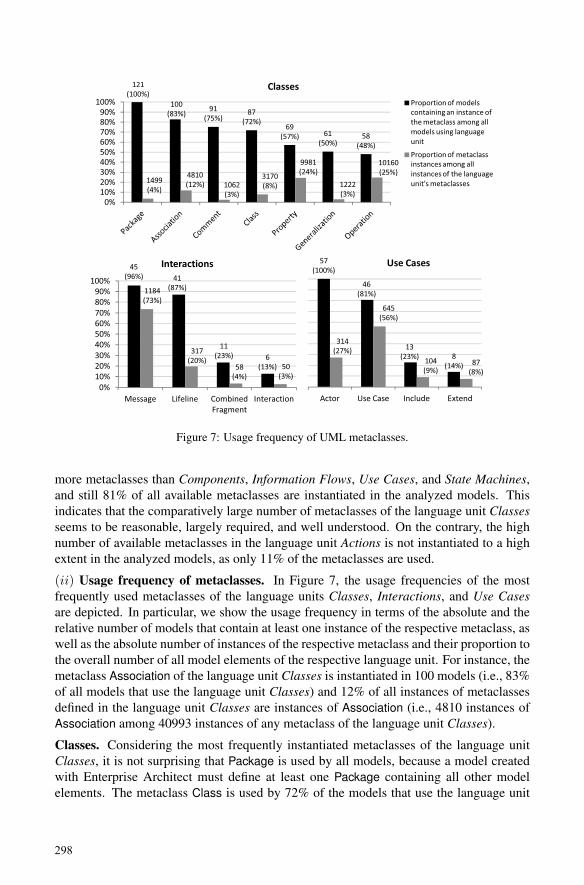
121(100%)
100(83%) 91
(75%)87
(72%)69
(57%) 61(50%)
58(48%)
1499(4%)
4810(12%) 1062
(3%)
3170(8%)
9981(24%)
1222(3%)
10160(25%)
0%10%20%30%40%50%60%70%80%90%100%
ClassesProportionof modelscontainingan instance ofthemetaclass among allmodels using languageunit
Proportionof metaclassinstancesamong allinstancesof the languageunit'smetaclasses
45(96%) 41
(87%)
11(23%) 6
(13%)
1184(73%)
317(20%)
58(4%)
50(3%)
0%10%20%30%40%50%60%70%80%90%
100%
Message Lifeline CombinedFragment
Interaction
Interactions 57(100%)
46(81%)
13(23%) 8
(14%)
314(27%)
645(56%)
104(9%)
87(8%)
Actor Use Case Include Extend
Use Cases
Figure 7: Usage frequency of UML metaclasses.
more metaclasses than Components, Information Flows, Use Cases, and State Machines,
and still 81% of all available metaclasses are instantiated in the analyzed models. This
indicates that the comparatively large number of metaclasses of the language unit Classes
seems to be reasonable, largely required, and well understood. On the contrary, the high
number of available metaclasses in the language unit Actions is not instantiated to a high
extent in the analyzed models, as only 11% of the metaclasses are used.
(ii) Usage frequency of metaclasses. In Figure 7, the usage frequencies of the most
frequently used metaclasses of the language units Classes, Interactions, and Use Cases
are depicted. In particular, we show the usage frequency in terms of the absolute and the
relative number of models that contain at least one instance of the respective metaclass, as
well as the absolute number of instances of the respective metaclass and their proportion to
the overall number of all model elements of the respective language unit. For instance, the
metaclass Association of the language unit Classes is instantiated in 100 models (i.e., 83%
of all models that use the language unit Classes) and 12% of all instances of metaclasses
defined in the language unit Classes are instances of Association (i.e., 4810 instances of
Association among 40993 instances of any metaclass of the language unit Classes).
Classes. Considering the most frequently instantiated metaclasses of the language unit
Classes, it is not surprising that Package is used by all models, because a model created
with Enterprise Architect must define at least one Package containing all other model
elements. The metaclass Class is used by 72% of the models that use the language unit
298
Classes. The reason why not all of these models use the modeling concept Class is that the
language unit Classes contains also metaclasses that are used in combination with meta-
classes of other language units. For instance, the modeling concept Generalization may not
only be used among instances of Class, but also among instances of Actor (belonging to
the language unit Use Cases). Similarly, as the metaclass Association is, for instance, also
used to associate an Actor with a UseCase, more models contain instances of Association
than models containing instances of Class. Interestingly, there are more models that con-
tain instances of Class than models containing instances of either Operation or Property.
This indicates that in some of the models Class instances exist without owned operations
or properties. It is also worth noting that 75% of the models that use the language unit
Classes also contain at least one instance of Comment, whereas the number of comments
is rather small (3% of the model elements). Modeling concepts that are not used at all in
the analyzed models are Abstraction, PackageImport, PackageMerge, and PrimitiveType.
The remaining 10 metaclasses of the language unit Classes considered in this study are
used in between 2% and 39% of the analyzed models using this language unit.
Interactions. Nearly all models that use metaclasses of the language unit Interactions
contain at least one instance of Message (96%) and Lifeline (87%). The proportion of in-
stances of these metaclasses together account for 93% among all instances of metaclasses
defined in this language unit. The metaclasses CombinedFragment and Interaction are only
used by 23% and 13% of the models, respectively. The low number of models using the
metaclass Interaction can be justified by the fact that Enterprise Architect does not im-
plement the restriction, defined in the UML metamodel, that instances of the metaclasses
Lifeline and Message have to be contained by an instance of Interaction. If a user creates,
for instance, a new sequence diagram in Enterprise Architect, no Interaction instance is
created automatically, but the user can still add Lifeline instances and Message instances
to the diagram. The metaclass Gate is only used in two models which contain one instance
each, whereas the metaclasses Continuation and StateInvariant are not used at all.
Use Cases. The most frequently used metaclasses of the language unit Use Cases are Actor
and UseCase, which are instantiated in 100% and 81% of the models using the language
unit Use Cases, respectively. This also means that 19% of the models that contain an
instance of Actor do not contain an instance of UseCase. This finding can be justified
by two reasons. First, some of the analyzed models contain only Actor instances without
associating them to UseCase instances. Second, in Enterprise Architect actors can be used
equivalently to lifelines for defining interactions. In the analyzed models, instances of
Actor and UseCase together account for 83% of all UML elements from the language unit
Use Cases, whereas there are on average around two use cases per actor in the analyzed
models. Interestingly, the metaclasses Extend and Include are only scarcely used in the
analyzed models: only 23% and 14% of the models use them at all and their instances
account together for only 17% of all UML elements of the language unit Use Cases.
Other language units. Besides the language units discussed above, we also highlight
some interesting findings in the language units Activities, Actions, and Deployments. How-
ever, we omit a dedicated figure due to space limitations.
Among all models that contain instances of metaclasses of the language unit Activities, the
most frequently used metaclasses are ControlFlow (used in 88% of the respective models),
299

Activity (77%), InitialNode (73%), as well as ActivityFinalNode and DecisionNode (65%
each). Modeling concepts of the language unit Activities, that are not used in any of the
analyzed models, are ActivityParameter, CentralBufferNode, ConditionalNode, Exception-
Handler, ExpansionNode, SequenceNode, and StructuredActivityNode.
Unfortunately, only 13 models contain at least one instance of a metaclass containted
by the language unit Actions (cf. Figure 4), which mitigates the validity of any general
conclusions that we may draw from this data. However, it is interesting to note that in
these models, only the metaclass OpaqueAction has been used frequently (in twelve out of
13 models). CallOperationAction, Pin, and WriteVariableAction are only used in three, two,
and one of 13 models, respectively, whereas all other action types are not used at all.
Also modeling concepts of the language unit Deployments are only used in 13 models
(cf. Figure 4). From this language unit, mainly Node and Device are adopted frequently:
Eleven models use Node and eight models use Device. The metaclasses ExecutionEnvironment
and DeploymentSpecification are only used in three and two models, respectively, and Ar-
tifact, as well as Manifestation, are not used at all.
4.3 RQ3: UML Profiles
We explore in this subsection the usage of UML profiles in our corpus of UML models. In
particular, we identify (i) the ratio of models containing profile applications compared to
those not having profile applications. To consider to which extent the models are profiled,
we further analyze (ii) the ratio of stereotyped elements in models, i.e., elements that
have at least one stereotype applied, compared to non-stereotyped elements, i.e., elements
that have no stereotype applied. Finally, we determine (iii) the most frequently used
stereotypes and the most frequently extended metaclasses.
(i) Ratio of profiled versus non-profiled models. We identified the models that have at
least one stereotype applied on one of their model elements resulting in a profiling rate
of 59% for the analyzed models. In this context, we had to consider also the realization
peculiarities of UML. In particular, we did not count the application of UML standard
stereotypes and keywords. Thus, more stereotype applications may exist, which are, how-
ever, considered as an alternative way to represent standard UML concepts.
(ii) Ratio of stereotyped versus non-stereotyped elements. Some models are heavily
extended by profile applications. One model even contains nearly exclusively stereotyped
elements which is a strong indicator for the usage of UML profiles providing mandatory
stereotypes. On average (arithmetic mean), 22% of the elements contained by a profiled
model are stereotyped.
(iii) Most frequently extended metaclasses / most frequently used stereotypes. In
Figure 8, we show the ten most frequently extended metaclasses according to the absolute
number of the metaclasses’ instances with stereotype applications. The most frequently
extended metaclasses are Property, Operation, Class, and Association. Stereotype appli-
cations that are attached to instances of these four metaclasses account for 88% of all
stereotype applications for the given model population.
300
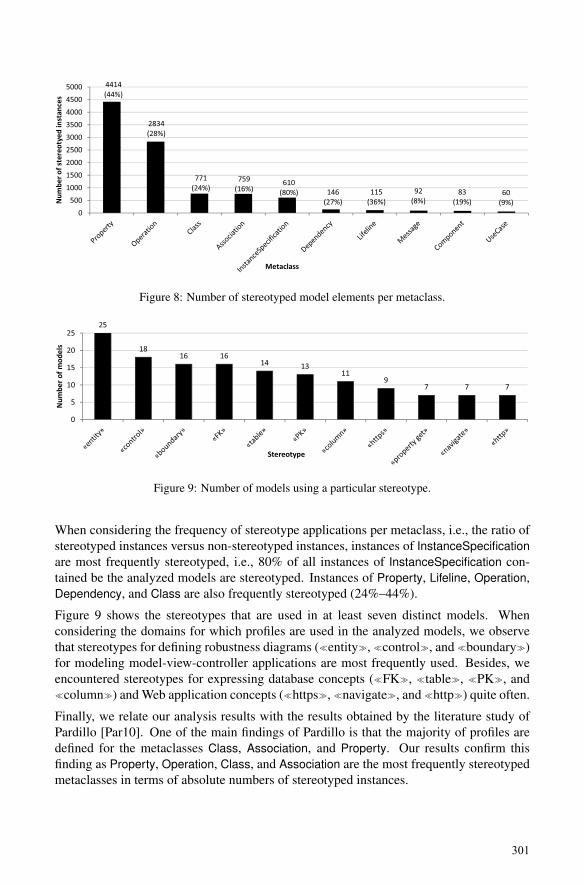
0,4422402560,2789370080,2432176660,1577962580,8036890650,2693726940,3627760250,0777027030,1903669720,0930232560,108280255
4414(44%)
2834(28%)
2000250030003500400045005000
ofstereo
tyed
instan
ces
0,4848484850,6666666670,3272727270,0887096770,0813953490,571428571
0,3750,2727272730,6666666670,068965517
1
771(24%)
759(16%)
610(80%) 146
(27%)115(36%)
92(8%)
83(19%)
60(9%)
05001000150020002500
Num
bero
fstereo
Metaclass
Figure 8: Number of stereotyped model elements per metaclass.
25
1816 16
14 1311
97 7 710
15
20
25
mbe
rofm
odels
0
5Num
Stereotype
Figure 9: Number of models using a particular stereotype.
When considering the frequency of stereotype applications per metaclass, i.e., the ratio of
stereotyped instances versus non-stereotyped instances, instances of InstanceSpecification
are most frequently stereotyped, i.e., 80% of all instances of InstanceSpecification con-
tained be the analyzed models are stereotyped. Instances of Property, Lifeline, Operation,
Dependency, and Class are also frequently stereotyped (24%–44%).
Figure 9 shows the stereotypes that are used in at least seven distinct models. When
considering the domains for which profiles are used in the analyzed models, we observe
that stereotypes for defining robustness diagrams ("entity#, "control#, and "boundary#)
for modeling model-view-controller applications are most frequently used. Besides, we
encountered stereotypes for expressing database concepts ("FK#, "table#, "PK#, and"column#) and Web application concepts ("https#, "navigate#, and "http#) quite often.
Finally, we relate our analysis results with the results obtained by the literature study of
Pardillo [Par10]. One of the main findings of Pardillo is that the majority of profiles are
defined for the metaclasses Class, Association, and Property. Our results confirm this
finding as Property, Operation, Class, and Association are the most frequently stereotyped
metaclasses in terms of absolute numbers of stereotyped instances.
301

5 Threats to Validity
Internal threats. We identified the following two factors that might affect the validity of
our analysis results for the analyzed corpus of UML models.
We were not able to analyze the usage of all modeling concepts provided by UML, because
not all of them are explicitly supported by Enterprise Architect. From the 193 modeling
concepts of UML, we could only consider 115 of them in the analysis (cf. Figure 2). For
determining which modeling concepts are explicitly supported, we reviewed the Enterprise
Architect user guide, as well as the tool itself.
In the analysis, we chose to classify all modeling concepts provided by UML into sub-
languages according to their assignment to language units defined by the UML standard.
However, this sublanguage categorization does not take into account that certain modeling
concepts can be used also when applying other sublanguages.
External threats. The following characteristics of the analyzed UML models restrict the
extent at which it is possible to generalize our findings. The presented analysis consid-
ers open models that are publicly available on the Web and that have been created with
Enterprise Architect. Further, the analyzed sample is with 121 UML models fairly small.
The analyzed set of models does not contain very huge models. Furthermore, most of the
models are obtained from open source repositories and thus may largely concern the do-
main of software systems. We did not take into account the purpose of the models, such as
documentation, specification, code generation, or reverse engineering, which might have
an impact on which modeling concepts of UML are used. Due to these characteristics
of the analyzed data set, the obtained results are only valid for this set of analyzed UML
models and they cannot be generalized for closed UML models (i.e., models that are not
publicly available), UML models that have been created with UML modeling tools other
than Enterprise Architect, huge models, or models that have been used in other application
domains than software systems. Further, it has to be investigated whether the purpose of
the models has an impact on which modeling concepts of UML are used.
Despite these limitations concerning the generalisability of our results, the analysis method
presented in this paper can be applied to analyze arbitrary UML models to compute the
usage frequency of UML’s sublanguages, UML’s modeling concepts, and UML profiles.
6 Summary and Outlook
We presented the results of analyzing 121 open UML models concerning the usage fre-
quency of the sublanguages and modeling concepts of UML, as well as of UML profiles.
Our stated research questions have been answered for this set of UML models as follows.
RQ1: What is the usage frequency of UML’s sublanguages? The language units that
are most frequently used in the analyzed models are Classes, Use Cases, and Interactions
(100%, 47%, and 39% of the models, respectively).
RQ2: What is the usage frequency of UML’s modeling concepts? We may conclude
302

that models using the language unit Classes use several modeling concepts quite fre-
quently, such as Class, Property, Operation, Generalization, and Association, whereas in
the language units Interactions and Use Cases mainly two modeling concepts each account
for the largest proportion among model elements of the respective language unit: 93% of
all model elements of Interactions metaclasses are either instances of Message or Lifeline
and 83% of all model elements of Use Cases are either instances of Actor or Use Case.
RQ3: What is the usage frequency of UML profiles? From the observations made
in this study, we may conclude that profiles are frequently used for defining robustness
diagrams and database schemas. The core concepts of the language unit Classes, which
are the most frequently used modeling concepts, are also most frequently stereotyped.
These results provide a first indication of which modeling concepts could be contained
in a concise core of UML. In future work, we plan to enlarge the corpus of analyzed
UML models with closed UML models from our collaborator SparxSystems Software
GmbH Central Europe, as well as with models created using other UML modeling tools, to
counteract the external threats to validity and to enable drawing more general conclusions.
Furthermore, we plan to relate the usage frequency of UML’s modeling concepts with
different characteristics of the analyzed models, such as their size, lifespan, number of
authors, purpose, and domain.
Acknowledgments. We thank Alexander Bohn and Tobias Fink for their contributions to
the presented study and SparxSystems Software GmbH Central Europe for their support.
This work is partly funded by the European Commission under the ICT Policy Support
Programme grant no. 317859 and by the Austrian Federal Ministry of Transport, Innova-
tion and Technology (BMVIT) under the FFG BRIDGE program grant no. 832160.
References
[BBB+11] David Budgen, Andy J. Burn, O. Pearl Brereton, Barbara A. Kitchenham, and RialettePretorius. Empirical evidence about the UML: a systematic literature review. Softw.,Pract. Exper., 41(4):363–392, 2011.
[BM98] Jean Bezivin and Pierre-Alain Muller. UML: The Birth and Rise of a Standard Mod-eling Notation. In First International Workshop on the Unified Modeling Language(UML), pages 1–8, 1998.
[DP06] Brian Dobing and Jeffrey Parsons. How UML is used. CACM, 49(5):109–113, 2006.
[FGDTS06] Robert B. France, Sudipto Ghosh, Trung T. Dinh-Trong, and Arnor Solberg. Model-Driven Development Using UML 2.0: Promises and Pitfalls. IEEE Computer,39(2):59–66, 2006.
[GAM05] Martin Grossman, Jay E. Aronson, and Richard V. McCarthy. Does UML make thegrade? Insights from the software development community. Information & SoftwareTechnology, 47(6):383–397, 2005.
[GPC09] Marcela Genero, Mario Piattini, and Michel R. V. Chaudron. Quality of UML models.Information & Software Technology, 51(12):1629–1630, 2009.
303
[HWRK11] John Hutchinson, Jon Whittle, Mark Rouncefield, and Steinar Kristoffersen. Empir-ical assessment of MDE in industry. In 33rd International Conference on SoftwareEngineering (ICSE), pages 471–480, 2011.
[Kob99] Cris Kobryn. UML 2001: A Standardization Odyssey. CACM, 42(10):29–37, 1999.
[KPP08] Dimitrios S. Kolovos, Richard F. Paige, and Fiona Polack. The Grand Challenge ofScalability for Model Driven Engineering. In Reports and Revised Selected Papers ofWorkshops and Symposia at MODELS’08, pages 48–53, 2008.
[KSW+13] Angelika Kusel, Johannes Schonbock, Manuel Wimmer, Werner Retschitzegger,Wieland Schwinger, and Gerti Kappel. Reality Check for Model TransformationReuse: The ATL Transformation Zoo Case Study. In International Workshop on Anal-ysis of Model Transformations (AMT) @ MODELS, 2013.
[LKR05] Ralf Lammel, Stan Kitsis, and Dave Remy. Analysis of XML Schema Usage. In XMLConference, 2005.
[MSZJ04] Haohai Ma, Weizhong Shao, Lu Zhang, and Yanbing Jiang. Applying OO Metrics toAssess UML Meta-models. In 7th International Conference on the Unified ModellingLanguage (UML), pages 12–26, 2004.
[NC08] Ariadi Nugroho and Michel R. V. Chaudron. A survey into the rigor of UML use andits perceived impact on quality and productivity. In 2nd International Symposium onEmpirical Software Engineering and Measurement (ESEM), pages 90–99, 2008.
[Obj11] Object Management Group. OMG Unified Modeling Language (OMGUML), Superstructure, Version 2.4.1, August 2011. Available at:http://www.omg.org/spec/UML/2.4.1.
[OC13] Mohd Hafeez Osman and Michel Chaudron. UML usage in Open Source Software De-velopment : A Field Study. In International Workshop on Experiences and EmpiricalStudies in Software Modelling (EESSMOD) @ MODELS, pages 23–32, 2013.
[Par10] Jesus Pardillo. A Systematic Review on the Definition of UML Profiles. In 13th In-ternational Conference on Model Driven Engineering Languages and Systems (MOD-ELS), pages 407–422, 2010.
[Pet13] Marian Petre. UML in practice. In 35th International Conference on Software Engi-neering (ICSE), pages 722–731, 2013.
[RLRC13] Gianna Reggio, Maurizio Leotta, Filippo Ricca, and Diego Clerissi. What are the usedUML diagrams? A Preliminary Survey. In International Workshop on Experiencesand Empirical Studies in Software Modelling (EESSMOD) @ MODELS, pages 3–12,2013.
[TC13] Robert Tairas and Jordi Cabot. Corpus-based analysis of domain-specific languages.Software & Systems Modeling, pages 1–16, 2013.
[WZM+13] James Williams, Athanasios Zolotas, Nicholas Matragkas, Louis Rose, DimitrisKolovos, Richard Paige, and Fiona Polack. What do metamodels really look like? InInternational Workshop on Experiences and Empirical Studies in Software Modelling(EESSMOD) @ MODELS, pages 55–60, 2013.
304

Analyzing Model Dependencies for Rule-based Regression
Test Selection
Qurat-ul-ann Farooq1, Steffen Lehnert1, Matthias Riebisch2
Ilmenau University of Technology1
University of Hamburg2
{Qurat-ul-ann.Farooq,Steffen.Lehnert}@tu-ilmenau.de
Abstract: Unintended side effects during changes of software demand for a precisetest case selection to achieve both confidence and minimal effort for testing. Identi-fying the change related test cases requires an impact analysis across different views,models, and tests. Model-based regression testing aims to provide this analysis earlierin the software development cycle and thus enables an early estimation of test effort.In this paper, we present an approach for model-based regression testing of businessprocesses. Our approach analyzes change types and dependency relations betweendifferent models such as Business Process Modeling Notation (BPMN), Unified Mod-eling Language (UML), and UML Testing Profile (UTP) models. We developed a setof impact rules to forecast the impact of those changes on the test models prior to theirimplementation. We discuss the implementation of our impact rules inside a prototypetool EMFTrace. The approach has been evaluated in a project for business processeson mobile devices.
1 Introduction
The lifetime of almost any software system is characterized by a continuous need for
changes in order to keep them up-to-date. Unintended side effects during these changes of
software introduce additional defects and errors to them. Tests as means for error detection
however require a high effort. Regression testing aims to reduce this effort by limiting the
test execution to a subset of the test cases that correspond to the changes [RH96].
Model-based regression testing (MBRT) has the potential to provide early assessments of
test effort by finding the impact of changes using the dependencies between requirements
and design models, implementation, and tests. Thus, the test effort can be reduced by
starting the test activity before the actual implementation of changes [BLH09]. However,
the representation of complex, process-based software systems demands for modeling dif-
ferent views to represent their structure, behavior and other relevant aspects.
These views represent different aspects of the same system, which results in an overlapping
of concepts and introduces dependencies between models of different views. Examples of
these views for business processes are the Process View, which represents the high level
business processes of the system, the Structural View which represents the component,
business resources, and other structural aspects of the system [PE00], and finally the Test
View which represents the test cases, test data, and other test related aspects [FR12]. De-
305
pendencies across these views propagate the changes across several models and can also
potentially impact the tests. Hence, it is crucial to analyze the dependency relations be-
tween models belonging to various views such as to deal with change propagation and to
guide the test selection.
Unfortunately, most of the existing approaches use process code for regression testing
[WLC08, LQJW10, LLZT07]. Therefore, an early forecast of the required regression
testing effort and an early start of the testing activity are not possible. Moreover, cross
view dependency relations are not considered for business processes, which results in im-
precise test selection. Other model-based regression testing approaches which determine
the model dependencies during impact analysis, require repeated dependency analysis for
each change [MTN10, PUA06, BLH09], which is not feasible in limited time and budget
constraints. Broadly, the problem we focus on in this paper is:
If a change is applied on any model belonging to the structural or process
view of a business process, what will be its impact on the tests.
The main contribution of our approach is twofold. Firstly, we forecast the impact of
changes on the Structural, Process [SDE+10, PE00], and Test view [FR12] of business
processes to support regression test selection. To do so, we combine various approaches
for dependency detection, change modeling, and impact analysis. This allows us to acquire
the impacted test elements, which are then classified as required for retest, unaffected or
obsolete. Secondly, we develop a set of impact rules to react on various changes of the
models of the structural view and the process view. Since we record the dependency rela-
tions prior to the test selection, the dependency relations are not required to be repeatedly
identified every time the impact analysis is performed, thus increasing the efficiency of the
overall process.
The remainder of this paper is organized as follows. Section 2 presents an introduction to
the case study we are using in this paper and provides more details for the motivation of
our work. Section 3 formulates the test selection problem. Section 4 presents an overview
of our approach and elaborates on the dependency relations, changes, and the impact rules.
Section 5 discusses the details of test selection and classification. Section 6 presents the
tool that implements our approach. Evaluation of the approach on a framework and on
a scenario from our case study is presented in Section 7. Related work is discussed in
Section 8 and finally, Section 9 concludes the paper and outlines further work.
2 Field Service Technician Case Study
Before we discuss the problem of regression test selection for business processes in detail,
we first introduce our case study briefly and then formulate our problem by focusing on
several aspects of the case study.
The Field Service Technician case study was developed in a joint academic and industrial
research project Adaptive Planning and Secure Execution of Mobile Processes in Dynamic
306

Scenarios (MOPS)1. Its goals are to automate the processes to assist field service orders,
which includes the planning, preparation, and execution of field service orders, manage-
ment of field tours, management of tools and spare parts, and resource scheduling. The
case study is of medium size and complexity and consists of 25 processes and 35 compo-
nents.
We modeled these processes, their interactions, and the services they utilize (Process View)
using BPMN collaboration diagrams. The other structural aspects of the processes, for
example the services provided by various participants and stakeholders of the processes
and their interfaces, the data acquired by the processes, and the relations between the
processes and business resources are modeled using UML class and component diagrams
(Structural View) [SDE+10, PE00, KKCM04] .
Test suites to tests the individual behavior of the processes and their interactions are also
required. The test suites which are being used for testing a stable version of processes
are known as a Baseline test suite. We model the baseline test suites using UTP 2 , which
allows us to model several aspects of the tests, such as the Test Architecture, Test Behavior,
and Test Data 2 . To evolve the processes of the Service Technician case study, various
changes are required to be introduced in these processes.
Section 7.2 presents an illustrative example which includes the details of views, depen-
dencies across these views and some example change scenarios on which our approach is
applied. Here, to further motivate the need for our approach, we briefly discuss one of the
changes from the scenario presented in Section 7.2.
A yet unrectified functional error in the system demands replacing an existing service with
the new one in a process. However, class-methods defined in class diagram implement
the interfaces of components, which in turn provide services to the processes. Similarly,
test cases in the test view also call these services during the test execution. Moreover,
mocks and stubs are implemented to mock the behavior of the class-methods and are used
by the test cases. If a service has to be replaced all such dependencies are required to be
understood and utilized to find the impacted tests. Thus, the questions arise that how many
such dependencies exist between these various views? If a change is to be introduced,
which test cases are affected due to such dependencies, and how they are affected?
3 Problem Definition
We consider the discussed various views and dependencies to formulate the problem of
regression test selection in the context of business processes.
Given a process P defined by a set of models SM= (B, CD, COD), where B is
a BPMN collaboration diagram representing the Process View, CD is a class
diagram, and COD is a component diagram representing the Structural View
of P. Given a set of baseline test models T to test P representing the Test View,
defined by a 2-tuple T=(Ta, Tb), where Ta is a class diagram representing the
1See: http://mops.uni-jena.de/us/Homepage-page-.html2http://utp.omg.org/
307

Test Architecture in UTP and Tb= (b1, b2,...,bn) is a set of activity diagram test
cases to test P representing the Test Behavior in UTP. Given a set of Changes
C=(c1, c2,...,cn), where each ci ∈ C is a distinct change type applicable on
any model in the set SM . For any given ci ∈ C, the problem is to determine
which elements of T will be affected by ci, which can be represented by T′
.
Moreover, for each element x ∈ T′
, it is required to determine how x can be
classified for regression testing.
The classification of test elements decides whether to select these elements for regression
testing or to omit them. Our classification of test elements is further explained in Section
5. The next section presents an overview of our approach to deal with the aforementioned
regression test selection problem.
4 Overview of Our Model-based Regression Test Selection Approach
Our approach is comprised of four major steps which are discussed in the following and
are also presented by Figure 1. In the first step, we elicitate and record the dependency
)'&%$# "!@#=
:7@&41 .,*#="#=1 (DB#*=
?<"96
:7@&41#B 3*#7#%1= )*&==0-0#B "#=1 3*#7#%1=?<"96
"+) .,*#=
F#@#%B#%4!.#*&10D%=
+!=1#7 (DB#*=?E9(CA <(>6
F#@#%B#%4!"!@#=
.#4D;B0%$ F#@#%B#%4!.#*&10D%=
"#=1 +#*#410D% 8)*&==0-04&10D%
.,*#52&=#B :7@&41/%&*!=0=
)'&%$#/@@*04&10D%
Figure 1: Overview of Regression Test Selection Approach
relations between the system models (SM to SM ) and between the system models and
test models (SM to T). They remain valid as long as no changes occur, therefore they can
be utilized for impact analysis tasks. The SM to SM dependencies are recorded using
dependency detection rules, whereas the SM to T dependencies are recorded during the
test generation. Section 4.1 discusses the details of the dependency relations and how we
record them.
The next step is to apply a change on any of the BPMN or UML models (SM ) and to assess
its impact on the tests. We defined a set of change types to model changes as shown in
Figure 1. Each model in the set SM is analyzed for this purpose to identify the applicable
changes. Section 4.2 discusses the details of these changes.
When a change is applied on a model, its corresponding impact rules are triggered to
identify the potentially affected model elements and test elements. Our impact propaga-
tion rules analyze the interplay of change types and dependency relations to identify the
affected elements. Section 4.3 elaborates on the structure and application of our impact
308

rules.
Finally, the impacted elements have to be analyzed to determine which test cases are re-
quired for regression testing and which test cases can be omitted. Therefore, we develop
a set of test selection and classification rules (TSC Rules). For the classification of the
test elements in a UTP model, we adapt and extend the test case classification scheme of
Leung and White [LW89] and applied it on UTP test elements. The classification scheme
and process are further explained in Section 5.
4.1 Recording Dependency Relations
To model them, we define the set of dependency relations as D=(d1, d2,...,dn), where each
di is a dependency relation defined by a 3-tuple (source, relation-type, target). The source
and target of a dependency relation specify the elements of either SM or T, which are
related to each other. The relation-type defines the purpose of a dependency relation and
clarifies its semantics. Dependency relations can be seen as relations between different
types of models (Cross-Model dependency relations) or relations within the same model
(Intra-Model dependency relations).
The cross-model dependency relations originating from Structural and Process views can
be categorized into four categories. These categories are also displayed by Figure 2 and
are discussed in the following.
Structural View to Structural View: expresses the relationships between UML class and
)'&'%$'%#" !':8642%0
..,* ('&%$#"!%: *('&%$#"!:"8 ('&%$#"!%
.(,* 86426'%'& :53:1"/-+)8<";986426'%'&..<* 02%$"&.6': 7"$#&6$9&3!8 ('&%$#"!%
;9200 72$':5%698 72$':
392#'00 14'/ 62 .69-#6-98: 14'/
392#'00 14'/ 62 ('06 14'/
.69-#6-98: 14'/ 62 ('06 14'/
3.,* ,$6!%**: *('&%$#"!:"8 86426'%'&
57,* 8)"**: 43!9$&!2"!98 02%$"&.6'57+* ,66): 43!9$&!2"!98 <"'%57<* ;"*9: 4$##8 7%$5.!%;"*9 .69-#6-98: 14'/ 62 .69-#6-98: 14'/
3.+* <"'%: *('&%$#"!:"8 8)"**3.<* 3"&"01/%!& : 0".&!&9&3!8 8)"**
3(+* 7%$5.!%;"*9: 53:1"/-,)8 53:1 02%$"&.6'3(<* ,$6!%** <";9"/-,) ;%*&8"*%
3(,* ,$6!%**: *('&%$#"!:"8 7-;
.(+* 02%$"&.6' :53:1"/-,)8 02%$"&.6'
==
==
==
==
3(<* ,$6!%** : <";9"/-,)8 ;%*&8"*%
==
.(<* 8)"**: <";9"/-,)8 ;%*&+6=%)
..+* ,$6!%**8)"**: *('&%$#"!:"8 86426'%'&
Figure 2: Categories of Cross-Model and Intra-Model Dependency Relations
component diagrams (SM to SM ). As an example of this category, consider the depen-
dency relation SS1:(Interface, Equivalence, Interface) depicted by Figure 2. It specifies
that an Interface of a component in a UML component diagram can also be presented as a
concrete interface in a UML class diagram. However, both express the same Interface.
Process View to Structural View: This category covers dependency relations between
BPMN collaboration diagrams and UML class and component diagrams (SM to SM ). As
309

an example, consider a Process in the BPMN collaboration diagram. It can be defined
as a component in a component diagram, where the component will define the interfaces
provided and acquired by the process [SDE+10]. This is depicted in Figure 2 as PS1,
(Process, Equivalence, Component).
Process View to Test View: consists of dependency relations between the elements of
BPMN collaboration diagrams and UTP test models (SM to T). One example of such a
relation is PT3:(Process, Tested By, TestCase), which suggests that a process can be tested
by a UTP Test Case.
Structural View to Test View: contains the dependency relations between the elements
of UML class and component diagrams and UTP test models (SM to T). An example of
such a relation is ST1:(Component, Mocked By, Test Component). It expresses a situation
where the behavior of a Component defined by a UML component diagram is simulated
by a Test Component in UTP test architecture.
Intra-Model. This category covers of dependency relations within one model, such as a
relation between two elements of a class diagram. Examples are IM1 and IM2 as depicted
by Figure 2. The dependency relation IM1 expresses that a class in a UML class diagram
can contain operations. A similar dependency relation of type Containment is suggested
by IM2, which expresses that a Lane element is contained by a Pool element in a BPMN
collaboration diagram. To record these dependency relations, we use two different meth-
ods as discussed in the following subsections.
Recording Dependency Relations During Test Generation: Dependency relations be-
longing to the test view (Categories Process View to Test View and Structural View to Test
View) can be recorded during the test generation [NZR10]. Our baseline test suites are
generated using a model-driven approach that uses information from BPMN collaboration
diagrams and UML class diagrams to generate UTP test architecture and test behavior
[FR12]. The UTP test architecture is in the form of UML class diagrams with UTP stereo-
types and test behavior is in the form of UML activity diagram test cases generated using
path traversal algorithms. During the test generation, the relations between source and
target models are also preserved. Each test case in UTP corresponds to a path in BPMN
collaboration diagram, thus mappings between the source and target elements also provide
the required dependency relations. An example is a Service Task in a BPMN collaboration
diagram that maps to a CallOperationAction in an activity diagram test case. This depen-
dency relation between the ServiceTask and CallOperationAction is recorded at the time
of test generation.
Recording Dependency Relations Using Detection Rules: The intra-model dependency
relations (Categories Structural View to Structural View and Process View to Structural
View) do not involve any test models. To record them, we utilize a rule-based approach
that was introduced in our previous works [LFR13]. This approach relies on a set of pre-
defined detection rules that are applied on a software and elicitate dependencies between
its software artifacts. Each rule is designed for detecting a specific dependency relation
using conditions encoded in the rule itself. These conditions allow the rules to query the
attributes (e.g. identifiers), relations (e.g. inheritance-relations) and the structure (e.g.
parent-child-relations) of models. However, we extended the set of dependency detection
rules to record the intra-model dependency relations and (SM to SM ) dependency relations
310
in our approach.
4.2 Change Application
Our rule-based approach requires that changes applicable on the models are well under-
stood and explicitly specified. Therefore we define types of changes belonging to the set
SM by the concept of Atomic and Composite changes [LFR12] to define the changes for
each model in the set SM . Atomic changes are the basic unit of change, and cover the Ad-
dition, Deletion, and Updating the properties of model elements. A composite change on
the other hand is composed of several other atomic or composite changes. The composite
changes are: Moving, Replacing, Swapping, Merging, and Splitting of model elements
[LFR12]. The names of these composite changes are self explanatory, whereas their actual
definition is context dependent. Every change type ci ∈ C is an instance of the aforemen-
tioned atomic or composite change types. As discussed earlier, the structural aspects of
a process, for example the local or provided operations, can be defined inside a Class of
a UML class diagram, which is therefore referred to as a ProcessClass [KKCM04]. An
example change type in this context is Add Operation in ProcessClass, which is an in-
stance of the atomic change type Add. It adds an operation inside a ProcessClass which
can provide services to a process.
As discuss earlier, processes require services to commence a process. An example change
type in this context is Replace a Service, which is an instance of the composite change
type Replace. Since this is a composite change type, it requires removing the existing
ServiceTask in BPMN collaboration diagram and adding a new one in the place of the
previous ServiceTask. It should also update any calls to former ServiceTask with the new
ServiceTask. A change can be selected from the list of pre-defined change types to initiate
the impact analysis and test selection process. Hence, the estimation of required regression
testing effort is possible even before a change is actually implemented on a model. Hence,
our approach is not dependent on any specific change detection strategy such as model
comparison as compared to other MBRT approaches[BLH09, NZR10].
4.3 Rule-based Impact Analysis
When a change is introduced to a model, its dependency relations are to be analyzed for
change propagation across related models and tests. To do so, we developed a set of impact
analysis rules for studying the propagation of changes between the changed model and all
related, thus possibly impacted, models using the recorded dependency relations.
An impact rule can be regarded as a 5-tuple R=(ct,me, ED, QD, RD), where ct defines
the change type that acts as the Change Trigger for the impact rule and me defines the
model element on which ct is applied. The ElementDefinition-part (ED) is defined as
ED=(e1,e2 ,...,en), where each ei is an element from one of the models belonging the set
SM or T. The QueryDefinition-part (QD) is defined as QD=(q1, q2,...qn), where each qispecifies a condition on the elements belonging to the set ED. These conditions include
311

logical conditions which can filter the elements selected by the rule, for example AND,
OR, XOR, and pre-defined operations to query the attributes of models and the relations
between models.
One example of these pre-defined operations is modelRelatedTo(a, t, b), which checks if a
dependency relation of type t exists between a model element a and another model element
b. Finally, the ResultDefinition-part (RD) is defined as RD=(a1, a2,...,an), where each aiis an action that reports an impact (Reporting Action). A Reporting Action can further
trigger a new change that may also trigger additional impact rules.
The actual execution and processing of our impact rules is accomplished in a recursive
manner [LFR13]. First, the initial change (Change Trigger) is selected for execution.
Rules which react on this kind of change are then being executed and produce a set of
impact reports. Each impact report equals a 3-tuple; the source of a change, the change
type, and the affected element. Each impact report is then again treated as the initial change
(Change Trigger) and processed accordingly. Consequently, further impact reports might
be created. The final result produced by this impact analysis process is an ordered set of
impact reports.
4.3.1 Example Impact Rule Illustration
To illustrate the aforementioned concept, we present a scenario and an impact rule which
can be applied in the context of this scenario. As discussed earlier in section 4.2, the
+)&$" RPNCB"A@?R>)@$=<;@:,*&$"(''C%+"$"<"#,!%
+"$"<"#, SQ;"NCO$@!!C 9$R@!NC"8C7%+"$"<"#, SQ;"NCS"!,O><;>#"#,C 9$R@!NC"6C7%+"$"<"#, SQ;"NCO><;>#"#,C 9$R@!NC"5C7%+"$"<"#, SQ;"NC9,><R:OA@#4"SQ;"C 9$R@!NC"3C7%
+7"$"<"#,!%+2&")Q%
+@#P%1@$&"02&@$!M"3LL#@<"K C9PP J;")@,R># R# I)>:"!! O$@!!CHG>P"$*"$@,"PS>M"5K CG>:F"PEBQCK "6H
G>P"$*"$@,"PS>M"8K C02&R?@$"#:"CK "5H+7@#P%
+72&")Q%+)"!&$,!%
*";>),=<;@:,M"8K C9PP G>:FJ;")@,R># R# S"!,O><;>#"#,CK "6H+7)"!&$,!%
+7)&$"%
!765731 /- 9# 0D@<;$" =<;@:, *&$" />) ,A" 9,><R: OA@#4" SQ;" .9PP J;")@,R>#-
420.035 ,0+73757*3
)*3(757*36"!('&% $#)&&%#
'.&%$5 #0&*"5
structure of a process can be modeled using a ProcessClass in the system class diagram.
However, each Process can also be defined as a Component in a UML component diagram
[SDE+10], which defines its required and provided interfaces which are implemented as
operations in the ProcessClass corresponding to the process. Thus, a ProcessClass that
defines a process and its corresponding Component are “equivalent”to each other (SS2 in
Figure 2). Furthermore, a TestComponent can “mock” the behavior of the Component (ST1
in Figure 2) to test a certain process. In case the Participant involved in a collaborative
process is changed, its related Component and consequently the related TestComponent
would be affected as well.
312
The example impact rule depicted in Listing 1 realizes this scenario. The element e4 is a
Change Trigger and the name of its associated change type is “Add Operation in Process-
Class”. The Element Definition part defines the elements to be evaluated by the impact
rule, i.e. Class, Component, and TestComponent. The conditions part applies constraints
on the model elements defined in the Element Definition part. The two main conditions use
the modelRelatedTo-operation to check if the dependency relations (ProcessClass, Equiv-
alence, Component) and (Component, Mocked By, TestComponent) exist for the model
elements specified in the element definitions.
If the conditions are satisfied, the next change is triggered and the impact is further prop-
agated as defined in the created Impact Report. The impact report states that the source
of the change was an element e1, a ProcessClass, and that the change is propagated to the
element e2, a TestComponent. The next change trigger will be the impact rule correspond-
ing to the change “Add MockOperation in TestComponent”, which will be applied on the
element e2.
5 Test Selection and Classification
We classify a UTP test suite into four types of test cases: Obsolete, Reusable, Retestable,
and New as suggested by Leung et al. [LW89]. To classify the composite model ele-
ments, we also introduce the notion of Partially Retestable elements to the classification
as explained in the following.
As presented in Section 3, the regression test selection problem consists of two fundamen-
tal parts: the identification of elements affected by a change ci ∈ C, and the classification
of these impacted elements. Let x ∈ T′
be an element impacted by a change ci ∈ C. Let
I be the set of reporting actions produced by the impact rules after the application of ci on
x. Let (O,U,R, P , and A) represent the sets of Obsolete, Reusable, Retestable, Partially
Retestable, and New elements. The test classification problem is to determine whether xbelongs to O,U,R, P, or A. Where O refers to the set of obsolete elements, which are no
more valid for T′
. The set U represents the set of Reusable elements in T′
, which are not
affected when the change ci is applied. R is the set of elements which are affected by the
change ci and should be used to retest the process P after any required modifications and
should be included in T′
.
We further extend the definition of Retestable by using another set of Partially Retestable
elements. An element x ∈ P is partially retestable, if at least one of its constituents is
Reusable and at least one of its child elements is Retestable. The element x should remain
in T′
, whereas its affected constituents should be updated and used during regression
testing. Finally, A is the set of elements that are required to be added in T′
to update it.
The type of the element x determines how it will be classified. Each element in UTP
has to be analyzed to define the conditions under which that element can belong to either
O,U,R, P, or A. We analyzed the UTP elements and define the classification conditions
for them. As an example, below we present some of the conditions under which a Test
Component element in UTP might belong to one of the classifications.
313
Example of Classifying a Test Component – Let x = tc ∈ T′
be a UTP TestComponent,
and let M be the set of MockOperations belonging to tc. In case a change ci is applied on
tc, it will be considered as Obsolete if the following conditions are met. There exists an
impact report r ∈ I caused by tc, such that the change type of r is Delete TestComponent.
The origin of the change type Delete TestComponent can vary due to the dependency
relations.
Element tc is considered Reusable if tc /∈ O,R, P, orA. This means that no reporting
action r ∈ I exists for tc. The element tc will be Retestable if ∀m ∈ M m is Retestable.
This means that, for a test component to be retestable, all of its mock operations should be
affected by ci. Otherwise, tc will be Partially Retestable under the following conditions;
(1) ∃m ∈ M,n ∈ M such that m is Reusable and n is Retestable, (2) ∃r ∈ I , such that
the change type of r is PropertyUpdate for tc, (3) A MockOperation is added to M inside
a r ∈ I . Finally, tc will be considered as New if ∃r ∈ I , such that the change type of r is
(Add TestComponent) for tc.
6 Tool Support
We implemented our approach in a prototype tool called EMFTrace 3 . EMFTrace is an
Eclipse-based tool which is built upon the Eclipse Modeling Framework 4 (EMF), and
was initially developed for dependency detection. Our tool offers features for importing
models from a variety of tools and modeling languages. It is capable of analyzing various
different types of software artifacts for dependency relations. This dependency analysis
is implemented by dependency detection rules as introduced in Section 4.1, which are
executed by the rule processing component integrated in EMFTrace.
EMFTrace has been extended to allow for rule-based impact analysis [LFR13] as presented
in Section 4.3.1. Therefore, the existing rule-processing infrastructure is reused and ex-
tended to allow for the generation of impact reports. To perform the test selection, we
further extended EMFTrace by implementing a test selector prototype plug-in. This plug-
in allows to analyze the impacted elements produced by the impact analyzer and classifies
the affected test elements.
7 Evaluation and Application on a Case study
To evaluate our approach, we applied the criteria of the framework of Rothermel et al
[RH96], which are employed by several MBRT approaches for evaluation [BLH09, NZR10].
The framework consists of 4 major criteria; Inclusiveness, Precision, Efficiency and Gen-
erality. Inclusiveness is the measure to which the modification revealing tests are included.
In contrast, Precision determines the presence of false positives. Efficiency is defined in
terms of time and space requirements of the approach, its automatability, the cost of calcu-
3https://sourceforge.net/projects/emftrace/4http://www.eclipse.org/modeling/emf/
314

lating modifications, and the costs that occur during the preliminary and critical phases of
testing. Generality is the ability of the approach to perform in various practical scenarios
[RH96]. Further, we also applied our approach on a case study that automates business
processes on mobile devices.
7.1 Evaluation based on Rothermel et al.’s Criteria
Inclusiveness and Precision: Our approach considers 114 different dependency relations,
hence all modification revealing test cases covered by them will be considered for retest.
Since we cover a comprehensive set of dependency relations, there is less risk of missing
any possibly impacted test elements. We explicitly separate the non-modification revealing
test cases, i.e. the Reusable test cases. Hence, the precision of our approach is considerably
higher than the Retest-All approach. One of our previous studies show a precision of 80%
for the rule-based impact analysis [LFR13]. We expect the same precision, as our approach
is also based on the rule-based impact analysis.
Efficiency: We provide the tool support through EMFTrace (see Section 6), which saves
the time required for manual analysis. The worst case eventuates if each model of the
system is dependent on any other model of the system. Hence there are n(n − 1)/2dependency relations for n models, which defines how often each impact rule is executed
due to recursion. The time complexity of a single rule computes to O(nk) where k is the
number of elements queried by the rule. Thus, the final time complexity equals O(m ·nk+2), where m represents the number of rules. Moreover, since the approach is able to
forecast the number of test cases affected by a change in earlier phases of development,
it can save test costs compared to the approaches that require more effort in later critical
testing phases.
Generality: We consider two factors when analyzing the generality of our approach. First,
our rules are easier to extend without requiring any change to the underlying rule execution
engine and tooling. Hence, our concept offers improved extensibility when compared to
other approaches that require changes in their respective tools, which is often a tedious
task. Moreover, our approach does not require any explicit model comparison, thus making
it easier to integrate with any change detection mechanism than other approaches.
7.2 Application of Our Approach on a Scenario from the Field Service Technician
Case study
In the following, we present the application of our approach on a process TourPlanning-
Process from the Field Service Technician case study. The Tour Planning Process is
responsible for planning a field tour based on various strategies. Figure 3 shows small
cutouts of this process, its related classes, components, UTP test models, and their depen-
dencies.
Process View: the box numbered as (a) in Figure 3 shows a part of the BPMN collabo-
ration diagram representing the TourPlanningProcess. It shows three process participants,
315

i.e. TourPlanner, RoutePlanner, and ServicePlanner. The participant Tour Planner com-
mences the process and collaborates with other participants to create a TourPlan. The part
presented in Figure 3 focuses on a situation where the TourPlan is created based on the
shortest available plan between start and end destinations. The participants RoutePlanner
and ServicePlanner provide two services modeled as Service Tasks: the getShortestRoute
service, which provides a shortest route between a given start and destination location, and
the getServiceOrders service which returns the list of service orders covering a particular
route. For our discussion we will concentrate on the dependencies of these participants
and services to other models.
Structural View: This view is represented in Figure 3 by the parts (b) and (c). Within this
view, the Process View participants RoutePlanner, TourPlanner, and ServicePlanner are
modeled as UML components, following the SoaML modeling method [SDE+10]. The
,*'%#!VTTR%
GRF EFV%F D*CVFB*TAV@R,*'%#!VT
GRF ?RAFBTVFB*T
-'AF*+B)R ,*'%#!VT
C%RVFR,*'%#!VT
(VT&!R,*'%#!VTTBT$#%*CRAA"FRAFWW,RAF#VCUV$RSS
(VT&!R,*'%#!VTTBT$#%*CRAA$"8
$78$68 $58
ER%@BCR#!VTTR%
WW-*+>*TRTFSS
E=*%FRAF ?BAFVTCR
<*'FR#!VTTR%,-*+WW,RAF-*+>*TRTFSS
$RFE=*%FRAF<*'FR;*CU:9
31/ 4260.5-7,
?8765'B@V!RTCR
?QP765'B@V!RTCR
?O7 65'B@V!RTCR
?N7 ?R%B@VFB*T?M7 -V!!A
$RFER%@BCRL%&R%A:9
ER%@BCR#!VTTBT$;VTV$R%
(,##,-*+WW,RAF-*+>*TRTFSS
C%RVFR,*'%#!VT;*CU:9
WW,RAF-*TFRKFSS
(VT&!R<*'FR#!VTTBT$#%*CRAA,-
FRAF-VARJ:9
FRAF-VARQ:9
<*'FR#!VTTR%
WW-*+>*TRTFSS,*'%#!VTTR%
WW-*+>*TRTFSS (VT&!R,*'%#!VTTBT$#%*CRAA
WW#%*CRAA -!VAASS
C%RVFR,*'%#!VT:9
AV@R,*'%#!VT:9
?QQ7 ;*CUR&IH4
31+/ *)('&"%.#6.
GRF E=*%FRAF<*'FR! GRF ER%@BCR
L%&R%A 3*% <*'FRGRF ,*'% EF%VFR$4
$RFE=*%FRAF<*'FR
$RFER%@BCRL%&R%A
<*'FR#!VTTR%
ER%@BCR#!VTTR%
C%RVFR,*'%#!VT
WW,RAF-VARSS $.8
ER5'RTCR 3!*2 ;RAAV$R 3!*2 ?R>RT&RTC4 <R!VFB*T
?87
?17 ?R0BTVFB*T
?/7 ?R%B@VFB*T?.7 -V!!A3+/4260.5-9,
Figure 3: A part of the tour planning process in MOPS, its different views and dependency relations
UML class diagram shown in part (b) presents two classes: HandleTourPlanningProcess,
and ServicePlanningManager. The first class represents the structural definition of the pro-
cess itself and the later class implements an interface of the ServicePlanner component. It
provides the service getServiceOrders() modeled as an operation. Test View: Finally, part
(d) and (e) show the Test View of the HandleTourPlanningProcess. The Test Architecture
as shown in part (d) includes a TestPackage and a TestContext class corresponding to the
HandleTourPlanningProcess. The UTP class TestContext contains the definitions of all
the test cases required for testing the process. However, Figure 3 shows only two of them
as an example. The actual test case specification in UTP is represented by an UML activity
diagram. Part (e) shows the exemplification of a test path, used to test the execution path
shown in the process view. The path is derived by applying a path search algorithm using
our test generation strategy [FR12].
Dependency Relations Across Views: The dashed arrows in Figure 3 show the depen-
dency relations among the elements of the models. An example dependency relation is
316

D2, which is shown in bold in Figure 3 and represents a dependency relation of type
Mocked by between the participant RoutePlanner and its corresponding TestComponent.
It implements the dependency relation ST1 as presented in Figure 2.
Change Application and Impact Analysis for Replacement of a Service: To illustrate
Table 1: An excerpt of the results of applying Change 2 on the scenario
Rule 1 Rule 2
Change Operation Replace ServiceTask Replace CallOperationAction
Source createTourPlan: ServiceTask createTourPlan: CallOperationAction
Target createTourPlan: CallOperationAction Operation
Dependency Relation ServiceTask,Derivation,
CallOperationAction
CallOperationAction,Equivalence,
TestOperation
Triggered Change Replace CallOperationAction Replace TestOperation
the implementation of our To illustrate the utilization of the dependencies and rules we
discuss the implementation of the replacement of an operation. The service task create-
TourPlan was discussed with part (a) of Figure 3. Its corresponding Operation is repre-
sented by the HandleTourPlanningProcess in part (b) by a UML class with the stereotype
ProcessClass . The operation createTourPlan() creates and initializes a TourPlan
object and returns it to the calling process. However, we identified that the creation of a
TourPlan in HandleTourPlanningProcess not only requires 1the creation and initialization
of the TourPlan object, but it should also assign the Tour and the ServiceOrders selected
for the Tour to the TourPlan. Otherwise, an empty TourPlan object would be kept in the
system, which would violate the constraints of the system design. However, we want to
keep the existing createTourPlan operation due to its utilization in another scenario. The
change scenario can now be implemented by evaluating the rules and dependency rela-
tions, leading to the following changes.
Change 1 - Atomic (Add): Add a new operation OP: “TourPlan createTourPlan(Tour cur-
rentTour, ServiceOrders List so );” in the ProcessClass HandleTourPlanningPro-
cess. This corresponds to the AddOperation in ProcessClass change type discussed in
Section 4.2.
Change 2 - Composite (Replace): Replace the operation corresponding to createTour-
Plan ServiceTask in the HandleTourPlanningProcess collaboration diagram with OP. The
Replace ServiceTask change type is also referred to in Section 4.2.
The application of Change 1 will activate the impact rule depicted in Listing 1. That will in
turn utilize the dependency relations D1 and D12 depicted in figure 3. The rule would then
suggest to add a corresponding mock operation inside the test component HTPPTCom by
triggering the change type Add MockOperation in TestComponent, as suggested by the
rule in Listing 1.
The application of the Change 2 requires to trigger the change type Replace ServiceTask,
which is also discussed in Section 4.2. Table 1 represents partial results in the case when
the Change 2 will be applied to replace a ServiceTask. The first column presents the
triggering of the first rule, while the second one represents the rule triggered as a result of
applying the first rule. When the first rule replaces the ServiceTask createTourPlan, it will
affect the corresponding CallOperationAction in the test case activity diagram due to the
317

dependency D7: (createTourPlan, Derivation, createTourPlan), as depicted in Figure 3.
Finally, Rule 2 will be triggered, which suggests replacing the CallOperationAction inside
the activity diagram test case. The rule for replacing the CallOperationAction triggers
another rule to replace its corresponding TestOperation inside the test code and so on.
Test Selection and Classification for the Scenario: The TestCase1, represented as an
activity diagram, is classified as Retestable, as it is required to be retested due to a change
in its called Operation. Other test cases remain unaffected because they do not call this
operation. As a new MockOperation is added inside the HTPPTCom TestComponent, it
would classified as Partially-Retestable. This classification is consistent with the case 3
presented in the classification discussed in Section 5.
7.3 Threats to Validity
We identified two major factors that can influence the results achieved by our approach.
The first factor is the accuracy of the dependency relations recorded by our dependency
detection approach. Although our rules cover several types of constraints for a precise
detection of dependency relations, the similarity of the names of model elements, however,
still plays a significant role. If proper naming conventions are not followed during the
modeling phase, some dependency relation might remain undetected and our approach
might produce imprecise results. The other factor is the size of the test suite. If the baseline
test suite is already too small, the reduction of cost and effort achieved by our approach
might not be significant compared to the retest-all approach. However, the results can still
be used to update the baseline test suite.
8 Related Work
A number of business process-based regression testing approaches use process code, such
as BPEL, for regression test selection [WLC08, LQJW10, LLZT07]. They start the test se-
lection activity after the changes are already implemented and cannot forecast the required
cost and effort earlier.
Our recent investigations on change impact analysis revealed the lack of support for the
interplay of different types of models and software artifacts [LFR13]. A few works, such
as the one of Ginige et al. [GG09], consider the relations between BPEL processes and the
WSDL web service specifications. Since we do not use process code for regression testing,
these dependency relations cannot contribute to our work. Wang et al. [WYZS12] use
dependency relations between the process layer and the service layer for impact analysis.
However, along with such dependencies, we support a more comprehensive set of other
dependency relations between processes, services, components, and test suites.
A number of MBRT approaches only consider intra-model relations inside a single artifact
and their impacts on tests [CPU07, CPU09, KTV02, TJJM00]. These approaches are
valuable for unit level testing; however, they cannot predict the indirect impacts resulting
from the changes in other system artifacts. A large number of MBRT approaches consider
318

the inter-model relations between artifacts for test selection [MTN10, PUA06, BLH09].
However, they do not record these relations prior to the impact analysis. To perform test
selection more than once, each time the relations have to be repeatedly searched; thus,
increasing the test selection time.
Recent work by Naslavsky et al. [NZR10] makes the dependency links explicit by stor-
ing them in a separate model during the test generation process prior to the test selection.
However, this approach can only record dependency relations between the design mod-
els from which tests are generated and the tests themselves. We are not only using this
approach, but also recording other inter-model dependency relations between several de-
sign models using additional dependency detection rules. Moreover, our approach further
compares to all above mentioned approaches in following ways.
Firstly, these approaches perform the discovery of dependency relations during the im-
pact analysis activity. In our approach, we separate these two activities by discovering
the dependency relations in the first phase and later performing the impact analysis. In
this way, the discovery part can be reused for other maintenance activities, such as consis-
tency checking of models. Secondly, all above discussed approaches are based on model
comparison for test selection. They cannot deal with the changes directly captured from
a model editor. Our approach can be integrated with both. Once a change is available,
independent from the detection mechanism, the impact analysis activity can be started.
9 Conclusion and Future Directions
In this paper, we presented a model-based regression testing approach for business pro-
cesses. Our approach determines affected test cases by forecasting the impacts of changes
prior to their implementation. For this purpose, we first record the dependency relations
between UML models, BPMN models, and UTP test models. As another contribution,
we developed a set of impact rules to forecast the impacts of changes and the resulting
change propagation on different parts of a test suite. Tests are further classified to decide
their inclusion for regression testing. We discussed the implementation of our approach
in our prototype tool EMFTrace. To demonstrate the applicability of our approach, we
applied it on several change scenarios in a case study on mobile field service technicians
developed under the MOPS project. We further evaluated our approach according to the
criteria of Inclusiveness, Precision, Efficiency, and Generality. Our future work targets on
an extension of our impact rules to cover the concrete test scripts. Furthermore, we plan
to analyze how risk, cost, and fault severity based approaches can be integrated with our
approach for further test prioritization.
References
[BLH09] L. C. Briand, Y. Labiche, and S. He. Automating regression test selection based onUML designs. Information and Software Technology., 51(1):16–30, 2009.
[CPU07] Yanping Chen, Robert L. Probert, and Hasan Ural. Regression test suite reduction usingextended dependence analysis. In SOQUA, pages 62–69, 2007.
319
[CPU09] Yanping Chen, Robert L. Probert, and Hasan Ural. Regression test suite reductionbased on SDL models of system requirements. Journal of Software Maintenance andEvolution: Research and Practice, 21(6):379–405, 2009.
[FR12] Qurat-Ul-Ann Farooq and Matthias Riebisch. A Holistic Model-driven Approach toGenerate U2TP Test Specifications Using BPMN and UML. In Valid 2012, pages 85–92, 2012.
[GG09] Jeewani Anupama Ginige and Athula Ginige. An Algorithm for Propagating-ImpactAnalysis of Process Evolutions. In UNISCON, volume 20, pages 153–164. 2009.
[KKCM04] Nora Koch, Andreas Kraus, Cristina Cachero, and Santiago Melia. Integration of busi-ness processes in web application models. J. Web Eng., 3(1):22–49, 2004.
[KTV02] B. Korel, L.H. Tahat, and B. Vaysburg. Model based regression test reduction usingdependence analysis. In ICSM 2002, pages 214–223, 2002.
[LFR12] Steffen Lehnert, Qurat-Ul-Ann Farooq, and Matthias Riebisch. A Taxonomy of ChangeTypes and its Application in Software Evolution. In ECBS 2012, pages 98–107, 2012.
[LFR13] Steffen Lehnert, Qurat-Ul-Ann Farooq, and Matt Riebisch. Rule-based Impact Analysisfor Heterogeneous Software Artifacts. In CSMR 2013, pages 209–218, 2013.
[LLZT07] H. Liu, Z. Li, J. Zhu, and H. Tan. Business Process Regression Testing. Service-Oriented Computing, pages 157–168, 2007.
[LQJW10] Bixin Li, Dong Qiu, Shunhui Ji, and Di Wang. Automatic test case selection andgeneration for regression testing of composite service based on extensible BPEL flowgraph. In ICSM 2010, pages 1–10, 2010.
[LW89] H.K.N. Leung and L. White. Insights into regression testing [software testing]. InConference on Software Maintenance, pages 60–69, 1989.
[MTN10] Nashat Mansour, Husam Takkoush, and Ali Nehme. UML-based regression testing forOO software. Journal of Software Maintenance and Evolution: Research and Practice,2010.
[NZR10] L. Naslavsky, H. Ziv, and D.J. Richardson. MbSRT2: Model-Based Selective Regres-sion Testing with Traceability. In ICST 2010, pages 89–98, 2010.
[PE00] Magnus Penker and Hans-Erik Eriksson. Business Modeling With UML: Business Pat-terns at Work. Wiley, 1 edition, January 2000.
[PUA06] Orest Pilskalns, Gunay Uyan, and Anneliese Andrews. Regression Testing UML De-signs. In ICSM 2006, pages 254–264, 2006.
[RH96] G. Rothermel and M.J. Harrold. Analyzing regression test selection techniques. Soft-ware Engineering, IEEE Transactions on, 22(8):529–551, 1996.
[SDE+10] A. Sadovykh, P. Desfray, B. Elvesaeter, A.-J. Berre, and E. Landre. Enterprise archi-tecture modeling with SoaML using BMM and BPMN - MDA approach in practice. InCEE-SECR, pages 79–85, 2010.
[TJJM00] Y. Le Traon, T. Jeron, J.-M. Jezequel, and P. Morel. Efficient object-oriented integrationand regression testing. IEEE Transactions on Reliability, 49(1):12–25, 2000.
[WLC08] Di Wang, Bixin Li, and Ju Cai. Regression Testing of Composite Service: An XBFG-Based Approach. In 2008 IEEE Congress on Services Part II, pages 112–119, 2008.
[WYZS12] Yi Wang, Jian Yang, Weiliang Zhao, and Jianwen Su. Change impact analysis inservice-based business processes. Serv. Oriented Comput. Appl., 6(2):131–149, 2012.
320
Efficient Exploration of Complex Data Flow Models∗
Patrick Frey,1 Reinhard von Hanxleden,2 Christoph Kruger,2
Ulf Ruegg,2 Christian Schneider,2 and Miro Sponemann2
1 ETAS GmbH, Stuttgart, Germany
2 Dept. of Computer Science, Christian-Albrechts-Universitat zu Kiel, Germany
{rvh,ckru,uru,chsch,msp}@informatik.uni-kiel.de
Abstract: The modeling tools that are commonly used for embedded software devel-opment are rather limited when it comes to communicating certain model propertiesbetween different groups of engineers. For example, calibration engineers need tounderstand dependencies between signals and calibration parameters, while functiondevelopers create models with a divide-and-conquer strategy, where details of signaldependencies are hidden by abstract interfaces.
We state requirements for modeling tools to improve the exploring of complexdata flow models and to facilitate the understanding of engineers from different do-mains. We propose an approach that combines transient views and automatic layoutand present two implementations based on different technologies, GMF and KLighD.While both technologies fulfill all requirements, KLighD turned out to be superior interms of both performance and programming effort. The implementations are basedon an open-source framework and are employed in a commercial product that targetsthe calibration process for automotive software development.
1 Introduction
In many application domains, such as the automotive industry, model-driven software dev-
elopment (MDSD) has become the established approach for the design and specification of
system features, as well as their implementation in form of software executed by embed-
ded computer systems. MDSD offers advantages such as separation of specification and
implementation, reuse of function specifications across different development phases from
simulation over prototyping to target integration, and automatic generation of safe code for
different target microcontroller platforms. Commercial tools such as ASCET from ETAS
GmbH, Simulink from The MathWorks, Inc., and the research framework Ptolemy from
UC Berkeley, offer similar means to model functions graphically based on block diagrams
for data flow oriented functions, or statecharts for control flow oriented functions. In such
tools, complex functions can be divided into manageable pieces such that the problem of
graphically specifying the functions is mastered. This results in nested graphical models
∗This work was also funded in part by the Program for the Future Economy of Schleswig-Holstein and the
European Regional Development Fund (ERDF)
321

consisting of several hierarchies of elements, each represented by a diagram. A complex
embedded system, an engine control system of an automotive vehicle for example, can
contain several hundreds or even thousands of individual diagrams.
While the graphical modeling approaches of MDSD are well suited to divide and conquer
complex functions into manageable parts, they do not address the need of engineers to get
a seamless understanding of the overall functionality at the system level. This, however,
is especially important after a function has been designed by one engineer and needs to be
understood by other engineers.
Control applications such as anti-lock braking systems or engine control systems often
need to be fine-tuned to match a desired behavior or to optimally control a physical pro-
cess. For this purpose, calibration engineers need to get an in-depth understanding of how
the functions in the electronic control system work. Since many functions are developed
by means of MDSD approaches, the graphical models are an important source of infor-
mation to get such an understanding. Often, the engineers do not have direct access to
the models and the tools themselves, but are only provided with a textual documentation
with a fixed page size, suited for printouts, where screenshots of the model hierarchies are
depicted. It is not untypical for calibration engineers, who are highly-paid application ex-
perts, to have to work with documents that exceed 5000 pages, where the cross-navigation
index alone may consume about a third of the pages. Needless to say, retrieving specific
information and assembling a complete picture of the application from such serialized,
static documents is thus a very tedious and time-consuming exercise.
Contributions This article presents an approach for exploring and browsing fragmented
complex data flow models that may come from several sources. The work presented here
has been driven by concrete demands for the calibration of electronic control units, but we
expect the results to be applicable to other areas, facing similar challenges, as well. We
state requirements for tooling support and propose a number of methods to fulfill these
requirements, specifically 1) a transient views approach, where the information that is
relevant for model exploration is extracted from the source models and transformed on-
the-fly into a generic light-weight format for presentation, 2) systematic use of automatic
layout for drawing the diagrams, and 3) an exemplary view modification increasing the
benefit of our model browser and illustrating some opportunities of the transient views
approach.
We present two exemplary implementations of these concepts, and compare and evaluate
them in terms of tool responsiveness and implementation effort. The implementations
are part of the EHANDBOOK solution (ETAS), which provides interactive documentation
facilities with an integrated model viewer, and of the KIELER open source project.1
Outline The rest of this paper is organized as follows. We discuss related work in the
remainder of this section and collect requirements for proper tooling support in Sec. 2.
The basic concepts are presented in Sec. 3, the corresponding implementations in Sec. 4.
Comparisons and evaluations are discussed in Sec. 5. Finally, we summarize in Sec. 6.
1 http://www.informatik.uni-kiel.de/rtsys/kieler/
322
Related Work
UC Berkeley’s Ptolemy project is an example of a modeling tool that allows heterogeneous
compositions of model parts [EJL+03], which is what we also want to do here. Each part
can define locally how its content shall be executed using a model of computation. The
composition of parts is done according to the actor-oriented design paradigm [LNW03],
where actors communicate via ports. Ptolemy uses a simple and extensible meta model
[BLL+08] defining the models’ abstract syntax that is implemented in Java. The Ptolemy
framework focuses on semantic aspects of heterogeneous models. Thus, each actor comes
with all information necessary for model simulation, and the models are treated as mono-
lithic artifacts. Here, in contrast, we concentrate on the exploration and browsing of large-
scale models by abstracting them into light-weight structures, which can be inspected more
efficiently.
Considerable effort has been spent on simplifying the development of modeling tools
for customized or domain-specific modeling environments. Corresponding development
environments include meta modeling facilities for creating the basic data structures as
well as support for determining the representations of those structures in diagrams. Ex-
amples of such tools are Marama [GHL+13], DIAMETA [Min06], GME [LMB+01],
VMTS [MLC06], GMF Tooling,2 and MetaEdit+.3 Those frameworks, however, focus
on the creation of models rather than browsing existing models most comfortably. In our
scenario existing complex models from different languages shall be explored by users.
This requires a high quality tool in terms of responsiveness as well as accurate rendering.
Editing assistance such as undo and redo operations, however, is not required.
The work of Storey et al. [SWFM97] employs automatic diagram synthesis for program
comprehension and architecture recovery of given code rather than representing specifica-
tion data in a reader-friendly form. In a follow-up work Bull et al. [BSLF06] developed
the Zest4 framework enabling visualizations of flat graph structures in Eclipse. Its aim is
to provide a graph widget that seamlessly integrates into the existing widget zoo. This
framework, however, supports neither ports nor nested graph representations.
Regarding the visualization of hierarchical models, an approach that follows the fisheye
view concept [SB92] was introduced by Schaffer et al. [SZG+96]: the content of hierar-
chical nodes is displayed directly inside their bounding box. The fisheye zoom technique
allows dynamic collapsing or expanding of composite nodes in order to hide or reveal their
content. This leads to the concept of focus & context, where the details of the currently
viewed component are directly embedded in the context the component is used in. Earlier
focus & context implementations employed algorithms for modifying the previous lay-
out in order to eliminate node overlaps [RMG07, SFM99], which is especially suited for
changing the layout as little as possible, thus helping the user to preserve his or her mental
map of the model. However, it is yet unclear how such layout modifications can be done
under consideration of port constraints. Here, we combine a focus & context visualization
with graph layout methods enhanced by orthogonal routing and port constraint support.
2http://www.eclipse.org/modeling/gmp/?project=gmf-tooling3http://www.metacase.com/mep/4 http://www.eclipse.org/gef/zest/
323

Figure 1: An ASCET model with original, manually drawn layout.
2 Exploring Complex Models – Requirements
In the following, we discuss requirements imposed on modeling tools that we found nec-
essary to improve the experience of navigating complex models. We focus on the process
of presenting and browsing existing models, which may be fragmented, i. e. spread over
multiple files, and neglect any functionality to create new models or alter existing ones.
The actor models of our driving application, such as shown in Fig. 1, consist of other actors
that are connected by edges via ports (denoted by little arrows). To assess the size of such
diagrams, Klauske [Kla12] analyzed 12 Simulink models from automotive applications
and measured an average size of 3333 nodes and 4274 edges per model. However, each
hierarchy level (the direct content of a composite actor) is usually rather moderate in size.
In Klauske’s measurements each level contains 22 nodes and 29 edges on average.
A very basic requirement is to draw the elements of which diagrams are composed in the
same way as in their original modeling tools. The symbols used to draw these elements of-
ten convey important semantic properties, e. g. about the type of a node. The mathematical
operators for addition, subtraction, division, and minimum are identified easily in Fig. 1
due to their intuitive graphical representation. Without this representation, the rectangular
node figures would all seem like black boxes.
Model Harmonization Large, possibly fragmented models shall be presented in a seam-
less fashion. For this purpose, several requirements can be stated.
H1 The impression of fragmentation shall be eliminated; hierarchy and fragment bound-
aries have to be spanned without breaking the natural flow of navigation.
H2 Likewise, no additional tool windows are to be opened when showing further details
of the model.
H3 Existing relationships between the fragments, e. g. wires that cross a hierarchy level,
shall be connected and be visible within the view.
324
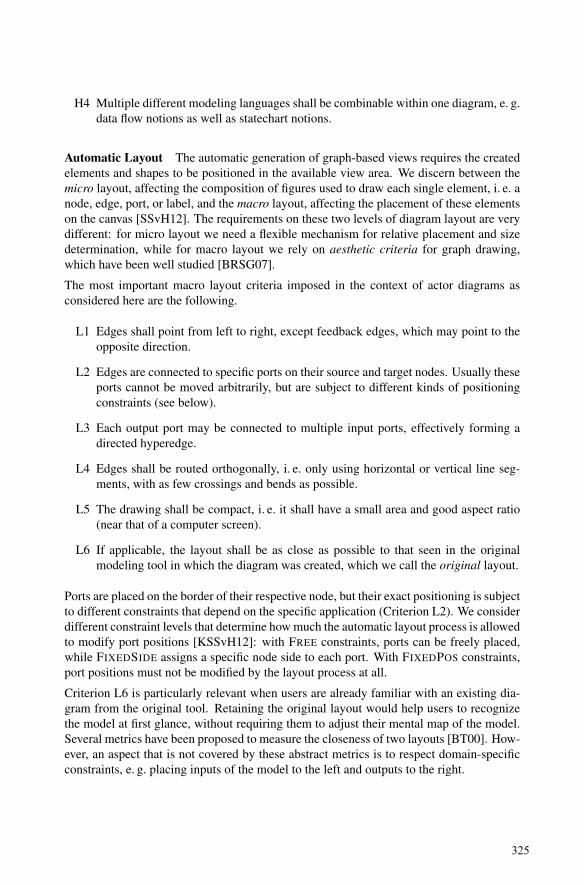
H4 Multiple different modeling languages shall be combinable within one diagram, e. g.
data flow notions as well as statechart notions.
Automatic Layout The automatic generation of graph-based views requires the created
elements and shapes to be positioned in the available view area. We discern between the
micro layout, affecting the composition of figures used to draw each single element, i. e. a
node, edge, port, or label, and the macro layout, affecting the placement of these elements
on the canvas [SSvH12]. The requirements on these two levels of diagram layout are very
different: for micro layout we need a flexible mechanism for relative placement and size
determination, while for macro layout we rely on aesthetic criteria for graph drawing,
which have been well studied [BRSG07].
The most important macro layout criteria imposed in the context of actor diagrams as
considered here are the following.
L1 Edges shall point from left to right, except feedback edges, which may point to the
opposite direction.
L2 Edges are connected to specific ports on their source and target nodes. Usually these
ports cannot be moved arbitrarily, but are subject to different kinds of positioning
constraints (see below).
L3 Each output port may be connected to multiple input ports, effectively forming a
directed hyperedge.
L4 Edges shall be routed orthogonally, i. e. only using horizontal or vertical line seg-
ments, with as few crossings and bends as possible.
L5 The drawing shall be compact, i. e. it shall have a small area and good aspect ratio
(near that of a computer screen).
L6 If applicable, the layout shall be as close as possible to that seen in the original
modeling tool in which the diagram was created, which we call the original layout.
Ports are placed on the border of their respective node, but their exact positioning is subject
to different constraints that depend on the specific application (Criterion L2). We consider
different constraint levels that determine how much the automatic layout process is allowed
to modify port positions [KSSvH12]: with FREE constraints, ports can be freely placed,
while FIXEDSIDE assigns a specific node side to each port. With FIXEDPOS constraints,
port positions must not be modified by the layout process at all.
Criterion L6 is particularly relevant when users are already familiar with an existing dia-
gram from the original tool. Retaining the original layout would help users to recognize
the model at first glance, without requiring them to adjust their mental map of the model.
Several metrics have been proposed to measure the closeness of two layouts [BT00]. How-
ever, an aspect that is not covered by these abstract metrics is to respect domain-specific
constraints, e. g. placing inputs of the model to the left and outputs to the right.
325

(a) Ptolemy’s original editor Vergil. The content of each hierarchical node is displayed in a new tool window,
thus the user can easily lose the context he is working in.
(b) KIELER’s Ptolemy viewer. Hierarchy is embedded directly into the nodes, and multiple visual representations
are possible within the same diagram.
Figure 2: Snippet from Ptolemy’s CarTracking model. Three hierarchy levels are visible,
of which the outermost level (Following Car actor) contains data flow. One of its actors
(ModalModel) contains a statechart, of which a state (faulty) is refined by a data flow model.
3 Towards Transient Views of Actor Models
Transient Views We apply the transient views approach to synthesize the graphical rep-
resentations of semantic models automatically [SSvH13]. This approach is about the on-
demand creation of diagrams without storing any intermediate data persistently. Thereby,
no specific relationship between objects in the application model and elements in the dia-
gram is prescribed. This way implicit model information can be made explicit, and frag-
mented information can be aggregated in order to present them to users most conveniently
(Criterion H1). Concrete diagrams are created by composing view models that are then
handed over to a rendering tool. They are automatically arranged, and heavy-weight edit-
ing facilities are omitted in favor of responsiveness of the tool. The approach is optimized
for user interactivity like changing the depicted amount of detail, e. g. by expanding or
collapsing nodes.
326

The fact that the view models denoting the diagram are completely separated from the
source models paves the way for composing diagrams from different hierarchy levels of
a model or even different modeling languages in the same view, fulfilling Criterion H4.
Thus, the so created diagrams are not restricted to actor-based models, but can also visu-
alize state machines, process models, or component composition specifications. This way
model visualizations meeting all the harmonization requirements stated in Sec. 2 can be
realized. As illustrated by Fig. 2, the combined visualization of multiple hierarchy levels
can help the user to set the focus without losing the corresponding context of the overall
model. Furthermore, view models need not to be created in one run, but may be built up
incrementally. For example, nested diagram elements can be attached lazily when their
container element is expanded. View models may also be updated continuously, e. g. for
displaying feedback data while performing simulations or in-system-tests.
In spite of the separation of application models and view models, transient view mappings
allow to associate diagram elements to the model elements they are derived from. By
means of such associations, queries can be performed on model elements that are chosen
via their representatives in the diagram, and the results can be visualized in the diagram
for easiest understanding by the user.
Automatic Layout Automatic macro layout can be realized using graph layout methods
[DETT99]. Some of the macro layout criteria listed in Sec. 2 have been thoroughly studied
in graph drawing research. The main method for obtaining a left-to-right layout as stated
in Criterion L1 is the layer-based (a. k. a. hierarchical) approach, which was proposed by
Sugiyama et al. [STT81]. Regarding Criterion L3, Sander proposed an extension of the
layer-based approach for routing orthogonal hyperedges [San04]. More recently, further
extensions have been published to support port constraints for Criterion L2 [KSSvH12,
SFvHM10]. Minimizing the number of edge crossings and bends (Criterion L4) are both
NP-hard problems, but numerous heuristics have been developed [DETT99]. In contrast,
the compactness of layouts stated in Criterion L5 has not been addressed much yet in the
context of layer-based drawing. Most computed layouts are acceptable w. r. t. compactness,
but further research in that area could certainly improve them.
A simple solution to meet Criterion L6, closeness to the original layout, is to extract the
layout information from the original view model, attach it to the new view model created
in our browsing application, and apply that layout directly to all diagram elements. With
this procedure it is possible to obtain identically looking diagrams in both the original tool
and the new browsing tool. However, there are two major limiting factors: the approach
requires a good hand-made layout that satisfies the first five layout criteria, which is very
time-consuming, and it cannot be applied when the sizes of some elements change or new
connections are drawn, since that could cause unwanted overlappings. The latter happens
in particular when focus & context browsing methods are employed as outlined in Sec. 2.
We propose to use both the original and automatically computed layouts according to the
following scheme. We choose one of these alternatives on each hierarchy level of the
composite diagram. If none of the nodes on a given hierarchy level are expanded and no
new connections to the surrounding level have been added, the original layout is applied,
otherwise the automatic layout is applied. This can optionally be enhanced by methods for
327
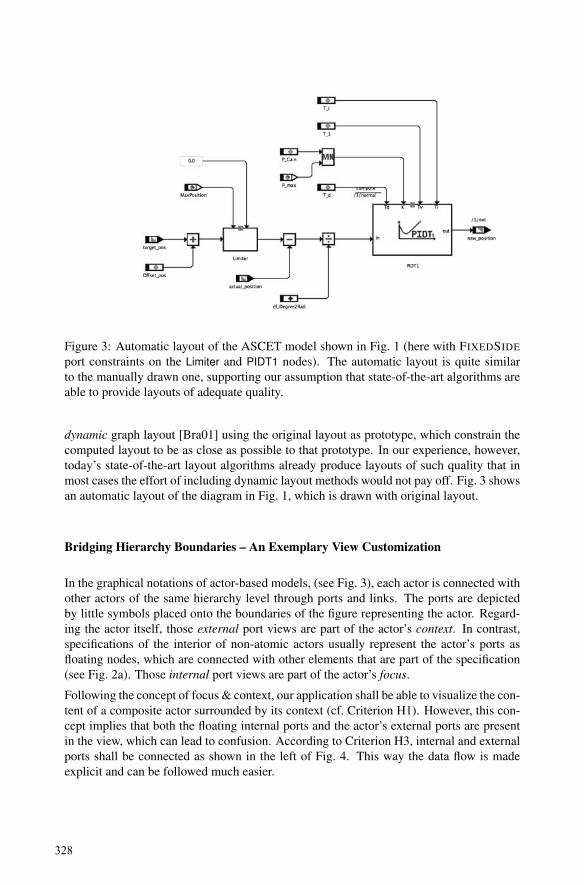
Figure 3: Automatic layout of the ASCET model shown in Fig. 1 (here with FIXEDSIDE
port constraints on the Limiter and PIDT1 nodes). The automatic layout is quite similar
to the manually drawn one, supporting our assumption that state-of-the-art algorithms are
able to provide layouts of adequate quality.
dynamic graph layout [Bra01] using the original layout as prototype, which constrain the
computed layout to be as close as possible to that prototype. In our experience, however,
today’s state-of-the-art layout algorithms already produce layouts of such quality that in
most cases the effort of including dynamic layout methods would not pay off. Fig. 3 shows
an automatic layout of the diagram in Fig. 1, which is drawn with original layout.
Bridging Hierarchy Boundaries – An Exemplary View Customization
In the graphical notations of actor-based models, (see Fig. 3), each actor is connected with
other actors of the same hierarchy level through ports and links. The ports are depicted
by little symbols placed onto the boundaries of the figure representing the actor. Regard-
ing the actor itself, those external port views are part of the actor’s context. In contrast,
specifications of the interior of non-atomic actors usually represent the actor’s ports as
floating nodes, which are connected with other elements that are part of the specification
(see Fig. 2a). Those internal port views are part of the actor’s focus.
Following the concept of focus & context, our application shall be able to visualize the con-
tent of a composite actor surrounded by its context (cf. Criterion H1). However, this con-
cept implies that both the floating internal ports and the actor’s external ports are present
in the view, which can lead to confusion. According to Criterion H3, internal and external
ports shall be connected as shown in the left of Fig. 4. This way the data flow is made
explicit and can be followed much easier.
328

Figure 4: Expansion of the Limiter block with direct links between hierarchy levels.
In most actor-based modeling languages ports are subject to FIXEDPOS constraints (see
Sec. 2). However, when focus & context browsing is employed, it is advisable to relax
these constraints. Adding edges to connect the content of a focused node with its context
and keeping strict port constraints could lead to confusing edge routings: for instance, con-
nections to input ports anchored to the top side would need to be routed all the way to the
left side of the contained diagram. If the constraints are relaxed to FREE, in contrast, the
layout algorithm can arrange all input ports to the left and output ports to the right, which
complies better with the overall flow of connections and thus allows shorter edges and less
bend points. The expanded node in Fig. 4, which originally had two input ports on the
top side (see Fig. 1), has been drawn with such relaxed constraints. As a consequence, we
need a flexible interface in order to dynamically adapt parameters of the layout algorithm
such as the port constraints depending on the context. We use the layout configuration
interface provided by KIELER for this purpose [SSM+13].
4 Two Approaches for Realization
In this section, we present two different realizations of the transient-views-based concepts
introduced in Sec. 3. One uses the established GMF Tooling for rapid prototyping of
graphical editors, while the other uses a viewer framework based on KIELER with the
focus on high performance and minimizing the time-to-diagram. Both realizations use
the KIELER layout algorithms for automatically computing macro layouts as described
in Sec. 3. The foundation is laid by an implementation of the layer-based graph layout
algorithm with extensions for port constraints and orthogonal edge routing [KSSvH12].
The diagrams shown in Fig. 2b, 3, and 4 all have been arranged with that algorithm.
We employed the two realizations for visualizing Ptolemy models in an open source ap-
plication, as well as ASCET and Simulink models in an industrial application. The latter
is implemented and validated in the EHANDBOOK (ETAS), an Eclipse-based interactive
documentation system for ECU software. This system aims to support the efficient explo-
329
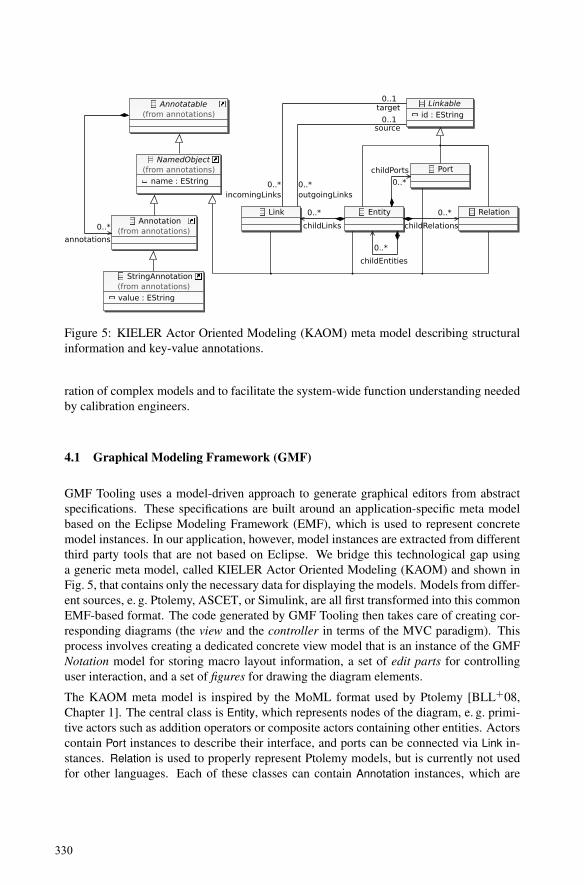
*('&'%
$#"'
!:86'&#(4&(2
"!10/-+)
&0 - *+'"&()
>((#'6'&#(<9"#7 6((#'6'&#(53
1/&80*('&'&:5
.,,@
1/&804&(25
.,,@
1/&80$#"'5
.,,@
1/&80!:86'&#(5
.,,@
5#?"1:.,,=
'6"):'.,,=
#?')#&()4&(25.,,@
&(1#7&()4&(25.,,@
6((#'6'&#(5
.,,@
+'"&()>((#'6'&#(<9"#7 6((#'6'&#(53
;68?: - *+'"&()
'/.),*-()&%<9"#7 6((#'6'&#(53
(67: - *+'"&()
$11#%/%/-+)<9"#7 6((#'6'&#(53
Figure 5: KIELER Actor Oriented Modeling (KAOM) meta model describing structural
information and key-value annotations.
ration of complex models and to facilitate the system-wide function understanding needed
by calibration engineers.
4.1 Graphical Modeling Framework (GMF)
GMF Tooling uses a model-driven approach to generate graphical editors from abstract
specifications. These specifications are built around an application-specific meta model
based on the Eclipse Modeling Framework (EMF), which is used to represent concrete
model instances. In our application, however, model instances are extracted from different
third party tools that are not based on Eclipse. We bridge this technological gap using
a generic meta model, called KIELER Actor Oriented Modeling (KAOM) and shown in
Fig. 5, that contains only the necessary data for displaying the models. Models from differ-
ent sources, e. g. Ptolemy, ASCET, or Simulink, are all first transformed into this common
EMF-based format. The code generated by GMF Tooling then takes care of creating cor-
responding diagrams (the view and the controller in terms of the MVC paradigm). This
process involves creating a dedicated concrete view model that is an instance of the GMF
Notation model for storing macro layout information, a set of edit parts for controlling
user interaction, and a set of figures for drawing the diagram elements.
The KAOM meta model is inspired by the MoML format used by Ptolemy [BLL+08,
Chapter 1]. The central class is Entity, which represents nodes of the diagram, e. g. primi-
tive actors such as addition operators or composite actors containing other entities. Actors
contain Port instances to describe their interface, and ports can be connected via Link in-
stances. Relation is used to properly represent Ptolemy models, but is currently not used
for other languages. Each of these classes can contain Annotation instances, which are
330
basically key-value pairs for attaching arbitrary data to model elements. We use annota-
tions to store the source language and the specific type of an element in order to select
the according figure from a predefined library, which is important for rendering the dia-
gram element in the same way as done in its source tool. Furthermore, we add annotations
holding the concrete position of each element in the original layout.
GMF supports collapsing and expanding composite nodes, which fits directly with our
focus & context approach. In theory it would be possible to load a whole model at once,
let GMF create the graphical viewer, and initially collapse all composite actors; users could
then selectively expand the actors in their focus. However, many models from industrial
applications are too large for this naive approach to work: loading the models would take
a long time, or might even fail due to memory limitations. Fortunately, as mentioned in
Sec. 2, even for such large-scale applications it is quite typical for each hierarchy level to
have a limited number of actors and connections such that they can be printed easily on one
page. Following this observation and the approach of Scheidgen et al. [SZFK12], we split
the input models such that each hierarchy level is persisted as a fragment. When a diagram
is opened, only its top-level fragment is loaded. Upon expansion of a composite actor,
its content is loaded lazily from the corresponding fragment, and when it is collapsed,
its content is unloaded again. This method limits memory consumption to the subset of
model elements that are actually shown in the generated view and greatly reduces the time
to open an initial view compared to the standard behavior of GMF, but of course it also
raises the time to expand composite actors.
4.2 KIELER Lightweight Diagrams (KLighD)
KLighD enables the visualization of models and other graph-like data in form of node-
link-diagrams according to the transient views approach [SSvH13]. Its aim is to provide
this opportunity without the burden of making oneself familiar with the peculiarities of
drawing frameworks and techniques of arranging diagrams. In contrast to GMF Tooling,
which derives diagrams from application models in a one-to-one manner, KLighD relies on
custom diagram synthesis mappings to formally describe diagrams based on given applica-
tion data. The view models produced by such mappings adhere to the KGraph/KRendering
format, which is well-suited for applying automatic layout and modifying diagrams inter-
actively [SSvH12]. The fact that it is specified in EMF’s meta modeling language Ecore
enables the full integration with Eclipse-based MDSD concepts and tools for implement-
ing diagram synthesis mappings.
The drawings of the desired diagrams, which correspond to the views in the MVC pattern,
are rendered by the mature 2D graphics framework Piccolo2D,5 which has been migrated
to SWT for use in Eclipse. The life cycle of those diagrams is controlled by an MVC-
like controller that is part of KLighD. This controller is in charge of updating the views
according to changes in the view models, as well as implementing the first class citizen op-
erations hiding and showing, expanding and collapsing, focusing elements, etc. Similarly
5http://www.piccolo2d.org/
331

"!('
"'&%$#
"!66542 / "!66542 - "!66542 333
15!20!"".1,+*) ()
')&)
%)
$)
#)
Figure 6: Diagram synthesis process of KLighD [SSvH13]: 1) Request for diagram of ap-
plication model, 2) mapping selection, 3) mapping application, 4) receipt of corresponding
view model, 5) handover to KIML, 6) receipt of view model with layout data, 7) handover
to a Piccolo2D diagram canvas and diagram rendering.
to the GMF-based solution, the arrangement of the diagram elements is contributed by the
KIELER Infrastructure for Meta Layout (KIML). The KGraph part of the view model is
the input for the KIML component, which evaluates layout directives such as port con-
straints (see Sec. 2), selects and executes layout algorithms, and augments the view model
elements with concrete position information. The procedure of creating graphical views
of given models is outlined in Fig. 6.
5 Evaluation
This section presents evaluations comparing the GMF-based and KLighD-based approaches
presented in the previous section. We consider two aspects of these approaches: perfor-
mance and implementation effort.
Performance We measured the execution time first for synthesizing view models and
rendering the diagrams, and second for applying automatic layout and updating the di-
agram rendering. The measurements were performed with about 360 example models
provided by the Ptolemy project. These models represent more realistic content than
randomly constructed ones do. In addition, this collection covers a reasonable range of
diagram elements per model.
Each of those models was examined 5 times with an intermediary sleep time of a few sec-
onds, allowing the tool to perform cleanup operations and the garbage collector to tidy up
the memory. Based on the data obtained this way, we computed the mean execution time
for opening and closing diagrams of each model, as well as for computing and applying an
automatic layout. The result is shown in Fig. 7: we measured an overall average speedup
of 2.64 for opening diagrams with KLighD compared to GMF, and a speedup of 7.41 for
332
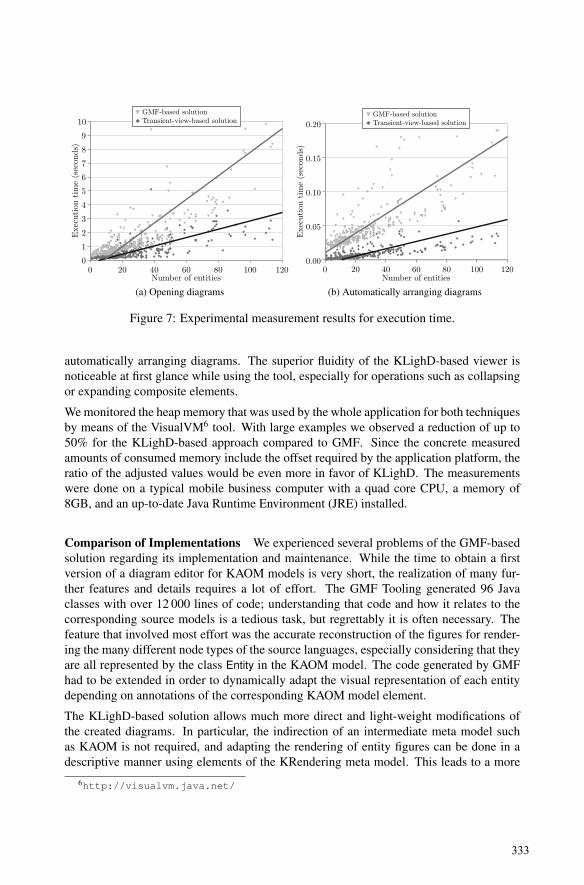
* (* '* &* %* $** $(**$(#'"&!%@$*
=:741/-+) -B?<96B30./3-6+394,6+E41/-+) -B?<96B3
DC+A<96B396>+;-+AB3)-8
5<>1+. B2 +39696+-(a) Opening diagrams
* (* '* &* %* $** $(*
#"!=:7420 4-+)A?-<967<4?2<A=3?21=:7420 4-+)A?-<
/.2,)A?-<A?C2B42,-<04@
>)C:26 -; 2<A?A?24
*8(*
*8$5
*8$*
*8*5
*8**
(b) Automatically arranging diagrams
Figure 7: Experimental measurement results for execution time.
automatically arranging diagrams. The superior fluidity of the KLighD-based viewer is
noticeable at first glance while using the tool, especially for operations such as collapsing
or expanding composite elements.
We monitored the heap memory that was used by the whole application for both techniques
by means of the VisualVM6 tool. With large examples we observed a reduction of up to
50% for the KLighD-based approach compared to GMF. Since the concrete measured
amounts of consumed memory include the offset required by the application platform, the
ratio of the adjusted values would be even more in favor of KLighD. The measurements
were done on a typical mobile business computer with a quad core CPU, a memory of
8GB, and an up-to-date Java Runtime Environment (JRE) installed.
Comparison of Implementations We experienced several problems of the GMF-based
solution regarding its implementation and maintenance. While the time to obtain a first
version of a diagram editor for KAOM models is very short, the realization of many fur-
ther features and details requires a lot of effort. The GMF Tooling generated 96 Java
classes with over 12 000 lines of code; understanding that code and how it relates to the
corresponding source models is a tedious task, but regrettably it is often necessary. The
feature that involved most effort was the accurate reconstruction of the figures for render-
ing the many different node types of the source languages, especially considering that they
are all represented by the class Entity in the KAOM model. The code generated by GMF
had to be extended in order to dynamically adapt the visual representation of each entity
depending on annotations of the corresponding KAOM model element.
The KLighD-based solution allows much more direct and light-weight modifications of
the created diagrams. In particular, the indirection of an intermediate meta model such
as KAOM is not required, and adapting the rendering of entity figures can be done in a
descriptive manner using elements of the KRendering meta model. This leads to a more
6http://visualvm.java.net/
333
intelligible and maintainable code base. For instance, the GMF-based visualization of
Ptolemy models was implemented in the Xtend7 language and compiled to 1372 lines
of Java code with 733 lines of hand-written code for the transformation to the KAOM
format, plus 1576 lines for the correct rendering of Ptolemy diagram elements, 5337 lines
generated by EMF for the KAOM meta model, 2374 lines of generic extensions of the
GMF editor code, and the aforementioned generated GMF code, which was customized
with 14 hand-edited code generation template files. This amounts to a total of roughly
24 000 lines of code. The KLighD-based visualization with the same functionality is made
of Xtend code that compiles to 4829 lines of Java code with 884 lines of hand-written code,
which is less than 6 000 lines in total.
6 Summary and Future Work
Today’s modeling tools provide reasonable support for application developers, who are
typically responsible for just a small portion of the system. However, it is sometimes nec-
essary to get an understanding of overall system functionality and to extract information
that is spread over a range of components. We have identified a number of requirements
that arise here, and have presented a concept combining transient views and automatic
layout to address them. The concept has been realized with two different Eclipse-based
technologies: GMF and KLighD. The presented methods allow the seamless browsing of
previously fragmented models as well as the integrated handling of heterogeneous models
comprising different source notations.
Comparing the two realizations of the transient views concept, we found that KLighD
allows to implement such applications with less effort both for the first prototypes and in
the long term compared to GMF. Furthermore, it reaches much better performance both
in terms of execution time and memory consumption. Hence, KLighD meets its design
objective stated in [SSvH13] in this application, and, as a bottom line, we would not
recommend employing a heavy-weight editor framework such as GMF when the goal is
merely visualizing and browsing models, but not editing.
First practical experiences with real-world models of the automotive industry have con-
firmed our thesis that automatically arranged models can easily be understood. The auto-
matic layout algorithms that take into account the positioning of ports optimize the read-
ability of the graphical models. This offers large time-saving potential for engineers who
are used to work with classical, page-oriented documentation.
While the pilot users of the EHANDBOOK solution at ETAS report promising experiences,
a substantial user study, evaluating the impacts on the daily work routine, has yet to be
performed. We also plan to integrate further methods supporting the understanding of the
models, e. g. dynamic exploration during the simulation of a model and the visualization
of time-critical paths based on profiling information. Another area for future work is the
further optimization of automatic layout algorithms in the context of hierarchical data-flow
models and very-large-scale models.
7http://www.eclipse.org/xtend/
334
References
[BLL+08] Christopher Brooks, Edward A. Lee, Xiaojun Liu, Stephen Neuendorffer, Yang Zhao,and Haiyang Zheng. Heterogeneous Concurrent Modeling and Design in Java, Volume2: Ptolemy II Software Architecture. Technical Report UCB/EECS-2008-29, EECSDepartment, University of California, Berkeley, April 2008.
[Bra01] Jurgen Branke. Dynamic Graph Drawing. In Michael Kaufmann and Dorothea Wag-ner, editors, Drawing Graphs: Methods and Models, volume 2025 of LNCS. Springer,2001.
[BRSG07] Chris Bennett, Jody Ryall, Leo Spalteholz, and Amy Gooch. The Aesthetics of GraphVisualization. In Proceedings of the International Symposium on Computational Aes-thetics in Graphics, Visualization, and Imaging (CAe’07), pages 57–64. EurographicsAssociation, 2007.
[BSLF06] Robert Ian Bull, Margaret-Anne Storey, Marin Litoiu, and Jean-Marie Favre. An Ar-chitecture to Support Model Driven Software Visualization. In Proceedings of the14th IEEE International Conference on Program Comprehension (ICPC’06), pages100–106. IEEE, 2006.
[BT00] Stina Bridgeman and Roberto Tamassia. Difference Metrics for Interactive OrthogonalGraph Drawing Algorithms. Journal of Graph Algorithms and Applications, 4(3):47–74, 2000.
[DETT99] Giuseppe Di Battista, Peter Eades, Roberto Tamassia, and Ioannis G. Tollis. GraphDrawing: Algorithms for the Visualization of Graphs. Prentice Hall, 1999.
[EJL+03] Johan Eker, Jorn W. Janneck, Edward A. Lee, Jie Liu, Xiaojun Liu, Jozsef Ludvig,Stephen Neuendorffer, Sonia Sachs, and Yuhong Xiong. Taming Heterogeneity—ThePtolemy Approach. Proceedings of the IEEE, 91(1):127–144, Jan 2003.
[GHL+13] John C. Grundy, John Hosking, Karen Na Li, Norhayati Mohd Ali, Jun Huh, andRichard Lei Li. Generating Domain-Specific Visual Language Tools from AbstractVisual Specifications. IEEE Transactions on Software Engineering, 39(4):487–515,April 2013.
[Kla12] Lars Kristian Klauske. Effizientes Bearbeiten von Simulink Modellen mit Hilfe einesspezifisch angepassten Layoutalgorithmus. PhD thesis, Technische Universitat Berlin,2012.
[KSSvH12] Lars Kristian Klauske, Christoph Daniel Schulze, Miro Sponemann, and Reinhard vonHanxleden. Improved Layout for Data Flow Diagrams with Port Constraints. In Pro-ceedings of the 7th International Conference on the Theory and Application of Dia-grams (DIAGRAMS’12), volume 7352 of LNAI, pages 65–79. Springer, 2012.
[LMB+01] Akos Ledeczi, Miklos Maroti, Arpad Bakay, Gabor Karsai, Jason Garrett, CharlesThomason, Greg Nordstrom, Jonathan Sprinkle, and Peter Volgyesi. The GenericModeling Environment. In Workshop on Intelligent Signal Processing, 2001.
[LNW03] Edward A. Lee, Stephen Neuendorffer, and Michael J. Wirthlin. Actor-Oriented De-sign of Embedded Hardware and Software Systems. Journal of Circuits, Systems, andComputers (JCSC), 12(3):231–260, 2003.
[Min06] Mark Minas. Generating Meta-Model-Based Freehand Editors. In Proceedings ofthe 3rd International Workshop on Graph Based Tools (GraBaTs’06), volume 1 ofElectronic Communications of the EASST, Berlin, Germany, 2006.
335

[MLC06] Gergely Mezei, Tihamer Levendovszky, and Hassan Charaf. Visual Presentation So-lutions for Domain Specific Languages. In Proceedings of the IASTED InternationalConference on Software Engineering, Innsbruck, Austria, 2006.
[RMG07] Tobias Reinhard, Silvio Meier, and Martin Glinz. An Improved Fisheye Zoom Al-gorithm for Visualizing and Editing Hierarchical Models. In Second InternationalWorkshop on Requirements Engineering Visualization, pages 9–19. IEEE, 2007.
[San04] Georg Sander. Layout of Directed Hypergraphs with Orthogonal Hyperedges. In Pro-ceedings of the 11th International Symposium on Graph Drawing (GD’03), volume2912 of LNCS, pages 381–386. Springer, 2004.
[SB92] Manojit Sarkar and Marc H. Brown. Graphical Fisheye Views of Graphs. In Pro-ceedings of the SIGCHI Conference on Human Factors in Computing Systems, pages83–91. ACM, 1992.
[SFM99] Margaret-Anne D. Storey, F. David Fracchia, and Hausi A. Muller. Customizing aFisheye View Algorithm to Preserve the Mental Map. Journal of Visual Languages &Computing, 10(3):245–267, 1999.
[SFvHM10] Miro Sponemann, Hauke Fuhrmann, Reinhard von Hanxleden, and Petra Mutzel. PortConstraints in Hierarchical Layout of Data Flow Diagrams. In Proceedings of the 17thInternational Symposium on Graph Drawing (GD’09), volume 5849 of LNCS, pages135–146. Springer, 2010.
[SSM+13] Miro Sponemann, Christoph Daniel Schulze, Christian Motika, Christian Schnei-der, and Reinhard von Hanxleden. KIELER: Building on Automatic Layout forPragmatics-Aware Modeling (Showpiece). In Proceedings of the IEEE Symposiumon Visual Languages and Human-Centric Computing (VL/HCC’13), San Jose, CA,USA, 15–19 September 2013.
[SSvH12] Christian Schneider, Miro Sponemann, and Reinhard von Hanxleden. Transient ViewGeneration in Eclipse. In Proceedings of the First Workshop on Academics Modelingwith Eclipse, Kgs. Lyngby, Denmark, July 2012.
[SSvH13] Christian Schneider, Miro Sponemann, and Reinhard von Hanxleden. Just Model!– Putting Automatic Synthesis of Node-Link-Diagrams into Practice. In Proceed-ings of the IEEE Symposium on Visual Languages and Human-Centric Computing(VL/HCC’13), San Jose, CA, USA, 15–19 September 2013. With accompanyingposter.
[STT81] Kozo Sugiyama, Shojiro Tagawa, and Mitsuhiko Toda. Methods for visual under-standing of hierarchical system structures. IEEE Transactions on Systems, Man andCybernetics, 11(2):109–125, February 1981.
[SWFM97] Margaret-Anne D. Storey, K. Wong, F. David Fracchia, and Hausi A. Muller. Onintegrating visualization techniques for effective software exploration. In Proceedingsof the IEEE Symposium on Information Visualization, pages 38–45. IEEE, 1997.
[SZFK12] Markus Scheidgen, Anatolij Zubow, Joachim Fischer, and Thomas H. Kolbe. Auto-mated and Transparent Model Fragmentation for Persisting Large Models. In Proceed-ings of the 15th International Conference on Model Driven Engineering Languagesand Systems (MODELS’12), volume 7590 of LNCS, pages 102–118. Springer, 2012.
[SZG+96] Doug Schaffer, Zhengping Zuo, Saul Greenberg, Lyn Bartram, John Dill, Shelli Dubs,and Mark Roseman. Navigating hierarchically clustered networks through fisheye andfull-zoom methods. ACM Transactions on Computer-Human Interaction, 3:162–188,1996.
336

SecEval: An Evaluation Framework for
Engineering Secure Systems∗
Marianne Busch, Nora Koch, Martin Wirsing
Ludwig-Maximilians-Universitat Munchen
Oettingenstraße 67, 80538 Munchen, Germany
{busch, kochn, wirsing}@pst.ifi.lmu.de
Abstract: Engineering secure software systems is not an easy task. Many methods,notations and tools – we call them knowledge objects – exist to support engineersin the development of such software. A main problem is the selection of appropri-ate knowledge objects. Therefore, we build the conceptual framework SECEVAL tosupport the evaluation and comparison of security features, vulnerabilities, methods,notations and tools. It provides an evaluation process and a model, which comprisesconcepts related to security context, data collection and data analysis. Our approach isvalidated by a case study in the area of security testing of web applications.
1 Introduction
Software and security engineers constantly make decisions about which technology should
be used in the different phases of the Software Development Life Cycle (SDLC). There-
fore, a cost-benefit analysis and a subsequent selection of appropriate methods, tools and
notations – so called knowledge objects (KOs) – for a specific task, play an important role
in the engineering process. All too frequent, there is no time to investigate on alternatives
to well-known KOs or those used so far. Most of the questions which arise are not entirely
new, but useful scraps of knowledge are distributed in papers, books or the web, or just
exist in the head of colleagues working at another project. Without having a template for
their domain, engineers often have to start defining the process of evaluating KOs as well
as creating the structure of the results from scratch.
To ease the tasks of recording results and of getting an overview of existing KOs the Com-
mon Body of Knowledge (CBK) [CBK13] was implemented as a semantic Wiki within
the scope of the EU project NESSoS. As members of the NESSoS project, we gained ex-
perience working with this knowledge base and its underlying model, which raised three
questions: (a) How could the CBK’s model be improved, so that security-related features
can also be represented as knowledge objects? (b) How can we use the model not only
for recording and comparing features of methods, notations and tools, but also for docu-
menting the search process. (c) How is the process of data collection and data analysis
specified, to make sure that emerging research results are comprehensible and valid?
∗This work has been supported by the EU-NoE project NESSoS, GA 256980.
337

Evaluation in the area of cybersecurity does mean for us, e.g., to find out which authen-
tication-related threats can or cannot be mitigated by a method, for which tool-support is
implemented. Up to now, these kinds of questions require researchers to document their
approaches and results in a self-made way. Consequently, other researchers, who want to
build on those results, have to understand many different schemas documenting research
processes and their results. This is not only time-consuming, but also error-prone, as
misunderstandings easily occur.
We present an evaluation approach, called SECEVAL, for evaluating security-related KOs.
However, we do not claim to provide a one-fits-all model for IT-security (which would hor-
ribly overload any model), but introduce an extensible basis. SECEVAL defines a graphical
model, which comprises (a) a security context model describing security properties, vul-
nerabilities and threats as well as methods, notations and tools; (b) a data collection model,
which records how data is gathered when researchers or practitioners do research to an-
swer a question; and (c) a data analysis model specifying, how reasoning on previously
collected data, is done.
A simplified example of the process of using SECEVAL for evaluation is depicted in Fig. 1.
Research questions initiate the process of data collection, where sources (as papers, web-
sites, . . . ) are gathered. These sources are then analyzed, which means to extract informa-
tion and record it using SECEVAL’s security context model.
Figure 1: Overview of SECEVAL’s Evaluation Process (full process: [Bus14a])
The remainder of this paper is structured as follows: Sect. 2 presents our evaluation ap-
proach called SECEVAL. In Sect. 3 we validate the approach by a guided review and a
case study in the area of security testing of web applications. We discuss related work in
Sect. 4 and conclude in Sect. 5.
2 Evaluation Framework SecEval
Our aim is to provide an approach for documenting the evaluation of methods, notations
and tools within the scope of secure software systems. The evaluation should also support
security properties, vulnerabilities and threats. For the graphical representation of con-
cepts and relationships we selected the UML notation, as we think it fits our needs best.
338

The full MagicDraw 17.01 model of SECEVAL and all diagrams can be downloaded from
the web [Bus14a]. Deliverable D2.4 [BK13, Bus14b] of the NESSoS project includes a
detailed description of SECEVAL.
We elicited the requirements of such a conceptual framework, i.e. which stakeholders are
involved (security engineers, users, attackers), which use cases they perform, which con-
cepts play a role and how they are related. We grouped the identified use cases according
to evaluation (e.g., collect data) and SDLC-related (e.g., identify vulnerabilities) concepts.
The use cases from our requirements analysis were a starting point to identify relevant
concepts related to security for using and evaluating methods, notations and tools during
the software engineering process. We clustered these concepts in three packages: Security
Context, Data Collection and Data Analysis. Figure 2 shows the model represented as a
UML class diagram.
Figure 2: SECEVAL: Model Overview
2.1 Security Context
The aim of Security Context package (shown in Figure 3) is to provide a structure for
the classification of (security-related) methods, notations and tools together with security
properties, vulnerabilities and threats. We introduce an abstract class Mechanism from
which the classes Method, Notation and Tool inherit common attributes such as
1MagicDraw. http://magicdraw.com
339

goals, costs, basedOnStandards, etc. In this paper we use the upper-case term
“Mechanism” when referring to a method, a notation or a tool. We focus on security
aspects, but the model can also record non-security Mechanisms.
Once Mechanisms are described by the model, it is easy to get an overview of existing
security-related methods, tools and notations for a certain area. Furthermore, the package
should serve as a flexible basis for a knowledge base and as a starting point for an eval-
uation. This means that it can be adopted to fit the needs of the researcher to examine a
concrete research question (which does not have to be scientific).
In Fig. 3, for convenience enumerations’ texts are grey and the background of classes
which can directly be instantiated is colored. All attributes and roles are typed; however the
types are not shown in the figures due to brevity. The main characteristics of Mechanisms
are specified as boolean types (can.., has.., is..). In an implementation of our model, it
should be possible to add further items to enumerations.
Figure 3: SECEVAL: Security Context
As mentioned above, a MECHANISM is an abstract notion for a method, notation or tool.
It can be described by a problem statement, by the goals it strives for, by its costs and by
the consequences it implies. Mechanisms can be based on standards or be standardized
themselves. They can have arbitrary many creators, as companies, inventors or developers.
Before applying a Mechanism, the preconditions that are necessary for using it have to be
fulfilled. Furthermore, an estimation regarding technical maturity and adoption in practice
340

should be given. Several levels of usability can be stated according to the experience a
user needs to employ a Mechanism, e.g., a certain Mechanism should best be applied by
experts.
A METHOD has some general attributes, such as as input, output and if it is model-driven,
which are used to describe the method at a high level of abstraction. For extensive methods,
each step of the method can also be described in detail, if necessary. A method or step can
be supported by notations or tools.
For a NOTATION, we consider characteristics such as whether the notation is graphical,
textual or based on a tabular representation. We also added a level of formality, which
ranges from informal to formal. Notations can be based on other notations, for example
many context-specific extensions for UML exist.
The description of a TOOL covers the information of languages it is written in, of operating
systems it supports, of frameworks it uses and of technical requirements, which have to
be fulfilled in order to use it. The tool (or its parts) are released under certain licenses.
Additionally, the needed time for installation and configuration can be provided. Booleans
describe if the tool can be used interactively or autonomously, if it has start parameters, a
GUI or a text-based user interface. A tool can be based on other tools, which is the case
when libraries are used or when plugins are written.
During our experience with the CBK, we noticed that tools as well as methods would be
better described according to the phases of the SDLC, because attributes which are used
to describe a method or tool are related to the SDLC phases they cover. As far as we
know, no phase-related attributes are needed to describe features of notations. Figure 4
depicts our Method class and the abstract class MAreasOfDev, which is a wildcard for
detailed information about the method. A method can support several development phases.
The phases of the SDLC are the same we have chosen to classify tools and methods in the
NESSoS project [BK11]: requirements, design, implementation, testing, assurance, risk &
cost, service composition and deployment. We added an additional category to distinguish
methods and tools that operate at the runtime of a system.
For example a method, as e.g., Microsoft’s Security Development Lifecycle2, can be used
as a basis for designing secure applications, but also covers other phases. In this case, the
attributes of the classes DesignM and ImplementationM and others would be used
to describe the method. The meaning of attributes should be self-explaining, for further
details and for the according SDLC refinement for tools, the reader is referred to [Bus14a].
We adopted the abstract KNOWLEDGEOBJECT (KO) which is used in the CBK to record
most information of elements which are described. For SECEVAL, we applied separation
of concerns so that only very general descriptions remain as attributes in a KO, which
can be applied to all elements (cf. Fig. 3). Therefore, the class KnowledgeObject has
names, tags and related sources, which could be any kinds of sources, as publications or
URLs. A description and examples enable easy learning of KOs, i.e. security properties,
vulnerabilities and mechanisms.
We represent security issues, such as confidentiality, integrity and privacy by the class
2Microsoft SDL. https://www.microsoft.com/security/sdl
341
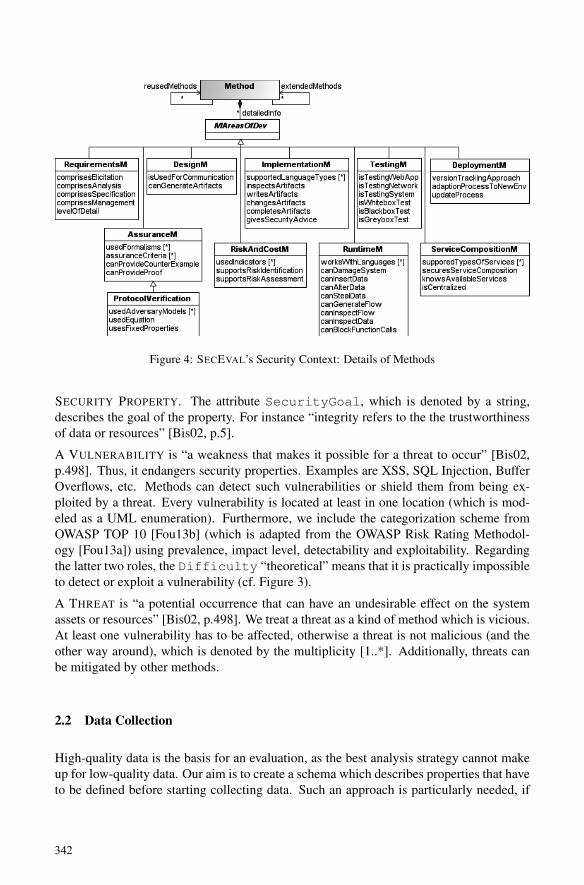
Figure 4: SECEVAL’s Security Context: Details of Methods
SECURITY PROPERTY. The attribute SecurityGoal, which is denoted by a string,
describes the goal of the property. For instance “integrity refers to the the trustworthiness
of data or resources” [Bis02, p.5].
A VULNERABILITY is “a weakness that makes it possible for a threat to occur” [Bis02,
p.498]. Thus, it endangers security properties. Examples are XSS, SQL Injection, Buffer
Overflows, etc. Methods can detect such vulnerabilities or shield them from being ex-
ploited by a threat. Every vulnerability is located at least in one location (which is mod-
eled as a UML enumeration). Furthermore, we include the categorization scheme from
OWASP TOP 10 [Fou13b] (which is adapted from the OWASP Risk Rating Methodol-
ogy [Fou13a]) using prevalence, impact level, detectability and exploitability. Regarding
the latter two roles, the Difficulty “theoretical” means that it is practically impossible
to detect or exploit a vulnerability (cf. Figure 3).
A THREAT is “a potential occurrence that can have an undesirable effect on the system
assets or resources” [Bis02, p.498]. We treat a threat as a kind of method which is vicious.
At least one vulnerability has to be affected, otherwise a threat is not malicious (and the
other way around), which is denoted by the multiplicity [1..*]. Additionally, threats can
be mitigated by other methods.
2.2 Data Collection
High-quality data is the basis for an evaluation, as the best analysis strategy cannot make
up for low-quality data. Our aim is to create a schema which describes properties that have
to be defined before starting collecting data. Such an approach is particularly needed, if
342

the data collection has to be systematic. Therefore, we base our approach on Kitchenham’s
systematic literature review [KC07].
In order to collect data, it is common to define a search process (c.f. Fig. 5) which specifies
several steps called process phases. Each phase may follow another approach, e.g., the
search can be automated or not, or it can be a depth-first or a breadth-first search. Depth-
first means, that the aim of a search is to extract a lot of detail information about a relatively
small topic, whereas a breadth-first search is good to get an overview of a broader topic.
Figure 5: SECEVAL: Data Collection
Similar to Kitchenham’s literature review, research questions are used to define the corner
stones and the goals of the search. Please note that for us the term “research” does not
necessarily refer to scientific research. Queries can be derived from the research questions.
They are then used and refined in the phases of the search process. As different search
engines support different types of queries, concrete queries are specific for each resource,
as e.g., Google Scholar. Queries can also refer to questions which are used as a basis for
experiments (cf. Sect. 3).
It is important to choose resources that will serve as data sources for the evaluation. The
use of an association class for ConcreteQuery (depicted by a dashed line) denotes that
for each pair of ProcessPhase and UsedResource, the class ConcreteQuery is
instantiated. The concrete search expression is derived from a general search expression.
For example, the general search expression could be “recent approaches in Security Engi-
neering” and we want to ask Google Scholar and a popular researcher. For Google Scholar
we could use “"Security Engineering" 2012..2013” as a concrete search expression and
the concrete expression for asking a researcher could read: “I’m interested in Security
Engineering. Which recent approaches in Security Engineering do you know?”.
If a concrete query matches sources, as papers, websites or personal answers, we classify
the source at least by author and description (as an abstract) and provide information about
the type of source and at least one reference where to find it. The process of data collection
and data analysis is depicted in Fig. 1.
343

2.3 Data Analysis
Data is collected with the purpose to obtain an answer to research questions based on the
analysis of the data. According to Kitchenham, the procedure how to collect as well as
analyze data belongs to the “review protocol” and has to be specified in the first place.
Figure 6 depicts relevant concepts for analyzing data. First, we have to specify which
type of strategy we want to use. Are we limited to quantitative analysis or do we focus
on qualitative analysis? Accordingly, one can later refer to Kitchenham’s checklists for
quantitative and qualitative studies [KC07, tables 5 and 6] to ensure the quality of the own
answers to the research questions.
Figure 6: SECEVAL: Data Analysis
The analysis strategy requires to select the used categories & criteria, algorithms for anal-
ysis, and filters according to the research question. Criteria can be grouped by categories.
A criterion gives more information about data values as it defines the data type (string,
list of booleans, ..) and the metric (milliseconds, ..). In addition, a priority can be defined
which is useful when Mechanisms should be compared.
Information can be extracted from the sources which were found in the data collection
phase (see "use# dependency starting from the class ExtractedInfo in Fig. 2), or
they can be processed using an analysis algorithm. This algorithm does not have to be
executable on a computer. The analysis strategy defines which algorithm is employed and
makes sure that the result of the algorithm fits to a criterion regarding meaning and metric.
344
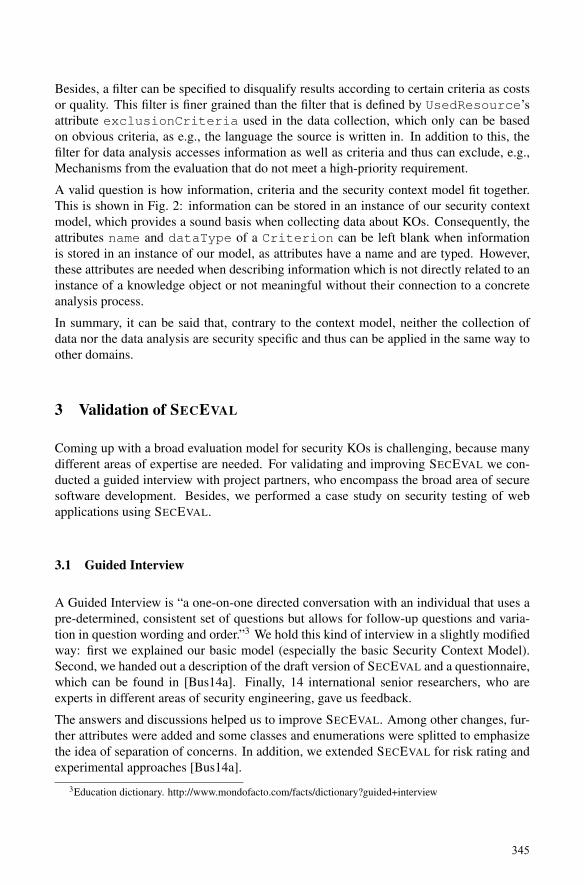
Besides, a filter can be specified to disqualify results according to certain criteria as costs
or quality. This filter is finer grained than the filter that is defined by UsedResource’s
attribute exclusionCriteria used in the data collection, which only can be based
on obvious criteria, as e.g., the language the source is written in. In addition to this, the
filter for data analysis accesses information as well as criteria and thus can exclude, e.g.,
Mechanisms from the evaluation that do not meet a high-priority requirement.
A valid question is how information, criteria and the security context model fit together.
This is shown in Fig. 2: information can be stored in an instance of our security context
model, which provides a sound basis when collecting data about KOs. Consequently, the
attributes name and dataType of a Criterion can be left blank when information
is stored in an instance of our model, as attributes have a name and are typed. However,
these attributes are needed when describing information which is not directly related to an
instance of a knowledge object or not meaningful without their connection to a concrete
analysis process.
In summary, it can be said that, contrary to the context model, neither the collection of
data nor the data analysis are security specific and thus can be applied in the same way to
other domains.
3 Validation of SECEVAL
Coming up with a broad evaluation model for security KOs is challenging, because many
different areas of expertise are needed. For validating and improving SECEVAL we con-
ducted a guided interview with project partners, who encompass the broad area of secure
software development. Besides, we performed a case study on security testing of web
applications using SECEVAL.
3.1 Guided Interview
A Guided Interview is “a one-on-one directed conversation with an individual that uses a
pre-determined, consistent set of questions but allows for follow-up questions and varia-
tion in question wording and order.”3 We hold this kind of interview in a slightly modified
way: first we explained our basic model (especially the basic Security Context Model).
Second, we handed out a description of the draft version of SECEVAL and a questionnaire,
which can be found in [Bus14a]. Finally, 14 international senior researchers, who are
experts in different areas of security engineering, gave us feedback.
The answers and discussions helped us to improve SECEVAL. Among other changes, fur-
ther attributes were added and some classes and enumerations were splitted to emphasize
the idea of separation of concerns. In addition, we extended SECEVAL for risk rating and
experimental approaches [Bus14a].
3Education dictionary. http://www.mondofacto.com/facts/dictionary?guided+interview
345
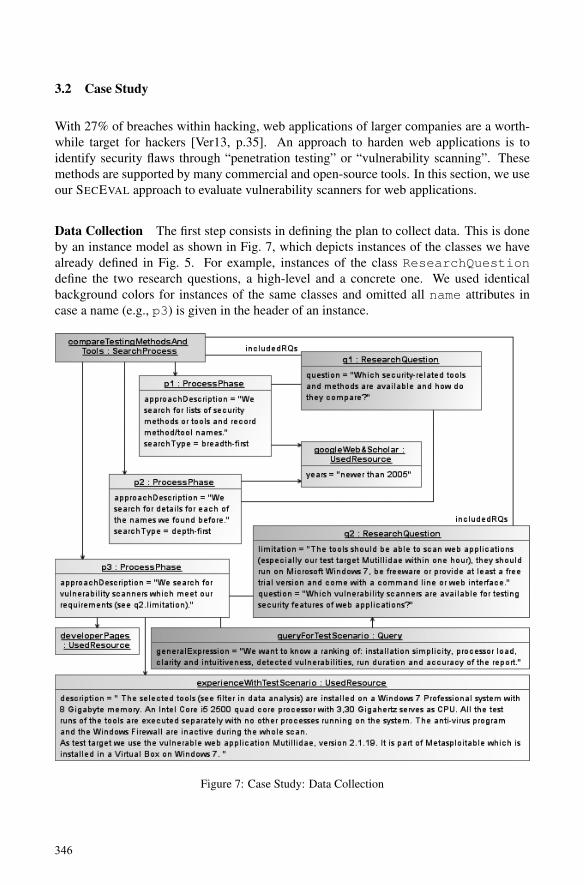
3.2 Case Study
With 27% of breaches within hacking, web applications of larger companies are a worth-
while target for hackers [Ver13, p.35]. An approach to harden web applications is to
identify security flaws through “penetration testing” or “vulnerability scanning”. These
methods are supported by many commercial and open-source tools. In this section, we use
our SECEVAL approach to evaluate vulnerability scanners for web applications.
Data Collection The first step consists in defining the plan to collect data. This is done
by an instance model as shown in Fig. 7, which depicts instances of the classes we have
already defined in Fig. 5. For example, instances of the class ResearchQuestion
define the two research questions, a high-level and a concrete one. We used identical
background colors for instances of the same classes and omitted all name attributes in
case a name (e.g., p3) is given in the header of an instance.
Figure 7: Case Study: Data Collection
346

Research question q1 (“Which security-related tools and methods are available and how
do they compare?”, cf. Fig. 7) is very general. In the first process phase p1, 13 methods
and 18 tools were selected [Sch13]. More detailed information was gathered in the sec-
ond process phase p2 about: vulnerability scanning, penetration testing, fuzzing and the
classification into black- grey- and white-box testing. Examples for tools are WSFuzzer,
X-Create and WS-Taxi, just to mention a few. As we already added most of the found
methods and tools to the CBK [CBK13], we focus on q2 in this section.
Research question q2 (“Which vulnerability scanners are available for testing security
features of web applications?”) is a typical question which could be asked by security
engineers working in a company. The “sources” (i.e., tools) we selected for analysis
were [Lac13]: a) Acunetix Web Vulnerability Scanner4, b) Mavituna Security - Netsparker5,
c) Burp Scanner6, d) Wapiti7, e) Arachni8, f) Nessus9, g) Nexpose10 and h) Nikto11.
The instance experienceWithTestScenario describes how the data is gathered by
testing the vulnerability scanners.
Data Analysis For analyzing collected data we define an analysis strategy and select a
filter which enforces the requirements (limitations) defined for question q2. Figure 8
depicts instances of the data analysis model we defined in Fig. 6.
Figure 8: Case Study: Data Analysis – Results
Before going into detail about particular results of our experiments, we first take a look
at the overall result regarding our research question q2. Figure 8 thus depicts an instance
of the class ProcessedInfo, which is called weightedResultValues. Only four
tools passed our filter: Arachni and Nikto, which provide command-line interfaces and
Nessus and Nexpose, which also provide web interfaces. From our list of tools from
4Acunetix. http://www.acunetix.com5Netsparker. https://www.mavitunasecurity.com/netsparker6Burp Scanner. http://portswigger.net/burp/scanner.html7Wapiti. http://www.ict-romulus.eu/web/wapiti8Arachni. http://www.arachni-scanner.com9Nessus. http://www.tenable.com/de/products/nessus
10Nexpose. https://www.rapid7.com/products/nexpose11Nikto. http://www.cirt.net/Nikto2
347
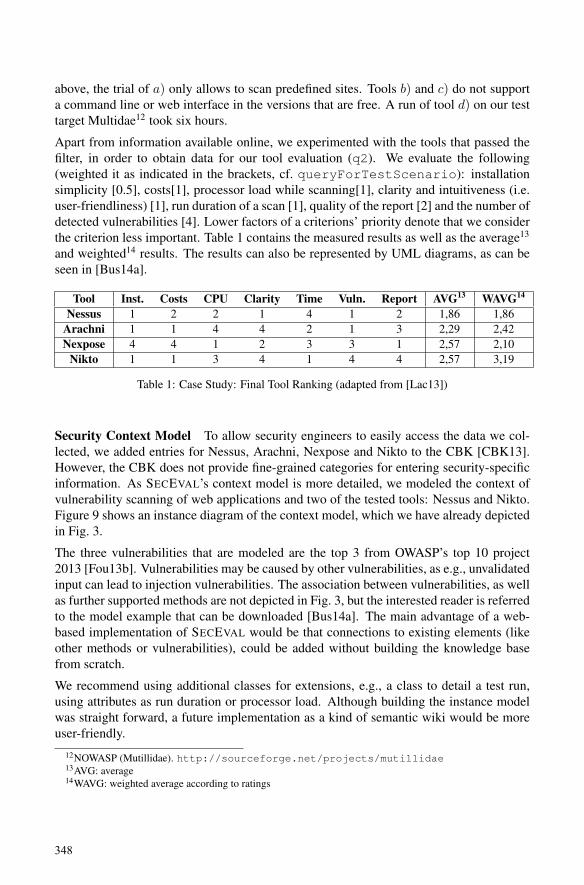
above, the trial of a) only allows to scan predefined sites. Tools b) and c) do not support
a command line or web interface in the versions that are free. A run of tool d) on our test
target Multidae12 took six hours.
Apart from information available online, we experimented with the tools that passed the
filter, in order to obtain data for our tool evaluation (q2). We evaluate the following
(weighted it as indicated in the brackets, cf. queryForTestScenario): installation
simplicity [0.5], costs[1], processor load while scanning[1], clarity and intuitiveness (i.e.
user-friendliness) [1], run duration of a scan [1], quality of the report [2] and the number of
detected vulnerabilities [4]. Lower factors of a criterions’ priority denote that we consider
the criterion less important. Table 1 contains the measured results as well as the average13
and weighted14 results. The results can also be represented by UML diagrams, as can be
seen in [Bus14a].
Tool Inst. Costs CPU Clarity Time Vuln. Report AVG13 WAVG14
Nessus 1 2 2 1 4 1 2 1,86 1,86
Arachni 1 1 4 4 2 1 3 2,29 2,42
Nexpose 4 4 1 2 3 3 1 2,57 2,10
Nikto 1 1 3 4 1 4 4 2,57 3,19
Table 1: Case Study: Final Tool Ranking (adapted from [Lac13])
Security Context Model To allow security engineers to easily access the data we col-
lected, we added entries for Nessus, Arachni, Nexpose and Nikto to the CBK [CBK13].
However, the CBK does not provide fine-grained categories for entering security-specific
information. As SECEVAL’s context model is more detailed, we modeled the context of
vulnerability scanning of web applications and two of the tested tools: Nessus and Nikto.
Figure 9 shows an instance diagram of the context model, which we have already depicted
in Fig. 3.
The three vulnerabilities that are modeled are the top 3 from OWASP’s top 10 project
2013 [Fou13b]. Vulnerabilities may be caused by other vulnerabilities, as e.g., unvalidated
input can lead to injection vulnerabilities. The association between vulnerabilities, as well
as further supported methods are not depicted in Fig. 3, but the interested reader is referred
to the model example that can be downloaded [Bus14a]. The main advantage of a web-
based implementation of SECEVAL would be that connections to existing elements (like
other methods or vulnerabilities), could be added without building the knowledge base
from scratch.
We recommend using additional classes for extensions, e.g., a class to detail a test run,
using attributes as run duration or processor load. Although building the instance model
was straight forward, a future implementation as a kind of semantic wiki would be more
user-friendly.
12NOWASP (Mutillidae). http://sourceforge.net/projects/mutillidae13AVG: average14WAVG: weighted average according to ratings
348

Figure 9: Case Study: Instances of Context Model (excerpt)
349

4 Related Work
Evaluation approaches are often tailored to the needs of a specific area. We start by intro-
ducing general approaches and continue with those which are security-specific.
General Evaluation Approaches. KITCHENHAM et al. [KC07] specify so called “Sys-
tematic Literature Reviews” in software engineering. The aim is to answer research ques-
tions by systematically searching and extracting knowledge of existing literature. Our
approach, SECEVAL, is based on their work. We focus instead on the use of arbitrary
resources, as source code or experiments which are carried out to answer a research ques-
tion. In contrast to Kitchenham’s approach, our data collection process is iterative, and
more specific for a chosen context as we define a detailed structure for recording results.
SIQINU (Strategy for understanding and Improving Quality in Use) [BPO13] is a frame-
work for evaluating the quality of a product version. It uses the conceptual framework
C-INCAMI, which specifies concepts and relationships for measurement and evaluation.
SIQinU defines a strategy using UML activity diagrams whereas C-INCAMI is specified
by a UML class diagram.
MOODY [Moo03] proposes an evaluation approach which is based on experiments. Prac-
titioners use methods and afterwards answer questions about perceived ease of use, per-
ceived usefulness and intention to use. A figure how Moody’s approach can be integrated
can be found online [Bus14a].
The CBK (Common Body of Knowledge) [BEHU12] defines a model for software en-
gineers to describe knowledge objects (KOs), which are methods, techniques, notations,
tools or standards. Techniques are methods which do not specify activities (in our ter-
minology: “steps”) for applying the method. The CBK is implemented as a semantic
Wiki [CBK13] and serves as a knowledge base containing all relevant information about
existing KOs. Unlike the CBK, SECEVAL is not implemented yet. In contrast to the
CBK, SECEVAL focuses on security-related features and provides a fine-grained model.
Additionally, it defines a process for the evaluation of KOs.
Security-specific Evaluation Approaches. Security-related frameworks often consider
concrete software systems for their evaluation. An example is the OWASP RISK RATING
METHODOLOGY [Fou13a], where the risk for a concrete application or system is esti-
mated. We added vulnerability-dependent features of the OWASP model to SECEVAL,
as e.g., the difficulty of detecting or exploiting a vulnerability. Features that are related
to a concrete system and the rating of a possible attack are introduced as an extension of
SECEVAL, which can be found online [Bus14a].
Humberg et al. [HWP+13] propose a two-step approach to support compliant and secure
outsourcing of business processes using the concept of ontologies to formalize compliance
and regulatory aspects of IT-security. They show how they can apply it to analyze the con-
tent of documents in a unified way in order to detect dependencies. Our means are similar,
as we want to represent methods, notations and tools in a structured and methodological
350
way. However, we focus on the selection of KOs and not on compliance issues.
The i* [Uni] metamodel is the basis of a vulnerability-centric requirements engineering
framework introduced in [EYZ10]. The extended, VULNERABILITY-CENTRIC I* META-
MODEL aims at analyzing security attacks, countermeasures, and requirements based on
vulnerabilities. The metamodel is represented using UML class models.
Another approach that focuses on vulnerabilities is described by Wang et al. [WG09] Their
concept model is less detailed than the i* metamodel. They create a knowledge base that
can be queried using a language for the semantic web, called SWRL. Unlike our approach,
they do not use graphical models.
5 Conclusion
We present a conceptual framework – called SECEVAL– for the structured evaluation of
methods, tools and notations in the area of secure software. SECEVAL specifies (a) an
improved, flexible security context model (b) a model that records the way how data is
collected (c) an analysis model which defines the analysis strategy, and the filters and al-
gorithms it uses on the collected sources. A UML model is used to represent concepts and
relationships of these three concerns (depicted as UML packages): context, data collec-
tion and data analysis. Furthermore, SECEVAL was improved using a guided interview and
we additionally provided a case study about methods and tools from the area of security
testing. The research question of our case study focuses on the selection of vulnerability
scanners for web applications.
Summarizing, SECEVAL provides a structure for evaluating research questions related to
secure software engineering. We think that this eases the process of doing research in the
area of security no matter if the research question aims at scientific or engineering issues.
When implementing the security context model in the future, it will be helpful to add
axioms to our model. In our case, we could think about rules to describe dependencies
between attributes, like a method should not extend the same version of itself. Addition-
ally, we plan to conduct a case study using SECEVAL for a comprehensive evaluation of
knowledge objects of the domain of secure web modeling.
References
[BEHU12] Kristian Beckers, Stefan Eicker, Maritta Heisel, and Widura Schwittek (UDE). NES-SoS Deliverable D5.2 – Identification of Research Gaps in the Common Body ofKnowledge. http://www.nessos-project.eu/media/deliverables/
y2/NESSoS-D5.2.pdf, 2012.
[Bis02] Matt Bishop. Computer Security: Art and Science. Addison-Wesley Professional, 1stedition, 2002.
[BK11] Marianne Busch and Nora Koch. NESSoS Deliverable D2.1 – First release of
351

Method and Tool Evaluation. http://www.nessos-project.eu/media/
deliverables/y1/NESSoS-D2.1.pdf, 2011.
[BK13] Marianne Busch and Nora Koch. NESSoS Deliverable D2.4 – Second Release ofthe Method and Tool Evaluation. http://www.nessos-project.eu/media/deliverables/y3/NESSoS-D2.4.pdf, 2013.
[BPO13] Pablo Becker, Fernanda Papa, and Luis Olsina. Enhancing the Conceptual FrameworkCapability for a Measurement and Evaluation Strategy. 4th International Workshop onQuality in Web Engineering , (6360):1–12, 2013.
[Bus14a] Marianne Busch. SecEval – Further Information and Figures. http://www.pst.ifi.lmu.de/˜busch/SecEval, 2014.
[Bus14b] Marianne Busch. Secure Web Engineering supported by an Evaluation Framework. InModelsward 2014. Scitepress, 2014.
[CBK13] CBK. Common Body of Knowledge. http://nessos-project.eu/cbk, 2013.
[EYZ10] Golnaz Elahi, Eric Yu, and Nicola Zannone. A vulnerability-centric requirements en-gineering framework: analyzing security attacks, countermeasures, and requirementsbased on vulnerabilities. Requirements Engineering, 15(1):41–62, 2010.
[Fou13a] OWASP Foundation. OWASP Risk Rating Methodology, 2013. https://www.
owasp.org/index.php/OWASP_Risk_Rating_Methodology.
[Fou13b] OWASP Foundation. OWASP Top 10 – 2013, 2013. http://owasptop10.
googlecode.com/files/OWASPTop10-2013.pdf.
[HWP+13] Thorsten Humberg, Christian Wessel, Daniel Poggenpohl, Sven Wenzel, ThomasRuhroth, and Jan Jurjens. Ontology-Based Analysis of Compliance and RegulatoryRequirements of Business Processes. In 3nd International Conference on Cloud Com-puting and Services Science, 2013.
[KC07] Barbara Kitchenham and Stuart Charters. Guidelines for performing Systematic Lit-erature Reviews in Software Engineering. Technical Report EBSE 2007-001, KeeleUniversity and Durham University Joint Report, 2007.
[Lac13] Christian Lacek. In-depth comparison and integration of tools for testing security fea-tures of web applications, 2013. Bachelor Thesis.
[Moo03] Daniel L. Moody. The method evaluation model: a theoretical model for validatinginformation systems design methods. In C. U. Ciborra, R. Mercurio, M. de Marco,M. Martinez, and A. Carignani, editors, ECIS, pages 1327–1336, 2003.
[Sch13] Stefanie Schreiner. Comparison of security-related tools and methods for testing soft-ware, 2013. Bachelor Thesis.
[Uni] RWTH Aachen University. i* notation. http://istar.rwth-aachen.de.
[Ver13] Verizon. Vector for hacking actions. Data Breach Investigations Report,2013. http://www.verizonenterprise.com/resources/reports/
es_data-breach-investigations-report-2013_en_xg.pdf.
[WG09] Ju An Wang and Minzhe Guo. Security Data Mining in an Ontology for VulnerabilityManagement. In Bioinformatics, Systems Biology and Intelligent Computing, 2009.IJCBS ’09. International Joint Conference on, pages 597–603, 2009.
352

P-1 Gregor Engels, Andreas Oberweis, Albert Zündorf (Hrsg.): Modellierung 2001.
P-2 Mikhail Godlevsky, Heinrich C. Mayr (Hrsg.): Information Systems Technology and its Applications, ISTA’2001.
P-3 Ana M. Moreno, Reind P. van de Riet (Hrsg.): Applications of Natural Lan-guage to Information Systems, NLDB’2001.
P-4 H. Wörn, J. Mühling, C. Vahl, H.-P. Meinzer (Hrsg.): Rechner- und sensor-gestützte Chirurgie; Workshop des SFB 414.
P-5 Andy Schürr (Hg.): OMER – Object-Oriented Modeling of Embedded Real-Time Systems.
P-6 Hans-Jürgen Appelrath, Rolf Beyer, Uwe Marquardt, Heinrich C. Mayr, Claudia Steinberger (Hrsg.): Unternehmen Hoch-schule, UH’2001.
P-7 Andy Evans, Robert France, Ana Moreira, Bernhard Rumpe (Hrsg.): Practical UML-Based Rigorous Development Methods – Countering or Integrating the extremists, pUML’2001.
P-8 Reinhard Keil-Slawik, Johannes Magen-heim (Hrsg.): Informatikunterricht und Medienbildung, INFOS’2001.
P-9 Jan von Knop, Wilhelm Haverkamp (Hrsg.): Innovative Anwendungen in Kommunikationsnetzen, 15. DFN Arbeits-tagung.
P-10 Mirjam Minor, Steffen Staab (Hrsg.): 1st German Workshop on Experience Man-agement: Sharing Experiences about the Sharing Experience.
P-11 Michael Weber, Frank Kargl (Hrsg.): Mobile Ad-Hoc Netzwerke, WMAN 2002.
P-12 Martin Glinz, Günther Müller-Luschnat (Hrsg.): Modellierung 2002.
P-13 Jan von Knop, Peter Schirmbacher and Viljan Mahni_ (Hrsg.): The Changing Universities – The Role of Technology.
P-14 Robert Tolksdorf, Rainer Eckstein (Hrsg.): XML-Technologien für das Se-mantic Web – XSW 2002.
P-15 Hans-Bernd Bludau, Andreas Koop (Hrsg.): Mobile Computing in Medicine.
P-16 J. Felix Hampe, Gerhard Schwabe (Hrsg.): Mobile and Collaborative Busi-ness 2002.
P-17 Jan von Knop, Wilhelm Haverkamp (Hrsg.): Zukunft der Netze –Die Verletz-barkeit meistern, 16. DFN Arbeitstagung.
P-18 Elmar J. Sinz, Markus Plaha (Hrsg.): Modellierung betrieblicher Informations-systeme – MobIS 2002.
P-19 Sigrid Schubert, Bernd Reusch, Norbert Jesse (Hrsg.): Informatik bewegt – Infor-matik 2002 – 32. Jahrestagung der Gesell-schaft für Informatik e.V. (GI) 30.Sept.-3.Okt. 2002 in Dortmund.
P-20 Sigrid Schubert, Bernd Reusch, Norbert Jesse (Hrsg.): Informatik bewegt – Infor-matik 2002 – 32. Jahrestagung der Gesell-schaft für Informatik e.V. (GI) 30.Sept.-3.Okt. 2002 in Dortmund (Ergänzungs-band).
P-21 Jörg Desel, Mathias Weske (Hrsg.): Promise 2002: Prozessorientierte Metho-den und Werkzeuge für die Entwicklung von Informationssystemen.
P-22 Sigrid Schubert, Johannes Magenheim, Peter Hubwieser, Torsten Brinda (Hrsg.): Forschungsbeiträge zur “Didaktik der Informatik” – Theorie, Praxis, Evaluation.
P-23 Thorsten Spitta, Jens Borchers, Harry M. Sneed (Hrsg.): Software Management 2002 – Fortschritt durch Beständigkeit
P-24 Rainer Eckstein, Robert Tolksdorf (Hrsg.): XMIDX 2003 – XML-Technologien für Middleware – Middle-ware für XML-Anwendungen
P-25 Key Pousttchi, Klaus Turowski (Hrsg.): Mobile Commerce – Anwendungen und Perspektiven – 3. Workshop Mobile Commerce, Universität Augsburg, 04.02.2003
P-26 Gerhard Weikum, Harald Schöning, Erhard Rahm (Hrsg.): BTW 2003: Daten-banksysteme für Business, Technologie und Web
P-27 Michael Kroll, Hans-Gerd Lipinski, Kay Melzer (Hrsg.): Mobiles Computing in der Medizin
P-28 Ulrich Reimer, Andreas Abecker, Steffen Staab, Gerd Stumme (Hrsg.): WM 2003: Professionelles Wissensmanagement – Er-fahrungen und Visionen
P-29 Antje Düsterhöft, Bernhard Thalheim (Eds.): NLDB’2003: Natural Language Processing and Information Systems
P-30 Mikhail Godlevsky, Stephen Liddle, Heinrich C. Mayr (Eds.): Information Systems Technology and its Applications
P-31 Arslan Brömme, Christoph Busch (Eds.): BIOSIG 2003: Biometrics and Electronic Signatures
GI-Edition Lecture Notes in Informatics

P-32 Peter Hubwieser (Hrsg.): Informatische Fachkonzepte im Unterricht – INFOS 2003
P-33 Andreas Geyer-Schulz, Alfred Taudes (Hrsg.): Informationswirtschaft: Ein Sektor mit Zukunft
P-34 Klaus Dittrich, Wolfgang König, Andreas Oberweis, Kai Rannenberg, Wolfgang Wahlster (Hrsg.): Informatik 2003 – Innovative Informatikanwendungen (Band 1)
P-35 Klaus Dittrich, Wolfgang König, Andreas Oberweis, Kai Rannenberg, Wolfgang Wahlster (Hrsg.): Informatik 2003 – Innovative Informatikanwendungen (Band 2)
P-36 Rüdiger Grimm, Hubert B. Keller, Kai Rannenberg (Hrsg.): Informatik 2003 – Mit Sicherheit Informatik
P-37 Arndt Bode, Jörg Desel, Sabine Rath-mayer, Martin Wessner (Hrsg.): DeLFI 2003: e-Learning Fachtagung Informatik
P-38 E.J. Sinz, M. Plaha, P. Neckel (Hrsg.): Modellierung betrieblicher Informations-systeme – MobIS 2003
P-39 Jens Nedon, Sandra Frings, Oliver Göbel (Hrsg.): IT-Incident Management & IT-Forensics – IMF 2003
P-40 Michael Rebstock (Hrsg.): Modellierung betrieblicher Informationssysteme – Mo-bIS 2004
P-41 Uwe Brinkschulte, Jürgen Becker, Diet-mar Fey, Karl-Erwin Großpietsch, Chris-tian Hochberger, Erik Maehle, Thomas Runkler (Edts.): ARCS 2004 – Organic and Pervasive Computing
P-42 Key Pousttchi, Klaus Turowski (Hrsg.): Mobile Economy – Transaktionen und Prozesse, Anwendungen und Dienste
P-43 Birgitta König-Ries, Michael Klein, Philipp Obreiter (Hrsg.): Persistance, Scalability, Transactions – Database Me-chanisms for Mobile Applications
P-44 Jan von Knop, Wilhelm Haverkamp, Eike Jessen (Hrsg.): Security, E-Learning. E-Services
P-45 Bernhard Rumpe, Wofgang Hesse (Hrsg.): Modellierung 2004
P-46 Ulrich Flegel, Michael Meier (Hrsg.): Detection of Intrusions of Malware & Vulnerability Assessment
P-47 Alexander Prosser, Robert Krimmer (Hrsg.): Electronic Voting in Europe – Technology, Law, Politics and Society
P-48 Anatoly Doroshenko, Terry Halpin, Stephen W. Liddle, Heinrich C. Mayr (Hrsg.): Information Systems Technology and its Applications
P-49 G. Schiefer, P. Wagner, M. Morgenstern, U. Rickert (Hrsg.): Integration und Daten-sicherheit – Anforderungen, Konflikte und Perspektiven
P-50 Peter Dadam, Manfred Reichert (Hrsg.): INFORMATIK 2004 – Informatik ver-bindet (Band 1) Beiträge der 34. Jahresta-gung der Gesellschaft für Informatik e.V. (GI), 20.-24. September 2004 in Ulm
P-51 Peter Dadam, Manfred Reichert (Hrsg.): INFORMATIK 2004 – Informatik ver-bindet (Band 2) Beiträge der 34. Jahresta-gung der Gesellschaft für Informatik e.V. (GI), 20.-24. September 2004 in Ulm
P-52 Gregor Engels, Silke Seehusen (Hrsg.): DELFI 2004 – Tagungsband der 2. e-Learning Fachtagung Informatik
P-53 Robert Giegerich, Jens Stoye (Hrsg.): German Conference on Bioinformatics – GCB 2004
P-54 Jens Borchers, Ralf Kneuper (Hrsg.): Softwaremanagement 2004 – Outsourcing und Integration
P-55 Jan von Knop, Wilhelm Haverkamp, Eike Jessen (Hrsg.): E-Science und Grid Ad-hoc-Netze Medienintegration
P-56 Fernand Feltz, Andreas Oberweis, Benoit Otjacques (Hrsg.): EMISA 2004 – Infor-mationssysteme im E-Business und E-Government
P-57 Klaus Turowski (Hrsg.): Architekturen, Komponenten, Anwendungen
P-58 Sami Beydeda, Volker Gruhn, Johannes Mayer, Ralf Reussner, Franz Schweiggert (Hrsg.): Testing of Component-Based Systems and Software Quality
P-59 J. Felix Hampe, Franz Lehner, Key Pousttchi, Kai Ranneberg, Klaus Turowski (Hrsg.): Mobile Business – Processes, Platforms, Payments
P-60 Steffen Friedrich (Hrsg.): Unterrichtskon-zepte für inforrmatische Bildung
P-61 Paul Müller, Reinhard Gotzhein, Jens B. Schmitt (Hrsg.): Kommunikation in ver-teilten Systemen
P-62 Federrath, Hannes (Hrsg.): „Sicherheit 2005“ – Sicherheit – Schutz und Zuver-lässigkeit
P-63 Roland Kaschek, Heinrich C. Mayr, Stephen Liddle (Hrsg.): Information Sys-tems – Technology and ist Applications
P-64 Peter Liggesmeyer, Klaus Pohl, Michael Goedicke (Hrsg.): Software Engineering 2005
P-65 Gottfried Vossen, Frank Leymann, Peter Lockemann, Wolffried Stucky (Hrsg.): Datenbanksysteme in Business, Techno-logie und Web
P-66 Jörg M. Haake, Ulrike Lucke, Djamshid Tavangarian (Hrsg.): DeLFI 2005: 3. deutsche e-Learning Fachtagung Infor-matik
P-67 Armin B. Cremers, Rainer Manthey, Peter Martini, Volker Steinhage (Hrsg.): INFORMATIK 2005 – Informatik LIVE (Band 1)
P-68 Armin B. Cremers, Rainer Manthey, Peter Martini, Volker Steinhage (Hrsg.): INFORMATIK 2005 – Informatik LIVE (Band 2)
P-69 Robert Hirschfeld, Ryszard Kowalcyk, Andreas Polze, Matthias Weske (Hrsg.): NODe 2005, GSEM 2005
P-70 Klaus Turowski, Johannes-Maria Zaha (Hrsg.): Component-oriented Enterprise Application (COAE 2005)
P-71 Andrew Torda, Stefan Kurz, Matthias Rarey (Hrsg.): German Conference on Bioinformatics 2005
P-72 Klaus P. Jantke, Klaus-Peter Fähnrich, Wolfgang S. Wittig (Hrsg.): Marktplatz Internet: Von e-Learning bis e-Payment
P-73 Jan von Knop, Wilhelm Haverkamp, Eike Jessen (Hrsg.): “Heute schon das Morgen sehen“
P-74 Christopher Wolf, Stefan Lucks, Po-Wah Yau (Hrsg.): WEWoRC 2005 – Western European Workshop on Research in Cryptology
P-75 Jörg Desel, Ulrich Frank (Hrsg.): Enter-prise Modelling and Information Systems Architecture
P-76 Thomas Kirste, Birgitta König-Riess, Key Pousttchi, Klaus Turowski (Hrsg.): Mo-bile Informationssysteme – Potentiale, Hindernisse, Einsatz
P-77 Jana Dittmann (Hrsg.): SICHERHEIT 2006
P-78 K.-O. Wenkel, P. Wagner, M. Morgens-tern, K. Luzi, P. Eisermann (Hrsg.): Land- und Ernährungswirtschaft im Wandel
P-79 Bettina Biel, Matthias Book, Volker Gruhn (Hrsg.): Softwareengineering 2006
P-80 Mareike Schoop, Christian Huemer, Michael Rebstock, Martin Bichler (Hrsg.): Service-Oriented Electronic Commerce
P-81 Wolfgang Karl, Jürgen Becker, Karl-Erwin Großpietsch, Christian Hochberger, Erik Maehle (Hrsg.): ARCS´06
P-82 Heinrich C. Mayr, Ruth Breu (Hrsg.): Modellierung 2006
P-83 Daniel Huson, Oliver Kohlbacher, Andrei Lupas, Kay Nieselt and Andreas Zell (eds.): German Conference on Bioinfor-matics
P-84 Dimitris Karagiannis, Heinrich C. Mayr, (Hrsg.): Information Systems Technology and its Applications
P-85 Witold Abramowicz, Heinrich C. Mayr, (Hrsg.): Business Information Systems
P-86 Robert Krimmer (Ed.): Electronic Voting 2006
P-87 Max Mühlhäuser, Guido Rößling, Ralf Steinmetz (Hrsg.): DELFI 2006: 4. e-Learning Fachtagung Informatik
P-88 Robert Hirschfeld, Andreas Polze, Ryszard Kowalczyk (Hrsg.): NODe 2006, GSEM 2006
P-90 Joachim Schelp, Robert Winter, Ulrich Frank, Bodo Rieger, Klaus Turowski (Hrsg.): Integration, Informationslogistik und Architektur
P-91 Henrik Stormer, Andreas Meier, Michael Schumacher (Eds.): European Conference on eHealth 2006
P-92 Fernand Feltz, Benoît Otjacques, Andreas Oberweis, Nicolas Poussing (Eds.): AIM 2006
P-93 Christian Hochberger, Rüdiger Liskowsky (Eds.): INFORMATIK 2006 – Informatik für Menschen, Band 1
P-94 Christian Hochberger, Rüdiger Liskowsky (Eds.): INFORMATIK 2006 – Informatik für Menschen, Band 2
P-95 Matthias Weske, Markus Nüttgens (Eds.): EMISA 2005: Methoden, Konzepte und Technologien für die Entwicklung von dienstbasierten Informationssystemen
P-96 Saartje Brockmans, Jürgen Jung, York Sure (Eds.): Meta-Modelling and Ontolo-gies
P-97 Oliver Göbel, Dirk Schadt, Sandra Frings, Hardo Hase, Detlef Günther, Jens Nedon (Eds.): IT-Incident Mangament & IT-Forensics – IMF 2006

P-98 Hans Brandt-Pook, Werner Simonsmeier und Thorsten Spitta (Hrsg.): Beratung in der Softwareentwicklung – Modelle, Methoden, Best Practices
P-99 Andreas Schwill, Carsten Schulte, Marco Thomas (Hrsg.): Didaktik der Informatik
P-100 Peter Forbrig, Günter Siegel, Markus Schneider (Hrsg.): HDI 2006: Hochschul-didaktik der Informatik
P-101 Stefan Böttinger, Ludwig Theuvsen, Susanne Rank, Marlies Morgenstern (Hrsg.): Agrarinformatik im Spannungsfeld zwischen Regionalisierung und globalen Wertschöpfungsketten
P-102 Otto Spaniol (Eds.): Mobile Services and Personalized Environments
P-103 Alfons Kemper, Harald Schöning, Thomas Rose, Matthias Jarke, Thomas Seidl, Christoph Quix, Christoph Brochhaus (Hrsg.): Datenbanksysteme in Business, Technologie und Web (BTW 2007)
P-104 Birgitta König-Ries, Franz Lehner, Rainer Malaka, Can Türker (Hrsg.) MMS 2007: Mobilität und mobile Informationssysteme
P-105 Wolf-Gideon Bleek, Jörg Raasch, Heinz Züllighoven (Hrsg.) Software Engineering 2007
P-106 Wolf-Gideon Bleek, Henning Schwentner, Heinz Züllighoven (Hrsg.) Software Engineering 2007 – Beiträge zu den Workshops
P-107 Heinrich C. Mayr, Dimitris Karagiannis (eds.) Information Systems Technology and its Applications
P-108 Arslan Brömme, Christoph Busch, Detlef Hühnlein (eds.) BIOSIG 2007: Biometrics and Electronic Signatures
P-109 Rainer Koschke, Otthein Herzog, Karl-Heinz Rödiger, Marc Ronthaler (Hrsg.) INFORMATIK 2007 Informatik trifft Logistik Band 1
P-110 Rainer Koschke, Otthein Herzog, Karl-Heinz Rödiger, Marc Ronthaler (Hrsg.) INFORMATIK 2007 Informatik trifft Logistik Band 2
P-111 Christian Eibl, Johannes Magenheim, Sigrid Schubert, Martin Wessner (Hrsg.) DeLFI 2007: 5. e-Learning Fachtagung Informatik
P-112 Sigrid Schubert (Hrsg.) Didaktik der Informatik in Theorie und Praxis
P-113 Sören Auer, Christian Bizer, Claudia Müller, Anna V. Zhdanova (Eds.) The Social Semantic Web 2007 Proceedings of the 1st Conference on Social Semantic Web (CSSW)
P-114 Sandra Frings, Oliver Göbel, Detlef Günther, Hardo G. Hase, Jens Nedon, Dirk Schadt, Arslan Brömme (Eds.) IMF2007 IT-incident management & IT-forensics Proceedings of the 3rd International Conference on IT-Incident Management & IT-Forensics
P-115 Claudia Falter, Alexander Schliep, Joachim Selbig, Martin Vingron and Dirk Walther (Eds.) German conference on bioinformatics GCB 2007
P-116 Witold Abramowicz, Leszek Maciszek (Eds.) Business Process and Services Computing 1st International Working Conference on Business Process and Services Computing BPSC 2007
P-117 Ryszard Kowalczyk (Ed.) Grid service engineering and manegement The 4th International Conference on Grid Service Engineering and Management GSEM 2007
P-118 Andreas Hein, Wilfried Thoben, Hans-Jürgen Appelrath, Peter Jensch (Eds.) European Conference on ehealth 2007
P-119 Manfred Reichert, Stefan Strecker, Klaus Turowski (Eds.) Enterprise Modelling and Information Systems Architectures Concepts and Applications
P-120 Adam Pawlak, Kurt Sandkuhl, Wojciech Cholewa, Leandro Soares Indrusiak (Eds.) Coordination of Collaborative Engineering - State of the Art and Future Challenges
P-121 Korbinian Herrmann, Bernd Bruegge (Hrsg.) Software Engineering 2008 Fachtagung des GI-Fachbereichs Softwaretechnik
P-122 Walid Maalej, Bernd Bruegge (Hrsg.) Software Engineering 2008 - Workshopband Fachtagung des GI-Fachbereichs Softwaretechnik

P-123 Michael H. Breitner, Martin Breunig, Elgar Fleisch, Ley Pousttchi, Klaus Turowski (Hrsg.) Mobile und Ubiquitäre Informationssysteme – Technologien, Prozesse, Marktfähigkeit Proceedings zur 3. Konferenz Mobile und Ubiquitäre Informationssysteme (MMS 2008)
P-124 Wolfgang E. Nagel, Rolf Hoffmann, Andreas Koch (Eds.) 9th Workshop on Parallel Systems and Algorithms (PASA) Workshop of the GI/ITG Speciel Interest Groups PARS and PARVA
P-125 Rolf A.E. Müller, Hans-H. Sundermeier, Ludwig Theuvsen, Stephanie Schütze, Marlies Morgenstern (Hrsg.) Unternehmens-IT: Führungsinstrument oder Verwaltungsbürde Referate der 28. GIL Jahrestagung
P-126 Rainer Gimnich, Uwe Kaiser, Jochen Quante, Andreas Winter (Hrsg.) 10th Workshop Software Reengineering (WSR 2008)
P-127 Thomas Kühne, Wolfgang Reisig, Friedrich Steimann (Hrsg.) Modellierung 2008
P-128 Ammar Alkassar, Jörg Siekmann (Hrsg.) Sicherheit 2008 Sicherheit, Schutz und Zuverlässigkeit Beiträge der 4. Jahrestagung des Fachbereichs Sicherheit der Gesellschaft für Informatik e.V. (GI) 2.-4. April 2008 Saarbrücken, Germany
P-129 Wolfgang Hesse, Andreas Oberweis (Eds.) Sigsand-Europe 2008 Proceedings of the Third AIS SIGSAND European Symposium on Analysis, Design, Use and Societal Impact of Information Systems
P-130 Paul Müller, Bernhard Neumair, Gabi Dreo Rodosek (Hrsg.) 1. DFN-Forum Kommunikations-technologien Beiträge der Fachtagung
P-131 Robert Krimmer, Rüdiger Grimm (Eds.) 3rd International Conference on Electronic Voting 2008 Co-organized by Council of Europe, Gesellschaft für Informatik and E-Voting.CC
P-132 Silke Seehusen, Ulrike Lucke, Stefan Fischer (Hrsg.) DeLFI 2008: Die 6. e-Learning Fachtagung Informatik
P-133 Heinz-Gerd Hegering, Axel Lehmann, Hans Jürgen Ohlbach, Christian Scheideler (Hrsg.) INFORMATIK 2008 Beherrschbare Systeme – dank Informatik Band 1
P-134 Heinz-Gerd Hegering, Axel Lehmann, Hans Jürgen Ohlbach, Christian Scheideler (Hrsg.) INFORMATIK 2008 Beherrschbare Systeme – dank Informatik Band 2
P-135 Torsten Brinda, Michael Fothe, Peter Hubwieser, Kirsten Schlüter (Hrsg.) Didaktik der Informatik – Aktuelle Forschungsergebnisse
P-136 Andreas Beyer, Michael Schroeder (Eds.) German Conference on Bioinformatics GCB 2008
P-137 Arslan Brömme, Christoph Busch, Detlef Hühnlein (Eds.) BIOSIG 2008: Biometrics and Electronic Signatures
P-138 Barbara Dinter, Robert Winter, Peter Chamoni, Norbert Gronau, Klaus Turowski (Hrsg.) Synergien durch Integration und Informationslogistik Proceedings zur DW2008
P-139 Georg Herzwurm, Martin Mikusz (Hrsg.) Industrialisierung des Software-Managements Fachtagung des GI-Fachausschusses Management der Anwendungs entwick-lung und -wartung im Fachbereich Wirtschaftsinformatik
P-140 Oliver Göbel, Sandra Frings, Detlef Günther, Jens Nedon, Dirk Schadt (Eds.) IMF 2008 - IT Incident Management & IT Forensics
P-141 Peter Loos, Markus Nüttgens, Klaus Turowski, Dirk Werth (Hrsg.) Modellierung betrieblicher Informations-systeme (MobIS 2008) Modellierung zwischen SOA und Compliance Management
P-142 R. Bill, P. Korduan, L. Theuvsen, M. Morgenstern (Hrsg.) Anforderungen an die Agrarinformatik durch Globalisierung und Klimaveränderung
P-143 Peter Liggesmeyer, Gregor Engels, Jürgen Münch, Jörg Dörr, Norman Riegel (Hrsg.) Software Engineering 2009 Fachtagung des GI-Fachbereichs Softwaretechnik

P-144 Johann-Christoph Freytag, Thomas Ruf, Wolfgang Lehner, Gottfried Vossen (Hrsg.) Datenbanksysteme in Business, Technologie und Web (BTW)
P-145 Knut Hinkelmann, Holger Wache (Eds.) WM2009: 5th Conference on Professional Knowledge Management
P-146 Markus Bick, Martin Breunig, Hagen Höpfner (Hrsg.) Mobile und Ubiquitäre Informationssysteme – Entwicklung, Implementierung und Anwendung 4. Konferenz Mobile und Ubiquitäre Informationssysteme (MMS 2009)
P-147 Witold Abramowicz, Leszek Maciaszek, Ryszard Kowalczyk, Andreas Speck (Eds.) Business Process, Services Computing and Intelligent Service Management BPSC 2009 · ISM 2009 · YRW-MBP 2009
P-148 Christian Erfurth, Gerald Eichler, Volkmar Schau (Eds.) 9th International Conference on Innovative Internet Community Systems I2CS 2009
P-149 Paul Müller, Bernhard Neumair, Gabi Dreo Rodosek (Hrsg.) 2. DFN-Forum Kommunikationstechnologien Beiträge der Fachtagung
P-150 Jürgen Münch, Peter Liggesmeyer (Hrsg.) Software Engineering 2009 - Workshopband
P-151 Armin Heinzl, Peter Dadam, Stefan Kirn, Peter Lockemann (Eds.) PRIMIUM Process Innovation for Enterprise Software
P-152 Jan Mendling, Stefanie Rinderle-Ma, Werner Esswein (Eds.) Enterprise Modelling and Information
Systems Architectures Proceedings of the 3rd Int‘l Workshop
EMISA 2009
P-153 Andreas Schwill, Nicolas Apostolopoulos (Hrsg.) Lernen im Digitalen Zeitalter DeLFI 2009 – Die 7. E-Learning Fachtagung Informatik
P-154 Stefan Fischer, Erik Maehle Rüdiger Reischuk (Hrsg.) INFORMATIK 2009 Im Focus das Leben
P-155 Arslan Brömme, Christoph Busch, Detlef Hühnlein (Eds.) BIOSIG 2009: Biometrics and Electronic Signatures Proceedings of the Special Interest Group on Biometrics and Electronic Signatures
P-156 Bernhard Koerber (Hrsg.) Zukunft braucht Herkunft 25 Jahre »INFOS – Informatik und Schule«
P-157 Ivo Grosse, Steffen Neumann, Stefan Posch, Falk Schreiber, Peter Stadler (Eds.) German Conference on Bioinformatics 2009
P-158 W. Claupein, L. Theuvsen, A. Kämpf, M. Morgenstern (Hrsg.) Precision Agriculture Reloaded – Informationsgestützte Landwirtschaft
P-159 Gregor Engels, Markus Luckey, Wilhelm Schäfer (Hrsg.) Software Engineering 2010
P-160 Gregor Engels, Markus Luckey, Alexander Pretschner, Ralf Reussner (Hrsg.) Software Engineering 2010 – Workshopband (inkl. Doktorandensymposium)
P-161 Gregor Engels, Dimitris Karagiannis Heinrich C. Mayr (Hrsg.) Modellierung 2010
P-162 Maria A. Wimmer, Uwe Brinkhoff, Siegfried Kaiser, Dagmar Lück-Schneider, Erich Schweighofer, Andreas Wiebe (Hrsg.) Vernetzte IT für einen effektiven Staat Gemeinsame Fachtagung Verwaltungsinformatik (FTVI) und Fachtagung Rechtsinformatik (FTRI) 2010
P-163 Markus Bick, Stefan Eulgem, Elgar Fleisch, J. Felix Hampe, Birgitta König-Ries, Franz Lehner, Key Pousttchi, Kai Rannenberg (Hrsg.) Mobile und Ubiquitäre Informationssysteme Technologien, Anwendungen und Dienste zur Unterstützung von mobiler Kollaboration
P-164 Arslan Brömme, Christoph Busch (Eds.) BIOSIG 2010: Biometrics and Electronic Signatures Proceedings of the Special Interest Group on Biometrics and Electronic Signatures

P-165 Gerald Eichler, Peter Kropf, Ulrike Lechner, Phayung Meesad, Herwig Unger (Eds.) 10th International Conference on Innovative Internet Community Systems (I2CS) – Jubilee Edition 2010 –
P-166 Paul Müller, Bernhard Neumair, Gabi Dreo Rodosek (Hrsg.) 3. DFN-Forum Kommunikationstechnologien Beiträge der Fachtagung
P-167 Robert Krimmer, Rüdiger Grimm (Eds.) 4th International Conference on Electronic Voting 2010 co-organized by the Council of Europe, Gesellschaft für Informatik and E-Voting.CC
P-168 Ira Diethelm, Christina Dörge, Claudia Hildebrandt, Carsten Schulte (Hrsg.) Didaktik der Informatik Möglichkeiten empirischer Forschungsmethoden und Perspektiven der Fachdidaktik
P-169 Michael Kerres, Nadine Ojstersek Ulrik Schroeder, Ulrich Hoppe (Hrsg.) DeLFI 2010 - 8. Tagung der Fachgruppe E-Learning der Gesellschaft für Informatik e.V.
P-170 Felix C. Freiling (Hrsg.) Sicherheit 2010 Sicherheit, Schutz und Zuverlässigkeit
P-171 Werner Esswein, Klaus Turowski, Martin Juhrisch (Hrsg.) Modellierung betrieblicher Informationssysteme (MobIS 2010) Modellgestütztes Management
P-172 Stefan Klink, Agnes Koschmider Marco Mevius, Andreas Oberweis (Hrsg.) EMISA 2010 Einflussfaktoren auf die Entwicklung flexibler, integrierter Informationssysteme Beiträge des Workshops der GI-Fachgruppe EMISA (Entwicklungsmethoden für Infor- mationssysteme und deren Anwendung)
P-173 Dietmar Schomburg, Andreas Grote (Eds.) German Conference on Bioinformatics 2010
P-174 Arslan Brömme, Torsten Eymann, Detlef Hühnlein, Heiko Roßnagel, Paul Schmücker (Hrsg.) perspeGKtive 2010 Workshop „Innovative und sichere Informationstechnologie für das Gesundheitswesen von morgen“
P-175 Klaus-Peter Fähnrich, Bogdan Franczyk (Hrsg.) INFORMATIK 2010 Service Science – Neue Perspektiven für die Informatik Band 1
P-176 Klaus-Peter Fähnrich, Bogdan Franczyk (Hrsg.) INFORMATIK 2010 Service Science – Neue Perspektiven für die Informatik Band 2
P-177 Witold Abramowicz, Rainer Alt, Klaus-Peter Fähnrich, Bogdan Franczyk, Leszek A. Maciaszek (Eds.) INFORMATIK 2010 Business Process and Service Science – Proceedings of ISSS and BPSC
P-178 Wolfram Pietsch, Benedikt Krams (Hrsg.) Vom Projekt zum Produkt Fachtagung des GI-
Fachausschusses Management der Anwendungsentwicklung und -wartung im Fachbereich Wirtschafts-informatik (WI-MAW), Aachen, 2010
P-179 Stefan Gruner, Bernhard Rumpe (Eds.) FM+AM`2010 Second International Workshop on Formal Methods and Agile Methods
P-180 Theo Härder, Wolfgang Lehner, Bernhard Mitschang, Harald Schöning, Holger Schwarz (Hrsg.) Datenbanksysteme für Business, Technologie und Web (BTW) 14. Fachtagung des GI-Fachbereichs „Datenbanken und Informationssysteme“ (DBIS)
P-181 Michael Clasen, Otto Schätzel, Brigitte Theuvsen (Hrsg.) Qualität und Effizienz durch informationsgestützte Landwirtschaft, Fokus: Moderne Weinwirtschaft
P-182 Ronald Maier (Hrsg.) 6th Conference on Professional Knowledge Management From Knowledge to Action
P-183 Ralf Reussner, Matthias Grund, Andreas Oberweis, Walter Tichy (Hrsg.) Software Engineering 2011 Fachtagung des GI-Fachbereichs Softwaretechnik
P-184 Ralf Reussner, Alexander Pretschner, Stefan Jähnichen (Hrsg.) Software Engineering 2011 Workshopband (inkl. Doktorandensymposium)

P-185 Hagen Höpfner, Günther Specht, Thomas Ritz, Christian Bunse (Hrsg.) MMS 2011: Mobile und ubiquitäre Informationssysteme Proceedings zur 6. Konferenz Mobile und Ubiquitäre Informationssysteme (MMS 2011)
P-186 Gerald Eichler, Axel Küpper, Volkmar Schau, Hacène Fouchal, Herwig Unger (Eds.) 11th International Conference on Innovative Internet Community Systems (I2CS)
P-187 Paul Müller, Bernhard Neumair, Gabi Dreo Rodosek (Hrsg.) 4. DFN-Forum Kommunikations- technologien, Beiträge der Fachtagung 20. Juni bis 21. Juni 2011 Bonn
P-188 Holger Rohland, Andrea Kienle, Steffen Friedrich (Hrsg.) DeLFI 2011 – Die 9. e-Learning Fachtagung Informatik der Gesellschaft für Informatik e.V. 5.–8. September 2011, Dresden
P-189 Thomas, Marco (Hrsg.) Informatik in Bildung und Beruf INFOS 2011 14. GI-Fachtagung Informatik und Schule
P-190 Markus Nüttgens, Oliver Thomas, Barbara Weber (Eds.) Enterprise Modelling and Information Systems Architectures (EMISA 2011)
P-191 Arslan Brömme, Christoph Busch (Eds.) BIOSIG 2011 International Conference of the Biometrics Special Interest Group
P-192 Hans-Ulrich Heiß, Peter Pepper, Holger Schlingloff, Jörg Schneider (Hrsg.) INFORMATIK 2011 Informatik schafft Communities
P-193 Wolfgang Lehner, Gunther Piller (Hrsg.) IMDM 2011
P-194 M. Clasen, G. Fröhlich, H. Bernhardt, K. Hildebrand, B. Theuvsen (Hrsg.) Informationstechnologie für eine nachhaltige Landbewirtschaftung Fokus Forstwirtschaft
P-195 Neeraj Suri, Michael Waidner (Hrsg.) Sicherheit 2012 Sicherheit, Schutz und Zuverlässigkeit Beiträge der 6. Jahrestagung des Fachbereichs Sicherheit der Gesellschaft für Informatik e.V. (GI)
P-196 Arslan Brömme, Christoph Busch (Eds.)BIOSIG 2012 Proceedings of the 11th International Conference of the Biometrics Special Interest Group
P-197 Jörn von Lucke, Christian P. Geiger, Siegfried Kaiser, Erich Schweighofer, Maria A. Wimmer (Hrsg.) Auf dem Weg zu einer offenen, smarten und vernetzten Verwaltungskultur Gemeinsame Fachtagung Verwaltungsinformatik (FTVI) und Fachtagung Rechtsinformatik (FTRI) 2012
P-198 Stefan Jähnichen, Axel Küpper, Sahin Albayrak (Hrsg.) Software Engineering 2012 Fachtagung des GI-Fachbereichs Softwaretechnik
P-199 Stefan Jähnichen, Bernhard Rumpe, Holger Schlingloff (Hrsg.) Software Engineering 2012 Workshopband
P-200 Gero Mühl, Jan Richling, Andreas Herkersdorf (Hrsg.) ARCS 2012 Workshops
P-201 Elmar J. Sinz Andy Schürr (Hrsg.) Modellierung 2012
P-202 Andrea Back, Markus Bick, Martin Breunig, Key Pousttchi, Frédéric Thiesse (Hrsg.) MMS 2012:Mobile und Ubiquitäre Informationssysteme
P-203 Paul Müller, Bernhard Neumair, Helmut Reiser, Gabi Dreo Rodosek (Hrsg.) 5. DFN-Forum Kommunikations-technologien Beiträge der Fachtagung
P-204 Gerald Eichler, Leendert W. M. Wienhofen, Anders Kofod-Petersen, Herwig Unger (Eds.) 12th International Conference on Innovative Internet Community Systems (I2CS 2012)
P-205 Manuel J. Kripp, Melanie Volkamer, Rüdiger Grimm (Eds.) 5th International Conference on Electronic Voting 2012 (EVOTE2012) Co-organized by the Council of Europe, Gesellschaft für Informatik and E-Voting.CC
P-206 Stefanie Rinderle-Ma, Mathias Weske (Hrsg.) EMISA 2012 Der Mensch im Zentrum der Modellierung
P-207 Jörg Desel, Jörg M. Haake, Christian Spannagel (Hrsg.) DeLFI 2012: Die 10. e-Learning Fachtagung Informatik der Gesellschaft für Informatik e.V. 24.–26. September 2012

P-208 Ursula Goltz, Marcus Magnor, Hans-Jürgen Appelrath, Herbert Matthies, Wolf-Tilo Balke, Lars Wolf (Hrsg.) INFORMATIK 2012
P-209 Hans Brandt-Pook, André Fleer, Thorsten Spitta, Malte Wattenberg (Hrsg.) Nachhaltiges Software Management
P-210 Erhard Plödereder, Peter Dencker, Herbert Klenk, Hubert B. Keller, Silke Spitzer (Hrsg.) Automotive – Safety & Security 2012 Sicherheit und Zuverlässigkeit für automobile Informationstechnik
P-211 M. Clasen, K. C. Kersebaum, A. Meyer-Aurich, B. Theuvsen (Hrsg.)Massendatenmanagement in der Agrar- und Ernährungswirtschaft Erhebung - Verarbeitung - Nutzung Referate der 33. GIL-Jahrestagung 20. – 21. Februar 2013, Potsdam
P-212 Arslan Brömme, Christoph Busch (Eds.) BIOSIG 2013 Proceedings of the 12th International Conference of the Biometrics Special Interest Group 04.–06. September 2013 Darmstadt, Germany
P-213 Stefan Kowalewski, Bernhard Rumpe (Hrsg.) Software Engineering 2013 Fachtagung des GI-Fachbereichs Softwaretechnik
P-214 Volker Markl, Gunter Saake, Kai-Uwe Sattler, Gregor Hackenbroich, Bernhard Mit schang, Theo Härder, Veit Köppen (Hrsg.) Datenbanksysteme für Business, Technologie und Web (BTW) 2013 13. – 15. März 2013, Magdeburg
P-215 Stefan Wagner, Horst Lichter (Hrsg.)Software Engineering 2013 Workshopband (inkl. Doktorandensymposium) 26. Februar – 1. März 2013, Aachen
P-216 Gunter Saake, Andreas Henrich, Wolfgang Lehner, Thomas Neumann, Veit Köppen (Hrsg.) Datenbanksysteme für Business, Technologie und Web (BTW) 2013 –Workshopband 11. – 12. März 2013, Magdeburg
P-217 Paul Müller, Bernhard Neumair, Helmut Reiser, Gabi Dreo Rodosek (Hrsg.) 6. DFN-Forum Kommunikations- technologien Beiträge der Fachtagung 03.–04. Juni 2013, Erlangen
P-218 Andreas Breiter, Christoph Rensing (Hrsg.) DeLFI 2013: Die 11 e-Learning Fachtagung Informatik der Gesellschaft für Informatik e.V. (GI) 8. – 11. September 2013, Bremen
P-219 Norbert Breier, Peer Stechert, Thomas Wilke (Hrsg.) Informatik erweitert Horizonte INFOS 2013 15. GI-Fachtagung Informatik und Schule 26. – 28. September 2013
P-220 Matthias Horbach (Hrsg.) INFORMATIK 2013 Informatik angepasst an Mensch, Organisation und Umwelt 16. – 20. September 2013, Koblenz
P-221 Maria A. Wimmer, Marijn Janssen, Ann Macintosh, Hans Jochen Scholl, Efthimios Tambouris (Eds.) Electronic Government and Electronic Participation Joint Proceedings of Ongoing Research of IFIP EGOV and IFIP ePart 2013 16. – 19. September 2013, Koblenz
P-222 Reinhard Jung, Manfred Reichert (Eds.) Enterprise Modelling
and Information Systems Architectures (EMISA 2013)
St. Gallen, Switzerland September 5. – 6. 2013
P-223 Detlef Hühnlein, Heiko Roßnagel (Hrsg.) Open Identity Summit 2013 10. – 11. September 2013 Kloster Banz, Germany
P-224 Eckhart Hanser, Martin Mikusz, Masud Fazal-Baqaie (Hrsg.) Vorgehensmodelle 2013 Vorgehensmodelle – Anspruch und Wirklichkeit 20. Tagung der Fachgruppe Vorgehensmodelle im Fachgebiet Wirtschaftsinformatik (WI-VM) der Gesellschaft für Informatik e.V. Lörrach, 2013
P-225 Hans-Georg Fill, Dimitris Karagiannis, Ulrich Reimer (Hrsg.) Modellierung 2014 19. – 21. März 2014, Wien
P-226 M. Clasen, M. Hamer, S. Lehnert, B. Petersen, B. Theuvsen (Hrsg.) IT-Standards in der Agrar- und Ernährungswirtschaft Fokus: Risiko- und Krisenmanagement Referate der 34. GIL-Jahrestagung 24. – 25. Februar 2014, Bonn

P-227 Wilhelm Hasselbring, Nils Christian Ehmke (Hrsg.) Software Engineering 2014 Fachtagung des GI-Fachbereichs Softwaretechnik 25. – 28. Februar 2014 Kiel, Deutschland
P-228 Stefan Katzenbeisser, Volkmar Lotz, Edgar Weippl (Hrsg.) Sicherheit 2014 Sicherheit, Schutz und Zuverlässigkeit Beiträge der 7. Jahrestagung des Fachbereichs Sicherheit der Gesellschaft für Informatik e.V. (GI) 19.–21. März 2014, Wien
The titles can be purchased at:
Köllen Druck + Verlag GmbHErnst-Robert-Curtius-Str. 14 · D-53117 BonnFax: +49 (0)228/9898222E-Mail: [email protected]