30 diffusion and inhibition processes in a hollow-fiber ... · mab production25,26 in hfbr have...
TRANSCRIPT
L. Legazpi et al., Diffusion and Inhibition Processes in a Hollow-fiber Membrane…, Chem. Biochem. Eng. Q., 30 (2) 213–225 (2016) 213
Diffusion and Inhibition Processes in a Hollow-fiber Membrane Bioreactor for Hybridoma Culture. Development of a Mathematical Model
L. Legazpi,a A. Laca,b S. Collado,a A. Laca,a and M. Díaza,*
aDepartment of Chemical and Environmental Engineering, University of Oviedo, C/Julián Clavería s/n. 33071 Oviedo, SpainbScientific-Technical Services, University of Oviedo, C/Fernando Bonguera s/n. 33071 Oviedo, Spain
The performance of a hollow-fiber membrane bioreactor (HFBR) (molecular weight cut-off 30 kD, fiber surface area 2050 cm2) containing a culture of hybridoma cells has been investigated. Experimental data were used as basis to develop a model of general application. Concentrations of fundamental nutrients (glucose and glutamine), inhibitory products (ammonium and lactate), and monoclonal antibodies (MAb) against bovine lac-toferrin (IgG1) were monitored over time. Exchange of nutrients and products occurred across the capillary surface, whereas cells and MAb remained in the extra-capillary space (ECS). A protein-free culture medium (Hybrimax) with and without antibiotics was used. In both cases, the final MAb concentration was the same; however, antibiotic presence slowed down the time to achieve this concentration. Diffusion assays have been carried out in order to support the development of a mathematical model that describes the per-formance of the HFBR, including mass transfer and reaction terms. Inhibition by ammo-nium and lactate has been considered in the kinetics, providing model results consistent with experimental data. Further research with other cell lines and/or culture media will allow to broaden the field of application of this model for general use in HFBR systems.
Key words: hollow-fiber membrane bioreactor, diffusion, inhibition, hybridoma, modelling
Introduction
Hybridoma technology was developed to over-come the limitations of polyclonal antibodies (broad specificity, possible cross-reactivity or variability among immune serum batches)1. Monoclonal anti-bodies (MAb) are currently used in many applica-tions, such as the diagnosis and treatment of certain diseases and the purification of substances. The growing demand for monoclonal antibodies at rea-sonable prices means that it is necessary to carry out an optimization of their production processes2.
Since the development of cell hybridoma tech-nology, production of ascites in mice has been the primary method available for the production of large amounts of monoclonal antibodies3. However, as in vivo assays are controversial and criticized for both practical and ethical reasons, manufacturers and Official Medicines Control Laboratories are en-couraged to develop and implement alternative
methods to limit the use of such methods4. Thus, in the last decade, researchers have developed numer-ous in vitro methodologies for hybridoma culture. The development of these assays offers the benefit of replacing mice ascites, enabling the production of large amounts of monoclonal antibodies under well-controlled conditions5.
Analysis of the evolution of substrate and prod-uct concentrations is fundamental in the determina-tion of hybridoma kinetics. Glucose and glutamine are key substrates for hybridoma growth. Glucose is mainly transformed into pyruvate, while pyruvate is partially converted to lactic acid. Part of the gluta-mine is deaminated, yielding ammonium and gluta-mate, which is later transformed into other amino acids for biosynthesis purposes. Whereas glucose and glutamine are fundamental nutrients, ammoni-um and lactate are products of cell metabolism that can act as inhibitors when their concentrations are high enough6. Regarding the culture medium, the use of a protein-free medium facilitates subsequent purification of the monoclonal antibodies. Addition-ally, due to increasing safety concerns as well as cost issues, the requirements for biotechnological
*Corresponding author: [email protected]; Phone: (+34) 985 10 34 39 Fax: (+34) 985 10 34 34
doi: 10.15255/CABEQ.2015.2207
Original scientific paper Received: April 1, 2015
Accepted: May 31, 2016
L. Legazpi et al., Diffusion and Inhibition Processes in a Hollow-fiber Membrane…213–225
214 L. Legazpi et al., Diffusion and Inhibition Processes in a Hollow-fiber Membrane…, Chem. Biochem. Eng. Q., 30 (2) 213–225 (2016)
processes now include the use of media free from animal-derived components7.
As regards in vitro techniques, hybridoma cul-ture has been traditionally carried out in bags, flasks, or bottles. However, cell densities and MAb concentrations obtained in batch culture are gener-ally low8. This disadvantage is overcome by the use of hollow-fiber membrane-based bioreactors (HFBR), which allow higher antibody concentra-tions and relatively lower operating costs. For these reasons, the use of hollow-fiber cell culture technol-ogy has greatly expanded worldwide9,10
.Hollow-fiber modules provide a high surface to
volume ratio, as much as 200 cm2 per mL. This al-lows a large number of cells to aggregate in a very small volume, thus obtaining high cell densities. Jain and Kumar11 have reported cells yields up to 107–109. These authors have also stated that HFBR systems are well suited for the production of anti-bodies in semi-continuous operation in concentra-tions higher than 2 mg mL–1 day, using a protein-free medium. The main disadvantage of using a hol-low-fiber bioreactor for an extended period is that the system is prone to be contaminated during the replacement of the culture medium and recovery. Antibiotics are usually added to in vitro cell cul-tures to avoid this problem12,13. It is essential to know how antibiotics affect MAb production, how-ever there are limited works focused on this sub-ject14,15,16, and the operative mechanisms of antibiot-ics with cell metabolism are still not clear17,18. One example of the existing works is the study devel-oped by Barnabé and Butler14 who reported that MAb specific production rates were not affected by low concentrations of tunicamycin (0.01–0.1 μg mL–1), whereas higher antibiotic concentrations (1 μg mL–1) made cell viability decrease and speci-fic production rates increase, probably due to pas-sive antibody release by non-viable cells.
Furthermore, the production of monoclonal an-tibodies by means of hybridoma cell lines has be-come an important biotechnological task. The effi-ciency of these processes can be further enhanced by developing macroscopic models, which can con-stitute valuable tools to reduce time and costs of bioprocess development19. The goal in modelling complex systems, such as MAb production by hy-bridoma cells, is the development of simple models that estimate system performance with an accept-able level of accuracy.
Thus, antibodies are well established in main-stream clinical practice as well as in research ar-eas20. Additionally, in recent years, hollow-fiber membrane-based bioreactors have been reported as apt cell culture systems for therapeutic applica-tions9, such as tissue engineering21 or growing red blood cells22. Therefore, in this paper, the perfor-
mance of hybridoma cells in a HFBR system was analyzed as a case study of cell culture in a mem-brane reactor. Modelling is increasingly being used to understand bioreactor behaviour, specifically some attempts to model hybridoma growth23,24 and MAb production25,26 in HFBR have been carried out. Moreover, different authors have recently pro-posed sophisticated mathematical equations to de-scribe hybridoma metabolism and antibody produc-tion in batch cultures19,20. However, as far as we know, there are virtually no published studies that consider both hybridoma metabolism and MAb pro-duction in HFBR systems. This paper has devel-oped an easily applicable reaction-diffusion model, assuming certain simplifications based on addition-al experiments, to assess the performance of the system, i.e. conversion of substrates (glucose and glutamine) into products (lactate and ammonium), as well as MAb production with and without antibi-otics. Hence, the aim of this work was to contribute to the understanding of hybridoma culture perfor-mance in HFBR systems and, at the same time, de-velop a model of general application for cultures carried out in similar membrane bioreactors.
Materials and methods
Cell line and cell culture
The hybridoma cell line studied here was HB-8852 (American Type Culture Collection) that pro-duces IgG1 monoclonal antibodies against bovine lactoferrin. A protein-free culture medium (Hybri-max) was employed.
The cell culture was developed following the procedure described by Legazpi et al.6 Hybridoma cells were cultured in Dulbecco’s Modified Eagle’s Medium (DMEM) supplemented with 20 % (v/v) fetal bovine serum (FBS), and subsequently a grad-ual adaptation to DMEM with 10 % (v/v) FBS was carried out. The cells were then passed to Hybrimax with 10 % (v/v) FBS and adapted so as to grow in Hybrimax with 4 % (v/v) FBS. A buffer of MOPS (3-(N-morpholino)propanesulfonic acid) and bicar-bonate were employed to maintain the pH of the culture medium close to 7.2. This adaptation pro-cess was carried out in T-flasks and, once adapted to grow in Hybrimax with 4 % (v/v) FBS, 3.4 · 107 viable cells were inoculated into the HFBR ex-tra-capillary space (ECS 12 mL volume). The cells were then gradually adapted to Hybrimax without serum in four steps (3 %, 2 %, 1 %, and 0 % (v/v) FBS). This process lasted approximately 5 weeks. All the reagents were supplied by Sigma-Aldrich.
The HFBR (CELLMAX) (Thermo Fisher Sci-entific Inc., Waltham, USA) consisted of a bundle of 2565 cellulose fibers with a molecular weight
L. Legazpi et al., Diffusion and Inhibition Processes in a Hollow-fiber Membrane…, Chem. Biochem. Eng. Q., 30 (2) 213–225 (2016) 215
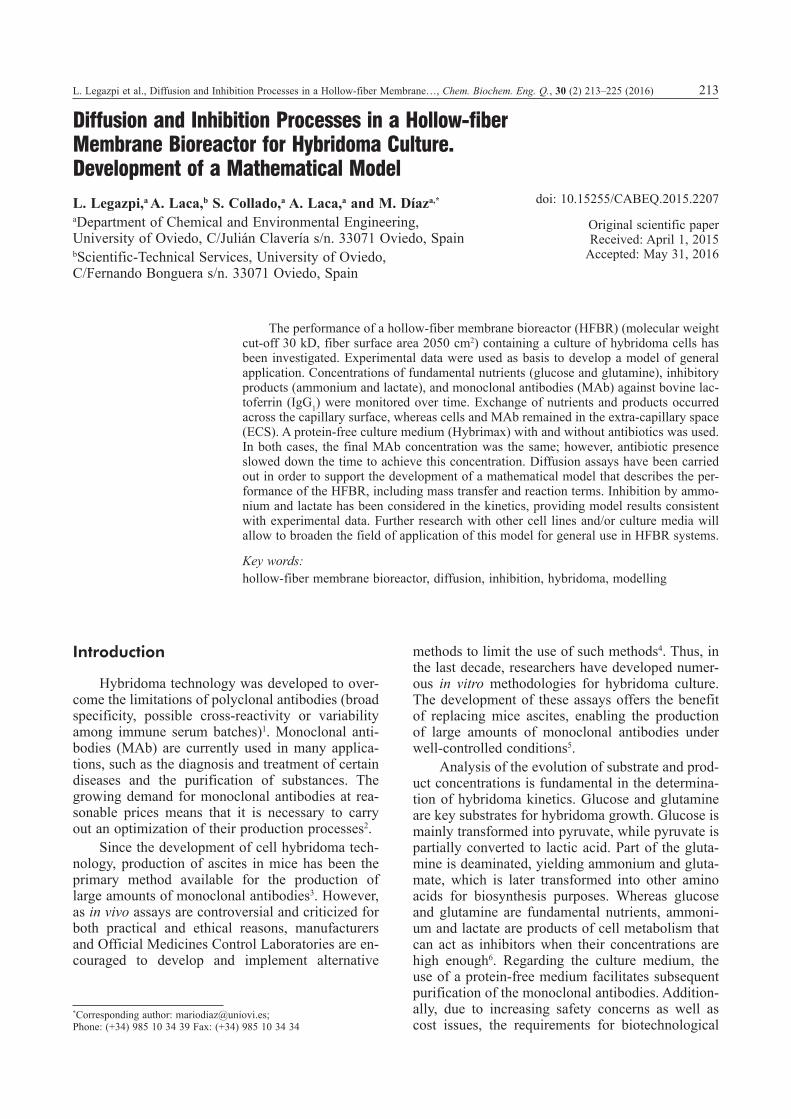
cut-off value of 30 kD, and a length of 13 cm. The fiber wall thickness was 15 μm, the internal diame-ter 180 μm, and the external diameter 210 μm. The medium was contained in a reservoir (a 500-mL bottle containing 300 mL of medium), and circulat-ed within the capillaries while the cells were grown in the ECS. Exchange of nutrients and products oc-curred across the capillary surface, whereas cells and MAb remained in the ECS (IgG size 150–170 kD). The pumping medium was continually oxy-genated, since passive gas exchange was realized by a silicone tubing device connected to the HFBR system. The flow was approximately 17 mL min–1. The operation was semi-continuous, the HFBR worked in a closed-circuit system, although the ex-hausted medium was regularly replaced by fresh Hybrimax (when the lactate concentration reached 1000–1200 ppm) (Fig. 1).
The cells were cultured in an incubator main-tained at 37 ºC with 5 % CO2 in air. The experi-ments were performed with and without antibiotics (SIGMA Penicillin-Streptomycin Solution with 10000 units penicillin and 10 mg mL–1 streptomy-cin; 1:50 dilution) (Sigma-Aldrich Corp., St. Louis, USA). When the experiment with antibiotics was completed, the medium was replaced by fresh Hy-brimax and, after a lapse of 24 hours, the experi-ment without antibiotics commenced. As explained model development section, the cell growth during the experiment was quite low and the order of magnitude in the concentration of cells was main-tained.
Analysis
Samples of 4 mL of medium were taken with a syringe from the bottle, filtered through 0.45 µm pore membranes, divided into aliquots, and frozen at –20 ºC for later analysis. This sampling size was chosen so that the change in the medium volume (~12 %) did not affect kinetic results. Glucose con-centration was determined by the dinitrosalicylic acid method (S.D. < 3 mM). Glutamine concentra-tion was determined using an enzymatic kit (SIG-MA, Ref.: GLN-2) (S.D. < 0.1 mM). Lactate was determined by ion exchange chromatography (Ion-Pac AS4A-SC column, IonPac AG4A-SC guard column) (S.D. < 0.3 mM). Ammonium concentra-tion was determined by ion exchange chromatogra-phy (IonPac CS-10 column, IonPac CG10 guard column) (S.D. < 0.1 mM). To quantify antibody IgG1, 120 μL samples were taken through the ports with a syringe from the bundle and analyzed using an enzyme-linked immunosorbent assay (ELISA) (S.D. < 3 µg mL–1). Ion exchange chromatography columns were supplied by Thermo Fisher Scientific Inc. and reagents by Sigma-Aldrich. These analysis methods are detailed in Legazpi et al.6
At the end of the culture, all cells were harvest-ed with a syringe through the sample ports of the cartridge. Dry weight was employed to quantify the final concentration of cells in the ECS.
Statistical analyses
In order to evaluate the effect of antibiotics on HFBR performance, experimental data for sub-strates (glucose and glutamine) and products (lac-tate and ammonium) were analysed by running con-trast of hypothesis tests at a 95.0 % confidence level. “The antibiotics do not affect the bioreactor performance” is the null hypothesis (H0), whereas the alternative hypothesis (H1) is “the antibiotics af-fect the bioreactor performance”. Kolmogorov- -Smir nov and Shapiro-Wilk tests were used to as-sess that all the samples came from normal distribu-tions. These analyses were performed using IBM SPSS Statistics 20 (International Business Machines Corp., New York, USA).
Diffusion assays
Nutrients passed through the wall of the fibers from the capillaries to the ECS where hybridoma cells were immobilized, whereas products diffused from the extra-capillary space inside the lumen fi-bers. With the aim of determining the hydrodynam-ic parameters needed to model the system, diffusion assays were performed with the main compounds involved in the process (glucose, glutamine, lactate, and ammonium) without cells.
F i g . 1 – Schematic representation of the HFBR system
216 L. Legazpi et al., Diffusion and Inhibition Processes in a Hollow-fiber Membrane…, Chem. Biochem. Eng. Q., 30 (2) 213–225 (2016)
(5)
( )
( ) ( )
1 1
1 ln1 1 1 1
i,GLC initiale,GLC
e i e
L,GLCi,GLC initial
e,GLC initiali e e i e
CC +
V V V= K´ At
C+ C +V V V V V
− −
−
HGLC
(6)
( )
( ) ( )
1 1
1 ln1 1 1 1
i,GLN initiale,GLN
e i e
L,GLNi,GLN initial
e,GLN initiali e e i e
CC +
V V V= K´ At
C+ C +V V V V V
− −
−
HGLN
For the analysis of glucose diffusion, the car-tridge was loaded with distilled water and the medi-um bottle was filled with a solution of glucose at a concentration similar to those employed in the ex-periments with hybridoma cells (initial concentra-tion 4.0 mg mL–1). Samples were then taken regu-larly from the ECS to evaluate the rate of diffusion of glucose from the capillaries. Glutamine diffusion was assessed in the same manner (initial concentra-tion 0.34 mg mL–1).
For the products (lactate and ammonium), the medium bottle was filled with distilled water, and the cartridge was loaded with a solution of lactate or ammonium in a concentration similar to those ob- tained in the experiments with hybridoma cells (ini-tial concentrations 1.0 mg mL–1 and 0.046 mg mL–1, respectively). Samples were also taken from the ECS.
Model development
Calculation of mass transfer coefficients
Diffusion assays allowed the estimation of the mass transfer coefficient values (K´L) required to solve the model equations. In the absence of cells, the material that appears/disappears in the ECS is equal to the material that passes through the fiber walls.
(1)
d( )
de,GLC
e L,GLC i,GLC e,GLC
CV = K´ A C C
t−
(2)
d( )
de,GLN
e L,GLN i,GLN e,GLN
CV = K´ A C C
t−
where Ve is the volume of the ECS, K´L the mass transfer coefficient for glucose (GLC) or glutamine (GLN), A the total fiber surface area, Ci the sub-strate concentration in the intra-capillary space (equal to the concentration in the bottle), and Ce the substrate concentration in the extra-capillary space.
The ECS volume was 12 mL and the total fiber surface area was 2050 cm2. As no reaction is taking place, Ci can be expressed as a function of Ce:
(3)
( )i,GLC initial i e,GLC ei,GLC
i
C V C VC =
V−
(4)
( )i,GLN initial i e,GLN ei,GLN
i
C V C VC =
V−
where Vi is the volume of medium in the bottle.Substituting Equations (3) and (4) in Equations
(1) and (2) and integrating, we obtain:
where (Ci)initial and (Ce)initial are the substrate concen-trations of glucose (GLC) or glutamine (GLN) at the beginning of the diffusion experiments, and t the experiment time. Plotting HGLC or HGLN vs. t, a line
is obtained for each substrate, and the correspond-ing mass transfer coefficient can be calculated from the slope of this line. The mass transfer coefficients of products were calculated in a similar way.

L. Legazpi et al., Diffusion and Inhibition Processes in a Hollow-fiber Membrane…, Chem. Biochem. Eng. Q., 30 (2) 213–225 (2016) 217
Assumptions of the model
Seeing as the goal was to develop an easily ap-plicable model for a complex system, a number of significant simplifications were introduced. Several initial assumptions normally considered by different researchers were assumed: isothermal process; Newtonian uncompressible fluid with constant physical properties; flow rates and pressures being uniformly distributed over the module cross-sec-tion; fiber bundles being regarded as a collection of parallel rods, which means that the packing-density distribution and flow distribution were consistent along the module length; the fibers had the same diameter, were rigid and could not be deformed; and entrance and exit effects in the lumen as well as the end effects in the shell were ignored28.
Other approximations and simplifications are listed and justified below:
1) In the HFBR, the inflow concentration of any compound (Ci, inlet) was approximately the same as the outflow concentration (Ci, outlet).
Assuming perfect mixing in the bottle and not taking into account the time that the medium takes to circulate from the HFBR to the bottle, the amount of substance that appears/disappears in the bottle during an increment of time is the same as the amount of substance that disappears/appears in the bundle of fibers:
( )i inlet i, outlet i, inletV C = Q C C t∆ − ∆ (7)
where Q is the flow through the ICS, Vi the volume
of medium in the bottle, and t the time.If the difference between Cinlet and Coutlet is a
percentage of Cinlet, α, it can be written as:
( )i, outlet i, inlet i, inletC C = Cα− (8)
From Equation (1) and being τ = Vi /Q:
(9)
ddi, inlet i, inletC C
=t
ατ
(10)
ddi, inlet
i, inlet
C=
C tτα
As Q = 1020 mL h–1 and Vi = 300 mL, then τ =
0.29 h. The values obtained for α will be comment-ed in Results and discussion and this assumption will be justified.
2) The time that the medium takes to circulate from the bottle to the HFBR and from the HFBR to the bottle was negligible in the context of the exper-iment. It is known that the medium took 2.3 min to reach the cartridge from the bottle, whereas the products took 0.9 min to get from the cartridge to
the bottle. This time (3.2 min in all) is insignificant with respect to the rate of change of the concentra-tions in the studied compounds. It is important to remark that, taking into account the experimental data (shown in Results and discussion section), the variation of substrates and products concentrations during these 3.2 min was always below 5 %.
3) The cell growth that took place during the experiments was negligible with respect to the high cell concentrations in the cartridge.
The final cell biomass was determined at the end of the experiment, being 16 mg mL–1 dry weight (~5·107 cell mL–1). The initial concentration was calculated considering the kinetic values for hybrid-oma growth in a T-flask6 and assuming similar be-havior, obtained was a value of the same order of magnitude, only 20 % lower than the final concen-tration.
4) The volume of culture medium contained in the bottle was virtually constant throughout the ex-periments. The initial volume was 300 mL. As 9 samples of 4 mL were taken, the final volume was 264 mL, just 12 % lower.
Model equations
Considering the assumptions postulated in the previous section, simple equations can be estab-lished to describe the system behavior based on mass balance in the bottle and in the intra-capillary space for substrates as well as products.
It was considered that the void spaces among cell layers around neighboring hollow fiber mem-branes give negligible contribution to flow in the ECS. Likewise, the flow resistance and the possible change in membrane properties caused by the adhe-sion of cells to the fiber membranes were also sup-posed negligible9,28.
The material that disappears/appears in the bot-tle is equal to the material that passes through the fiber walls:
(11)
d( )
di,GLC
i L,GLC i,GLC e,GLC
CV = K´ A C C
t− −
(12)
d( )
di,GLN
i L,GLN i,GLN e,GLN
CV = K´ A C C
t− −
(13)
d( )
di, LAC
i L, LAC e, LAC i, LAC
CV = K´ A C C
t−
(14)
d( )
di, AM
i L, AM e, AM i, AM
CV = K´ A C C
t−
where Vi is the volume of medium in the bottle, K´L the mass transfer coefficients for glucose (GLC),
218 L. Legazpi et al., Diffusion and Inhibition Processes in a Hollow-fiber Membrane…, Chem. Biochem. Eng. Q., 30 (2) 213–225 (2016)
(19) ( ) ( )* *
d( ) 1 1
d
n nLAC AM
e,GLC e, LAC e, AMe L,GLC i,GLC e,GLC e GLC v
e, LAC e, AM
C C CV = K´ A C C V q X
t C C
− − − −
(20) ( ) ( )* *
d( ) 1 1
d
n nLAC AM
e,GLN e, LAC e, AMe L,GLN i,GLN e,GLN e GLN v
e, LAC e, AM
C C CV = K´ A C C V q X
t C C
− − − −
(21) ( ) ( )* *
d( ) 1 1
d
n nLAC AM
e, LAC e, LAC e, AMe L, LAC i, LAC e, LAC e LAC v
e, LAC e, AM
C C CV = K´ A C C +V p X
t C C
− − −
(22) ( ) ( )* *
d( ) 1 1
d
n nLAC AM
e, AM e, LAC e, AMe L, AM i, AM e, AM e AM v
e, LAC e, AM
C C CV = K´ A C C +V p X
t C C
− − −
glutamine (GLN), lactate (LAC) or ammonium (AM), Ci the concentration in the intra-capillary space (equal to the concentration in the bottle), Ce the concentration in the extra-capillary space, and A the fiber surface area.
The material that appears/disappears in the ex-tra-capillary space is equal to the material that pass-es through the fiber walls minus/plus the consump-tion/production by the hybridoma cells:
(15) d
( )de,GLC
e L,GLC i,GLC e,GLC e GLC
CV = K´ A C C V r
t− −
(16) d
( )de,GLN
e L,GLN i,GLN e,GLN e GLN
CV = K´ A C C V r
t− −
(17) d
( )de, LAC
e L, LAC i, LAC e, LAC e LAC
CV = K´ A C C +V r
t−
(18) d
( )de, AM
e L, AM i, AM e, AM e AM
CV = K´ A C C +V r
t−
where Ve is the volume of the extra-capillary space, rGLC and rGLN the rates of consumption of glucose and glutamine, and rLAC and rAM the rates of forma-tion of lactate and ammonium, respectively.
The rates of substrate consumption and product generation were considered proportional to the via-ble cell concentrations. In addition, two inhibitory terms for lactate and ammonium were introduced in order to take into account the reduction in consump-tion and production rates observed during the final hours of the experiment. Equations 15–18 can be rewritten as follows:
where q and p are the maximum specific rates for substrates glucose (GLC) or glutamine (GLN) and products lactate (LAC) or ammonium (AM), Xv the cell concentration, (Ce, LAC )
* and (Ce, AM )* the maxi-
mum concentrations of lactate and ammonium that can be obtained (extrapolated from experimental data), and nLAC and nAM the exponents of the inhibi-tory terms.
It has been reported that byproducts such as ammonium and lactate affect cell physiology and
metabolism.29 For instance, Schneider et al.30 re-ported inhibition of glutamine uptake by elevated ammonia concentrations. Besides, it is a well-known fact that accumulation of these cellular me-tabolism byproducts may inhibit hybridoma MAb production.11,29
The produced antibody remained in the ex-tra-capillary space; so, in this case, only the produc-tion term is necessary. Two inhibitory terms were once again considered:
(23) ( ) ( )* *
d1 1
d
n´ n´LAC AM
e, MAb e, LAC e, AMMAb v
e, LAC e, AM
C C C= p X
t C C
− −
where Ce, MAb is the antibody concentration in the ex-tra-capillary space, pMAb the maximum specific pro-
duction rate for antibody, and n´LAC and n´AM the ex-ponents of the inhibitory terms.

L. Legazpi et al., Diffusion and Inhibition Processes in a Hollow-fiber Membrane…, Chem. Biochem. Eng. Q., 30 (2) 213–225 (2016) 219
Results and discussion
Hollow-fiber bioreactor performance
Cell metabolism and antibody production
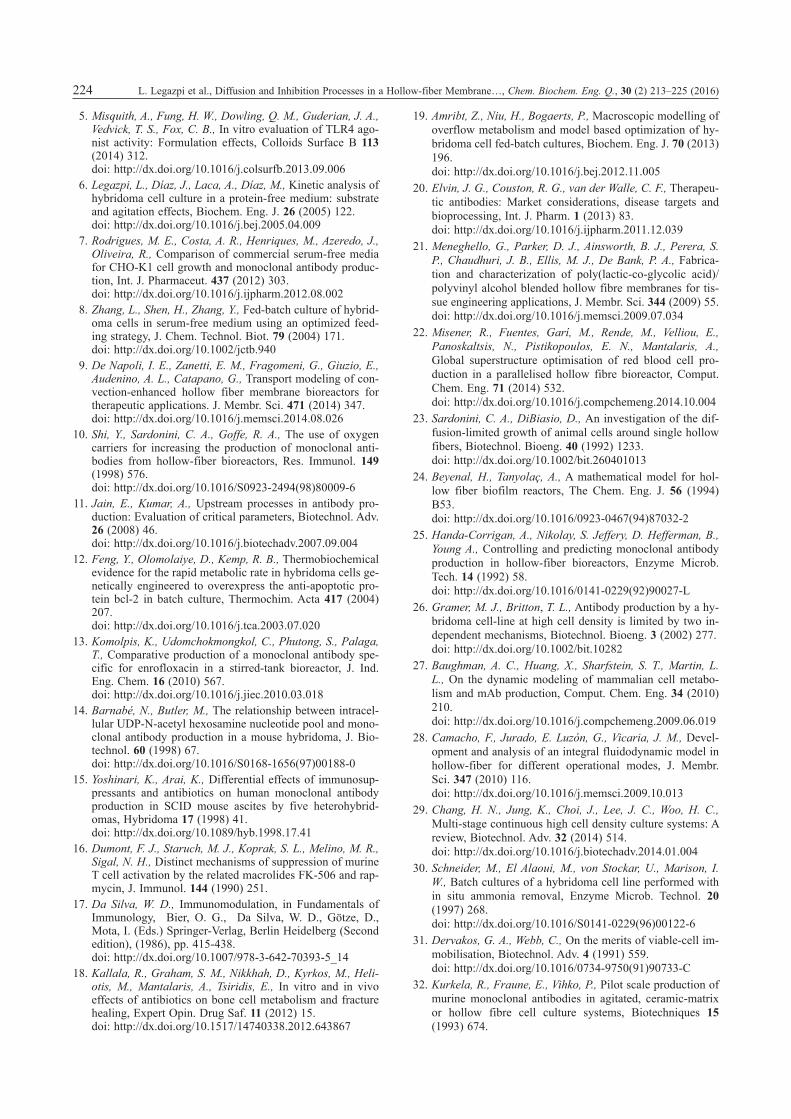
Fig. 2 shows the evolution of glucose and glu-tamine concentrations, while Fig. 3 shows the evo-lution of lactate and ammonium concentrations. Glucose and glutamine concentrations decreased throughout the duration of the experiment, although the consumption rate was slower during the last hours of experimentation. In a previous study car-ried out with the same cell line in T150-flasks con-taining 100 mL of protein-free medium6, it was ob-served that these substrates decreased only during the exponential growth phase. At the end of the ex-periment, the concentration of cells measured in the cartridge was 5·107 cell mL–1, approximately a quar-ter of the concentration reported for the Alps 25-3 hybridoma cell line in the extra-capillary space of a dual hollow-fiber bioreactor29. Lactate and ammoni-um likewise increased throughout the experiment, as their production is associated with glucose and glutamine consumption. In contrast, antibody con-centration was almost constant after 4 hours of cul-ture in the medium without antibiotics (see Fig. 4).
It has been previously observed that MAb produc-tion for this cell line is not totally associated with cell growth6. Cell growth and antibody generation are conditioned by the availability of amino acids in the medium31. For example, the presence of gluta-mine is a necessary condition for MAb production. Although, in this case, glutamine was available in the medium even during the final stages of the ex-periment, it is possible that other essential amino acids may have been depleted. Another possibility is that lactate and/or ammonium inhibit antibody production. In fact, a considerable amount of litera-ture exists on the inhibitory or toxic effects result-ing from lactate and ammonia accumulation in mammalian cell cultures31. Specifically, an inhibito-ry effect on cell growth and antibody production has been reported for these metabolic by-prod-ucts11,19,29.
The final antibody concentration was 0.22 mg mL–1 (approximately 4.4 pg cell–1). This value was similar to that reported by Kurkela et al.32 in one day for a HFBR system (0.3 mg mL–1), and lower than that obtained by Kessler et al.33 in one day for 6C10 cell line culture in a Tricentric bioreactor (1.8 mg mL–1). Street et al.34 reported a maximum antibody concentration of 2.4 mg mL–1 for the CB. Hep-1 hy-
F i g . 2 – Evolution of substrate concentrations (samples taken from the bottle). Experimental data with (□) and without (∆) antibi-otics, and the results of modelling with (continuous line) and without (discontinuous line) antibiotics (eq. 11 to 14, and 19 to 22).
F i g . 3 – Evolution of product concentrations (samples taken from the bottle). Experimental data with (□) and without (∆) antibiotics and, the results of modelling with (continuous line) and without (discontinuous line) antibiotics (eq. 11 to 14, and 19 to 22).
220 L. Legazpi et al., Diffusion and Inhibition Processes in a Hollow-fiber Membrane…, Chem. Biochem. Eng. Q., 30 (2) 213–225 (2016)
bridoma cell line in a HFBR employing protein-free culture medium, whereas other authors obtained concentrations for the same cell line that did not ex-ceed 0.015 mg mL–1. In a recent study employing 5A8 hybridoma cells immobilized in calcium algi-nate, the maximum concentration obtained was 0.006 µg mL–1 35. It is thus essential to note that anti-body production strongly depends on the character-istics of the medium and the cell line employed, as well as on the culture technique developed.
Comparison of cell metabolism and antibody production with and without antibiotics
The evolution of substrates (glucose and gluta-mine) and inhibitors (lactate and ammonium) with and without antibiotics can be seen in Figs. 2 and 3. In both cases, the glucose-lactate yield was 1.0, this yield is approximately half the value obtained in T-flask culture6. These results are similar to those reported by other authors with a different cell line (AB2-143.2) in a continuous reactor36. As regards glutamine consumption and ammonium production rates, once again, these were almost the same with and without antibiotics, with yields of 1.2 in both cases. This value is approximately double the gluta-mine-ammonium yield obtained in T-flask culture6. Schmid et al.37 reported similar values for the AB2-143.2 cell line in small-scale cultures. Statistical tests confirmed that consumption of substrates and production of products were not affected signifi-cantly by the presence of antibiotics.
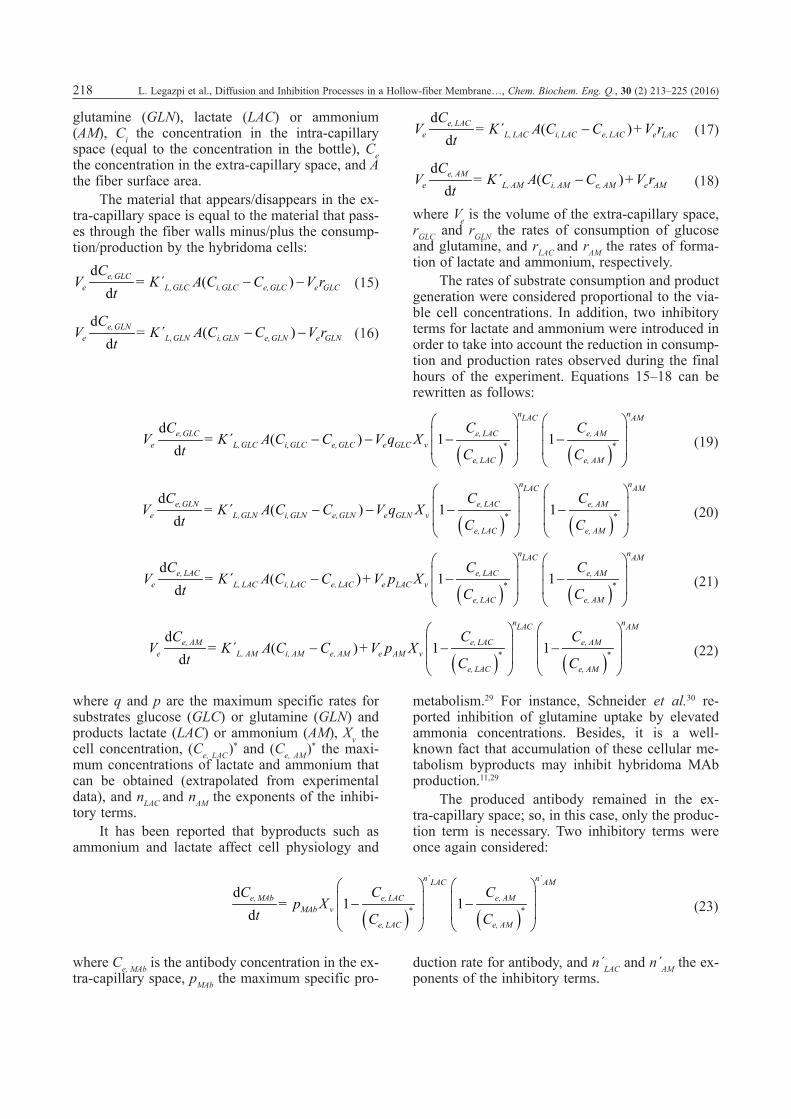
Fig. 4 shows the evolution of antibody concen-tration with and without antibiotics. Although the final concentration obtained was the same in both cases, the presence of antibiotics increased the time needed to reach this concentration. Whereas 4 h was sufficient time to obtain the maximum antibody concentration, approximately double this time was required when using antibiotics (8 h). The average
productivity decreased from 0.002 mg mL–1 h–1 to 0.001 mg mL–1 h–1. However, it should be noted that the use of antibiotics avoids system contamination and ensures the possibility of reusing hybridoma cells in several cycles with fresh medium. Accord-ing to Da Silva17, almost all antibiotics interfere in a lesser or greater extent with the production of anti-bodies as they form complexes with the DNA mol-ecules, impeding the formation of antibodies. More recently, Kallala et al.18 suggested that antibiotics exert direct effects on mitochondrial physiology within mammalian cells, disrupting mitochondrial function and cell activity. The effect of antibiotics on MAb production is determined by different fac-tors, such as antibiotic nature and concentration, cell lines, culture medium…14,15,16
Comparison of HFBR performance with other in vitro hybridoma culture techniques
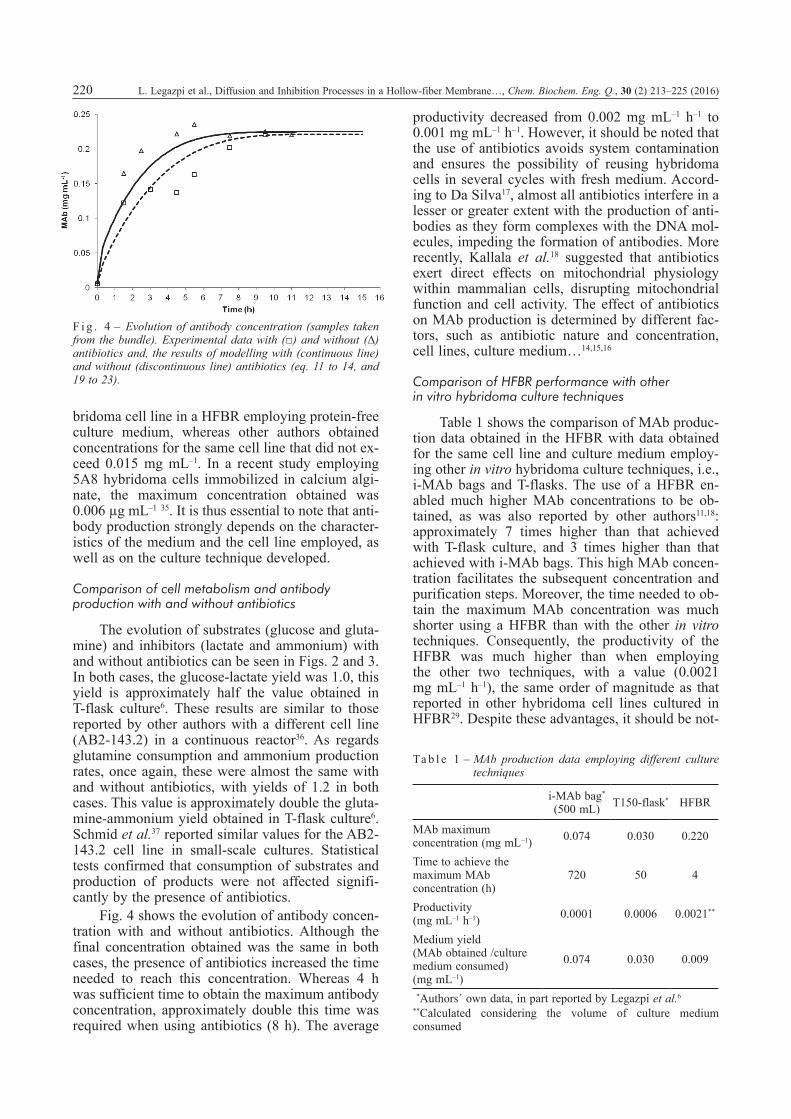
Table 1 shows the comparison of MAb produc-tion data obtained in the HFBR with data obtained for the same cell line and culture medium employ-ing other in vitro hybridoma culture techniques, i.e., i-MAb bags and T-flasks. The use of a HFBR en-abled much higher MAb concentrations to be ob-tained, as was also reported by other authors11,18: approximately 7 times higher than that achieved with T-flask culture, and 3 times higher than that achieved with i-MAb bags. This high MAb concen-tration facilitates the subsequent concentration and purification steps. Moreover, the time needed to ob-tain the maximum MAb concentration was much shorter using a HFBR than with the other in vitro techniques. Consequently, the productivity of the HFBR was much higher than when employing the other two techniques, with a value (0.0021 mg mL–1 h–1), the same order of magnitude as that reported in other hybridoma cell lines cultured in HFBR29. Despite these advantages, it should be not-
Ta b l e 1 – MAb production data employing different culture techniques
i-MAb bag* (500 mL) T150-flask* HFBR
MAb maximum concentration (mg mL–1) 0.074 0.030 0.220
Time to achieve the maximum MAb concentration (h)
720 50 4
Productivity (mg mL–1 h–1) 0.0001 0.0006 0.0021**
Medium yield (MAb obtained /culture medium consumed) (mg mL–1)
0.074 0.030 0.009
**Authors´ own data, in part reported by Legazpi et al.6
**Calculated considering the volume of culture medium consumed
F i g . 4 – Evolution of antibody concentration (samples taken from the bundle). Experimental data with (□) and without (∆) antibiotics and, the results of modelling with (continuous line) and without (discontinuous line) antibiotics (eq. 11 to 14, and 19 to 23).
L. Legazpi et al., Diffusion and Inhibition Processes in a Hollow-fiber Membrane…, Chem. Biochem. Eng. Q., 30 (2) 213–225 (2016) 221
ed that the medium yield (MAb produced in rela-tion to consumed medium) was more than 3-fold higher in T-flask culture than in the HFBR, and 8-fold higher in the case of i-MAb bags. The draw-back of i-MAb bags is obviously the time needed to obtain the maximum concentration of antibodies (approximately one month).
The medium yield data reported in Table 1 were calculated considering the production process to begin with fresh medium and end when the max-imum MAb concentration is obtained. The actual operation with T-flasks and a HFBR differs slightly, as MAb is periodically harvested by replacing the used medium with fresh medium. The amount of MAb harvested in one month was calculated assum-ing that 40 % of the medium contained in the T-flask was replaced daily with fresh medium, and that all the medium in the HFBR was replaced every 12 hours. MAb production would be 37 mg per i-MAb bag (500 mL capacity), 12 mg per T150-flask, and 96 mg for the HFBR. Therefore, if high amounts of antibody were required, it would be recommendable to employ an HFBR instead of other culture tech-niques. This culture system not only enables higher MAb production, but also allows working for several months, obtaining a much more concentrated product.
Experimental system analysis and assessment of the model
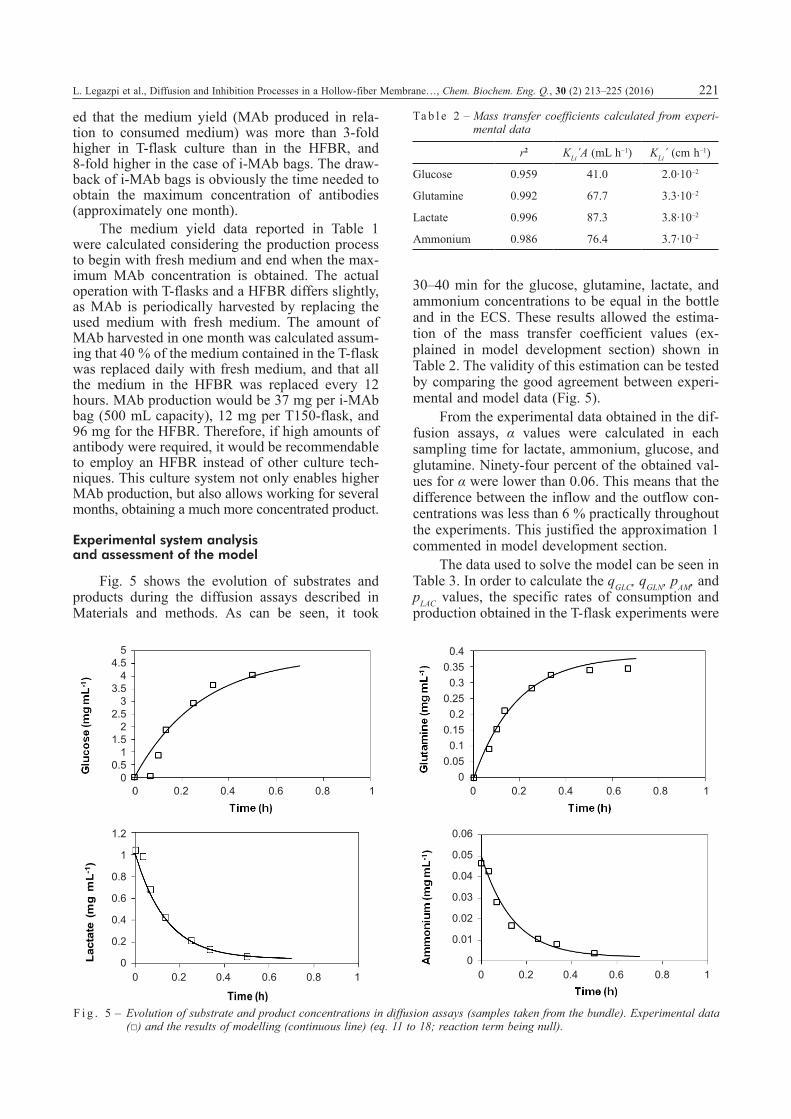
Fig. 5 shows the evolution of substrates and products during the diffusion assays described in Materials and methods. As can be seen, it took
30–40 min for the glucose, glutamine, lactate, and ammonium concentrations to be equal in the bottle and in the ECS. These results allowed the estima-tion of the mass transfer coefficient values (ex-plained in model development section) shown in Table 2. The validity of this estimation can be tested by comparing the good agreement between experi-mental and model data (Fig. 5).
From the experimental data obtained in the dif-fusion assays, α values were calculated in each sampling time for lactate, ammonium, glucose, and glutamine. Ninety-four percent of the obtained val-ues for α were lower than 0.06. This means that the difference between the inflow and the outflow con-centrations was less than 6 % practically throughout the experiments. This justified the approximation 1 commented in model development section.
The data used to solve the model can be seen in Table 3. In order to calculate the qGLC, qGLN, pAM, and pLAC values, the specific rates of consumption and production obtained in the T-flask experiments were
F i g . 5 – Evolution of substrate and product concentrations in diffusion assays (samples taken from the bundle). Experimental data (□) and the results of modelling (continuous line) (eq. 11 to 18; reaction term being null).
0
0,2
0,4
0,6
0,8
1
1,2
0 0,2 0,4 0,6 0,8 1
Lact
ate
(mg
mL-
1 )
Time (h)
Ta b l e 2 – Mass transfer coefficients calculated from experi-mental data
r2 KLi´A (mL h–1) KLi´ (cm h–1)
Glucose 0.959 41.0 2.0·10–2
Glutamine 0.992 67.7 3.3·10–2
Lactate 0.996 87.3 3.8·10–2
Ammonium 0.986 76.4 3.7·10–2
54.5
43.5
32.5
21.5
10.5
00 0.2 0.4 0.6 0.8 1
1.2
1
0.8
0.6
0.4
0.2
00 0.2 0.4 0.6 0.8 1
0.40.350.3
0.250.2
0.150.1
0.050
0 0.2 0.4 0.6 0.8 1
0.06
0.05
0.04
0.03
0.02
0.01
00 0.2 0.4 0.6 0.8 1

222 L. Legazpi et al., Diffusion and Inhibition Processes in a Hollow-fiber Membrane…, Chem. Biochem. Eng. Q., 30 (2) 213–225 (2016)
assumed as the starting point6. A good fit was ob-tained for glucose employing the T-flask value (qGLC = 0.3 h–1). For lactate and ammonium, the values of maximum specific production rate obtained in the HFBR were very similar to the specific rates of pro-duction measured in T-flask (pLAC = 0.25 and pAM = 0.005 h–1, respectively). However, the maximum specific consumption rate of glutamine in the HFBR was half the specific consumption rate value ob-tained in T-flasks (qGLN = 0.03 and qGLN = 0.06 h–1, respectively). Comparing the results with and with-out antibiotics in the HFBR, again it can be con-cluded that the presence of antibiotics in the medi-um had no significant effect on the reaction rates of substrates and products. Changes in hybridoma me-tabolism determined by culture conditions may be responsible for the differences observed for gluta-mine consumption. Cell confinement makes hybrid-omas grow, forming biofilms and conglomerates. This different environment interacts with cell devel-opment, altering morphology and membrane per-meability, as well as surface tension and osmotic pressure31,35,39. Maximum specific rates found in this work were slightly higher than lactate and ammoni-um specific production rates and glucose specific consumption rate reported by Ozturk and Palsson40
(0.13, 0.002, and 0.14 h–1, respectively). On the contrary, the maximum specific consumption rates for glutamine were very similar (≈ 0.03 h–1). Addi-tionally, Amribt et al.12 reported values for the max-imum specific uptake rate for glutamine of the same order of magnitude.
As explained in model development section, inhibition by lactate and ammonium was included in the kinetic equations (see eq. 19–22). The expo-
nents of the inhibitory terms were assumed to be the same for glucose/glutamine consumption and lac-tate/ammonium production, both values being found to be quite similar (nLAC = 0.10 and nAM = 0.15, re-spectively).
As shown in Figs. 2 and 3, the agreement be-tween experimental and model data for substrates and products is quite good, despite the fact that the model overestimates actual values in the case of the lactate after 8 hours.
Fig. 4 shows the evolution of antibody concen-tration (experimental data and model results) with and without antibiotics. The value obtained for pMAb was higher without antibiotics, indicating that the presence of antibiotics negatively affects the pro-duction of MAb. In both cases, the production rate of MAb slowed down after approximately 3 hours. This behavior, also observed in T-flasks6, might be explained by the inhibition of antibody production due to the accumulation of toxic byproducts, such as lactate and ammonia11. For these reasons, inhibi-tory terms were also considered for MAb produc-tion. In this case, inhibition by lactate was found to be stronger than inhibition by ammonium, with ex-ponents of n´LAC = 1.3 and n´AM = 0.5, respectively. Model and experimental data have been compared with good agreement (r2 > 0.98 in all cases).
Conclusions
The use of antibiotics (streptomycin/penicillin) did not affect glucose and glutamine consumption or lactate and ammonium production. Although the same final concentration of antibody was obtained
Ta b l e 3 – Parameter values, with and without antibiotics, used to solve the model
Initial concentrations
in the ICS (mg mL–1)
Initial concentrations
in the ECS (mg mL–1)
KL´ (cm h–1)
A (cm2)
Vi/Ve (mL)
Xv (mg
mL–1)
qGLC, qGLN pAM, pLAC
(h–1)
(Ce,Lac)*
(mg mL–1)(Ce,AM)*
(mg mL–1)nLAC n´LAC
nAM n´AM
Glucose 4.3 (without ant.) 4.6 (with ant.)
4.3 (without ant.) 4.6 (with ant.) 2.0·10–2 2050 300/12 16 0.30 1.45 0.047 0.10 0.15
Glutamine 0.38 (without ant.) 0.34 (with ant.)
0.38 (without ant.) 0.34 (with ant.) 3.3·10–2 2050 300/12 16 0.03 1.45 0.047 0.10 0.15
Lactate 0.14 (without ant.) 0.11 (with ant.)
0.14 (without ant.) 0.11 (with ant.) 3.8·10–2 2050 300/12 16
0.25 (without ant.)
0.23 (with ant.)
1.45 0.047 0.10 0.15
Ammonium 0.013 (without ant.) 0.016 (with ant.)
0.013 (without ant.) 0.016 (with ant.) 3.7·10–2 2050 300/12 16 0.005 1.45 0.047 0.10 0.15
Antibody – 0.008 (without ant.) 0.005 (with ant.) – 2050 300/12 16
0.023 (without ant.)
0.010 (with ant.)
1.45 0.047 1.30 0.50

L. Legazpi et al., Diffusion and Inhibition Processes in a Hollow-fiber Membrane…, Chem. Biochem. Eng. Q., 30 (2) 213–225 (2016) 223
with and without antibiotics, twice the time was needed to obtain the maximum MAb concentration when antibiotics were added.
When antibody production in a HFBR was compared with other systems, i.e. T-flasks and i-MAb bags, the highest antibody concentration was obtained using a HFBR, and the time needed to ob-tain this concentration was the shortest. However, the waste of medium per mg of MAb obtained was maximal in this case.
It was possible to simulate the system employ-ing a simplified model that considered reaction and mass transfer terms. Inhibition by lactate and am-monium was considered in the model for substrate consumption and product generation. The model accurately described the evolution of substrates and products, and even antibody production, which was found to be inhibited by ammonium and especially by lactate that had accumulated in the medium.
L i s t o f s y m b o l s a n d a c r o n y m s
A – total fiber area, cm2
AM – ammoniumCe – concentration in cartridge ECS, mg mL–1
(Ce)initial – initial concentration in cartridge ECS, mg mL–1
Ce,AM – ammonium concentration in the ECS, mg mL–1
Ce,GLC – glucose concentration in the ECS, mg mL–1
Ce,GLN – glutamine concentration in the ECS, mg mL–1
Ce,LAC – lactate concentration in the ECS, mg mL–1
Ce,MAb – antibody concentration in the ECS, mg mL–1
(Ce,LAC)* – maximum lactate concentration, mg mL–1
(Ce,AM)* – maximum ammonium concentration, mg mL–1
Ci – concentration in the bottle or ICS, mg mL–1
(Ci)initial – initial concentration in the bottle or ICS, mg mL–1
Ci, inlet – bundle inflow concentration, mg mL–1
Ci, outlet – bundle outflow concentration, mg mL–1
Ci,AM – ammonium concentration in the ICS, mg mL–1
Ci,GLC – glucose concentration in the ICS, mg mL–1
Ci,GLN – glutamine concentration in the ICS, mg mL–1
Ci,LAC – lactate concentration in the ICS, mg mL–1
ECS – extra-capillary spaceGLC – glucoseGLN – glutamineHFBR – hollow fiber bioreactorICS – intra-capillary spaceK´L, AM – mass transfer coefficient for ammonium,
cm h–1
K´L, GLC – mass transfer coefficient for glucose, cm h–1
K´L, GLN – mass transfer coefficient for glutamine, cm h–1
K´L, LAC – mass transfer coefficient for lactate, cm h–1
LAC – lactateMAb – monoclonal antibodypAM – maximum specific production rate for am-
monium, h–1
pLAC – maximum specific production rate for lac-tate, h–1
qGLC – maximum specific consumption rate for glu-cose, h–1
qGLN – maximum specific consumption rate for glu-tamine, h–1
qMAb – maximum specific production rate for anti-body, h–1
Q – flow, mL h–1
nAM – exponent for inhibitory term due to ammoni-um in eq. 19–20
nLAC – exponent for inhibitory term due to lactate in eq. 19–20
n´AM – exponent for inhibitory term due to ammoni-um in eq. 23
n´LAC – exponent for inhibitory term due to lactate in eq. 23
rAM – ammonium production rates, mg mL–1
rGLC – glucose consumption rates, mg mL–1
rGLN – glutamine consumption rates, mg mL–1
rLAC – lactate production rates, mg mL–1
SD – standard deviationt – time, hVe – cartridge extra-capillary volume, mLVi – volume of medium in the bottle, mLXv – cell concentration, cell mL–1
τ – retention time in the bottle, h
R e f e r e n c e s
1. Féraudet-Tarisse, C., Vaisanen-Tunkelrott, M. L., Moreau, K., Lamourette, P. Créminon, C., Volland, H., Pathogen-free screening of bacteria-specific hybridomas for selecting high-quality monoclonal antibodies against pathogen bacte-ria as illustrated for Legionella pneumophila, J. Immunol. Methods 391 (2013) 81.doi: http://dx.doi.org/10.1016/j.jim.2013.02.012
2. Legazpi, L., Laca, A., Díaz, M., Kinetic analysis of hybrid-oma cells viability under mechanical shear stress with and without serum protection, Bioproc. Biosyst. Eng. 32 (2009) 717.doi: http://dx.doi.org/10.1007/s00449-008-0295-4
3. Peterson, N. C., Peavey, J. E., Comparison of in vitro monoclonal antibody production methods with an in vivo ascites production technique, Contemp. Top Lab. Anim. 37 (1998) 61.
4. Gibert, R., Alberti, M., Poirier, B., Jallet, C., Tordo, N., Morgeaux, S., A relevant in vitro ELISA test in alternative to the in vivo NIH test for human rabies vaccine batch re-lease, Vaccine 31 (2013) 6022.doi: http://dx.doi.org/10.1016/j.vaccine.2013.10.019
224 L. Legazpi et al., Diffusion and Inhibition Processes in a Hollow-fiber Membrane…, Chem. Biochem. Eng. Q., 30 (2) 213–225 (2016)
5. Misquith, A., Fung, H. W., Dowling, Q. M., Guderian, J. A., Vedvick, T. S., Fox, C. B., In vitro evaluation of TLR4 ago-nist activity: Formulation effects, Colloids Surface B 113 (2014) 312.doi: http://dx.doi.org/10.1016/j.colsurfb.2013.09.006
6. Legazpi, L., Díaz, J., Laca, A., Díaz, M., Kinetic analysis of hybridoma cell culture in a protein-free medium: substrate and agitation effects, Biochem. Eng. J. 26 (2005) 122.doi: http://dx.doi.org/10.1016/j.bej.2005.04.009
7. Rodrigues, M. E., Costa, A. R., Henriques, M., Azeredo, J., Oliveira, R., Comparison of commercial serum-free media for CHO-K1 cell growth and monoclonal antibody produc-tion, Int. J. Pharmaceut. 437 (2012) 303.doi: http://dx.doi.org/10.1016/j.ijpharm.2012.08.002
8. Zhang, L., Shen, H., Zhang, Y., Fed-batch culture of hybrid-oma cells in serum-free medium using an optimized feed-ing strategy, J. Chem. Technol. Biot. 79 (2004) 171.doi: http://dx.doi.org/10.1002/jctb.940
9. De Napoli, I. E., Zanetti, E. M., Fragomeni, G., Giuzio, E., Audenino, A. L., Catapano, G., Transport modeling of con-vection-enhanced hollow fiber membrane bioreactors for therapeutic applications. J. Membr. Sci. 471 (2014) 347.doi: http://dx.doi.org/10.1016/j.memsci.2014.08.026
10. Shi, Y., Sardonini, C. A., Goffe, R. A., The use of oxygen carriers for increasing the production of monoclonal anti-bodies from hollow-fiber bioreactors, Res. Immunol. 149 (1998) 576.doi: http://dx.doi.org/10.1016/S0923-2494(98)80009-6
11. Jain, E., Kumar, A., Upstream processes in antibody pro-duction: Evaluation of critical parameters, Biotechnol. Adv. 26 (2008) 46.doi: http://dx.doi.org/10.1016/j.biotechadv.2007.09.004
12. Feng, Y., Olomolaiye, D., Kemp, R. B., Thermobiochemical evidence for the rapid metabolic rate in hybridoma cells ge-netically engineered to overexpress the anti-apoptotic pro-tein bcl-2 in batch culture, Thermochim. Acta 417 (2004) 207.doi: http://dx.doi.org/10.1016/j.tca.2003.07.020
13. Komolpis, K., Udomchokmongkol, C., Phutong, S., Palaga, T., Comparative production of a monoclonal antibody spe-cific for enrofloxacin in a stirred-tank bioreactor, J. Ind. Eng. Chem. 16 (2010) 567.doi: http://dx.doi.org/10.1016/j.jiec.2010.03.018
14. Barnabé, N., Butler, M., The relationship between intracel-lular UDP-N-acetyl hexosamine nucleotide pool and mono-clonal antibody production in a mouse hybridoma, J. Bio-technol. 60 (1998) 67.doi: http://dx.doi.org/10.1016/S0168-1656(97)00188-0
15. Yoshinari, K., Arai, K., Differential effects of immunosup-pressants and antibiotics on human monoclonal antibody production in SCID mouse ascites by five heterohybrid-omas, Hybridoma 17 (1998) 41.doi: http://dx.doi.org/10.1089/hyb.1998.17.41
16. Dumont, F. J., Staruch, M. J., Koprak, S. L., Melino, M. R., Sigal, N. H., Distinct mechanisms of suppression of murine T cell activation by the related macrolides FK-506 and rap-mycin, J. Immunol. 144 (1990) 251.
17. Da Silva, W. D., Immunomodulation, in Fundamentals of Immunology, Bier, O. G., Da Silva, W. D., Götze, D., Mota, I. (Eds.) Springer-Verlag, Berlin Heidelberg (Second edition), (1986), pp. 415-438.doi: http://dx.doi.org/10.1007/978-3-642-70393-5_14
18. Kallala, R., Graham, S. M., Nikkhah, D., Kyrkos, M., Heli-otis, M., Mantalaris, A., Tsiridis, E., In vitro and in vivo effects of antibiotics on bone cell metabolism and fracture healing, Expert Opin. Drug Saf. 11 (2012) 15.doi: http://dx.doi.org/10.1517/14740338.2012.643867
19. Amribt, Z., Niu, H., Bogaerts, P., Macroscopic modelling of overflow metabolism and model based optimization of hy-bridoma cell fed-batch cultures, Biochem. Eng. J. 70 (2013) 196.doi: http://dx.doi.org/10.1016/j.bej.2012.11.005
20. Elvin, J. G., Couston, R. G., van der Walle, C. F., Therapeu-tic antibodies: Market considerations, disease targets and bioprocessing, Int. J. Pharm. 1 (2013) 83.doi: http://dx.doi.org/10.1016/j.ijpharm.2011.12.039
21. Meneghello, G., Parker, D. J., Ainsworth, B. J., Perera, S. P., Chaudhuri, J. B., Ellis, M. J., De Bank, P. A., Fabrica-tion and characterization of poly(lactic-co-glycolic acid)/polyvinyl alcohol blended hollow fibre membranes for tis-sue engineering applications, J. Membr. Sci. 344 (2009) 55.doi: http://dx.doi.org/10.1016/j.memsci.2009.07.034
22. Misener, R., Fuentes, Garí, M., Rende, M., Velliou, E., Panoskaltsis, N., Pistikopoulos, E. N., Mantalaris, A., Global superstructure optimisation of red blood cell pro-duction in a parallelised hollow fibre bioreactor, Comput. Chem. Eng. 71 (2014) 532.doi: http://dx.doi.org/10.1016/j.compchemeng.2014.10.004
23. Sardonini, C. A., DiBiasio, D., An investigation of the dif-fusion-limited growth of animal cells around single hollow fibers, Biotechnol. Bioeng. 40 (1992) 1233.doi: http://dx.doi.org/10.1002/bit.260401013
24. Beyenal, H., Tanyolaç, A., A mathematical model for hol-low fiber biofilm reactors, The Chem. Eng. J. 56 (1994) B53.doi: http://dx.doi.org/10.1016/0923-0467(94)87032-2
25. Handa-Corrigan, A., Nikolay, S. Jeffery, D. Hefferman, B., Young A., Controlling and predicting monoclonal antibody production in hollow-fiber bioreactors, Enzyme Microb. Tech. 14 (1992) 58.doi: http://dx.doi.org/10.1016/0141-0229(92)90027-L
26. Gramer, M. J., Britton, T. L., Antibody production by a hy-bridoma cell-line at high cell density is limited by two in-dependent mechanisms, Biotechnol. Bioeng. 3 (2002) 277.doi: http://dx.doi.org/10.1002/bit.10282
27. Baughman, A. C., Huang, X., Sharfstein, S. T., Martin, L. L., On the dynamic modeling of mammalian cell metabo-lism and mAb production, Comput. Chem. Eng. 34 (2010) 210.doi: http://dx.doi.org/10.1016/j.compchemeng.2009.06.019
28. Camacho, F., Jurado, E. Luzón, G., Vicaria, J. M., Devel-opment and analysis of an integral fluidodynamic model in hollow-fiber for different operational modes, J. Membr. Sci. 347 (2010) 116.doi: http://dx.doi.org/10.1016/j.memsci.2009.10.013
29. Chang, H. N., Jung, K., Choi, J., Lee, J. C., Woo, H. C., Multi-stage continuous high cell density culture systems: A review, Biotechnol. Adv. 32 (2014) 514.doi: http://dx.doi.org/10.1016/j.biotechadv.2014.01.004
30. Schneider, M., El Alaoui, M., von Stockar, U., Marison, I. W., Batch cultures of a hybridoma cell line performed with in situ ammonia removal, Enzyme Microb. Technol. 20 (1997) 268.doi: http://dx.doi.org/10.1016/S0141-0229(96)00122-6
31. Dervakos, G. A., Webb, C., On the merits of viable-cell im-mobilisation, Biotechnol. Adv. 4 (1991) 559.doi: http://dx.doi.org/10.1016/0734-9750(91)90733-C
32. Kurkela, R., Fraune, E., Vihko, P., Pilot scale production of murine monoclonal antibodies in agitated, ceramic-matrix or hollow fibre cell culture systems, Biotechniques 15 (1993) 674.

L. Legazpi et al., Diffusion and Inhibition Processes in a Hollow-fiber Membrane…, Chem. Biochem. Eng. Q., 30 (2) 213–225 (2016) 225
33. Kessler, N., Thomas, G., Gerentes, L., Delfosse, G., Aymard, M., Hybridoma growth in a new generation hollow-fiber bioreactor: antibody productivity and consistency, Cyto-technology 24 (1997) 109.doi: http://dx.doi.org/10.1023/A:1007922004714
34. Street, C., Delort, A. M., Braddock, P. S. H., Brinde, K. M., A 1H/15NN n.m.r- study of nitrogen metabolism in cul-tured mammalian cells, Biochem. J. 291 (1993) 485.doi: http://dx.doi.org/10.1042/bj2910485
35. Selimoglu, S. M., Ayyildiz-Tamis, D. Gurhan, I. D., Elibol, M., Purification of alginate and feasible production of monoclonal antibodies by the alginate-immobilized hybrid-oma cells, J. Biosci. Bioeng. 113 (2012) 233.doi: http://dx.doi.org/10.1016/j.jbiosc.2011.09.020
36. Miller, W. M., Wilke, C. R., Blanch, H. W., Transient re-sponses of hybridoma metabolism to changes in the oxygen supply rate in continuous culture, Bioprocess. Eng. 3 (1998) 103.doi: http://dx.doi.org/10.1007/BF00373473
37. Schmid, G., Blanch, H. W., Wilke, C. R., Hybridoma growth, metabolism, and product formation in Hepes-buffered me-dium: II. Effect of pH, Biotechnol. Lett. 12 (1990) 633.doi: http://dx.doi.org/10.1007/BF01088185
38. Jackson, L. R., Trudel, L. J., Fox, J. G., Lipman, N. S., Evaluation of hollow-fiber bioreactors as an alternative to murine ascites production for small scale monoclonal anti-body production, J. Immunol. Methods 189 (1996) 217.doi: http://dx.doi.org/10.1016/0022-1759(95)00251-0
39. Laca, A., García, L. A., Díaz, M., Analysis and description of the evolution of alginate immobilised cells systems, J. Biotechnol. 80 (2000) 203.doi: http://dx.doi.org/10.1016/S0168-1656(00)00252-2
40. Ozturk, S. S., Palsson, B. O., Growth, metabolic, and anti-body production kinetics of hybridoma cell culture. 1. Analysis of data from controlled batch reactors, Biotechnol. Prog. 7 (1991) 471.doi: http://dx.doi.org/10.1021/bp00012a001