30-day mortality after systemic anticancer treatment … · john dewar, denis talbot, michael...
TRANSCRIPT

Articles
www.thelancet.com/oncology Vol 17 September 2016 1203
30-day mortality after systemic anticancer treatment for breast and lung cancer in England: a population-based, observational studyMichael Wallington*, Emma B Saxon*, Martine Bomb, Rebecca Smittenaar, Matthew Wickenden, Sean McPhail, Jem Rashbass, David Chao, John Dewar, Denis Talbot, Michael Peake, Timothy Perren, Charles Wilson, David Dodwell
SummaryBackground 30-day mortality might be a useful indicator of avoidable harm to patients from systemic anticancer treatments, but data for this indicator are limited. The Systemic Anti-Cancer Therapy (SACT) dataset collated by Public Health England allows the assessment of factors aff ecting 30-day mortality in a national patient population. The aim of this fi rst study based on the SACT dataset was to establish national 30-day mortality benchmarks for breast and lung cancer patients receiving SACT in England, and to start to identify where patient care could be improved.
Methods In this population-based study, we included all women with breast cancer and all men and women with lung cancer residing in England, who were 24 years or older and who started a cycle of SACT in 2014 irrespective of the number of previous treatment cycles or programmes, and irrespective of their position within the disease trajectory. We calculated 30-day mortality after the most recent cycle of SACT for those patients. We did logistic regression analyses, adjusting for relevant factors, to examine whether patient, tumour, or treatment-related factors were associated with the risk of 30-day mortality. For each cancer type and intent, we calculated 30-day mortality rates and patient volume at the hospital trust level, and contrasted these in a funnel plot.
Findings Between Jan 1, and Dec, 31, 2014, we included 23 228 patients with breast cancer and 9634 patients with non-small cell lung cancer (NSCLC) in our regression and trust-level analyses. 30-day mortality increased with age for both patients with breast cancer and patients with NSCLC treated with curative intent, and decreased with age for patients receiving palliative SACT (breast curative: odds ratio [OR] 1·085, 99% CI 1·040–1·132; p<0·0001; NSCLC curative: 1·045, 1·013–1·079; p=0·00033; breast palliative: 0·987, 0·977–0·996; p=0·00034; NSCLC palliative: 0·987, 0·976–0·998; p=0·0015). 30-day mortality was also signifi cantly higher for patients receiving their fi rst reported curative or palliative SACT versus those who received SACT previously (breast palliative: OR 2·326 99% CI 1·634–3·312; p<0·0001; NSCLC curative: 3·371, 1·554–7·316; p<0·0001; NSCLC palliative: 2·667, 2·109–3·373; p<0·0001), and for patients with worse general wellbeing (performance status 2–4) versus those who were generally well (breast curative: 6·057, 1·333–27·513; p=0·0021; breast palliative: 6·241, 4·180–9·319; p<0·0001; NSCLC palliative: 3·384, 2·276–5·032; p<0·0001). We identifi ed trusts with mortality rates in excess of the 95% control limits; this included seven for curative breast cancer, four for palliative breast cancer, fi ve for curative NSCLC, and seven for palliative NSCLC.
Interpretation Our fi ndings show that several factors aff ect the risk of early mortality of breast and lung cancer patients in England and that some groups are at a substantially increased risk of 30-day mortality. The identifi cation of hospitals with signifi cantly higher 30-day mortality rates should promote review of clinical decision making in these hospitals. Furthermore, our results highlight the importance of collecting routine data beyond clinical trials to better understand the factors placing patients at higher risk of 30-day mortality, and ultimately improve clinical decision making. Our insights into the factors aff ecting risk of 30-day mortality will help treating clinicians and their patients predict the balance of harms and benefi ts associated with SACT.
Funding Public Health England.
Copyright © The Author(s). Published by Elsevier Ltd. This is an Open Access article under the CC BY NC-ND license.
IntroductionThe use of systemic anticancer therapies (SACTs) has increased substantially in the past three decades.1,2 SACTs were previously only used to treat a small number of cancer types, but are now used routinely in many patients with common solid cancers.1–4 There is huge potential to improve patient care if the outcomes of these patients can be monitored more eff ectively, and if clinicians better
understand the outcomes that are achieved with current approaches to treatment.
SACTs can be given with the aim of improving long-term survival, either alone or in combination with surgery or radiotherapy. They can also be given for palliative purposes, to improve the quality of life for patients with advanced incurable cancers for as long as possible by controlling cancer growth and providing
Lancet Oncol 2016; 17: 1203–16
This online publication has been corrected. The corrected version first appeared at thelancet.com/oncology on August 31, 2016
See Comment page 1172
*Both authors contributed equally
Public Health England, London, UK (M Wallington BA, M Bomb PhD, S McPhail PhD, J Rashbass PhD, M Peake FRCP); Cancer Research UK, London, UK (E B Saxon PhD, R Smittenaar PhD, M Wickenden BSc); Department of Oncology, Royal Free Hospital, London, UK (D Chao FRCP); Department of Oncology, Ninewells Hospital & Medical School, Dundee, UK (J Dewar FRCR); University of Oxford, Department of Oncology, Oxford, UK (Prof D Talbot PhD); University of Leicester, Department of Respiratory Medicine, Glenfield Hospital, Leicester, UK (M Peake); Leeds Institute of Cancer Research and Pathology, St James’s University Hospital, Leeds, UK (Prof T Perren MD); Oncology Centre, Addenbrooke’s NHS Trust, Cambridge, UK (C Wilson MD); and Institute of Oncology, St James’s Hospital, Leeds, UK (Prof D Dodwell MD)
Correspondence to:Prof David Dodwell, Institute of Oncology, St James’s Hospital, Leeds LS9 7TF, [email protected]

Articles
1204 www.thelancet.com/oncology Vol 17 September 2016
symptom relief. For some patients, this approach might also increase survival time.
Patients dying within 30 days after beginning treatment with SACT are unlikely to have gained the survival or palliative benefi ts of the treatment, and in view of the side-eff ects sometimes caused by SACT, are more likely to have suff ered harm. In particular, the risk of neutropenic sepsis (infection resulting from low blood neutrophil count, probably the most important cause of SACT-related death) is highest in the 30 days after SACT, peaking at around 11–15 days after treatment.5 SACT cycles are typically 21 or, less commonly, 28 days long, so death from neutropenic sepsis from the previous treatment is captured within the 30-day mortality metric. Simply reducing doses of or avoiding SACT altogether would reduce or eliminate instances of treatment-related early mortality, but at the cost of some patients being denied eff ective SACT and hence the survival and palliation benefi ts.
To maximise the benefi ts of SACTs it is therefore important to gain a more detailed understanding of how the many diff erent patient and tumour characteristics can predict patient outcomes, such as the risk of early mortality. Only a small number of local observational studies have assessed 30-day mortality after SACT, but each has pointed to areas in which patient care could be improved.5–8
Treatment-related early mortality is also commonly measured in clinical trials of SACT, but, by necessity, patient cohorts are often selected on the basis of protocol-
driven inclusion criteria—eg, within a certain age range, good performance status, or limited comorbidities.9,10 The fi ndings from these trials are therefore less reliable estimates of treatment-related early mortality in the groups not included from the general cancer patient population. There is thus a clear need to make use of population-based data to establish 30-day mortality benchmarks for the full range of patient types, to investigate how patient and treatment-related factors aff ect the risk of 30-day mortality, and to identify diff erences between provider trusts to help improve clinical outcomes.
Here we examine factors that aff ect the risk of 30-day mortality in patients with breast and lung cancer in 2014 using data collected from NHS hospital trusts across England in the SACT dataset. The proportion of patients dying within 30 days of receiving SACT is potentially linked to poor clinical decision making. This outcome measure allows us to better understand the factors that predict early mortality and identify the patients for whom treatment could potentially be improved. We additionally characterised the extent of variation in 30-day mortality rates between hospital trusts in England, and identifi ed those with signifi cantly higher 30-day mortality rates. This is the fi rst time, to our knowledge, that 30-day mortality following recently reported SACT has been investigated on a large scale in a population that refl ects the real diversity of patients with breast and lung cancer being treated in the National Health Service (NHS) in England.
Research in context
Evidence before this studyWe searched PubMed for articles published up to Feb 29, 2016, reporting on 30-day mortality after chemotherapy for breast and lung cancer. We used the search terms “30-day mortality” or “early mortality”; “breast cancer” or “lung cancer”; and “systemic anti-cancer therapy” or “chemotherapy”. No languages were excluded from our search. We also consulted leading clinicians in this specialty for relevant, recent published work.
We identifi ed four studies investigating the factors associated with high 30-day mortality following anticancer treatment in patients with a range of cancers including breast and lung, and two recent clinical trials that reported on 30-day mortality after treatment with current standard treatments for breast and lung cancer.
The four studies identifi ed were all regional rather than national, and the clinical trials were done in selected groups of patients (restricted to certain age and performance status ranges or with limited comorbidities) so the results do not necessarily apply to the national cancer patient population in England. We also identifi ed previous published work that showed variation in 30-day postoperative mortality between trusts using funnel plots.
Added value of this studyThis study reports on patient, tumour-related, and treatment-related factors associated with 30-day mortality after systemic anticancer treatment. We studied the diverse populations of patients with breast and lung cancer in England throughout 2014 using data from the newly available Systemic Anti-Cancer Therapy (SACT) dataset. We also presented patient volume and 30-day mortality rates at the level of hospital trusts as funnel plots. To our knowledge, this is the fi rst time this topic has been investigated at a national level.
Implications of all the available evidenceThis study shows that the SACT dataset provides insight into the factors aff ecting early mortality of patients in England. It suggests that treatment intent (curative or palliative), age, performance status, whether patients had received SACT before the qualifying treatment used for this study, and sex and stage (lung cancer only) all aff ect the 30-day mortality risk. The discrepancies between patient categories for each of these factors point to opportunities for improvements in care. The identifi cation of hospitals with signifi cantly higher 30-day mortality rates will promote review of clinical decision making in these hospitals. The fi ndings presented here could be used to improve clinical outcomes.

Articles
www.thelancet.com/oncology Vol 17 September 2016 1205
MethodsStudy design and data This population-based, observational study11 included all breast and lung cancer patients aged 24 years and older reported to have received SACT in England between Jan 1, and Dec 31, 2014, according to the SACT dataset, irrespective of the number of previous treatment cycles or programmes, and irrespective of their position within the disease trajectory.
The SACT dataset is a new resource at Public Health England, which started a phased implementation in 2012, and which collects information reported routinely by NHS hospital trusts about the treatment of cancer in England12 in four key areas: patient and tumour characteristics including age, sex, morphology, and performance status; hospital and consultant details, including General Medical Council (GMC) number; treatment characteristics including drug names and drug combinations (regimens); and outcome fi elds including date of most recent treatment and date of death (when applicable).
The appendix provides the full data standard, including a description of all 43 items recorded, with data fi eld formats as described in the NHS Data Dictionary13
(appendix p 1). Several data items are mandatory and submissions that omit them are rejected. These are primary patient and hospital trust identifi ers (NHS number, birth date, postcode, SACT provider organisation code) and key treatment details (SACT regimen name, regimen start date, and cycle number).
Phased introduction of data entry started in April, 2012. Monthly data submission has become mandatory for all trusts in England from April, 2014. By January, 2014, 141 (95%) of 148 trusts were routinely submitting at least the mandatory data items; because of trust mergers, the total number of trusts expected reduced to 147 by July 2014. We selected a reporting period of January to December, 2014, because this was the most complete calendar year of data that was available at the time this analysis was completed.14 This reporting period also allowed linkage with the English National Cancer Registration and Analysis Service (NCRAS), which improved data completeness when morphology, stage at diagnosis, and dates of death were missing from the SACT dataset.
Treatment and patientsWe defi ned SACT as any cytotoxic chemotherapy, active anticancer therapies such as monoclonal antibodies (eg, trastuzumab), and targeted biological treatments such as EGFR tyrosine kinase inhibitors. We excluded endocrine therapy and supportive therapy treatments such as bisphosphonates, denosumab, and anti-emetics. We did not distinguish between patients receiving combined chemo-radiotherapy and those receiving chemotherapy only, as this was poorly recorded in the SACT dataset at this stage.
We examined data for breast and lung cancer patients (identifi ed by the clinical codes in panel 1) because both had good data completeness in the SACT dataset; in 2014, data had been submitted for 18 976 (94%) of 20 265 patients with breast cancer and 13 405 (92%) of 14 527 patients with lung cancer who were reported to have commenced chemotherapy.13 We provide descriptive statistics on small cell lung cancer (SCLC) and non-small cell lung cancer (NSCLC) separately, based on morphology data (supplemented from cancer registry data where missing from the SACT dataset) because these cancer types generally require diff erent treatment strategies. We completed regression analysis on NSCLC, but not SCLC, because there were too few patients (n=3352) for robust statistical analysis in that group. We excluded from our regression analysis all patients for whom the start date of their last reported cycle of SACT was not reported because this precluded an assessment of 30-day mortality.
OutcomesOf the patients with breast or lung cancer reported to have received SACT in England between Jan 1, 2014, and Dec 31, 2014, we identifi ed those that died within 30 days of SACT (from all causes, including iatrogenic deaths or those due to disease progression) by calculating the time between the start date of the most recently reported SACT cycle in 2014 and, when relevant, the date of death for each patient. Cycle start date was defi ned as the day that the patient started receiving SACT treatment in that cycle irrespective of cycle length or route of administration. From this, we calculated a national 30-day mortality rate by dividing the number of patients that received SACT within 30 days of their death by the total number of patients that received SACT in the reporting period. The analysis of
See Online for appendix
Panel 1: Cancer site and morphology codes included in this analysis
Breast cancer: ICD10: C50, D05*, D24*
Lung cancer (NSCLC): ICD10: C33-C34, C37-C39; Morphology: M8012/3, M8013/3, M8046/3, M8050/3, M8070/3, M8070/6, M8071/3, M8072/3, M8074/3, M8075/3, M8140/3, M8140/6, M8200/3, M8240/3, M8246/3, M8249/3, M8250/3, M8253/3, M8255/3, M8260/3, M8263/3, M8310/3, M8370/3, M8470/3, M8480/3, M8481/3, M8490/3, M8520/3, M8550/3, M8560/3, M8574/3, M8575/3
Lung cancer (SCLC): ICD10: C33-C34, C37-C39; Morphology: M8002/3, M8041/3, M8042/3, M8044/3, M8045/3
Lung cancer (unknown morphology): ICD10: C33-C34, C37-C39; Morphology not recorded
*D05 (breast cancer in situ) and D24 (benign breast cancer), reported for only four patients, are included as it is very unlikely that in situ and benign breast cancers would have been treated with SACT, and more likely that these codes were reported in error.

Articles
1206 www.thelancet.com/oncology Vol 17 September 2016
30-day mortality was only done using the most recent cycle of SACT if a patient received multiple cycles in the year. Patients receiving multiple treatments in the year were counted only once in the dataset. We mainly used the date of death as reported for a patient through SACT dataset returns, but when that was unavailable, we extracted it from records in the NCRAS. All patients were traced through the NHS Demographics Services using matched identifi ers (including NHS number, date of birth, and sex).
There were 22 deaths for patients with breast cancer and 35 deaths for patients with lung cancer that were only recorded in NCRAS, not the SACT dataset or the NHS Demographics Service. Of these, only three were deaths within 30 days (for patients with lung cancer). 608 patients with breast cancer and 732 patients with NSCLC had confl icting dates of death recorded in the SACT versus NCRAS datasets; this resulted in a confl ict about 30-day mortality status (records fl agged as death within 30 days in one source but not the other) for 16 patients with breast cancer and 20 with NSCLC.
For 26 patients who died within 30 days of receiving SACT, death certifi cate data could not be found. The death certifi cate data may not be timely when inquests or coroner investigations are involved. Additionally, patients dying overseas might never have their date of death recorded in NCRAS, although an embarkation date might be recorded. When confl icting dates of death were recorded in the SACT dataset and NCRAS, we selected the date of death reported in the SACT dataset. One patient with lung cancer in the 30-day mortality group had a diff erent date of birth recorded in the cancer registry, so we used their date of birth recorded in the SACT dataset. For all other patients, NHS number, date of birth, and sex were identical in both databases.
Some trusts reported a high proportion of patients as having received only the fi rst cycle of SACT: 13 trusts that treated 574 patients with breast cancer, and 14 trusts that treated 302 patients with lung cancer, had a very high proportion (>80%) of patients for whom only the fi rst cycle of SACT was reported. Some of
these patients might have had subsequent cycles of chemotherapy that were not recorded in the SACT dataset.
Statistical analysis and explanatory variablesWe examined the association of age, performance status, income deprivation, whether patients had received previous SACT (as recorded in the SACT dataset), and BMI with 30-day mortality after SACT for breast and NSCLC patients. These variables are linked to patient care in a clinical setting in relation to SACT treatment; income deprivation, while not directly linked to patient care, refl ects other factors that are—for example, those in low-income areas might be more likely to smoke and have higher levels of comorbidity.
We also examined the association of sex and cancer stage at diagnosis with 30-day mortality for NSCLC patients only. We excluded male patients with breast cancer from our analysis, so did not study the association of sex with 30-day mortality for patients with breast cancer. We also did not examine the association of cancer stage at diagnosis with 30-day mortality for breast cancer because there can be a substantial time interval between diagnosis and SACT treatment for many breast cancer patients (eg, patients who relapse with metastatic disease several years after the initial diagnosis), making this indicator less clinically relevant than for lung cancer.
Income deprivation was not reported directly by NHS hospital trusts in the SACT dataset. Instead, we used patient postcodes, as reported in the dataset, to derive each patient’s income deprivation score from the English Indices of Deprivation 2010,15 and assigned patients into fi ve groups from least (group 1) to most (group 5) income deprived. We chose income deprivation over health-related indices, which would have been interrelated with our 30-day mortality outcome measure.
In the dataset there were missing values for performance status and BMI for patients with breast cancer or NSCLC, and stage for NSCLC (table 1). Inspection of the data showed that for performance status, this was mainly the result of a few trusts not reporting this measure: four trusts reported no performance status data, one of which was a large trust, and 12 trusts had 10% or less completion of performance status data. Therefore, these data were missing not at random (MNAR) at trust level. We assumed data were missing completely at random (MCAR) at the patient level because we found no evidence to the contrary, and these trusts provided care for a range of patients.
Height and weight data (used to calculate BMI) are less likely to be recorded for patients receiving treatments with a fi xed dose; however, many patients included in our study received treatments that were dosed according to body surface area or weight, some of whom also had missing height and weight data, which probably obscures this association between BMI and
Patients with breast cancer (n=23 228*)
Patients with NSCLC (n=9364*)
None 11 787 (51%) 5492 (59%)
1: BMI 1203 (5%) 757 (8%)
1: Stage 2960 (13%) 366 (4%)
1: PS 3345 (14%) 1756 (19%)
2: Stage, BMI 359 (2%) 51 (1%)
2: PS, BMI 1707 (7%) 964 (10%)
2: PS, stage 1113 (5%) 135 (1%)
3: PS, stage, BMI 754 (3%) 113 (1%)
Data are n (%). NSCLC=non-small cell lung cancer. PS=performance status. *These total numbers are patients treated with curative and palliative intents only, and do not include those for whom treatment intent was unknown.
Table 1: Patterns of missing values in the SACT dataset for PS, stage, and BMI for all patients with breast or NSCLC

Articles
www.thelancet.com/oncology Vol 17 September 2016 1207
treatment regimen. Additionally, some trusts with low patient volumes (<400 patients) reported no height or weight data, giving some evidence for an association between BMI and treating trust, although this link is probably weak.
Data for stage at diagnosis were more complete: stage was reported for 10 408 (93%) of 11 199 patients with lung cancer and 13 883 (89%) of 15 626 patients with curative breast cancer, compared with 4159 (55%) of 7602 patients with palliative breast cancer, suggesting that stage at diagnosis data were more likely to be reported when patients had a smaller time interval between diagnosis and last reported treatment. Most patients with breast cancer receiving palliative treatment are likely to be stage IV (the most advanced stage); therefore, clinicians might be less likely to record stage at diagnosis for these patients because it is assumed to be stage IV. Thus, there was evidence of an association between stage at diagnosis and treatment intent.
Because we assumed that performance status was MCAR, and that BMI and stage seemed to be only weakly related to treatment regimen and intent, respectively, we hypothesised that there would be no variables upon which we could base multiple imputation. We tested this by attempting multiple imputation16 using the ice command in Stata, based on variables of age, sex, intent of treatment, patients not having received any previous SACT as recorded in the dataset from 2012–14 (treatment naive), regimen, income deprivation group, cancer type (breast or lung cancer), treating trust, and death within 30 days.
We used a train-test approach to assess the accuracy of this imputed data, whereby from all known data, we used the multiple imputation algorithm to estimate 1%, 5%, 10%, and 20% of the data in multiple tests. This approach showed the multiple imputation was very error-prone. Based on this fi nding, we opted to create unknown categories for performance status, BMI, and stage. Because the unknown category consists of data from the remaining categories, this will add noise to the model and reduce statistical power. These unknown categories were also used for risk adjustment in the funnel plot.
Regression analysis and risk-adjustmentWe used logistic regression analysis to assess any associations between the explanatory variables and 30-day mortality. We present the results of these logistic regression analyses as adjusted odds ratios (OR) that refl ect the eff ect of each variable in our multivariable regression model, alongside the unadjusted OR and proportion of patients with 30-day mortality. We used Z-tests to examine signifi cance and a p value of 0·01 for statistical signifi cance associated with the OR. We used the collin command in Stata to diagnose co-linearity between variables in the model. For each model, the mean variance infl ation factor was lower than 1·04,
which suggests that there were no issues with co-linearity between model terms.
We plotted the errors of the residuals in the model, which showed that the variables in our model were equally variable and indicated that the assumptions of our regression model were valid. To select the model that best described our data,17–19 we used the Bayesian Information Criterion (BIC) for model comparison. In addition to testing the main eff ects presented here, we tested models with interactions modelled between age and performance status, age and BMI, and for NSCLC only, sex and performance status, and sex and BMI. In each case, the model fi t was inferior.
Analyses were completed separately by cancer type (breast or NSCLC) further separated by treatment intent (curative or palliative) in four regression analyses. The treatment intent was specifi ed at the time the clinicians prescribed SACT. Panel 2 provides typical defi nitions of treatment intent, but these were not specifi ed in the SACT dataset. In some cases individual clinicians might have used slightly diff erent defi nitions of curative and palliative treatment. In this fi rst analysis of the SACT dataset, we did not do separate regression analyses for each mode of treatment we included as curative (panel 2), because this would have resulted in smaller group sizes and thus lower statistical power.
We compared 30-day mortality rates between the following groups for age, performance status, income deprivations, previous SACT treatment, BMI, sex (NSCLC), and tumour stage at diagnosis (NSCLC). We assessed age as a continuous variable for both patients with breast cancer and those with NSCLC. For performance status, we recorded patients as PS 0 (asymptomatic), PS 1 (symptomatic, still able to carry out light activities), PS 2–4 (symptomatic patients requiring any amount of bed rest during the day, or who were completely bed bound, grouped together because of small patient numbers), and performance status not recorded. For income deprivation, we compared patients
Panel 2: Typical defi nitions of curative and palliative intent used in this study, as recorded by trusts in electronic prescribing systems
Curative modes of treatment1 Adjuvant: given after surgery to reduce the chance of the
cancer spreading or coming back2 Neoadjuvant: given before surgery to shrink a tumour and
make surgery possible or less disfi guring3 Curative: given alone without other forms of treatment to
try to cure the cancer completely
Palliative modes of treatment1 Palliative: given to maintain or improve the quality of life
for patients with advanced incurable cancer for as long as possible, by controlling the growth of a cancer and providing symptom relief
Articles
1208 www.thelancet.com/oncology Vol 17 September 2016
in income domain group 3 (the middle level of socioeconomic deprivation based on household income) with those in group 1 (least deprived), 2, 4, and 5 (most deprived). For previous SACT treatment, we compared patients for whom one or more previous systemic
anticancer treatments were recorded in the SACT dataset before the qualifying treatment used in this study with patients for whom no previous systemic anticancer treatments were recorded in any year (2012–14) of the database (treatment naive). For BMI, we compared patients with BMI scores in the healthy weight range (BMI 18·5 to <25 kg/m²) with those in the underweight range (BMI <18·5 kg/m²), overweight (BMI 25 to <30 kg/m²), and obese categories (BMI >30 kg/m²), and those for whom BMI information was not recorded. Specifi cally in patients with NSCLC, we compared male and female patients and tumour stage at diagnosis—patients with stage III NSCLC compared with patients with stage I, II, and IV NSCLC, and, where relevant, patients for whom stage was not recorded.
To generate funnel plots, for every hospital trust, we calculated risk-adjusted mortality rates for breast curative, breast palliative, NSCLC curative, and NSCLC palliative as well as the patient volume treated with SACT for each of these patient categories. The factors included in the risk adjustment were the same as those detailed for the logistic regression analyses (eg, age, perfor mance status, BMI, and stage at diagnosis).
As noted in the methods for multiple imputation, the large number of missing values for performance status were a result of a small number of trusts not providing any performance status information. We used the risk-adjusted mortality rate to create funnel plots using the “funnelcompar” command in Stata, which gave the 95% and 99·8% control limits (dashed lines on the graphs) and the national risk-adjusted 30-day mortality rate (the horizontal line on each graph).
Role of the funding sourceThere was no funding source for this study. MWa and SM had access to the raw data; all authors had access to aggregated data and all analyses. The corresponding author had full access to all aggregated data and analyses and the fi nal responsibility to submit for publication.
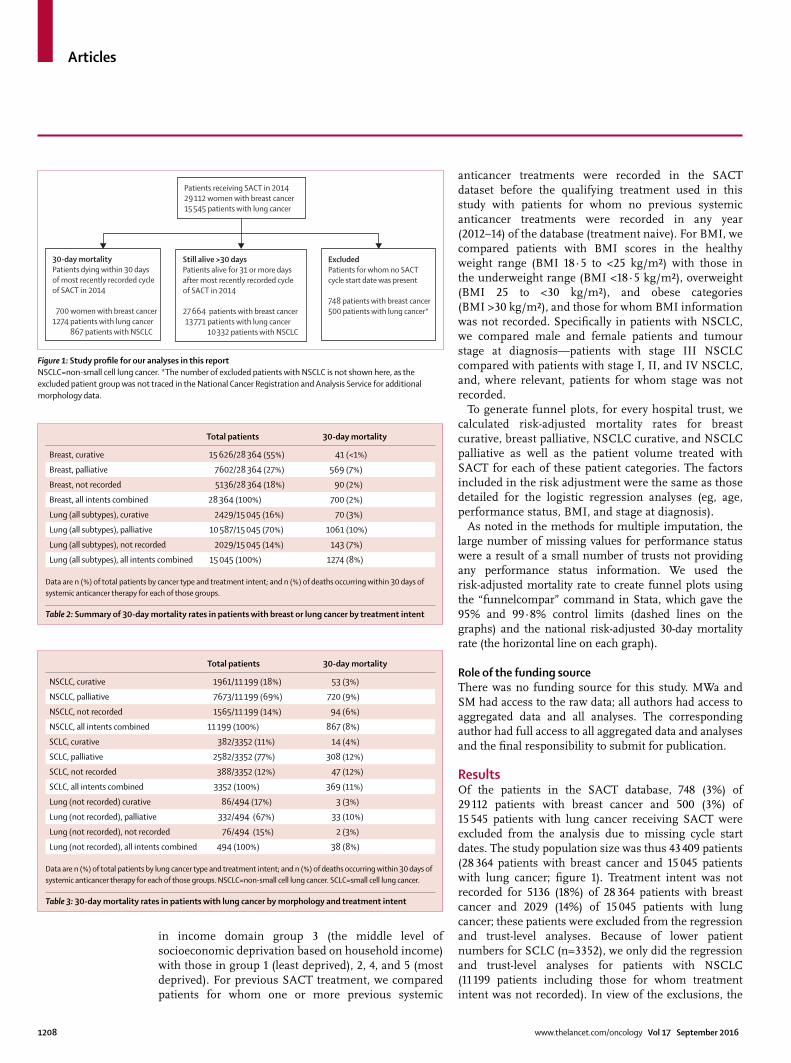
Results Of the patients in the SACT database, 748 (3%) of 29 112 patients with breast cancer and 500 (3%) of 15 545 patients with lung cancer receiving SACT were excluded from the analysis due to missing cycle start dates. The study population size was thus 43 409 patients (28 364 patients with breast cancer and 15 045 patients with lung cancer; fi gure 1). Treatment intent was not recorded for 5136 (18%) of 28 364 patients with breast cancer and 2029 (14%) of 15 045 patients with lung cancer; these patients were excluded from the regression and trust-level analyses. Because of lower patient numbers for SCLC (n=3352), we only did the regression and trust-level analyses for patients with NSCLC (11 199 patients including those for whom treatment intent was not recorded). In view of the exclusions, the
Figure 1: Study profi le for our analyses in this report NSCLC=non-small cell lung cancer. *The number of excluded patients with NSCLC is not shown here, as the excluded patient group was not traced in the National Cancer Registration and Analysis Service for additional morphology data.
30-day mortalityPatients dying within 30 daysof most recently recorded cycle of SACT in 2014
700 women with breast cancer1274 patients with lung cancer
867 patients with NSCLC
Patients receiving SACT in 201429 112 women with breast cancer15 545 patients with lung cancer
Still alive >30 daysPatients alive for 31 or more days after most recently recorded cycle of SACT in 2014
27 664 patients with breast cancer13 771 patients with lung cancer
10 332 patients with NSCLC
ExcludedPatients for whom no SACTcycle start date was present
748 patients with breast cancer500 patients with lung cancer*
Total patients 30-day mortality
Breast, curative 15 626/28 364 (55%) 41 (<1%)
Breast, palliative 7602/28 364 (27%) 569 (7%)
Breast, not recorded 5136/28 364 (18%) 90 (2%)
Breast, all intents combined 28 364 (100%) 700 (2%)
Lung (all subtypes), curative 2429/15 045 (16%) 70 (3%)
Lung (all subtypes), palliative 10 587/15 045 (70%) 1061 (10%)
Lung (all subtypes), not recorded 2029/15 045 (14%) 143 (7%)
Lung (all subtypes), all intents combined 15 045 (100%) 1274 (8%)
Data are n (%) of total patients by cancer type and treatment intent; and n (%) of deaths occurring within 30 days of systemic anticancer therapy for each of those groups.
Table 2: Summary of 30-day mortality rates in patients with breast or lung cancer by treatment intent
Total patients 30-day mortality
NSCLC, curative 1961/11 199 (18%) 53 (3%)
NSCLC, palliative 7673/11 199 (69%) 720 (9%)
NSCLC, not recorded 1565/11 199 (14%) 94 (6%)
NSCLC, all intents combined 11 199 (100%) 867 (8%)
SCLC, curative 382/3352 (11%) 14 (4%)
SCLC, palliative 2582/3352 (77%) 308 (12%)
SCLC, not recorded 388/3352 (12%) 47 (12%)
SCLC, all intents combined 3352 (100%) 369 (11%)
Lung (not recorded) curative 86/494 (17%) 3 (3%)
Lung (not recorded), palliative 332/494 (67%) 33 (10%)
Lung (not recorded), not recorded 76/494 (15%) 2 (3%)
Lung (not recorded), all intents combined 494 (100%) 38 (8%)
Data are n (%) of total patients by lung cancer type and treatment intent; and n (%) of deaths occurring within 30 days of systemic anticancer therapy for each of those groups. NSCLC=non-small cell lung cancer. SCLC=small cell lung cancer.
Table 3: 30-day mortality rates in patients with lung cancer by morphology and treatment intent
Articles
www.thelancet.com/oncology Vol 17 September 2016 1209
fi nal cohort for regression and trust-level analyses included 23 228 patients with breast cancer and 9634 patients with NSCLC.
The median patient age was 54 years (IQR 47–64) for patients with breast cancer treated with curative intent; 61 years (51–70) for patients with palliative breast cancer; 67 years (61–73) for patients with NSCLC treated with curative intent; and 68 years (61–74) for patients with NSCLC treated with palliative intent. The appendix shows the distribution of age, performance status, income deprivation, and BMI by age for patients with breast and NSCLC treated with curative and palliative intent (appendix pp 2–4).
Data for performance status, a measure of patients’ level of cancer symptoms and general wellbeing,20 was not reported for 6919 (30%) of 23 228 patients with breast cancer and 2968 (31%) of 9634 patients with NSCLC, for whom treatment intent was recorded. A further 2139 (42%) of 5136 patients with breast cancer and 530 (34%) of 1565 patients with NSCLC, were missing both performance status and treatment intent.
Overall, 30-day mortality was higher for patients with lung cancer (1274/15 045 [9%]; table 2) than patients with breast cancer (700/28 364 [3%]; table 2), and in each treatment intent category (curative, palliative, and unknown; table 2). 30-day mortality was lowest for patients with breast or lung cancer receiving systemic anticancer therapy for curative rather than for palliative purposes: 41/15 626 (<1%) versus 569/7602 (8%) for breast cancer, and 70/2429 (3%) versus 1061/10 587 (10%) for lung cancer (table 2). 30-day mortality was higher for curative SCLC (14/382 [4%]) than curative NSCLC patients, (53/1961 [3%]) and for palliative SCLC (308/2582 [12%]) than palliative NSCLC (720/7673 [9%]) patients (table 3).
Using the information available on death certifi cates, provided through the Offi ce for National Statistics, cancer was confi rmed as the underlying cause of death for 1279 (92%) of 1384 patients with breast cancer or NSCLC dying within 30 days of curative or palliative chemotherapy. For the remaining 105 (8%) of patients, most death certifi cates mentioned cancer.
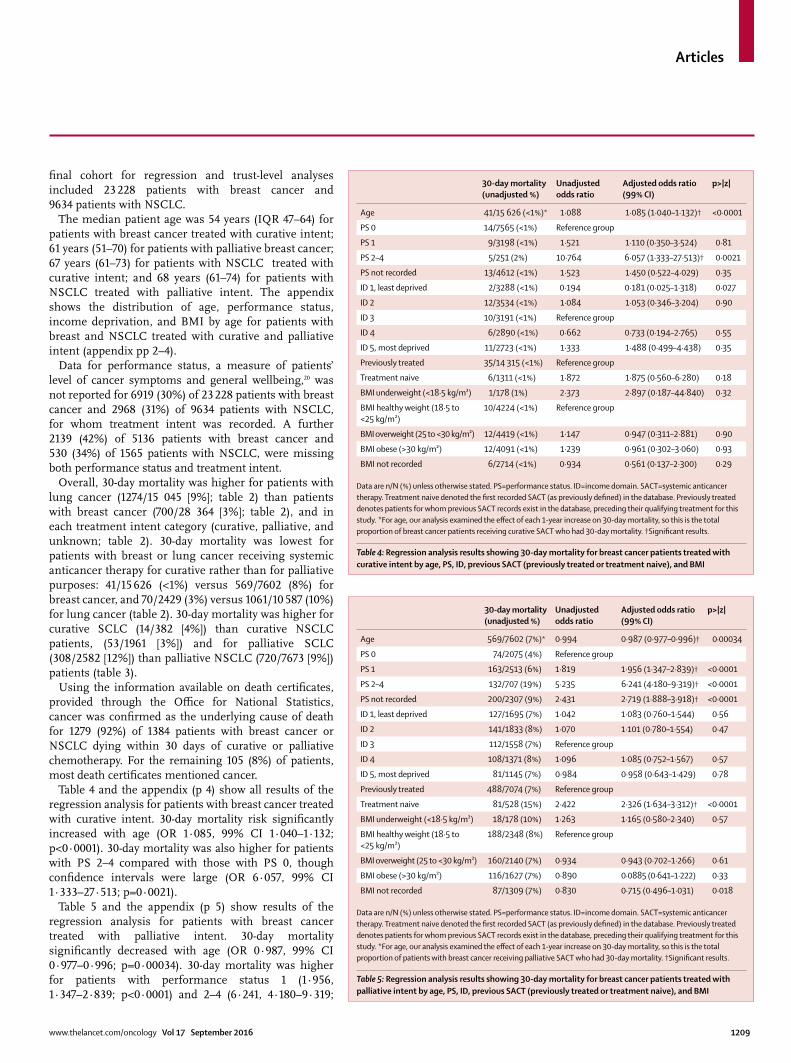
Table 4 and the appendix (p 4) show all results of the regression analysis for patients with breast cancer treated with curative intent. 30-day mortality risk signifi cantly increased with age (OR 1·085, 99% CI 1·040–1·132; p<0·0001). 30-day mortality was also higher for patients with PS 2–4 compared with those with PS 0, though confi dence intervals were large (OR 6·057, 99% CI 1·333–27·513; p=0·0021).
Table 5 and the appendix (p 5) show results of the regression analysis for patients with breast cancer treated with palliative intent. 30-day mortality signifi cantly decreased with age (OR 0·987, 99% CI 0·977–0·996; p=0·00034). 30-day mortality was higher for patients with performance status 1 (1·956, 1·347–2·839; p<0·0001) and 2–4 (6·241, 4·180–9·319;
30-day mortality (unadjusted %)
Unadjusted odds ratio
Adjusted odds ratio (99% CI)
p>|z|
Age 41/15 626 (<1%)* 1·088 1·085 (1·040–1·132)† <0·0001
PS 0 14/7565 (<1%) Reference group
PS 1 9/3198 (<1%) 1·521 1·110 (0·350–3·524) 0·81
PS 2–4 5/251 (2%) 10·764 6·057 (1·333–27·513)† 0·0021
PS not recorded 13/4612 (<1%) 1·523 1·450 (0·522–4·029) 0·35
ID 1, least deprived 2/3288 (<1%) 0·194 0·181 (0·025–1·318) 0·027
ID 2 12/3534 (<1%) 1·084 1·053 (0·346–3·204) 0·90
ID 3 10/3191 (<1%) Reference group
ID 4 6/2890 (<1%) 0·662 0·733 (0·194–2·765) 0·55
ID 5, most deprived 11/2723 (<1%) 1·333 1·488 (0·499–4·438) 0·35
Previously treated 35/14 315 (<1%) Reference group
Treatment naive 6/1311 (<1%) 1·872 1·875 (0·560–6·280) 0·18
BMI underweight (<18·5 kg/m²) 1/178 (1%) 2·373 2·897 (0·187–44·840) 0·32
BMI healthy weight (18·5 to <25 kg/m²)
10/4224 (<1%) Reference group
BMI overweight (25 to <30 kg/m²) 12/4419 (<1%) 1·147 0·947 (0·311–2·881) 0·90
BMI obese (>30 kg/m²) 12/4091 (<1%) 1·239 0·961 (0·302–3·060) 0·93
BMI not recorded 6/2714 (<1%) 0·934 0·561 (0·137–2·300) 0·29
Data are n/N (%) unless otherwise stated. PS=performance status. ID=income domain. SACT=systemic anticancer therapy. Treatment naive denoted the fi rst recorded SACT (as previously defi ned) in the database. Previously treated denotes patients for whom previous SACT records exist in the database, preceding their qualifying treatment for this study. *For age, our analysis examined the eff ect of each 1-year increase on 30-day mortality, so this is the total proportion of breast cancer patients receiving curative SACT who had 30-day mortality. †Signifi cant results.
Table 4: Regression analysis results showing 30-day mortality for breast cancer patients treated with curative intent by age, PS, ID, previous SACT (previously treated or treatment naive), and BMI
30-day mortality (unadjusted %)
Unadjusted odds ratio
Adjusted odds ratio (99% CI)
p>|z|
Age 569/7602 (7%)* 0·994 0·987 (0·977–0·996)† 0·00034
PS 0 74/2075 (4%) Reference group
PS 1 163/2513 (6%) 1·819 1·956 (1·347–2·839)† <0·0001
PS 2–4 132/707 (19%) 5·235 6·241 (4·180–9·319)† <0·0001
PS not recorded 200/2307 (9%) 2·431 2·719 (1·888–3·918)† <0·0001
ID 1, least deprived 127/1695 (7%) 1·042 1·083 (0·760–1·544) 0·56
ID 2 141/1833 (8%) 1·070 1·101 (0·780–1·554) 0·47
ID 3 112/1558 (7%) Reference group
ID 4 108/1371 (8%) 1·096 1·085 (0·752–1·567) 0·57
ID 5, most deprived 81/1145 (7%) 0·984 0·958 (0·643–1·429) 0·78
Previously treated 488/7074 (7%) Reference group
Treatment naive 81/528 (15%) 2·422 2·326 (1·634–3·312)† <0·0001
BMI underweight (<18·5 kg/m²) 18/178 (10%) 1·263 1·165 (0·580–2·340) 0·57
BMI healthy weight (18·5 to <25 kg/m²)
188/2348 (8%) Reference group
BMI overweight (25 to <30 kg/m²) 160/2140 (7%) 0·934 0·943 (0·702–1·266) 0·61
BMI obese (>30 kg/m²) 116/1627 (7%) 0·890 0·0885 (0·641–1·222) 0·33
BMI not recorded 87/1309 (7%) 0·830 0·715 (0·496–1·031) 0·018
Data are n/N (%) unless otherwise stated. PS=performance status. ID=income domain. SACT=systemic anticancer therapy. Treatment naive denoted the fi rst recorded SACT (as previously defi ned) in the database. Previously treated denotes patients for whom previous SACT records exist in the database, preceding their qualifying treatment for this study. *For age, our analysis examined the eff ect of each 1-year increase on 30-day mortality, so this is the total proportion of patients with breast cancer receiving palliative SACT who had 30-day mortality. †Signifi cant results.
Table 5: Regression analysis results showing 30-day mortality for breast cancer patients treated with palliative intent by age, PS, ID, previous SACT (previously treated or treatment naive), and BMI

Articles
1210 www.thelancet.com/oncology Vol 17 September 2016
p<0·0001) compared with those with a performance status score of 0. Patients for whom performance status was not recorded also had a higher 30-day mortality than those with PS 0 (2·719, 1·888–3·918; p<0·0001). Treatment-naive patients receiving palliative treatment had a signifi cantly higher 30-day mortality than those for whom previous SACTs are recorded in the dataset between 2012 and 2014 (OR 2·326, 99% CI 1·634–3·312; p<0·0001).
Table 6 and the appendix (p 6) show results of the regression analysis for patients with NSCLC treated with curative intent. As with patients with breast cancer, 30-day mortality signifi cantly increased with age for patients with NSCLC treated with curative intent (OR 1·045, 99% CI 1·013–1·079; p<0·00033). Treatment-naive patients had signifi cantly higher 30-day mortality than those for whom previous systemic anticancer treatments were recorded in the dataset between 2012 and 2014 (OR 3·371, 99% CI 1·554–7·316; p=0·00033).
Table 7 and the appendix (p 7) show results of the regression analysis for patients with NSCLC treated with palliative intent. As for breast cancer patients, 30-day mortality decreased with age for patients with NSCLC treated with palliative intent (OR 0·987, 99% CI 0·976–0·998; p=0·0015). 30-day mortality was higher for those with PS 1 (OR 1·452, 99% CI 1·012–2·083; p=0·0078), and PS 2–4 (OR 3·384, 99% CI 2·276–5·032; p<0·0001) than those with PS 0. Treatment-naive patients had signifi cantly higher 30-day mortality than those for whom previous SACT was recorded in the dataset between 2012 and 2014 (OR 2·667, 99% CI 2·109–3·373; p<0·0001). 30-day mortality was also signifi cantly higher for patients with stage IV (advanced) than stage III tumours (OR 1·438, 95% CI 1·099–1·883; p=0·00051).
Figures 2–5 show risk-adjusted funnel plots for diff erent modalities of treatment and cancer type, by hospital trust. We identifi ed hospital trusts that had signifi cantly higher 30-day mortality rates. This included seven trusts for breast curative, four for breast palliative, fi ve for NSCLC curative, and seven for NSCLC palliative.
DiscussionIn our population-based study of English breast and lung cancer patients, 30-day mortality increased with age for both patients with breast cancer or NSCLC receiving curative SACT, and decreased with age for patients receiving palliative SACT. Patients with breast cancer or NSCLC with worse general wellbeing (indicated by higher PS scores) had higher 30-day mortality than those who were generally well (PS 0), and 30-day mortality was also higher for treatment-naive patients than those who had any previously recorded cycles of SACT between 2012 and 2014. Our funnel plots showed that 30-day mortality varied between trusts, with values for some trusts exceeding the 95% control limits. Individual trust data will be discussed in a Public Health England report.
To our knowledge, this is the fi rst time these benchmarks in 30-day mortality after SACT have been established on a national basis. The 2011 national cancer strategy for England proposed 30-day mortality as a potential national clinical indicator of avoidable harm from SACT21 and it has been used as a clinically relevant indicator for SACT in previously published work.5 These benchmarks can provide a better understanding of the patient characteristics associated with increased 30-day mortality and start to support improved clinical treatment decision making and identify those hospital trusts where clinical practice and data management should be reviewed.
A particular strength of 30-day mortality as an outcome measure is that it avoids issues with the details and coding of causes of death on death certifi cates. For example, cancer was the cause of death listed for
30-day mortality (unadjusted %)
Unadjusted odds ratio
Adjusted odds ratio (99% CI)
p>|z|
Age 53/1961 (3%)* 1·045 1·045 (1·013–1·079)† 0·00033
PS 0 13/480 (3%) Reference group
PS 1 18/809 (2%) 0·822 0·709 (0·272–1·846) 0·35
PS 2-4 4/88 (5%) 1·678 1·190 (0·256–5·526) 0·77
PS not recorded 18/584 (3%) 1·138 0·977 (0·365–2·614) 0·95
ID 1, least deprived 8/266 (3%) 1·181 1·097 (0·317–3·791) 0·85
ID 2 7/380 (2%) 0·723 0·716 (0·202–2·537) 0·50
ID 3 11/432 (3%) Reference group
ID 4 13/424 (3%) 1·204 1·218 (0·414–3·584) 0·64
ID 5, most deprived 14/459 (3%) 1·198 1·277 (0·442–3·690) 0·55
Previously treated 30/1585 (2%) Reference group
Treatment naive 23/376 (6%) 3·232 3·371 (1·554–7·316)† <0·0001
BMI underweight (<18·5 kg/m²) 3/68 (4%) 1·752 2·055 (0·369–11·440) 0·28
BMI healthy weight (18·5 to <25 kg/m²)
17/675 (3%) Reference group
BMI overweight (25 to <30 kg/m²) 12/578 (2%) 0·824 0·721 (0·263–1·981) 0·41
BMI obese (>30 kg/m²) 10/327 (3%) 1·214 1·242 (0·433–3·564) 0·60
BMI not recorded 11/313 (4%) 1·581 0·947 (0·332–2·700) 0·89
Female 19/886 (2%) 0·678 0·655 (0·309–1·388) 0·15
Male 34/1075 (3%) Reference group
Stage I 5/184 (3%) 0·993 1·045 (0·287–3·810) 0·93
Stage II 12/521 (2%) 0·842 0·833 (0·338–2·054) 0·60
Stage III 28/1023 (3%) Reference group
Stage IV 7/168 (4%) 1·522 1·676 (0·550–5·111) 0·23
Stage not recorded 1/65 (2%) 0·562 0·517 (0·034–7·944) 0·53
Data are n/N (%) unless otherwise stated. PS=performance status. ID=income domain. SACT=systemic anitcancer therapy. NSCLC=non-small cell lung cancer. Treatment naive denoted the fi rst recorded SACT (as previously defi ned) in the database. Previously treated denotes patients for whom previous SACT records exist in the database, preceding their qualifying treatment for this study. *For age, our analysis examined the eff ect of each 1-year increase on 30-day mortality, so this is the total proportion of patients with NSCLC receiving curative SACT who had 30-day mortality. †Signifi cant results.
Table 6: Regression analysis results showing 30-day mortality for patients with NSCLC treated with curative intent by age, PS, ID, previous SACT (previously treated or treatment naive), BMI, sex, and cancer stage

Articles
www.thelancet.com/oncology Vol 17 September 2016 1211
nearly all patients in our study, including those dying within 30 days of receiving SACT. Therefore, death certifi cates would not have provided enough detail to assess what factors lead to the patient’s death. However, we know that patients who die within 30 days of receiving SACT are very unlikely to receive any benefi t from it irrespective of what their cause of death was. It is therefore not necessary to know whether death was caused by side-eff ects from treatment, cancer pro-gression, or any other causes to examine factors that increase the risk of experiencing net harm rather than net benefi t from receiving SACT.
The large cohort of breast and lung cancer patients included in the SACT dataset gives confi dence that the associations we recorded between a number of variables and higher early mortality in England are real, despite some issues with data completeness, which we expect to improve in subsequent years of data collection.
The large, signifi cant increase in 30-day mortality for treatment-naive patients suggests that particular care and an emphasis on the early reporting of toxic eff ects should be undertaken in patients who are SACT treatment naive. This approach is consistent with fi ndings of a previous study of the toxic eff ects from lung cancer treatment.22 To our knowledge there are no previous studies of treatment-naive status in this context, so we are unable to identify the reasons behind the increased 30-day mortality for these patients.
Our identifi cation of treatment-naive patients relied on treatment records taken from the SACT dataset alone and there are two known data issues reducing the accuracy of this grouping. The database was only implemented in 2012 and made mandatory in April, 2014, so data for previous SACT treatments might be missing for some patients (eg, those who received a previous treatment before 2012). This issue will be most pronounced when there is a long gap between penultimate and last reported treatments—eg, for recurrent tumours. Therefore, we might have overestimated the number of treatment-naive patients. Additionally, the challenge of some trusts only recording patients’ fi rst cycle of SACT means we might be underestimating early mortality from SACT and overestimating the increased risk associated with treatment-naive patients. As data completeness improves in subsequent years, a clearer understanding of the association between treatment-naive status and 30-day mortality will be possible.
30-day mortality increased with age for patients with breast cancer and NSCLC treated with curative intent,
30 day mortality (unadjusted %)
Unadjusted odds ratio
Adjusted odds ratio (99% CI)
p>|z|
Age 720/7673 (9%)* 0·989 0·987 (0·976–0·998)† 0·0015
PS 0 73/1354 (5%) Reference group
PS 1 237/3051 (8%) 1·441 1·452 (1·012–2·083)† 0·0078
PS 2–4 151/884 (17%) 3·168 3·384 (2·276–5·032)† <0·0001
PS not recorded 259/2384 (11%) 2·015 2·123 (1·476–3·055)† <0·0001
ID 1, least deprived 104/1225 (8%) 0·857 0·898 (0·633–1·276) 0·43
ID 2 147/1496 (10%) 0·948 1·043 (0·759–1·435) 0·73
ID 3 155/1565 (10%) Reference group
ID 4 145/1679 (9%) 0·872 0·853 (0·620–1·174) 0·20
ID 5, most deprived 169/1708 (10%) 0·999 0·964 (0·706–1·316) 0·76
Previously treated 494/6477 (8%) Reference group
Treatment naive 226/1196 (19%) 2·478 2·667 (2·109–3·373)† <0·0001
BMI underweight (<18·5 kg/m²) 43/333 (13%) 1·202 1·141 (0·711–1·830) 0·47
BMI healthy weight (18·5 to <25 kg/m²)
287/2671 (11%) Reference group
BMI overweight (25 to <30 kg/m²)
159/2070 (8%) 0·715 0·706 (0·538–0·925)† 0·00090
BMI obese (>30 kg/m²) 81/1027 (8%) 0·734 0·730 (0·518–1·029) 0·018
BMI not recorded 150/1572 (10%) 0·888 0·733 (0·545–0·986)† 0·0070
Female 287/3583 (8%) 0·757 0·733 (0·594–0·905)† 0·00014
Male 433/4090 (11%) Reference group
Stage I 18/313 (6%) 0·792 0·731 (0·377–1·421) 0·22
Stage II 25/345 (7%) 0·998 1·019 (0·562–1·850) 0·93
Stage III 135/1859 (7%) Reference group
Stage IV 488/4556 (11%) 1·475 1·438 (1·099–1·883)† 0·00051
Stage not recorded 54/600 (9%) 1·239 1·207 (0·779–1·873) 0·27
Data are n/N (%) unless otherwise stated. PS=performance status. ID=income domain. SACT=systemic anticancer therapy. NSCLC=non-small cell lung cancer. Treatment naive denotes the fi rst recorded SACT (as previously defi ned) in the database. Previously treated denotes patients for whom previous SACT records exist in the database, preceding their qualifying treatment for this study. *For age, our analysis examined the eff ect of each 1-year increase on 30-day mortality, so this is the total proportion of patients with NSCLC receiving palliative SACT who had 30-day mortality. †Signifi cant results.
Table 7: Regression analysis results showing 30-day mortality for patients with NSCLC treated with palliative intent by age, PS, ID, previous SACT (previously treated or treatment naive), BMI, sex, and cancer stage
Figure 2: Funnel plot of variation in risk-adjusted 30-day mortality in patients with breast cancer given systemic anticancer therapy with curative
intent, by hospital trustEach circle represents a separate hospital trust; blue and red circles represent outliers beyond the 95% and 99·8% confi dence interval boundaries that are represented as
grey lines. Red line shows national risk-adjusted 30-day mortality rate.
0 100 200 300 400 500 600 700 800 900 1000 1100 12000
1
2
3
4
5
Risk
-adj
uste
d 30
-day
pos
t-ch
emot
hera
py m
orta
lity
perc
enta
ge
Number of patients receiving chemotherapy (2014)

Articles
1212 www.thelancet.com/oncology Vol 17 September 2016
perhaps because older patients are generally more frail and less able to tolerate SACT than are younger patients. Conversely, 30-day mortality decreased with age for patients with breast cancer and NSCLC treated with palliative intent, perhaps because older patients are less likely likely than younger patients to accept or be prescribed SACT treatment that might extend their life in favour of other palliative care options to relieve pain or discomfort. Alternatively younger patients might have more aggressive disease with a higher risk of non-iatrogenic cancer mortality.23
The fi nding that 30-day mortality increased with worsening performance status for patients with breast cancer or NSCLC treated with palliative intent could be because patients with poorer general health are less able to tolerate the negative side-eff ects of SACT compared with healthier individuals, to an extent where the toxic eff ects outweigh the benefi cial eff ects.5 These fi ndings suggest great care is required when advising chemo-therapy in this patient group.
We noted that 30-day mortality was signifi cantly higher for patients with breast cancer or NSCLC receiving palliative SACT for whom performance status was not recorded compared with those with PS 0. Therefore, patients with no recorded performance status are likely to be mainly a mix of patients with PS 1–4. This result might be because PS 0 is relatively easy to defi ne, but it might be more diffi cult for clinicians to score the extent of reduced wellbeing.
Our fi nding that 30-day mortality was lower in women with lung cancer than in men with lung cancer given palliative SACT was expected. Previous data suggest that women with lung cancer are generally diagnosed at an earlier age, with a more localised cancer, and have better survival.20 However, to our knowledge there have been no specifi c investigations of early mortality in this context prior to our study, so we are unable at this stage to suggest why sex aff ects 30-day mortality risk in particular. The increased 30-day mortality for NSCLC patients receiving palliative SACT who had advanced cancers was also expected because these patients are typically less well; although again, no previous studies have, to our knowledge, investigated the eff ect of cancer stage on early mortality specifi cally.
The fi nding that overweight NSCLC patients treated with palliative intent had a reduced 30-day mortality compared with those in the healthy BMI group could be explained by dose-limitation practices. Chemotherapy doses are calculated according to patient height and weight, but smaller doses than this are often given to patients with higher BMI.24,25 These practices might reduce short-term mortality in overweight patients. However, long-term survival might be lower for these patients than those with a healthy BMI if the administered dose is not high enough to eff ectively reduce tumour growth and spread. Research into whether there are longer-term survival diff erences between overweight and healthy weight patients could help to elucidate whether there is a problem with under-dosing for larger patients. We also noted that underweight patients with NSCLC had higher 30-day mortality compared with those with normal weight. Weight loss is an adverse prognostic factor in lung cancer26 and could explain this trend, though the diff erence recorded was non-signifi cant.
The relative risk of overall mortality in obese and overweight patients with breast cancer is increased compared with healthy weight individuals,27 which
Figure 3: Funnel plot of variation in risk-adjusted 30-day mortality in patients with breast cancer given systemic anticancer therapy with palliative intent, by hospital trustEach circle represents a separate hospital trust; blue and red circles represent outliers beyond the 95% and 99·8% confi dence interval boundaries that are represented as grey lines. Red line shows national risk-adjusted 30-day mortality rate.
0 50 100 150 200 250 300 350 400 450 5000
10
15
5
20
25
30
35
40
45
50
Risk
-adj
uste
d 30
-day
pos
t-ch
emot
hera
py m
orta
lity
perc
enta
ge
Number of patients receiving chemotherapy (2014)
Figure 4: Funnel plot showing variation in risk-adjusted 30-day mortality in patients with non-small cell lung cancer given systemic anticancer therapy with curative intent, by hospital trustEach circle represents a separate hospital trust; blue and red circles represent outliers beyond the 95% and 99·8% confi dence interval boundaries that are represented as grey lines. Red line shows national risk-adjusted 30-day mortality rate.
0 10 20 30 40 50 60 70 80 90 100 110 120 1300
10
15
5
20
25
30
35
40
45
50
Risk
-adj
uste
d 30
-day
pos
t-ch
emot
hera
py m
orta
lity
perc
enta
ge
Number of patients receiving chemotherapy (2014)
Articles
www.thelancet.com/oncology Vol 17 September 2016 1213
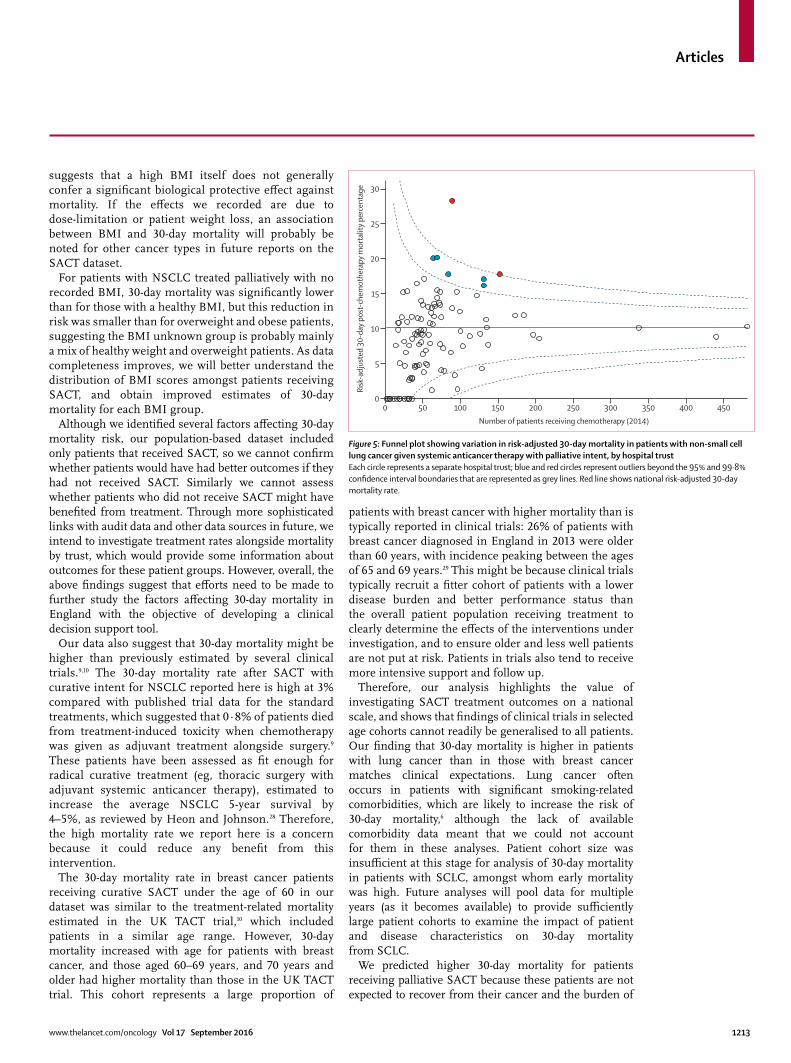
suggests that a high BMI itself does not generally confer a signifi cant biological protective eff ect against mortality. If the eff ects we recorded are due to dose-limitation or patient weight loss, an association between BMI and 30-day mortality will probably be noted for other cancer types in future reports on the SACT dataset.
For patients with NSCLC treated palliatively with no recorded BMI, 30-day mortality was signifi cantly lower than for those with a healthy BMI, but this reduction in risk was smaller than for overweight and obese patients, suggesting the BMI unknown group is probably mainly a mix of healthy weight and overweight patients. As data completeness improves, we will better understand the distribution of BMI scores amongst patients receiving SACT, and obtain improved estimates of 30-day mortality for each BMI group.
Although we identifi ed several factors aff ecting 30-day mortality risk, our population-based dataset included only patients that received SACT, so we cannot confi rm whether patients would have had better outcomes if they had not received SACT. Similarly we cannot assess whether patients who did not receive SACT might have benefi ted from treatment. Through more sophisticated links with audit data and other data sources in future, we intend to investigate treatment rates alongside mortality by trust, which would provide some information about outcomes for these patient groups. However, overall, the above fi ndings suggest that eff orts need to be made to further study the factors aff ecting 30-day mortality in England with the objective of developing a clinical decision support tool.
Our data also suggest that 30-day mortality might be higher than previously estimated by several clinical trials.9,10 The 30-day mortality rate after SACT with curative intent for NSCLC reported here is high at 3% compared with published trial data for the standard treatments, which suggested that 0·8% of patients died from treatment-induced toxicity when chemotherapy was given as adjuvant treatment alongside surgery.9 These patients have been assessed as fi t enough for radical curative treatment (eg, thoracic surgery with adjuvant systemic anticancer therapy), estimated to increase the average NSCLC 5-year survival by 4–5%, as reviewed by Heon and Johnson.28 Therefore, the high mortality rate we report here is a concern because it could reduce any benefi t from this intervention.
The 30-day mortality rate in breast cancer patients receiving curative SACT under the age of 60 in our dataset was similar to the treatment-related mortality estimated in the UK TACT trial,10 which included patients in a similar age range. However, 30-day mortality increased with age for patients with breast cancer, and those aged 60–69 years, and 70 years and older had higher mortality than those in the UK TACT trial. This cohort represents a large proportion of
patients with breast cancer with higher mortality than is typically reported in clinical trials: 26% of patients with breast cancer diagnosed in England in 2013 were older than 60 years, with incidence peaking between the ages of 65 and 69 years.29 This might be because clinical trials typically recruit a fi tter cohort of patients with a lower disease burden and better performance status than the overall patient population receiving treatment to clearly determine the eff ects of the interventions under investigation, and to ensure older and less well patients are not put at risk. Patients in trials also tend to receive more intensive support and follow up.
Therefore, our analysis highlights the value of investigating SACT treatment outcomes on a national scale, and shows that fi ndings of clinical trials in selected age cohorts cannot readily be generalised to all patients. Our fi nding that 30-day mortality is higher in patients with lung cancer than in those with breast cancer matches clinical expectations. Lung cancer often occurs in patients with signifi cant smoking-related comorbidities, which are likely to increase the risk of 30-day mortality,6 although the lack of available comorbidity data meant that we could not account for them in these analyses. Patient cohort size was insuffi cient at this stage for analysis of 30-day mortality in patients with SCLC, amongst whom early mortality was high. Future analyses will pool data for multiple years (as it becomes available) to provide suffi ciently large patient cohorts to examine the impact of patient and disease characteristics on 30-day mortality from SCLC.
We predicted higher 30-day mortality for patients receiving palliative SACT because these patients are not expected to recover from their cancer and the burden of
Figure 5: Funnel plot showing variation in risk-adjusted 30-day mortality in patients with non-small cell lung cancer given systemic anticancer therapy with palliative intent, by hospital trustEach circle represents a separate hospital trust; blue and red circles represent outliers beyond the 95% and 99·8% confi dence interval boundaries that are represented as grey lines. Red line shows national risk-adjusted 30-day mortality rate.
0 50 100 150 200 250 300 350 400 4500
10
15
5
20
25
30
Risk
-adj
uste
d 30
-day
pos
t-ch
emot
hera
py m
orta
lity
perc
enta
ge
Number of patients receiving chemotherapy (2014)

Articles
1214 www.thelancet.com/oncology Vol 17 September 2016
disease is generally high. However, it remains important to weigh up the important benefi ts some patients receive from palliative treatment with emerging evidence suggesting that patients prescribed chemotherapy at the end of life overall experience a net reduction in their quality of life.30,31 Patient choice is an important factor in these decisions; previous fi ndings showed that patients with cancer were much more likely to accept intensive SACT treatment with only a small chance of benefi t compared with doctors and nurses.32 To help clinicians and patients to make treatment decisions that are most likely to produce the desired outcomes, we must understand the factors aff ecting the balance between benefi ts and harms of palliative SACT, which we have started to investigate here. These factors should be a focus of discussions about treatment between patients and their clinicians to allow better informed decisions and improved outcomes.
In future studies based on the SACT dataset, we hope to examine diff erences in the factors aff ecting 30-day mortality between subcategories of patients that received curative SACT (adjuvant, neoadjuvant, and curative), which we were unable to do in this initial analysis due to insuffi cient patient numbers in each sub-category. This analysis will be possible once data on more patients become available in subsequent years.
We also identifi ed several trusts with signifi cantly higher levels of 30-day mortality. We have written to all trusts to inform them of their 30-day mortality rates, and have specifi cally encouraged outlier trusts to review both their clinical practice and also their data management systems. At present, it is possible that hospital trusts are identifi ed as outliers owing to poor data management practices rather than the delivery of poor clinical care. Analogously, simply because a hospital trust fell within the control limits of the funnel plots, it does not guarantee that each patient received optimal treatment, as data issues may be obscuring instances of suboptimal clinical decision making. It is also possible that hospitals with signifi cantly lower 30-day mortality rates are not tolerating any risk and are treating only the fi ttest patients, which may have the unintended consequence of not treating patients who could have potentially benefi ted from receiving SACT. More comprehensive case mix adjustment and better data completeness will, in time, allow national datasets such as the SACT dataset to be used as a performance management tool.
Although we have made some important insights into 30-day mortality using the SACT dataset, some limitations and gaps in reporting still remain. The SACT dataset uses only routinely reported data with no clinical note or pro-forma review. Therefore, the dataset does not include items such as laboratory indicator test results—eg, for liver and renal function, so we are unable to analyse any association between these indicators and 30-day mortality, or use them in risk adjustment models.
At this stage, we did not assess whether drug dosage was appropriate, and whether this was associated with 30-day mortality because this was beyond the scope of our fi rst report. However, analyses of these data in future reports would be valuable, for example in assessing whether SACT regimens are both clinically eff ective and cost-eff ective. For some patients, only the fi rst cycle of SACT was recorded. Subsequently, some of those patients probably received subsequent cycles that were not recorded in the dataset, whose absence from the SACT dataset would artifi cially increase the time between cycle start date and date of death, and lower 30-day mortality. This omission might also artifi cially increase the risk of 30-day mortality associated with being treatment naive, because later cycles of SACT, and therefore any deaths within 30 days of those later cycles, were not recorded. As shown in table 1, data for performance status, BMI, and cancer stage was also missing for some patients. Issues with missing data will be resolved through improvements in SACT data reporting by trusts through e-prescribing systems in subsequent years.
Compared with the National Cancer Waiting Times database, the SACT dataset captured 94% and 92% of patients with breast and lung cancer, respectively, reported to have received SACT in 2014.13 3% of both patients with breast cancer and with lung cancer receiving SACT were also excluded from the analyses in this report due to missing cycle start dates. Some of these missing data could be due to delayed or phased reporting because the dataset was only mandated from April, 2014 (the proportion of trusts reporting on at least the mandatory data fi elds was 141 [95%] of 148 in January, 2014, but 147 [100%] of 147 by July).
Some NHS trusts reported incorrect names for the combinations of SACTs (regimens) given to some confi rmed breast and lung cancer patients included in our analyses, which highlights the need for trusts to improve the quality of their regimen data reporting. For some trusts, some patients reported to have died were recorded as having been prescribed SACT that had not actually been given. This error could be because SACT is recorded some time before its administration, and the record might not be updated if treatment is delayed or omitted, which is likely to falsely increase 30-day mortality.
We acknowledge that performance status might not have accurately refl ected comorbidity status, which can be associated with socioeconomic deprivation (eg, through a higher prevalence of smoking amongst more socioeconomically deprived patients), which might aff ect whether these patients receive SACT. Therefore, improved data collection on comorbidity status would enable us to investigate the association between socioeconomic deprivation and 30-day mortality more thoroughly in future.
For the fi rst time to our knowledge, our analysis of the SACT dataset (with linkage to the NCRAS for morphology, stage at diagnosis, and mortality

Articles
www.thelancet.com/oncology Vol 17 September 2016 1215
information) gives us important insights into 30-day mortality in a large, representative population of patients with breast or lung cancer receiving systemic anticancer therapy in England. Our data suggest that treatment intent, patient age, performance status, whether patients had received previous systemic anticancer treatments, and sex all aff ect 30-day mortality risk in this context. There is variation between hospital trusts in the rates of 30-day mortality, with some trusts having signifi cantly higher rates for early mortality. The reasons for this variation require further investigation. Some patients may not have benefi ted from decisions to give SACT; accurate and complete reporting of SACT data on a national scale is therefore crucial to provide real world information to support clinicians with decision making on treatment, complementing evidence from clinical trial data.ContributorsDD, MWa, MP, and SM led on study design and concept. MWa and SM led on the analysis of the data. DD, MWa, MP, SM as well as EBS, MB, RS, MWi, JR, DC, JD, DT, TP, and CW all actively and substantially contributed to the writing of this manuscript, performing literature searches, interpreting data and providing comment on multiple iterations of the manuscript.
Declaration of interestsDD reports that Public Health England (PHE) provided funding for the project team and are preparing a report on the subject of 30-day mortality in England (2014) for publication. This will have some areas of overlap with this paper submitted to the Lancet Oncology, but a diff erent focus. The aspiration is that there will be a simultaneous publication. If this is not possible the PHE report will be published after the submitted paper. MP reports personal fees from Roche Pharmaceuticals Ltd, personal fees from Pierre Fabre Oncology Ltd, personal fees from Eli Lilly, personal fees from AstraZeneca, grants from MSD, outside the submitted work. JR reports grants from NHS England during the conduct of the study. The other authors declare no competing interests.
AcknowledgmentsThis work is only possible because of data that are routinely collected by the NHS as part of patient care. This research was supported by Public Health England. No grants were received from any funding agencies in the public, commercial, or not-for-profi t sectors. We thank the following colleagues for constructive comments and helpful discussions during the analysis of the data and drafting of this report: Sara Hiom (Cancer Research UK), members from the Chemotherapy Clinical Information and lung cancer Site Specifi c Clinical Reference groups at PHE, particularly Michael Lind, and Eva Morris (University of Leeds).
References1 Chabner BA, Roberts TG. Chemotherapy and the war on cancer.
Nat Rev Cancer 2005; 5: 65–72.2 Morgan G, Ward R, Barton M. The contribution of cytotoxic
chemotherapy to 5-year survival in adult malignancies. Clin Oncol 2004; 16: 549–60.
3 Fossati R, Confalonieri C, Torri V, et al. Cytotoxic and hormonal treatment for metastatic breast cancer: a systematic review of published randomized trials involving 31,510 women. J Clin Oncol 1998; 16: 3439–60.
4 Non-small Cell Lung Cancer Collaborative Group. Chemotherapy in non-small cell lung cancer: a meta-analysis using updated data on individual patients from 52 randomised clinical trials. BMJ 1995; 311: 899–909.
5 Mort D, Lansdown M, Smith N, Protopapa K, Mason M. Systemic Anti-Cancer Therapy: For better, for worse? National Confi dential Enquiry into Patient Outcome and Death. [Online] Available at: http://www.ncepod.org.uk/2008report3/Downloads/SACT_report.pdf (accessed March 21, 2016).
6 Khoja L, McGurk A, O’Hara C, Chow S, Hasan J. Mortality within 30 days following SACT, a review of all cases over a 4 year period in a tertiary cancer centre. Eur J Cancer 2015; 51: 233–40.
7 O’Brien ME, Borthwick A, Rigg A, et al. Mortality within 30 days of chemotherapy: a clinical governance benchmarking issue for oncology patients. Br J Cancer 2006; 95: 1632–36.
8 Yoong J, Seah JA, Hamilton K, Teo LN, Chong G. Mortality within 30 days of receiving SACT at a regional oncology unit: what have we learned? Asia Pac J Clin Oncol 2012; 8: 325–29.
9 Arriagada R, Bergman B, Dunant A, Le Chevalier T, Pignon JP, Vansteenkiste J; International Adjuvant Lung Cancer Trial Collaborative Group. Cisplatin-based adjuvant chemotherapy in patients with completely resected non-small-cell lung cancer. N Engl J Med 2004; 350: 351–60.
10 Ellis P, Barrett-Lee P, Johnson L, et al. Sequential docetaxel as adjuvant chemotherapy for early breast cancer (TACT): an open-label, phase III, randomised controlled trial. Lancet 2009; 373: 1681–92.
11 STROBE statement. Available at: http://www.strobe-statement.org/index.php?id=strobe-home (accessed May 11, 2016).
12 Central Offi ce of Information. NHS Cancer Reform Strategy [Online] Available at: http://webarchive.nationalarchives.gov.uk/20130107105354/http:/www.dh.gov.uk/prod_consum_dh/groups/dh_digitalassets/documents/digitalasset/dh_081007.pdf (accessed March 23, 2016).
13 Health and Social Care Information Centre (HSCIC). Data Set: Systemic Anti-Cancer Therapy dataset. http://www.datadictionary.nhs.uk/data_dictionary/messages/clinical_data_sets/data_sets/systemic_anti-cancer_therapy_data_set_fr.asp?shownav=1 (accessed May 11, 2016).
14 National Cancer Registration and Analysis Service. Completeness of the national Systemic Anti-Cancer Therapy data set compared with the Cancer Waiting Times data set [Online] Available at: http://www.ncin.org.uk/publications/data_briefi ngs/sact_cwt (accessed March 23, 2016).
15 Social Disadvantage Research Centre, University of Oxford. The English indices of deprivation 2010. https://www.gov.uk/government/uploads/system/uploads/attachment_data/fi le/6871/1871208.pdf (accessed March 23, 2016).
16 Sterne JAC, White IR, Carlin JB, et al. Multiple imputation for missing data in epidemiological and clinical research: potential and pitfalls. BMJ 2009; 338: b2393.
17 Harrell FE Jr, Lee KL, Mark DB. Multivariable prognostic models: issues in developing models, evaluating assumptions and adequacy, and measuring and reducing errors. Stat Med 1996; 15: 361–87.
18 Concato J, Peduzzi P, Holford TR, Feinstein AR. Importance of events per independent variable in proportional hazards analysis. I. Background, goals, and general strategy. J Clin Epidemiol. 1995; 48: 1495–501.
19 Peduzzi P, Concato J, Feinstein AR, Holford TR. Importance of events per independent variable in proportional hazards regression analysis. II. Accuracy and precision of regression estimates. J Clin Epidemiol 1995, 48: 1503–10.
20 Oken MM, Creech RH, Tormey DC. Toxicity and response criteria of the Eastern Cooperative Oncology Group. Am J Clin Oncol 1982; 5: 649–655.
21 Department of Health. Improving outcomes: a strategy for cancer 2011 [Online] available at: https://www.gov.uk/government/uploads/system/uploads/attachment_data/fi le/213785/dh_123394.pdf (accessed March 23, 2016).
22 Radford J, Ryder D, Dodwell D, Anderson H, Thatcher N. Predicting septic complications of chemotherapy: an analysis of 382 patients treated for small cell lung cancer without dose reduction after major sepsis. Eur J Cancer 1992; 29A: 81–86.
23 Hsu CL, Chen KY, Shih JY, et al. Advanced non-small cell lung cancer in patients aged 45 years or younger: outcomes and prognostic factors. BMC Cancer 2012; 12: 241.
24 Greenman CG, Jagielski CH, Griggs JJ. Breast cancer adjuvant chemotherapy dosing in obese patients: dissemination of information from clinical trials to clinical practice. Cancer 2008; 112: 2159–65.
25 Griggs JJ, Mangu PB, Anderson H. Appropriate Chemotherapy Dosing for Obese Adult Patients With Cancer: American Society of Clinical Oncology Clinical Practice Guideline. J Clin Oncol 2012; 30: 1–10.
Articles
1216 www.thelancet.com/oncology Vol 17 September 2016
26 Ross PJ, Ashley S, Norton A, et al. Do patients with weight loss have a worse outcome when undergoing chemotherapy for lung cancers? Br J Cancer 2004; 90: 1905–11.
27 Chan DS, Vieira AR, Aune D. Body mass index and survival in women with breast cancer—systematic literature review and meta-analysis of 82 follow-up studies Ann Oncol 2014 25: 1901–14.
28 Heon S, Johnson BE. Adjuvant chemotherapy for surgically resected non-small cell lung cancer. J Thorac Cardiovasc Surg 2012; 144: 39–42.
29 NHS Cancer Data. Incidence (base numbers). https://www.cancerdata.nhs.uk/incidence/base_numbers (accessed March 23, 2016).
30 Prigerson HG, Bao Y, Shah MA, et al. Chemotherapy use, performance status, and quality of life at the end of life. JAMA Oncol 2015; 1: 778–84.
31 The National Council for Palliative Care. Getting serious about prevention: enabling people to stay out of hospital at the end of life. http://www.ncpc.org.uk/sites/default/fi les/Getting%20Serious_WEB.pdf (accessed March 23, 2016).
32 Slevin ML, Stubbs L, Plant HJ, et al. Attitudes to chemotherapy: comparing views of patients with cancer with those of doctors, nurses, and general public. BMJ 1990; 300: 1458–60.