3 way project - 3d acoustic research
TRANSCRIPT
BIG 3 WAY SPEAKER: INTEGRATION OF BASS AND MIDRANGE R
DRIVERS
© 3D Acoustics Research, January 2010 www.3DAR.ru
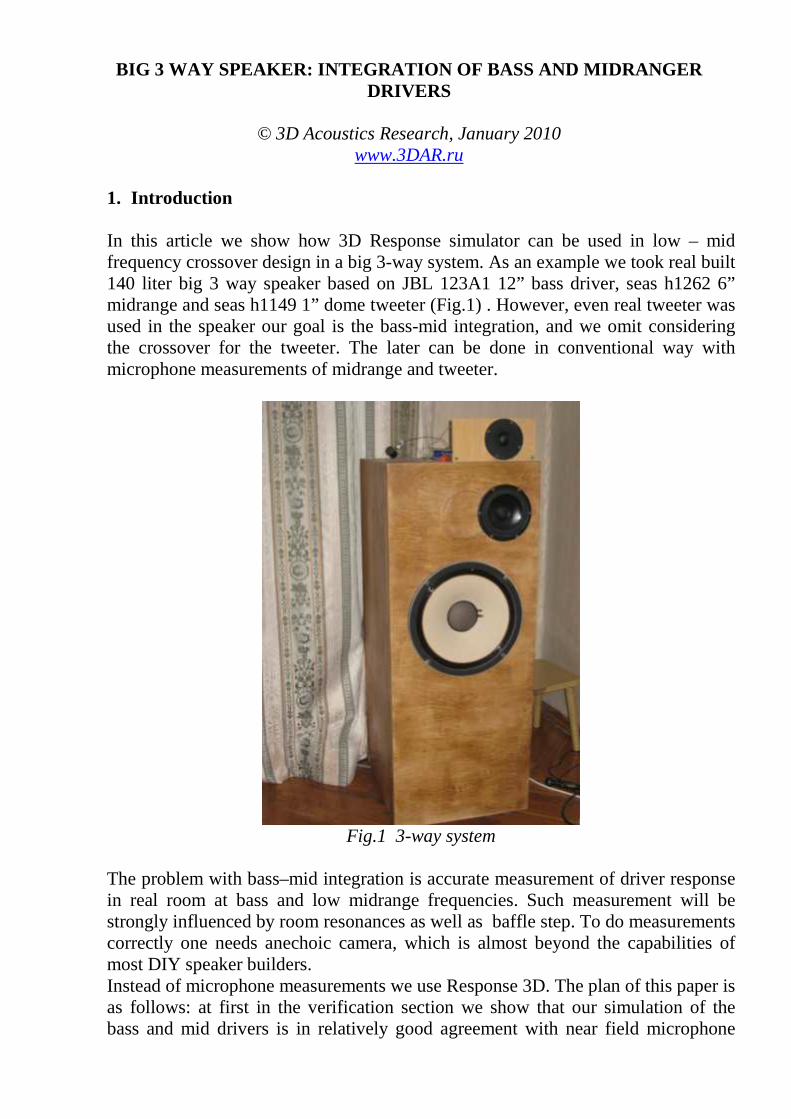
1. Introduction In this article we show how 3D Response simulator can be used in low – mid frequency crossover design in a big 3-way system. As an example we took real built 140 liter big 3 way speaker based on JBL 123A1 12” bass driver, seas h1262 6” midrange and seas h1149 1” dome tweeter (Fig.1) . However, even real tweeter was used in the speaker our goal is the bass-mid integration, and we omit considering the crossover for the tweeter. The later can be done in conventional way with microphone measurements of midrange and tweeter.
Fig.1 3-way system
The problem with bass–mid integration is accurate measurement of driver response in real room at bass and low midrange frequencies. Such measurement will be strongly influenced by room resonances as well as baffle step. To do measurements correctly one needs anechoic camera, which is almost beyond the capabilities of most DIY speaker builders. Instead of microphone measurements we use Response 3D. The plan of this paper is as follows: at first in the verification section we show that our simulation of the bass and mid drivers is in relatively good agreement with near field microphone
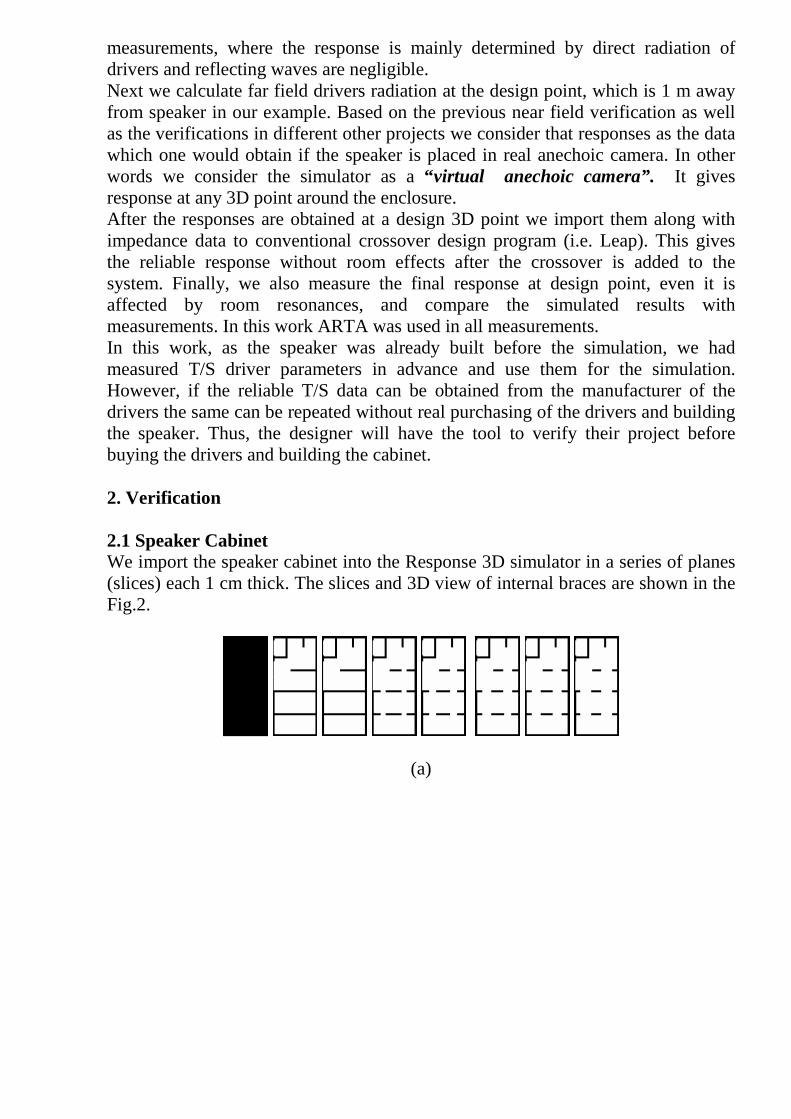
measurements, where the response is mainly determined by direct radiation of drivers and reflecting waves are negligible. Next we calculate far field drivers radiation at the design point, which is 1 m away from speaker in our example. Based on the previous near field verification as well as the verifications in different other projects we consider that responses as the data which one would obtain if the speaker is placed in real anechoic camera. In other words we consider the simulator as a “ virtual anechoic camera”. It gives response at any 3D point around the enclosure. After the responses are obtained at a design 3D point we import them along with impedance data to conventional crossover design program (i.e. Leap). This gives the reliable response without room effects after the crossover is added to the system. Finally, we also measure the final response at design point, even it is affected by room resonances, and compare the simulated results with measurements. In this work ARTA was used in all measurements. In this work, as the speaker was already built before the simulation, we had measured T/S driver parameters in advance and use them for the simulation. However, if the reliable T/S data can be obtained from the manufacturer of the drivers the same can be repeated without real purchasing of the drivers and building the speaker. Thus, the designer will have the tool to verify their project before buying the drivers and building the cabinet. 2. Verification 2.1 Speaker Cabinet We import the speaker cabinet into the Response 3D simulator in a series of planes (slices) each 1 cm thick. The slices and 3D view of internal braces are shown in the Fig.2.
(a)
(b)
Fig.2 Internal construction of the box, external dimensions 40 x 40 x 100 cm (a) – slices, (b) – 3D view
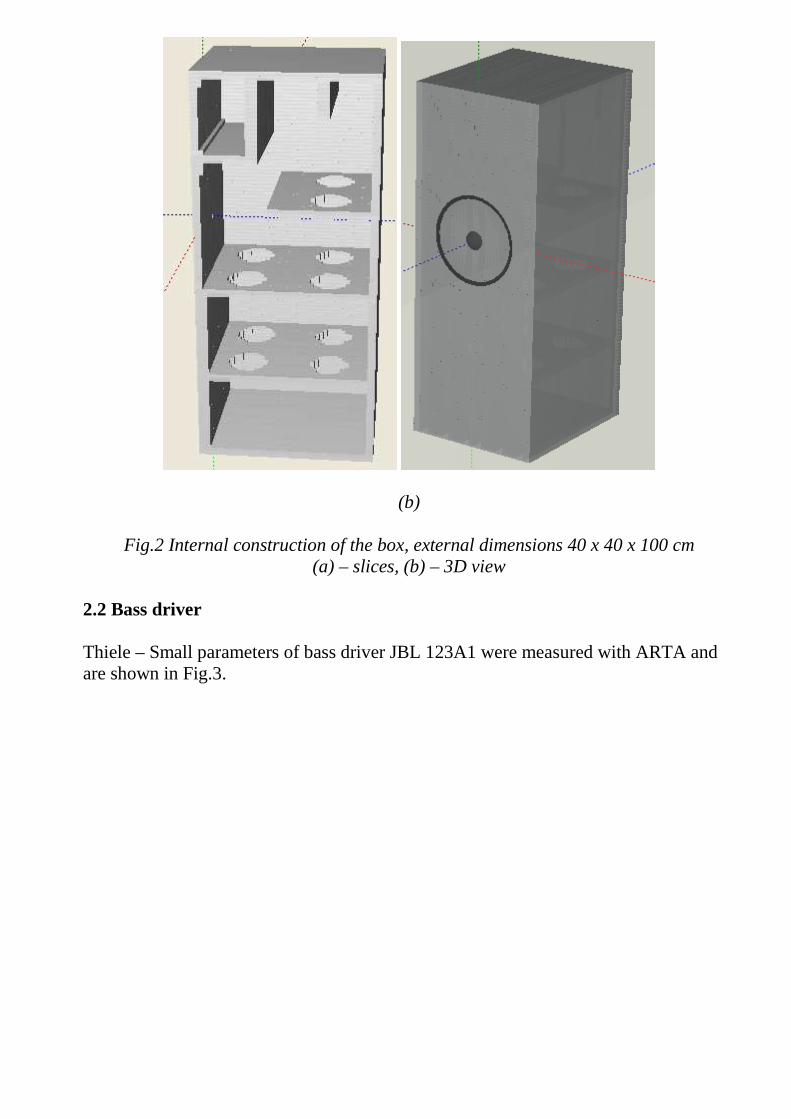
2.2 Bass driver Thiele – Small parameters of bass driver JBL 123A1 were measured with ARTA and are shown in Fig.3.
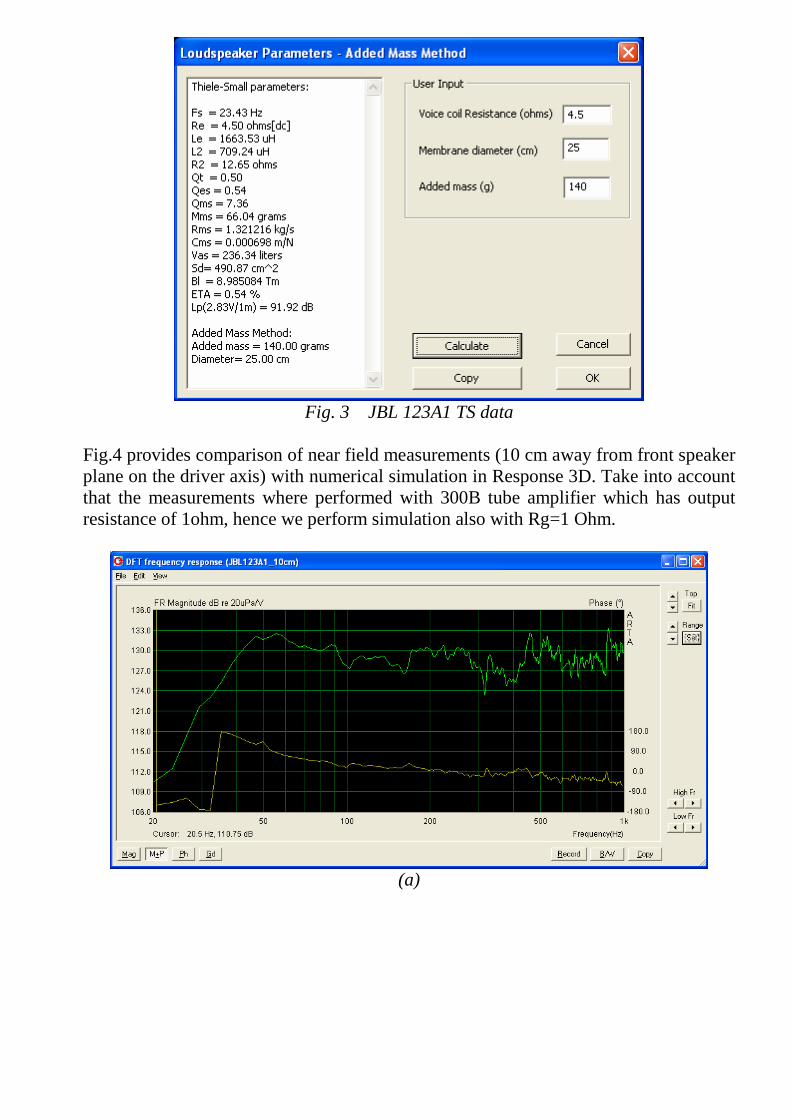
Fig. 3 JBL 123A1 TS data
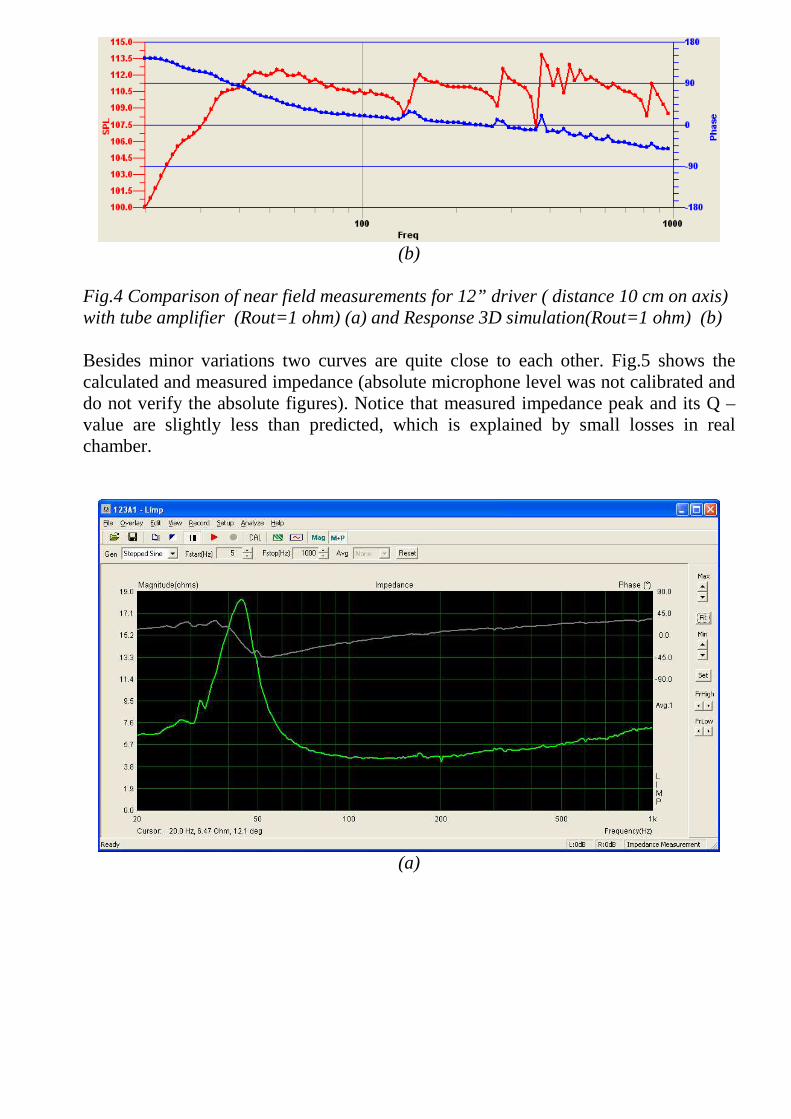
Fig.4 provides comparison of near field measurements (10 cm away from front speaker plane on the driver axis) with numerical simulation in Response 3D. Take into account that the measurements where performed with 300B tube amplifier which has output resistance of 1ohm, hence we perform simulation also with Rg=1 Ohm.
(a)
(b)
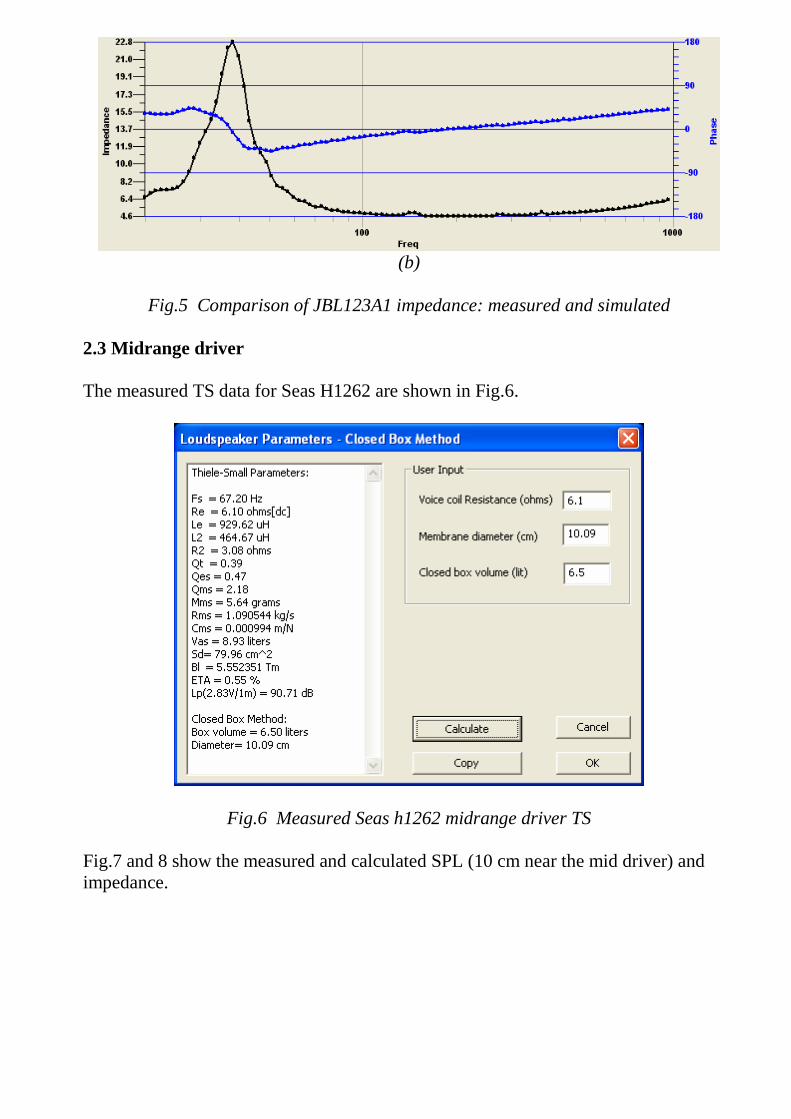
Fig.4 Comparison of near field measurements for 12” driver ( distance 10 cm on axis) with tube amplifier (Rout=1 ohm) (a) and Response 3D simulation(Rout=1 ohm) (b) Besides minor variations two curves are quite close to each other. Fig.5 shows the calculated and measured impedance (absolute microphone level was not calibrated and do not verify the absolute figures). Notice that measured impedance peak and its Q –value are slightly less than predicted, which is explained by small losses in real chamber.
(a)
(b)
Fig.5 Comparison of JBL123A1 impedance: measured and simulated
2.3 Midrange driver The measured TS data for Seas H1262 are shown in Fig.6.
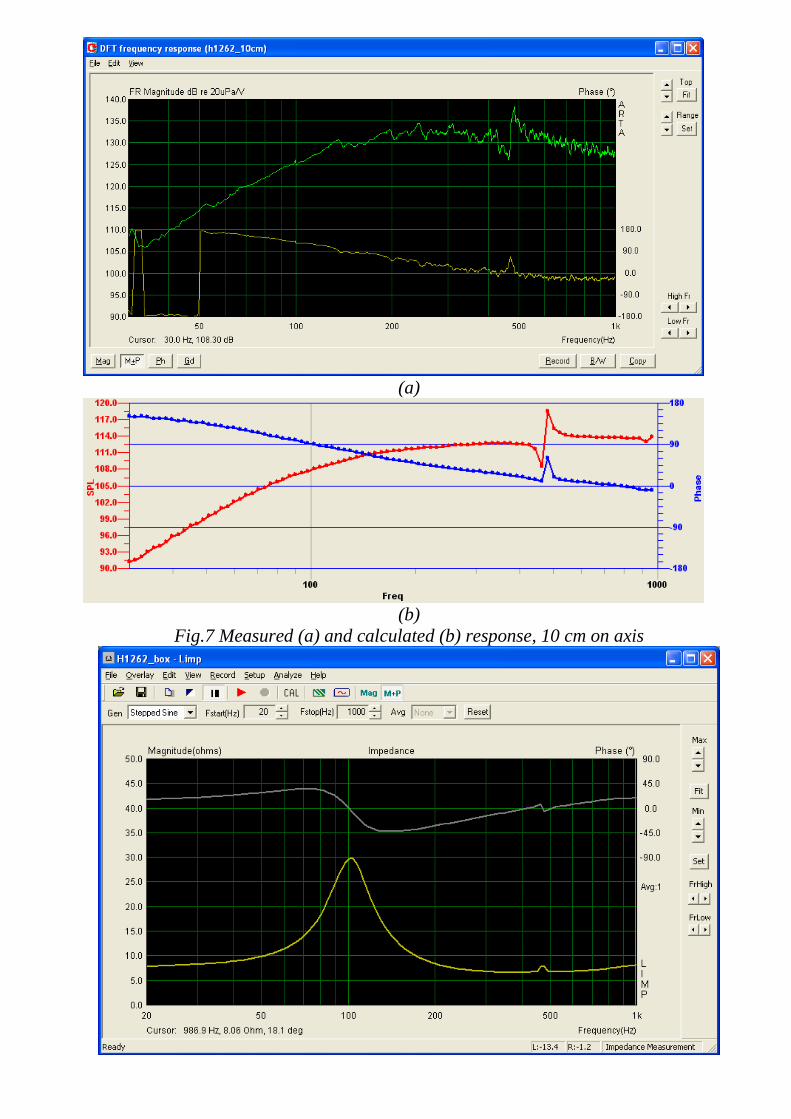
Fig.6 Measured Seas h1262 midrange driver TS Fig.7 and 8 show the measured and calculated SPL (10 cm near the mid driver) and impedance.
(a)
(b)
Fig.7 Measured (a) and calculated (b) response, 10 cm on axis
(a)
(b)
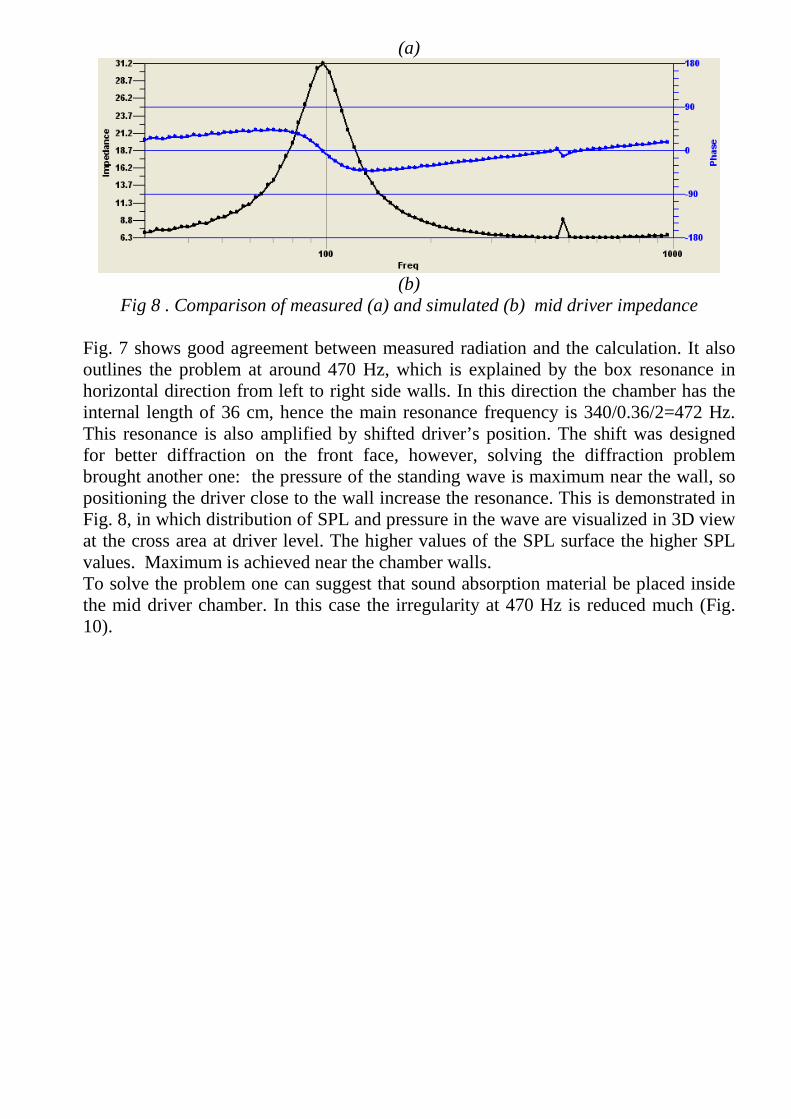
Fig 8 . Comparison of measured (a) and simulated (b) mid driver impedance Fig. 7 shows good agreement between measured radiation and the calculation. It also outlines the problem at around 470 Hz, which is explained by the box resonance in horizontal direction from left to right side walls. In this direction the chamber has the internal length of 36 cm, hence the main resonance frequency is 340/0.36/2=472 Hz. This resonance is also amplified by shifted driver’s position. The shift was designed for better diffraction on the front face, however, solving the diffraction problem brought another one: the pressure of the standing wave is maximum near the wall, so positioning the driver close to the wall increase the resonance. This is demonstrated in Fig. 8, in which distribution of SPL and pressure in the wave are visualized in 3D view at the cross area at driver level. The higher values of the SPL surface the higher SPL values. Maximum is achieved near the chamber walls. To solve the problem one can suggest that sound absorption material be placed inside the mid driver chamber. In this case the irregularity at 470 Hz is reduced much (Fig. 10).
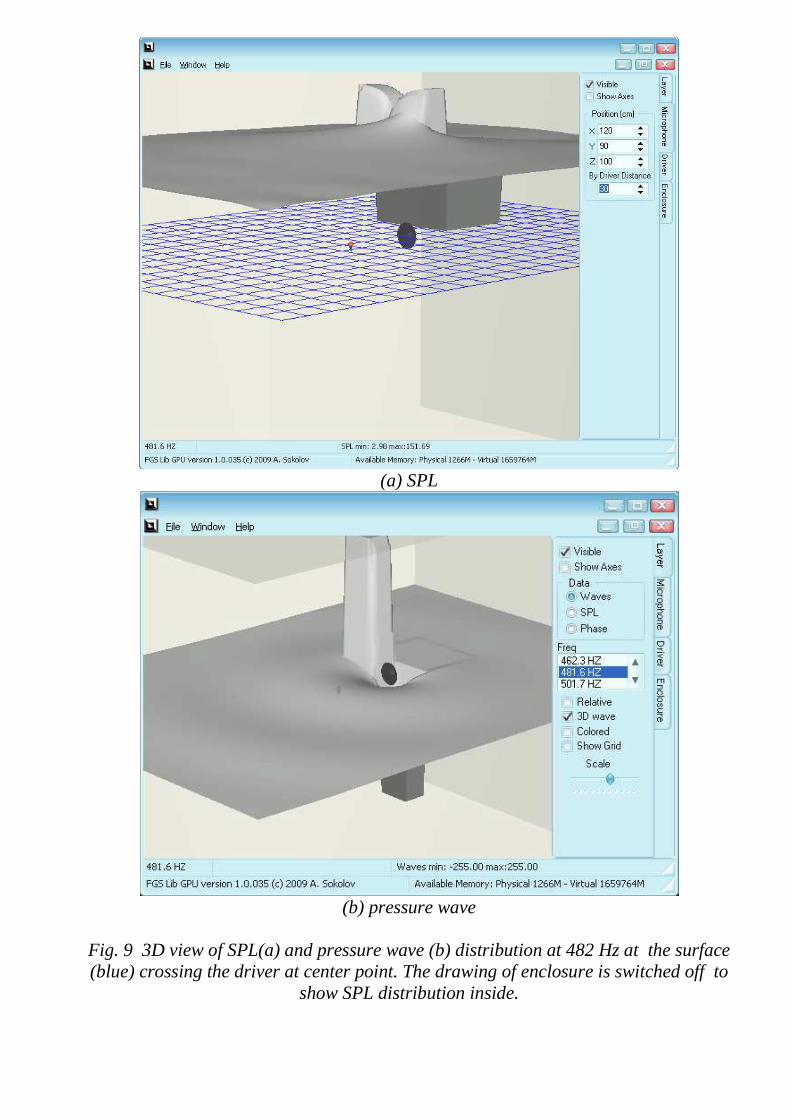
(a) SPL
(b) pressure wave
Fig. 9 3D view of SPL(a) and pressure wave (b) distribution at 482 Hz at the surface (blue) crossing the driver at center point. The drawing of enclosure is switched off to
show SPL distribution inside.

Fig. 10 Measured midranger driver response 10 cm on axis with absorbing material in
the chamber 3. Crossover design Our goal is to verify the crossover for SPL response at a given 3D point in front of the speaker. As an example we consider the point A which is between bass and mid drivers and 1 m away from front speaker baffle, see Fig 11. Because the crossover point will be around 350 Hz (wavelength about 1 m), we do not take into account the depth difference of two radiation centers of both drivers, the later in practice is 2-5 cm and much less than the wavelength at the crossover point for bass and mid drivers. (In the case when it is necessary one can shift the midriver in the simulation to the appropriate point).
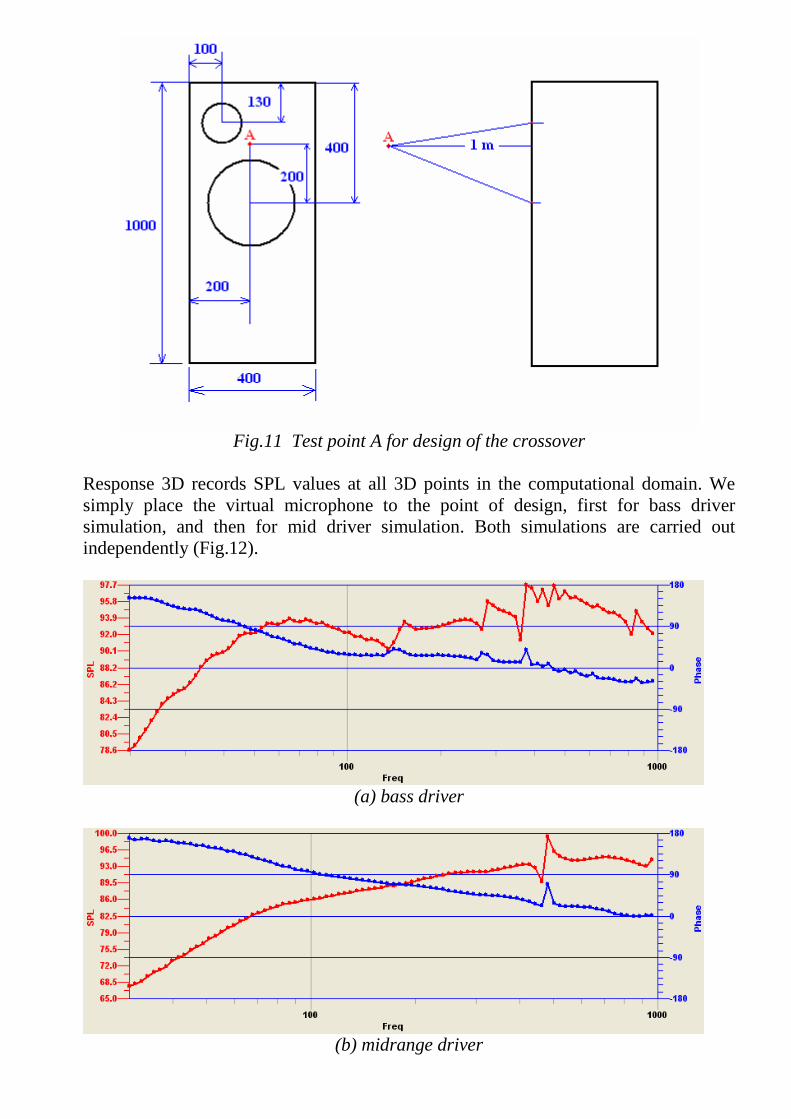
Fig.11 Test point A for design of the crossover
Response 3D records SPL values at all 3D points in the computational domain. We simply place the virtual microphone to the point of design, first for bass driver simulation, and then for mid driver simulation. Both simulations are carried out independently (Fig.12).
(a) bass driver
(b) midrange driver

Fig.12 Simulated response at design point A
Next step is to export the obtained data into text format and import it to crossover design software (Fig 13):
Fig.13 Simulated SPL curves for woofer and mid drivers are imported into LEAP Now we turn to evaluation of the bass-midrange crossover. Fig 14 shows original crossover of the speaker which was designed before this simulation. Here R1, C7 and L2 values on the mid section where designed for integration with the tweeter.
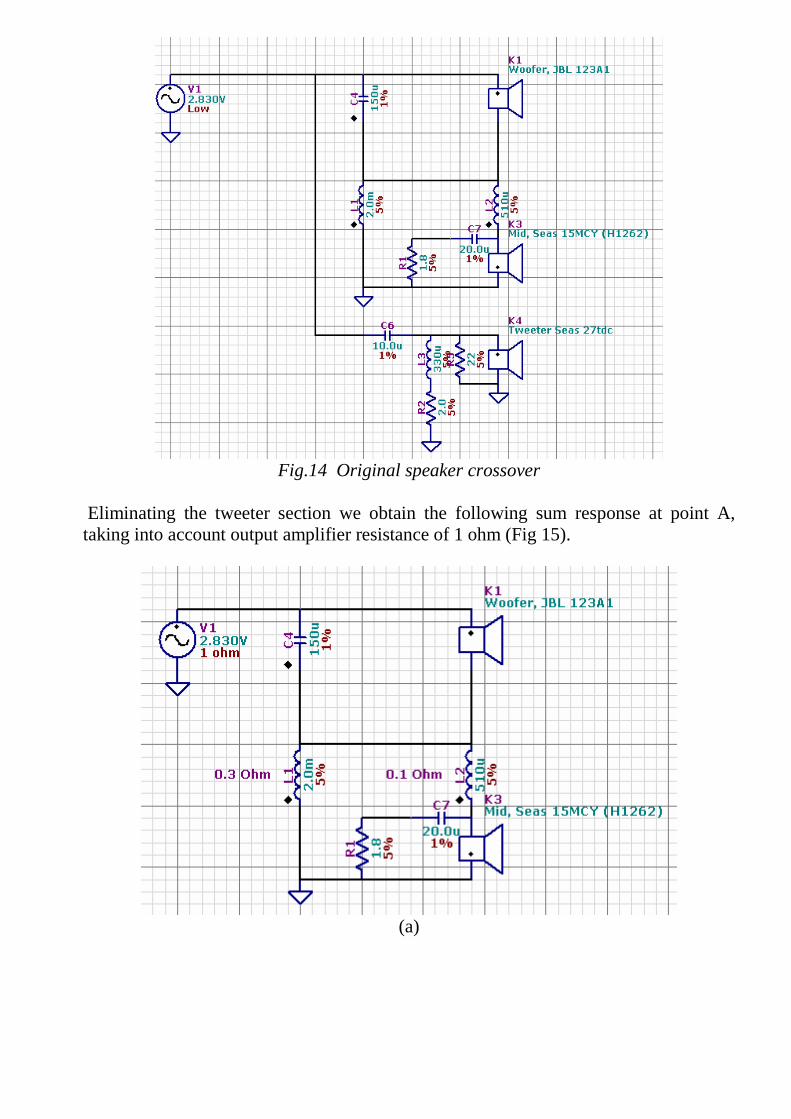
Fig.14 Original speaker crossover
Eliminating the tweeter section we obtain the following sum response at point A, taking into account output amplifier resistance of 1 ohm (Fig 15).
(a)
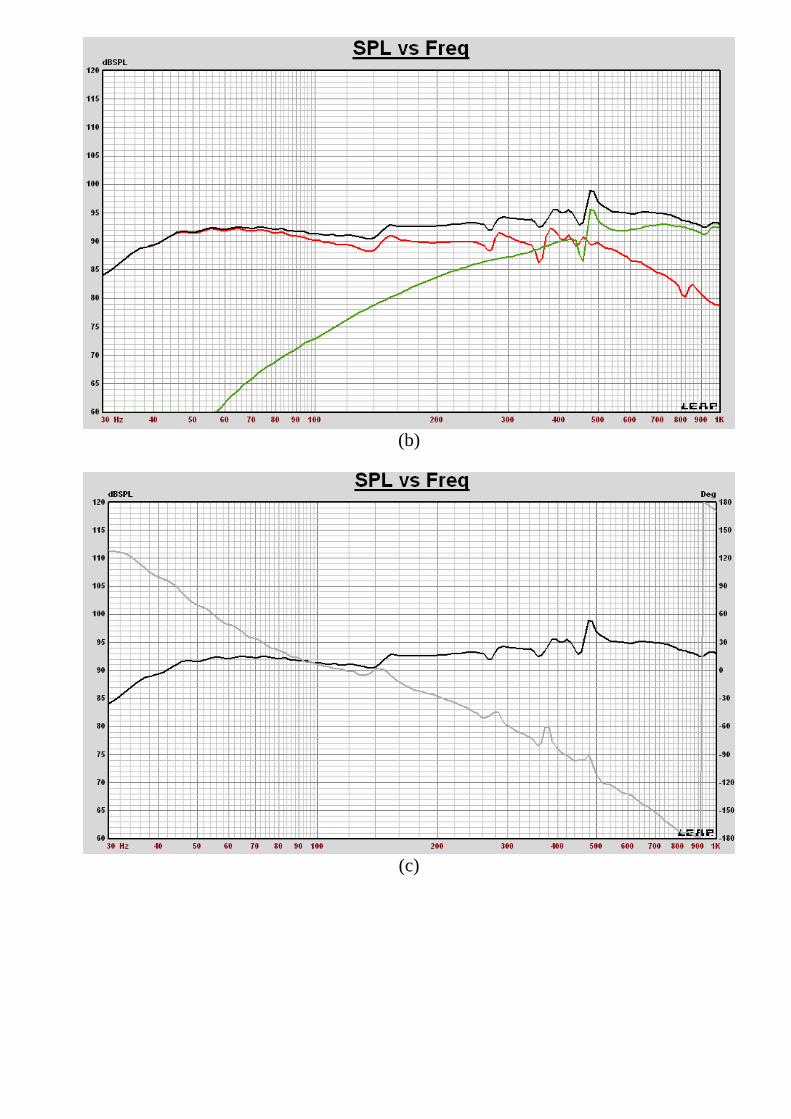
(b)
(c)
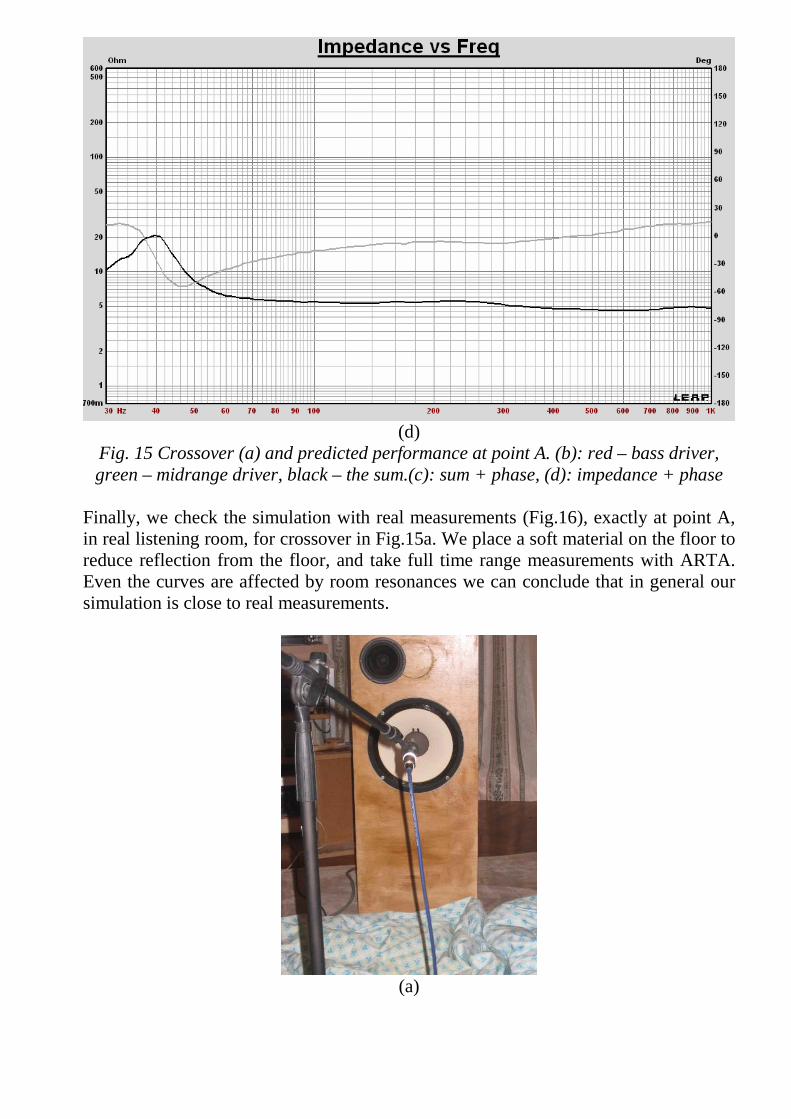
(d)
Fig. 15 Crossover (a) and predicted performance at point A. (b): red – bass driver, green – midrange driver, black – the sum.(c): sum + phase, (d): impedance + phase
Finally, we check the simulation with real measurements (Fig.16), exactly at point A, in real listening room, for crossover in Fig.15a. We place a soft material on the floor to reduce reflection from the floor, and take full time range measurements with ARTA. Even the curves are affected by room resonances we can conclude that in general our simulation is close to real measurements.
(a)
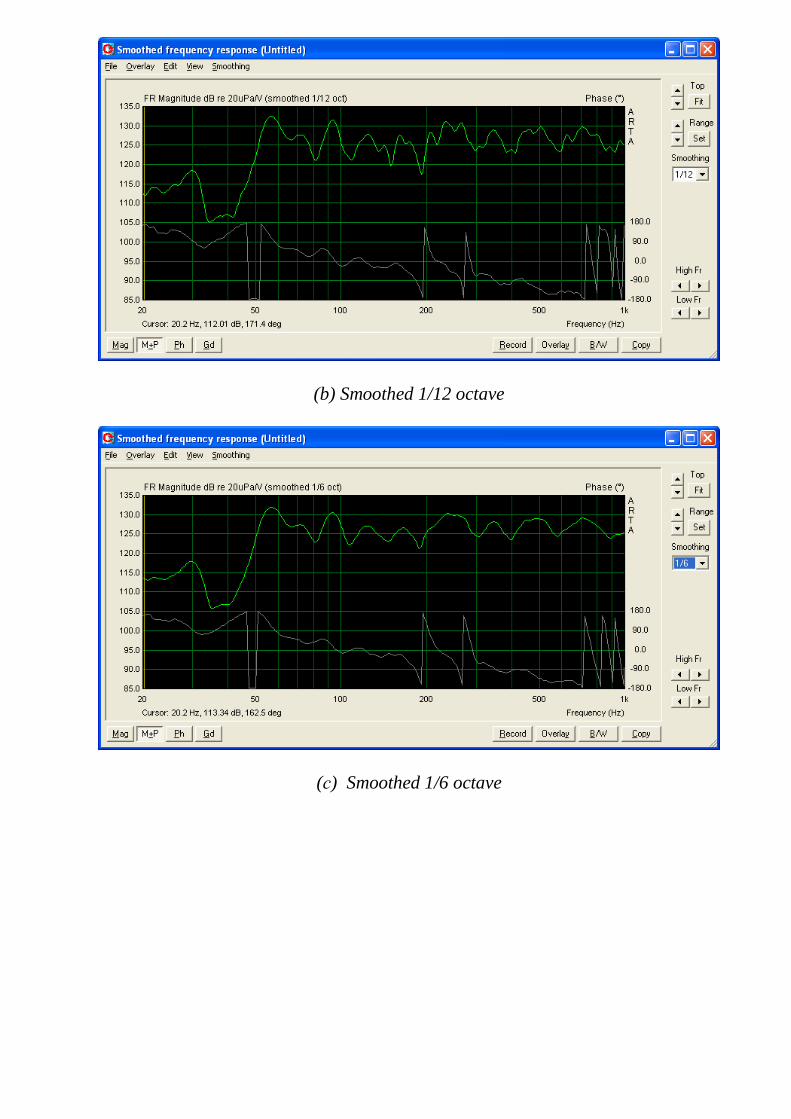
(b) Smoothed 1/12 octave
(с) Smoothed 1/6 octave
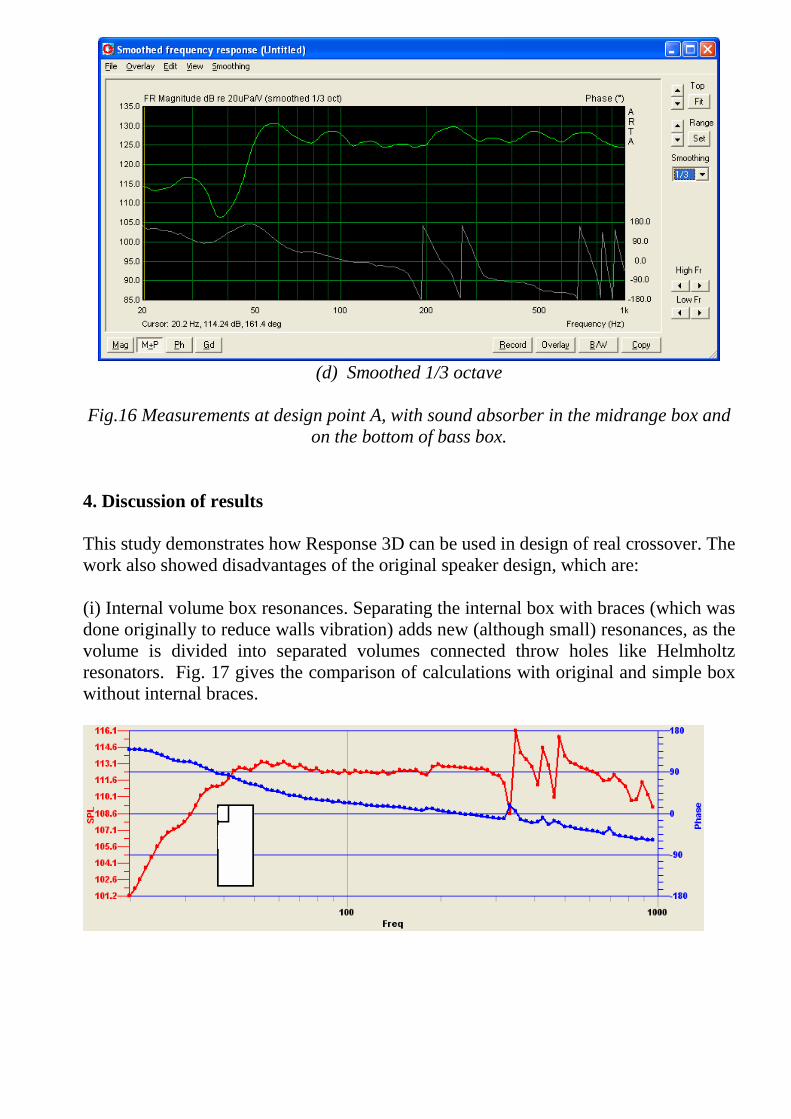
(d) Smoothed 1/3 octave
Fig.16 Measurements at design point A, with sound absorber in the midrange box and
on the bottom of bass box.
4. Discussion of results This study demonstrates how Response 3D can be used in design of real crossover. The work also showed disadvantages of the original speaker design, which are: (i) Internal volume box resonances. Separating the internal box with braces (which was done originally to reduce walls vibration) adds new (although small) resonances, as the volume is divided into separated volumes connected throw holes like Helmholtz resonators. Fig. 17 gives the comparison of calculations with original and simple box without internal braces.
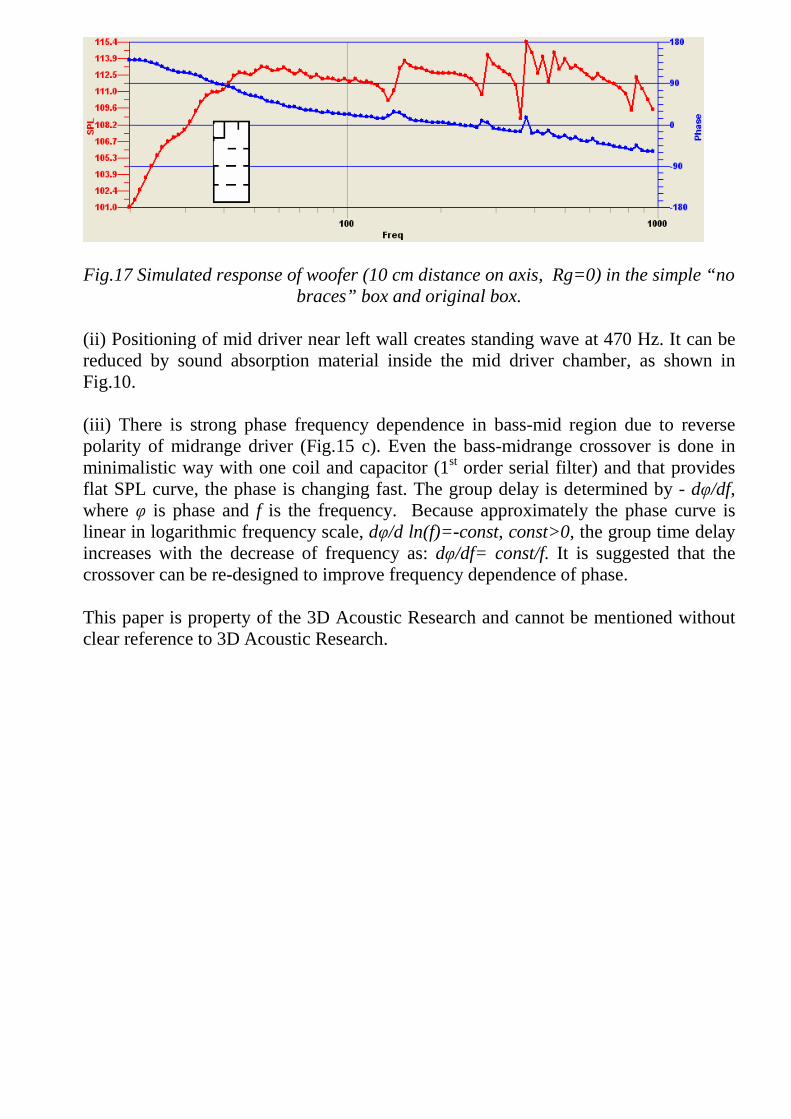
Fig.17 Simulated response of woofer (10 cm distance on axis, Rg=0) in the simple “no braces” box and original box.
(ii) Positioning of mid driver near left wall creates standing wave at 470 Нz. It can be reduced by sound absorption material inside the mid driver chamber, as shown in Fig.10. (iii) There is strong phase frequency dependence in bass-mid region due to reverse polarity of midrange driver (Fig.15 c). Even the bass-midrange crossover is done in minimalistic way with one coil and capacitor (1st order serial filter) and that provides flat SPL curve, the phase is changing fast. The group delay is determined by - dφ/df, where φ is phase and f is the frequency. Because approximately the phase curve is linear in logarithmic frequency scale, dφ/d ln(f)=-const, const>0, the group time delay increases with the decrease of frequency as: dφ/df= const/f. It is suggested that the crossover can be re-designed to improve frequency dependence of phase. This paper is property of the 3D Acoustic Research and cannot be mentioned without clear reference to 3D Acoustic Research.