spe 149602 distributed acoustic sensing - a new way of listening
TRANSCRIPT

SPE 149602
Distributed Acoustic Sensing - a new way of listening to your well/reservoir Kjetil Johannessen Statoil ASA, SPE, Brian Drakeley Weatherford International, SPE, Mahmoud Farhadiroushan Silixa Ltd., SPE
Copyright 2012, Society of Petroleum Engineers This paper was prepared for presentation at the SPE Intelligent Energy International held in Utrecht, The Netherlands, 27–29 March 2012. This paper was selected for presentation by an SPE program committee following review of information contained in an abstract submitted by the author(s). Contents of the paper have not been reviewed by the Society of Petroleum Engineers and are subject to correction by the author(s). The material does not necessar ily reflect any position of the Society of Petroleum Engineers, its officers, or members. Electronic reproduction, distribution, or storage of any part of this paper without the written consent of the Society of Petroleum Engineers is prohibited. Permission to reproduce in print is restricted to an abstract of not more than 300 words; illustrations may not be copied. The abstract must contain conspicuous acknowledgment of SPE copyright.
Abstract There is a new generation of in-well monitoring technologies that are being characterized under the Acoustic Energy sensing
banner. Some are essentially disturbance or vibration event monitoring techniques but this paper describes a Distributed
Acoustic Sensing (DAS) technology [1]. The subject sensing system uniquely allows the user to listen to the acoustic field at
every point along many kilometers of fiber optic cable deployed in the well. With a spatial resolution of 1 meter, for example,
there will be 10,000 synchronized sensors along a 10,000 meter fiber. The system uses a novel digital optical detection
technique to precisely capture the true full acoustic field (amplitude, frequency and phase over a wide dynamic range) at every
point simultaneously. A number of signal processing techniques have been developed to process a large array of acoustic
signals to quantify the coherent temporal and spatial characteristics of the acoustic waves. Potential in-well monitoring
applications have been identified, and significant benefits are predicted for optimizing and maximizing production in many
types of oil and gas fields by facilitating informed decisions.
The system can be retrofitted to existing installations of permanent in-well fiber optics based monitoring systems with the
addition of surface instrumentation. New installations are also planned.
The paper also describes the background technology with focus on full reconstruction of the acoustic signal along the well
bore, sensing system capabilities and the results of field trial surveys, with first generation instrumentation in seven offshore
Norwegian Continental Shelf wells. These seven offshore wells already contained in-well fiber optics sensing systems, and
comprised of two water injectors, one gas injector, three producers with gas lift valves, and one high rate Gas Oil Ratio
producer. Installed sensing included Bragg grating based Pressure and Temperature gauges and fiber based flow meters. DAS
measurements were recorded on fibers with both types of sensors installed on the same fibers. An acoustic signal for flowing
wells was obtained in all cases and for most of the wells it was possible to also extract qualitative information on the flow
regime, speed of sound and an estimate for flow velocity in at least parts of the wells.
Introduction Fiber optics based sensing has been used in the oilfield for over 20 years with the first downhole installation in 1993 being a
simple point pressure and temperature sensor in a land well in the Netherlands. It has become the industry norm for
permanent in-well monitoring systems to be installed in all offshore wells, and an increasing number of land wells.
Since fiber optics based sensing’s inception in the 1980’s, the technologies have been focused on unique monitoring
applications that included extreme operating environments, physical space limitations, and/or unique measurement
requirements. Existing electrical/quartz sensing technology has always had a basic physics temperature limitation of around
150°C (though operation at higher temperatures for shorter time periods have been demonstrated), and do not readily meet
extreme temperature requirements.
The initial applications for fiber optics sensing were targeted toward military and space applications, but monitoring in oil and
gas wells inevitably followed as in effect the same challenges needed to be faced. Early development of fiber optics sensing
technologies for production monitoring started in the mid 1980’s. Following the successes of early 90’s field trials what
followed was some considerable investment by both oil and gas upstream service companies, as well as operators in the further
development of these fiber optics sensing systems, and their eventual commercialization.
Today commercial fiber optics sensing capabilities for downhole applications include:
Pressure and Temperature – first installed in 1993 with now over 400 installations

2 SPE 149602
Distributed Temperature Sensing (DTS) – by far the most popular sensing option with at least a thousand logging and
permanent installations to-date
Array Temperature Sensing – first in 2008, and 100 total installations
Flow and Fraction Meters – Single and Multi-Phase – first installed in 2000, with a multi-phase meter installed in 2003, over
60 meters total
Seismic Accelerometers – over 45 installations since the first in 1999
for land, offshore platform, and subsea well applications. Other available commercial systems include strain measurement.
Initially, fiber optic sensing was limited to simple reservoir pressure monitoring and distributed temperature measurement
applications. Today complete intelligent well systems are being installed with multiple types of sensors in the same well, to
provide reservoir and flow data, as well as remotely operated zonal flow control devices to provide the ability to adjust flow
regimes – both production and injection.
In a drive to reduce well construction costs and manage the production of wells, the complexity of wells has increased with the
introduction of multi-lateral completions, and intelligent wells, and combinations thereof. The integrated use of permanent
fiber optics monitoring systems with those completion options has allowed operators to manage the drawdown of a reservoir,
or multiple reservoirs, with one main well bore. With these well construction and control options, the level of data required to
manage and optimize the production has increased significantly. Instead of a single pressure gauge being installed in a well
above the packer, multiple pressure gauges are being placed in the well to cover each production zone with at least one
pressure measurement. In addition, flow meters have been added to monitor zonal production rates in combination with phase
fraction to facilitate individual rate measurement (oil, water, gas), as well as DTS for thermal profiling, and qualitatively
identifying other well problems.
For the single point sensors described above, it is necessary to predetermine where in the well the sensors are to be placed.
One of the attractions of DTS has always been the ability to measure temperature at any point along the fiber. However, due to
their slow response compared to the point sensors, distributed sensors are usually only used in applications where
measurements taking in order of several seconds to hours are acceptable to achieve a high resolution. The emergence of DAS
[1], and the whole premise of making the entire fiber “the sensor” is even more promising in its potential to deliver well and
reservoir data along the entire length of the well, and use that data for production optimization to a level that is not possible
with DTS alone. DAS enables the fiber to be used as a series of microphones (typically one every meter) and to listen to for
example, flow noise in the tubing or downhole flow control devices at any point in the well – audible condition monitoring.
Distributed Acoustic Sensing When a pulse of light travels down an optical fiber, a small amount of the light is naturally scattered (mostly through Rayleigh
scattering) in the fiber and returns to the sensor unit. By recording the returning signal against time, a measurement of the
scattered light generated all along the fiber can be determined. An instrument that uses the mean intensity of the backscattered
light to determine the optical loss along the fiber is known as an Optical Time Domain Reflectometer (OTDR). DTS also uses
the same principle although the light used with DTS (normally Raman scattered light) is much weaker and harder to detect.
Distributed Acoustic Sensor (DAS)
Backscattered light returning to DAS
Acoustic field
Laser pulse propagating through the fiber
Optical fiber
Figure 1 The principle operation of Distributed Acoustic Sensor (DAS)

SPE 149602 3
A Distributed Disturbance Sensor (DDS), which is sometimes referred to as Distributed Vibration Sensor (DVS), is based on
an OTDR with a coherent light source. The DDS systems look at fast changes in amplitude of the returning Rayleigh
backscatter signal - if the signal changes, this indicates a disturbance or a vibration along the fiber but cannot quantify the
amplitude, frequency and phase of the disturbance. The DDS systems have been originally developed as a distributed alarm
system [3] such as for the perimeter intrusion detection applications [4]. More recently, the DDS systems have been used as in-
well noise or vibration indicators with limited data processing capabilities.
The DAS system described in this paper, on the other hand, uses a novel optoelectronic digital detection technique to record
the instantaneous phase (or frequency) of the backscattered light rather than the amplitude. Figure 1 shows the principle
operation with an acoustic field around the fiber causing the scatter centers, naturally distributed through the fiber, to vibrate.
The system digitally records both the amplitude and phase of the acoustic fields up to tens of kilohertz at every location along
and, hence, can “listen” to every point along the fiber. The system can offer 1 meter spatial resolution with a wide dynamic
range of more than 90 dB and with no cross-talk. So the fiber acts as an acoustic antenna and it can be deployed in multi-
dimensional configurations to enhance its sensitivity, directionality and frequency response [1].
Acoustic Signal Processing
One of the challenges is processing a large volume of the data collected at high speeds. For 10 km of fiber, 1m intervals at 10
kHz sampling, the minimum data rate is 100 MSamples/s. A number of fast signal processing techniques have been
developed to analyze the acoustic spectrum of the signal along the entire length of fiber and identify flow characteristics along
the wellbore [1]. In addition using coherent phase array processing techniques, the propagation of the acoustic energy along
the wellbore can be analyzed in space-frequency domain (k-ω) to determine the speed of sound and, thereby, measure the fluid
composition and velocity.
Potential Applications The following potential applications for DAS technology are amongst those identified already [1]. It is anticipated that more
will be identified as the technology and in particular data processing capabilities mature.
Distributed Flow Measurement – the U.K.’s Technology Strategy Board are partially funding Project No. 100722
"Distributed Acoustic Flow Meter”. The goal of the project, initiated in 2009, is to use the DAS technology to allow
flow measurements to be made along the entire length of the fiber [5]).
Sand Detection – the ability to detect the presence of sand, as well as provide a quantitative measurement downhole
has a number of benefits one of which is distributed condition monitoring of multi-stage sand control completions to
facilitate remedial steps to isolate problem zones.
Gas Breakthrough – identification and isolation.
Gas Lift Optimization – field survey data has already been acquired that demonstrates the ability to view and hear the
operational status of individual gas lift valves. This can facilitate appropriate optimization adjustments to the overall
gas lift program.
ESP Monitoring – electrical motor condition monitoring using noise pattern recognition techniques.
Intelligent Completions Performance – condition monitoring of downhole zonal flow control devices e.g. for erosion
effects.
Leak Detection/Well Integrity & Formation Subsidence Monitoring – allowing remedial activities to be planned.
Seismic – e.g. Vertical Seismic Profiling [6]
Field Surveys From a relatively large base of installed sensors offshore Norway operated on single mode optical fiber, seven wells were
selected for DAS surveys. Measurements were taken from DAS instrumentation placed in the instrument rooms connecting to
the existing surface and downhole fiber infrastructure. For the duration of the surveys mostly the existing downhole sensors
were disconnected from their own topsides instrumentation. For some measurements a spare fiber in the cables was used.
Neither dedicated installation of fiber nor any optimization of the cable construction or connectors was performed. The
producers used in this field survey all had a Bragg grating based pressure temperature gauge located in a gauge carrier
somewhere above the production packer. The gauge carriers being located below the gas lift valves. Hence, the survey does
not include any producers with the optical fiber running all the way to the sand face. Some of the wells can use traditional DTS
on a separate multimode fiber in the same downhole cable, but the DAS surveys were all performed on single-mode fibers.
The injectors surveyed are multi zone injectors with outflow control valves. The fiber runs down to a fiber based flow meter
and is terminated in a gauge carrier. The fiber to the lower zones runs past one or two injection zones. Hence the fiber is run
through several packers and past control valves and flow meters higher in the wells. In this paper we will not address in detail
the signal in the lower completion, but focus on the acoustic signals we obtained above the production packers.
4 SPE 149602
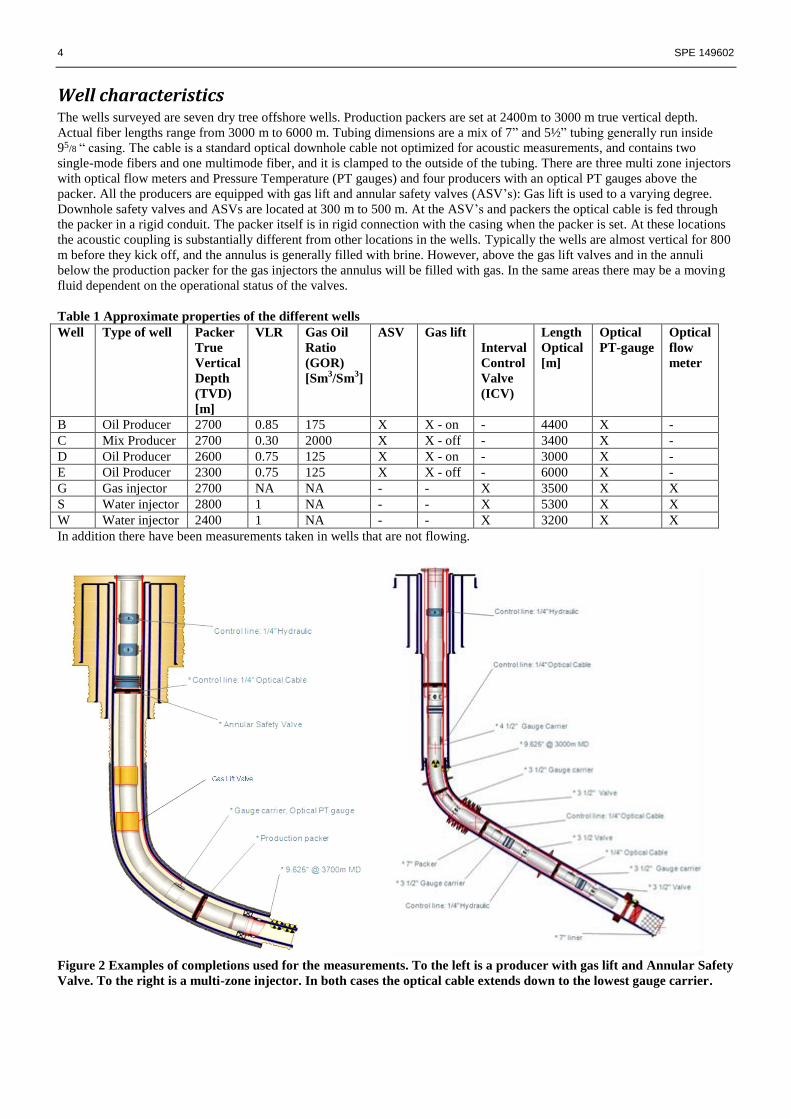
Well characteristics The wells surveyed are seven dry tree offshore wells. Production packers are set at 2400m to 3000 m true vertical depth.
Actual fiber lengths range from 3000 m to 6000 m. Tubing dimensions are a mix of 7” and 5½” tubing generally run inside
95/8 “ casing. The cable is a standard optical downhole cable not optimized for acoustic measurements, and contains two
single-mode fibers and one multimode fiber, and it is clamped to the outside of the tubing. There are three multi zone injectors
with optical flow meters and Pressure Temperature (PT gauges) and four producers with an optical PT gauges above the
packer. All the producers are equipped with gas lift and annular safety valves (ASV’s): Gas lift is used to a varying degree.
Downhole safety valves and ASVs are located at 300 m to 500 m. At the ASV’s and packers the optical cable is fed through
the packer in a rigid conduit. The packer itself is in rigid connection with the casing when the packer is set. At these locations
the acoustic coupling is substantially different from other locations in the wells. Typically the wells are almost vertical for 800
m before they kick off, and the annulus is generally filled with brine. However, above the gas lift valves and in the annuli
below the production packer for the gas injectors the annulus will be filled with gas. In the same areas there may be a moving
fluid dependent on the operational status of the valves.
Table 1 Approximate properties of the different wells
Well Type of well Packer
True
Vertical
Depth
(TVD)
[m]
VLR Gas Oil
Ratio
(GOR)
[Sm3/Sm
3]
ASV Gas lift
Interval
Control
Valve
(ICV)
Length
Optical
[m]
Optical
PT-gauge
Optical
flow
meter
B Oil Producer 2700 0.85 175 X X - on - 4400 X -
C Mix Producer 2700 0.30 2000 X X - off - 3400 X -
D Oil Producer 2600 0.75 125 X X - on - 3000 X -
E Oil Producer 2300 0.75 125 X X - off - 6000 X -
G Gas injector 2700 NA NA - - X 3500 X X
S Water injector 2800 1 NA - - X 5300 X X
W Water injector 2400 1 NA - - X 3200 X X
In addition there have been measurements taken in wells that are not flowing.
Figure 2 Examples of completions used for the measurements. To the left is a producer with gas lift and Annular Safety
Valve. To the right is a multi-zone injector. In both cases the optical cable extends down to the lowest gauge carrier.
SPE 149602 5
Large scale acoustics
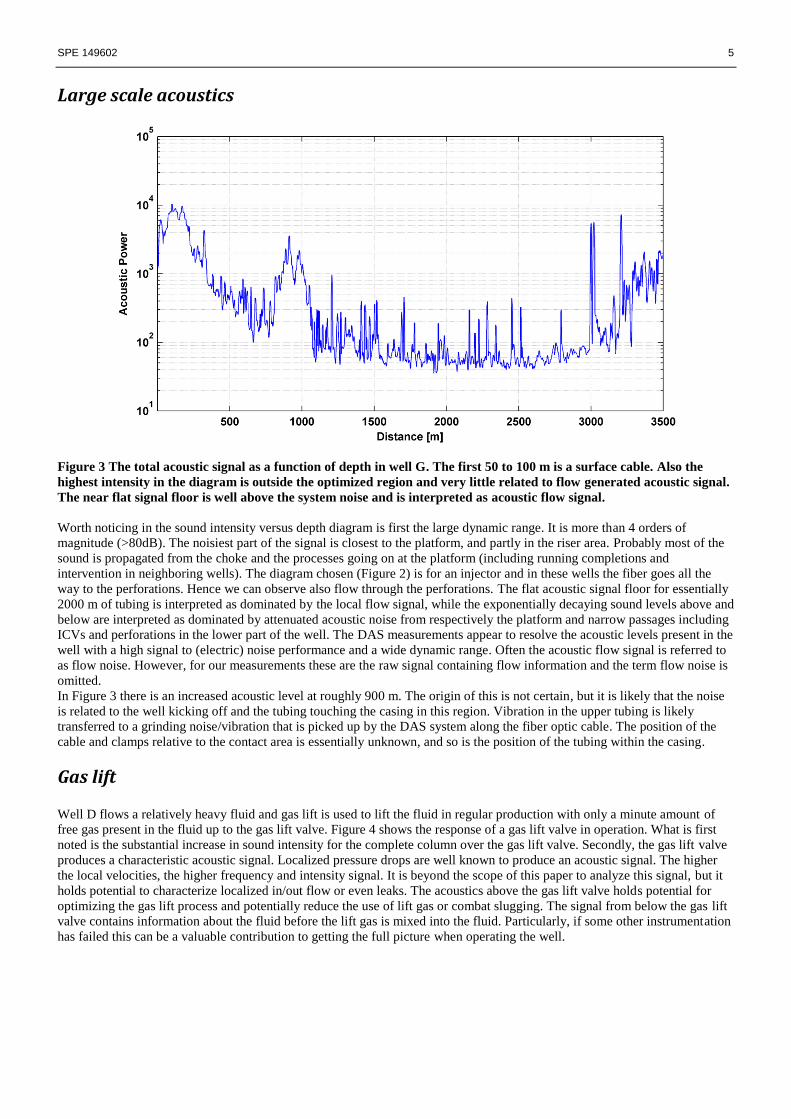
Figure 3 The total acoustic signal as a function of depth in well G. The first 50 to 100 m is a surface cable. Also the
highest intensity in the diagram is outside the optimized region and very little related to flow generated acoustic signal.
The near flat signal floor is well above the system noise and is interpreted as acoustic flow signal.
Worth noticing in the sound intensity versus depth diagram is first the large dynamic range. It is more than 4 orders of
magnitude (>80dB). The noisiest part of the signal is closest to the platform, and partly in the riser area. Probably most of the
sound is propagated from the choke and the processes going on at the platform (including running completions and
intervention in neighboring wells). The diagram chosen (Figure 2) is for an injector and in these wells the fiber goes all the
way to the perforations. Hence we can observe also flow through the perforations. The flat acoustic signal floor for essentially
2000 m of tubing is interpreted as dominated by the local flow signal, while the exponentially decaying sound levels above and
below are interpreted as dominated by attenuated acoustic noise from respectively the platform and narrow passages including
ICVs and perforations in the lower part of the well. The DAS measurements appear to resolve the acoustic levels present in the
well with a high signal to (electric) noise performance and a wide dynamic range. Often the acoustic flow signal is referred to
as flow noise. However, for our measurements these are the raw signal containing flow information and the term flow noise is
omitted.
In Figure 3 there is an increased acoustic level at roughly 900 m. The origin of this is not certain, but it is likely that the noise
is related to the well kicking off and the tubing touching the casing in this region. Vibration in the upper tubing is likely
transferred to a grinding noise/vibration that is picked up by the DAS system along the fiber optic cable. The position of the
cable and clamps relative to the contact area is essentially unknown, and so is the position of the tubing within the casing.
Gas lift
Well D flows a relatively heavy fluid and gas lift is used to lift the fluid in regular production with only a minute amount of
free gas present in the fluid up to the gas lift valve. Figure 4 shows the response of a gas lift valve in operation. What is first
noted is the substantial increase in sound intensity for the complete column over the gas lift valve. Secondly, the gas lift valve
produces a characteristic acoustic signal. Localized pressure drops are well known to produce an acoustic signal. The higher
the local velocities, the higher frequency and intensity signal. It is beyond the scope of this paper to analyze this signal, but it
holds potential to characterize localized in/out flow or even leaks. The acoustics above the gas lift valve holds potential for
optimizing the gas lift process and potentially reduce the use of lift gas or combat slugging. The signal from below the gas lift
valve contains information about the fluid before the lift gas is mixed into the fluid. Particularly, if some other instrumentation
has failed this can be a valuable contribution to getting the full picture when operating the well.

6 SPE 149602
Figure 4 Signal in a gas lift well. Upper graph is a spectrogram (red is high acoustic power spectral density, blue is
low); lower graph is a waterfall plot showing sound intensity for time versus depth (red is high power, blue/purple is
low).
Speed of sound The DAS system can measure the phase of the acoustic signal coherently along the fiber optic cable. Therefore, it is possible to
work out a propagating acoustic wave in that there is coherence in time and space with a corresponding dispersion diagram.
Digital signal processing can transform the time and linear space (along the well) sample into a diagram showing frequency
and wavenumber, k-ω space [2,1]. A frequency independent speed of sound propagation along the well will show up as a line
in k-ω space.
Figure 5 Sound in a well. Normalized sound data is shown to the left and dispersion diagram to the right corresponding
to a section to the right of in the raw acoustic trace.
Position of gas lift valve

SPE 149602 7
Figure 5 shows the time and space signal and the corresponding k-ω space. As can be seen for frequencies below 10 and above
100 Hz it is possible to work out a good fit for the speed of sound. This frequency range is determined in part by a
combination of factors including: present flow signal, propagation and coupling of the acoustic signal and to some extent the
processing. It can be noted that as seen in Figure 5 there are upward and downward traveling waves. In addition there can be
multiple paths and hence different speeds of sound. As an example a path confined to the steel is known, so is a path
dominated by the fluid. As has been used in two phase measurements [2] this signal contains information on the composition
of the flow. The frequency band over which a speed of sound can be determined is more than sufficient for compositional and
flow characterization. With the DAS system the speed of sound can be evaluated over a large section of the well and,
therefore, measure the distributed variations of the flow composition and characteristics along the well [1].
Flow There is potential for developing other methods such as shown for the gas lift well where e.g. features in the flow such as slugs
can be tracked. In Figure 4 the sound intensity varies with the amount of gas in the flow. The gas lift operates cyclically and
the bands of high and low sound intensity can be tracked as they propagate up the well. Lines can in general be fitted to
features in time distance diagrams. Dependent on the flow condition these lines correspond directly or indirectly to the velocity
of the general flow. There are more subtle characteristics that can be tracked with further processing of the digital signal.
The other feature to produce a distributed flow speed is the Doppler shift in the speed of sound along the well [1]. A Doppler
shift can be measured as long as clear speed of sound lines can be fitted to both upward and downward propagating sound
dominated by the fluid of interest. The Doppler shift is to the first approximation twice the flow speed.
Figure 6 Evolution of speed of sound with depth in a gas injector (top) and the deduced flow speed from the Doppler
shift along a large section of the well. The faster speed of sound is downward propagating traveling with the flow. For
both graphs the dashed line is the expected value based on average injection rate and PVT. Absolute uncertainties in
the references are roughly 5% for the flow rate and at least 15 m/s for the speed of sound, but with small uncertainties
in the trends.
Figure 6 shows the distributed flow determined in a gas injector based on Doppler shift measurements for a 30 s sampling. The
determined flow varies with the depth in the well corresponding to the change in pressure for a section of tubing with a

8 SPE 149602
uniform inner dimension and a gradually sloped well trajectory. In total the instantaneous and locally determined flow is
roughly within +/- 0.3 m/s (that for this well is 10%) of the actual flow speed. The flow is continuous, so this is the best
reference. The match to reference measurements is within the uncertainties of an instantaneous measurement, the fluid
property and the distribution of the pressure drop within the well. It remains to verify the ultimately achievable accuracy.
Longer homogenous lengths and stable conditions over time hold potential for reducing the uncertainty substantially.
Summary of what signals have been demonstrated in the different wells The initial field measurements show good signal in many wells. As could be expected speed of sound and direct determination
of flow is more challenging in substantially inhomogeneous flows than in highly uniform flows. Being early in the
development process, the DAS system is sensitive enough to record flow acoustics in all the wells surveyed. As long as a true
acoustic signal with a relatively good signal to noise margin is recorded for the complete well then the raw signal is suitable
for further processing. The signal processing for further refining the flow and compositional information is beyond the scope
of this paper
Table 2 Measurement results for the different wells
Well Type of well Recorded
raw
acoustic
Features
in the
flow
Speed of
sound
detected
Flow Comment
B Oil Producer X N/A N/A N/A High optical losses. Accordingly given low
attention. Also, surveyed during an intervention.
C Mix Producer X (X) Difficult signal, may require more processing
D Oil Producer X X intervals intervals
E Oil Producer X X X intervals
G Gas injector X uniform X X
S Water injector X uniform X X
(limits)
Injection and packer fluids are almost the same
giving some challenges
W Water injector X uniform X X
(limits)
Injection and packer fluids are almost the same
giving some challenges
Other measurements Figure 7 is included to show that it is possible to identify elements in the well with the characteristics of the sound
propagation[1]. When the propagation information and other characteristics such as shown in Figures 3 and 4 are combined
with the sound intensity information from Figure 7 it is possible to e.g. look for tubing wear, liquid levels and possibly
identification of other characteristics of a well that otherwise would require a separate logging run. Having the fiber installed
and surveying with DAS has thus the potential for rapidly delivering information concerning imminent well problems, and
possibly saving intervention costs. Such an application has to be developed over time to get to the same confidence level as
traditional logging.
From an operational point of view DAS appears to already have shown the capability of providing interesting and potentially
useful qualitative information in essentially all the wells that have been surveyed. For a quantitative measurement further
development is required. A DAS measurement also provides essentially orders of magnitude more data than e.g. a DTS
measurement. Handling the data will require development for the operator both in terms of communication and data storage to
make use of the full potential of DAS, with the possibility to combine DAS and DTS survey measurements adding further
value.
Conclusions It is demonstrated that DAS can detect the acoustic field in the variety of oil wells surveyed. There is a sufficient signal to
noise level to do further processing of the recorded acoustic field. The demonstration of relatively clear sound dispersion
diagrams (wavenumber versus frequency plots), demonstrates both the quality of the recorded signal and the presence of
propagating acoustic signals that can be used to further quantify distributed composition and flow velocity along the wellbore.
DAS has demonstrated its capability for retrofitting to existing fiber installations. The signal quality also holds potential for
developing other diagnostics techniques in the future.

SPE 149602 9
.
Figure 7 The left part shows the sound intensity (not calibrated units) in the lower part of an injector well. Features
corresponding to change in the completion can be seen to the right. To the length scale shown the completion sketch is
no accurate representation of the ID, but rather an indication of where in the completion we are.
Acknowledgements The authors wish to thank the following: Statoil assets teams, Roy Kutlik of Chevron, David Selviah of University College London, Haldun
Unalmis of Weatherford, and Tom Parker, Sergey Shatalin, Mladen Todorov and Janti Shawash of Silixa and for related discussions with the
partners in the Distributed Acoustic Flow Meter project [5]
References 1. Mahmoud Farhadiroushan, Tom Parker and Sergey Shatalin, “Method and Apparatus for Optical Sensing”, Patent
application no. PCT/GB2010/050889, 27th
May 2009.
2. Paper, (National Engineering Laboratory Workshop), "Fiber-Optic Flowmeter at BP Mahogany, Offshore Trinidad," 7th
South East Asia Hydrocarbon Flow Measurement Workshop, March 5-7, 2008, Kuala Lumpur, Malaysia. Ö. H.
Ünalmis, A. Vera, S. Mathias, and E. S. Johansen, Weatherford Intl.; R. Chung, BP Trinidad & Tobago LLC.
3. Shatalin, Sergey et al., “Interferometric optical time-domain reflectometry for distributed optical-fiber sensing”, Applied
Optics, Vol. 37, No. 24, pp. 5600 -5604, 20 August 1998.
4. Juan C. Juarez, et al. , “Distributed Fiber-optic Intrusion sensor System”, J. Lightwave Technology, Vol. 23, No. 6, pp. 2081
-2087, June 2005.
5. Project No. 100722 "Distributed Acoustic Flow Meter” partially funded by the U.K.’s Technology Strategy Board with
project partners Chevron, Saudi Aramco, Silixa, Statoil, University College London, Weatherford
6. Project Number: 100988 - "Distributed Optical Seismic Sensing System" partially funded by the U.K.’s Technology
Strategy Board with project partners, Silixa, Statoil and Weatherford.