3 q09 presentation
DESCRIPTION
TRANSCRIPT
1
3Q09
Resultados
Operacionais
e Financeiros
1T08
Financial and Operating
Results
3Q09
November 17, 2009
2
3Q09
Agenda
► Highlights
► Operating Results
► Financial Results
► Introduction
► CEMAR’s Tariff Review
► Recent Events
3
3Q09
Agenda
► Highlights
► Operating Results
► Financial Results
► Introduction
► CEMAR’s Tariff Review
► Recent Events
4
3Q09
Introduction
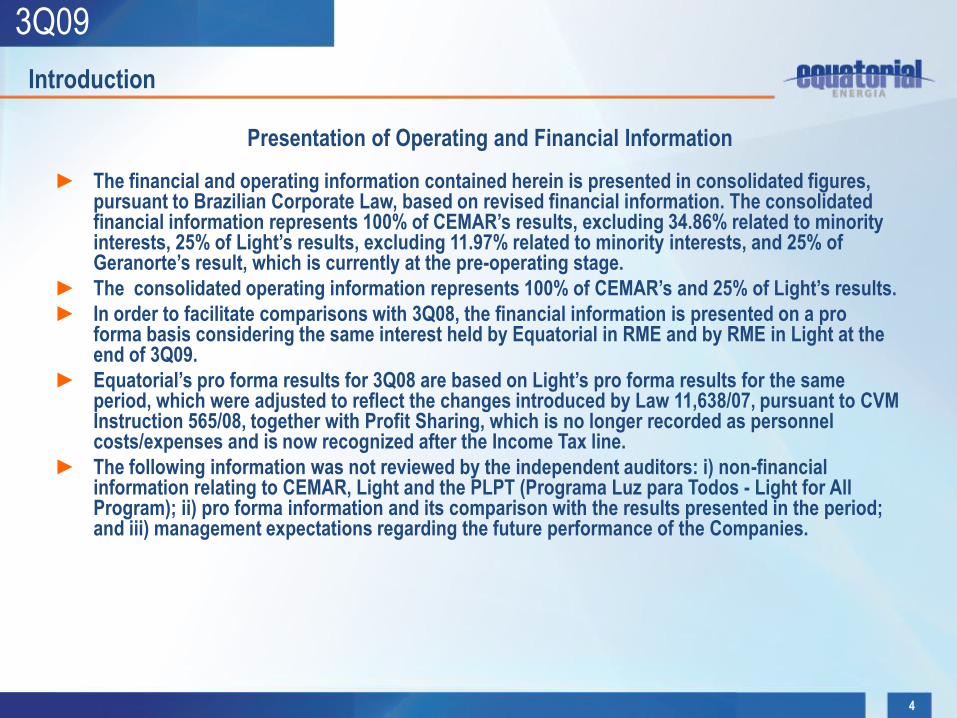
Presentation of Operating and Financial Information
► The financial and operating information contained herein is presented in consolidated figures, pursuant to Brazilian Corporate Law, based on revised financial information. The consolidated financial information represents 100% of CEMAR’s results, excluding 34.86% related to minority interests, 25% of Light’s results, excluding 11.97% related to minority interests, and 25% of Geranorte’s result, which is currently at the pre-operating stage.
► The consolidated operating information represents 100% of CEMAR’s and 25% of Light’s results.
► In order to facilitate comparisons with 3Q08, the financial information is presented on a pro forma basis considering the same interest held by Equatorial in RME and by RME in Light at the end of 3Q09.
► Equatorial’s pro forma results for 3Q08 are based on Light’s pro forma results for the same period, which were adjusted to reflect the changes introduced by Law 11,638/07, pursuant to CVM Instruction 565/08, together with Profit Sharing, which is no longer recorded as personnel costs/expenses and is now recognized after the Income Tax line.
► The following information was not reviewed by the independent auditors: i) non-financial information relating to CEMAR, Light and the PLPT (Programa Luz para Todos - Light for All Program); ii) pro forma information and its comparison with the results presented in the period; and iii) management expectations regarding the future performance of the Companies.

5
3Q09
Agenda
► Highlights
► Operating Results
► Financial Results
► Introduction
► CEMAR’s Tariff Review
► Recent Events
6
3Q09
► CEMAR’s and Light SESA’s total energy volume amounted to 2,221 GWh in 3Q09, 4.1%more than in 3Q08. CEMAR’s quarterly volume grew by 9.4%, while Light’s increased by0.2% (considering both captive and free markets).
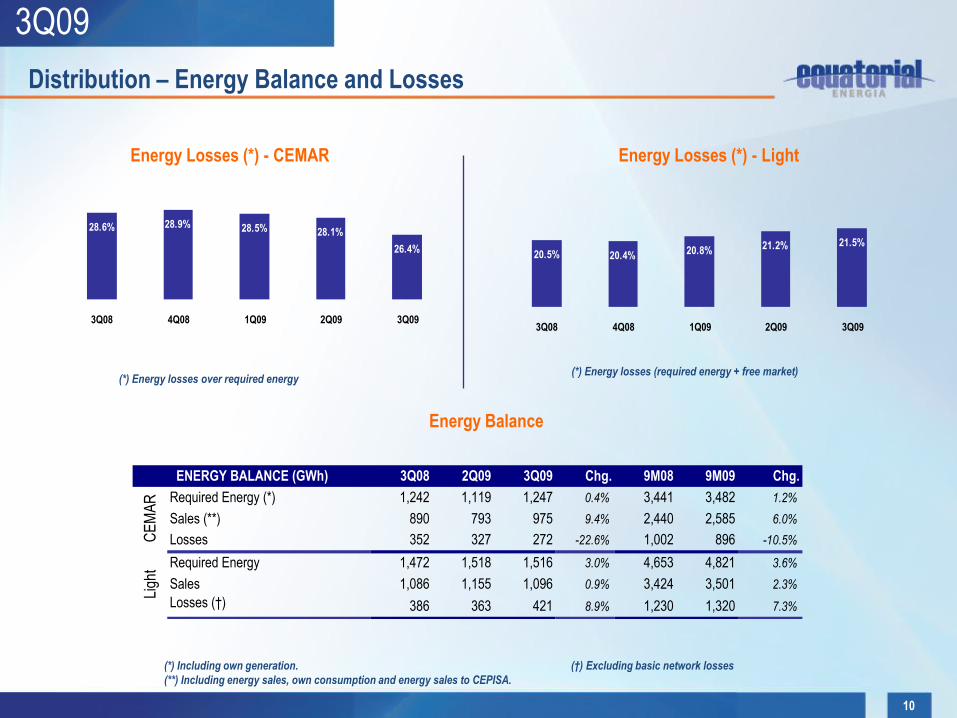
► CEMAR’s last-12-month energy losses totaled 26.4% of required energy in 3Q09, 2.5 p.p. less than the 4Q08 ratio of 28.9%. Light’s last-12-month losses came to 21.5%, 1.1 p.p. up compared with 4Q08.
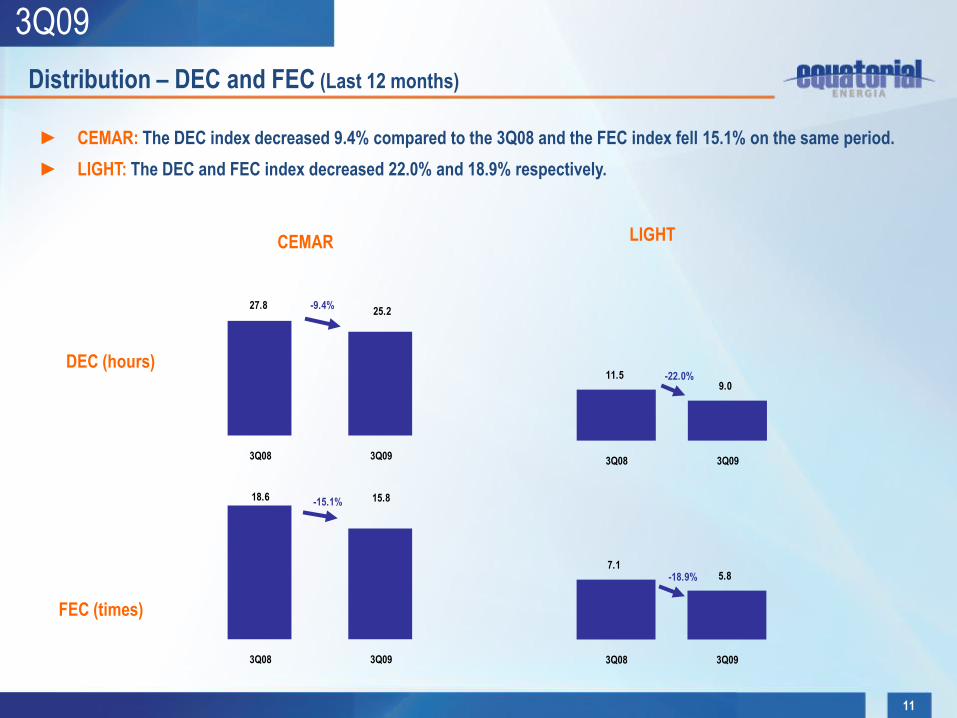
► CEMAR’s last-12-month 3Q09 DEC index reached 9.4%, down to 25.2 hours, while last-12-month FEC index improved 15.1%, to 15.8 times. Light’s last-12-month DEC and FEC moved down 22.0% and 18.9%, reaching 9.0 hours and 5.8 times, respectively.
Operating Highlights
7
3Q09
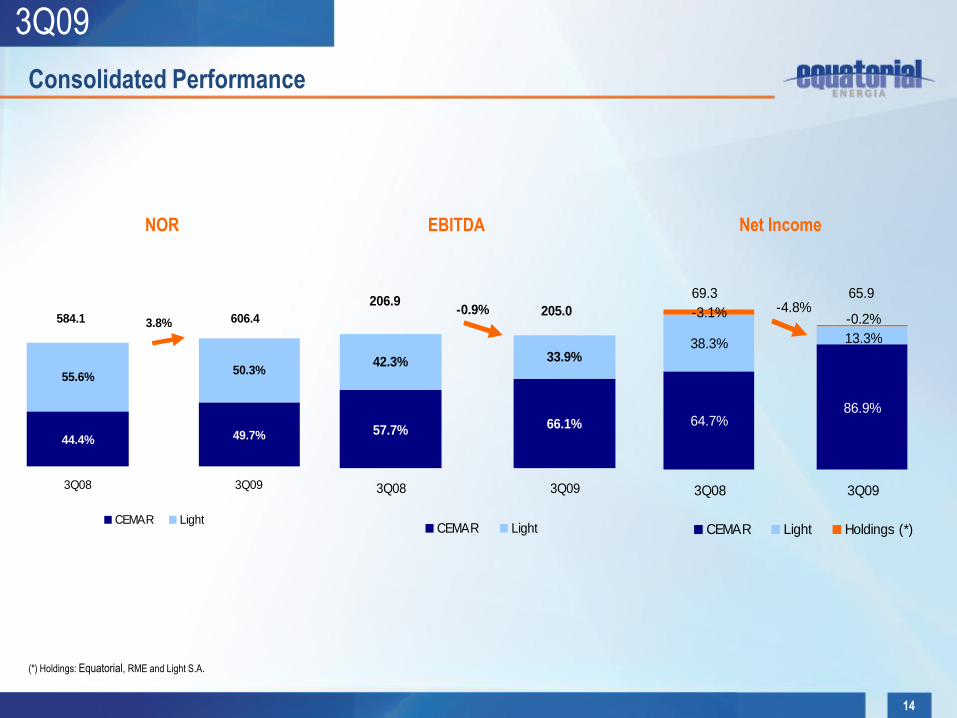
► Net operating revenues (NOR) reached R$606.4 million in 3Q09, 3.8% up over 3Q08, reflecting a 16.0% increase by CEMAR and a 6.1% downturn by Light.
► Adjusting for non-recurring effects, 3Q09 EBITDA reached R$215.1 million, up by 4.0% over 3Q08.
► Adjusted net income came to R$71.5 million in 3Q09, reflecting a 3.2% increase over 3Q08.
► In 3Q09, Equatorial’s consolidated investments grew 26.2% when compared with 3Q08. CEMAR’s investments (excluding direct investments in the PLPT program) totaled R$62.2 million in 3Q09, while Light’s investments came to R$37.2 million in the period, up by 7.7% over 3Q08. Geranorte’s investments reached R$63.6 million in 3Q09.
Financial Highlights
8
3Q09
Agenda
► Highlights
► Operating Results
► Financial Results
► Introduction
► CEMAR’s Tariff Review
► Recent Events
9
3Q09
Consolidated
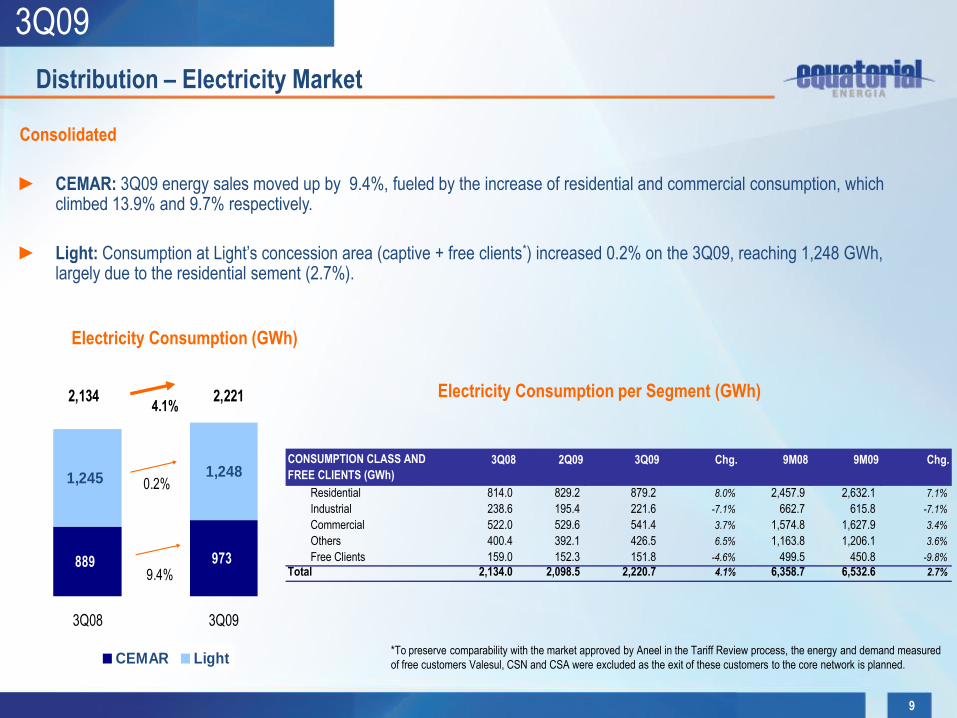
► CEMAR: 3Q09 energy sales moved up by 9.4%, fueled by the increase of residential and commercial consumption, which climbed 13.9% and 9.7% respectively.
► Light: Consumption at Light’s concession area (captive + free clients*) increased 0.2% on the 3Q09, reaching 1,248 GWh, largely due to the residential sement (2.7%).
Distribution – Electricity Market
Electricity Consumption per Segment (GWh)
Electricity Consumption (GWh)
*To preserve comparability with the market approved by Aneel in the Tariff Review process, the energy and demand measured
of free customers Valesul, CSN and CSA were excluded as the exit of these customers to the core network is planned.
1,245
973889
1,248
3Q08 3Q09
CEMAR Light
9.4%
0.2%
4.1%2,2212,134
CONSUMPTION CLASS AND 3Q08 2Q09 3Q09 Chg. 9M08 9M09 Chg.
FREE CLIENTS (GWh)
Residential 814.0 829.2 879.2 8.0% 2,457.9 2,632.1 7.1%
Industrial 238.6 195.4 221.6 -7.1% 662.7 615.8 -7.1%
Commercial 522.0 529.6 541.4 3.7% 1,574.8 1,627.9 3.4%
Others 400.4 392.1 426.5 6.5% 1,163.8 1,206.1 3.6%
Free Clients 159.0 152.3 151.8 -4.6% 499.5 450.8 -9.8%
Total 2,134.0 2,098.5 2,220.7 4.1% 6,358.7 6,532.6 2.7%
10
3Q09
Energy Losses (*) - CEMAR
Energy Balance
(*) Including own generation. (†) Excluding basic network losses
(**) Including energy sales, own consumption and energy sales to CEPISA.
(*) Energy losses (required energy + free market)
Energy Losses (*) - Light
(*) Energy losses over required energy
Distribution – Energy Balance and Losses
28.6% 28.1%28.5%28.9%
26.4%
3Q08 4Q08 1Q09 2Q09 3Q09
20.5%21.2%20.8%20.4%
21.5%
3Q08 4Q08 1Q09 2Q09 3Q09
3Q08 2Q09 3Q09 Chg. 9M08 9M09 Chg.
Required Energy (*) 1,242 1,119 1,247 0.4% 3,441 3,482 1.2%
Sales (**) 890 793 975 9.4% 2,440 2,585 6.0%
Losses 352 327 272 -22.6% 1,002 896 -10.5%
Required Energy 1,472 1,518 1,516 3.0% 4,653 4,821 3.6%
Sales 1,086 1,155 1,096 0.9% 3,424 3,501 2.3%
Losses (†) 386 363 421 8.9% 1,230 1,320 7.3%
CE
MA
R
ENERGY BALANCE (GWh)
Ligh
t
11
3Q09
DEC (hours)
FEC (times)
CEMAR LIGHT
► CEMAR: The DEC index decreased 9.4% compared to the 3Q08 and the FEC index fell 15.1% on the same period.
► LIGHT: The DEC and FEC index decreased 22.0% and 18.9% respectively.
Distribution – DEC and FEC (Last 12 months)
7.15.8
3Q08 3Q09
-18.9%
18.6 15.8
3Q08 3Q09
-15.1%
11.59.0
3Q08 3Q09
-22.0%
25.227.8
3Q08 3Q09
-9.4%
12
3Q09
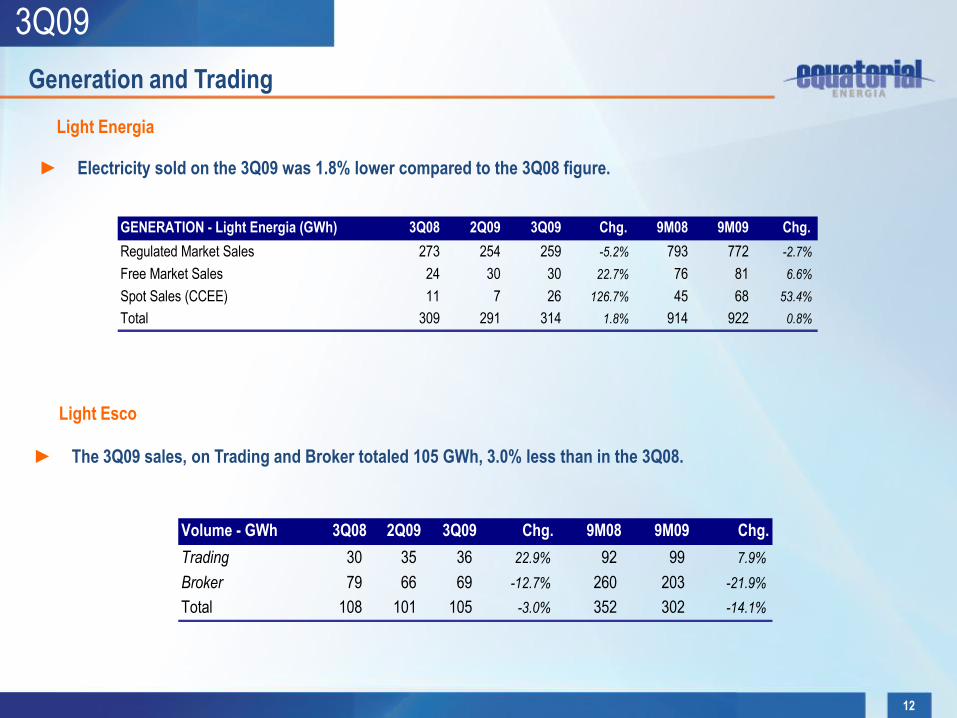
► Electricity sold on the 3Q09 was 1.8% lower compared to the 3Q08 figure.
Light Energia
Light Esco
► The 3Q09 sales, on Trading and Broker totaled 105 GWh, 3.0% less than in the 3Q08.
Generation and Trading
GENERATION - Light Energia (GWh) 3Q08 2Q09 3Q09 Chg. 9M08 9M09 Chg.
Regulated Market Sales 273 254 259 -5.2% 793 772 -2.7%
Free Market Sales 24 30 30 22.7% 76 81 6.6%
Spot Sales (CCEE) 11 7 26 126.7% 45 68 53.4%
Total 309 291 314 1.8% 914 922 0.8%
Volume - GWh 3Q08 2Q09 3Q09 Chg. 9M08 9M09 Chg.
Trading 30 35 36 22.9% 92 99 7.9%
Broker 79 66 69 -12.7% 260 203 -21.9%
Total 108 101 105 -3.0% 352 302 -14.1%
13
3Q09
Agenda
► Highlights
► Operating Results
► Financial Results
► Introduction
► CEMAR’s Tariff Review
► Recent Events
14
3Q09
NOR EBITDA Net Income
Consolidated Performance
(*) Holdings: Equatorial, RME and Light S.A.
44.4% 49.7%
55.6%50.3%
3Q08 3Q09
CEMAR Light
3.8%
3.2%
606.4584.1
57.7% 66.1%
42.3% 33.9%
3Q08 3Q09
CEMAR Light
-0.9%206.9
205.0
64.7%86.9%
38.3% 13.3%
-0.2%-3.1%
3Q08 3Q09
CEMAR Light Holdings (*)
65.969.3-4.8%
15
3Q09
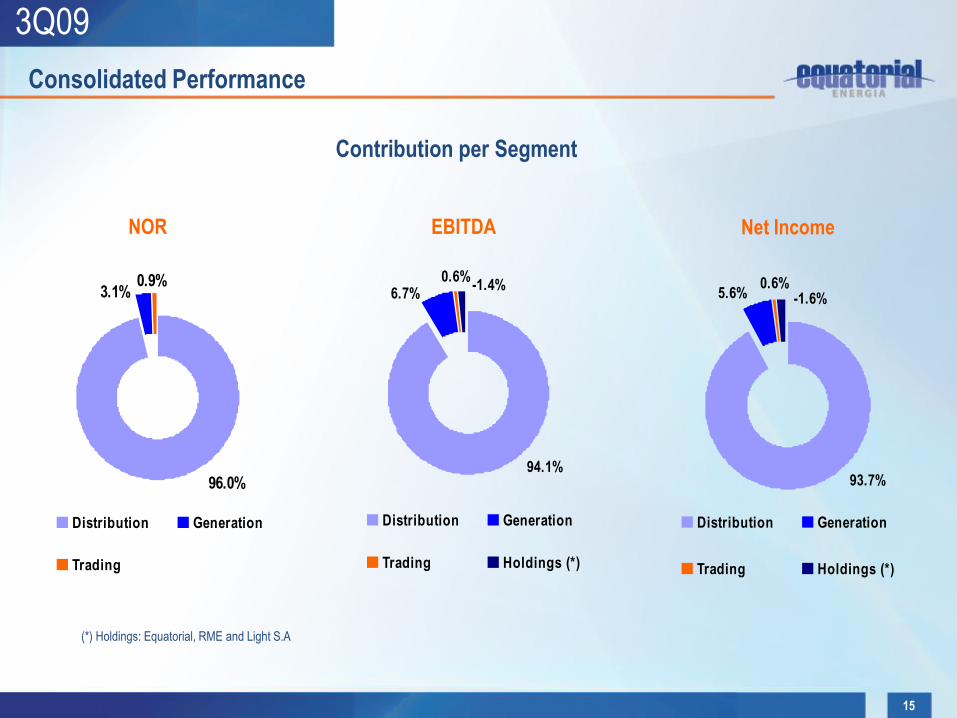
NOR EBITDA Net Income
(*) Holdings: Equatorial, RME and Light S.A
Consolidated Performance
Contribution per Segment
96.0%
0.9%3.1%
Distribution Generation
Trading
6.7%0.6%
-1.4%
94.1%
Distribution Generation
Trading Holdings (*)
93.7%
-1.6%0.6%
5.6%
Distribution Generation
Trading Holdings (*)
16
3Q09
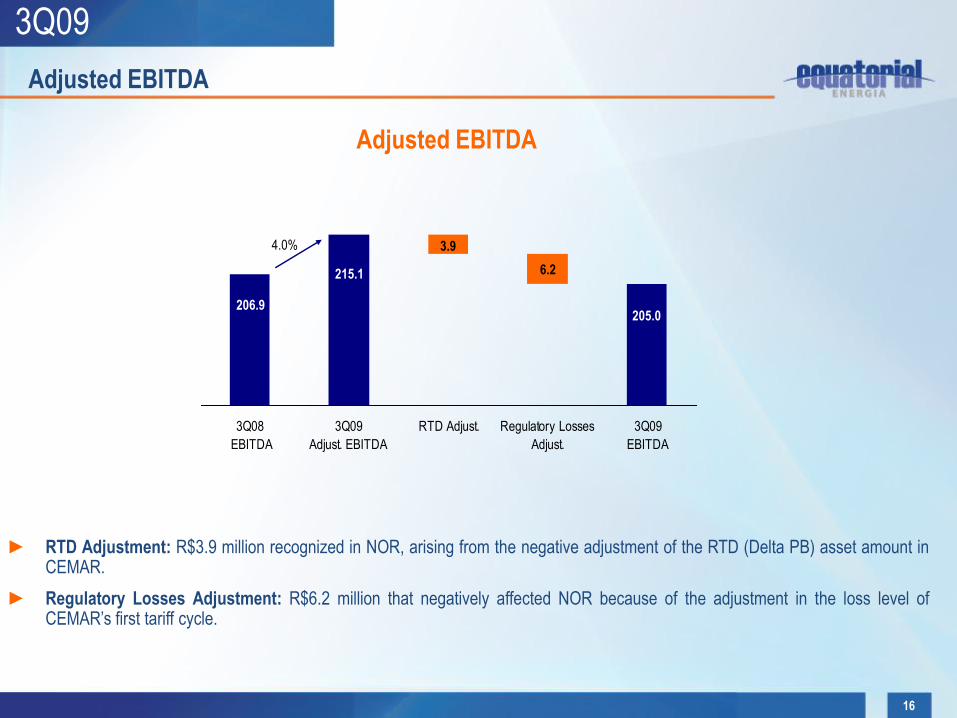
Adjusted EBITDA
Adjusted EBITDA
► RTD Adjustment: R$3.9 million recognized in NOR, arising from the negative adjustment of the RTD (Delta PB) asset amount inCEMAR.
► Regulatory Losses Adjustment: R$6.2 million that negatively affected NOR because of the adjustment in the loss level ofCEMAR’s first tariff cycle.
6.2
205.0
215.1
206.9
3.9
3Q08
EBITDA
3Q09
Adjust. EBITDA
RTD Adjust. Regulatory Losses
Adjust.
3Q09
EBITDA
4.0%
17
3Q09
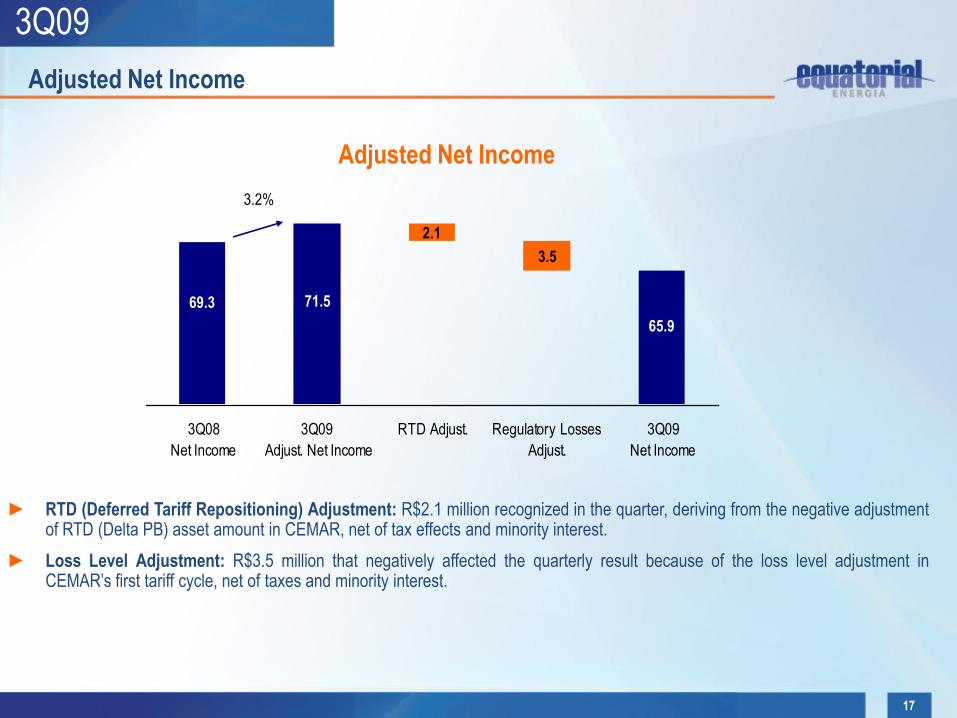
Adjusted Net Income
Adjusted Net Income
► RTD (Deferred Tariff Repositioning) Adjustment: R$2.1 million recognized in the quarter, deriving from the negative adjustmentof RTD (Delta PB) asset amount in CEMAR, net of tax effects and minority interest.
► Loss Level Adjustment: R$3.5 million that negatively affected the quarterly result because of the loss level adjustment inCEMAR’s first tariff cycle, net of taxes and minority interest.
2.1
3.5
69.3 71.5
65.9
3Q08
Net Income
3Q09
Adjust. Net Income
RTD Adjust. Regulatory Losses
Adjust.
3Q09
Net Income
3.2%
18
3Q09
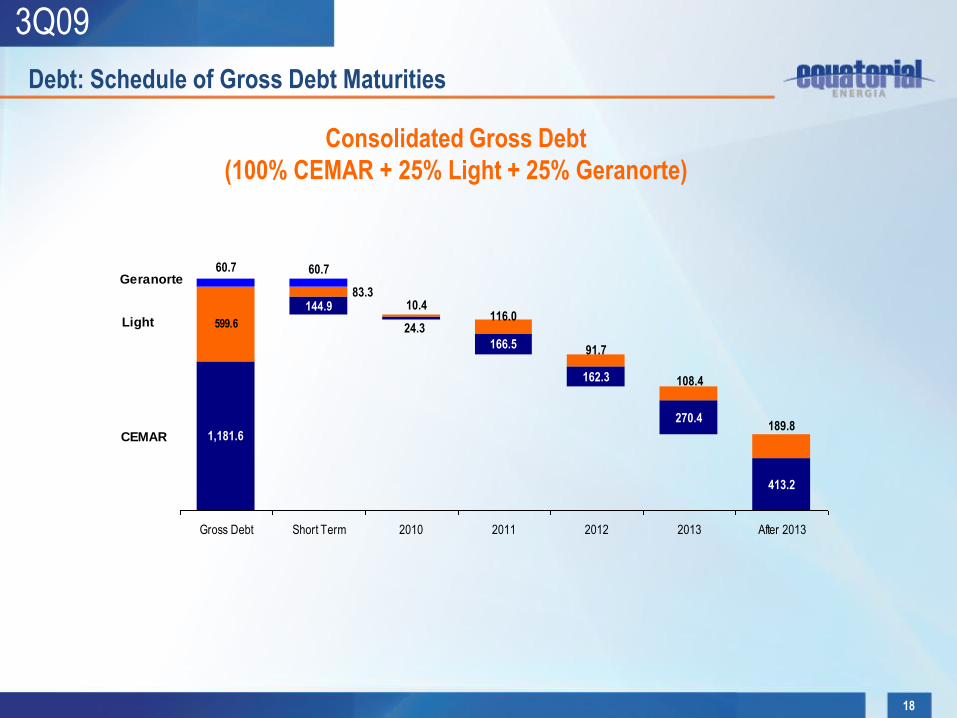
Debt: Schedule of Gross Debt Maturities
Consolidated Gross Debt
(100% CEMAR + 25% Light + 25% Geranorte)
144.9
166.5
162.3
270.4
413.2
24.3
1,181.6
599.6
83.310.4
116.0
91.7
108.4
189.8
60.760.7
Gross Debt Short Term 2010 2011 2012 2013 After 2013
CEMAR
Light
Geranorte
19
3Q09
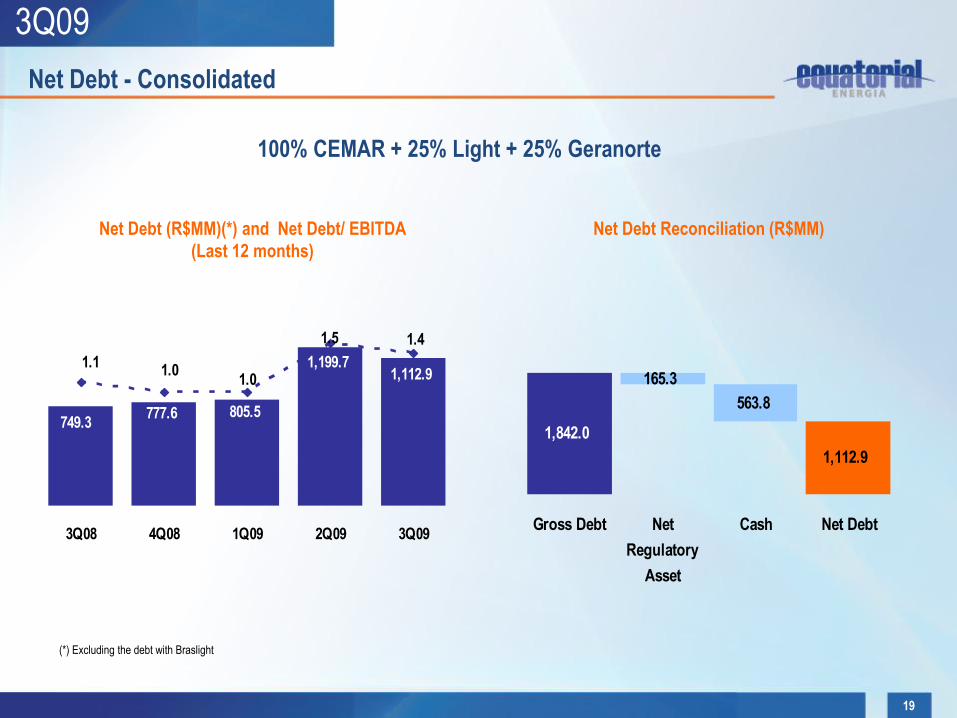
Net Debt - Consolidated
Net Debt (R$MM)(*) and Net Debt/ EBITDA
(Last 12 months)
Net Debt Reconciliation (R$MM)
(*) Excluding the debt with Braslight
100% CEMAR + 25% Light + 25% Geranorte
1,112.9
749.3
1,199.7
805.5777.6
1.01.0
1.5 1.4
1.1
3Q08 4Q08 1Q09 2Q09 3Q09
165.3
563.8
1,112.9
1,842.0
Gross Debt Net
Regulatory
Asset
Cash Net Debt
20
3Q09
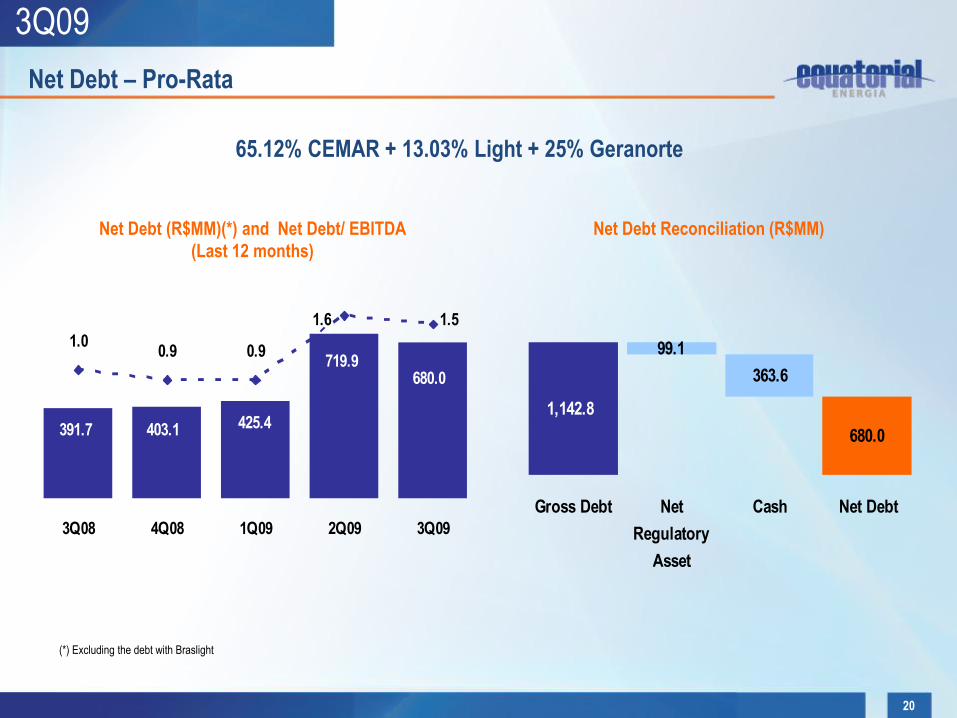
(*) Excluding the debt with Braslight
Net Debt – Pro-Rata
Net Debt (R$MM)(*) and Net Debt/ EBITDA
(Last 12 months)
Net Debt Reconciliation (R$MM)
65.12% CEMAR + 13.03% Light + 25% Geranorte
680.0
391.7
719.9
425.4403.1
0.9 0.9
1.6 1.5
1.0
3Q08 4Q08 1Q09 2Q09 3Q09
99.1
363.6
680.0
1,142.8
Gross Debt Net
Regulatory
Asset
Cash Net Debt
21
3Q09
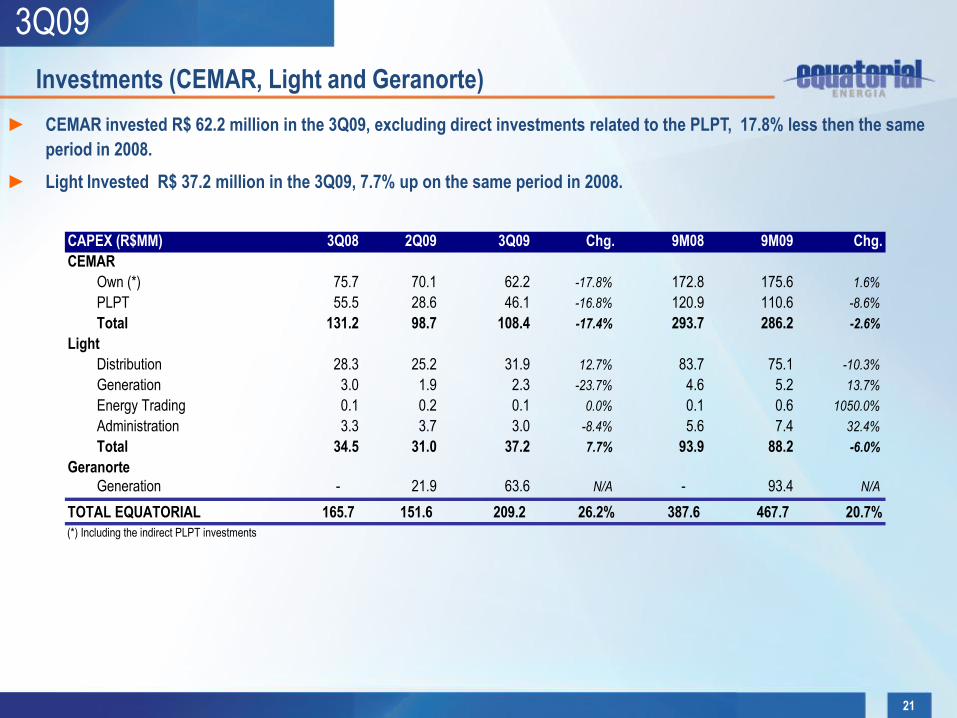
► CEMAR invested R$ 62.2 million in the 3Q09, excluding direct investments related to the PLPT, 17.8% less then the same
period in 2008.
► Light Invested R$ 37.2 million in the 3Q09, 7.7% up on the same period in 2008.
Investments (CEMAR, Light and Geranorte)
CAPEX (R$MM) 3Q08 2Q09 3Q09 Chg. 9M08 9M09 Chg.
CEMAR
Own (*) 75.7 70.1 62.2 -17.8% 172.8 175.6 1.6%
PLPT 55.5 28.6 46.1 -16.8% 120.9 110.6 -8.6%
Total 131.2 98.7 108.4 -17.4% 293.7 286.2 -2.6%
Light
Distribution 28.3 25.2 31.9 12.7% 83.7 75.1 -10.3%
Generation 3.0 1.9 2.3 -23.7% 4.6 5.2 13.7%
Energy Trading 0.1 0.2 0.1 0.0% 0.1 0.6 1050.0%
Administration 3.3 3.7 3.0 -8.4% 5.6 7.4 32.4%
Total 34.5 31.0 37.2 7.7% 93.9 88.2 -6.0%
Geranorte
Generation - 21.9 63.6 N/A - 93.4 N/A
TOTAL EQUATORIAL 165.7 151.6 209.2 26.2% 387.6 467.7 20.7%
(*) Including the indirect PLPT investments
22
3Q09
Agenda
► Highlights
► Operating Results
► Financial Results
► Introduction
► CEMAR’s Tariff Review
► Recent Events
23
3Q09
CEMAR’s Tariff Review
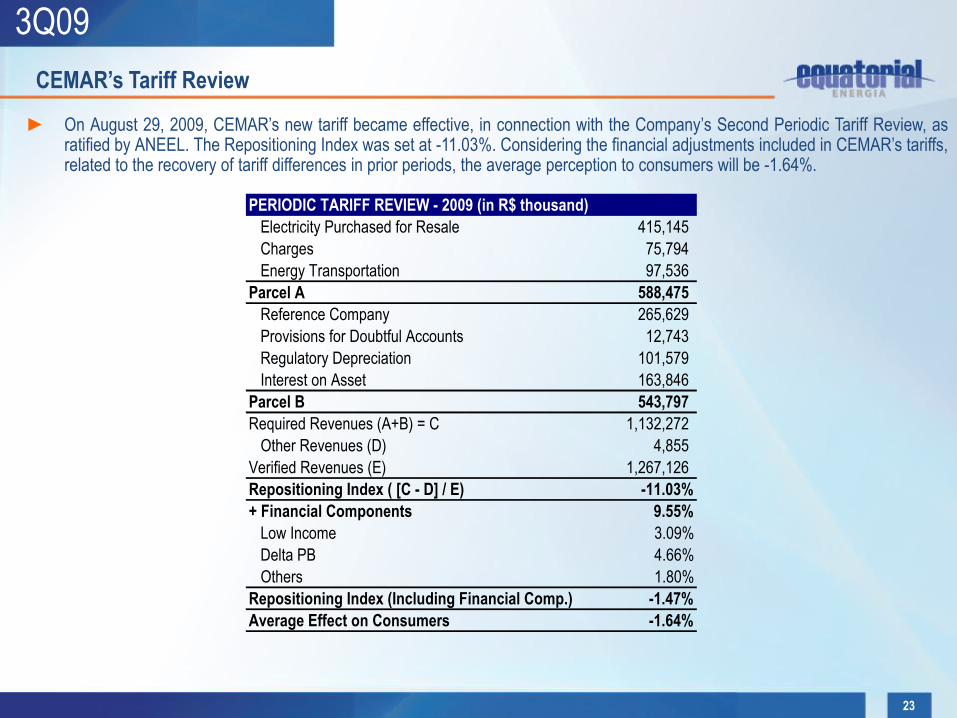
► On August 29, 2009, CEMAR’s new tariff became effective, in connection with the Company’s Second Periodic Tariff Review, asratified by ANEEL. The Repositioning Index was set at -11.03%. Considering the financial adjustments included in CEMAR’s tariffs,related to the recovery of tariff differences in prior periods, the average perception to consumers will be -1.64%.
Electricity Purchased for Resale 415,145
Charges 75,794
Energy Transportation 97,536
Parcel A 588,475
Reference Company 265,629
Provisions for Doubtful Accounts 12,743
Regulatory Depreciation 101,579
Interest on Asset 163,846
Parcel B 543,797
Required Revenues (A+B) = C 1,132,272
Other Revenues (D) 4,855
Verified Revenues (E) 1,267,126
Repositioning Index ( [C - D] / E) -11.03%
+ Financial Components 9.55%
Low Income 3.09%
Delta PB 4.66%
Others 1.80%
Repositioning Index (Including Financial Comp.) -1.47%
Average Effect on Consumers -1.64%
PERIODIC TARIFF REVIEW - 2009 (in R$ thousand)
24
3Q09
Agenda
► Highlights
► Operating Results
► Financial Results
► Introduction
► CEMAR’s Tariff Review
► Recent Events
25
3Q09
CEMAR:
► “Viva Luz Project”: In October 2009, the State of Maranhão approved the allocation of R$49.0 million in state funds, to be used through the close of 2010, to exempt residential costumers with monthly consumption not exceeding 50kWh from the payment of energy bills. The Project is estimated to benefit up to 500 thousand residential consumers, which corresponds nearly to 30% of the CEMAR’s total clients.
Light:
In a meeting held on November 06, 2009, Light S.A.’s Board of Directors approved, among others, the following issues:
► The additional dividend distribution of R$94.7 million, or R$0.46 per share of the Company, relating to the profit reserve account balance as of December 31, 2008.
► The engagement of Light Serviços de Eletricidade S.A. to “Novo Refis”, as set forth by Law 11,941/2009, resulting in tax debt rescheduling in up to 180 monthly installments.
► The Share Buyback Plan, whereby up to 6,571,846 common shares issued by Light S.A. will be purchased at market prices no longer than 365 days as of November 10, 2009. Said Plan represents up to 6.73% of total free float and aims at complying with the Long-Term Shares Incentive Plan, without diluting the interest held by current shareholders.
Recent Events
26
3Q09
Eduardo Haiama
CFO and IRO
Thomas Newlands
IR Analyst
Telephone 1: +0 55 (21) 3206-6635
Telephone 2: +0 55 (21) 3217-6607
Email: [email protected]
Website: http://www.equatorialenergia.com.br/ir
Contacts
27
3Q09
• This presentation may contain forward-looking statements, which are subject to risks and uncertainties, as they were based on the
expectations of Company’s management and on available information. These prospects include statements concerning the Company’s
current intentions or expectations for our clients; this presentation will also be available at our website www.equatorialenergia.com.br/ir and
in the IPE system of the Brazilian Securities and Exchange Commission (CVM).
• Forward-looking statements refer to future events which may or may not occur. Our future financial situation, operating results, market share
and competitive positioning may differ substantially from those expressed or suggested by said forward-looking statements. Many factors
and values that can establish these results are outside Company’s control or expectation. The reader/investor is advised not to completely
rely on the information above.
• The words “believe", “can", “predict", “estimate", “continue", “anticipate", “intend", “forecast" and similar words, are intended to identify
estimates, which refer only to the date on which they were expressed. Hence, the Company has no obligation to update said statements.
• This presentation does not constitute any offering, invitation or request of subscription offer or purchase of any marketable securities. And,
this statement or any other information herein, does not constitute the basis for any contract or commitment of any kind.
Disclaimer