3-4 development of the measurement technology of the ... kouichi et al. 61 conclusion, including the...
TRANSCRIPT

59SEBATA Kouichi et al.
1 Introduction
To ensure the effective use of radio fre-quencies spectrum, a reduction of the unwant-ed radio frequency emissions is required to bein line with the agreed international recom-mendation is a goal shared throughout theworld. The ITU (International Telecommuni-cation Union) has revised the regulatory limitsof unwanted emissions and spurious emissionsin 1997, stipulating its application from 2003[1].
In Japan, the law was revised as ofDecember 2005, applying more rigorous regu-latory limits relative to earlier regulations(however, a two-year transitional period wasapproved). Specifically in terms of primaryradar, unlike other communications equip-ment, the law requires the establishment of thelimit mask described below (-20 dB/decade;see also the bold line in Fig. 1) to enable con-trol and identification of out-of-band and spu-rious regions.
3-4 Development of the Measurement Technology of the Spurious Emissionfrom Primary Radar
SEBATA Kouichi, MIYAZAWA Yoshiyuki, KITAZAWA Hironori, and SHIOTA Sadaaki
In order to facilitate efficient use of frequency spectrum, ITU-R recommends the reduction ofall unwanted emissions in line with the agreed international recommendations of the ITU. Theunwanted emission control recommendation, for Radars requires the measurement of allunwanted emissions transmitted by the radar antenna including that of the spurious in a definedmethod of measurement detailed in a recommendation.
NICT have been conducting a research and development program to establish the requiredmeasurement site in Japan and the necessary measurement system. This paper will providereviews of our activities at NICT on the project to date. In order to construct the measurementsite that can meet the requirement of ITU-R M.1177, we have surveyed a number of potentialsites in Japan and measured their electro-magnetic environment. Radar emission measurementexperiments were also conducted at each site to enable the selection of the best suitable sitefrom the potential list. For the measurement system requirements, a theoretical evaluation wasconducted using simulation technique as well as performing real measurement experimentation.From our investigation, the following conclusions were obtained: The requirements in ITU-RM.1177 for the dynamic range, measurement distance (far field condition) and the measurementcondition of rotating antenna under test are reasonable and must be adhered to. Resolutionbandwidth (RBW) of the receiver, however, in the ITU-R M.1177 is found to be not sufficient andnarrower bandwidth must be selected to be no more than 1/4τ(τ: pulse width) in order todecrease the measurement error.
KeywordsUnwanted emission, Spurious emission, ITU-R, M.1177, Radar

60 Journal of the National Institute of Information and Communications Technology Vol.53 No.1 2006
To measure the unwanted emissions fromradar systems, measurement methods has beenset out and defined in ITU-R Recommenda-tion ITU-R M.1177, recommendationsapproved by the ITU-R assembly must beemployed[2].
The ITU-R M.1177 recommendation spec-ifies two measurement methods: the directmethod (measures the Air-Bourne radio fre-quency emissions radiated directly from theradar antenna), and the indirect method (whichcalculates emissions by measuring spectra atthe feeding point of the transmitter-receiverwithin the wave guide separately from mea-surement of the antenna characteristics). In thecase of the indirect method, even if the anten-na and transmitter characteristics (measuredseparately over the entire target frequencyrange under measurement) are correctedtogether, the oscillation condition (i.e., thespectra) varies with changes in load dependingon the transmitter, thus rendering accuratemeasurement totally impossible. As a result,the direct method is currently favoured.
ITU-R M.1177 requires a measurementdynamic range of 70 [dB] or higher, specify-ing that in the case of the direct method, thefar-field antenna condition (((2xD2)/λ) {D:length of the antenna under measurement,λ:wavelength}—several hundreds of meters formarine radar, several km for meteorologicalradar) be met in measurement. From this per-
spective, two factors are critical for measure-ment according to ITU-R M.1177: the mea-surement system must provide a sufficientmeasurement dynamic range and the measure-ment location (site) must meet the far-fieldantenna condition.
Since fiscal 2004, NICT has beenengaged, under a commission from the Min-istry of Internal Affairs and Communications,in the development of a method for measuringspurious emissions from radar that is compati-ble with the new regulations slated to comeinto effect in Japan. Among its efforts NICThas conducted a wide range of surveys andstudies aimed, for example, at establishingmeasurement sites and systems in Japan. Atpresent, only two sites in the world are capa-ble of far-field measurement: QinetiQ inBritain and the NTIA (National Telecommuni-cations and Information Administration) in theUS. Accordingly, we conducted an experimentto measure spurious radar emissions at theNTIA site in October 2004 in partnership withvarious members of the NTIA.
From the survey and study results obtainedto date, we have concluded that accurate mea-surement will be difficult to achieve at NICT’scurrent Koganei measurement site (outdoorsite) if such measurement is to be conductedin accordance with the measurement methodset out in ITU-R Recommendation ITU-RM.1177. There are several reasons for this
Fig.1 Out-of-band and spurious regions

61SEBATA Kouichi et al.
conclusion, including the insufficient distancefor measurement at the facility and the signifi-cant impact of external radio frequencies[4][5].
Thus it is clear that we must establish anew measurement site in Japan; accordingly,we are in the process of investigating potentiallocations.
In terms of the measurement system, onthe other hand, it is critical to secure a suffi-cient dynamic range (70 [dB] or more); astudy is now underway to find a way to over-come this hurdle. Among the methods we arecurrently exploring, one involves expansion ofthe dynamic range while appropriately con-trolling the power input to the spectrum ana-lyzer; this is performed by combining a vari-able band rejection filter (V-BRF) capable ofsuppressing only the fundamental wave (i.e.,the centre frequency) with a low noise ampli-fier (LNA).
This paper describes the survey and studyresults to date from two perspectives—i.e.,based on considerations 2 and 3 mentionedabove—for the measurement of spurious radaremissions, in accordance with the ITU-RM.1177 recommendation.
2 Measurement site
In reviewing measurement sites, we car-ried out the following survey and study todetermine the potential use of NICT’s currentmeasurement site (the Koganei outdoor site)and the possibility of building a further site atanother location in Japan.
2.1 Study on measurement distance(necessity of far-field conditions)
One of the measurement requirements ofITU-R Recommendation ITU-R M.1177 isthat the far-field antenna condition must bemet. NICT’s measurement site has a maxi-mum measurement distance of 100 m, with anumber of on-site radar systems that do notmeet the far-field condition. To verify thenecessity of this requirement, therefore, weconducted an experiment to confirm the dif-ference in spectra obtained when the far-fieldcondition is met and when it is not.
The experiment was carried out at theNTIA site in the US, as there are only twosites in the world (QinetiQ in Britain and theNTIA) where the far-field antenna condition ismet.
In this measurement, the spectrum analyz-er was set to zero span and RBW steps ofapproximately 1/τwith a sweep time equal toor exceeding the time required for a singlerotation of the antenna, in accordance withITU-R Recommendation ITU-R M.1177. Ablock diagram of NTIA’s measurement systemis shown below (Fig. 2).
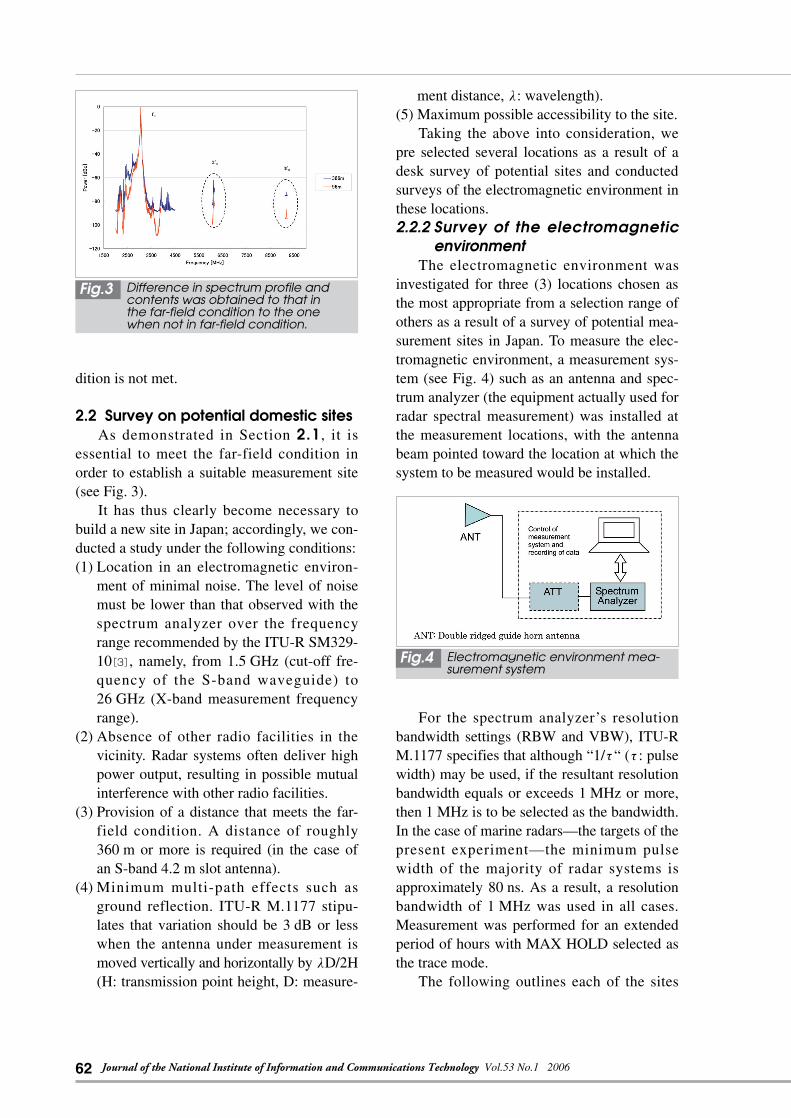
Spectral measurements were performed onthe same radar (marine radar; S-band 30 kWP0N 4.2 m slot antenna) in two states: one inwhich the far-field antenna condition was metand another in which it was not. The spectraobtained are shown below (Fig. 3).
An 11 dB difference was observed for thesecond harmonic and a 14 dB difference wasobserved for the third harmonic. It is clearfrom these results that spurious emissions maybe underestimated if the far-field antenna con-
Fig.2 Measurement system block diagram
62 Journal of the National Institute of Information and Communications Technology Vol.53 No.1 2006
dition is not met.
2.2 Survey on potential domestic sitesAs demonstrated in Section 2.1, it is
essential to meet the far-field condition inorder to establish a suitable measurement site(see Fig. 3).
It has thus clearly become necessary tobuild a new site in Japan; accordingly, we con-ducted a study under the following conditions:(1) Location in an electromagnetic environ-
ment of minimal noise. The level of noisemust be lower than that observed with thespectrum analyzer over the frequencyrange recommended by the ITU-R SM329-10[3], namely, from 1.5 GHz (cut-off fre-quency of the S-band waveguide) to26 GHz (X-band measurement frequencyrange).
(2) Absence of other radio facilities in thevicinity. Radar systems often deliver highpower output, resulting in possible mutualinterference with other radio facilities.
(3) Provision of a distance that meets the far-field condition. A distance of roughly360 m or more is required (in the case ofan S-band 4.2 m slot antenna).
(4) Minimum multi-path effects such asground reflection. ITU-R M.1177 stipu-lates that variation should be 3 dB or lesswhen the antenna under measurement ismoved vertically and horizontally byλD/2H(H: transmission point height, D: measure-
ment distance,λ: wavelength).(5) Maximum possible accessibility to the site.
Taking the above into consideration, wepre selected several locations as a result of adesk survey of potential sites and conductedsurveys of the electromagnetic environment inthese locations.2.2.2 Survey of the electromagnetic
environment The electromagnetic environment was
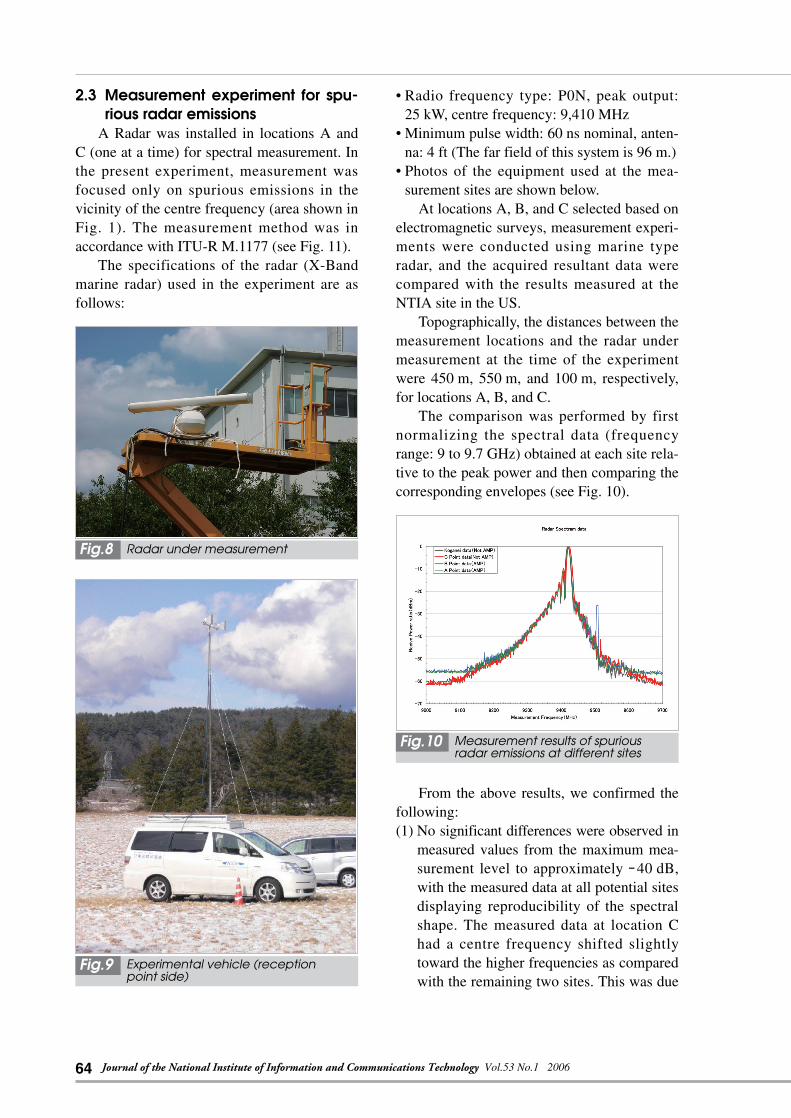
investigated for three (3) locations chosen asthe most appropriate from a selection range ofothers as a result of a survey of potential mea-surement sites in Japan. To measure the elec-tromagnetic environment, a measurement sys-tem (see Fig. 4) such as an antenna and spec-trum analyzer (the equipment actually used forradar spectral measurement) was installed atthe measurement locations, with the antennabeam pointed toward the location at which thesystem to be measured would be installed.
For the spectrum analyzer’s resolutionbandwidth settings (RBW and VBW), ITU-RM.1177 specifies that although “1/τ“ (τ: pulsewidth) may be used, if the resultant resolutionbandwidth equals or exceeds 1 MHz or more,then 1 MHz is to be selected as the bandwidth.In the case of marine radars—the targets of thepresent experiment—the minimum pulsewidth of the majority of radar systems isapproximately 80 ns. As a result, a resolutionbandwidth of 1 MHz was used in all cases.Measurement was performed for an extendedperiod of hours with MAX HOLD selected asthe trace mode.
The following outlines each of the sites
Fig.3 Difference in spectrum profile andcontents was obtained to that inthe far-field condition to the onewhen not in far-field condition.
Fig.4 Electromagnetic environment mea-surement system

63SEBATA Kouichi et al.
and lists the measurement results obtainedunder the above-mentioned conditions:Location A
This candidate measurement site (locationA) is in a corner of a cultivated field in amountainous region that is isolated frommobile phones. The transmitter (radar) waslocated in front of a thick plantation at the footof a mountain. The receiver (measurementvehicle) was placed approximately two ter-raced fields below. The distance between thetransmitter and receiver was approximately500 m, with an altitude difference of 10 m(including a transmission antenna height of7 m and a reception antenna height of 10 m).The electromagnetic environment at thispotential site was found to be -60 dBm or less(1 GHz to 26 GHz) (see Fig. 5).
Location BLocated in the mountains, this candidate
measurement site (location B) is isolated frommobile phones, with a V-shaped gorge sand-wiched between a thick plantation of trees onthe north side (receiver side) and a narrowploughed field on the south side (transmitterside). The transmitter was installed in a cornerof the field, and the receiver was placed in aclearing near a forest trail. The distancebetween the transmitter and receiver wasapproximately 500 m, with a valley betweenthe two devices. The electromagnetic environ-ment at this potential site was found to returna value of-60 dBm or less (1 GHz to 26 GHz)(see Fig. 6).
Location CThis candidate measurement site (location
C) is more accessible than the remaining twosites, lying some distance from the centre ofan urban area. Although surrounded by a high-way and national road, the location is in a spa-cious, nearly flat meadow (300 m×300 m; aformer agricultural experimental station).The distance between the transmitter andreceiver is roughly 100 m, with almost no dif-ference in altitude (including a transmissionantenna height of 4 m and reception antennaheight of 6 m). Worst case emission in theelectromagnetic environment was found to beat -57 dBm. All emissions encountered werein the low frequency region (1 GHz to 3 GHz)from expected sources such as mobile phones(see Fig. 7).
Fig.5 Results of measurement of electro-magnetic environment at location A
Fig.6 Measurement results for electromag-netic environment at location B
Fig.7 Results of measurement of electro-magnetic environment at location C
64 Journal of the National Institute of Information and Communications Technology Vol.53 No.1 2006
2.3 Measurement experiment for spu-rious radar emissions
A Radar was installed in locations A andC (one at a time) for spectral measurement. Inthe present experiment, measurement wasfocused only on spurious emissions in thevicinity of the centre frequency (area shown inFig. 1). The measurement method was inaccordance with ITU-R M.1177 (see Fig. 11).
The specifications of the radar (X-Bandmarine radar) used in the experiment are asfollows:
• Radio frequency type: P0N, peak output:25 kW, centre frequency: 9,410 MHz
• Minimum pulse width: 60 ns nominal, anten-na: 4 ft (The far field of this system is 96 m.)
• Photos of the equipment used at the mea-surement sites are shown below.
At locations A, B, and C selected based onelectromagnetic surveys, measurement experi-ments were conducted using marine typeradar, and the acquired resultant data werecompared with the results measured at theNTIA site in the US.
Topographically, the distances between themeasurement locations and the radar undermeasurement at the time of the experimentwere 450 m, 550 m, and 100 m, respectively,for locations A, B, and C.
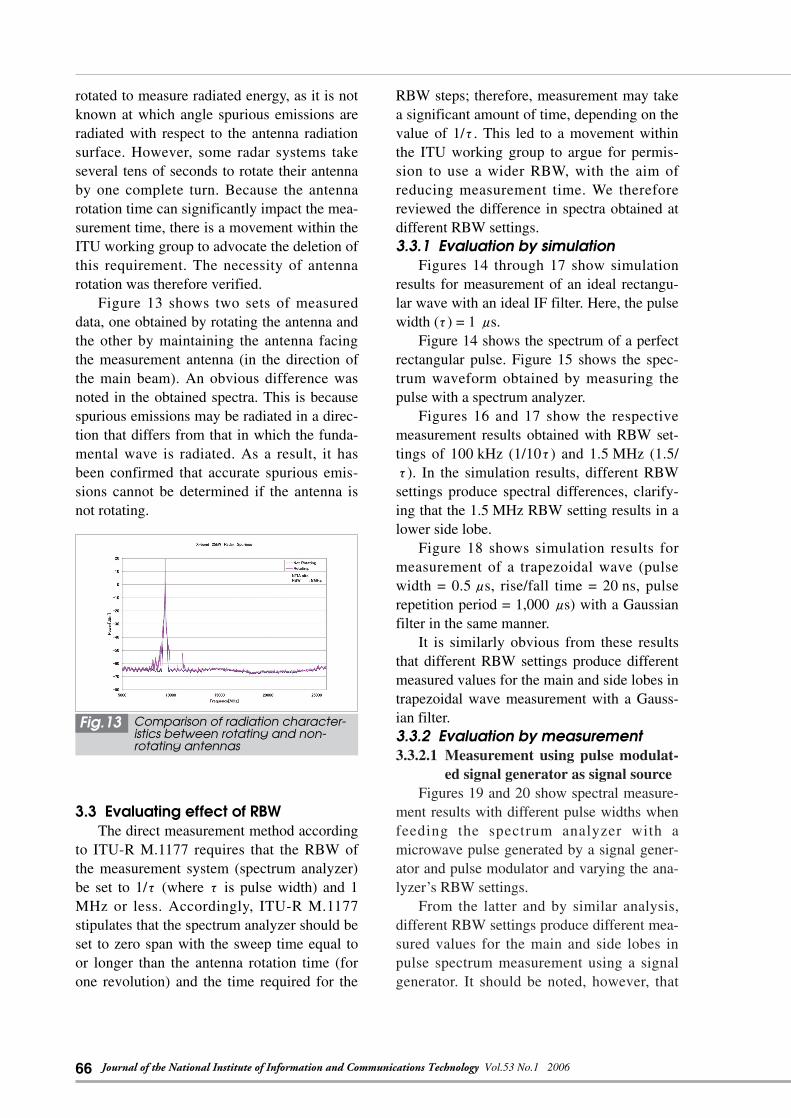
The comparison was performed by firstnormalizing the spectral data (frequencyrange: 9 to 9.7 GHz) obtained at each site rela-tive to the peak power and then comparing thecorresponding envelopes (see Fig. 10).
From the above results, we confirmed thefollowing:(1) No significant differences were observed in
measured values from the maximum mea-surement level to approximately -40 dB,with the measured data at all potential sitesdisplaying reproducibility of the spectralshape. The measured data at location Chad a centre frequency shifted slightlytoward the higher frequencies as comparedwith the remaining two sites. This was due
Fig.8 Radar under measurement
Fig.9 Experimental vehicle (receptionpoint side)
Fig.10 Measurement results of spuriousradar emissions at different sites

65SEBATA Kouichi et al.
to the properties of the magnetron, theoscillation source, compounded with lowambient temperatures at the time of themeasurement.
(2) The measured data of -40 dB or below atall potential sites varied, presumably dueto topographic factors including multi-patheffects.
(3) Fluctuation in the received signal powerlevel is likely to be caused by externalinterfering radio frequencies or the com-posite effect of combining more than onesource. This was observed in several areaswithin the measurement results. Thesespectra, presumably reflecting the effectsof aircraft radar or the like, merit furtherinvestigation. If aircraft, for example, canbe identified as responsible, this effectcould likely be eliminated by monitoringapproaching aircraft or similar method.Considering factors such as multi-path
effects, the difference in altitude between thetransmission and reception points should pre-sumably be minimized. All sites tested fea-tured an altitude difference, and under the pre-sent circumstances, this difference will hinderstable reception of extremely weak signals ator below-40 dB. Particularly at potential siteswith a number of obstacles such as standingtrees (locations A and B), this effect has beenconfirmed. In this respect, however, possiblecauses of signal level variations should be fur-ther investigated, as in these cases we aredealing with extremely weak signals.
3 Measurement system
As part of the overall study of spuriousemission measurement methods and systems,several topics have been reviewed, includingthe actual performance of NICT’s currentmeasurement system and the adequacy of therequirements imposed by ITU-R M.1177 onmeasurement systems, including measurementmethods. A summary of the study results isgiven below.
3.1 Confirming the performance ofthe measurement system
The NICT spurious measurement systemis shown below.
A comparison was made between thespectra obtained with this measurement sys-tem (measured at the NICT site) and thoseobtained with the NTIA measurement system(Fig. 2). The comparison results are shown inFig. 12. In the case of the NICT outdoor site,the dynamic range was approximately 60 dB,falling short of the 80 dB or more required byITU-R M.1177. This was primarily caused bysuppression of the AMP input, and occurredbecause even though the main frequency com-ponent was attenuated by the BRF, the AMPdeveloped inter-modulation at other frequencybands. In response to this result, several coun-termeasures are now under test, including theimposition of band limitations on the AMPand the use of a high-gain antenna.
3.2 Necessity of antenna rotationThe direct measurement method stipulated
by ITU-R M.1177 requires that the antenna be
Fig.11 NICT spurious measurement system
Fig.12 Comparison of dynamic rangebetween NICT and NTIA sites
66 Journal of the National Institute of Information and Communications Technology Vol.53 No.1 2006
rotated to measure radiated energy, as it is notknown at which angle spurious emissions areradiated with respect to the antenna radiationsurface. However, some radar systems takeseveral tens of seconds to rotate their antennaby one complete turn. Because the antennarotation time can significantly impact the mea-surement time, there is a movement within theITU working group to advocate the deletion ofthis requirement. The necessity of antennarotation was therefore verified.
Figure 13 shows two sets of measureddata, one obtained by rotating the antenna andthe other by maintaining the antenna facingthe measurement antenna (in the direction ofthe main beam). An obvious difference wasnoted in the obtained spectra. This is becausespurious emissions may be radiated in a direc-tion that differs from that in which the funda-mental wave is radiated. As a result, it hasbeen confirmed that accurate spurious emis-sions cannot be determined if the antenna isnot rotating.
3.3 Evaluating effect of RBWThe direct measurement method according
to ITU-R M.1177 requires that the RBW ofthe measurement system (spectrum analyzer)be set to 1/τ (whereτ is pulse width) and 1MHz or less. Accordingly, ITU-R M.1177stipulates that the spectrum analyzer should beset to zero span with the sweep time equal toor longer than the antenna rotation time (forone revolution) and the time required for the
RBW steps; therefore, measurement may takea significant amount of time, depending on thevalue of 1/τ. This led to a movement withinthe ITU working group to argue for permis-sion to use a wider RBW, with the aim ofreducing measurement time. We thereforereviewed the difference in spectra obtained atdifferent RBW settings.3.3.1 Evaluation by simulation
Figures 14 through 17 show simulationresults for measurement of an ideal rectangu-lar wave with an ideal IF filter. Here, the pulsewidth (τ) = 1 μs.
Figure 14 shows the spectrum of a perfectrectangular pulse. Figure 15 shows the spec-trum waveform obtained by measuring thepulse with a spectrum analyzer.
Figures 16 and 17 show the respectivemeasurement results obtained with RBW set-tings of 100 kHz (1/10τ) and 1.5 MHz (1.5/τ). In the simulation results, different RBWsettings produce spectral differences, clarify-ing that the 1.5 MHz RBW setting results in alower side lobe.
Figure 18 shows simulation results formeasurement of a trapezoidal wave (pulsewidth = 0.5μs, rise/fall time = 20 ns, pulserepetition period = 1,000μs) with a Gaussianfilter in the same manner.
It is similarly obvious from these resultsthat different RBW settings produce differentmeasured values for the main and side lobes intrapezoidal wave measurement with a Gauss-ian filter.3.3.2 Evaluation by measurement3.3.2.1 Measurement using pulse modulat-
ed signal generator as signal sourceFigures 19 and 20 show spectral measure-
ment results with different pulse widths whenfeeding the spectrum analyzer with amicrowave pulse generated by a signal gener-ator and pulse modulator and varying the ana-lyzer’s RBW settings.
From the latter and by similar analysis,different RBW settings produce different mea-sured values for the main and side lobes inpulse spectrum measurement using a signalgenerator. It should be noted, however, that
Fig.13 Comparison of radiation character-istics between rotating and non-rotating antennas

67SEBATA Kouichi et al.
Fig.14 Pulse amplitude modulated spec-trum
Fig.15 Spectrum waveform displayed onthe spectrum analyzer
Fig.16 Difference between main lobe m1and side lobe m2 with 100 kHzRBW (17.9 dB)
Fig.17 Difference between main lobe m1and side lobe m2 with 1.5 MHzRBW (23.2 dB)
Fig.18 Different measured values produced by different RBW settings with Gaussian filter
68 Journal of the National Institute of Information and Communications Technology Vol.53 No.1 2006
these results suggest that as long as the condi-tion of RBW < 1/(4τ) is fulfilled, measure-ment error can be kept constant (approx.0.5 dB or less).3.3.2.2 Measurements using actual radar
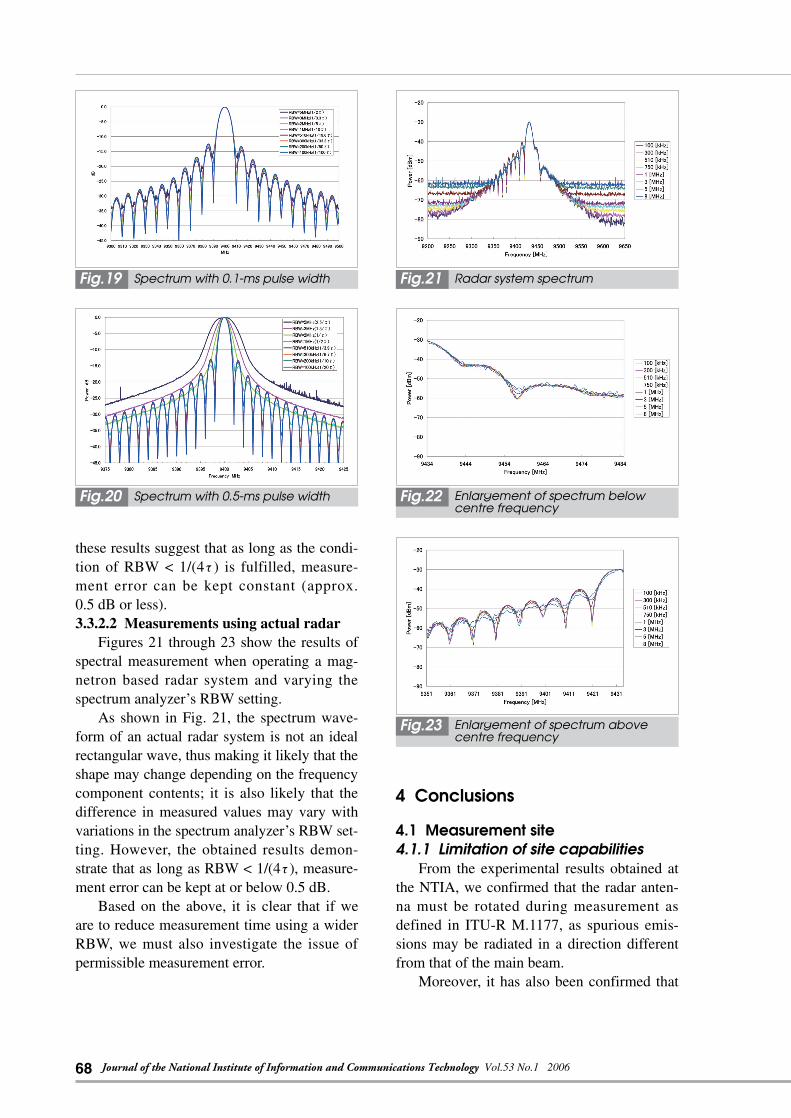
Figures 21 through 23 show the results ofspectral measurement when operating a mag-netron based radar system and varying thespectrum analyzer’s RBW setting.
As shown in Fig. 21, the spectrum wave-form of an actual radar system is not an idealrectangular wave, thus making it likely that theshape may change depending on the frequencycomponent contents; it is also likely that thedifference in measured values may vary withvariations in the spectrum analyzer’s RBW set-ting. However, the obtained results demon-strate that as long as RBW < 1/(4τ), measure-ment error can be kept at or below 0.5 dB.
Based on the above, it is clear that if weare to reduce measurement time using a widerRBW, we must also investigate the issue ofpermissible measurement error.
4 Conclusions
4.1 Measurement site4.1.1 Limitation of site capabilities
From the experimental results obtained atthe NTIA, we confirmed that the radar anten-na must be rotated during measurement asdefined in ITU-R M.1177, as spurious emis-sions may be radiated in a direction differentfrom that of the main beam.
Moreover, it has also been confirmed that
Fig.19 Spectrum with 0.1-ms pulse width Fig.21 Radar system spectrum
Fig.22 Enlargement of spectrum belowcentre frequency
Fig.23 Enlargement of spectrum abovecentre frequency
Fig.20 Spectrum with 0.5-ms pulse width

69SEBATA Kouichi et al.
the current NICT measurement system have anumber of problems, including those related todynamic range and measurement distancerequirements, and therefore this system pre-sents numerous challenges that must beresolved in order to ensure and achieve therequired accuracy in measurement.4.1.2 Survey on potential measure-
ment sites in JapanPotential sites were evaluated for the
establishment of a standard site in Japan.Although further investigation is required—including an investigation of signal levels at-40 dB or less and spectra (spurious emis-sions) at frequencies other than the main fre-quency—our choice as the best potential siteis location C, in line with the results of theinvestigation stated above for the variousnumber of important points under considera-tion.
4.2 Measurement system4.2.1 Necessity of antenna rotation
Spurious emissions are at frequencies thatdiffer from the main frequency and may beradiated in a direction different from that ofthe antenna beam. Further, it has been con-
firmed that the antenna must be rotated toachieve correct measurement value in alldirections4.2.2 RBW study results
Based on the simulation and measurementresults, we conclude that the relationshipbetween the main and side lobe frequencybands obtained with a spectrum analyzer isrepresented by twice 1/τ for the fundamentalwave bandwidth and 1/τ for the side lobebandwidth. This means that increasing theRBW will results in reception of the signal inthe adjacent lobe (i.e., the signal is in theopposite phase). As a result, significant errormay be expected to occur depending on theRBW used when comparing the main and sidelobes in terms of level difference. To eliminatethis error, an RBW value of 1/(4τ) or less isrequired.
However, using 1/(4τ) RBW requires aneven longer measurement time than at present.
In the future, we plan to survey measure-ment sites in Japan that will allow for far-fieldmeasurement and study techniques for estab-lishing measurement methods for spuriousradar emissions, taking RBW and permissiblemeasurement error into consideration.
References01 ITU-R Radio Regulations Appendix3 (Tables of maximum permitted power levels for spurious or spuri-
ous domain emissions), 2004.
02 Recommendation ITU-R M.1177-3 (Techniques for measurement of unwanted emissions of radar sys-
tems).
03 Recommendation ITU-R SM.329-10 (Unwanted emissions in the spurious domain).
04 Measurement of unwanted emissions of radar systems by ITU-R Method IEICE Technical Report
EMCJ2005-94, MW2005-100.(in Japanese)
05 Measurement of unwanted emissions of radar systems by ITU-R Method IEICE GEN. Conf. ’05 No.SB2-
1,pp.20-21,Mar.2005. (in Japanese)

70 Journal of the National Institute of Information and Communications Technology Vol.53 No.1 2006
SEBATA Kouichi
Senior Researcher, EMC MeasurementGroup, Wireless CommunicationsDepartment
EMC Measurement
KITAZAWA Hironori
Technical Expert, EMC MeasurementGroup, Wireless CommunicationsDepartment
EMC Measurement
MIYAZAWA Yoshiyuki
Chief, EMC Measurement Group,Wireless Communications Department
EMC Measurement
SHIOTA Sadaaki
Technical Expert, EMC MeasurementGroup, Wireless CommunicationsDepartment
EMC Measurement