2q 15 activity and results banco santander
TRANSCRIPT

1
30 July 2015
2 Important information Banco Santander, S.A. ("Santander") cautions that this presentation contains forward-looking statements. These forward-looking statements are found in various places throughout this presentation and include, without limitation, statements concerning our future business development and economic performance. While these forward-looking statements represent our judgment and future expectations concerning the development of our business, a number of risks, uncertainties and other important factors could cause actual developments and results to differ materially from our expectations. These factors include, but are not limited to: (1) general market, macro-economic, governmental and regulatory trends; (2) movements in local and international securities markets, currency exchange rates and interest rates; (3) competitive pressures; (4) technological developments; and (5) changes in the financial position or credit worthiness of our customers, obligors and counterparties. The risk factors that we have indicated in our past and future filings and reports, including those with the Securities and Exchange Commission of the United States of America (the “SEC”) could adversely affect our business and financial performance. Other unknown or unpredictable factors could cause actual results to differ materially from those in the forward-looking statements.
Forward-looking statements speak only as of the date on which they are made and are based on the knowledge, information available and views taken on the date on which they are made; such knowledge, information and views may change at any time. Santander does not undertake any obligation to update or revise any forward-looking statement, whether as a result of new information, future events or otherwise.
The information contained in this presentation is subject to, and must be read in conjunction with, all other publicly available information, including, where relevant any fuller disclosure document published by Santander. Any person at any time acquiring securities must do so only on the basis of such person's own judgment as to the merits or the suitability of the securities for its purpose and only on such information as is contained in such public information having taken all such professional or other advice as it considers necessary or appropriate in the circumstances and not in reliance on the information contained in the presentation. In making this presentation available, Santander gives no advice and makes no recommendation to buy, sell or otherwise deal in shares in Santander or in any other securities or investments whatsoever.
Neither this presentation nor any of the information contained therein constitutes an offer to sell or the solicitation of an offer to buy any securities. No offering of securities shall be made in the United States except pursuant to registration under the U.S. Securities Act of 1933, as amended, or an exemption therefrom. Nothing contained in this presentation is intended to constitute an invitation or inducement to engage in investment activity for the purposes of the prohibition on financial promotion in the U.K. Financial Services and Markets Act 2000.
Note: Statements as to historical performance or financial accretion are not intended to mean that future performance, share price or future earnings (including earnings per share) for any period will necessarily match or exceed those of any prior year. Nothing in this presentation should be construed as a profit forecast.
The businesses included in each of our geographic segments and the accounting principles under which their results are presented here may differ from the included businesses and local applicable accounting principles of our public subsidiaries in such geographies. Accordingly, the results of operations and trends shown for our geographic segments my differ materially from those of such subsidiaries.

3
Agenda
■ Group performance 1H'15
■ Business areas performance 1H'15
■ Conclusions
■ Appendix
4
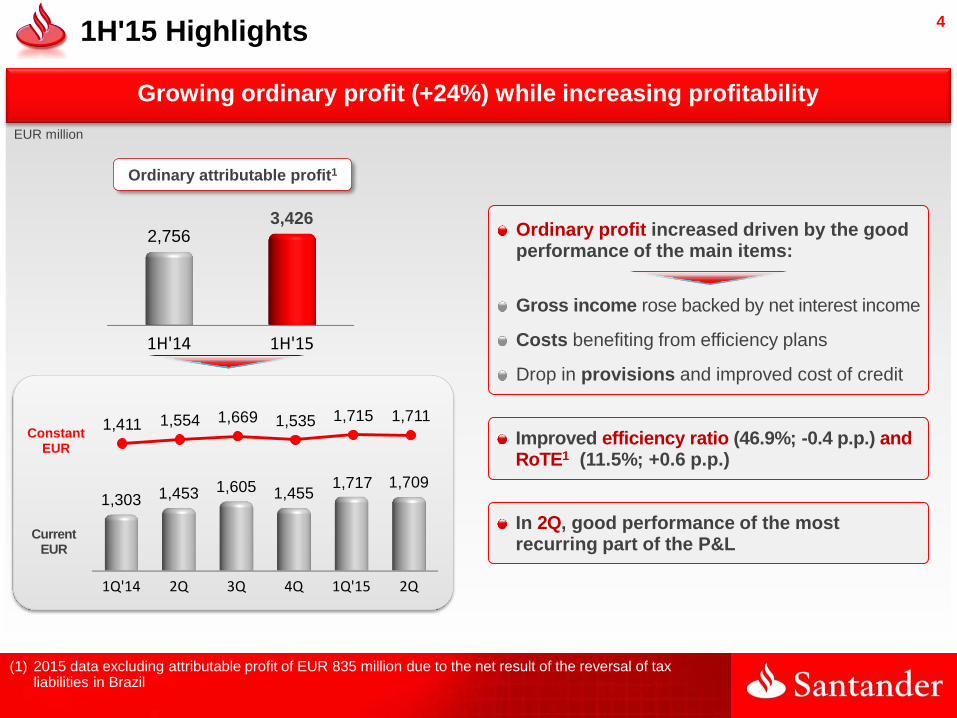
Growing ordinary profit (+24%) while increasing profitability
Ordinary attributable profit1
In 2Q, good performance of the most recurring part of the P&L
EUR million
1H'15 Highlights
(1) 2015 data excluding attributable profit of EUR 835 million due to the net result of the reversal of tax liabilities in Brazil
1Q'14 2Q 3Q 4Q 1Q'15 2Q
1,303 1,453 1,605 1,455 1,717 1,709
1H'14 1H'15
2,756 3,426
1,411 1,554 1,669 1,535 1,715 1,711 Constant
EUR
Ordinary profit increased driven by the good performance of the main items:
Gross income rose backed by net interest income
Costs benefiting from efficiency plans
Drop in provisions and improved cost of credit
Current EUR
Improved efficiency ratio (46.9%; -0.4 p.p.) and RoTE1 (11.5%; +0.6 p.p.)

5
67% 70%
Quarter-on-quarter growth Year-on-year growth
Loans Deposits +Mutual funds
+1% +1%
Loans Deposits +Mutual funds
+7% +8%
5.45% 4.64%
J'14 J'15
Volumes growth, improved credit quality and higher solvency
Increase in LENDING. Growth to individuals and companies
Growth in FUNDS consistent with lower cost of liabilities
CREDIT QUALITY indicators continued to improve
Strengthening SOLVENCY ratios
NOTE: Loans and deposits excluding repos
M'15 J'15
9.67%
9.83%
+0.4% +1% Current
EUR
Constant EUR
+12% +12%
1H'15 Highlights
NPL and coverage ratios CET1 Fully loaded
Coverage ratio
NPL ratio

6
Profit & Loss
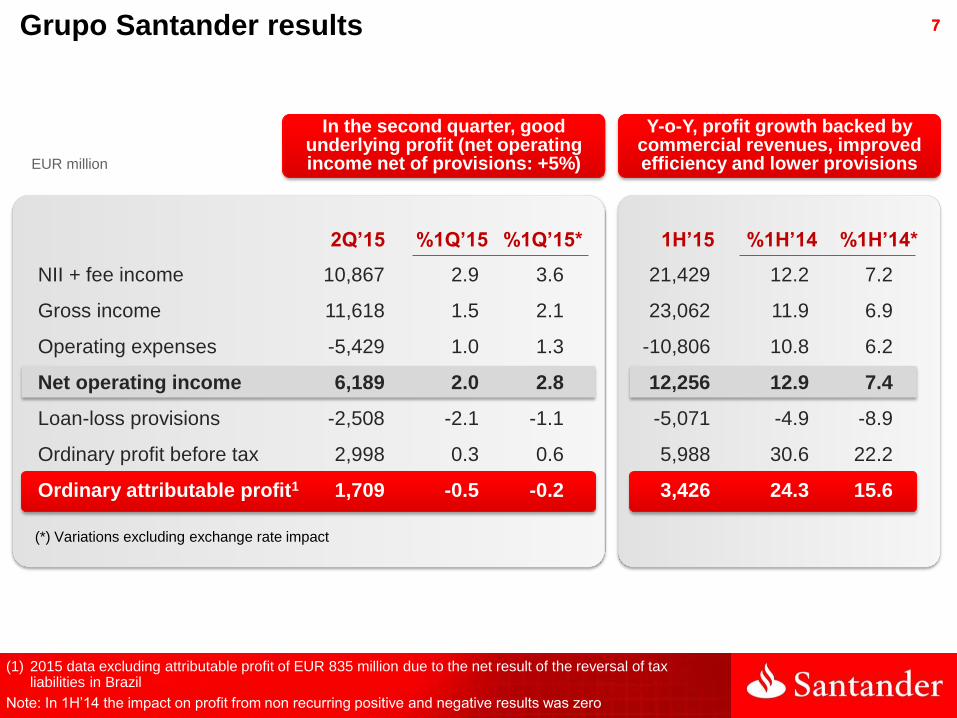
7 7 Grupo Santander results
EUR million
2Q’15 %1Q’15 %1Q’15*
(*) Variations excluding exchange rate impact
(1) 2015 data excluding attributable profit of EUR 835 million due to the net result of the reversal of tax liabilities in Brazil
Note: In 1H’14 the impact on profit from non recurring positive and negative results was zero
Y-o-Y, profit growth backed by commercial revenues, improved efficiency and lower provisions
In the second quarter, good underlying profit (net operating income net of provisions: +5%)
1H’15 %1H’14 %1H’14*
21,429 12.2 7.2
23,062 11.9 6.9
-10,806 10.8 6.2
12,256 12.9 7.4
-5,071 -4.9 -8.9
5,988 30.6 22.2
3,426 24.3 15.6
NII + fee income 10,867 2.9 3.6
Gross income 11,618 1.5 2.1
Operating expenses -5,429 1.0 1.3
Net operating income 6,189 2.0 2.8
Loan-loss provisions -2,508 -2.1 -1.1
Ordinary profit before tax 2,998 0.3 0.6
Ordinary attributable profit1 1,709 -0.5 -0.2
8
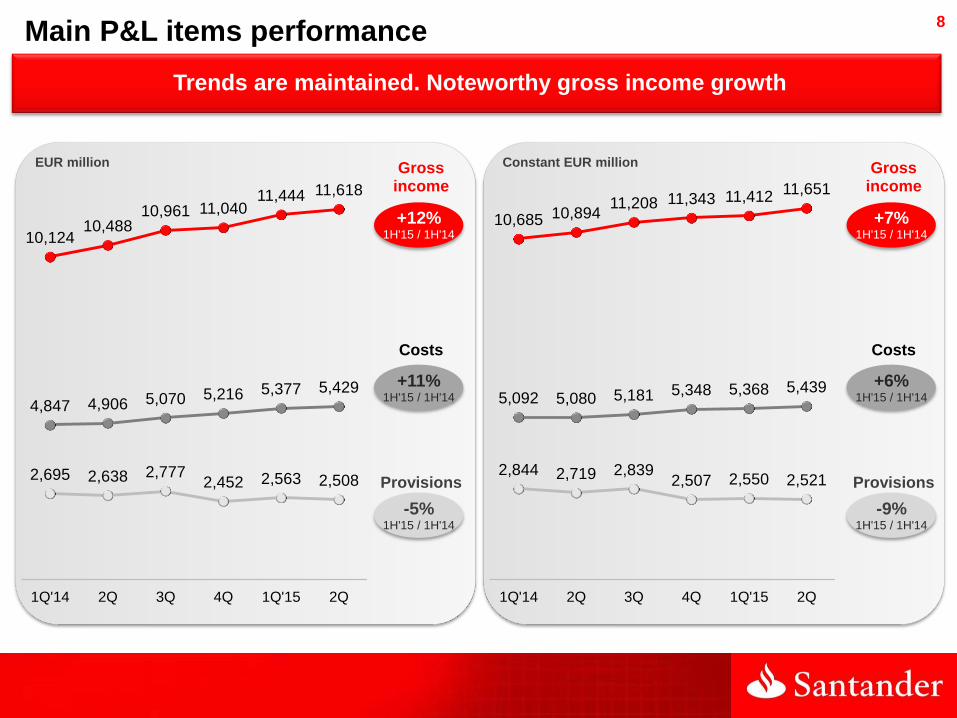
Trends are maintained. Noteworthy gross income growth
10,685 10,894 11,208 11,343 11,412
11,651
5,092 5,080 5,181 5,348 5,368 5,439
2,844 2,719 2,839 2,507 2,550 2,521
1Q'14 2Q 3Q 4Q 1Q'15 2Q
Gross income
+7% 1H'15 / 1H'14
Costs
+6% 1H'15 / 1H'14
Provisions
-9% 1H'15 / 1H'14
Gross income
+12% 1H'15 / 1H'14
Costs
+11% 1H'15 / 1H'14
Provisions
-5% 1H'15 / 1H'14
10,124 10,488
10,961 11,040 11,444 11,618
4,847 4,906 5,070 5,216 5,377 5,429
2,695 2,638 2,777 2,452 2,563 2,508
1Q'14 2Q 3Q 4Q 1Q'15 2Q
EUR million Constant EUR million
Main P&L items performance

9
792 539
968 637 697
370
1Q'14 2Q 3Q 4Q 1Q'15 2Q
2,427 2,462 2,465 2,566 2,513 2,597
7,427 7,683 7,668
7,950 8,015 8,304
Gross income - Group
Constant EUR million
Fee income
Net interest income
Trading gains
Up due to higher volumes and lower funding cost
Lending spreads impacted by change of mix and tougher competition
Sustained increase in gross income, underpinned by net interest income
Impacted by environment and regulation
Q-o-Q increase due to corporate banking
Low structural weight in gross income
Drop due to lower revenues from hedging portfolios and higher dividends collection
GROSS INCOME. Quarterly performance

10
, Gross income rose in most countries (8 out of 10) driven by
net interest income and fee income
(*) "Other" includes income from equity accounted method, dividends and other operating results
Total gross income
EUR million and % change in constant EUR
1H'15 / 1H'14 (%)
+9
+12
-2
+5
+22
+7
+0.2
+24
-2
+1
GROSS INCOME. 1H'15 / 1H'14 performance and detail by country
Brazil
USA
Spain
UK
SCF
Mexico
Chile
Argentina
Poland
Portugal
6,066
3,676
3,516
3,177
1,988
1,702
1,188
756
676
472
Business: +7%
20,611
23,062
+968
+1,209 +221 +53
+5%
+8%
+3%
Fee income
Net int. income
Trading gains and Other*
1H'14 Gross
income
FX 1H'15 Gross
income
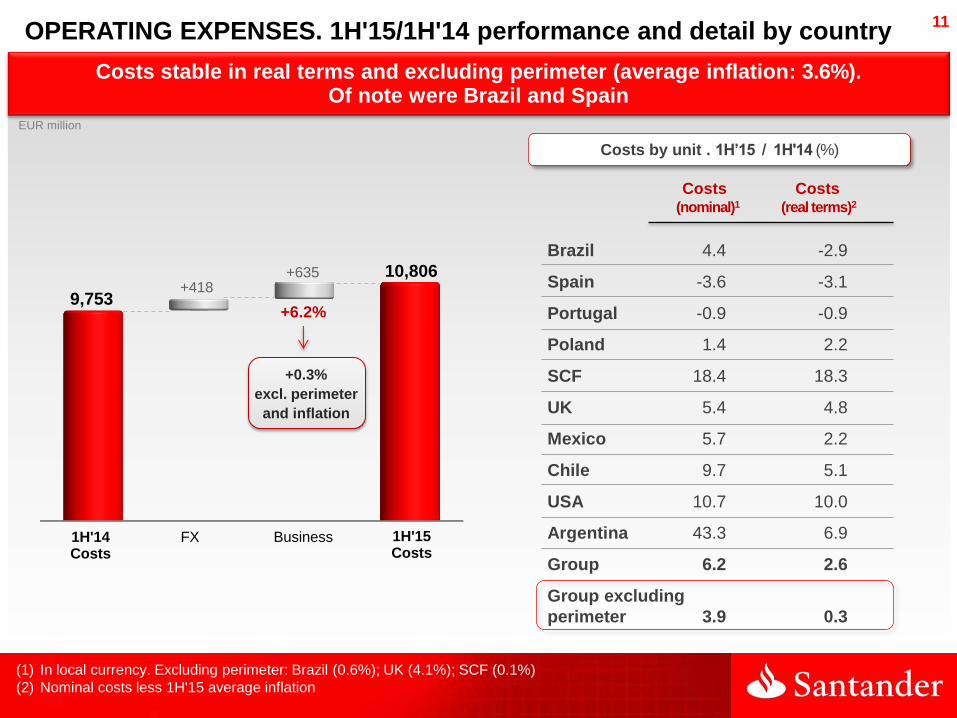
11
Costs stable in real terms and excluding perimeter (average inflation: 3.6%). Of note were Brazil and Spain
9,753
10,806 +418
+635
+0.3%
excl. perimeter
and inflation
+6.2%
Costs by unit . 1H’15 / 1H'14 (%)
EUR million
(1) In local currency. Excluding perimeter: Brazil (0.6%); UK (4.1%); SCF (0.1%)
(2) Nominal costs less 1H'15 average inflation
Costs Costs
(nominal)1 (real terms)2
Brazil 4.4 -2.9
Spain -3.6 -3.1
Portugal -0.9 -0.9
Poland 1.4 2.2
SCF 18.4 18.3
UK 5.4 4.8
Mexico 5.7 2.2
Chile 9.7 5.1
USA 10.7 10.0
Argentina 43.3 6.9
Group 6.2 2.6
Group excluding
perimeter 3.9 0.3
OPERATING EXPENSES. 1H'15/1H'14 performance and detail by country
Business 1H'14 Costs
FX 1H'15 Costs
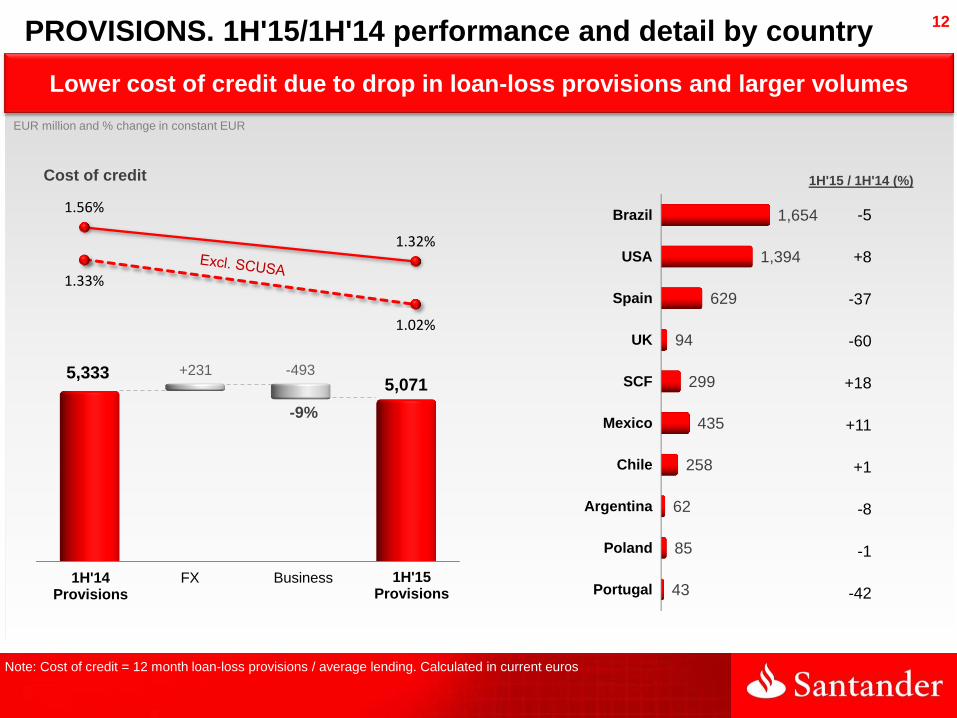
12
Brazil
USA
Spain
UK
SCF
Mexico
Chile
Argentina
Poland
Portugal
1,654
1,394
629
94
299
435
258
62
85
43
Lower cost of credit due to drop in loan-loss provisions and larger volumes
EUR million and % change in constant EUR
Note: Cost of credit = 12 month loan-loss provisions / average lending. Calculated in current euros
1H'15 / 1H'14 (%)
-5
+8
-37
-60
+18
+11
+1
-8
-1
-42
1.56%
1.32%
1.33%
1.02%
5,333 5,071
+231 -493
-9%
PROVISIONS. 1H'15/1H'14 performance and detail by country
Cost of credit
Business 1H'14 Provisions
FX 1H'15 Provisions

13
Balance sheet
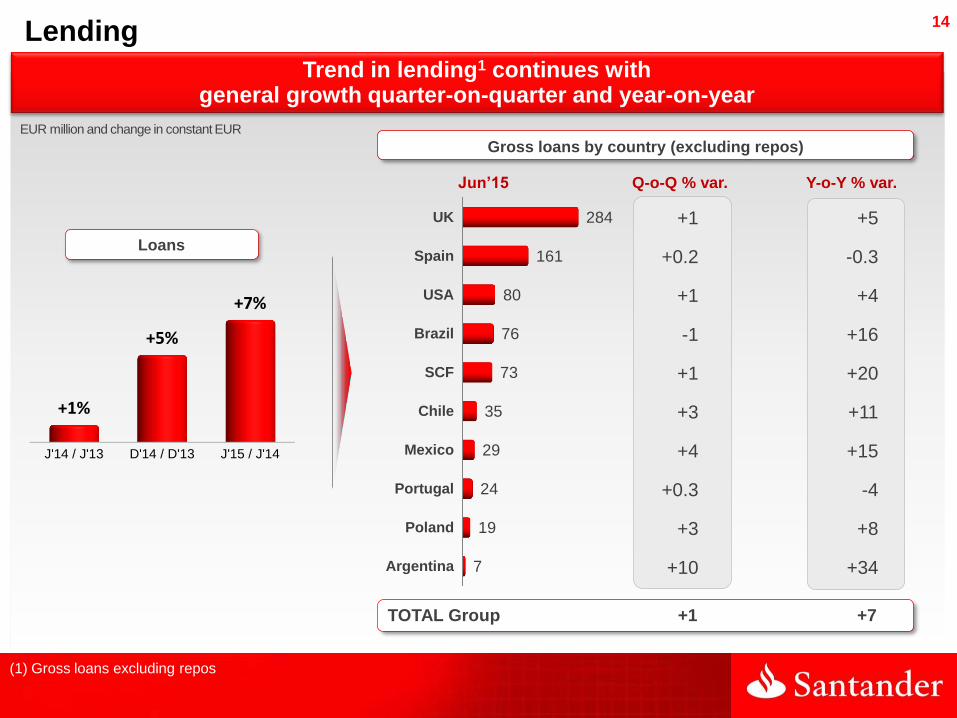
14
Trend in lending1 continues with general growth quarter-on-quarter and year-on-year
UK
Spain
USA
Brazil
SCF
Chile
Mexico
Portugal
Poland
Argentina
284
161
80
76
73
35
29
24
19
7
+1
+0.2
+1
-1
+1
+3
+4
+0.3
+3
+10
Gross loans by country (excluding repos)
Jun’15 Q-o-Q % var. Y-o-Y % var.
TOTAL Group +1 +7
+5
-0.3
+4
+16
+20
+11
+15
-4
+8
+34
(1) Gross loans excluding repos
Loans
J'14 / J'13 D'14 / D'13 J'15 / J'14
+1%
+5%
+7%
EUR million and change in constant EUR
Lending

15
Customer funds1 also registered quarter-on-quarter and year-on-year growth, with all units growing in 12 months
Deposits (excl. repos) + Mutual funds by country
(1) Deposits (excluding repos) + managed and marketed mutual funds
Jun’15
J'14 / J'13 D'14 / D'13 J'15 / J'14
+2%
+6%
+8%
EUR million and change in constant EUR
Deposits + Mutual funds
Deposits + Mutual funds
UK
Spain
Brazil
USA
Mexico
SCF
Chile
Portugal
Poland
Argentina
233
227
89
57
38
32
30
25
24
9
+2
-1
+3
-1
+3
+3
-2
+1
+1
+10
TOTAL Group +1 +8
+4
+6
+13
+16
+12
+3
+15
+6
+10
+48
Q-o-Q % var. Y-o-Y % var.
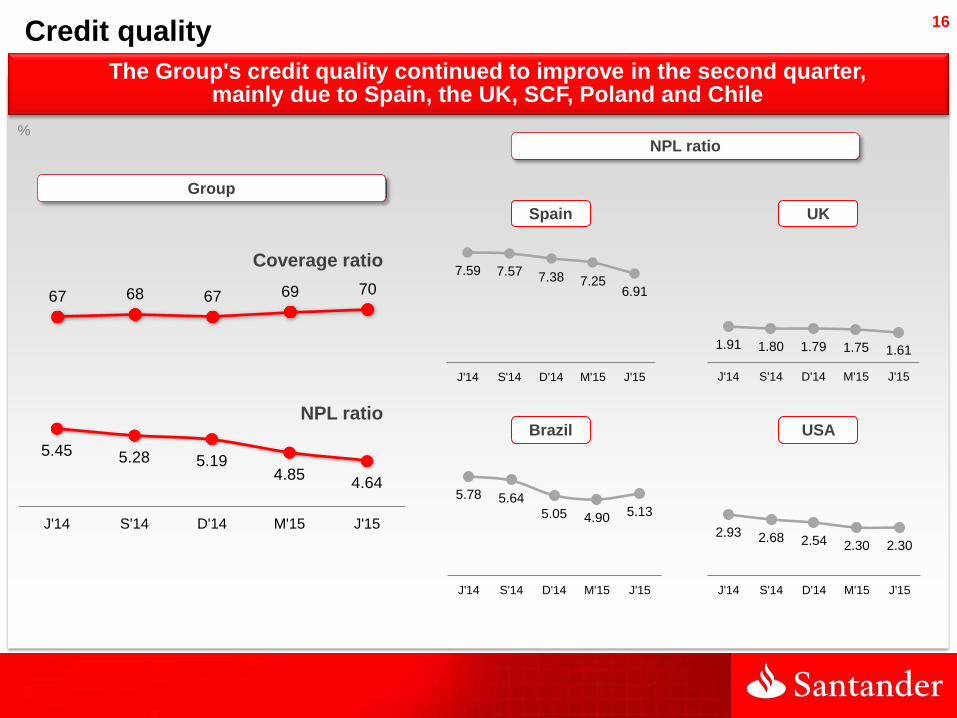
16 Credit quality
The Group's credit quality continued to improve in the second quarter, mainly due to Spain, the UK, SCF, Poland and Chile
5.45 5.28 5.19 4.85
4.64
J'14 S'14 D'14 M'15 J'15
67 68 67 69 70
2.93 2.68 2.54 2.30 2.30
J'14 S'14 D'14 M'15 J'15
1.91 1.80 1.79 1.75 1.61
J'14 S'14 D'14 M'15 J'15
5.78 5.64
5.05 4.90 5.13
J'14 S'14 D'14 M'15 J'15
7.59 7.57 7.38 7.25 6.91
J'14 S'14 D'14 M'15 J'15
% NPL ratio
NPL ratio
Coverage ratio
Group
Brazil
Spain
USA
UK
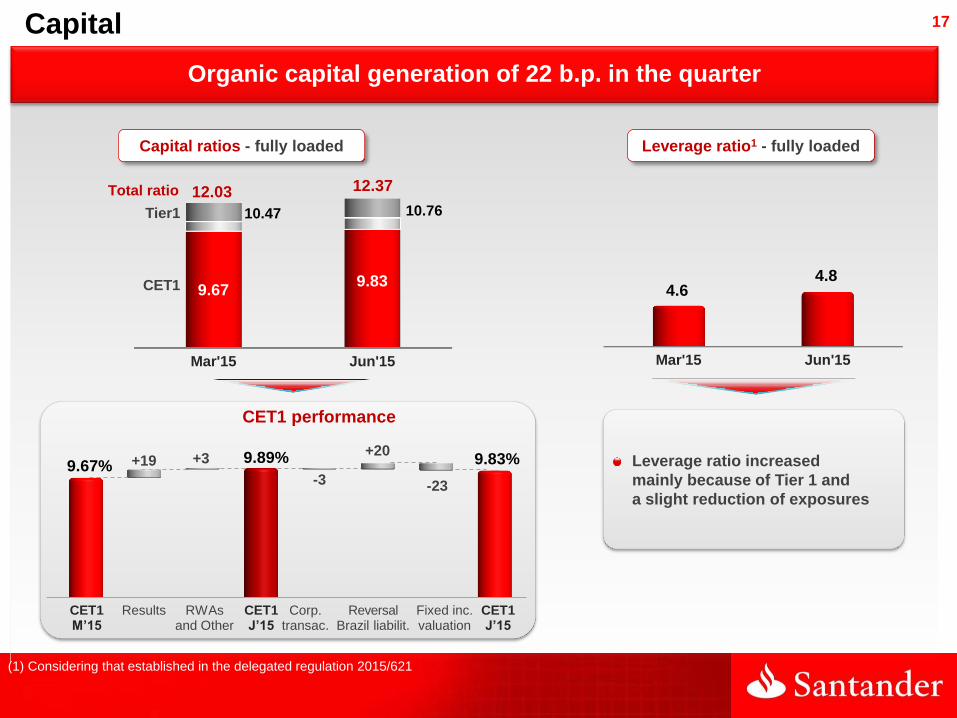
17
Organic capital generation of 22 b.p. in the quarter
Capital
(1) Considering that established in the delegated regulation 2015/621
9.67% 9.89% 9.83% +19 +3
-3
+20
-23
Leverage ratio increased
mainly because of Tier 1 and
a slight reduction of exposures
Total ratio
CET1
Tier1
Capital ratios - fully loaded Leverage ratio1 - fully loaded
CET1 performance
CET1 J’15
CET1 M’15
Results RWAs and Other
Corp. transac.
Reversal Brazil liabilit.
Fixed inc. valuation
CET1 J’15
Mar'15 Jun'15
4.6 4.8
Mar'15 Jun'15
9.67 9.83
10.47 10.76
12.03 12.37
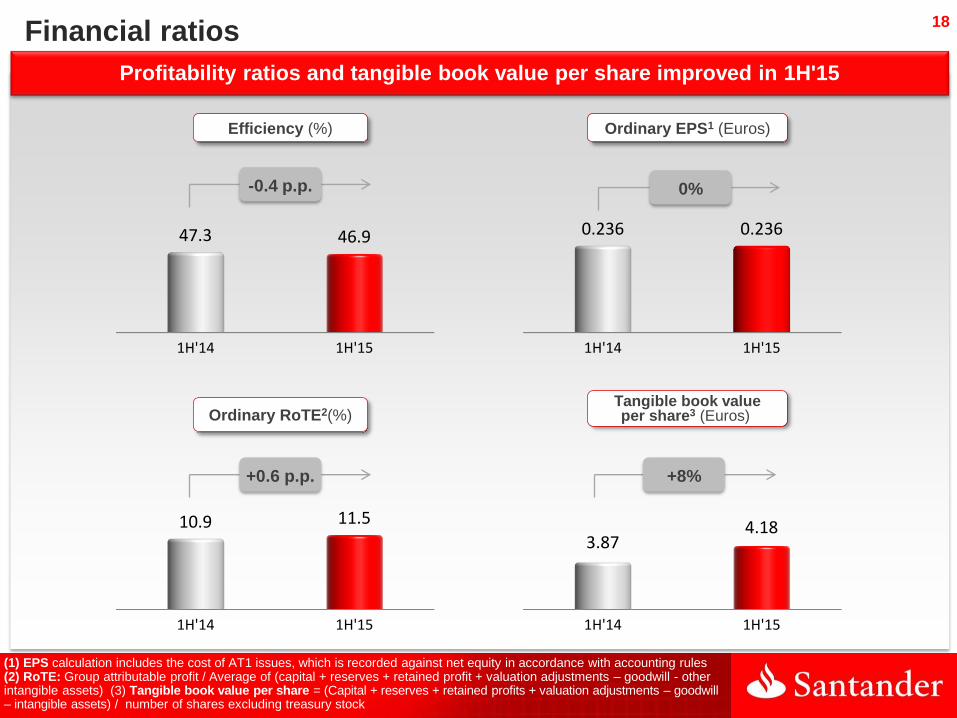
18
1H'14 1H'15
10.9 11.5
Profitability ratios and tangible book value per share improved in 1H'15
Ordinary RoTE2(%)
1H'14 1H'15
0.236 0.236
Ordinary EPS1 (Euros)
1H'14 1H'15
47.3 46.9
Efficiency (%)
0%
+0.6 p.p.
-0.4 p.p.
Financial ratios
1H'14 1H'15
3.87 4.18
+8%
Tangible book value per share3 (Euros)
(1) EPS calculation includes the cost of AT1 issues, which is recorded against net equity in accordance with accounting rules (2) RoTE: Group attributable profit / Average of (capital + reserves + retained profit + valuation adjustments – goodwill - other intangible assets) (3) Tangible book value per share = (Capital + reserves + retained profits + valuation adjustments – goodwill – intangible assets) / number of shares excluding treasury stock
19
Agenda
■ Group performance 1H'15
■ Business areas performance 1H'15
■ Conclusions
■ Appendix
20
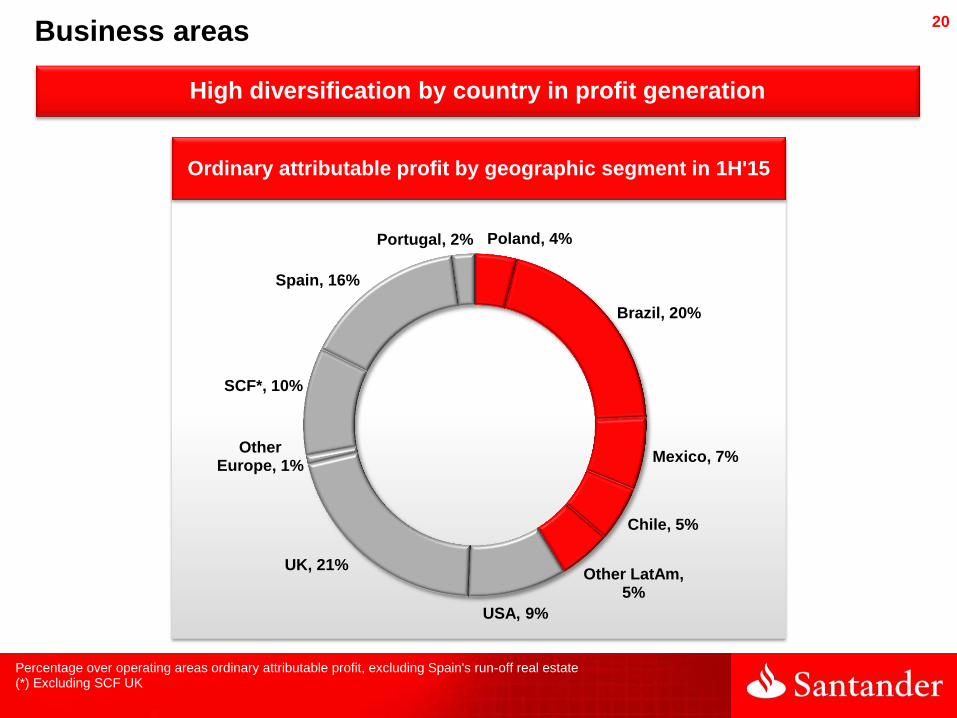
High diversification by country in profit generation
Ordinary attributable profit by geographic segment in 1H'15
Poland, 4%
Brazil, 20%
Mexico, 7%
Chile, 5%
Other LatAm, 5%
USA, 9%
UK, 21%
Other Europe, 1%
SCF*, 10%
Spain, 16%
Portugal, 2%
Business areas
Percentage over operating areas ordinary attributable profit, excluding Spain's run-off real estate (*) Excluding SCF UK
21
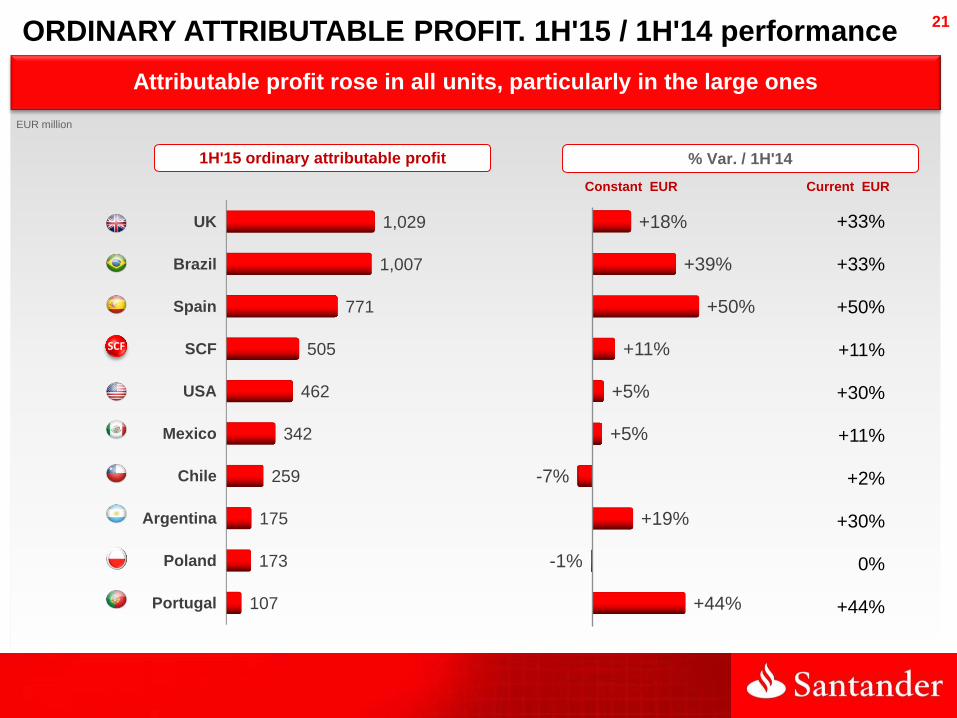
Attributable profit rose in all units, particularly in the large ones
UK
Brazil
Spain
SCF
USA
Mexico
Chile
Argentina
Poland
Portugal
1,029
1,007
771
505
462
342
259
175
173
107
1H'15 ordinary attributable profit
EUR million
+18%
+39%
+50%
+11%
+5%
+5%
-7%
+19%
-1%
+44%
% Var. / 1H'14
+33%
+33%
+50%
+11%
+30%
+11%
+2%
+30%
0%
+44%
SCF
ORDINARY ATTRIBUTABLE PROFIT. 1H'15 / 1H'14 performance
Current EUR Constant EUR

22
2.97% 2.87% 2.80% 2.66% 2.50%
1.07% 0.98% 0.86% 0.64% 0.57%
2Q'14 3Q 4Q 1Q'15 2Q
Spain
Activity
Var. J'15 / J'14
Volumes1
EUR million
P&L
(1) Loans excluding repos. Funds: deposits (excluding repos) + marketed mutual funds
Loans Funds
-0.3%
+6%
+0,2% / 1Q'15
-1% / 1Q'15
New strategy to attract / engage customers with the 1l2l3 account
Stable lending in a still deleveraging environment
In gross income, net interest income under pressure due to low interest rates and sharp competition on the assets side
Profit improved driven by lower provisions and operating expenses (efficiency plan)
Customer NIM
2Q’15 %1Q’15 1H’15 %1H’14
NII + fee income 1,577 -0.8 3,167 -3.0
Gross income 1,751 -0.7 3,516 -1.6
Operating expenses -852 0.0 -1,704 -3.6
Net op. income 899 -1.4 1,812 0.3
LLPs -261 -28.9 -629 -36.8
Attributable profit 413 15.6 771 50.3
Cost of deposits
Profitability of loans

23
J'14 J'15
85 87
12 13
50 46
15 15
162 161
1.31 1.21 1.06 0.97 0.84
J'14 S'14 D'14 M'15 J'15
3 3
Lower NPLs due to negative net entries in 1H'15
NPL ratio improved in recent quarters
5 3
Growth in volumes combined with drop in NPL ratio and improved cost of credit
Increased customer funds focusing on profitability
Demand deposits up 20% and mutual funds 17%. Time deposits down 19%
J'14 J'15
101 121
75 61
39 45
215 227
New lending: individuals (+33%) and companies1 (+17%)
New mortgage loans: +29%
(1) Excluding commercial bills
7.59 7.57 7.38 7.25 6.91
Spain
NPL and Cost of credit (%) Loans (EUR billion) Customer funds (EUR billion)
Repos
Public Institutions
Companies
Other loans to individuals
Household mortgages
Repos
Demand deposits
Time deposits
Mutual funds
Cost of credit
NPL Ratio
24
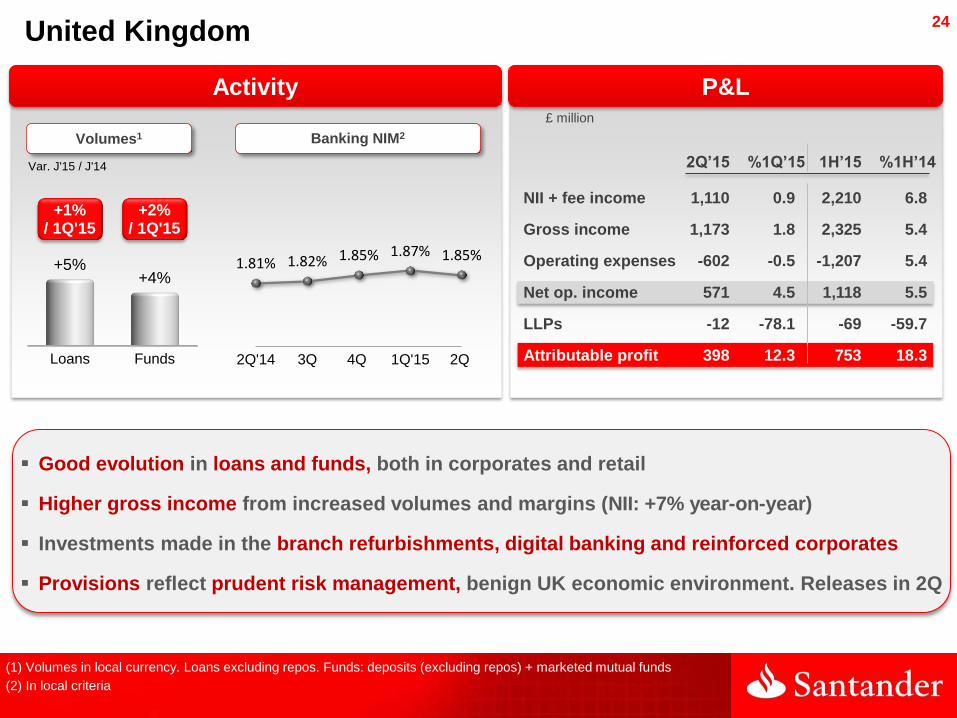
United Kingdom
Good evolution in loans and funds, both in corporates and retail
Higher gross income from increased volumes and margins (NII: +7% year-on-year)
Investments made in the branch refurbishments, digital banking and reinforced corporates
Provisions reflect prudent risk management, benign UK economic environment. Releases in 2Q
Var. J'15 / J'14
Volumes1 Banking NIM2
1.81% 1.82% 1.85% 1.87% 1.85%
2Q'14 3Q 4Q 1Q'15 2Q
Activity
(1) Volumes in local currency. Loans excluding repos. Funds: deposits (excluding repos) + marketed mutual funds
(2) In local criteria
£ million
P&L
Loans Funds
+5% +4%
+1% / 1Q'15
+2% / 1Q'15
2Q’15 %1Q’15 1H’15 %1H’14
NII + fee income 1,110 0.9 2,210 6.8
Gross income 1,173 1.8 2,325 5.4
Operating expenses -602 -0.5 -1,207 5.4
Net op. income 571 4.5 1,118 5.5
LLPs -12 -78.1 -69 -59.7
Attributable profit 398 12.3 753 18.3
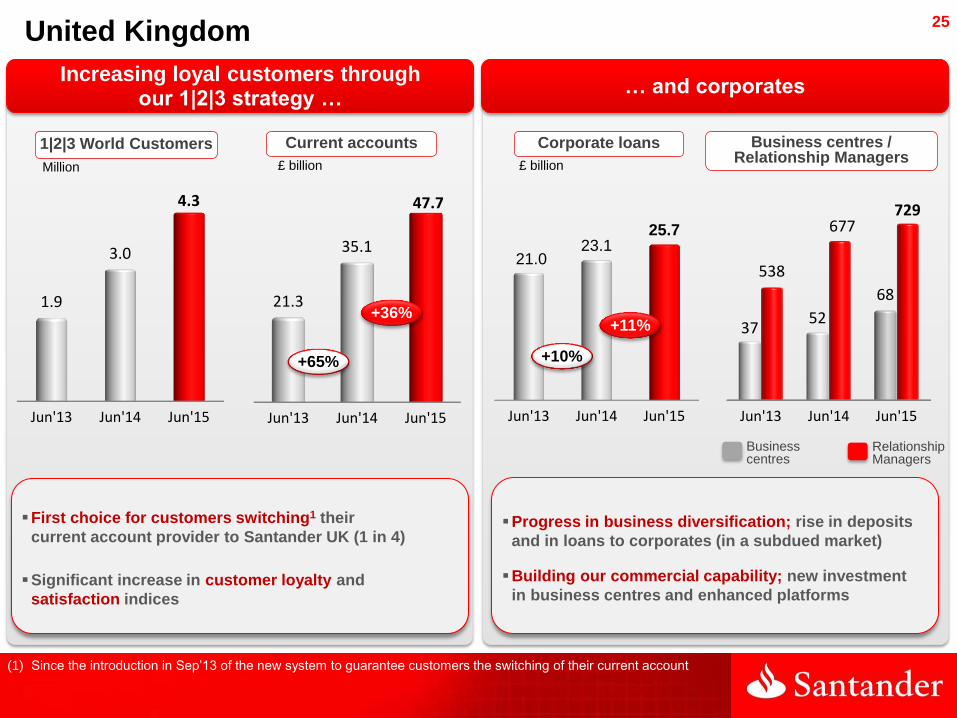
25 United Kingdom
Increasing loyal customers through our 1|2|3 strategy …
… and corporates
(1) Since the introduction in Sep’13 of the new system to guarantee customers the switching of their current account
Jun'13 Jun'14 Jun'15
21.3
35.1
47.7
+36%
Jun'13 Jun'14 Jun'15
21.0 23.1
25.7
+11%
+10% +65%
Jun'13 Jun'14 Jun'15
1.9
3.0
4.3
Jun'13 Jun'14 Jun'15
37 52
68
538
677 729
£ billion
Current accounts
Million
1|2|3 World Customers Business centres / Relationship Managers
Corporate loans
£ billion
Business centres
Relationship Managers
First choice for customers switching1 their
current account provider to Santander UK (1 in 4)
Significant increase in customer loyalty and
satisfaction indices
Progress in business diversification; rise in deposits
and in loans to corporates (in a subdued market)
Building our commercial capability; new investment
in business centres and enhanced platforms
26
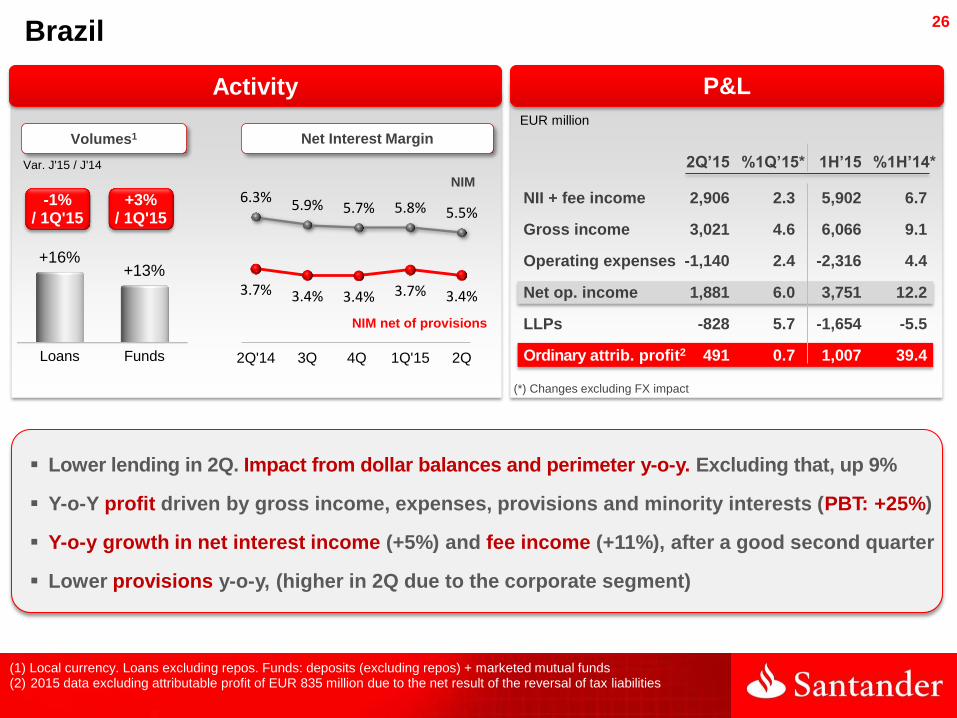
Loans Funds
+16% +13%
Brazil
Var. J'15 / J'14
Volumes1
Activity
Net Interest Margin
-1% / 1Q'15
+3% / 1Q'15
(1) Local currency. Loans excluding repos. Funds: deposits (excluding repos) + marketed mutual funds (2) 2015 data excluding attributable profit of EUR 835 million due to the net result of the reversal of tax liabilities
6.3% 5.9% 5.7% 5.8% 5.5%
3.7% 3.4% 3.4% 3.7% 3.4%
2Q'14 3Q 4Q 1Q'15 2Q
EUR million
P&L
(*) Changes excluding FX impact
Lower lending in 2Q. Impact from dollar balances and perimeter y-o-y. Excluding that, up 9%
Y-o-Y profit driven by gross income, expenses, provisions and minority interests (PBT: +25%)
Y-o-y growth in net interest income (+5%) and fee income (+11%), after a good second quarter
Lower provisions y-o-y, (higher in 2Q due to the corporate segment)
2Q’15 %1Q’15* 1H’15 %1H’14*
NII + fee income 2,906 2.3 5,902 6.7
Gross income 3,021 4.6 6,066 9.1
Operating expenses -1,140 2.4 -2,316 4.4
Net op. income 1,881 6.0 3,751 12.2
LLPs -828 5.7 -1,654 -5.5
Ordinary attrib. profit2 491 0.7 1,007 39.4
NIM net of provisions
NIM

27
Brazil Growth in loans with change of mix
and a lower risk profile …
EUR million and change in constant EUR
… reflecting on an NPL ratio performing better than the sector's
Total Individual customers
Companies
(1) Loans: local criteria figures exclude branches abroad
Loan spread and Cost of credit
Jun’15 /Jun’14 /Mar’15
Mortgage loans to individuals 7 34% 6%
Consumer loans to individuals 16 -1% 1%
Consumer finance 8 -5% -2%
SMEs 11 6% 0%
Companies 13 23% -1%
Large companies 20 38% -6%
Total 76 16% -1%
SANBrazil
System SANBrazil
System SANBrazil
System
+13% +10%
+4%
+11%
+22%
+9%
Loans by segment Loans – May’15 / May’14 change
Local criteria (1)
Cost of credit
Loan spread
4.0%
3.9% 3.7%
3.9% 4.0% 4.1%
3.7% 3.3%
3.0% 3.2%
2Q'14 3Q 4Q 1Q'15 May'15
NPL ratio – Over 90 days
Santander
National private banks
9.0% 8.4% 8.0% 7.8% 7.9%
5.4% 5.1% 4.9% 4.6% 4.4%
2Q'14 3Q 4Q 1Q'15 2Q
28
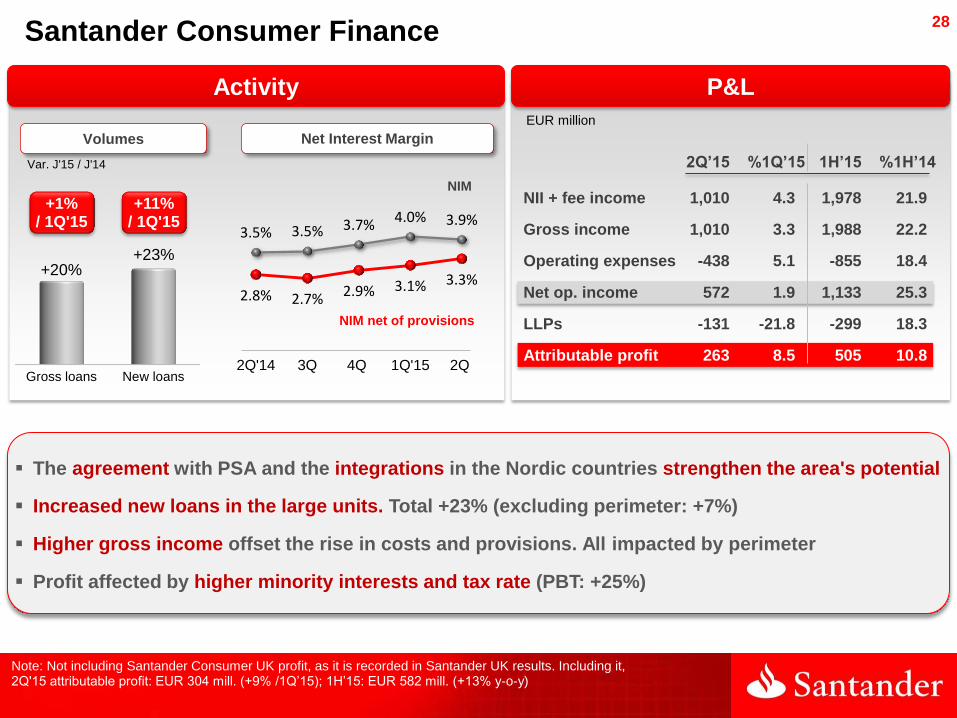
Activity
Santander Consumer Finance
Volumes
Gross loans New loans
+20% +23%
EUR million
P&L
Var. J'15 / J'14
+1% / 1Q'15
+11% / 1Q'15
Net Interest Margin
The agreement with PSA and the integrations in the Nordic countries strengthen the area's potential
Increased new loans in the large units. Total +23% (excluding perimeter: +7%)
Higher gross income offset the rise in costs and provisions. All impacted by perimeter
Profit affected by higher minority interests and tax rate (PBT: +25%)
3.5% 3.5% 3.7% 4.0% 3.9%
2.8% 2.7% 2.9% 3.1% 3.3%
2Q'14 3Q 4Q 1Q'15 2Q
Note: Not including Santander Consumer UK profit, as it is recorded in Santander UK results. Including it, 2Q'15 attributable profit: EUR 304 mill. (+9% /1Q’15); 1H’15: EUR 582 mill. (+13% y-o-y)
2Q’15 %1Q’15 1H’15 %1H’14
NII + fee income 1,010 4.3 1,978 21.9
Gross income 1,010 3.3 1,988 22.2
Operating expenses -438 5.1 -855 18.4
Net op. income 572 1.9 1,133 25.3
LLPs -131 -21.8 -299 18.3
Attributable profit 263 8.5 505 10.8
NIM net of provisions
NIM

29
Activity
United States
Var. J'15 / J'14
Santander Bank1 SCUSA
Var. J'15 / J'14
(1) Local currency. Loans excluding repos. Funds: deposits (excluding repos) + marketed mutual funds.
(2) Excluding sale of portfolios and securitisations: +7% y-o-y.
+1% / 1Q'15
+1% / 1Q'15
+6% / 1Q'15
US$ million
P&L
2
+1% / 1Q'15
Santander Bank: selective growth. SCUSA: strong growth in new loans and servicing
Higher revenues driven by greater commercial activity in SCUSA. S. Bank affected by low interest rates
Rise in operating expenses (regulatory compliance and franchise) in line with expected plan
Higher LLPs due to SCUSA (retained portfolio and seasonality) which accounts for 93% of the US total
2Q’15 %1Q’15 1H’15 %1H’14
NII + fee income 1,916 3.8 3,762 6.7
Gross income 2,110 6.2 4,097 12.2
Operating expenses -732 3.3 -1,441 10.7
Net op. income 1,378 7.8 2,656 12.9
LLPs -834 16.0 -1,553 8.4
Attributable profit 238 -14.1 515 5.4 Loans Funds
+2%
+10%
Loans New Loans
+12%
+7%

30
P&L
EUR million
Corporate Activities
1H'15 1H’14
NII + fee income -954 -1,037
Trading gains 263 550
Operating expenses -413 -389
Provisions -294 -139
Taxes and minority interests 36 140
Attributable profit -1,326 -849
Higher net interest income due to lower cost of issues
Lower trading gains (interest and exchange rates hedging)
Higher provisions to reinforce the balance sheet
Lower recovery of taxes
31
Agenda
■ Group performance 1H'15
■ Business areas performance 1H'15
■ Conclusions
■ Appendix

32
Conclusions 1H’15
Buenas dinámicas de RESULTADOS
Buenas dinámicas de Volumes
In line to meet our targets by 2017 and become a bank that's Simple l Personal l Fair
Higher commercial revenues, costs under control and lower provisions. Ordinary profit: +24% y-o-y
Quality RESULTS
Loans increased y-o-y in 8 out of 10 core units and funds up in all of them
VOLUMES growing, although at a slower pace in the quarter
Buenas dinámicas de RESULTADOS
Buenas dinámicas de Volumes
Central focus: growing while using capital more efficiently
Comfortable in LIQUIDITY AND CAPITAL
All ratios improved in the quarter: NPL, coverage and cost of credit
RISKS quality continues to improve
Ratios improved in the first half: Efficiency, RoTE and TBV per share
Enhanced PROFITABILITY and book value per share
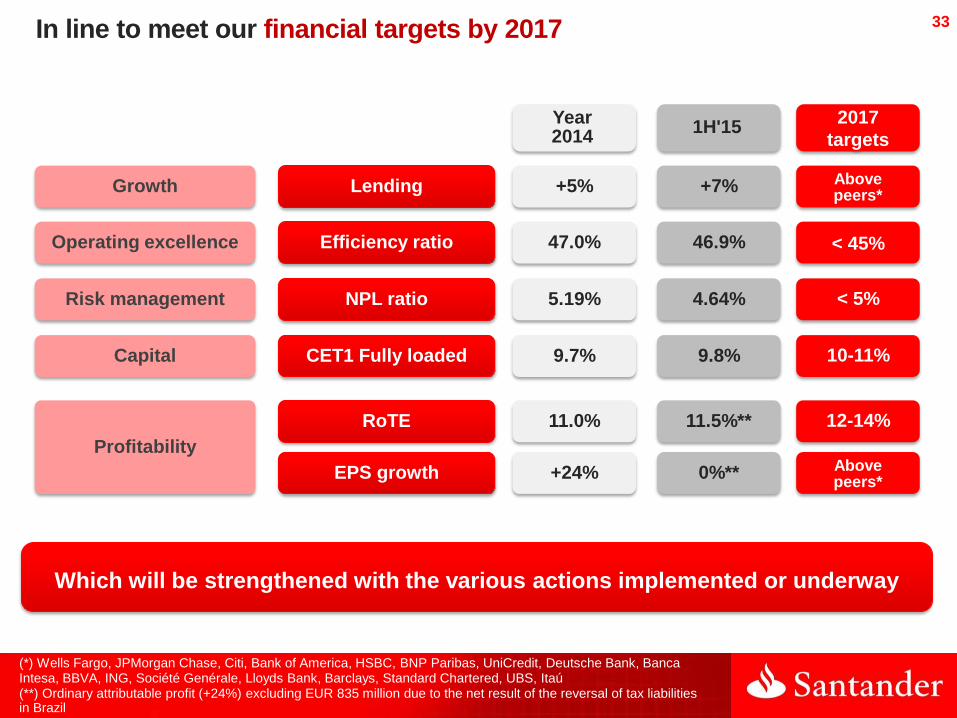
33
(*) Wells Fargo, JPMorgan Chase, Citi, Bank of America, HSBC, BNP Paribas, UniCredit, Deutsche Bank, Banca Intesa, BBVA, ING, Société Genérale, Lloyds Bank, Barclays, Standard Chartered, UBS, Itaú
Lending
Year 2014
2017
targets
+5% Above peers*
Efficiency ratio 47.0% < 45%
NPL ratio 5.19% < 5%
CET1 Fully loaded 9.7% 10-11%
RoTE 11.0% 12-14%
EPS growth +24% Above peers*
Growth
Operating excellence
Risk management
Capital
Profitability
1H'15
+7%
46.9%
4.64%
9.8%
11.5%**
0%**
(**) Ordinary attributable profit (+24%) excluding EUR 835 million due to the net result of the reversal of tax liabilities in Brazil
In line to meet our financial targets by 2017
Which will be strengthened with the various actions implemented or underway
34
Agenda
■ Group performance 1H'15
■ Business areas performance 1H'15
■ Conclusions
■ Appendix
35
Global segments results
Appendix
Group balance sheet
Liquidity and funding
NPL and coverage ratios, and cost of credit
Quarterly income statements
Other geographic units results
36
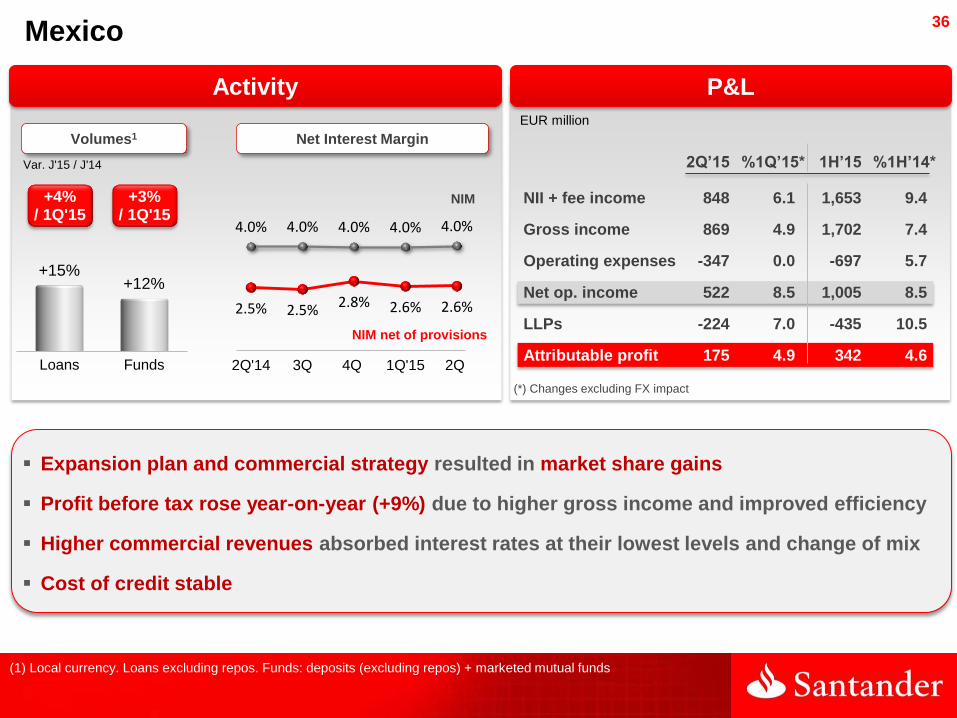
Mexico
Expansion plan and commercial strategy resulted in market share gains
Profit before tax rose year-on-year (+9%) due to higher gross income and improved efficiency
Higher commercial revenues absorbed interest rates at their lowest levels and change of mix
Cost of credit stable
Loans Funds
+15% +12%
Var. J'15 / J'14
Volumes1
Activity
+4% / 1Q'15
+3% / 1Q'15
(1) Local currency. Loans excluding repos. Funds: deposits (excluding repos) + marketed mutual funds
P&L
EUR million
Net Interest Margin
4.0% 4.0% 4.0% 4.0% 4.0%
2.5% 2.5% 2.8% 2.6% 2.6%
2Q'14 3Q 4Q 1Q'15 2Q
2Q’15 %1Q’15* 1H’15 %1H’14*
NII + fee income 848 6.1 1,653 9.4
Gross income 869 4.9 1,702 7.4
Operating expenses -347 0.0 -697 5.7
Net op. income 522 8.5 1,005 8.5
LLPs -224 7.0 -435 10.5
Attributable profit 175 4.9 342 4.6
NIM
NIM net of provisions
(*) Changes excluding FX impact

37
P&L
Chile
Selective growth: loans to companies and SMEs (+12%), high-income (+13%), demand deposits (+37%)
Gross income and profit comparisons impacted by lower UF inflation
Operating expenses rose in 2Q due to the automatic revision of the wage agreement (April) indexed to FX
Profit rose in the second quarter driven by inflation (UF) and improved cost of credit
Loans Funds
+11%
+15%
Var. J'15 / J'14
Volumes1
Activity
+3% / 1Q'15
-2% / 1Q'15
(1) Local currency. Loans excluding repos. Funds: deposits (excluding repos) + marketed mutual funds (2) Chilean Unidad de Fomento
EUR million
(*) Changes excluding FX impact
Net Interest Margin
4.7% 4.0%
4.7%
3.5% 4.1%
3.5% 2.6%
3.2% 2.3%
3.1%
2Q'14 3Q 4Q 1Q'15 2Q
1.8% 0.6% 1.9% -0.02% 1.5%
2Q’15 %1Q’15* 1H’15 %1H’14*
NII + fee income 593 19.1 1,078 -3.0
Gross income 634 11.2 1,188 0.2
Operating expenses -260 7.8 -494 9.7
Net op. income 374 13.6 694 -5.7
LLPs -126 -7.0 -258 0.7
Attributable profit 150 34.2 259 -7.1
Inflation UF2
NIM
NIM net of provisions

38
Activity
Poland
Var. J'15 / J'14
Volumes1
(1) Local currency. Loans excluding repos. Funds: deposits (excluding repos) + marketed mutual funds
Loans and funds rose, in a better economic environment and European funds
Gross income affected by lower interest rates (Lombard rate limit) and tougher regulation
Operating expenses under control, and lower LLPs with reduction of NPLs
Higher provisions in the second quarter, from a very low first quarter
Loans Funds
+8% +10%
+3% / 1Q'15
+1% / 1Q'15
P&L
EUR million
5.22% 5.12% 4.77% 4.53% 4.11%
1.60% 1.68% 1.68% 1.33% 1.13%
2Q'14 3Q 4Q 1Q'15 2Q
Customer NIM
2Q’15 %1Q’15* 1H’15 %1H’14*
NII + fee income 301 1.0 593 -9.0
Gross income 336 -3.9 676 -2.5
Operating expenses -152 -0.9 -301 1.4
Net op. income 184 -6.3 375 -5.4
LLPs -46 13.8 -85 -1.0
Attributable profit 83 -10.4 173 -0.8
(*) Changes excluding FX impact
Cost of deposits
Profitability of loans
39
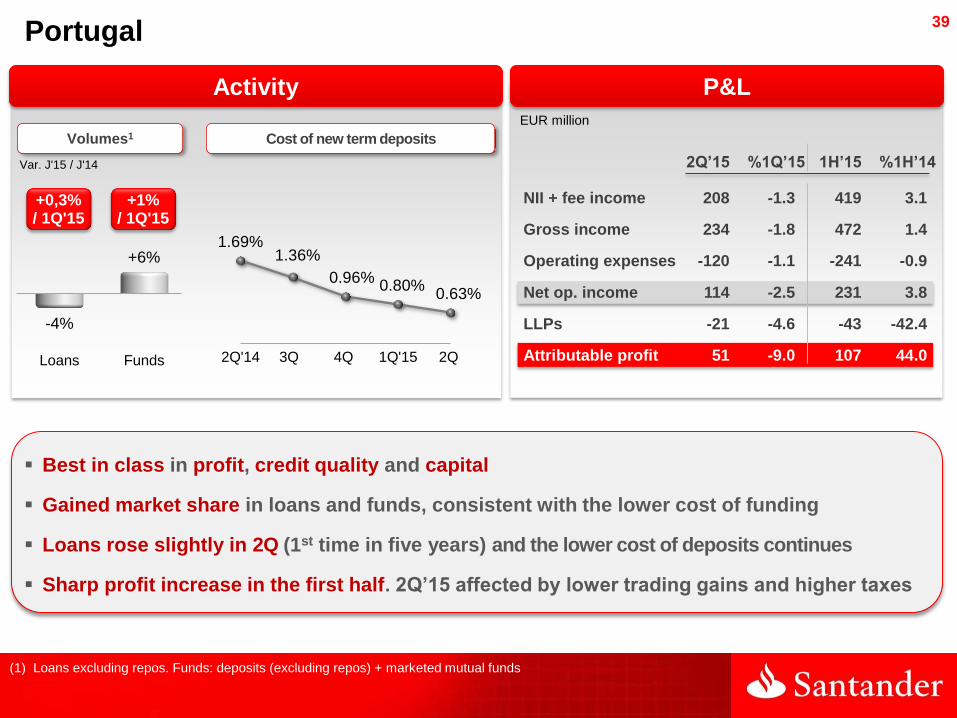
P&L
1.69% 1.36%
0.96% 0.80%
0.63%
2Q'14 3Q 4Q 1Q'15 2Q
Activity
Portugal
Best in class in profit, credit quality and capital
Gained market share in loans and funds, consistent with the lower cost of funding
Loans rose slightly in 2Q (1st time in five years) and the lower cost of deposits continues
Sharp profit increase in the first half. 2Q’15 affected by lower trading gains and higher taxes
Var. J'15 / J'14
Volumes1 Cost of new term deposits
(1) Loans excluding repos. Funds: deposits (excluding repos) + marketed mutual funds
Loans Funds
-4%
+6%
+0,3% / 1Q'15
+1% / 1Q'15
EUR million
2Q’15 %1Q’15 1H’15 %1H’14
NII + fee income 208 -1.3 419 3.1
Gross income 234 -1.8 472 1.4
Operating expenses -120 -1.1 -241 -0.9
Net op. income 114 -2.5 231 3.8
LLPs -21 -4.6 -43 -42.4
Attributable profit 51 -9.0 107 44.0

40
Other Latin American countries
Argentina
Constant EUR million
Attributable profit performance
Uruguay Peru
1H'14 1H'15
147 175
1H'14 1H'15
27 35
1H'14 1H'15
11 17
+19%
+30%
+46%
Focus on loyalty, transactions and target segments
Double-digit growth in volumes
P&L underpinned by gross income growth
41
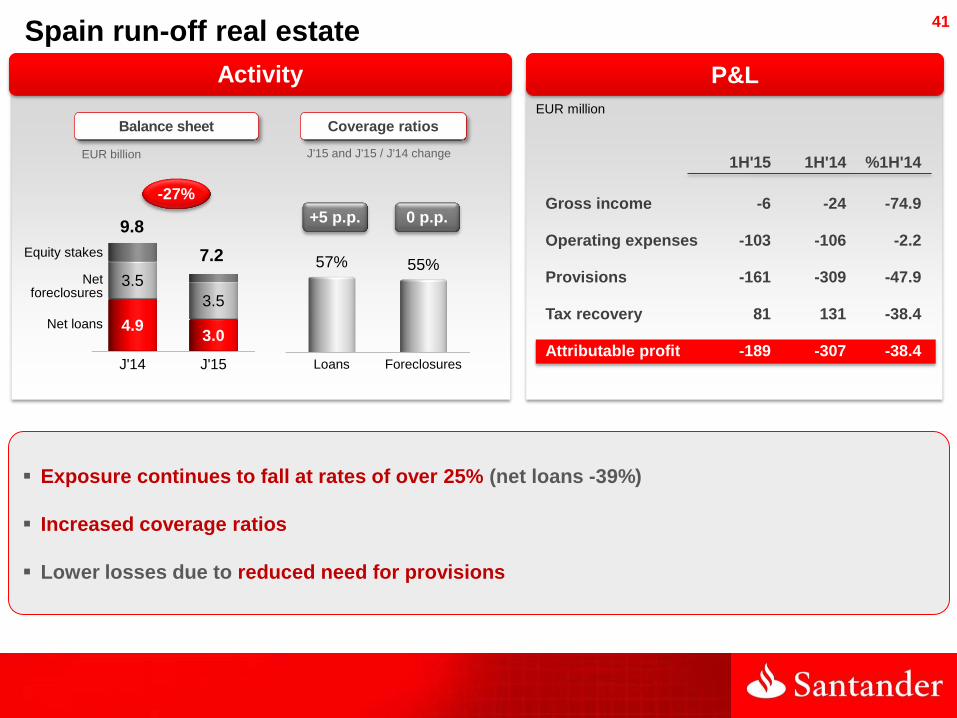
Activity
EUR billion
Balance sheet Coverage ratios
J'15 and J'15 / J'14 change
0 p.p.
EUR million
P&L
1H'15 1H'14 %1H'14
Gross income -6 -24 -74.9
Operating expenses -103 -106 -2.2
Provisions -161 -309 -47.9
Tax recovery 81 131 -38.4
Attributable profit -189 -307 -38.4 Loans Foreclosures
57% 55%
+5 p.p.
Exposure continues to fall at rates of over 25% (net loans -39%)
Increased coverage ratios
Lower losses due to reduced need for provisions
Spain run-off real estate
J'14 J'15
4.9 3.0
3.5
3.5
9.8
7.2
-27%
Net foreclosures
Net loans
Equity stakes

42
Global segments results

43
Retail Banking
Activity
EUR million
P&L
EUR billion
J'14 J'15
620
691 +11%*
J'14 J'15
548 608
+11%*
EUR million
1Q'14 2Q 3Q 4Q 1Q'15 2Q
9,074 9,423 9,705 10,008 10,298 10,673
Gross income (*) Changes excluding FX impact
2Q’15 %1Q’15* 1H’15* %1H’14*
NII + fee income 10,186 2.7 20,157 5.6
Gross income 10,673 4.1 20,970 8.1
Operating expenses -4,659 1.3 -9,277 6.0
Net op. income 6,013 6.4 11,694 9.8
LLPs -2,315 0.6 -4,638 -9.1
Ord. Attrib. profit1 2,087 7.8 4,020 26.0
(1) 2015 data excluding attributable profit of EUR 835 million due to the net result of the reversal of tax liabilities in Brazil
Net loans Deposits
(*) +6% excluding FX impact (*) +5% excluding FX impact
Volumes growth
Good y-o-y performance of net interest
income (+6%) and fee income (+5%)
Stable costs in real terms and excluding
perimeter
Lower provisions

44
836 905
579 656
899 795
285 396
2,599 2,752
1H'14 1H'15
1Q'14 2Q 3Q 4Q 1Q'15 2Q
1,156 1,157 1,056 1,034 1,155 1,201
1,281 1,317 1,257 1,068
1,398 1,355
Global Wholesale Banking (GBM)
+6%*
+8%
-12%
+39%
TOTAL
Global transaction
banking
Global markets
Capital and other
+13%
TOTAL
Capital and other
Customers
Gross income
Customers +2%*
Financing
solutions & advisory
P&L
(*) Changes excluding FX impact
2Q’15 %1Q’15* 1H’15* %1H’14*
NII + fee income 1.143 6,6 2.233 14,3
Gross income 1.355 -1,8 2.752 3,3
Operating expenses -513 2,6 -1.013 9,1
Net op. income 842 -4,3 1.740 0,1
LLPs -144 -24,6 -342 10,5
Attributable profit 457 0,1 921 -1,0
EUR million EUR million
(*) Excluding FX impact: total gross income, +3%; customer revenues -1%
Customer revenues account for 86% of total gross income
Excellent efficiency ratio (37%)
Positive performance of gross income,
with provisions growing y-o-y and costs
up due to investment in developing
franchises

45
Group balance sheet

46
Highlights of the Group balance sheet
Retail balance sheet, appropriate for a low risk business model, liquid and well capitalised
Assets Liabilities
799
118
114
220
69
688
109 44
79 104
169 165
1,339 1,339
EUR billion
1
6
5
4
3
2
Balance sheet at June 2015
Trading portfolio
Other*
Net loans to
customers
Derivatives
Cash and credit institutions
AFS portfolio
Customer deposits
Issues and subordinated
liabilities
Credit institutions
Other
Derivatives
Shareholders’ equity & fixed liabilities
Lending: 60% of balance sheet
Derivatives (with counterparty on the liabilities side): 6% of balance sheet
Cash, central banks and credit institutions: 13%
Other (goodwill, fixed assets, accruals): 8%
Available for sale portfolio (AFS): 8%
Trading portfolio: 5%
1
3
2
4
5
6
Other assets: Goodwill EUR 29 bn., tangible and intangible assets EUR 27 bn., other capital instruments at fair value EUR 1 bn., accruals and other accounts EUR 57 bn.

47
Liquidity and funding

48
Activos Pasivos
175
22
82
136
799
146
64
688
Structural liquidity1 surplus:
EUR 153 bn. (14.5% net liabilities)
Commercial Gap: EUR 111 bn.
Grupo Santander liquidity balance sheet
Jun’15. EUR bnion
Well-funded balance sheet with high structural liquidity surplus
Liquidity and funding
Net loans to customers
Deposits
M/L term funding
Financial assets
Equity (102) and other (34)
Securitisations
Fixed assets & other
ST Funding
Note: Liquidity balance sheet for management purposes (net of trading derivatives and interbank balances). Provisional
(1) Financial assets – short term wholesale funding markets
49
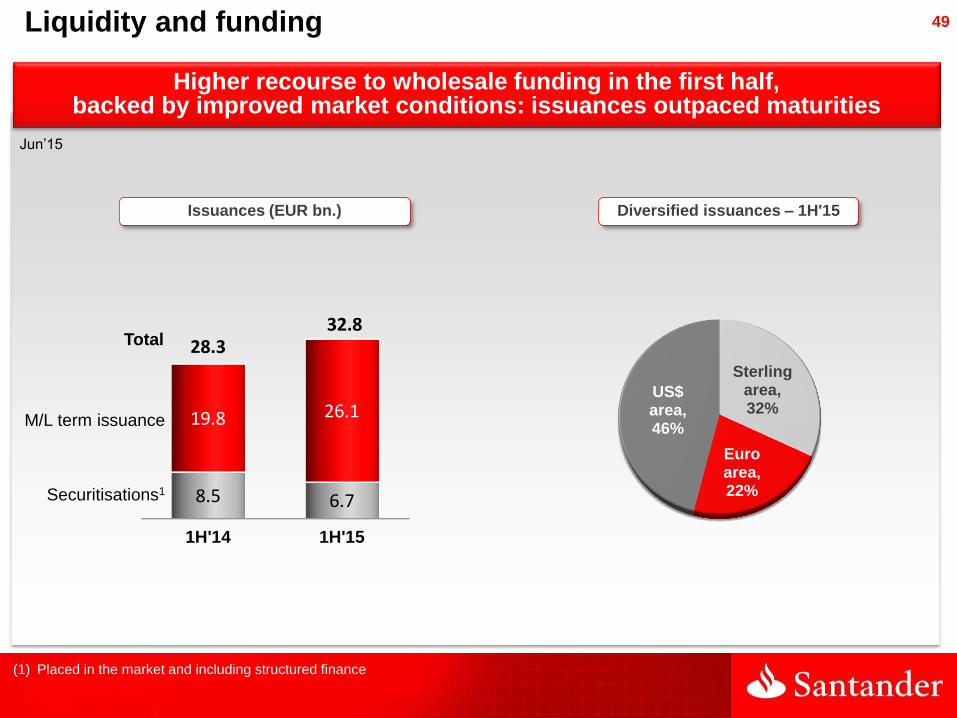
Jun’15
Sterling area, 32%
Euro area, 22%
US$ area, 46%
Total
(1) Placed in the market and including structured finance
1H'14 1H'15
8.5 6.7
19.8 26.1
28.3 32.8
Liquidity and funding
Higher recourse to wholesale funding in the first half, backed by improved market conditions: issuances outpaced maturities
Diversified issuances – 1H'15 Issuances (EUR bn.)
M/L term issuance
Securitisations1
50
NPL, coverage ratios and cost of credit
51
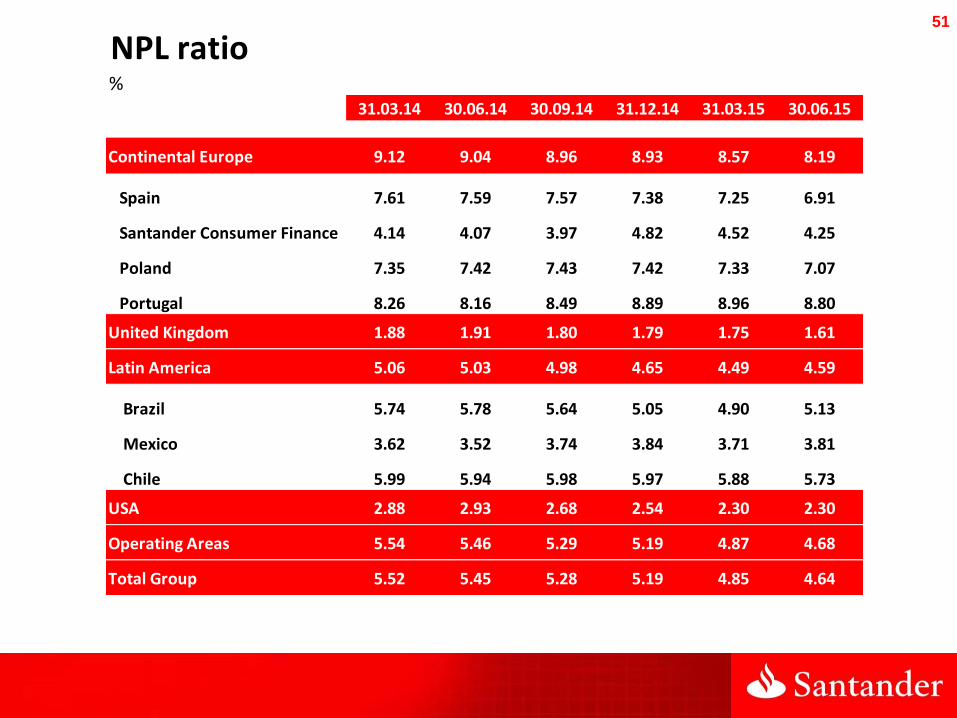
NPL ratio%
31.03.14 30.06.14 30.09.14 31.12.14 31.03.15 30.06.15
Continental Europe 9.12 9.04 8.96 8.93 8.57 8.19
Spain 7.61 7.59 7.57 7.38 7.25 6.91
Santander Consumer Finance 4.14 4.07 3.97 4.82 4.52 4.25
Poland 7.35 7.42 7.43 7.42 7.33 7.07
Portugal 8.26 8.16 8.49 8.89 8.96 8.80
United Kingdom 1.88 1.91 1.80 1.79 1.75 1.61
Latin America 5.06 5.03 4.98 4.65 4.49 4.59
Brazil 5.74 5.78 5.64 5.05 4.90 5.13
Mexico 3.62 3.52 3.74 3.84 3.71 3.81
Chile 5.99 5.94 5.98 5.97 5.88 5.73
USA 2.88 2.93 2.68 2.54 2.30 2.30
Operating Areas 5.54 5.46 5.29 5.19 4.87 4.68
Total Group 5.52 5.45 5.28 5.19 4.85 4.64
52
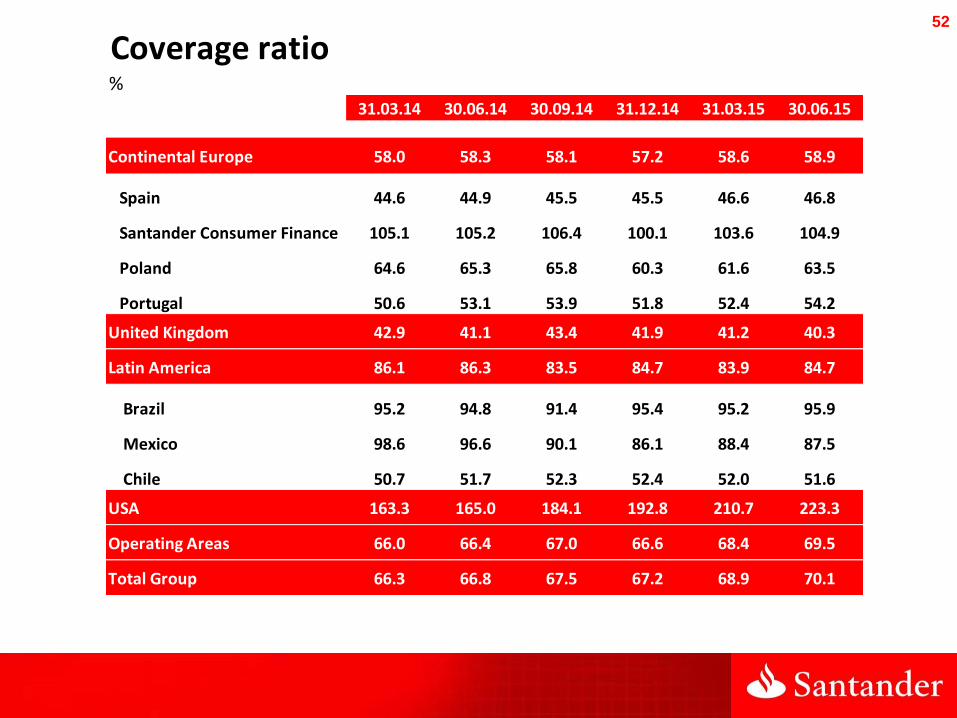
Coverage ratio%
31.03.14 30.06.14 30.09.14 31.12.14 31.03.15 30.06.15
Continental Europe 58.0 58.3 58.1 57.2 58.6 58.9
Spain 44.6 44.9 45.5 45.5 46.6 46.8
Santander Consumer Finance 105.1 105.2 106.4 100.1 103.6 104.9
Poland 64.6 65.3 65.8 60.3 61.6 63.5
Portugal 50.6 53.1 53.9 51.8 52.4 54.2
United Kingdom 42.9 41.1 43.4 41.9 41.2 40.3
Latin America 86.1 86.3 83.5 84.7 83.9 84.7
Brazil 95.2 94.8 91.4 95.4 95.2 95.9
Mexico 98.6 96.6 90.1 86.1 88.4 87.5
Chile 50.7 51.7 52.3 52.4 52.0 51.6
USA 163.3 165.0 184.1 192.8 210.7 223.3
Operating Areas 66.0 66.4 67.0 66.6 68.4 69.5
Total Group 66.3 66.8 67.5 67.2 68.9 70.1

53
Percentage over Group's total (*) Excluding SCF UK
Non-performing loans and Provision funds. 1H’15
Spain, 21%
SCF*, 12%
Poland, 3%
Portugal, 4%
UK, 7% Brazil, 15%
Mexico, 4%
Chile, 4%
USA, 15%
Other, 15%
Spain, 31%
SCF*, 8%
Poland, 4%
Portugal, 6%
UK, 12%
Brazil, 11%
Mexico, 3%
Chile, 5%
USA, 5%
Other, 15%
Non-performing loans Provision funds
100%: EUR 40,273 mill. 100%: EUR 28,233 mill.
54
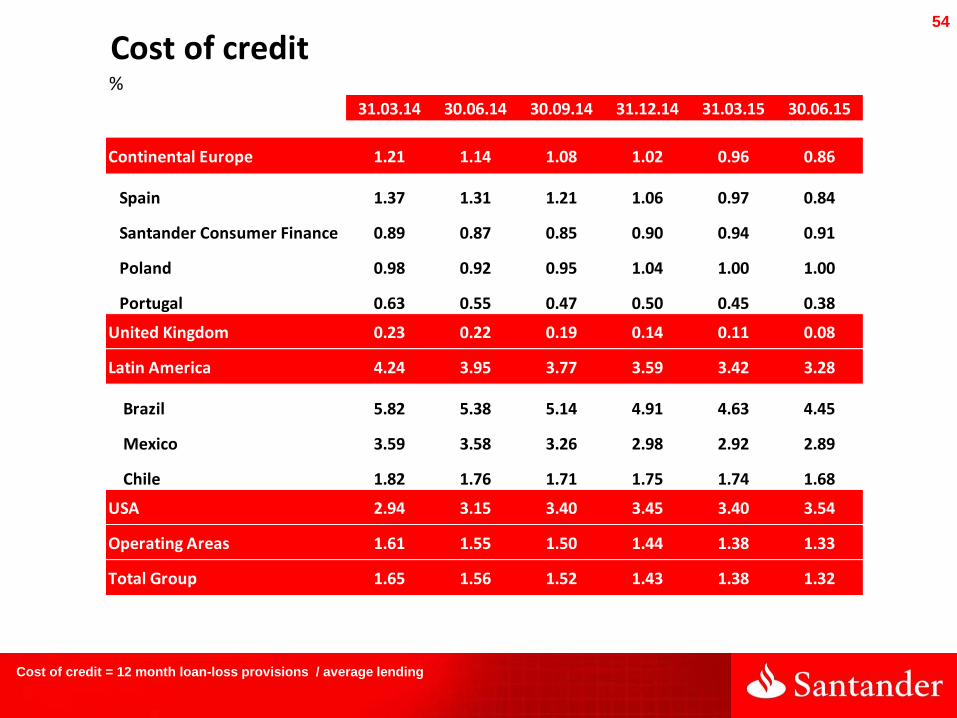
Cost of credit%
31.03.14 30.06.14 30.09.14 31.12.14 31.03.15 30.06.15
Continental Europe 1.21 1.14 1.08 1.02 0.96 0.86
Spain 1.37 1.31 1.21 1.06 0.97 0.84
Santander Consumer Finance 0.89 0.87 0.85 0.90 0.94 0.91
Poland 0.98 0.92 0.95 1.04 1.00 1.00
Portugal 0.63 0.55 0.47 0.50 0.45 0.38
United Kingdom 0.23 0.22 0.19 0.14 0.11 0.08
Latin America 4.24 3.95 3.77 3.59 3.42 3.28
Brazil 5.82 5.38 5.14 4.91 4.63 4.45
Mexico 3.59 3.58 3.26 2.98 2.92 2.89
Chile 1.82 1.76 1.71 1.75 1.74 1.68
USA 2.94 3.15 3.40 3.45 3.40 3.54
Operating Areas 1.61 1.55 1.50 1.44 1.38 1.33
Total Group 1.65 1.56 1.52 1.43 1.38 1.32
Cost of credit = 12 month loan-loss provisions / average lending
55
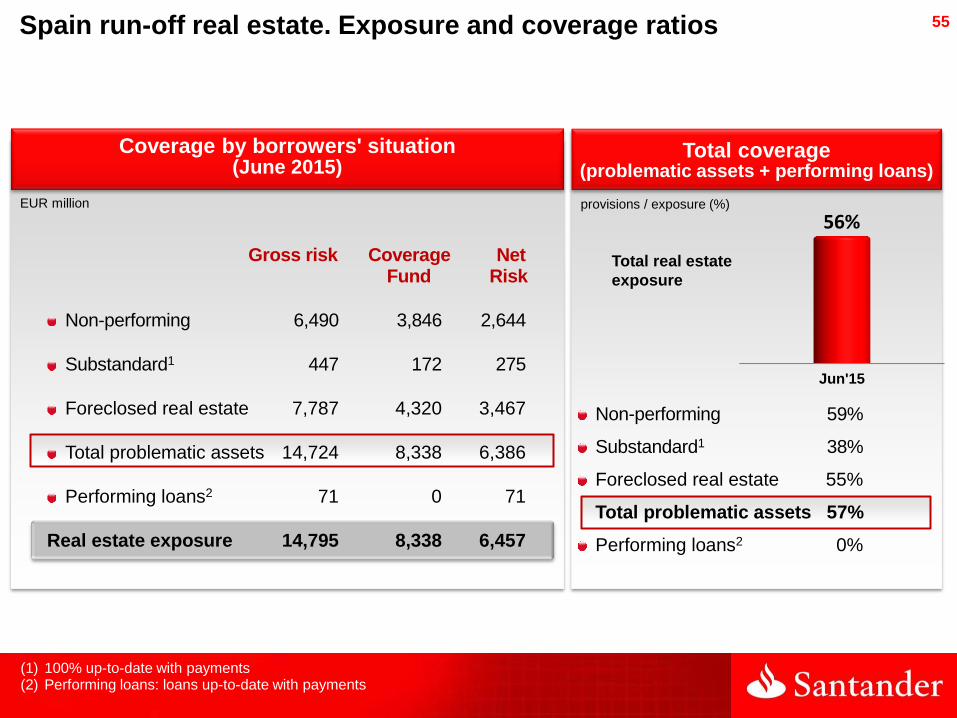
Jun'15
56%
Coverage by borrowers' situation (June 2015)
Gross risk Coverage Net Fund Risk
Non-performing 6,490 3,846 2,644
Substandard1 447 172 275
Foreclosed real estate 7,787 4,320 3,467
Total problematic assets 14,724 8,338 6,386
Performing loans2 71 0 71
Real estate exposure 14,795 8,338 6,457
Spain run-off real estate. Exposure and coverage ratios
(1) 100% up-to-date with payments (2) Performing loans: loans up-to-date with payments
Non-performing 59%
Substandard1 38%
Foreclosed real estate 55%
Total problematic assets 57%
Performing loans2 0%
Total coverage
(problematic assets + performing loans)
provisions / exposure (%) EUR million
Total real estate
exposure
56
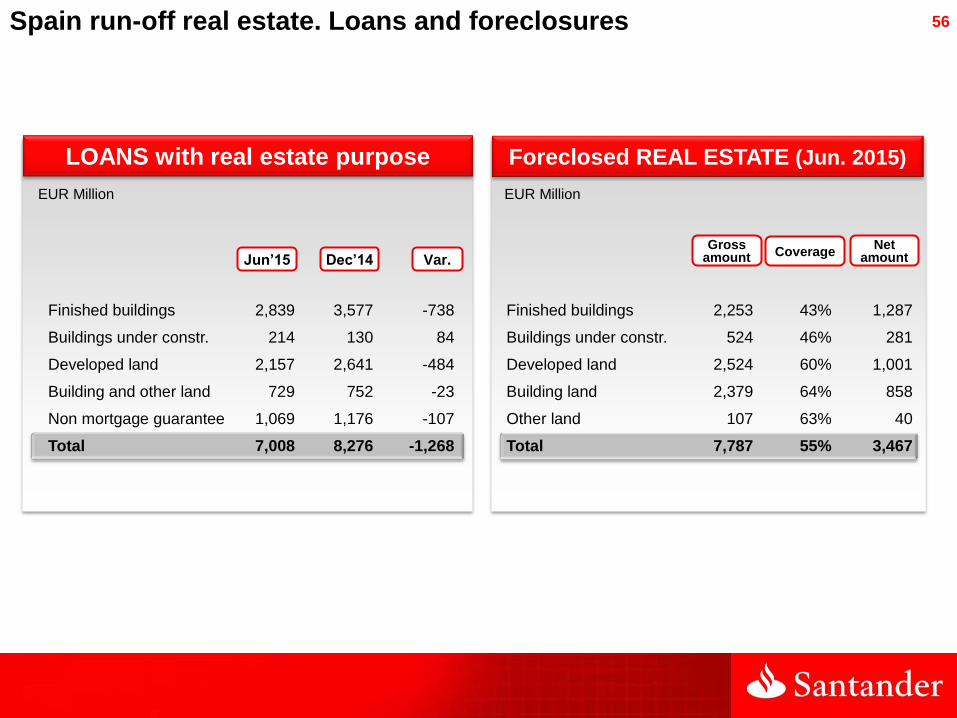
Jun’15 Dec’14 Var.
Spain run-off real estate. Loans and foreclosures
Finished buildings 2,839 3,577 -738
Buildings under constr. 214 130 84
Developed land 2,157 2,641 -484
Building and other land 729 752 -23
Non mortgage guarantee 1,069 1,176 -107
Total 7,008 8,276 -1,268
Finished buildings 2,253 43% 1,287
Buildings under constr. 524 46% 281
Developed land 2,524 60% 1,001
Building land 2,379 64% 858
Other land 107 63% 40
Total 7,787 55% 3,467
LOANS with real estate purpose Foreclosed REAL ESTATE (Jun. 2015)
EUR Million EUR Million
Gross amount Coverage
Net amount
57
Quarterly P&L
58
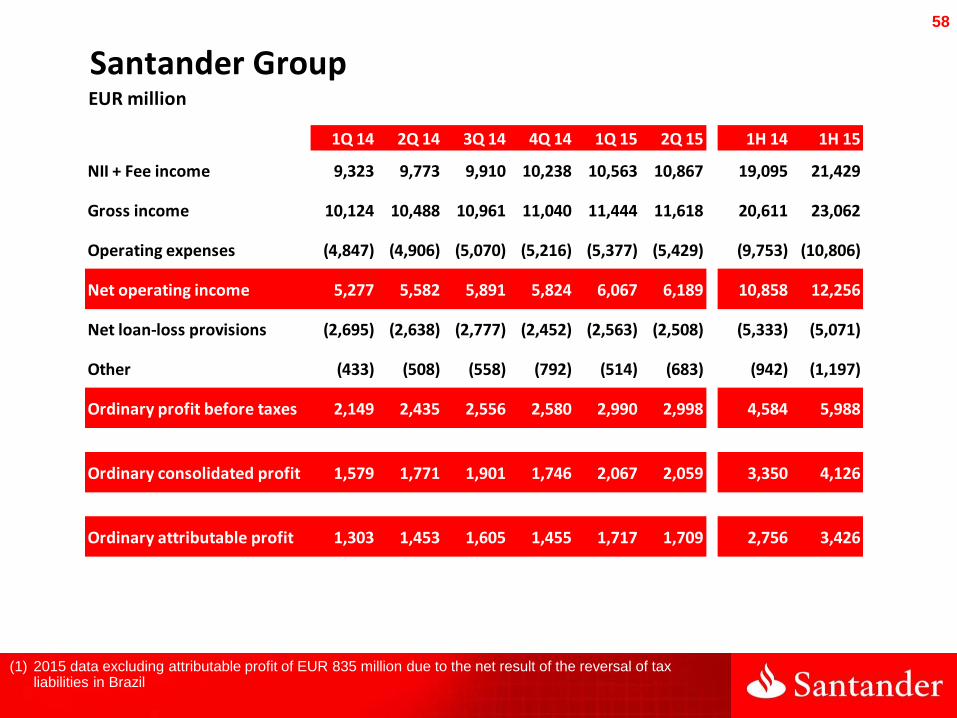
Santander GroupEUR million
1Q 14 2Q 14 3Q 14 4Q 14 1Q 15 2Q 15 1H 14 1H 15
NII + Fee income 9,323 9,773 9,910 10,238 10,563 10,867 19,095 21,429
Gross income 10,124 10,488 10,961 11,040 11,444 11,618 20,611 23,062
Operating expenses (4,847) (4,906) (5,070) (5,216) (5,377) (5,429) (9,753) (10,806)
Net operating income 5,277 5,582 5,891 5,824 6,067 6,189 10,858 12,256
Net loan-loss provisions (2,695) (2,638) (2,777) (2,452) (2,563) (2,508) (5,333) (5,071)
Other (433) (508) (558) (792) (514) (683) (942) (1,197)
Ordinary profit before taxes 2,149 2,435 2,556 2,580 2,990 2,998 4,584 5,988
Ordinary consolidated profit 1,579 1,771 1,901 1,746 2,067 2,059 3,350 4,126
Ordinary attributable profit 1,303 1,453 1,605 1,455 1,717 1,709 2,756 3,426
(1) 2015 data excluding attributable profit of EUR 835 million due to the net result of the reversal of tax liabilities in Brazil
59
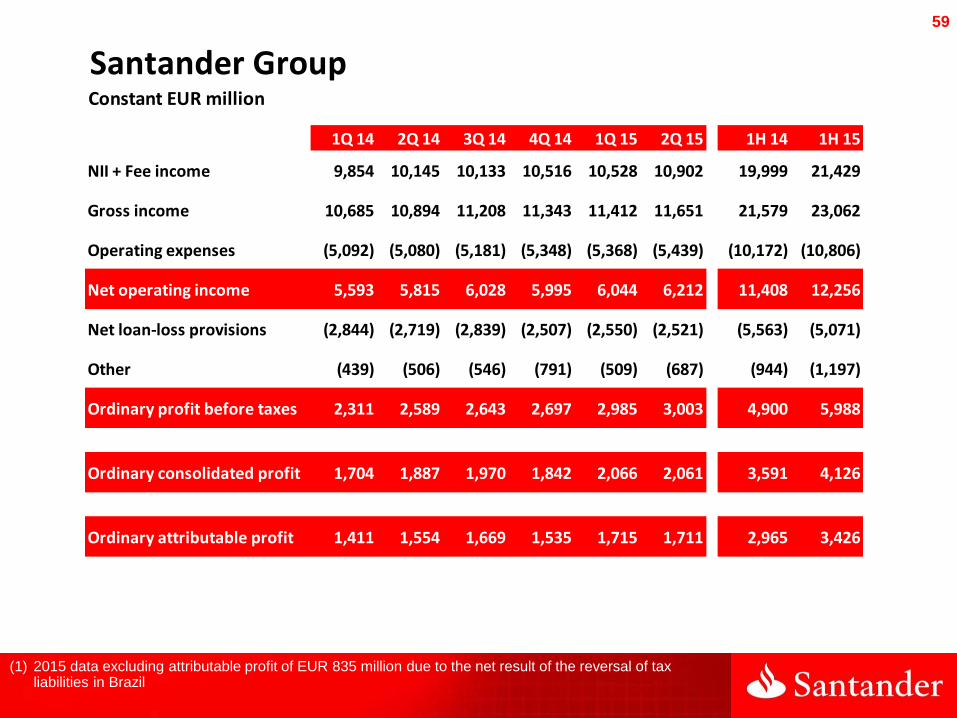
Santander GroupConstant EUR million
1Q 14 2Q 14 3Q 14 4Q 14 1Q 15 2Q 15 1H 14 1H 15
NII + Fee income 9,854 10,145 10,133 10,516 10,528 10,902 19,999 21,429
Gross income 10,685 10,894 11,208 11,343 11,412 11,651 21,579 23,062
Operating expenses (5,092) (5,080) (5,181) (5,348) (5,368) (5,439) (10,172) (10,806)
Net operating income 5,593 5,815 6,028 5,995 6,044 6,212 11,408 12,256
Net loan-loss provisions (2,844) (2,719) (2,839) (2,507) (2,550) (2,521) (5,563) (5,071)
Other (439) (506) (546) (791) (509) (687) (944) (1,197)
Ordinary profit before taxes 2,311 2,589 2,643 2,697 2,985 3,003 4,900 5,988
Ordinary consolidated profit 1,704 1,887 1,970 1,842 2,066 2,061 3,591 4,126
Ordinary attributable profit 1,411 1,554 1,669 1,535 1,715 1,711 2,965 3,426
(1) 2015 data excluding attributable profit of EUR 835 million due to the net result of the reversal of tax liabilities in Brazil

60
Continental EuropeEUR million
1Q 14 2Q 14 3Q 14 4Q 14 1Q 15 2Q 15 1H 14 1H 15
NII + Fee income 2,973 3,077 3,013 3,123 3,126 3,154 6,050 6,280
Gross income 3,196 3,256 3,139 3,231 3,379 3,392 6,452 6,771
Operating expenses (1,607) (1,582) (1,557) (1,591) (1,627) (1,647) (3,189) (3,274)
Net operating income 1,589 1,673 1,582 1,640 1,751 1,745 3,263 3,496
Net loan-loss provisions (791) (770) (737) (582) (638) (509) (1,561) (1,147)
Other (152) (196) (151) (77) (120) (140) (348) (260)
Profit before taxes 647 707 694 981 993 1,095 1,354 2,088
Consolidated profit 499 536 518 693 734 810 1,036 1,545
Attributable profit 463 499 472 644 664 744 962 1,408

61
SpainEUR million
1Q 14 2Q 14 3Q 14 4Q 14 1Q 15 2Q 15 1H 14 1H 15
NII + Fee income 1,602 1,663 1,635 1,665 1,590 1,577 3,264 3,167
Gross income 1,792 1,782 1,733 1,690 1,764 1,751 3,574 3,516
Operating expenses (894) (873) (855) (860) (852) (852) (1,767) (1,704)
Net operating income 898 909 878 830 913 899 1,807 1,812
Net loan-loss provisions (507) (488) (429) (320) (367) (261) (995) (629)
Other (33) (51) (9) (81) (32) (52) (84) (85)
Profit before taxes 358 370 440 429 513 586 728 1,099
Consolidated profit 253 261 310 303 362 419 514 781
Attributable profit 251 261 309 299 357 413 513 771

62
Santander Consumer FinanceEUR million
1Q 14 2Q 14 3Q 14 4Q 14 1Q 15 2Q 15 1H 14 1H 15
NII + Fee income 800 822 822 850 968 1,010 1,622 1,978
Gross income 800 827 821 862 978 1,010 1,626 1,988
Operating expenses (366) (357) (354) (376) (417) (438) (722) (855)
Net operating income 434 470 467 486 561 572 904 1,133
Net loan-loss provisions (130) (123) (149) (143) (168) (131) (252) (299)
Other (14) (17) (71) 65 (22) (36) (31) (58)
Profit before taxes 291 330 247 408 372 405 621 777
Consolidated profit 225 245 184 277 274 294 470 568
Attributable profit 219 237 170 265 242 263 456 505
63
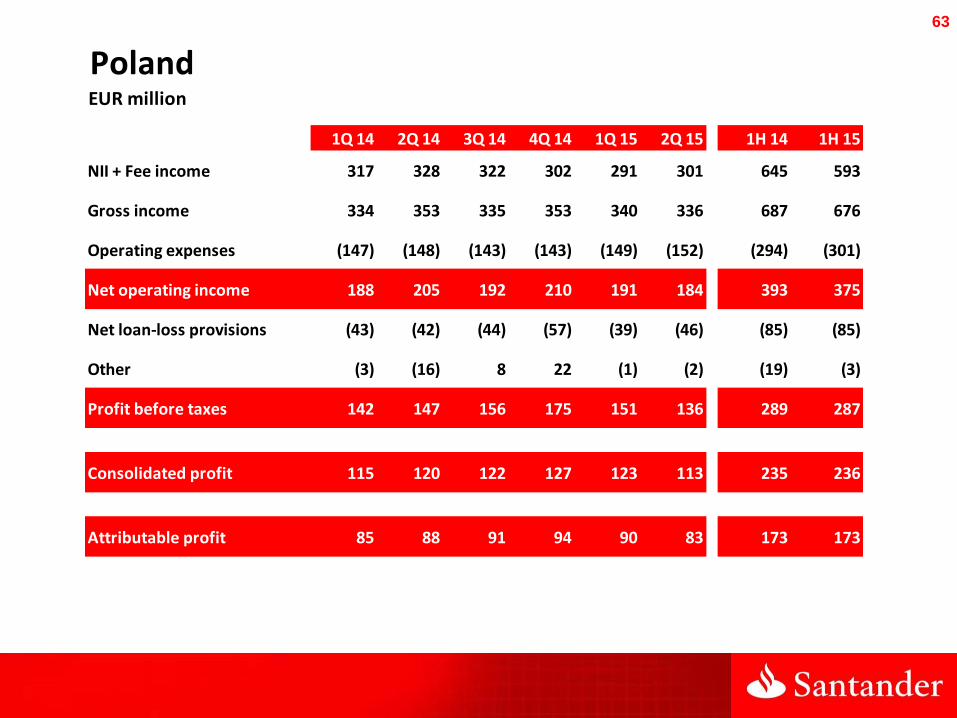
PolandEUR million
1Q 14 2Q 14 3Q 14 4Q 14 1Q 15 2Q 15 1H 14 1H 15
NII + Fee income 317 328 322 302 291 301 645 593
Gross income 334 353 335 353 340 336 687 676
Operating expenses (147) (148) (143) (143) (149) (152) (294) (301)
Net operating income 188 205 192 210 191 184 393 375
Net loan-loss provisions (43) (42) (44) (57) (39) (46) (85) (85)
Other (3) (16) 8 22 (1) (2) (19) (3)
Profit before taxes 142 147 156 175 151 136 289 287
Consolidated profit 115 120 122 127 123 113 235 236
Attributable profit 85 88 91 94 90 83 173 173
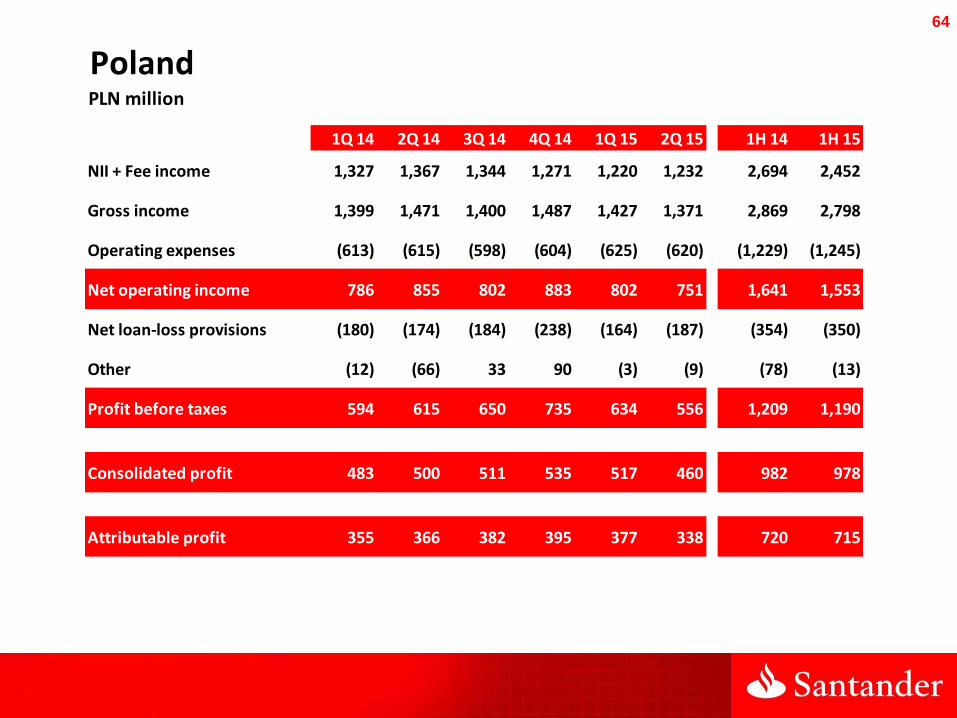
64
PolandPLN million
1Q 14 2Q 14 3Q 14 4Q 14 1Q 15 2Q 15 1H 14 1H 15
NII + Fee income 1,327 1,367 1,344 1,271 1,220 1,232 2,694 2,452
Gross income 1,399 1,471 1,400 1,487 1,427 1,371 2,869 2,798
Operating expenses (613) (615) (598) (604) (625) (620) (1,229) (1,245)
Net operating income 786 855 802 883 802 751 1,641 1,553
Net loan-loss provisions (180) (174) (184) (238) (164) (187) (354) (350)
Other (12) (66) 33 90 (3) (9) (78) (13)
Profit before taxes 594 615 650 735 634 556 1,209 1,190
Consolidated profit 483 500 511 535 517 460 982 978
Attributable profit 355 366 382 395 377 338 720 715

65
PortugalEUR million
1Q 14 2Q 14 3Q 14 4Q 14 1Q 15 2Q 15 1H 14 1H 15
NII + Fee income 202 204 206 215 211 208 406 419
Gross income 228 237 230 261 238 234 465 472
Operating expenses (122) (121) (122) (126) (121) (120) (243) (241)
Net operating income 106 116 108 135 117 114 222 231
Net loan-loss provisions (34) (40) (32) (17) (22) (21) (75) (43)
Other (30) (29) (20) (20) (21) (23) (59) (45)
Profit before taxes 42 47 57 97 74 70 89 143
Consolidated profit 33 37 42 73 56 51 70 107
Attributable profit 36 39 42 73 56 51 74 107
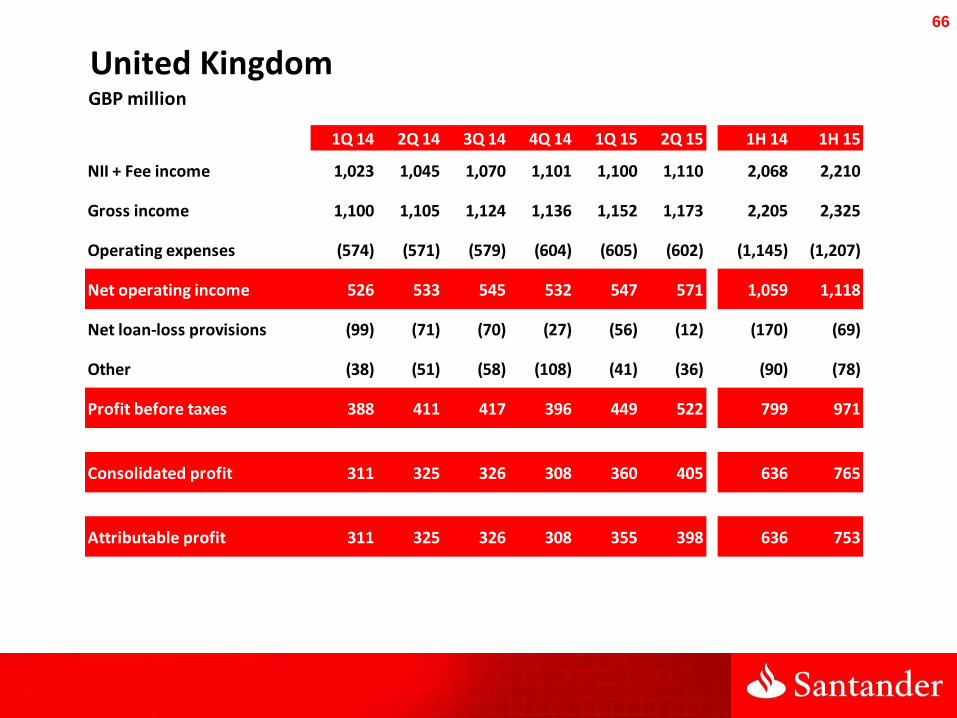
66
United KingdomGBP million
1Q 14 2Q 14 3Q 14 4Q 14 1Q 15 2Q 15 1H 14 1H 15
NII + Fee income 1,023 1,045 1,070 1,101 1,100 1,110 2,068 2,210
Gross income 1,100 1,105 1,124 1,136 1,152 1,173 2,205 2,325
Operating expenses (574) (571) (579) (604) (605) (602) (1,145) (1,207)
Net operating income 526 533 545 532 547 571 1,059 1,118
Net loan-loss provisions (99) (71) (70) (27) (56) (12) (170) (69)
Other (38) (51) (58) (108) (41) (36) (90) (78)
Profit before taxes 388 411 417 396 449 522 799 971
Consolidated profit 311 325 326 308 360 405 636 765
Attributable profit 311 325 326 308 355 398 636 753
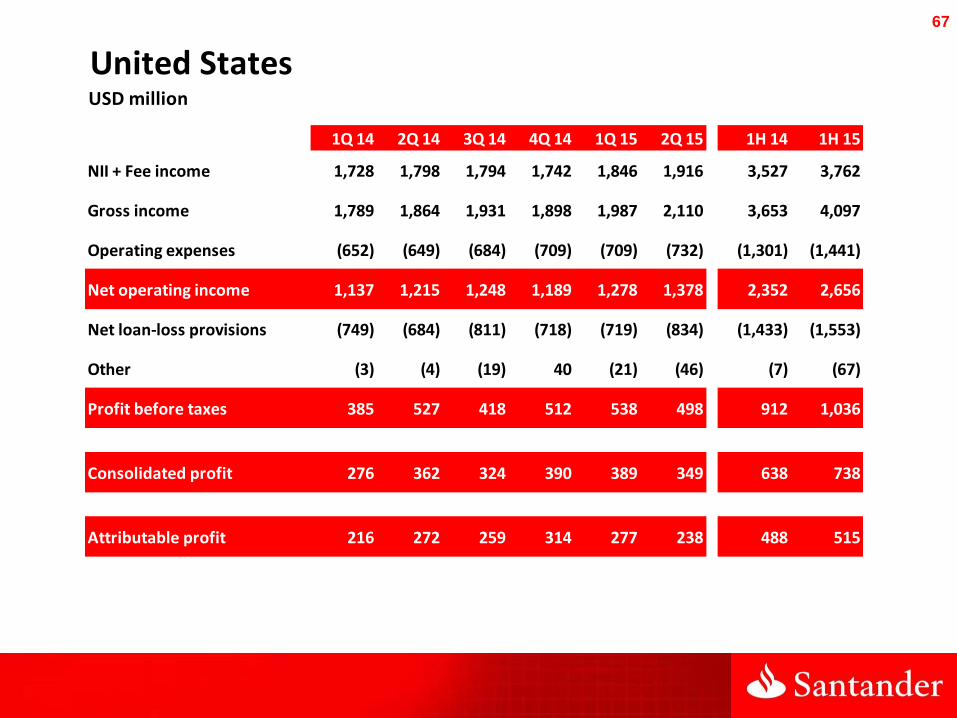
67
United StatesUSD million
1Q 14 2Q 14 3Q 14 4Q 14 1Q 15 2Q 15 1H 14 1H 15
NII + Fee income 1,728 1,798 1,794 1,742 1,846 1,916 3,527 3,762
Gross income 1,789 1,864 1,931 1,898 1,987 2,110 3,653 4,097
Operating expenses (652) (649) (684) (709) (709) (732) (1,301) (1,441)
Net operating income 1,137 1,215 1,248 1,189 1,278 1,378 2,352 2,656
Net loan-loss provisions (749) (684) (811) (718) (719) (834) (1,433) (1,553)
Other (3) (4) (19) 40 (21) (46) (7) (67)
Profit before taxes 385 527 418 512 538 498 912 1,036
Consolidated profit 276 362 324 390 389 349 638 738
Attributable profit 216 272 259 314 277 238 488 515
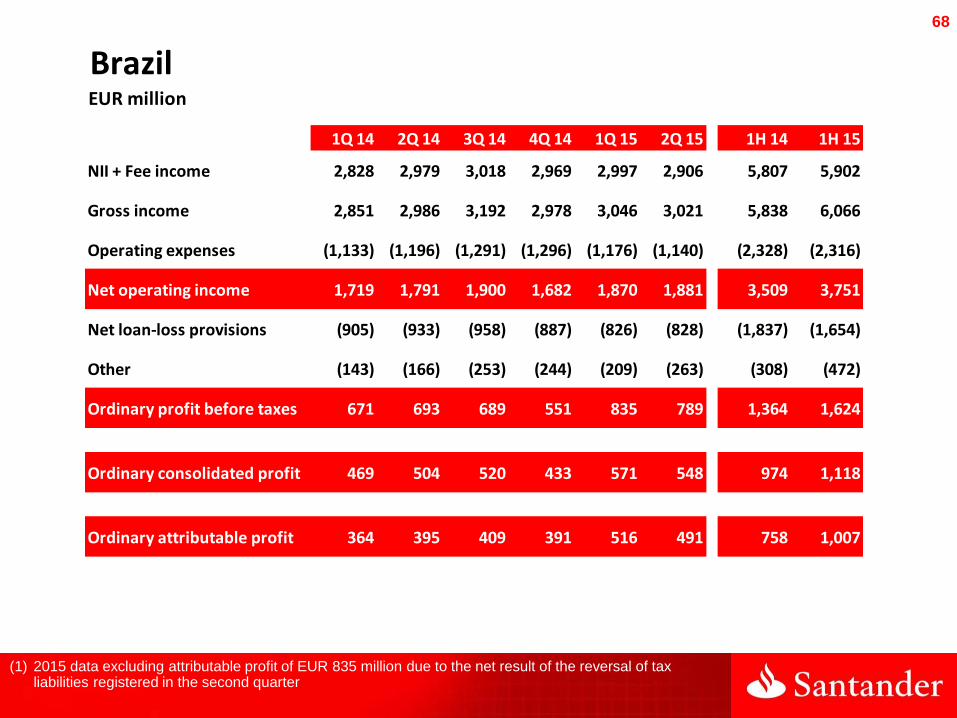
68
BrazilEUR million
1Q 14 2Q 14 3Q 14 4Q 14 1Q 15 2Q 15 1H 14 1H 15
NII + Fee income 2,828 2,979 3,018 2,969 2,997 2,906 5,807 5,902
Gross income 2,851 2,986 3,192 2,978 3,046 3,021 5,838 6,066
Operating expenses (1,133) (1,196) (1,291) (1,296) (1,176) (1,140) (2,328) (2,316)
Net operating income 1,719 1,791 1,900 1,682 1,870 1,881 3,509 3,751
Net loan-loss provisions (905) (933) (958) (887) (826) (828) (1,837) (1,654)
Other (143) (166) (253) (244) (209) (263) (308) (472)
Ordinary profit before taxes 671 693 689 551 835 789 1,364 1,624
Ordinary consolidated profit 469 504 520 433 571 548 974 1,118
Ordinary attributable profit 364 395 409 391 516 491 758 1,007
(1) 2015 data excluding attributable profit of EUR 835 million due to the net result of the reversal of tax liabilities registered in the second quarter

69
BrazilR$ million
1Q 14 2Q 14 3Q 14 4Q 14 1Q 15 2Q 15 1H 14 1H 15
NII + Fee income 9,161 9,111 9,081 9,425 9,635 9,860 18,272 19,495
Gross income 9,236 9,132 9,617 9,458 9,792 10,245 18,367 20,036
Operating expenses (3,669) (3,657) (3,893) (4,111) (3,779) (3,869) (7,325) (7,648)
Net operating income 5,567 5,475 5,724 5,347 6,012 6,376 11,042 12,388
Net loan-loss provisions (2,930) (2,850) (2,882) (2,818) (2,657) (2,808) (5,781) (5,464)
Other (462) (508) (770) (772) (672) (888) (969) (1,560)
Ordinary profit before taxes 2,175 2,117 2,072 1,757 2,683 2,680 4,292 5,364
Ordinary consolidated profit 1,520 1,544 1,564 1,378 1,834 1,859 3,063 3,693
Ordinary attributable profit 1,178 1,208 1,231 1,241 1,657 1,668 2,385 3,326
(1) 2015 data excluding attributable profit of EUR 835 million due to the net result of the reversal of tax liabilities registered in the second quarter

70
MexicoEUR million
1Q 14 2Q 14 3Q 14 4Q 14 1Q 15 2Q 15 1H 14 1H 15
NII + Fee income 699 720 752 781 804 848 1,419 1,653
Gross income 713 775 791 793 833 869 1,488 1,702
Operating expenses (307) (312) (319) (322) (349) (347) (619) (697)
Net operating income 407 463 471 471 484 522 870 1,005
Net loan-loss provisions (179) (191) (210) (177) (211) (224) (369) (435)
Other (2) (2) 6 (1) 8 (2) (3) 6
Profit before taxes 226 271 267 293 281 295 497 576
Consolidated profit 178 214 217 242 215 228 392 443
Attributable profit 138 169 167 186 167 175 307 342

71
MexicoMillion pesos
1Q 14 2Q 14 3Q 14 4Q 14 1Q 15 2Q 15 1H 14 1H 15
NII + Fee income 12,667 12,832 13,074 13,529 13,530 14,355 25,500 27,886
Gross income 12,928 13,821 13,738 13,732 14,017 14,706 26,749 28,723
Operating expenses (5,557) (5,560) (5,545) (5,579) (5,878) (5,878) (11,116) (11,756)
Net operating income 7,371 8,261 8,193 8,153 8,139 8,828 15,632 16,967
Net loan-loss provisions (3,237) (3,401) (3,654) (3,058) (3,545) (3,791) (6,638) (7,336)
Other (28) (34) 106 (13) 130 (36) (62) 93
Profit before taxes 4,106 4,827 4,644 5,083 4,724 5,001 8,933 9,725
Consolidated profit 3,228 3,825 3,770 4,192 3,624 3,856 7,053 7,480
Attributable profit 2,504 3,012 2,910 3,225 2,817 2,954 5,515 5,771
2,504 3,012 2,910 3,225 2,817 2,954 5,515 5,771

72
ChileEUR million
1Q 14 2Q 14 3Q 14 4Q 14 1Q 15 2Q 15 1H 14 1H 15
NII + Fee income 489 526 470 577 485 593 1,015 1,078
Gross income 533 551 505 608 554 634 1,084 1,188
Operating expenses (201) (210) (217) (226) (234) (260) (411) (494)
Net operating income 332 341 288 382 320 374 672 694
Net loan-loss provisions (116) (118) (131) (156) (132) (126) (234) (258)
Other (7) (3) 3 (18) 6 (3) (9) 3
Profit before taxes 209 220 160 209 195 245 429 439
Consolidated profit 176 192 136 236 150 215 367 366
Attributable profit 123 132 92 162 109 150 255 259
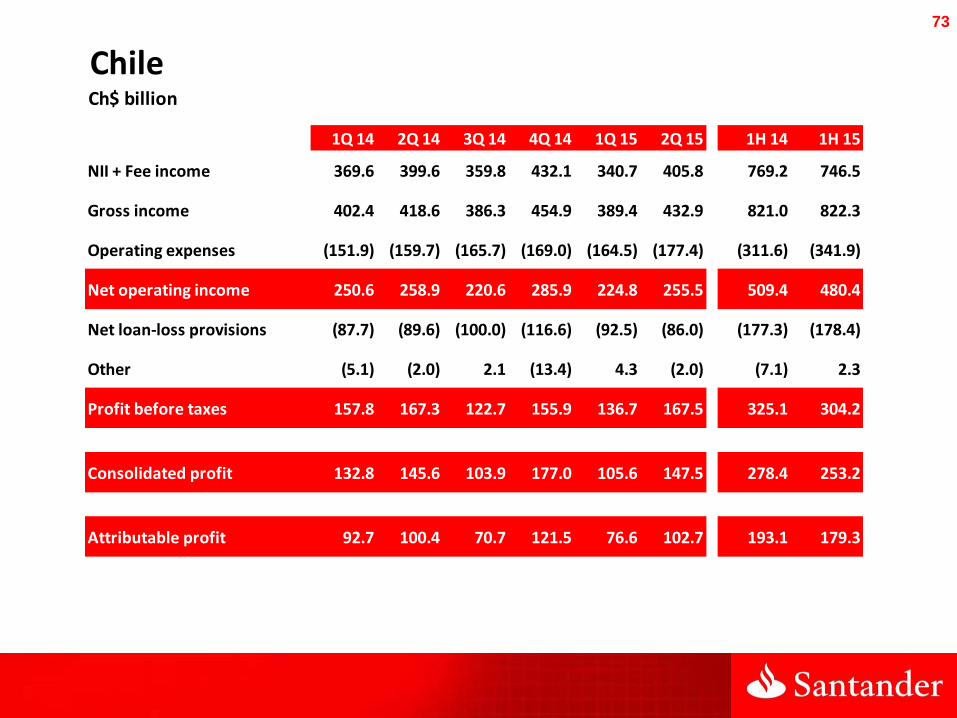
73
ChileCh$ billion
1Q 14 2Q 14 3Q 14 4Q 14 1Q 15 2Q 15 1H 14 1H 15
NII + Fee income 369.6 399.6 359.8 432.1 340.7 405.8 769.2 746.5
Gross income 402.4 418.6 386.3 454.9 389.4 432.9 821.0 822.3
Operating expenses (151.9) (159.7) (165.7) (169.0) (164.5) (177.4) (311.6) (341.9)
Net operating income 250.6 258.9 220.6 285.9 224.8 255.5 509.4 480.4
Net loan-loss provisions (87.7) (89.6) (100.0) (116.6) (92.5) (86.0) (177.3) (178.4)
Other (5.1) (2.0) 2.1 (13.4) 4.3 (2.0) (7.1) 2.3
Profit before taxes 157.8 167.3 122.7 155.9 136.7 167.5 325.1 304.2
Consolidated profit 132.8 145.6 103.9 177.0 105.6 147.5 278.4 253.2
Attributable profit 92.7 100.4 70.7 121.5 76.6 102.7 193.1 179.3
74
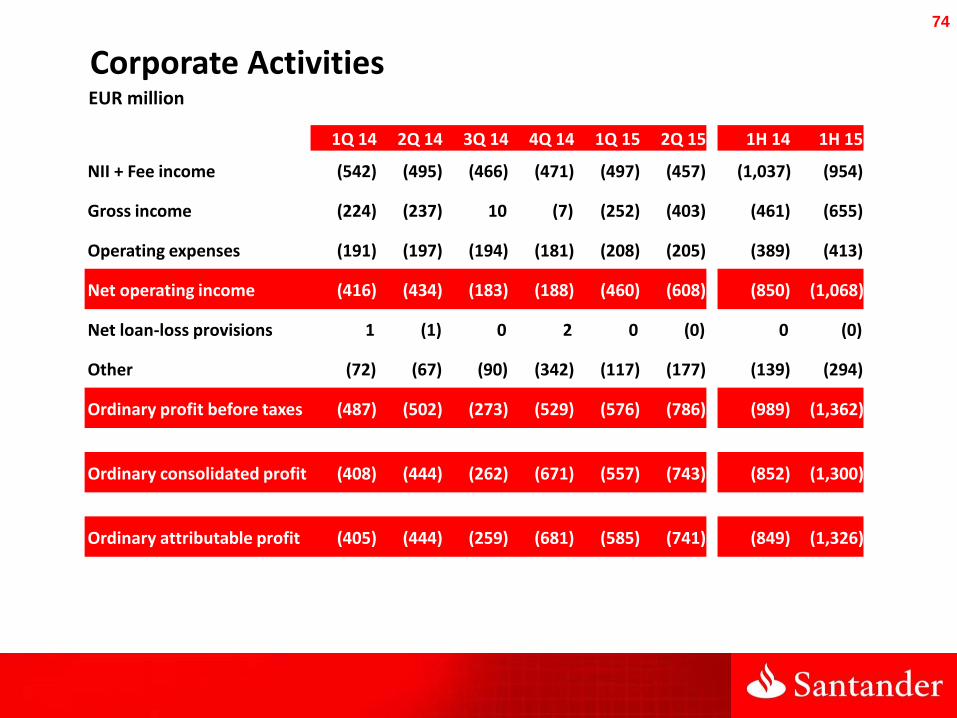
Corporate Activities EUR million
1Q 14 2Q 14 3Q 14 4Q 14 1Q 15 2Q 15 1H 14 1H 15
NII + Fee income (542) (495) (466) (471) (497) (457) (1,037) (954)
Gross income (224) (237) 10 (7) (252) (403) (461) (655)
Operating expenses (191) (197) (194) (181) (208) (205) (389) (413)
Net operating income (416) (434) (183) (188) (460) (608) (850) (1,068)
Net loan-loss provisions 1 (1) 0 2 0 (0) 0 (0)
Other (72) (67) (90) (342) (117) (177) (139) (294)
Ordinary profit before taxes (487) (502) (273) (529) (576) (786) (989) (1,362)
Ordinary consolidated profit (408) (444) (262) (671) (557) (743) (852) (1,300)
Ordinary attributable profit (405) (444) (259) (681) (585) (741) (849) (1,326)