26jun tat hong ar 2015 v
TRANSCRIPT

C O N S O L I DAT I N G O U R S T R E N G T H S
A N N U A L R E P O R T 2 0 1 5
15_0126 Tat Hong AR 2015 FA03.indd 1 29/6/15 10:34 am

OUR EXTENSIVE FOOTPRINT
GROUP STRUCTURE
CHAIRMAN’S MESSAGE
DIALOGUE WITH THE GROUP CEO
OPERATIONS AND FINANCIAL REVIEW
FINANCIAL HIGHLIGHTS
5-YEAR FINANCIAL SUMMARY
CRANE FLEET SIZE
BOARD OF DIRECTORS
KEY MANAGEMENT
INVESTOR RELATIONS
CORPORATE RESPONSIBILITY
KEY MILESTONES
CORPORATE INFORMATION
CORPORATE GOVERNANCE
FINANCIALCONTENTS
8
9
10
13
16
20
22
23
24
28
30
32
38
40
41
55
26Jun_Tat Hong AR 2015_V.indd B26Jun_Tat Hong AR 2015_V.indd B 26/6/15 16:2926/6/15 16:29

We are the largest crane owning company in the Asia-Pacific region with a fleet of more than 1,500 crawler, mobile and tower cranes.1
Established in Singapore in the 1970s as a supplier of cranes and heavy equipment, Tat Hong’s operations have grown across the region covering Singapore, Australia, China, Malaysia, Thailand, Hong Kong, Vietnam, Indonesia, Myanmar and Papua New Guinea. The Group has four core businesses – crane rental, tower crane rental, general equipment rental and distribution.
In Asia, we have successfully leveraged our extensive crane fleet and vast experience in providing lifting solutions to establish ourselves as the leading name in the crane rental, heavy lift, heavy haulage and equipment sales business.
Through our wholly-owned Australian subsidiary, Tutt Bryant Group Limited, we have a leading position in Australia in crane hire and heavy haulage, general plant and equipment hire and equipment sale and distribution.
We have also aggressively expanded our tower crane rental business in China and are currently one of the largest tower crane rental companies in the country,2 with a market reach that spans across 29 provinces.
1 Source: International Cranes, IC50 Ranking, June 20142 Source: Cranes Today, Fleet File, October 2014
TAT HONG HOLDINGS LTD (“TAT HONG”) ONE OF THE WORLD’S LARGEST CRANE OWNING COMPANIES1
15_0126 Tat Hong AR 2015 FA03.indd 1 29/6/15 10:34 am

ANNUAL REPORT 2015
TAT HONG HOLDINGS LTD2
15_0126 Tat Hong AR 2015 FA03.indd 2 29/6/15 10:34 am

R E F I N I N GO U R M O V E STo keep up in today’s ever-changing
economy, one must learn to evolve with
changing t imes. L ike a chess player
who constant ly adapts his tact ics to
secure success, we wi l l l ikewise str ive
to cont inual ly ref ine our strategies and
execute effect ive moves to enhance our
business operat ions.
15_0126 Tat Hong AR 2015 FA03.indd 3 29/6/15 10:34 am

ANNUAL REPORT 2015
TAT HONG HOLDINGS LTD4
26Jun_Tat Hong AR 2015_V.indd 426Jun_Tat Hong AR 2015_V.indd 4 26/6/15 16:2926/6/15 16:29

T A R G E T I N GO U R G O A L SAt Tat Hong, we remain steadfast in
our pursuit of long-term growth. Led
by a committed management team,
we are focused on consol idat ing
our capabi l i t ies, re invent ing our
advantages and strengthening our
internal structure, thereby enabl ing us
to stay ahead in the industry.
15_0126 Tat Hong AR 2015 FA03.indd 5 29/6/15 10:34 am

ANNUAL REPORT 2015
TAT HONG HOLDINGS LTD6
26Jun_Tat Hong AR 2015_V.indd 626Jun_Tat Hong AR 2015_V.indd 6 26/6/15 16:3026/6/15 16:30

M O U L D I N GO U R F U T U R E
The cornerstone of our stabi l i ty has
a lways been our people. Moving forward,
we wi l l cont inue to work together and
dr ive synergies between staff, customers
and business partners in order to del iver
resi l ient results to our stakeholders.
26Jun_Tat Hong AR 2015_V.indd 726Jun_Tat Hong AR 2015_V.indd 7 26/6/15 16:3026/6/15 16:30

• Kuala Lumpur
• Jakarta
Bangkok •Yangon •
AUSTRALIA
CHINA
INDIA
JAPAN
PHILIPPINES
• PAPUA NEW GUINEA
• Ho Chi Minh
Beijing •
Guangzhou •
Shanghai •
SINGAPORE •
HONG KONG • TAIWAN
VIETNAM
Hanoi •
INDONESIA
THAILAND
MALAYSIA
SOUTH KOREA
MYANMAR
Perth •
Adelaide •Portland •
Karratha • • Port Hedland
• Darwin
• Cairns
• Townsville
• MackayDysart • • Gladstone
RockleaOrmeau
DandenongDovetonLavertonHallam
South GuildfordRedcliffeKwinana Sydney Olympic Park
South GranvillePrestons
• Brisbane
• Coffs Harbour Muswellbrook •
• BeresfieldSingleton •• Sydney
• WollongongGoulburn •Melbourne••Moolap
TAT HONG’S BUSINESS PRESENCE
TAT HONG’S BUSINESS ACTIVITIES
TAT HONG’S OFFICES
OUR EXTENSIVE FOOTPRINT
Liaoning
Heilongjiang
Jilin
Inner MongoliaBeijing Tianjin
Hebei
ShandongShanxi
Shanghai
Zhejiang
Jiangsu
Hubei
Shaanxi
Ningxia
Sichuan
Gansu
Chongqing
Guizhou
Jiangxi
Fujian
Yunnan Guangxi Guangdong
Anhui
Xinjiang
Hainan
Henan
Hunan
ANNUAL REPORT 2015
TAT HONG HOLDINGS LTD8
26Jun_Tat Hong AR 2015_V.indd 826Jun_Tat Hong AR 2015_V.indd 8 26/6/15 16:3026/6/15 16:30

GROUP STRUCTURE
KEY OPERATING ENTITIES
S I N G A P O R E
Tat Hong Plant Leasing Pte Ltd100%
Tat Hong HeavyEquipment (Pte.) Ltd100%
Tat Hong Machinery Pte Ltd100%
Tat Hong Training Services Pte Ltd100%
Tat Hong United Logistics Pte Ltd100%
Tat Hong Heavylift Pte Ltd100%
Load Controls Systems Pte Ltd70%
Peng Koon Heavy Machinery Pte Ltd70%
Tat Hong Offshore and Marine Services Pte Ltd50%
THL FoundationEquipment Pte Ltd45%
Yongmao Holdings Limited24%
M A L A Y S I A
Tat Hong Plant Hire Sdn Bhd100%
Tat Hong Crane Rental (Sarawak) Sdn Bhd100%
Tat Hong Crane Logistics Sdn Bhd100%
T H A I L A N D
Tat Hong (Thailand) Co., Ltd100%
H O N G K O N G
Tat Hong HeavyEquipment (Hong Kong) Limited100%
Tat Hong HeavyEquipment(Macau) Limited100%
I N D O N E S I A
PT Tatindo Heavy Equipment95%
PT Tat Hong HeavyEquipment Indonesia100%
PT World Wide EquipmentSouth East Asia100%
PT Tat Hong Batam100%
C H I N AShanghai Tat HongEquipment Rental Co., Ltd87%
China Nuclear Huaxing TatHong Machinery Construction Co., Ltd73%
Jiangsu Zhongjian TatHong Machinery Construction Co., Ltd88%
Jiangsu Hengxingmao Financial Leasing Co., Ltd88%
Tat Hong Zhiyuan (Jiangsu) Equipment Rental Co., Ltd88%
Changzhou Tat Hong Zhaomao Machinery Construction Co., Ltd88%
Tat Hong Zhaomao Investment Co., Ltd88%
Distribution & Crane Rental SubsidiariesAssociatesJoint Ventures
General Equipment Rental
Tower Crane Rental
M Y A N M A R
Tat Hong Intraco Heavy Equipment Co Ltd40%
V I E T N A M
Tat Hong Equipment Co., Ltd100%
Tat Hong Vietnam Co., Ltd70%
A U S T R A L I A
Tutt Bryant Group Limited100%
BT Equipment Pty Ltd100%
MuswellbrookCrane Services Pty Ltd100%
T.B.F Oceania Pty Ltd50%
Offi ce Cleaning Services Pty Ltd100%
North Sheridan Pty Ltd100%
Kingston Industries Pty Ltd100%
PAPUA NEW GUINEA
Tat Hong (PNG) Limited50%
T A T H O N G H O L D I N G S L T D
9
26Jun_Tat Hong AR 2015_V.indd 926Jun_Tat Hong AR 2015_V.indd 9 26/6/15 16:3026/6/15 16:30
D E A R S H A R E H O L D E R S
It has been another challenging year for Tat Hong when global economic growth remained in the doldrums and uncertainties abound. Amidst prevailing challenges, the Group ended FY2015 with an 11% decline in revenue. Group net profi t attributable to shareholders tumbled 85% to S$4.9 million, caused by one-off non-cash impairments of S$30.8 million by our wholly-owned Australian subsidiary group – Tutt Bryant Group. Excluding these non-cash impairments, Group net profi t would have been S$35.7 million, about the same level as the previous fi nancial year.
C R E D I B L E P E R F O R M A N C E
A M I D S T C H A L L E N G E S
During the year under review, the infl ux of excess equipment from the region and Europe into Singapore coupled with the slowdown in the construction sector resulted in utilisation and pricing pressures for our crane rental operations and reduced demand for our distribution business. The better crane rental performance in Malaysia was insuffi cient to offset the poorer performance in Singapore. Whilst Hong Kong and Thailand turned in stable performance, trading conditions in Australia remained diffi cult throughout the year. Our tower crane rental business continued to perform well on the back of fi rm demand and long-term contracts in the infrastructure, power generation and large commercial building sectors in the People’s Republic of China. As a result, Group revenue fell 11% to S$608.6 million.
CHAIRMAN’S MESSAGE
The fall in revenue coupled with increased provisioning for stock obsolescence as well as crane repositioning costs in Australia led to a 14% decline in gross profi t to S$212.1 million. Whilst the Group’s other income increased 23% to S$34.5 million, primarily from the disposal of non-core businesses and properties, and foreign exchange gains, the S$30.8 million non-cash impairment charge by Tutt Bryant Group eroded these positives resulting in the Group ending the year with a profi t before tax of S$18.4 million and a profi t after tax and minority interests (PATMI) of S$4.9 million, 62% and 85% lower than FY2014 respectively.
R I G H T S I Z I N G O U R
O P E R A T I O N S
During the year under review, we trimmed our crawler and mobile crane fl eet to 647 units, primarily through the divestment of a subsidiary Hup Hin Transport. The reduction in fl eet size is well-timed as it eases fl eet utilisation pressure at a time when the construction sector in Singapore is facing a slowdown.
Our tower crane rental business in China added 25 tower cranes to meet demand and at 31 March 2015, has 934 tower cranes in its fl eet.
The Group will continue to be prudent in its equipment purchases to ensure we have an optimal fl eet size given the uncertainties in many of the markets that we operate in.
ANNUAL REPORT 2015
TAT HONG HOLDINGS LTD1 0
26Jun_Tat Hong AR 2015_V.indd 1026Jun_Tat Hong AR 2015_V.indd 10 26/6/15 16:3026/6/15 16:30

P R U D E N T C A P I T A L
M A N A G E M E N T
During the year, the Group divested non-core business and assets and in the process monetised S$89.1 million. The Group achieved free cash fl ow of S$115.1 million in FY2015 from strong cash fl ows from operations, reduced capital expenditure and better working capital management.
The strong positive cash fl ow from operations and proceeds from the divestments funded the net repayment of loans and other fi nancial obligations totaling S$63.1 million, deleveraged the balance sheet and reduced net gearing to 0.77 times from 0.87 times a year earlier.
D I V I D E N D S
The Board is pleased to recommend a fi nal dividend of 1.0 Singapore cent for shareholders’ approval at the forthcoming Annual General Meeting to be held on 29 July 2015. If approved by shareholders, total dividend for FY2014 would amount to 1.5 Singapore cents, including 0.5 Singapore cent interim dividend paid out on 9 December 2014.
M O V I N G F O R W A R D
We expect the challenges faced last year to continue into FY2016 as uncertainty continues to beleaguer the world economy. However, we are confi dent that the Group
1 1
26Jun_Tat Hong AR 2015_V.indd 1126Jun_Tat Hong AR 2015_V.indd 11 26/6/15 16:3026/6/15 16:30

CHAIRMAN’S MESSAGE
will be able to navigate the choppy waters and acquit itself. With a strong business franchise across the major markets in Asia and in Australia and our deep experience in the crane rental business, the Group has signifi cant strengths to withstand the turbulence ahead.
Whilst the macro environment is beyond our means to manage, we can however keep our house in order, rid ourselves of ineffi ciencies and consolidate our strengths to move forward. FY2016 will be the year that we return to fundamentals and by doing so, I believe that we can overcome the diffi culties ahead and emerge as a stronger Tat Hong.
A C K N O W L E D G E M E N T S
Our executive director Mr David Ng stepped down from the Board on 23 June 2015 and on behalf of the Board and management, I would like to thank him for his many years of service on the Board of Tat Hong. David will remain in a senior executive role in one of our subsidiaries, Tat Hong HeavyEquipment (Pte.) Ltd.
I wish to thank particularly my fellow colleagues on the Board of Tat Hong for their invaluable advice and counsel in the many years they have been on the board. Equally, my deep appreciation also goes to the staff and management who have pressed on with unfl agging dedication and hard work.
To all our stakeholders and shareholders, we record our deep appreciation for their continued support all these years.
A F O N D F A R E W E L L
It has been a great privilege for me to serve on the Board of Tat Hong since 1997. I have seen the Group grow in the many good years as there were also diffi cult years. Notwithstanding the swing in fortunes, our company has continued to be the leading crane rental company in Asia-Pacifi c.
With advancing age, it is time for me to say a fond farewell to one and all as I will not be seeking re-election at the forthcoming AGM.
I have found it tremendously fulfi lling serving on the Board of Tat Hong for the past 18 years and I hope that I have, on my part, contributed to the growth of Tat Hong. I would like to thank my fellow colleagues on the Board of Tat Hong as well as the management and staff for all the assistance and co-operation extended to me during my tenure.
Best wishes and good fortune to Tat Hong.
T A N C H O K K I A N
Non-Executive and Independent Chairman
23 June 2015
ANNUAL REPORT 2015
TAT HONG HOLDINGS LTD1 2
26Jun_Tat Hong AR 2015_V.indd 1226Jun_Tat Hong AR 2015_V.indd 12 26/6/15 16:3026/6/15 16:30

DIALOGUE WITH THE GROUP CEO
The Australian market has been in the doldrums since FY2014. Would you like to comment on the Group’s business in Australia and the outlook going forward?
There was a 7% decline in revenue contribution from our Australia subsidiary group, TBG, in FY2015 compared to FY2014. The impact on its profitability arose from the S$30.8 million non-cash impairment charges. Excluding such impairments and one-off gains from sale of assets, TBG recorded an improvement in operating profits, albeit from a low base. This was attributable to the continued discipline in cost containment by TBG’s management.
Going forward, I expect TBG’s performance to be stable and we do not expect any significant improvements. The challenges we faced in Australia are linked to macro-economic factors such as the overall economic weakness, the lack of investments in the
resources sector, lack of public spending on urban infrastructure, etc. There is nothing much Tat Hong can do to stimulate demand but we can and will continue to watch our costs and improve our services.
Revenue contribution from Singapore has seen a decline of 35%. What are the reasons for such a drastic decline?
Both our crane rental and distribution businesses in Singapore were weaker in FY2015. We have recently seen excess equipment from overseas coming into the local market competing directly with our distribution business and reducing the overall demand for crane rental. This, together with new market entrants, expansion by existing players and a slowdown in the construction sector, have resulted in price and utilisation pressures for our crane rental business and weak demand for our distribution business.
1 3
15_0126 Tat Hong AR 2015 FA03.indd 13 29/6/15 10:34 am

DIALOGUE WITH THE GROUP CEO
We are fortunate to have an extensive regional footprint for our crane rental business and our overseas operations in Southeast Asia continued to perform well together with a relatively stable but muted underlying performance from Australia. As a result, crane rental revenue as a whole fell only 9%. On the other hand, our distribution business was further impacted by the down-sizing of our excavator distribution business in Indonesia as well as weaker performance in Australia which resulted in a 18% decline in distribution revenue for FY2015.
Is the decline in Distribution revenue a
cyclical occurrence or do you foresee a
permanent downward trend for this line
of business?
Going forward, we should see a progressive decline in the percentage contribution from the Distribution division to total Group revenue as it is our intention to scale down our excavator sales business in Indonesia whilst at the same time, grow our crane rental operations across various markets and tower crane rental operations in China. However, the distribution of cranes out of Singapore to the region and the multi-brand multi-equipment distribution business in Australia will continue to be important to the Group as these businesses are synergistic with and complementary to our crane rental and general equipment rental businesses.
As doing business in Singapore is getting
more and more challenging, would
you consider reducing your Singapore
operations and diverting resources to
grow your overseas crane rental business?
It is getting increasingly challenging in Singapore because on the one hand, we face increasing competition in a market that is trending down and on the other hand, we have costs of doing business which are trending up. However, Singapore is our home market even though about 80% of our revenues are derived from our overseas operations.
While we continue to grow our overseas business, Singapore will still remain important to the Group because we are a homegrown company with our International Headquarters here where there are many advantages of doing business and directing the growth of the Group’s business.
You mentioned competition. What is
being done to address this?
If you are in a good sustainable and profi table business, you can always expect competition. And competition is not necessarily a bad thing as it drives market players to continuously improve themselves. In facing up to competition, it is also important to ensure that long-term goals are not sacrifi ced in the pursuit of short-term results.
We have been in this business in Singapore since the 1970s and our Australian subsidiary, Tutt Bryant has more than 75 years of business history. We have therefore accumulated a vast store of experience and expertise in crane operations and the best way we can rise above our competitors is to leverage our expertise and experience to provide better services in terms of timeliness, safety and quality.
What was the rationale behind the Group’s
accelerated disposal programme in FY2015?
Since three years ago, we implemented a programme to derive greater effi ciency from our capital deployment. The programme entailed looking to replacing some of the properties in Singapore where the leases were running out and to secure cheaper alternative sites in Malaysia. We commenced to dispose our older properties when the replacement sites became ready for use in FY2015. The sale and leaseback of our properties in Australia was part of this overall plan, and so was the divestment of non-core businesses and unproductive assets as I had told management in FY2014 that we needed to be a leaner Group because times
ANNUAL REPORT 2015
TAT HONG HOLDINGS LTD1 4
26Jun_Tat Hong AR 2015_V.indd 1426Jun_Tat Hong AR 2015_V.indd 14 26/6/15 16:3026/6/15 16:30

are uncertain and we have to trim some fat in order to run a longer race.
I am glad to see that our management team has worked hard and helped to realise almost S$90.0 million cash from divestments and pared down debt, resulting in a much stronger balance sheet. I fi rmly believe that cash fl ow management is very important and thus I am happy to report that the Group has achieved a positive free cash fl ow of S$115.1 million for FY2015 as a result of our prudent working capital management.
What will be your focus for FY2016?
Right-sizing. I think that in some areas we need to grow such as our tower crane rental business in China. However, in other areas, we need to trim down. We have started this right-sizing exercise already last year in Australia where we have taken action in reducing our fl eet, disposing some properties and co-locating our equipment distribution and general equipment rental operations to save cost. We have also disposed our non-core investments and property assets to unlock value in FY2015. However, I believe there’s more to be done and we will continue to look at ways to achieve an optimum size for our operations.
Would you like to elaborate on the Group’s
plans for growing the tower crane rental
business in China?
Our tower crane rental business in China has shown consistent growth in the past few years and even though there is a slowdown in building and construction activities in some sectors, such as the residential and commercial sectors, growth prospects are still very good. There is still a strong pipeline of infrastructure projects such as rail, airport as well as power generation projects, all of which are driven by government spending.
To capitalise on the growth opportunities would require heavy capital commitments. Thus, to
accelerate the growth of our tower crane rental business, we have plans to spin-off this business possibly by way of a listing. This way, the tower crane rental business can directly access more funding options for its growth and expansion.
The theme of the Annual Report is
Consolidating. Does it mean that the
Group will not be making any acquisitions
this year?
We are not totally closed to the idea of acquisitions or investments for growth. Should there be a compelling investment proposition, we will certainly look at it. But the world is an uncertain place today and given the many challenges facing Tat Hong at this point in time, I would rather management concentrate on getting our business right and ensuring that we are able to bring the company to its next lap of growth rather than focusing our attention on an acquisitive or expansionary programme. FY2016 will be a time to consolidate our strengths and improve our operations which will position the Group for the long-run.
How would you describe the Group’s
prospects for FY2016?
The next 12 months will continue to be challenging as we do not see a signifi cant improvement in our Australia businesses, our largest revenue contributor, in the immediate future. As the resources sector is in the doldrums, what could help our business there would be government spending on urban infrastructure but as yet, the Australian government has not announced many major projects. The Singapore market is shrinking due to the slowdown in the construction sector, though there are still infrastructure projects. However, competition is getting tougher and we have to watch our costs. Elsewhere in the region prospects for our crane rental business appear encouraging whilst our tower crane rental business in China will continue its growth momentum.
1 5
26Jun_Tat Hong AR 2015_V.indd 1526Jun_Tat Hong AR 2015_V.indd 15 26/6/15 16:3026/6/15 16:30
OPERATIONS AND FINANCIAL REVIEW
Amidst challenging market conditions, Tat Hong posted an 11% decline in revenue to S$608.6 million whilst operating profi t (excluding impairment charges) remained fl at at S$35.7 million comparable to the net profi t achieved in FY2014. Profi t after tax and minority interests (PATMI) dipped 85% to S$4.9 million due to non-cash goodwill and asset impairment charges of S$30.8 million taken by the Group’s Australian subsidiaries.
F I N A N C I A L P E R F O R M A N C E I N
F Y 2 0 1 5
Refl ecting the weak market conditions in Australia and Singapore, which together account for more than 60% of the Group’s business, total revenue fell 11% to S$608.6 million. Weaker performances were posted by all divisions except the Tower Crane Rental division.
The lower revenue led to a 14% decline in gross profi t to S$212.1 million from S$245.7 million in FY2014, yielding a gross profi t margin of 34.8% compared with 35.9% a year earlier. The slight decrease in gross profi t margin arose from lower utilisation rates in both the Crane Rental and Tower Crane Rental divisions, higher provisions for stock obsolescence in the Distribution division and non-recoverable crane re-positioning costs incurred in Australia.
The Group’s other operating income increased 23% to S$34.5 million primarily from gains from the disposal of properties in Australia and Singapore, disposal of equipment as well as the divestment of the Group’s non-core subsidiaries, Hup Hin Transport and Tat Hong Flo-Line, and an associate, Kian Ho Bearings. In comparison, FY2014 results had included a gain of S$13.0 million from the disposal of purchase rights for a plot of land in Iskandar, Malaysia. The Group also benefi ted from a
foreign exchange gain of S$12.0 million from a weaker Japanese Yen and stronger Renminbi and US Dollar against the Singapore Dollar, compared with a net foreign exchange loss of S$8.4 million recorded in FY2014.
Total operating expenses increased marginally by 1% to S$206.7 million from S$204.8 million due to goodwill and asset impairment charges of S$30.8 million. The goodwill impairment accounting charge relates to a subsidiary in the General Equipment Rental division - North Sheridan Pty Ltd, which was acquired in 2006 at a substantial premium over net asset value. This business was negatively affected in the past two years as a result of the general economic malaise in Australia and a fair value assessment of the business resulted in the need to account for S$20.4 million in goodwill impairment. The asset impairment charges of S$10.4 million relate primarily to the specialised transport units in Australia.
Excluding the impairment charges, operating expenses fell 13% to S$175.9 million arising from cost savings from the disposal of non-core subsidiaries, lower activity levels and better cost management by entities in ASEAN and Australia in the areas of staff costs and repair and maintenance expenses.
The divestment of an associate and weaker performance from the Group’s joint ventures resulted in a 19% decline in contribution from associates and joint ventures, to S$4.4 million compared with S$5.4 million a year earlier.
Resulting from the foregoing, the Group’s profi t before tax fell 62% to S$18.4 million whilst PATMI declined 85% to S$4.9 million. Excluding the non-cash impairment charges and on a comparable basis, net operating profi t after tax for FY2015 was S$35.7 million, similar to that achieved in FY2014.
ANNUAL REPORT 2015
TAT HONG HOLDINGS LTD1 6
26Jun_Tat Hong AR 2015_V.indd 1626Jun_Tat Hong AR 2015_V.indd 16 26/6/15 16:3026/6/15 16:30

S E G M E N T A L R E V I E W
Crane Rental
The Crane Rental division saw a 9% fall in revenue to S$237.6 million as higher revenues from Malaysia and from barge rental activities were insuffi cient to compensate for the decline in contribution from Singapore where revenue was impacted by the completion of projects and the disposal of a subsidiary. Revenue contribution from Malaysia improved on the back of participation in higher value infrastructure and industrial projects such as the Sabah Ammonia and Urea Plant and the fabrication of structures for the Wheatstone LNG project. Thailand and Hong Kong posted similar revenues as the year before from continued participation in long-term projects such as the Bengkruai Power Plant and the EPC project for Ichthys LNG facilities in the former, and the Wan Chai Bypass and the Hong Kong-Macau-Zhuhai Bridge projects in the latter. Revenue contribution from Australia was also stable from continued deployment of its cranes in long-term LNG projects such as the Gorgon, Ichthys and Wheatstone projects.
Gross profi t margin from the Crane Rental division fell marginally by 1% point to 53.0% primarily due to the decline in revenue as well as non-recoverable crane re-positioning costs in Australia.
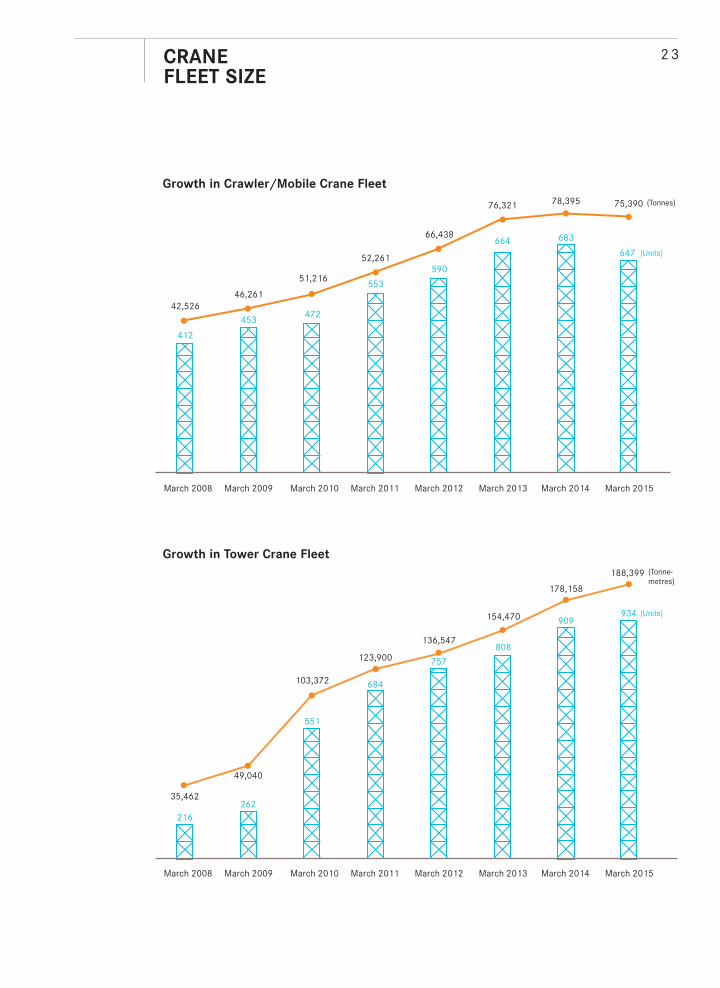
As at 31 March 2015, the Group’s fl eet of crawler and mobile cranes comprised 647 units, 36 units fewer than the previous year due to the disposal of a subsidiary and asset disposals. Utilisation rate on 31 March 2015 was 57% compared with 65% on 31 March 2014 due mainly to the construction slowdown in Singapore and the completion of projects.
Tower Crane Rental
Backed by continued demand from the power generation, infrastructure, industrial and commercial sectors, the Tower Crane Rental division continued to perform well and chalked up an 8% increase in revenue to S$96.6 million. Even though the building momentum is facing a slowdown in some sectors in the People’s Republic of China, our tower crane rental business continued to see good demand for its services as the sectors it serves, largely power generation and infrastructure sectors, are driven by government spending.
Gross profi t margin for the Tower Crane Rental division fell 1.4% points to 25.8% due to higher costs associated with operating a larger fl eet and lower utilisation rates.
At 31 March 2015, the Group’s fl eet of tower cranes comprised 934 units, an increase of 25 units over the previous year. Group’s tower crane fl eet enjoyed a healthy utilisation rate of 70% as at 31 March 2015 which is lower than the 78% recorded at 31 March 2014 due to the completion of projects and the time lag in redeploying the returned cranes to new projects.
General Equipment Rental
The General Equipment Rental division was adversely affected by the overall weak economic conditions in Australia, lower public spending, the lack of infrastructure projects and pricing pressure. As a result, it recorded a 17% slide in revenue to S$55.9 million from S$67.5 million a year ago.
Pricing pressure and low utilisation resulted in a margin compression to 47.3% in FY2015 compared with the margin of 50.3% achieved a year earlier.
1 7
26Jun_Tat Hong AR 2015_V.indd 1726Jun_Tat Hong AR 2015_V.indd 17 26/6/15 16:3026/6/15 16:30

OPERATIONS AND FINANCIAL REVIEW
Distribution
Revenue contribution from the Distribution division fell 18% to S$218.4 million from S$267.0 million posted a year earlier. The fall in revenue contribution was attributable to lower sales of cranes in Singapore and to overseas markets such as Malaysia and Europe. Australia also recorded lower equipment sales due to weak demand. Meanwhile, the Group continued to downsize its excavator sales business in Indonesia which further exacerbated the decline in revenues.
Gross profi t margin for the division fell by 1.7% percentage points to 15.9% primarily due to an increase of S$5.0 million in provisions for stock obsolescence.
U N L O C K I N G VA L U E
Concerted efforts to unlock value from the Group’s non-core assets which commenced in FY2014 continued into FY2015. In total, the Group realised proceeds of S$89.1 million from its divestment programme during the year under review.
Two non-core subsidiaries, 70%-owned Hup Hin Transport Pte Ltd, which provides lorry transport and mobile crane rental services, and 60%-owned Tat Hong Flo-Line Pte Ltd, whose principal activities are in the remanufacturing, repair and testing of hydraulic components were divested for a consideration of S$20.9 million and S$1.5 million, respectively. The Group also divested its entire 31.3% stake in listed company, Kian Ho Bearings Ltd, a stockist and retailer of all kinds of bearings, seals and power transmission belts, raising total proceeds of S$17.2 million.
The major asset disposals comprised four properties in Australia which were disposed on a sale and leaseback basis and a property
at 18 Sungei Kadut Avenue in Singapore which has a remaining lease of seven and a half years. These raised a total of S$31.7 million. Disposal of equipment contributed to the balance of the disposal proceeds.
E F F I C I E N T C A P I T A L
M A N A G E M E N T
Proceeds from the divestment programme were utilised to repay loans and other fi nancial obligations. As a result, net gearing was reduced to 0.77 times at 31 March 2015 compared with 0.87 times a year ago while cash and cash equivalents increased to S$93.3 million from S$58.6 million.
In addition to de-levering the balance sheet, the Group also termed out it loans resulting in a more balanced debt maturity profi le that refl ects the long useful lives of the crane assets. Previously, the Group’s debt maturity profi le was skewed towards short-term loans due to a heavy reliance on hire purchase loans which are usually of 3-year tenor. The Group has since expanded its sources of funds to include a S$100 million 5-year notes which was issued in FY2014 as well as a S$100 syndicated 5-year term loan obtained during the year under review. These facilities enabled the Group to achieve a more balanced debt maturity profi le and to term out its loan repayments up to FY2020.
C A S H F L O W S A N D L I Q U I D I T Y
The Group enjoyed strong cash fl ows from operations in FY2015 of S$141.6 million, S$62.6 million more than the S$79.0 million achieved in FY2014. The improvement arose primarily from better working capital management and lower income taxes. The improved net cash from operations, together with reduced capital expenditure, resulted in free cash fl ow generated of S$115.1 million.
ANNUAL REPORT 2015
TAT HONG HOLDINGS LTD1 8
26Jun_Tat Hong AR 2015_V.indd 1826Jun_Tat Hong AR 2015_V.indd 18 26/6/15 16:3026/6/15 16:30

Net cash infl ows from investing activities totalled S$14.5 million in FY2015, compared with net cash outfl ows of S$103.5 million. The improvement was primarily the result of reduced purchases of property, plant and equipment which declined S$62.8 million to S$78.0 million, increased proceeds from the disposals of non-core assets and businesses of S$45.7 million as well as the repayment of a S$5.6 million loan by a joint venture.
Net cash outfl ows from fi nancing activities totalled S$113.9 million compared with cash infl ows of S$17.0 million in FY2014. Cash outfl ows comprised mainly of the repayment of trust receipts of S$30.2 million, net repayment of fi nance leases of S$60.2 million, the redemption of 11.7 million convertible redeemable preference shares at S$13.5 million as well as dividend and interest payments of S$35.7 million. Cash infl ow comprised mainly of net proceeds from bank loans of S$27.3 million.
S T R O N G E R B A L A N C E S H E E T
Total equity attributable to shareholders fell to S$650.8 million as at 31 March 2015 from S$675.5 million a year earlier due primarily to the reduction in share capital from the redemption of the convertible redeemable preference shares, the depreciation of the Australian Dollar which impacted the Group’s currency translation reserve and dividends declared.
Non-current assets decreased to S$1.0 billion from S$1.1 billion a year ago due primarily to the disposal of subsidiaries and an associate, net foreign exchange translation loss, depreciation and asset impairments, partially offset by equipment purchases, reclassifi cation of inventory into plant, property and equipment as well as the capitalisation of building construction costs. Current assets rose to S$485.1 million from S$473.7 million a
year earlier due primarily to an increase in cash and cash equivalents, partially offset by lower receivables due to the decline in revenues.
Total fi nancial liabilities (current and non-current) comprising fi xed-rate notes, bank loans and fi nance leases fell to S$556.5 million as at 31 March 2015, from S$578.3 million as at 31 March 2014, primarily from the net repayment of fi nancial obligations. This, together with lower deferred tax liabilities and trade and other payables but higher current tax payables, brought total liabilities down to S$795.8 million as at 31 March 2015 from S$846.5 million a year ago.
D I V I S I O N A L O U T L O O K
While demand remains positive in certain markets for the Crane Rental division, weakness in the Singapore and Australia markets will impact performance from this division.
The Tower Crane Rental division is expected to maintain its growth momentum in FY2016 with its strong base of on-going projects and new opportunities in the building, infrastructure, transport and power generation sectors in the People’s Republic of China.
The General Equipment Rental division is expected to turn in a lacklustre performance due to the slow recovery of the Australian construction sector.
Trading conditions for the Distribution division are expected to continue to be challenging due to the generally weak demand for heavy equipment in the region, coupled with the weak Australian economy.
The economic and sector outlooks for the Group’s key markets are expected to remain challenging.
1 9
26Jun_Tat Hong AR 2015_V.indd 1926Jun_Tat Hong AR 2015_V.indd 19 26/6/15 16:3026/6/15 16:30

Crane Rental 59%
Tower Crane Rental 12%
General Equipment
Rental 13%
Distribution 16%
Singapore 17%
Southeast Asia 21%
Australia 46%
China 16%
Crane Rental 39%
Tower Crane Rental 16%
General Equipment
Rental 9%
Distribution 36%
Revenue
By Business
Activity
Revenue
By Regions
Gross
Profi t By
Business
Activity
Turnover
(S$m)Profi t
Before Taxation
(S$m)
Net Profi t Attributable
to Shareholders
(S$m)
11 12 13 14 15 11 12 13 14 15 11 12 13 14 15
584.
2
40.6
26.0
719.
8
58.0 42
.3
836.
9
102.
4
70.4
684.
1
608.
6
49.2
18.4
35.7
4.9
35.8
51.9
FINANCIAL HIGHLIGHTS
48.9
32.8
--- Excluding one-off non-cash impairments of S$3.0m--- Excluding one-off non-cash impairments of S$30.8m
ANNUAL REPORT 2015
TAT HONG HOLDINGS LTD2 0
26Jun_Tat Hong AR 2015_V.indd 2026Jun_Tat Hong AR 2015_V.indd 20 26/6/15 16:3026/6/15 16:30

Gross Profi t Margin Trend (%)
Crane Rental General Equipment Rental Tower Crane Rental Distribution Overall
FY 2011 FY 2012 FY 2013 FY 2014 FY 2015
Shareholders’ Equity
(S$m)Earnings Per Share
(Singapore cents)NAV Per Share
(S$)
518.
9
4.56
0.91
556.
4
7.42
0.98
689.
6
11.6
2
1.08
675.
5
650.
8
5.69
5.67
0.77
1.07
1.03
11 12 13 14 15 11 12 13 14 15 11 12 13 14 15
56.1
19.4
35.7
31.1
49.3
57.4
19.9
24.2
36.5
53.9
59.8
17.3
30.7
37.6
48.8
54.0
17.6
27.2
35.9
50.3
53.0
15.9
25.8
34.8
47.3
5.21
--- Excluding one-off non-cash impairments of S$3.0m--- Excluding one-off non-cash impairments of S$30.8m
2 1
26Jun_Tat Hong AR 2015_V.indd 2126Jun_Tat Hong AR 2015_V.indd 21 26/6/15 16:3026/6/15 16:30

5-YEAR FINANCIAL SUMMARY
FY2015 FY2014 FY2013 FY2012 FY2011
Financial Highlights (S$m)
Revenue 608.6 684.1 836.9 719.8 584.2
Gross profi t 212.1 245.7 314.9 263.0 208.5
Profi t before tax 18.4 48.9 102.4 58.0 40.6
Profi t before tax (excluding one-off impairments)
49.2 51.9 102.4 58.0 40.6
Net profi t attributable to shareholders
4.9 32.8 70.4 42.3 26.0
Net profi t attributable to shareholders (excluding one-off impairments)
35.7 35.8 70.4 42.3 26.0
Balance Sheet (S$m)
Property, plant and equipment
919.3 975.4 905.4 765.5 623.6
Inventories 186.5 186.3 193.7 234.2 200.8
Cash and cash equivalents 93.3 58.6 68.8 76.8 61.8
Debtors 204.7 230.8 250.0 184.8 145.4
Shareholders’ equity 650.8 675.5 689.6 556.4 518.9
Financial ratios
Earnings per share (Singapore cents)
0.77 5.21 11.62 7.42 4.56
Earnings per share excluding one-off impairments (Singapore cents)
5.67 5.69 11.62 7.42 4.56
Net asset value per share (S$) 1.03 1.07 1.08 0.98 0.91
Return on equity (%) 0.7 4.9 10.2 7.6 5.0
Return on equity (excluding one-off impairments) (%)
5.3 5.3 10.2 7.6 5.0
Net gearing (times) 0.77 0.87 0.71 0.79 0.75
Interest cover (times) 5.0 5.7 8.3 6.7 6.9
The number of ordinary shares used in the computation of EPS and NAV per share for FY2014 has been adjusted retrospectively to account for the redemption of 11.7 million convertible redeemable preference shares in FY2015
ANNUAL REPORT 2015
TAT HONG HOLDINGS LTD2 2
26Jun_Tat Hong AR 2015_V.indd 2226Jun_Tat Hong AR 2015_V.indd 22 26/6/15 16:3026/6/15 16:30
CRANE FLEET SIZE
March 2008 March 2009 March 2010 March 2011 March 2012 March 2013 March 2014 March 2015
March 2008 March 2009 March 2010 March 2011 March 2012 March 2013 March 2014 March 2015
412
453472
553
590
664 683
647
Growth in Crawler/Mobile Crane Fleet
Growth in Tower Crane Fleet
35,462
216
49,040
262
103,372
551
123,900
684
136,547
757
808
178,158
188,399
909 934
(Units)
(Units)
42,52646,261
51,216
52,261
66,438
76,321 78,395 75,390 (Tonnes)
(Tonne-metres)
154,470
2 3
26Jun_Tat Hong AR 2015_V.indd 2326Jun_Tat Hong AR 2015_V.indd 23 26/6/15 16:3026/6/15 16:30

BOARD OF DIRECTORS
MR ONG TIEW SIAM MR NG SUN HO TONY
MR MAK LYE MUN DR LEONG HORN KEE MR LOW SEOW JUAN
ANNUAL REPORT 2015
TAT HONG HOLDINGS LTD2 4
26Jun_Tat Hong AR 2015_V.indd 2426Jun_Tat Hong AR 2015_V.indd 24 26/6/15 16:3026/6/15 16:30

MR TAN CHOK KIANMR NG SANG KUEY MICHAEL
MR TSE PO SHING ANDYMR NG SAN TIONG ROLAND
2 5
26Jun_Tat Hong AR 2015_V.indd 2526Jun_Tat Hong AR 2015_V.indd 25 26/6/15 16:3026/6/15 16:30

BOARD OF DIRECTORS
M R T A N C H O K K I A NNon-Executive and Independent ChairmanMr Tan Chok Kian was appointed as a Non-Executive Chairman on 29 July 1997 and was last re-appointed as an Independent Chairman on 25 July 2014. As the Chairman of the Board, Mr Tan approves the Group’s overall policies and strategic plans. In addition, he is also the Chairman of the Nominating Committee. Mr Tan has served in various senior appointments in the Singapore civil service from 1956 until his retirement in 1986 including the positions of Permanent Secretary in the Ministry of Finance and other Ministries. He also served as the Chairman of the Central Provident Fund Board, Director-General of Nanyang University and Chairman of the Post Office Savings Bank of Singapore.
Current directorships in other listed companies: Nil
M R N G S A N T I O N G R O L A N DManaging DirectorMr Roland Ng joined the Group in 1979 and has been its Managing Director since 25 October 1991. He was last re-appointed as a Director on 26 July 2013. With some 35 years of experience in the heavy equipment and plant hiring business, Mr Ng has overall responsibility for the Group including strategy formulation, the development of new businesses and potential acquisitions in the region. Mr Ng sits on the board of several SGX-listed companies and is also the Vice-President of the Singapore Chinese Chamber of Commerce and Industry (SCCCI), a member of the Board of Directors of Business China and a member of the Board of Trustees of the Chinese Development and Assistance Council (CDAC).
Mr Ng holds a Bachelor of Science (Honours) degree from Loughborough University, United Kingdom. He was awarded the Pingat Bakti Masyarakat (Public Service Medal) in 2002 and the Bintang Bakti Masyarakat (Public Service Star) in 2010 by the President of the Republic of Singapore.
Current directorships in other listed companies: INTRACO Limited, Yongmao Holdings Limited, CSC Holdings Ltd.
D R L E O N G H O R N K E ENon-Executive and Independent DirectorDr Leong Horn Kee was appointed as a Non-Executive Director on 19 January 2001 and was last re-appointed as an Independent
Director on 26 July 2013. He is the Chairman of CapitalCorp Partners Pte Ltd, a boutique financial advisory firm. Dr Leong has experience in the public sector in economic planning, trade and investments, and in the private sector in corporate finance, venture capital, merchant banking, hotels, property development and management. He served as a Member of Parliament for 22 years from 1984 to 2006. Dr Leong is currently Singapore’s Non-Resident High Commissioner to Cyprus and a member of the Securities Industry Council. Dr Leong holds a degree (Honours) in Production Engineering from Loughborough University, UK, a degree (Honours) in Economics from the University of London, UK, a degree in Chinese Language and Literature from Beijing Normal University, MBA from INSEAD, France as well as a Master in Business Research and a Doctorate in Business Administration from University of Western Australia.
Current directorships in other listed companies: Amtek Limited, IGG Inc, Wilmar International Ltd.
Directorships in management companies of listed REITs: SPH REIT Management Pte Ltd, Viva Industrial Trust Management Pte Ltd
M R L O W S E O W J U A NNon-Executive and Independent DirectorMr Low Seow Juan was appointed as a Non-Executive Director on 25 January 2006 and was last re-appointed as an Independent Director on 27 July 2012. He is the Chairman of Pinetree Capital Partners Pte Ltd, a Singapore venture capital fund company. Mr Low started his working career with the Singapore Public Works Department, Morgan Grenfell (Asia) Limited and the Singapore Economic Development Board heading the Aerospace, Medical Optical Division.
Mr Low holds a Master of Business Administration from the National University of Singapore, a Bachelor of Law degree from the University of London and a Bachelor Degree in Electrical Engineering from Monash University, Australia.
Current directorships in other listed companies: Amtek Engineering Limited.
M R M A K L Y E M U NNon-Executive and Independent DirectorMr Mak Lye Mun was appointed as a Non-Executive Director on 1 June 2005 and was
ANNUAL REPORT 2015
TAT HONG HOLDINGS LTD2 6
15_0126 Tat Hong AR 2015 FA03.indd 26 29/6/15 10:34 am

last re-appointed as an Independent Director on 25 July 2014. He is the Country Head and CEO of CIMB Bank Singapore. In addition to these roles, his portfolio was further expanded in 2013 to include the oversight of CIMB Group’s Private Banking business within the region. He is also a Non-Executive Director of CIMB Securities Pte Ltd, CIMB Securities International Pte Ltd and Boardroom Limited. He holds a Bachelor of Civil Engineering (First Class Honours) degree from the University of Malaya in Malaysia and a Master of Business Administration degree from the University of Texas at Austin, USA. Mr Mak is a qualified Chartered Financial Analyst.
Current directorships in other listed companies: Boardroom Limited.
M R N G S U N H O T O N YDeputy Managing DirectorMr Tony Ng joined the Group in 1975. He was appointed as an Executive Director on 2 November 1991 and was last re-appointed on 27 July 2012. Mr Ng is the Group’s Deputy Managing Director and also holds the position of CEO ASEAN I and is responsible for the Group’s operations in Singapore (Crane Rental), Indonesia, Vietnam and Papua New Guinea. He has more than 35 years of experience in the heavy equipment and plant hire businesses.
Besides managing the Group’s business portfolio in Singapore and the region, Mr Ng is also responsible for identifying and exploring new business opportunities and markets for the Group. He has built and maintained strong relationships with key heavy equipment manufacturers.
Current directorships in other listed companies: Nil
M R N G S A N G K U E Y M I C H A E LExecutive DirectorMr Michael Ng joined the Group in 1977 and was appointed as an Executive Director on 1 October 1996. He was last re-appointed on 25 July 2014. Together with the Deputy Managing Director, Mr Ng oversees the Group’s extensive Asia (ex-China) businesses and operations portfolio with a focus on Malaysia, Thailand, Hong Kong and Batam. He is also responsible for the offshore and marine business segments as well sales and purchasing functions for the Singapore office.
Mr Ng has spent most of his working years in the heavy equipment industry, especially in the cranes sector, and has built strong relationships and network with clients, major suppliers and crane manufacturers.
Current directorships in other listed companies: Nil
M R O N G T I E W S I A MNon-Executive and Independent DirectorMr Ong Tiew Siam was appointed as a Non-Executive Director on 1 September 1999 and was last re-appointed as an Independent Director on 27 July 2012. He has more than 34 years of experience in finance, accounting and administration in various industries. He is a fellow member of the Institute of Singapore Chartered Accountants and a member of the Singapore Institute of Directors. He also sits on the board of several SGX-listed companies. Mr Ong holds a Bachelor of Commerce (Accountancy)(Honours) degree from the former Nanyang University.
Current directorships in other listed companies: Fung Choi Media Group Limited, Design Studio Group Ltd, Valuetronics Holdings Ltd.
M R T S E P O S H I N G A N D YNon-Executive and Non-Independent DirectorMr Andy Tse joined the Board as a Non-Executive Director on 22 October 2009 and was last re-appointed as a Non-Independent Director on 29 July 2013. He is a Managing Director at AIF Capital Limited (“AIF Capital”) and has accumulated some 20 years of private equity experience in Asia, including Korea, Japan, China, Hong Kong, Singapore, the Philippines, Indonesia, Australia, Sri Lanka, India and Thailand. Having been with AIF Capital since 1994, Mr Tse has led investments in transportation, logistics and manufacturing and represents AIF Capital on the boards of various portfolio companies. Prior to AIF Capital, Mr Tse worked with Hopewell Holdings Limited and was involved in the investment, development, financing, construction and operations of infrastructure projects amongst others. He holds a Bachelor of Science and MBA from the Chinese University of Hong Kong and is also a CFA charterholder.
Current directorships in other listed companies: Nirvana Asia Ltd, Tai-I Electric Wire & Cable Co., Ltd.
2 7
15_0126 Tat Hong AR 2015 FA03.indd 27 29/6/15 10:34 am

KEY MANAGEMENT
M R N G S A N T I O N G R O L A N D
Group Chief Executive Offi cer
Mr Roland Ng graduated from Loughborough University, United Kingdom with a Bachelor of Science degree in 1976 and started his career with Jurong Town Corporation as a Civil Engineer in the same year. Mr Ng joined Tat Hong in 1979 and was appointed Group Chief Executive Offi cer in 1991. Under his stewardship, the Group has grown into one of the largest crane rental companies in the world.
With some 35 years of experience in the heavy equipment and plant hiring business, Mr Ng bears overall responsibility for the Group as well as strategy formulation, corporate planning, business development and potential acquisitions. He also oversees the Group’s business operations in Australia, the tower crane rental business in China as well as the Group’s investments.
Mr Ng is the Vice-President of the Singapore Chinese Chamber of Commerce & Industry (SCCCI), a member of the Board of Directors of Business China and a member of the Board of Trustees of the Chinese Development Assistance Council (CDAC). He also serves on the boards of several listed companies.
Mr Ng has been actively involved in various charity work for the past 10 years. In 2002, he was awarded the Pingkat Bakti Masyarakat (Public Service Medal) and in 2010, the Bintang Bakti Masyarakat (Public Service Medal) by the President of the Republic of Singapore.
M R L I O N A L T S E N G
Group Chief Financial Offi cer, Joint Company Secretary and Head Of Corporate
Mr Lional Tseng, CA, is the Group Chief Financial Offi cer, Joint Company Secretary and Head of Corporate. He has overall responsibility for the Group’s fi nancial and other corporate functions, including corporate fi nance, fi nancial reporting, treasury management, taxation, risk management, corporate secretarial matters and investor relations.
Mr Tseng has more than 35 years of experience in corporate fi nance, tax and treasury management in diverse businesses including real estate development and construction, IT, architectural and engineering consulting, and international trading. He has held senior executive positions and directorships in large groups of companies and has undertaken major corporate fi nancial and M & A transactions in Singapore, various ASEAN countries, India, China and USA.
Mr Tseng holds a Bachelor of Accountancy degree from the University of Singapore and sits on the boards of a number of Voluntary Welfare Organisations, chairs their audit committees and had also served as a member of the audit committee of a statutory board.
M R N G S U N H O T O N Y
CEO ASEAN I - Singapore (Crane Rental And Heavy Lift), Indonesia, Vietnam and Papua New Guinea
Mr Tony Ng is the CEO ASEAN I and is responsible for the Group’s operations in Singapore (Crane Rental and Heavy Lift), Indonesia, Vietnam and Papua New Guinea.
ANNUAL REPORT 2015
TAT HONG HOLDINGS LTD2 8
26Jun_Tat Hong AR 2015_V.indd 2826Jun_Tat Hong AR 2015_V.indd 28 26/6/15 16:3026/6/15 16:30

Mr Ng maintains strong relationships with key heavy equipment manufacturers and through his network, explores and identifi es new opportunities for the Group’s expansion in the respective markets.
Mr Ng has more than 35 years’ experience in the heavy equipment and plant hiring business.
M R N G S A N G K U E Y M I C H A E L
CEO ASEAN II - Singapore (Distribution And Marine), Malaysia, Thailand and Hong Kong
Mr Michael Ng is the CEO ASEAN II and is responsible for overseeing the Group’s operations in Singapore (Distribution and Marine), Malaysia, Batam, Thailand, and Hong Kong. In Singapore, Mr Ng is responsible for equipment sales, transportation and logistics as well as the offshore and marine segments. He also oversees the sales and purchasing functions for the Singapore offi ce.
Mr Ng has spent most of his career in the heavy equipment industry, especially in the crane sector, and has built strong relationships and networks with clients, major equipment suppliers and crane manufacturers.
M R N G C H E N W E I
Managing Director, Tutt Bryant Group LimitedCEO - Australia
Mr Ng Chen Wei was appointed Managing Director of Tutt Bryant Group Limited (TBG) on 1 July 2013. He has overall responsibility for TBG’s operational and fi nancial performance as well as strategy formulation.
Mr Ng joined TBG in July 2009 as an executive director responsible for driving business development, M&As, business planning and implementing strategies across TBG’s existing operations. Prior to joining TBG, he worked for over seven years with ABN AMRO where he last held the position of Director, Structured Finance and was involved in a variety of project fi nance and advisory transactions across a range of industries including infrastructure, power and utilities, and natural resources.
Mr Ng holds a Bachelor of Commerce (Honours) degree from the University of Western Australia, and is a CFA charterholder as well as a graduate of the Australian Institute of Company Directors.
M R YA U K O K S A N S E A N
Senior Vice PresidentHead Of Corporate - China
Mr Sean Yau is the Senior Vice President and Head of Corporate – China. He has more than 10 years’ experience in the areas of corporate fi nance and venture capitalism in China.
Mr Yau began his career in 1987 as an engineer with Singapore Technologies and moved on to Vertex, the venture capital arm of Singapore Technologies, as an investment manager. Thereafter, he was the Finance Director in a technology start-up company. Prior to joining the Group, Mr Yau was a consultant providing corporate fi nance advisory to Chinese companies.
Mr Yau holds a Master of Business Administration from the National University of Singapore and a First Class Honours degree in Engineering from Nanyang Technological University (Singapore).
2 9
26Jun_Tat Hong AR 2015_V.indd 2926Jun_Tat Hong AR 2015_V.indd 29 26/6/15 16:3026/6/15 16:30

INVESTORRELATIONS
Tat Hong Holdings’ investor relations practices are grounded on the basic tenets of fairness and timeliness. In this spirit, we are fully committed to ensuring that important, balanced and relevant information on the Group is disseminated in a fair and timely manner via the SGXNet so as to assist the investing community in making informed decisions regarding their investments in the Company.
In addition, we hold regular dialogues with fund managers, analysts, media and shareholders to keep them abreast of developments within the Group and also to answer questions that stakeholders may have on the Group’s performance and operations.
C O M M U N I C A T I O N W I T H
I N V E S T O R S
The Group employs a variety of channels to communicate with shareholders and the investing community. These include one-on-one meetings, conference calls, briefi ngs, presentations and postings on SGXNet and our website.
All material information is released timely via the SGXNet and these announcements are also made available on the Investor Relations webpage of the Group’s website at: www.tathong.com/th_investor. Our website also contains comprehensive description of the Group’s business and links to related information.
During the year under review, we met or spoke to about 100 institutional investors, analysts and journalists in one-on-one or group meetings or conference calls. The Group also conducted two results briefi ngs during the year for the media and analysts following the release of the half-year and full year results.
A dedicated IR site is maintained on our website where the investing community can access the latest news and fi nancial information on the Group. Email and telephone contact numbers are also available on the IR page so that shareholders and investors can contact the Group’s investor relations staff directly. During Annual General Meetings, ample time is set aside for shareholders to ask questions or seek clarifi cation from the management or the Board.
S H A R E H O L D E R R E T U R N S
We strive to offer shareholders a fair return on their investment in Tat Hong. We are proposing a total dividend of 1.5 Singapore cents per share for FY2015 comprising 0.5 Singapore cents interim dividend which was paid out on 9 December 2014 and 1.0 Singapore cent fi nal dividend which is subject to shareholders’ approval at the Annual General Meeting to be held on 29 July 2015.
ANNUAL REPORT 2015
TAT HONG HOLDINGS LTD3 0
26Jun_Tat Hong AR 2015_V.indd 3026Jun_Tat Hong AR 2015_V.indd 30 26/6/15 16:3026/6/15 16:30

Tat Hong’s shares traded between S$0.66 and S$0.91 during the period 1 April 2014 to 31 March 2015 with an average daily volume of 0.36 million shares.
Tat Hong’s market capitalisation, based on its closing share price on 31 March 2015 of S$0.66, was S$478.7 million.
Share Price Performance
Ownership Distribution
by Geography
AS AT 31 MARCH 2015
Distribution of Holdings
by Types of Investors
AS AT 31 MARCH 2015
Volume (M)
3.5
3.0
2.5
2.0
1.5
1.0
0.5
0.0
0.96
0.87
0.79
0.71
0.63
Share Price ($)
Volume Period average volume Share price
■ Singapore 60.0%■ Unidentifi ed holdings 27.3%■ Asia (ex Singapore) 9.4%■ North America 1.3%■ Rest of the world 1.0%■ UK + Europe 1.0%
■ Chwee Cheng & Sons Pte Ltd and related parties 56.6%
■ Private Stakeholders 27.3%■ Institutions 15.2%■ Corporate Stakeholders 0.4%■ Others 0.5%
02 A
pr 1
4
30 A
pr 1
4
28 M
ay 1
4
25 Ju
n 14
23 Ju
l 14
20 A
ug 1
4
17 S
ep 1
4
15 O
ct 1
4
12 N
ov 1
4
10 D
ec 1
4
07 Ja
n 15
04 F
eb 1
5
04 M
ar 1
5
3 1
26Jun_Tat Hong AR 2015_V.indd 3126Jun_Tat Hong AR 2015_V.indd 31 26/6/15 16:3026/6/15 16:30

CORPORATERESPONSIBILITY
As a responsible corporate citizen, the Group is committed to conducting its business with integrity and in a sustainable manner that is also responsive to the changing economic, social, governance and environmental conditions.
In growing our business, we are committed to:
1) Providing safe and high quality products and services to our customers
2) Being a fair employer and providing a safe working environment for our employees
3) Minimising the negative impact of our operations on the environment
4) Caring for the wider community
The Group has physical presence and operations in Singapore, Australia, China, Malaysia, Thailand, Indonesia, Vietnam and Hong Kong. It also has a 50% joint venture in Papua New Guinea and a 40% joint venture in Myanmar.
The Group’s operations are at different levels of maturity across markets that are at different stages of economic development. Some operations are currently not of a material size. The focus of this report is therefore on the main operating subsidiaries in Singapore* and wholly-owned subsidiary group in Australia, the Tutt Bryant Group (TBG), which together account for about 63% of the Group’s total revenue in FY2015. All subsidiaries abide with Group policies and comply with the laws of their respective jurisdictions.
E M P L O Y E E S
The Group has a strict policy against the hiring of child or forced labour and its HR practices, in particular the philosophy of fair employment and compliance with the labour laws, are practiced across all the geographical locations where the Group operates.
As an equal opportunity employer, the Group employs staff based on education, knowledge, skills, experience and competence. It does not discriminate against gender, race or religion.
Despite its fair hiring practices, the Group tends to be male-dominated with the ratio of male to female employees across the Group at 85% : 15%. This is attributable to the fact that due to the nature of its business, the Group employs a large number of engineers, crane operators, riggers and other technical and operations personnel who are involved in physically-demanding jobs. In addition, the harsh working environments at worksites and in workshops do not appeal to the female gender.
The Group has 4,240 employees as at 31 March 2015.
Distribution of Employees by Geography
■■ Singapore 11.2%■ Australia 13.4%■ China 57.9%■ Southeast Asia + Hong Kong 17.5%
* The main operating subsidiaries refer to Tat Hong HeavyEquipment Pte Ltd and Tat Hong Plant Leasing Pte Ltd.
ANNUAL REPORT 2015
TAT HONG HOLDINGS LTD3 2
26Jun_Tat Hong AR 2015_V.indd 3226Jun_Tat Hong AR 2015_V.indd 32 26/6/15 16:3026/6/15 16:30

People Development
The Group places strong emphasis not only in recruiting people with the right skills and experience but also in the continuous development of its human resources so as to constantly improve the quality of solutions and services that are provided to our customers. The Group values the experience and capability of each and every staff member, on whom it depends for the timely delivery of complex lifting solutions and heavy equipment, and is committed to equipping and upgrading the skills and knowledge of its employees to enable them to continuously improve their performance.
Our employees undergo various types of training. For the employees engaged in crane operations, vocational and supervisory skills training include on-the-job training and training conducted by third party service providers. Executives and managerial staff undergo training related to their jobs as well as those related to improving leadership and management skills.
In Singapore, a total of 264 employees (55% of the local workforce) attended various types of training. Total training costs for the year amounted to S$168,000 before government subsidies. A total of 446 training places, which translates into an average of approximately one training place per employee, were made available during the year for courses in construction safety, occupational health and safety, work at height, crane operations, cyber security, fi nance and accounting, risk management and other vocational courses.
In Australia about S$150,000 was spent on various types of training programmes including induction programmes, workshop and technical courses, formal qualifi cations and professional/executive development.
The Group also operates the Tat Hong Training Centre which conducts crane operations safety, quality management and related courses for our staff and for external parties.
Staff Welfare
In addition to fair wages, the employees also enjoy medical and other benefi ts that are in line with market practices in the country of operation. In Singapore, staff welfare is also promoted through the signifi cantly subsidised Recreation Club which is run by employee representatives. During the 12-month reporting period, the Recreation Club organised a series of activities for the staff including a nature walk, a bowling tournament and a tour to Malaysia amongst other activities and staff volunteerism projects.
In Australia, TBG employees are provided with benefi ts including income protection insurance, employee assistance programme, employee discount scheme as well as free fl u vaccination. Social clubs across TBG also organise activities for their respective employees.
Diverse activities were organised across the Group’s operations in the area of staff welfare including promotion of healthy lifestyle, sports events, family days and celebration of local festivities, etc.
3 3
26Jun_Tat Hong AR 2015_V.indd 3326Jun_Tat Hong AR 2015_V.indd 33 26/6/15 16:3026/6/15 16:30

CORPORATERESPONSIBILITY
Employee Communication
The Group employs a wide spectrum of tools and channels in its constant communication with its employees. Letters, fl yers, posters, emails, the intranet and staff meetings are used to communicate general messages such as policy changes, announcements, safety messages as well as social and recreational information. In addition to the above, specifi c communication for target groups such as safety reviews, changes in work procedures, etc., are communicated at toolbox or staff meetings.
Q U A L I T Y , H E A L T H A N D S A F E T Y
The Group believes that the best way it can serve its customers and create value for stakeholders is through the provision of quality products and services with a particular emphasis on safety.
Whilst activities and practices across the Group’s operations in different countries may vary depending on the business culture and operating constraints, the commitment to quality and safety remains unchanged. Due to their dominance with regard to their contribution to the Group’s performance, many of the parameters in this report refer to the practices in Singapore and Australia.
Health & Safety
Our main operating subsidiaries in Singapore which are involved in the distribution of cranes and heavy equipment and the provision of crane rental services – Tat Hong HeavyEquipment (Pte) Ltd (THHE) and Tat Hong Plant Leasing Pte Ltd (THPL) - are both certifi ed to ISO9001 and ISO18001. In addition, THPL is also certifi ed to ISO14001. Two of our Australian subsidiaries, Tutt Bryant Equipment Pty Ltd (TBE) and North Sheridan Pty Ltd (NS) are certifi ed to ISO9001. THHE and THPL have also been awarded the bizSAFE Star award by Workplace Health and Safety Council in Singapore for achieving the highest level in meeting required safety and health standards.
Whilst TBG’s operations have not been externally certifi ed (except for subsidiaries which are certifi ed to ISO9001), their systems and processes are developed to comply with espoused philosophy and principles of Australian and/or international standards. For example, its risk management programme incorporates the philosophy and principles advocated within ISO 31000, its health and safety programme is developed within the AS/NZS 4801 and OHSAS 18001 standards and the environmental programme is consistent with the principles contained in ISO 14001. Work health safety and environment (WHSE) audits are also conducted annually.
Certification
Name of subsidiary ISO9001 ISO14001 ISO18001 Other
certifi cation
Tat Hong HeavyEquipment (Pte) Ltd (THHE) N.A bizSAFE Star
Tat Hong Plant Leasing Pte Ltd (THPL) bizSAFE Star
Tutt Bryant Equipment Pty Ltd
North Sheridan Pty Ltd
Notes:
1. ISO 14001 is not applicable to Tat Hong HeavyEquipment (Pte) Ltd as its principal business activities is the trading of new and used cranes and other heavy equipment.
2. bizSAFE Star awarded by the Workplace Health and Safety Council in Singapore for companies which have been certifi ed by recognised auditors for meeting required safety and health standards
ANNUAL REPORT 2015
TAT HONG HOLDINGS LTD3 4
26Jun_Tat Hong AR 2015_V.indd 3426Jun_Tat Hong AR 2015_V.indd 34 26/6/15 16:3026/6/15 16:30

For effective management of WHSE issues in Australia, TBG has put in place the Safety, Risk and Claims Management solution, a software solution which captures WHSE data and ensures timely reporting of incidents to TBG management and compliance with legislative requirements. In addition, a comprehensive “Injury Management” software solution has also been implemented to improve management oversight of workers’ compensation claims and enable early intervention in cases where injury management and workers’ compensations are off-track.
During the year under review, our operations in Malaysia, Tat Hong Plant Hire Sdn Bhd received an award for “Excellence in HSE Performance” from Sapura Kencana Petroleum Berhad for our excellent services provided for the Wheatstone LNG Load-out Project.
Safety issues are continually emphasised in toolbox meetings in Singapore. Toolbox meetings for each workgroup are held on a daily basis and once a week for all workers of THPL and THHE. In addition to toolbox meetings, TBG also organises an annual safety week and the theme for FY2015 was “Getting Back to Basics” which sought to reinforce safety consciousness and safe practice across all aspects of its operations. During the week, all branches took time to review operations to make it safer for workers, identify hazards and implement or reassess control measures. The campaign
also focused on communications ensuring that TBG’s WHSE Policies have been communicated to everyone and that workers are aware of their HSE responsibilities. TBG has also implemented the “bullying and harassment program” across the Australian operations to protect its employees from workforce bullying and harassment.
Our workers in Singapore are generally not exposed to loud noises in the course of their work however those who are exposed undergo annual audiometric tests and those exposed to paint, solvent and other skin irritants undergo lead test every six months. In Australia, the employees are generally not exposed to excessive noise levels whilst employees who are exposed to paints and solvents undergo regular test for contact dermatitis. As all activities are subject to safety analysis, exposure to skin irritants, if any, is minor in nature. During the year under review, there were no reported cases of hearing loss, skin irritation or dermatitis in both Singapore and Australia.
No major accidents or incidents have been reported in our operations in the past 12 months. There were however, occurrences of minor injuries such as cuts, burns, abrasions, sprains, etc. The incidents have been investigated, work procedures reviews and measures implemented to prevent recurrence. Improvements to work procedures have also been communicated during toolbox meetings.
Safety Statistics
Singapore Australia
Accident rate per million man hours worked
10.1 12.6
Total man days lost to accidents
289 502
Man days lost to accidents as a percentage of total man days worked
0.03% 0.34%
3 5
26Jun_Tat Hong AR 2015_V.indd 3526Jun_Tat Hong AR 2015_V.indd 35 26/6/15 16:3026/6/15 16:30

CORPORATERESPONSIBILITY
E N V I R O N M E N T
The Group is committed to managing its operations with the objective of minimising its impact on the environment.
One possible source of environmental pollution arising from our operations is carbon dioxide emission from our fl eet of crawler and mobile cranes, transportation assets and general equipment such as excavators, compaction machines, etc. The transportation of our crawler, mobile and tower cranes to and from sites also contributes to our carbon footprint.
The Group complies with existing regulations governing emission control with regard to the operations of our cranes and transportation fl eet in the countries where we operate. For example, in Singapore, all mobile and crawler cranes imported after 1 July 2012 for use in the country comply with US Tier II, EU Stage II or Japan Tier II emission standards. In Australia, all equipment meet or exceed current emission standards.
TBG’s operations in Australia are not subject to any particular or signifi cant environment regulation under the Commonwealth or State legislation. To meet the general environmental obligations, TBG has in place a detailed environmental management system that is consistent with the requirements of the AS/NZS 14001.
There is potential for small spillage of fuel during refi lling at our various depots or from plant and equipment that are being serviced in our workshops or customers’ work site. Operating procedures have been put in place and workers have been trained in the prevention of spills as well as the proper clean-up process.
Additional initiatives taken to preserve the environment include the recycling of paper, the recycling of waste oils, photocopying on both sides of the paper and water conservation.
No environmental breaches have been cited by the relevant government agencies in Singapore and Australia in FY2015.
C O M M U N I T Y
The Group has a long-standing tradition of caring for the community. Our corporate philanthropic efforts support a variety of causes that benefi t wide-ranging members of the community who need assistance.
In Singapore, the Group supports various causes ranging from education, healthcare, the arts and care for the aged and the underprivileged through donations and sponsorships. In FY2015, the Group made donations and sponsorships totaling more than S$200,000 to non-profi t organisations and charities such as ChildAid, Chung Hwa Medical Institution, Chinese Development and Assistance Council, Breast Cancer Foundation and NUS Business School Undergraduate Bursary.
Our overseas subsidiaries also played their part in contributing to the community in which they operate. TGB supported wide ranging causes in Australia through sponsorships and donations to schools, volunteer fi re brigades, etc. Its employees also volunteer their time with various non-profi t organsations such as local bush fi re brigades and state emergency services. One of its subsidiaries also participated in a programme which provides employment to low level offenders on day release.
In China, donations of RMB30,000 were made to homes for the aged and poor children, in Malaysia, a donation of RM20,000 was made to fl ood victims whilst in Indonesia donations of Rp35 million were made to an orphanage and a mosque.
ANNUAL REPORT 2015
TAT HONG HOLDINGS LTD3 6
26Jun_Tat Hong AR 2015_V.indd 3626Jun_Tat Hong AR 2015_V.indd 36 26/6/15 16:3026/6/15 16:30

F R E E G R O C E R I E S P R O J E C T
In January 2014, Tat Hong initiated the bi-annual “Free Groceries” Corporate Social Responsibility (CSR) Project where the Company provides free groceries to needy families living in rented flats in Toa Payoh. In FY2015, we continued this tradition and helped more than 500 low-income families in Toa Payoh.
The two Free Groceries CSR events, the third and fourth such events, were held on 4 October 2014 for residents of Blocks 160 and 161 and on 7 February 2015 for residents of Blocks 53, 54 and 58 in Toa Payoh. On both occasions, residents were able to select
$50 worth of groceries and daily necessities which were brought literally to the foot of the residents’ flats for their selection. Such items included rice, sugar, noodles, milk, canned food, cooking oil, detergent, etc.
More than 100 staff members volunteered their time over the two Saturdays on which the Free Groceries events were held to help in organising the event and assist the residents in bringing their groceries home.
The Free Groceries CSR Project is just one of the many ways that the Tat Hong Group gives back to the community.
3 7
15_0126 Tat Hong AR 2015 FA03.indd 37 29/6/15 10:34 am

KEY MILESTONES
1997
Listed on the Australian Securities Exchange (ASX)
2000
Secondary listing on the SGX Mainboard
2001
Established joint venture company, BT Equipment, with PSL Industries
2002
Placement of 40 million new shares at S$0.30 per share
2004
February
Private placement of 50 million new shares at S$0.56 per share
December
Acquired Kingston Industries, a leading Australian plant hire and haulage company
2005
April
Conversion of Secondary to Primary Listing on the SGX Mainboard
August
Established a joint venture with Fushun Yongmao to enter tower crane rental business in China
November
Delisted Tat Hong from the ASX
December
Listed Australian subsidiary, Tutt Bryant Group Limited (TBG), on the ASX
2006
September
Established a joint venture company, Shanghai Tat Hong Equipment Rental Co., Ltd
December
Acquired Queensland-based equipment hire company, North Sheridan, through TBG
2007
February
Acquired Hunter Valley-based Muswellbrook Crane Services through TBG
April
Placement of 40 million new shares at S$1.46 per share
May
Established 100%-owned Tat Hong Equipment (China) Pte Ltd as an investment holding company for the Group’s subsidiaries in China
June
Established China Nuclear Huaxing Tat Hong Machinery Construction Co., Ltd
July
Established Zhongjian Tat Hong Equipment Rental Co., Ltd. Renamed to Jiangsu Zhongjian Tat Hong Machinery Construction Co; Ltd Incorporation of PT Tat Hong Batam
December
Acquired assets of Melbourne-based Bradshaw Ultra Heavy Haulage through TBG
2008
February
Listing of Yongmao Holdings Limited (24%-held associate)
April
Acquired Townsville-based Paramount Hire through North Sheridan, a subsidiary of TBG
May
Acquired Caradel Hire through Kingston Industries, a subsidiary of TBG
June
Issued 50,662,673 bonus warrants
2009
October
Issued 65 million convertible redeemable preference shares at S$1.00 per share to AIF Capital
2010
June
Incorporated joint-venture investment holding company in China, Tat Hong Zhaomao Investment Co., Ltd, with Fushun Yongmao
October
Completed privatisation and subsequent delisting of TBG from the ASX
December
Acquired 70% stake in Hup Hin Transport Co Pte Ltd
ANNUAL REPORT 2015
TAT HONG HOLDINGS LTD3 8
26Jun_Tat Hong AR 2015_V.indd 3826Jun_Tat Hong AR 2015_V.indd 38 26/6/15 16:3026/6/15 16:30
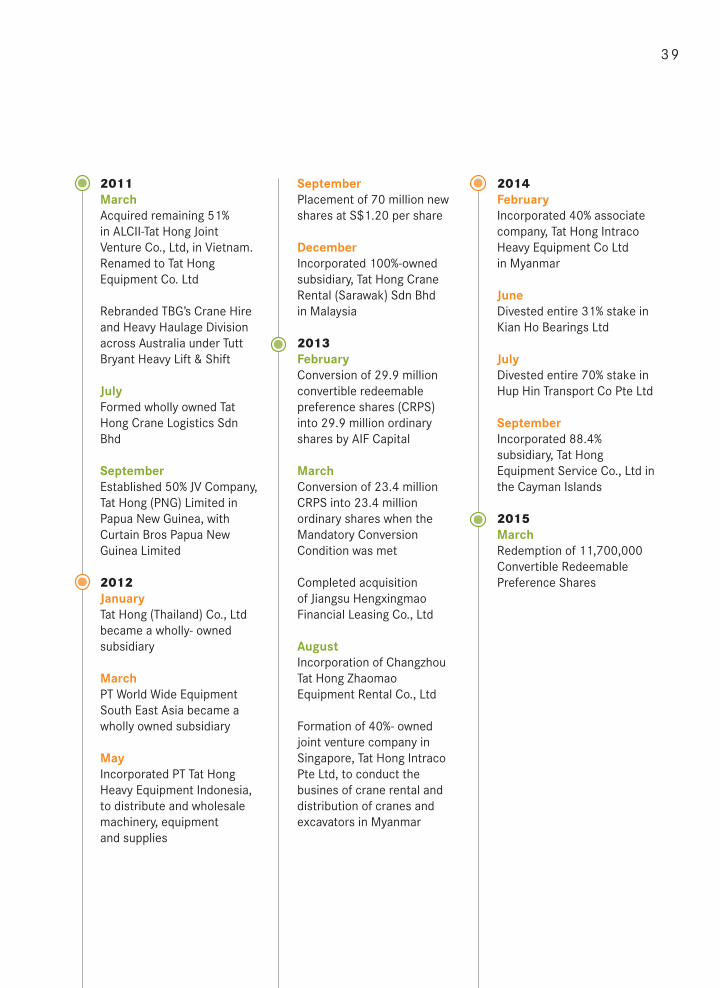
2011
March
Acquired remaining 51% in ALCII-Tat Hong Joint Venture Co., Ltd, in Vietnam. Renamed to Tat Hong Equipment Co. Ltd
Rebranded TBG’s Crane Hire and Heavy Haulage Division across Australia under Tutt Bryant Heavy Lift & Shift
July
Formed wholly owned Tat Hong Crane Logistics Sdn Bhd
September
Established 50% JV Company, Tat Hong (PNG) Limited in Papua New Guinea, with Curtain Bros Papua New Guinea Limited
2012
January
Tat Hong (Thailand) Co., Ltd became a wholly- owned subsidiary
March
PT World Wide Equipment South East Asia became a wholly owned subsidiary
May
Incorporated PT Tat Hong Heavy Equipment Indonesia, to distribute and wholesale machinery, equipment and supplies
September
Placement of 70 million new shares at S$1.20 per share
December
Incorporated 100%-owned subsidiary, Tat Hong Crane Rental (Sarawak) Sdn Bhd in Malaysia
2013
February
Conversion of 29.9 million convertible redeemable preference shares (CRPS) into 29.9 million ordinary shares by AIF Capital
March
Conversion of 23.4 million CRPS into 23.4 million ordinary shares when the Mandatory Conversion Condition was met
Completed acquisition of Jiangsu Hengxingmao Financial Leasing Co., Ltd
August
Incorporation of Changzhou Tat Hong Zhaomao Equipment Rental Co., Ltd
Formation of 40%- owned joint venture company in Singapore, Tat Hong Intraco Pte Ltd, to conduct the busines of crane rental and distribution of cranes and excavators in Myanmar
2014
February
Incorporated 40% associate company, Tat Hong Intraco Heavy Equipment Co Ltd in Myanmar
June
Divested entire 31% stake in Kian Ho Bearings Ltd
July
Divested entire 70% stake in Hup Hin Transport Co Pte Ltd
September
Incorporated 88.4% subsidiary, Tat Hong Equipment Service Co., Ltd in the Cayman Islands
2015
March
Redemption of 11,700,000 Convertible Redeemable Preference Shares
3 9
26Jun_Tat Hong AR 2015_V.indd 3926Jun_Tat Hong AR 2015_V.indd 39 26/6/15 16:3026/6/15 16:30

BOARD OF
DIRECTORS
Mr Tan Chok Kian (Chairman)
Mr Ng San Tiong Roland(Managing Director)
Mr Ng Sun Ho Tony(Deputy Managing Director)
Mr Ng Sang Kuey MichaelDr Leong Horn KeeMr Low Seow JuanMr Mak Lye MunMr Ong Tiew SiamMr Tse Po Shing Andy
AUDIT COMMITTEE
Dr Leong Horn Kee(Chairman)
Mr Low Seow JuanMr Tan Chok KianMr Tse Po Shing Andy
REMUNERATION
COMMITTEE
Dr Leong Horn Kee(Chairman)
Mr Low Seow JuanMr Mak Lye MunMr Tan Chok Kian
NOMINATING
COMMITTEE
Mr Tan Chok Kian(Chairman)
Mr Ng San Tiong RolandMr Low Seow JuanDr Leong Horn Kee
SHARE OPTION /
PERFORMANCE
SHARES PLAN
COMMITTEE
Mr Mak Lye Mun(Chairman)
Mr Ng San Tiong RolandMr Ng Sun Ho TonyMr Ong Tiew Siam
RISK MANAGEMENT
COMMITTEE
Mr Mak Lye Mun(Chairman)
Mr Ong Tiew SiamMr Tan Chok KianMr Tse Po Shing Andy
COMPANY
SECRETARIES
Mr Lional TsengMs Ong Beng Hong(Joint Company Secretaries)
SINGAPORE
REGISTERED OFFICE
82 Ubi Ave 4 #05-01Edward Boustead CentreSingapore 408832
SINGAPORE SHARE
REGISTRAR & SHARE
TRANSFER OFFICE
M & C Services Private Limited112 Robinson Road#05-01Singapore 068902Tel: (65) 6227 6660
AUDITOR
KPMG LLPPublic Accountants and Chartered Accountants16 Raffl es Quay #22-00Hong Leong Building Singapore 048581
Partner-in-Charge:Mr Lucas Tran(Appointed in FY2015)
CORPORATEINFORMATION
ANNUAL REPORT 2015
TAT HONG HOLDINGS LTD4 0
26Jun_Tat Hong AR 2015_V.indd 4026Jun_Tat Hong AR 2015_V.indd 40 26/6/15 16:3026/6/15 16:30

4 1CORPORATE GOVERNANCE
23 June 2015
INTRODUCTION
The Board of Directors (the “Board”) of Tat Hong Holdings Ltd (the “Company” and together with its subsidiaries, the “Group”) is committed to a high standard of corporate governance and has always recognised the importance of good governance to enhance corporate performance, accountability, and protection of stakeholders’ interests. This report describes the Company’s corporate governance practices with specifi c reference to the Code of Corporate Governance 2012 (the “Code”), pursuant to Rule 710 of the Listing Manual of Singapore Stock Exchange Securities Trading Limited (“SGX-ST”).
BOARD MATTERS
Board’s Conduct of its Affairs
The Board’s primary role is to protect and enhance long-term shareholder value. The Board meets at least once every quarter to oversee the affairs of the Company and provide strategic direction for sustainable growth. The Board also ensures that the necessary fi nancial and human resources are in place for the Company to meet its objectives.
In discharging its duties and responsibilities, the Board:
• Reviews and approves the fi nancial objectives and strategies to be implemented by the Management, including signifi cant acquisitions and divestments;
• Reviews and approves the release of quarterly and full year results;• Reviews the Management’s performance and sets major policies; • Establishes a framework of prudent and effective controls which enables the identifi cation, assessment
and management of risks to safeguard shareholders’ interests and the Company’s assets;• Establishes controls over capital expenditure, investments and divestments, funding decisions and bank
borrowings;• Sets the Company’s values and standards (including ethical standards) and ensures that obligations to
shareholders and other stakeholders are understood and met; and• Provides guidance on sustainability issues as part of the overall strategy formulation.
Board meetings are scheduled in advance on a yearly basis. This enables the Board to meet on a regular basis without interfering with the Company’s operations. The Board may request for further clarifi cations and information from the Management on all matters within its purview. Ad-hoc meetings are convened as and when circumstances require.
The Company adopts a set of guidelines and an authority matrix which sets out various types of material transactions which require Board approval. The guidelines set out the delegation of authority from the Board with fi nancial threshold limits on transactions including, inter alia, capital and operating expenses, extension of credit or waiver of bad debts, bank borrowings, acquisitions and disposals, forex hedging and changes in capital structure.
To assist the Board in the execution of its responsibilities, fi ve main Board Committees, namely Audit, Nominating, Remuneration, Risk Management and Share Option/Performance Shares Plan Committees, have been established and delegated certain functions. Other ad-hoc committees such as the Succession Planning Committee may be formed from time to time. All Board Committees are chaired by Independent Directors and the various Committees have written terms of references which are reviewed from time to time.
26Jun_TatHong_FR15_V.indd 4126Jun_TatHong_FR15_V.indd 41 26/6/15 16:5626/6/15 16:56

ANNUAL REPORT 2015
TAT HONG HOLDINGS LTD4 2 CORPORATE
GOVERNANCE
The Company’s Articles of Association provides for meetings of the Board to be conducted by way of telephone or video conference or other methods of simultaneous communication by electronic means. Directors’ Training
The Management conducts briefi ngs and orientation programmes to familiarise newly appointed Directors with the various businesses, operations and processes of the Group. The Board is also regularly updated on any changes in policies, laws and regulations that are relevant and apply to the Group and its businesses. Directors attend relevant courses conducted by various professional institutions where possible as part of their continuous training. The Company also organises in-house seminars on various topics such as corporate governance and relevant legislation conducted by legal and other professionals for Directors and the Management.
Board Composition and Guidance
The composition and size of the Board are reviewed from time to time by the Nominating Committee to ensure that the Board has an appropriate number of independent directors and a balance of expertise, skills and core competencies in areas including fi nance, legal, business and management.
Factors that are considered in evaluating a Director as independent include where a Director has no relationship with the Company or Group, with any shareholder with 10% or more interest in the Company, or its offi cers that could interfere, or be reasonably perceived to interfere, with the exercise of his independent business judgement in the interest of the Company.
As at 23 June 2015, the Board has nine members comprising three Executive Directors, one Non-Executive Non-Independent Director, and fi ve Independent Directors. The Board members are:
Board Member
Position Held
on the Board
Date of fi rst
appointment to the
board
Date of last
re-election/
re-appointment
as director Nature of Appointment
Tan Chok Kian Chairman 29 July 1997 25 July 2014* Non-Executive/IndependentNg San Tiong Roland Managing Director 25 October 1991 26 July 2013 Executive/Non-IndependentLeong Horn Kee Director 19 January 2001 26 July 2013 Non-Executive/IndependentLow Seow Juan Director 25 January 2006 27 July 2012* Non-Executive/IndependentMak Lye Mun Director 1 June 2005 25 July 2014 Non-Executive/IndependentNg Sun Ho Tony Director 2 November 1991 27 July 2012* Executive/Non-IndependentNg Sang Kuey Michael Director 1 October 1996 25 July 2014 Executive/Non-IndependentOng Tiew Siam Director 1 September 1999 27 July 2012* Non-Executive/IndependentTse Po Shing Andy Director 22 October 2009 26 July 2013 Non-Executive/Non-Independent
*Up for retirement at the forthcoming AGM 2015
Mr Tan Chok Kian will not be seeking re-election at the forthcoming AGM 2015. Please refer to the Announcement on 23 June 2015 for details.
26Jun_TatHong_FR15_V.indd 4226Jun_TatHong_FR15_V.indd 42 26/6/15 16:5626/6/15 16:56

4 3CORPORATE GOVERNANCE
The Board believes that there is a strong and independent element on the Board, with a majority of Non-Executive Directors, which allows the Board to exercise its objective and independent judgement on all affairs. No individual or small group of individuals dominates the Board’s decision-making process. The Directors consider the Board an appropriate size and possesses the right mix of skills and experience. This composition of the Board enables the Management to benefi t from its diverse and objective perspective on issues brought before the Board.
As at 23 June 2015, the following Independent Directors have held offi ce on the Board for more than nine years:
Mr Tan Chok KianDr Leong Horn KeeMr Low Seow JuanMr Ong Tiew Siam Mr Mak Lye Mun
The Board has assessed the independence of the above Directors and has determined that despite serving on the Board for more than nine years, Messrs Tan, Leong, Low, Ong and Mak have continued to demonstrate their independence through their active participation and objective questioning of all matters discussed during Board meetings. In addition, all the above Independent Directors do not have any fi nancial dealings with the Group. Each of the above Directors has abstained from evaluating his own independence.
The Chairman and the Group Chief Executive Offi cer (Group CEO)
The Chairman and the Group CEO are not related. There is a clear separation of roles and responsibilities of the Chairman and Group CEO. The Chairman is an Independent Director who leads the Board and is responsible for the Board’s workings and proceedings. The Chairman, together with the other Non-Executive directors, ensures that the Board engages in constructive debate with the Management on various matters, including strategic issues and business plans. The Chairman also ensures that a high standard of corporate governance is upheld. The Group CEO is responsible for implementing the Group’s strategies and policies, and for conducting the Group’s businesses.
The following table shows the composition of Board Committees as at 23 June 2015:
Board Member
Audit
Committee
Nominating
Committee
Remuneration
Committee
Risk Management
Committee
Share Option/
Performance
Shares Plan
Committee
Tan Chok Kian Member Chairman Member MemberNg San Tiong Roland Member MemberNg Sun Ho Tony MemberTse Po Shing Andy Member MemberLeong Horn Kee Chairman Member ChairmanOng Tiew Siam Member MemberLow Seow Juan Member Member MemberMak Lye Mun Member Chairman Chairman
26Jun_TatHong_FR15_V.indd 4326Jun_TatHong_FR15_V.indd 43 26/6/15 16:5626/6/15 16:56

ANNUAL REPORT 2015
TAT HONG HOLDINGS LTD4 4
The following table shows the Directors’ attendance at Board and Board Committee Meetings for FY2015:
Board Member Board Meeting
Audit
Committee
Meeting
Nominating
Committee
Meeting
Remuneration
Committee
Meeting
Risk
Management
Committee
Meeting
Share Option/
Performance
Shares Plan
Committee
Meeting
Tan Chok Kian 6/6 4/4 1/1 1/1 2/2 –Ng San Tiong Roland 5/6 – 1/1 – – –Ng Sun Ho Tony 6/6 – – – – –Ng Sang Kuey Michael 5/6 – – – – –Ng San Wee David** 6/6 – – – – –Tse Po Shing Andy 6/6 4/4 – – 2/2 –Leong Horn Kee 6/6 4/4 1/1 1/1 – –Ong Tiew Siam 6/6 – – – 2/2 –Low Seow Juan 6/6 4/4 1/1 1/1 – –Mak Lye Mun 5/6 – – 1/1 2/2 –
** Mr Ng San Wee David stepped down as an Executive/Non-Independent Director on 23 June 2015. Please refer to the Announcement of even date for details.
Board Membership and Performance
The Nominating Committee (the “NC”) comprises four members of whom three are Non-Executive Independent Directors as follows:
Mr Tan Chok Kian (Chairman)Dr Leong Horn KeeMr Low Seow JuanMr Ng San Tiong Roland
The NC is responsible for the following:• Assessing the necessary and desirable competencies of Board members and Board composition;• Reviewing Board succession plans and recommending the appointment, re-appointment and/or removal of
Directors;• Evaluating the Board’s performance and effectiveness as a whole;• Reviewing the independence of Directors in accordance with the Code’s defi nition of “Independent
Director”; and• Identifying, reviewing and recommending candidates for Senior Management positions in the Group.
The Chairman of NC is not associated with any substantial shareholders.
The NC applies the following principles in making recommendations to the Board:• Ensuring a formal and transparent procedure for the appointment and re-appointment of Directors to
the Board and Senior Management or, if in the case of a new Director or senior manager, consider the recommendations of the Board members as well as candidates from external search consultants;
• Ensuring that multiple board representations held by any Board member does not impede that Director’s performance in carrying out his duties to the Company; and
• Ensuring that the Board comprises Directors who, as a group, have the necessary range of expertise, skills and core competencies.
CORPORATE GOVERNANCE
26Jun_TatHong_FR15_V.indd 4426Jun_TatHong_FR15_V.indd 44 26/6/15 16:5626/6/15 16:56

4 5
The NC adopts a formal board evaluation process, including using evaluation questionnaires covering areas which include Board composition, information management, Board processes, CEO performance and succession planning, and standards of conduct in assessing the effectiveness of the Board as a whole and the contribution of each Director to the effectiveness of the Board. The results of such appraisals are presented to the Board with recommendations for improvement to the overall standard of governance.
The NC has considered the multiple board representations held by some Directors and has satisfi ed itself that they do not impede such Director’s performance in carrying out his duties to the Company. The Board noted that none of the directors holds more than six directorships in listed companies.
The NC has reviewed the independence of each Non-Executive Independent Director in accordance with the Code’s defi nition of independence and considered each Director’s independence in character and judgement.
Access to information
All Directors are provided with complete, adequate and timely information prior to meetings and upon request to enable them to fulfi l their responsibilities properly. The Management provides fi nancial reports and other relevant and material information with adequate explanations to all Directors on a regular and monthly basis outside the specifi c requirements for Board and Board Committee meetings.
In exercising their duties, the Directors have access to the advice of Senior Management and the Joint Company Secretaries who are responsible to the Board for ensuring that Board procedures are followed and that applicable laws and regulations are complied with. If necessary, the Directors can seek professional advice and services in areas which they deem necessary, at the expense of the Company. All Board members have separate and independent access to the Joint Company Secretaries at all times.
REMUNERATION MATTERS
Procedures for developing remuneration policies
The policies on remuneration – salaries, benefi ts and incentives – of the Group’s Executive Directors and Senior Management are reviewed and set by the Remuneration Committee (the “RC”). The RC comprises four Non-Executive Independent members as follows:
Dr Leong Horn Kee (Chairman)Mr Low Seow JuanMr Mak Lye MunMr Tan Chok Kian
The RC meets at least once a year to: • Review and approve recommendations on remuneration policies and the remuneration of the Group’s
Senior Management;• Approve the annual increment and bonuses of key executives as recommended by the Management;• Review all matters concerning Non-Executive Directors’ fees to ascertain that their fees are commensurate
with the contribution and responsibility of each Director; and• Review and approve the remuneration of any executives related to the controlling shareholder whose
remuneration is above S$150,000 per annum.
CORPORATE GOVERNANCE
26Jun_TatHong_FR15_V.indd 4526Jun_TatHong_FR15_V.indd 45 26/6/15 16:5626/6/15 16:56

ANNUAL REPORT 2015
TAT HONG HOLDINGS LTD4 6
The RC ensures that none of the Directors is involved in deciding his own remuneration. Each member of the RC refrains from voting on any resolution in respect of the assessment of his remuneration.
In setting the remuneration packages of the Executive Directors and senior managers, the Company makes a comparative study of the packages of executives in comparable industries or companies of a similar market size and takes into account the performance of the Company. The terms of the contracts of services of Executive Directors and senior management, including termination clauses, are in line with market practices and are not overly generous.
There are no service agreements with any Non-Executive Directors whose terms of appointment are in accordance with the Articles of Association of the Company.
Where the need arises, the RC engages external professional human resource consultants for advice on matters relating to remuneration.
The Share Option/Performance Shares Plan Committee
The Share Option/Performance Shares Plan Committee (the “SOC”) comprises of four Directors:-
Mr Mak Lye Mun (Chairman)Mr Ong Tiew SiamMr Ng San Tiong RolandMr Ng Sun Ho Tony
The SOC is responsible for and has absolute discretion, provided that no member of the SOC shall participate in any deliberation or decision in respect of share options to be granted to him or held by him, for the administration of the Company’s Employee Share Option Scheme 2006 and Performance Shares Plan. The SOC:
• Reviews the Share Option Scheme and Performance Shares Plan to ensure that they are effective in rewarding deserving employees;
• Determines the eligibility of employees to participate in the Share Option Scheme and Performance Shares Plan; and
• Offers and grants share options and/or performance shares in accordance with the provisions of the Employee Share Option Scheme 2006 and the Performance Shares Plan.
As a safeguard against abuse, where share options are proposed to be granted to or held by Executive Directors, the controlling shareholder or associates of the controlling shareholder, only members of the Board who are not Executive Directors, the controlling shareholder or associates of the controlling shareholder will be involved in the deliberation of the same.
Non-Executive Directors are not eligible to participate in the Performance Shares Plan. A grant of award for performance shares to the controlling shareholder or associates of the controlling shareholder requires the specifi c approval of shareholders to be obtained at a general meeting.
CORPORATE GOVERNANCE
26Jun_TatHong_FR15_V.indd 4626Jun_TatHong_FR15_V.indd 46 26/6/15 16:5626/6/15 16:56

4 7
The Employee Share Option Scheme and Performance Shares Plan form part of the Company’s long-term incentive plans for key management. As such, share options granted to employees are exercisable over a period of 10 years. Performance shares granted vest over a period of four years.
No share options were granted whilst 430,000 Performance Shares were granted, of which, 90,000 were cancelled, during the fi nancial year under review.
Level and mix of remuneration
The Board ensures that transparent procedures are in place for the determination of the remuneration of the Directors. The compensation of Non-Executive Directors is based on a framework comprising a basic retainer fee, fee for chairmanship of the Board or a Committee of the Board and service on a Committee. Executive Directors of the Company do not receive Directors’ fees from the Company.
The remuneration of each of the Non-Executive Director is determined based on the following Directors’ Fee Framework:
Fee Structure S$
Basic Fee 55,000Chairman of the Board 25,000Chairman, AC 15,000Chairman of other board committee 10,000Member of any board committee 5,000
Key management staff are remunerated taking into consideration factors such as the level and scope of responsibility, the performance of the Company/Group and various key performance indicators (“KPIs”). The compensation and benefi ts of management staff are benchmarked against the market and comprise components including fi xed basic salaries, variable performance-based bonuses, share-based incentives and other benefi ts. Where necessary, the Company will engage external consultants to study and recommend compensation and benefi t plans for its key management staff to ensure that such compensation packages are fair but not overly generous and that Management compensation is aligned with the long-term objectives of the Company.
Disclosure on Remuneration
Details of the remuneration paid to or accrued to the Directors of the Company for the fi nancial year ended 31 March 2015 are set out in the table below. Save as disclosed below, Directors do not receive any other benefi ts such as retirement or termination benefi ts.
As the Directors’ remuneration is fully disclosed in this section, the Company will not be issuing a separate report to shareholders on this subject matter.
CORPORATE GOVERNANCE
26Jun_TatHong_FR15_V.indd 4726Jun_TatHong_FR15_V.indd 47 26/6/15 16:5626/6/15 16:56

ANNUAL REPORT 2015
TAT HONG HOLDINGS LTD4 8
Name of DirectorRemuneration
(S$'000) Total Fees Salaries BonusStock
Options
Share-based
IncentiveBenefi ts-in-Kind
Tan Chok Kian 105 100% 100% 0% 0% 0% 0% 0%Leong Horn Kee 85 100% 100% 0% 0% 0% 0% 0%Mak Lye Mun 80 100% 100% 0% 0% 0% 0% 0%Low Seow Juan 70 100% 100% 0% 0% 0% 0% 0%Ong Tiew Siam 65 100% 100% 0% 0% 0% 0% 0%Tse Po Shing Andy 65 100% 100% 0% 0% 0% 0% 0%Ng San Tiong Roland 795 100% 0% 81% 19% 0% 0% 0%Ng Sang Kuey Michael@ 663 100% 0% 66% 34% 0% 0% 0%Ng Sun Ho Tony@ 435 100% 0% 93% 7% 0% 0% 0%Ng San Wee David@*** 375 100% 0% 67% 33% 0% 0% 0%
*** Mr Ng San Wee David stepped down on 23 June 2015.
Details of the remuneration of the top fi ve key executives of the Group for the fi nancial year ended 31 March 2015 are set out below. Save as disclosed below, the key management staff have not received any other benefi ts such as termination, retirement or post-employment benefi ts.
Remuneration Band
(S$'000) Total Fees Salaries BonusStock
Options
Share-based
IncentiveBenefi ts-in-Kind
Lional Tseng 251 – 500 100% 0% 75% 20% 0% 5% 0%Wong Meng Choong1 251 – 500 100% 0% 80% 15% 0% 5% 0%James Blaker2 251 – 500 100% 0% 90% 0% 0% 0% 10%Yau Kok San Sean 251 – 500 100% 0% 72% 21% 0% 7% 0%Lau Chuan Chai Danny 251 – 500 100% 0% 71% 29% 0% 0% 0%
1 Mr Wong Meng Choong resigned from his position as Group Chief Operating Offi cer (Asia) on 2 February 20152 Mr James Blaker stepped down from his role as General Manager, BT Equipment Pty Ltd, in Australia, on 9 February 2015
Details of the remuneration of employees who are immediate family members of the Group CEO, are set out below:
Remuneration Band
(S$'000) Total Fees Salaries BonusStock
Options
Share-based
IncentiveBenefi ts- in-Kind
Ng Chen Wei# 451 – 500 100% 0% 100% 0% 0% 0% 0%Ng Sun Hoe Patrick@ 301 – 350 100% 0% 93% 7% 0% 0% 0%Ng San Guan William@ 251 – 300 100% 0% 93% 7% 0% 0% 0%Ng Sun Oh Lewis@ 251 – 300 100% 0% 93% 7% 0% 0% 0%
@ Mr Ng Sun Ho Tony, Mr Ng Sang Kuey Michael, Mr Ng San Wee David, Mr Ng Sun Hoe Patrick, Mr Ng San Guan William and Mr Ng Sun Oh Lewis are the brothers of Mr Ng San Tiong Roland, Managing Director & Group CEO
# Mr Ng Chen Wei is the son of Mr Ng San Tiong Roland, Managing Director & Group CEO
Notes:Fees include directors’ feesSalaries also include Central Provident Fund contributions, transport allowance, Superannuation Fund, long service leaveBonus includes incentives, ex-gratia payments and profi t sharing Share-based incentives include performance shares awardedBenefi ts-in-kind include vehicle and housing benefi ts
CORPORATE GOVERNANCE
26Jun_TatHong_FR15_V.indd 4826Jun_TatHong_FR15_V.indd 48 26/6/15 16:5626/6/15 16:56
4 9
ACCOUNTABILITY AND AUDIT
Accountability
It is the Board’s aim to present the Company’s stakeholders with fair, balanced and clear assessment of the Company’s fi nancial performance, position and prospects. To facilitate the Board’s regular oversight of the Group, the Management provides the Board with appropriate detailed management accounts and reports of the Group’s fi nancial performance and position on a monthly basis.
The Board reviews and approves all quarterly and full year fi nancial results and announcements of major transactions prior to their release via the SGXNet to ensure that detailed and balanced information on the Group’s performance is disseminated on a timely and fair basis to the stakeholders.
Risk Management and Internal Controls
The Board acknowledges that it is responsible for the overall internal control framework adopted by the Group but also notes that no cost-effective system of internal controls can preclude and provide absolute assurance against errors, irregularities or loss as such a system is designed to manage rather than eliminate the risk of failure to achieve business objectives. The Company maintains a sound internal control system to safeguard the Company’s assets.
Risk Management
The Board has overall responsibility for the oversight of material risks in the Group’s business. The Board is assisted by a Risk Management Committee (the “RMC”) which comprises four Non-Executive Directors, three of whom are Independent Directors and one Non-Executive Non-Independent Director:
Mr Mak Lye Mun (Chairman)Mr Ong Tiew SiamMr Tan Chok KianMr Tse Po Shing Andy
The RMC identifi es and reviews signifi cant risks to the Group, and oversees the Group risk management practices and procedures to ensure the overall effectiveness of risk identifi cation, management, monitoring, and compliance with internal guidelines and/or external requirements. The RMC met twice in FY2015, and will meet as it deems necessary in discharging its duties and carrying out its functions of:
• Overseeing the development and improvement of the Group-wide risk management processes and approving risk policies and the Enterprise Risk Management framework;
• Reviewing at a high level the major types of risk faced by the Group and the current and future strategies necessary to manage them. The various matters and high-level enterprise risk that the RMC would review from time to time include, inter alia, capital allocation risks, key business, project management and operational risks including risks relating to inventory, loss of key customers and suppliers, key staff, reputation, health and safety issues, country of operations, etc, as well as fi nancial risks including interest rates, foreign exchange, liquidity, tax and market risk; and
• Monitoring an overview of risks and the adequacy of management’s responses for managing risk, including mitigating actions being taken to reduce key risks.
CORPORATE GOVERNANCE
26Jun_TatHong_FR15_V.indd 4926Jun_TatHong_FR15_V.indd 49 26/6/15 16:5626/6/15 16:56
ANNUAL REPORT 2015
TAT HONG HOLDINGS LTD5 0
The Management regularly reviews the Group’s businesses and operational activities to identify the areas of signifi cant business risks as well as appropriate measures to control and mitigate these risks within the Group’s policies and strategies.
The Directors have also considered the various fi nancial risks which the Group may face, the details of which can be found from page 141 to page 156 of this annual report.
Internal Controls
The Audit Committee, through the assistance of the internal auditors and external auditors, reviews and reports to the Board on the adequacy of the Company’s system of internal controls, including fi nancial, operational and compliance controls. In assessing the effectiveness of internal controls, the Audit Committee ensures that the key objectives are met, material assets are safeguarded, fraud or errors in the accounting records are prevented or detected, accounting records are accurate and complete, and reliable fi nancial information is prepared in compliance with applicable laws, regulations and internal policies.
For the year under review, the Board has received assurance from the Group CEO and Group CFO that:
a) The fi nancial records have been properly maintained and the fi nancial statements give a true and fair view of the Company’s operations and fi nances; and
b) The Company’s risk management and internal control systems are effective.
The Board is satisfi ed that the Company’s framework on internal controls is adequate to provide reasonable assurance on the effectiveness of the internal control system put in place by the Management.
The Board, with the concurrence of the Audit Committee, is of the opinion that the system of internal controls, including fi nancial, operational, compliance and information technology controls, and risk management systems put in place by the Management is adequate and effective to address fi nancial, operational and compliance risks of the Group.
Audit Committee and Internal Audit
The Audit Committee (the “AC”) comprises the following four members, three of whom are Non-Executive Independent Directors and one Non-Executive Non-Independent Director:
Dr Leong Horn Kee (Chairman)Mr Low Seow JuanMr Tan Chok KianMr Tse Po Shing Andy
The AC meets at least four times a year and is responsible for:
• Assessing the performance and independence of, and evaluate recommendations for the appointment or removal of external auditors;
• Assessing the performance and objectivity of the internal audit function;• Reviewing the reports on internal audit undertaken by third party audit practitioners and in-house audit
staff;
CORPORATE GOVERNANCE
26Jun_TatHong_FR15_V.indd 5026Jun_TatHong_FR15_V.indd 50 26/6/15 16:5626/6/15 16:56

5 1
• Reviewing the Company’s quarterly fi nancial statements and audited annual fi nancial statements and related notes, and external auditors’ report, and the formal announcements relating thereto, and recommend the same for the approval of the Board;
• Reviewing material Interested Person Transactions;• Reviewing the adequacy of the Company’s and Group’s internal fi nancial controls as well as operational and
compliance controls and systems;• Considering any whistle-blower reports; and• Reviewing and approving the annual internal audit plan.
The AC would commission and review the fi ndings of internal investigations into matters where there is suspected fraud or irregularity, or failure of internal controls or infringement of any applicable law, rule or regulation which has, or is likely to have, a material impact on the Group’s operating results and/or fi nancial position.
The AC has full access to the Management and also full discretion to invite any Director or key management staff to attend meetings of the AC, and has been given reasonable resources to discharge its functions. The AC also meets with the external and internal auditors, without the presence of the Management at least once a year, and has obtained assurances that the Management has co-operated fully in providing the auditors with such information as required in the conduct of their audits.
During the year, the AC, on behalf of the Board, has reviewed the effectiveness of the Group’s material internal controls, including fi nancial, operational and compliance controls.
The Company’s internal audit functions are outsourced to third party internal audit fi rms which meet the standards for the Professional Practice of Internal Auditing as adopted by the Institute of Internal Auditors. The Internal Auditor (“IA”) reports directly to the Chairman of the AC and administratively to the Group CFO.
Whistle-blowing Policy
The Company has a Whistle-Blowing Policy, endorsed by the AC, and has established procedures where employees of the Company may, in confi dence and without fear of reprisals, raise concerns about suspected fraud, dishonest practices, other misdemeanours and improprieties in the conduct of the Company’s business. Arrangements are in place for the independent investigations of such matters by the AC and for appropriate follow-up action.
The Company has communicated the Whistle-blowing Policy to all employees through the Employee Handbook and the whistle-blower may submit his/her concerns via email to the Chairman of the Board or the AC Chairman.
External Auditors
The Board is responsible for the initial appointment of the external auditors and shareholders subsequently approve the appointment at the Annual General Meeting. The Audit Committee evaluates the external auditors’ performance, quality of their audit, and their independence and recommends their appointment to the Board. The Company’s external auditor is KPMG Singapore and the Company complies with Rules 712 and 715 of the Listing Manual of the SGX-ST. KPMG has assigned a new audit engagement partner in FY2015 to enhance the independence of the audit.
CORPORATE GOVERNANCE
26Jun_TatHong_FR15_V.indd 5126Jun_TatHong_FR15_V.indd 51 26/6/15 16:5626/6/15 16:56

ANNUAL REPORT 2015
TAT HONG HOLDINGS LTD5 2
The total amount of fees for audit services for the fi nancial year ended 31 March 2015 provided by KPMG Singapore and its overseas member fi rms was approximately S$792,000 whilst fees for non-audit services amounted to approximately S$81,000. The AC has satisfi ed itself with the independence and objectivity of the external auditors in carrying out their audit of the fi nancial statements for the fi nancial year ended 31 March 2015, having reviewed the volume of non-audit services provided by the external auditors and having received written confi rmation from the auditors of their independence.
SHAREHOLDER RIGHTS AND RESPONSIBILITIES
The Company recognises its responsibilities to its shareholders, ensures that all shareholders are treated fairly and equitably and facilitates the exercising of shareholders’ rights. The Company also welcomes shareholders’ views and encourages the participation of shareholders at general meetings.
Shareholder Rights and Conduct of Shareholder Meetings
The Company does not practice selective disclosure and ensures that full and fair disclosure of the Company’s business or any development which may materially affects the share price of the Company is released in a timely manner via the SGXNet.
All shareholders are informed of the convening of general meetings through printed circulars or reports and through notices published in the newspapers, on the SGXNet and on the Company’s website.
The Company’s Articles of Association allow shareholders who are unable to attend shareholder’s meetings the right to appoint up to two proxies to attend the meeting and vote on their behalf.
The Chairman, MD and Group CEO, chairmen of the respective Board Committees, Group CFO and Joint Company Secretaries are required to attend shareholder meetings. External auditors are also in attendance during Annual General Meetings to assist in addressing queries from shareholders relating to the audit and preparation of the fi nancial statements.
At the start of each general meeting, the Chairman of the Board or his designated representative will brief the shareholders on proceedings including a short explanation of the matter which is brought up for shareholders’ approval.
Every matter requiring approval at a general meeting is proposed as a separate resolution and shareholders are given ample time to ask questions of the Board on issues related to proposed resolution before the resolution is voted on.
The Company will be conducting voting by poll for all resolutions and will announce the detailed results, giving the total number of votes cast for and against each resolution, as well as the respective percentages, to all shareholders at the general meeting. An announcement of the detailed results will also be made via the SGXNet.The Company records the minutes of all shareholder meetings and these are available to shareholders upon request.
CORPORATE GOVERNANCE
26Jun_TatHong_FR15_V.indd 5226Jun_TatHong_FR15_V.indd 52 26/6/15 16:5626/6/15 16:56

5 3
Communication with Shareholders
The Company is committed to a high standard of disclosure as it believes that this promotes governance and greater investor confi dence. All material information is disclosed in a timely and comprehensive manner fi rst via the SGXNet and through the Company’s website thus ensuring that all shareholders have the same access to information.
The Company does not practice selective disclosure and should a price sensitive matter be inadvertently disclosed, the Company will release the same information to the general public via the SGXNet.
The Company employs various platforms to communicate with shareholders including postings on the Company’s website, investor meetings, roadshows and shareholder meetings. The Company maintains a dedicated investor relations section on the Company’s website where shareholders, analysts and the investing community can easily access information relating to the Company’s fi nancial performance, announcements, fi nancial ratios, stock fundamentals, etc. Shareholders can also contact the Company through a dedicated email address: [email protected].
The Management also solicits feedback and the views of the investing community at meetings with shareholders, analysts and potential investors.
Dividend Policy
The Company is committed to enhancing value for its shareholders and strives to achieve an effi cient capital structure that balances the returns to shareholders with the Company’s capital needs for investment and growth.
The quantum and frequency of the dividend payout may vary depending on the Group’s fi nancial performance, its capital requirements for expansion, or equipment replacement and other factors which the Board may deem appropriate. Over the past fi ve years, annual dividends paid out by the Group ranged between 30% and 40% of the Group’s total net profi t after tax and minority interests.
DEALINGS IN SECURITIES
The Group has adopted an internal code of conduct on dealings in securities by Directors of the Company, Management staff and employees in possession of confi dential information, who are also expected to abide by insider trading laws at all times.
The Group’s Directors and affected employees are prohibited from dealing in the securities of the Company whilst in possession of price-sensitive information or during the embargo period commencing two weeks before the announcement of the Company’s fi nancial statements for each of the fi rst three quarters of the fi nancial year and during the period commencing a month before the announcement of the fi nancial statements for the fi nancial year, and ending on the date of the announcement of the relevant results. The Company’s internal compliance code requires that employees not deal in the Company’s securities on short term considerations.
This internal code of conduct is modelled on the Best Practice Guide and has been disseminated to Directors and affected employees. A copy of the code on dealings in securities is also issued to new employees when they join the Company.
CORPORATE GOVERNANCE
26Jun_TatHong_FR15_V.indd 5326Jun_TatHong_FR15_V.indd 53 26/6/15 16:5626/6/15 16:56

ANNUAL REPORT 2015
TAT HONG HOLDINGS LTD5 4
POLICY ON INTERESTED PERSON TRANSACTIONS
The Company has adopted a policy in respect of any transaction with Interested Persons and has procedures established for the review and approval of the Company’s Interested Person Transactions to ensure that they are carried out on normal commercial terms or entered into on an arm’s length basis.
The Company also adopts the materiality thresholds imposed under Chapter 9 of the Listing Manual of SGX-ST to announce such transactions, or to announce and convene separate General Meetings as and when potential transactions with the Interested Persons arise, to seek shareholders’ prior approval for these transactions.
Save as disclosed below, there are no Interested Person Transactions between the Company or its subsidiaries and any of its interested persons during the fi nancial year under review.
Name of Interested Person
Aggregate value of all interested
person transactions during the
fi nancial year under review
(excluding transactions less than
S$100,000 and transactions
conducted under shareholders’
mandate pursuant to Rule 920)
Aggregate value of all interested
person transactions conducted
under the shareholders’ mandate
pursuant to Rule 920 (excluding
transactions less than S$100,000)
Group Group
12 months ended 12 months ended
31 March 2015 31 March 2014 31 March 2015 31 March 2014
S$’000 S$’000 S$’000 S$’000
(A) Sale
CS Construction &Geotechnic Pte Ltd – – 840 –CMC Construction Pte Ltd – – 1,145 1,480THL Foundation Equipment Pte Ltd – – 630 –L&M Foundation Specialist Pte Ltd – – 295 –THAB Development Sdn Bhd – – 248 –
(B) Purchase
CMC Construction Pte Ltd – – 9,472 250Chwee Cheng & Sons Pte Ltd – – 156 –ICE Far East (HK) Ltd – – 1,131 –BP-Ubi Industrial Pte Ltd – 337 –CS Bored Pile System Pte Ltd – – – 240
CORPORATE GOVERNANCE
26Jun_TatHong_FR15_V.indd 5426Jun_TatHong_FR15_V.indd 54 26/6/15 16:5626/6/15 16:56

5 5
DIRECTORS’REPORT
STATEMENT BYDIRECTORS
INDEPENDENTAUDITORS’ REPORT
STATEMENTS OFFINANCIAL
POSITION
CONSOLIDATEDINCOME STATEMENT
CONSOLIDATEDSTATEMENT OF
COMPREHENSIVE INCOME
56626365
6667
68
72
75
168170
FINANCIAL CONTENTS
CONSOLIDATEDSTATEMENT OF CHANGESIN EQUITY
CONSOLIDATEDSTATEMENT OFCASH FLOWS
NOTES TO THEFINANCIALSTATEMENTS
ANALYSIS OFSHAREHOLDINGS
NOTICE OF ANNUALGENERAL MEETING
15_0126 TatHong_FR15_FA02.indd 55 29/6/15 10:56 am
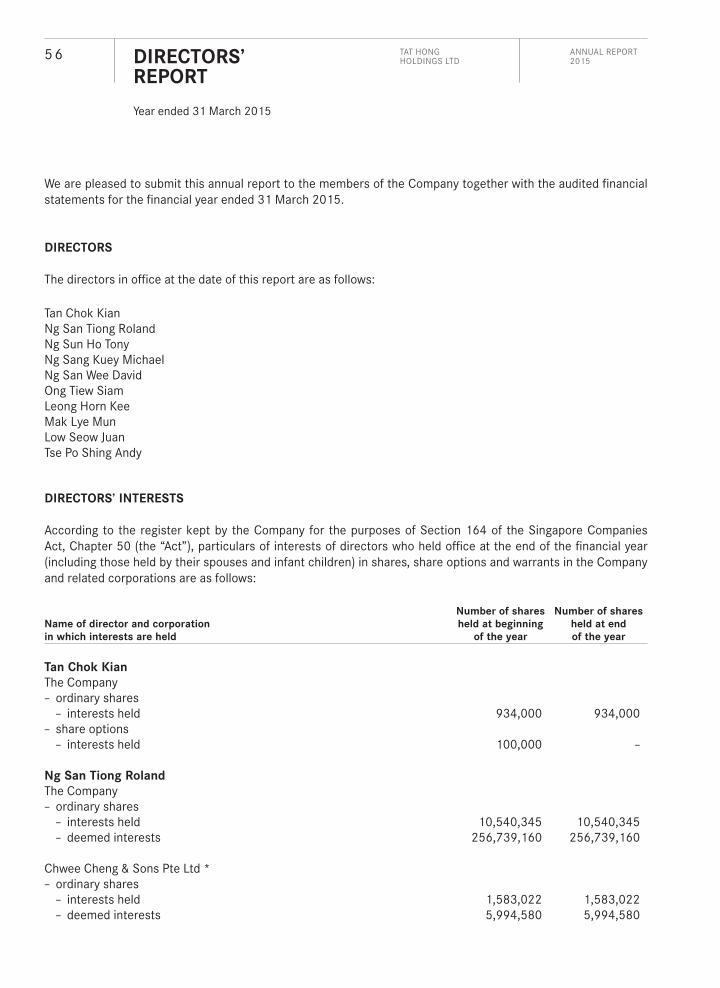
ANNUAL REPORT 2015
TAT HONG HOLDINGS LTD5 6
We are pleased to submit this annual report to the members of the Company together with the audited fi nancial statements for the fi nancial year ended 31 March 2015.
DIRECTORS
The directors in offi ce at the date of this report are as follows:
Tan Chok KianNg San Tiong RolandNg Sun Ho TonyNg Sang Kuey MichaelNg San Wee DavidOng Tiew SiamLeong Horn KeeMak Lye MunLow Seow JuanTse Po Shing Andy
DIRECTORS’ INTERESTS
According to the register kept by the Company for the purposes of Section 164 of the Singapore Companies Act, Chapter 50 (the “Act”), particulars of interests of directors who held offi ce at the end of the fi nancial year (including those held by their spouses and infant children) in shares, share options and warrants in the Company and related corporations are as follows:
Name of director and corporation
in which interests are held
Number of shares
held at beginning
of the year
Number of shares
held at end
of the year
Tan Chok Kian
The Company– ordinary shares – interests held 934,000 934,000– share options – interests held 100,000 –
Ng San Tiong Roland
The Company– ordinary shares – interests held 10,540,345 10,540,345 – deemed interests 256,739,160 256,739,160
Chwee Cheng & Sons Pte Ltd *– ordinary shares – interests held 1,583,022 1,583,022 – deemed interests 5,994,580 5,994,580
DIRECTORS’ REPORT Year ended 31 March 2015
26Jun_TatHong_FR15_V.indd 5626Jun_TatHong_FR15_V.indd 56 26/6/15 16:5626/6/15 16:56

5 7
DIRECTORS’ INTERESTS (CONT’D)
Name of director and corporation
in which interests are held
Number of shares
held at beginning
of the year
Number of shares
held at end
of the year
Ng Sun Ho Tony
The Company– ordinary shares – interests held 6,138,630 6,138,630 – deemed interests 256,739,160 256,739,160
Chwee Cheng & Sons Pte Ltd *– ordinary shares – interests held 1,376,230 1,376,230 – deemed interests 5,994,580 5,994,580
Ng Sang Kuey Michael
The Company– ordinary shares – interests held 4,908,350 4,908,350
Chwee Cheng & Sons Pte Ltd *– ordinary shares – interests held 911,863 911,863
Ng San Wee David
The Company– ordinary shares – interests held 3,161,250 349,500 – deemed interests 256,739,160 259,550,910
Chwee Cheng & Sons Pte Ltd *– ordinary shares – interests held 463,497 463,497 – deemed interests 5,994,580 5,994,580
Ong Tiew Siam
The Company– ordinary shares – interests held 2,817,000 2,817,000
Leong Horn Kee
The Company– ordinary shares – interests held 700,000 700,000– share options – interests held 100,000 –
* Immediate and ultimate holding company
DIRECTORS’ REPORT Year ended 31 March 2015
26Jun_TatHong_FR15_V.indd 5726Jun_TatHong_FR15_V.indd 57 26/6/15 16:5626/6/15 16:56

ANNUAL REPORT 2015
TAT HONG HOLDINGS LTD5 8
DIRECTORS’ INTERESTS (CONT’D)
Name of director and corporation
in which interests are held
Number of shares
held at beginning
of the year
Number of shares
held at end
of the year
Mak Lye Mun
The Company– share options – interests held 100,000 –
Low Seow Juan
The Company– ordinary shares – interests held 40,000 40,000– share options – interests held 100,000 –
Except as disclosed in this report, no director who held offi ce at the end of the fi nancial year had interests in shares or debentures of the Company or of related corporations either at the beginning of the fi nancial year or at the end of the fi nancial year.
On 16 April 2015, Ng Sun Ho Tony had transferred 2,000,000 ordinary shares of the Company from his account to a nominee account, resulting in a reduction in his direct interests and an increase in his deemed interests. Except as disclosed above, there were no changes in any of the above mentioned interests in the Company between the end of the fi nancial year and 21 April 2015.
Except as disclosed in the “Share Options” section of this report, neither at the end of, nor at any time during the fi nancial year, was the Company a party to any arrangements whose objects are, or one of whose objects is, to enable the directors of the Company to acquire benefi ts by means of the acquisition of shares in or debentures of the Company or any other body corporate.
In the normal course of business, the Company and its related corporations entered into transactions with companies in which directors have substantial interests as disclosed in note 31 to the fi nancial statements. However, the directors have neither received nor become entitled to receive any benefi t arising out of these transactions other than those to which they are ordinarily entitled to as shareholders of these companies.
Except as disclosed above and in notes 22 and 31 to the fi nancial statements, since the end of the last fi nancial year, no director has received or become entitled to receive, a benefi t by reason of a contract made by the Company or a related corporation with the director, or with a fi rm of which he is a member, or with a company in which he has a substantial fi nancial interest.
DIRECTORS’ REPORT Year ended 31 March 2015
26Jun_TatHong_FR15_V.indd 5826Jun_TatHong_FR15_V.indd 58 26/6/15 16:5626/6/15 16:56

5 9
SHARE OPTIONS
Tat Hong Employee Share Option Scheme 2006 and Performance Share Plan
The Tat Hong Employee Share Option Scheme 2006 (“ESOS 2006”) and Performance Share Plan (“PSP”) (collectively the “Scheme”) were approved by the Company at its Extraordinary General Meeting on 8 December 2006. The Scheme is administered by the Share Options/Performance Shares Plan Committee, comprising four directors, Mak Lye Mun (Chairman), Ng San Tiong Roland, Ng Sun Ho Tony and Ong Tiew Siam.
Other information regarding the Scheme is set out as follows:
– the Board of the Company may specify the vesting conditions which must be satisfi ed or waived by the Board before options and awards allocated under the Scheme may be dealt with;
– the exercise price for each share in respect of which an option is exercisable shall be a price equal to the market price;
– the options can be exercised 1 year after the grant; and
– the options granted expire after 5 years for non-executive directors and 10 years for the employees of the Company and its subsidiaries.
At the end of the fi nancial year, details of the options granted under the Scheme on the unissued ordinary shares of the Company, are as follows:
Date of grant of
options
Exercise
price
per share
Options
outstanding
as at
1 April
2014
Options
cancelled
Options
exercised
Options
outstanding
as at
31 March
2015
Number
of option
holders
as at
31 March
2015 Exercise period
30 September 2009
1.08 1,709,000 (75,000) – 1,634,000 43 1 October 2010 – 30 September 2019
30 September 2009
1.08 400,000 (400,000) – – – 1 October 2010 – 30 September 2014
2,109,000 (475,000) – 1,634,000
Except as disclosed above, there were no unissued shares of the Company or its subsidiaries under options granted by the Company or its subsidiaries as at the end of the fi nancial year.
DIRECTORS’ REPORT Year ended 31 March 2015
26Jun_TatHong_FR15_V.indd 5926Jun_TatHong_FR15_V.indd 59 26/6/15 16:5626/6/15 16:56

ANNUAL REPORT 2015
TAT HONG HOLDINGS LTD6 0
SHARE OPTIONS (CONT’D)
Details of options granted to directors of the Company under the Scheme are as follows:
Name of director
Options granted
for fi nancial
year ended
31 March 2015
Aggregate options
granted since
commencement
of Scheme to
31 March 2015
Aggregate options
exercised since
commencement
of Scheme to
31 March 2015
Aggregate options
outstanding as at
31 March 2015
Tan Chok Kian – 100,000 – –Ong Tiew Siam – 200,000 (200,000) –Leong Horn Kee – 100,000 – –Mak Lye Mun – 100,000 – –Low Seow Juan – 100,000 – –
Since the commencement of the Scheme, no options have been granted to the controlling shareholders of the Company or their associates and no participant under the Scheme has been granted 5% or more of the total options available under the Scheme.
The options granted by the Company do not entitle the holders of the options, by virtue of such holdings, to any rights to participate in any share issue of any other company.
During the fi nancial year ended 31 March 2015, 203,500 (2014: 96,000) shares were vested under the PSP and satisfi ed by treasury shares (see note 15).
AUDIT COMMITTEE
The members of the Audit Committee during the year and at the date of this report are as follows:
• Leong Horn Kee (Chairman)• Tan Chok Kian• Low Seow Juan • Tse Po Shing Andy
The Audit Committee performs the functions specifi ed by section 201B of the Companies Act, Chapter 50, the SGX Listing Manual and the Code of Corporate Governance.
The Audit Committee held four meetings during the year. In performing its functions, the Audit Committee met with the Company’s external and internal auditors to discuss the scope of their work and the results of their examination and evaluation of the Company’s system of internal accounting controls.
The Audit Committee also reviewed the following:
• assistance provided by the Company’s offi cers to the internal and external auditors;• quarterly fi nancial information and annual fi nancial statements of the Group and of the Company prior to
their submission to the directors of the Company for adoption; and• interested person transactions (as defi ned in Chapter 9 of the SGX Listing Manual).
DIRECTORS’ REPORT Year ended 31 March 2015
26Jun_TatHong_FR15_V.indd 6026Jun_TatHong_FR15_V.indd 60 26/6/15 16:5626/6/15 16:56

6 1
AUDIT COMMITTEE (CONT’D)
The Audit Committee has full access to the Management and is given the resources required for it to discharge its functions. It has full authority and discretion to invite any director or executive offi cer to attend its meetings.
The Audit Committee also recommends the appointment of the external auditors and reviews the level of audit and non-audit fees.
The Audit Committee is satisfi ed with the independence and objectivity of the external auditors and recommends to the Board of Directors that the auditors, KPMG LLP, be nominated for re-appointment as auditors at the forthcoming Annual General Meeting of the Company.
In appointing our auditors for the Company and subsidiaries, we have complied with Rules 712 and 715 of the SGX Listing Manual.
AUDITORS
The auditors, KPMG LLP, have indicated their willingness to accept re-appointment.
On behalf of the Board of Directors
Tan Chok Kian
Chairman
Ng San Tiong Roland
Director
29 May 2015
DIRECTORS’ REPORT Year ended 31 March 2015
26Jun_TatHong_FR15_V.indd 6126Jun_TatHong_FR15_V.indd 61 26/6/15 16:5626/6/15 16:56

ANNUAL REPORT 2015
TAT HONG HOLDINGS LTD6 2
In our opinion:
(a) the fi nancial statements set out on pages 65 to 167 are drawn up so as to give a true and fair view of the state of affairs of the Group and of the Company as at 31 March 2015 and the results, changes in equity and cash fl ows of the Group for the year ended on that date in accordance with the provisions of the Singapore Companies Act, Chapter 50 and Singapore Financial Reporting Standards; and
(b) at the date of this statement, there are reasonable grounds to believe that the Company will be able to pay its debts as and when they fall due.
The Board of Directors has, on the date of this statement, authorised these fi nancial statements for issue.
On behalf of the Board of Directors
Tan Chok Kian
Chairman
Ng San Tiong Roland
Director
29 May 2015
STATEMENT BY DIRECTORS
26Jun_TatHong_FR15_V.indd 6226Jun_TatHong_FR15_V.indd 62 26/6/15 16:5626/6/15 16:56

6 3
REPORT ON THE FINANCIAL STATEMENTS
We have audited the accompanying fi nancial statements of Tat Hong Holdings Ltd (the “Company”) and its subsidiaries (the “Group”), which comprise the statements of fi nancial position of the Group and the Company as at 31 March 2015, the income statement, statement of comprehensive income, statement of changes in equity and statement of cash fl ows of the Group for the year then ended, and a summary of signifi cant accounting policies and other explanatory information, as set out on pages 65 to 167.
The Management’s responsibility for the fi nancial statements
The Management is responsible for the preparation of fi nancial statements that give a true and fair view in accordance with the provisions of the Singapore Companies Act, Chapter 50 (the “Act”) and Singapore Financial Reporting Standards, and for devising and maintaining a system of internal accounting controls suffi cient to provide a reasonable assurance that assets are safeguarded against loss from unauthorised use or disposition; and transactions are properly authorised and that they are recorded as necessary to permit the preparation of true and fair profi t and loss accounts and balance sheets and to maintain accountability of assets.
Auditors’ responsibility
Our responsibility is to express an opinion on these fi nancial statements based on our audit. We conducted our audit in accordance with Singapore Standards on Auditing. Those standards require that we comply with ethical requirements and plan and perform the audit to obtain reasonable assurance about whether the fi nancial statements are free from material misstatement.
An audit involves performing procedures to obtain audit evidence about the amounts and disclosures in the fi nancial statements. The procedures selected depend on the auditor’s judgement, including the assessment of the risks of material misstatement of the fi nancial statements, whether due to fraud or error. In making those risk assessments, the auditor considers internal control relevant to the entity’s preparation of fi nancial statements that give a true and fair view in order to design audit procedures that are appropriate in the circumstances, but not for the purpose of expressing an opinion on the effectiveness of the entity’s internal control. An audit also includes evaluating the appropriateness of accounting policies used and the reasonableness of accounting estimates made by the Management, as well as evaluating the overall presentation of the fi nancial statements.
We believe that the audit evidence we have obtained is suffi cient and appropriate to provide a basis for our audit opinion.
Opinion
In our opinion, the consolidated fi nancial statements of the Group and the statement of fi nancial position of the Company are properly drawn up in accordance with the provisions of the Act and Singapore Financial Reporting Standards to give a true and fair view of the state of affairs of the Group and of the Company as at 31 March 2015 and the results, changes in equity and cash fl ows of the Group for the year ended on that date.
INDEPENDENT AUDITORS’ REPORT
Members of the Company Tat Hong Holdings Ltd
26Jun_TatHong_FR15_V.indd 6326Jun_TatHong_FR15_V.indd 63 26/6/15 16:5626/6/15 16:56

ANNUAL REPORT 2015
TAT HONG HOLDINGS LTD6 4
Report on other legal and regulatory requirements
In our opinion, the accounting and other records required by the Act to be kept by the Company and by those subsidiaries incorporated in Singapore of which we are the auditors have been properly kept in accordance with the provisions of the Act.
KPMG LLP
Public Accountants andChartered Accountants
Singapore
29 May 2015
INDEPENDENT AUDITORS’ REPORT
26Jun_TatHong_FR15_V.indd 6426Jun_TatHong_FR15_V.indd 64 26/6/15 16:5626/6/15 16:56

6 5
Group Company
Note 2015 2014 2015 2014
$’000 $’000 $’000 $’000
Assets
Property, plant and equipment 4 919,310 975,422 1,650 608Subsidiaries 5 – – 387,320 384,463Associates 6 58,865 69,271 12,556 27,486Joint ventures 7 4,564 2,579 4,439 2,178Other fi nancial assets 8 798 518 714 434Deferred tax assets 9 5,745 5,293 – –Intangible assets 10 21,152 45,230 – –Trade and other receivables 13 1,585 2,074 – –Non-current assets 1,012,019 1,100,387 406,679 415,169
Asset held for sale 11 2,240 – – –Inventories 12 186,500 186,306 – –Trade and other receivables 13 203,140 228,764 169,459 90,139Cash and cash equivalents 14 93,266 58,603 891 178Current assets 485,146 473,673 170,350 90,317Total assets 1,497,165 1,574,060 577,029 505,486
Equity
Share capital 15 325,849 337,321 325,849 337,321Reserves 16 324,980 338,214 40,621 41,786Equity attributable to owners of the
Company 650,829 675,535 366,470 379,107Non-controlling interests 50,571 52,073 – –Total equity 701,400 727,608 366,470 379,107
Liabilities
Trade and other payables 17 1,173 1,533 – –Financial liabilities 18 369,047 354,822 195,382 114,145Deferred tax liabilities 9 23,525 28,049 – –Non-current liabilities 393,745 384,404 195,382 114,145
Trade and other payables 17 208,455 238,152 3,637 3,715Financial liabilities 18 187,489 223,451 11,510 8,500Current tax payable 6,076 445 30 19Current liabilities 402,020 462,048 15,177 12,234Total liabilities 795,765 846,452 210,559 126,379Total equity and liabilities 1,497,165 1,574,060 577,029 505,486
STATEMENTS OF FINANCIAL POSITION
As at 31 March 2015
The accompanying notes form an integral part of these fi nancial statements.
26Jun_TatHong_FR15_V.indd 6526Jun_TatHong_FR15_V.indd 65 26/6/15 16:5626/6/15 16:56

ANNUAL REPORT 2015
TAT HONG HOLDINGS LTD6 6
Note 2015 2014
$’000 $’000
Restated*
Revenue 20 608,597 684,087Cost of sales (396,504) (438,347)Gross profi t 212,093 245,740Other operating income 22 34,534 28,180Distribution expenses (42,810) (42,880)Administrative expenses (143,556) (149,852)Other operating expenses (20,354) (12,027)Results from operating activities 39,907 69,161Finance expense 21 (25,960) (25,643)
13,947 43,518Share of results of associates (net of tax) 4,624 4,785Share of results of joint ventures (net of tax) (214) 645Profi t before income tax 22 18,357 48,948Income tax expense 23 (11,560) (15,169)Profi t for the year 6,797 33,779 Attributable to:
Owners of the Company 4,865 32,809Non-controlling interests 1,932 970Profi t for the year 6,797 33,779
Earnings per share
Basic earnings per share (cents) 24(a) 0.77 5.21*Diluted earnings per share (cents) 24(b) 0.77 5.21*
* Comparatives were restated. Refer to notes 24 and 33 for details.
CONSOLIDATED INCOME STATEMENT
Year ended 31 March 2015
The accompanying notes form an integral part of these fi nancial statements.
26Jun_TatHong_FR15_V.indd 6626Jun_TatHong_FR15_V.indd 66 26/6/15 16:5626/6/15 16:56

6 7
2015 2014
$’000 $’000
Profi t for the year 6,797 33,779
Other comprehensive income for the year, net of income tax
Items that are or may be reclassifi ed subsequently to profi t or loss:
Share of other comprehensive income of an associate – (47)Net loss on translation of net investment in foreign entities (2,330) (24,440)Effective portion of changes in fair value of cash fl ow hedges 383 –Net change in fair value of available-for-sale fi nancial assets (110) –Foreign currency translation reclassifi ed to profi t or loss on disposal
of an associate 1,023 –Other comprehensive income for the year, net of income tax (1,034) (24,487)Total comprehensive income for the year 5,763 9,292
Attributable to:
Owners of the Company 3,700 7,826Non-controlling interests 2,063 1,466Total comprehensive income for the year 5,763 9,292
CONSOLIDATED STATEMENT OF COMPREHENSIVE INCOME
Year ended 31 March 2015
The accompanying notes form an integral part of these fi nancial statements.
26Jun_TatHong_FR15_V.indd 6726Jun_TatHong_FR15_V.indd 67 26/6/15 16:5626/6/15 16:56

ANNUAL REPORT 2015
TAT HONG HOLDINGS LTD6 8
Share
capital
Reserve
for own
shares
Share-
based
payment
reserve
Capital
reserves
Currency
translation
reserve
Accumulated
profi ts
Total
attributable
to owners of
the Company
Non-
controlling
interests
Total
equity
$’000 $’000 $’000 $’000 $’000 $’000 $’000 $’000 $’000
At 1 April 2013 336,753 (1,693) 905 24,200 4,425 325,030 689,620 49,940 739,560
Total
comprehensive
income for the
year
Profi t for the year – – – – – 32,809 32,809 970 33,779
Other
comprehensive
income
Share of other comprehensive income of an associate – – – (47) – – (47) – (47)
Net loss on translation of net investment in foreign entities – – – (4) (24,918) (14) (24,936) 496 (24,440)
Total other
comprehensive
income – – – (51) (24,918) (14) (24,983) 496 (24,487)Total
comprehensive
income for the
year – – – (51) (24,918) 32,795 7,826 1,466 9,292
CONSOLIDATED STATEMENT OF CHANGES IN EQUITY
Year ended 31 March 2015
The accompanying notes form an integral part of these fi nancial statements.
26Jun_TatHong_FR15_V.indd 6826Jun_TatHong_FR15_V.indd 68 26/6/15 16:5626/6/15 16:56
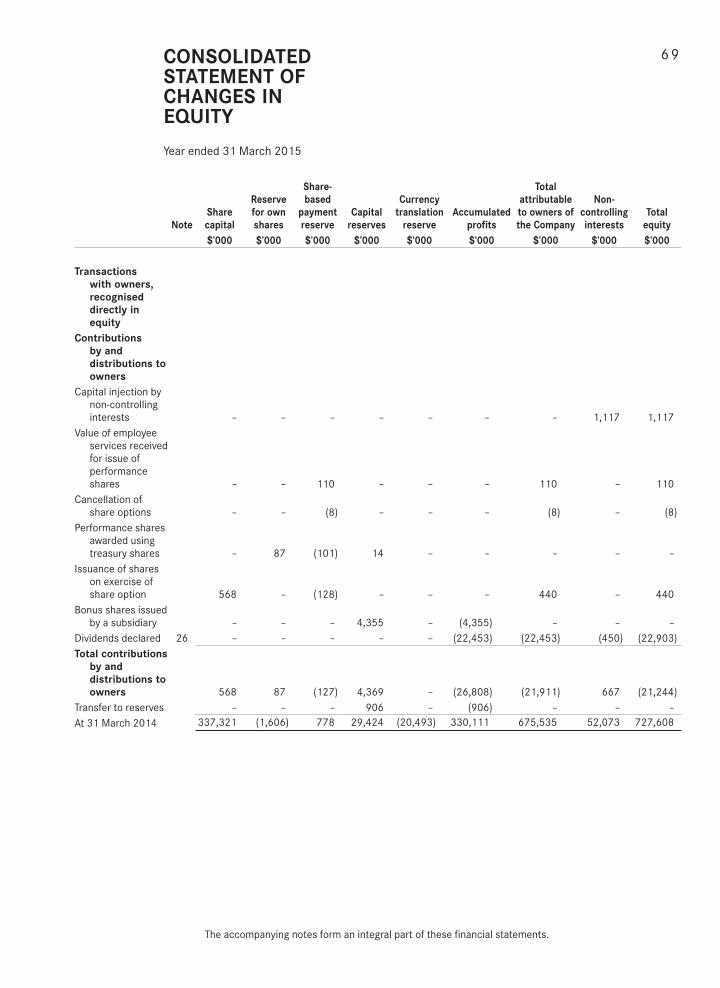
6 9
Note
Share
capital
Reserve
for own
shares
Share-
based
payment
reserve
Capital
reserves
Currency
translation
reserve
Accumulated
profi ts
Total
attributable
to owners of
the Company
Non-
controlling
interests
Total
equity
$’000 $’000 $’000 $’000 $’000 $’000 $’000 $’000 $’000
Transactions
with owners,
recognised
directly in
equity
Contributions
by and
distributions to
owners
Capital injection by non-controlling interests – – – – – – – 1,117 1,117
Value of employee services received for issue of performance shares – – 110 – – – 110 – 110
Cancellation of share options – – (8) – – – (8) – (8)
Performance shares awarded using treasury shares – 87 (101) 14 – – – – –
Issuance of shares on exercise of share option 568 – (128) – – – 440 – 440
Bonus shares issued by a subsidiary – – – 4,355 – (4,355) – – –
Dividends declared 26 – – – – – (22,453) (22,453) (450) (22,903)Total contributions
by and
distributions to
owners 568 87 (127) 4,369 – (26,808) (21,911) 667 (21,244)Transfer to reserves – – – 906 – (906) – – –At 31 March 2014 337,321 (1,606) 778 29,424 (20,493) 330,111 675,535 52,073 727,608
CONSOLIDATED STATEMENT OF CHANGES IN EQUITY
Year ended 31 March 2015
The accompanying notes form an integral part of these fi nancial statements.
26Jun_TatHong_FR15_V.indd 6926Jun_TatHong_FR15_V.indd 69 26/6/15 16:5626/6/15 16:56

ANNUAL REPORT 2015
TAT HONG HOLDINGS LTD7 0
Share
capital
Reserve
for own
shares
Share-
based
payment
reserve
Capital
reserves
Fair value
reserve
Currency
translation
reserve
Accumulated
profi ts
Total
attributable
to owners of
the Company
Non-
controlling
interests
Total
equity
$’000 $’000 $’000 $’000 $’000 $’000 $’000 $’000 $’000 $’000
At 1 April 2014 337,321 (1,606) 778 29,424 – (20,493) 330,111 675,535 52,073 727,608
Total
comprehensive
income for the
year
Profi t for the year – – – – – – 4,865 4,865 1,932 6,797
Other
comprehensive
income
Net (loss)/gain on translation of net investment in foreign entities – – – 303 – (2,764) – (2,461) 131 (2,330)
Effective portion of changes in fair value of cash fl ow hedges – – – – 383 – – 383 – 383
Net change in fair value of available-for-sale fi nancial assets – – – – (110) – – (110) – (110)
Foreign currency translation reclassifi ed to profi t or loss on disposal of an associate – – – – – 1,023 – 1,023 – 1,023
Total other
comprehensive
income – – – 303 273 (1,741) – (1,165) 131 (1,034)Total
comprehensive
income for the
year – – – 303 273 (1,741) 4,865 3,700 2,063 5,763
CONSOLIDATED STATEMENT OF CHANGES IN EQUITY
Year ended 31 March 2015
The accompanying notes form an integral part of these fi nancial statements.
26Jun_TatHong_FR15_V.indd 7026Jun_TatHong_FR15_V.indd 70 26/6/15 16:5626/6/15 16:56

7 1
Note
Share
capital
Reserve
for own
shares
Share-
based
payment
reserve
Capital
reserves
Fair
value
reserve
Currency
translation
reserve
Accumulated
profi ts
Total
attributable
to owners of
the Company
Non-
controlling
interests
Total
equity
$’000 $’000 $’000 $’000 $’000 $’000 $’000 $’000 $’000 $’000
Transactions
with owners,
recognised
directly in
equity
Contributions
by and
distributions to
owners
Cancellation of share options – – (24) – – – 24 – – –
Value of employee services received for issue of performance shares – – 213 – – – – 213 – 213
Performance shares awarded using treasury shares – 185 (188) 3 – – – – – –
Bonus shares issued by a subsidiary – – – 3,706 – – (3,706) – – –
Dividends declared 26 – – – – – – (9,624) (9,624) (1,039) (10,663)Redemption of
convertible redeemable preference shares (11,472) – – (1,982) – – – (13,454) – (13,454)
Purchase of treasury shares – (345) – – – – – (345) – (345)
Total contributions
by and
distributions to
owners (11,472) (160) 1 1,727 – – (13,306) (23,210) (1,039) (24,249)
Change in
ownership
interest in
subsidiaries
Disposal of subsidiaries 25 – – – – – – – – (7,464) (7,464)
Acquisition of/Equity contribution by non-controlling interests – – – (5,196) – – – (5,196) 4,938 (258)
Total changes
in ownership
interests in
subsidiaries – – – (5,196) – – – (5,196) (2,526) (7,722)Total transactions
with owners (11,472) (160) 1 (3,469) – – (13,306) (28,406) (3,565) (31,971)At 31 March 2015 325,849 (1,766) 779 26,258 273 (22,234) 321,670 650,829 50,571 701,400
CONSOLIDATED STATEMENT OF CHANGES IN EQUITY
Year ended 31 March 2015
The accompanying notes form an integral part of these fi nancial statements.
26Jun_TatHong_FR15_V.indd 7126Jun_TatHong_FR15_V.indd 71 26/6/15 16:5626/6/15 16:56

ANNUAL REPORT 2015
TAT HONG HOLDINGS LTD7 2
2015 2014
$’000 $’000
Cash fl ows from operating activities
Profi t for the year 6,797 33,779Adjustments for:Inventories written off – 216Depreciation of property, plant and equipment 89,802 86,562Gain on disposal of property, plant and equipment (21,153) (6,459)Impairment loss on property, plant and equipment recognised/(reversed) 8,385 (365)Impairment loss on intangible assets 22,447 –Property, plant and equipment written off 203 40Gain on disposal of land rights – (12,961)Impairment loss on investment in associates – 3,400Amortisation of intangible assets 368 512Cost of long service and annual leave 4,975 5,892Gain on disposal of subsidiaries (4,823) (343)Gain on disposal of an associate (151) –Gain on disposal of other fi nancial assets – (294)Dividend income from other fi nancial assets (174) –Share of results of associates (4,624) (4,785)Share of results of joint ventures 214 (645)Gain on fair value adjustment on derivatives, net (867) (3,810)Provisions made/(reversed), net 164 (13)Loss on partial disposal of interest in an associate – 44Share-based payment expenses 213 102Finance income (846) (936)Finance expense 25,960 25,643Income tax expense 11,560 15,169Operating profi t before working capital changes 138,450 140,748
Changes in working capital:Inventories (7,551) (29,069)Trade and other receivables 17,281 20,394Trade and other payables 6,249 (27,048)Non-trade balances with related parties – 97Cash generated from operations 154,429 105,122Income taxes paid (8,985) (19,984)Payment for long service and annual leave and others (3,820) (6,155)Net cash from operating activities 141,624 78,983
CONSOLIDATED STATEMENT OF CASH FLOWS
Year ended 31 March 2015
The accompanying notes form an integral part of these fi nancial statements.
26Jun_TatHong_FR15_V.indd 7226Jun_TatHong_FR15_V.indd 72 26/6/15 16:5626/6/15 16:56

7 3
Note 2015 2014
$’000 $’000
Cash fl ows from investing activities
Purchase of property, plant and equipment (77,997) (140,794)Purchase of intangible assets (1,680) (1,016)Proceeds from disposal of property, plant and equipment 61,143 28,752Net proceeds from disposal of land rights – 13,949Investment in joint ventures (2,261) (842)Investment in other fi nancial assets (390) (434)Loan from an associate – 750Loan to a joint venture – (8,630)Repayment of loan owing by a joint venture 5,609 –Net cash infl ow on disposal of subsidiaries 25 10,726 288Proceeds from partial disposal of interest in an associate – 383Proceeds from disposal of other fi nancial assets – 325Proceeds from disposal of an associate 17,181 –Interest received 846 953Dividends received from other fi nancial assets 174 –Dividends received from associates 1,145 412Dividends received from a joint venture – 2,389Net cash from/(used in) investing activities 14,496 (103,515)
Cash fl ows from fi nancing activities
Purchase of treasury shares (345) –Proceeds from issuance of shares on exercise of share options – 440Net proceeds from issuance of notes payable – 99,052Net (repayment of)/proceeds from trust receipts (30,211) 23,970Proceeds from bank loans 225,158 129,263Repayment of bank loans (197,818) (131,725)Acquisition of non-controlling interests 25 (11,302) –Equity contribution by non-controlling interests 25 11,044 –Redemption of convertible redeemable preference shares (13,454) –Capital injection by non-controlling interests – 1,117Proceeds from fi nance lease obligations 20,477 26,534Repayment of fi nance lease obligations (80,666) (84,451)Interest paid (26,092) (26,104)Dividends paid to non-controlling interests – (450)Dividends paid (9,624) (22,453)Bank balances earmarked for certain banking facilities (1,029) 1,805Net cash (used in)/from fi nancing activities (113,862) 16,998
Net increase/(decrease) in cash and cash equivalents 42,258 (7,534)Cash and cash equivalents at 1 April 51,191 60,974Effect of exchange rate fl uctuations on cash held (1,212) (2,249)Cash and cash equivalents at 31 March 14 92,237 51,191
CONSOLIDATED STATEMENT OF CASH FLOWS
Year ended 31 March 2015
The accompanying notes form an integral part of these fi nancial statements.
26Jun_TatHong_FR15_V.indd 7326Jun_TatHong_FR15_V.indd 73 26/6/15 16:5626/6/15 16:56

ANNUAL REPORT 2015
TAT HONG HOLDINGS LTD7 4
During the year ended 31 March 2015, the Group acquired property, plant and equipment with an aggregate cost of $102,809,000 (2014: $181,651,000) of which $24,813,000 (2014: $40,856,000) was acquired by means of fi nance leases. In addition, property, plant and equipment of $32,391,000 (2014: $28,941,000) was reclassifi ed from inventories during the fi nancial year, of which $29,678,000 (2014: $26,534,000) was fi nanced by means of fi nance leases.
CONSOLIDATED STATEMENT OF CASH FLOWS
Year ended 31 March 2015
The accompanying notes form an integral part of these fi nancial statements.
26Jun_TatHong_FR15_V.indd 7426Jun_TatHong_FR15_V.indd 74 26/6/15 16:5626/6/15 16:56

7 5NOTES TO THE FINANCIAL STATEMENTS
Year ended 31 March 2015
These notes form an integral part of the fi nancial statements.
The fi nancial statements were authorised for issue by the Board of Directors on 29 May 2015.
1 DOMICILE AND ACTIVITIES
Tat Hong Holdings Ltd (the Company) is incorporated in the Republic of Singapore and has its registered offi ce at 82 Ubi Avenue 4, #05-01, Edward Boustead Centre, Singapore 408832.
The principal activities of the Company are those relating to investment holding. The principal activities of the subsidiaries are set out in note 5 below.
The immediate and ultimate holding company is Chwee Cheng & Sons Pte Ltd, a company incorporated in the Republic of Singapore.
The consolidated fi nancial statements relate to the Company and its subsidiaries (together referred to as the Group) and the Group’s interest in equity-accounted investees.
2 BASIS OF PREPARATION
2.1 Statement of compliance
The fi nancial statements have been prepared in accordance with the Singapore Financial Reporting Standards (FRS).
2.2 Basis of measurement
The fi nancial statements have been prepared on the historical cost basis except for the following material items in the statements of fi nancial position:
• derivative fi nancial instruments are measured at fair value; and• fi nancial instruments at fair value through profi t or loss are measured at fair value.
2.3 Functional and presentation currency
These fi nancial statements are presented in Singapore dollars, which is the Company’s functional currency. All fi nancial information presented in Singapore dollars have been rounded to the nearest thousand, unless otherwise stated.
2.4 Use of estimates and judgements
The preparation of the fi nancial statements in conformity with FRS requires the Management to make judgements, estimates and assumptions that affect the application of accounting policies and the reported amounts of assets, liabilities, income and expenses. Actual results may differ from these estimates.
26Jun_TatHong_FR15_V.indd 7526Jun_TatHong_FR15_V.indd 75 26/6/15 16:5626/6/15 16:56

7 6 NOTES TO THE FINANCIAL STATEMENTS
Year ended 31 March 2015
ANNUAL REPORT 2015
TAT HONG HOLDINGS LTD
2 BASIS OF PREPARATION (CONT’D)
2.4 Use of estimates and judgements (Cont’d)
Estimates and underlying assumptions are reviewed on an ongoing basis. Revisions to accounting estimates are recognised in the period in which the estimates are revised and in any future periods affected.
Information about assumptions and estimation uncertainties that have a signifi cant risk of resulting in a material adjustment within the next fi nancial year are included in the following notes:
• Note 4 – useful life, residual values and impairment of property, plant and equipment;• Note 5 – assumptions of recoverable amounts relating to investment in subsidiaries;• Note 6 – assumptions of recoverable amounts relating to investment in associates;• Note 7 – assumptions of recoverable amounts relating to investment in joint ventures;• Note 10 – assumptions of recoverable amounts relating to goodwill impairment;• Note 12 – assessment of allowance for inventory obsolescence;• Note 13 – assessment of the recoverability of trade receivables;• Note 23 – income taxes;• Note 25 – valuation of assets, liabilities and contingent liabilities acquired in business
combinations; and• Note 27 – valuation of fi nancial instruments.
Measurement of fair values
A number of the Group’s accounting policies and disclosures require the measurement of fair values, for both fi nancial and non-fi nancial assets and liabilities.
The Group has an established approach with respect to the measurement of fair values. If third party information, such as broker quotes or pricing services, is used to measure fair values, the Group assesses and documents the evidence obtained from the third parties to support the conclusion that such valuations meet the requirements of FRS, including the level in the fair value hierarchy in which such valuations should be classifi ed.
Fair values are categorised into different levels in a fair value hierarchy based on the inputs used in the valuation techniques as follows:
• Level 1: quoted prices (unadjusted) in active markets for identical assets or liabilities.• Level 2: inputs other than quoted prices included in Level 1 that are observable for the asset or
liability, either directly (i.e., as prices) or indirectly (i.e., derived from prices).• Level 3: inputs for the asset or liability that are not based on observable market data (unobservable
inputs).
If the inputs used to measure the fair value of an asset or a liability might be categorised in different levels of the fair value hierarchy, then the fair value measurement is categorised in its entirety in the same level of the fair value hierarchy as the lowest level input that is signifi cant to the entire measurement (with Level 3 being the lowest).
26Jun_TatHong_FR15_V.indd 7626Jun_TatHong_FR15_V.indd 76 26/6/15 16:5626/6/15 16:56

7 7NOTES TO THE FINANCIAL STATEMENTS
Year ended 31 March 2015
2 BASIS OF PREPARATION (CONT’D)
2.4 Use of estimates and judgements (Cont’d)
Further information about the assumptions made in measuring fair values is included in the following notes:
• Note 19 – share-based payment; and• Note 27 – fi nancial instruments.
2.5 Changes in accounting policies
Subsidiaries
As a result of FRS 110 Consolidated Financial Statements, the Group has changed its accounting policy for determining whether it has control over and consequently whether it consolidates its investees. FRS 110 introduces a new control model that focuses on whether the Group has power over an investee, exposure or rights to variable returns from its involvement with the investee and ability to use its power to affect those returns.
In accordance with the transitional provisions of FRS 110, the Group reassessed the control conclusion for its investees at 1 April 2014. The Group continues to consolidate its investment in subsidiaries and there is no impact on the recognised assets, liabilities and comprehensive income of the Group.
Joint arrangements
From 1 April 2014, as a result of FRS 111 Joint Arrangements, the Group has changed its accounting policy for its interests in joint arrangements. Under FRS 111, the Group has classifi ed its interests in joint arrangements as either joint operations (if the Group has rights to the assets, and obligations for the liabilities, relating to an arrangement) or joint ventures (if the Group has rights only to the net assets of an arrangement). When making this assessment, the Group considered the structure of the arrangements, the legal form of any separate vehicles, the contractual terms of the arrangements and other facts and circumstances. Previously, the structure of the arrangement was the sole focus of classifi cation.
The Group has re-evaluated its involvement in its joint arrangements and has reclassifi ed the investments from jointly controlled entities to joint ventures. Notwithstanding the reclassifi cation, the investments continue to be recognised by applying the equity method and there is no impact on the recognised assets, liabilities and comprehensive income of the Group.
Disclosure of interests in other entities
From 1 April 2014, as a result of FRS 112 Disclosure of Interests in Other Entities, the Group has expanded its disclosures about its interests in subsidiaries (see note 5), associates (see note 6) and joint ventures (see note 7), as well as non-controlling interests in subsidiaries (see note 30).
26Jun_TatHong_FR15_V.indd 7726Jun_TatHong_FR15_V.indd 77 26/6/15 16:5626/6/15 16:56

7 8 NOTES TO THE FINANCIAL STATEMENTS
Year ended 31 March 2015
ANNUAL REPORT 2015
TAT HONG HOLDINGS LTD
2 BASIS OF PREPARATION (CONT’D)
2.5 Changes in accounting policies (Cont’d)
Offsetting of fi nancial assets and fi nancial liabilities
Under the Amendments to FRS 32 Financial Instruments: Presentation – Offsetting Financial Assets and Financial Liabilities, to qualify for offsetting, the right to set off a fi nancial asset and a fi nancial liability must not be contingent on a future event and must be enforceable both in the normal course of business and in the event of default, insolvency or bankruptcy of the entity and all counterparties.
The adoption of the amendment to FRS 32 has no impact on the recognised assets, liabilities and comprehensive income of the Group.
3 SIGNIFICANT ACCOUNTING POLICIES
The accounting policies set out below have been applied consistently to all periods presented in these fi nancial statements, and have been applied consistently by Group entities, except as explained in note 2.5, which addresses changes in accounting policies.
Certain comparative amounts have been reclassifi ed to conform to the current year’s presentation (see note 33).
3.1 Basis of consolidation
Business combinations
Business combinations are accounted for using the acquisition method in accordance with FRS 103 Business Combinations as at the acquisition date, which is the date on which control is transferred to the Group.
The Group measures goodwill at the acquisition date as:• the fair value of the consideration transferred; plus • the recognised amount of any non-controlling interests in the acquiree; plus• if the business combination is achieved in stages, the fair value of the existing equity interest in the
acquiree, over the net recognised amount (generally fair value) of the identifi able assets acquired and liabilities assumed. Any goodwill that arises is tested annually for impairment.
When the excess is negative, a bargain purchase gain is recognised immediately in profi t or loss.
The consideration transferred does not include amounts related to the settlement of pre-existing relationships. Such amounts are generally recognised in profi t or loss.
26Jun_TatHong_FR15_V.indd 7826Jun_TatHong_FR15_V.indd 78 26/6/15 16:5626/6/15 16:56

7 9NOTES TO THE FINANCIAL STATEMENTS
Year ended 31 March 2015
3 SIGNIFICANT ACCOUNTING POLICIES (CONT’D)
3.1 Basis of consolidation (Cont’d)
Business combinations (Cont’d)
Any contingent consideration payable is recognised at fair value at the acquisition date and included in the consideration transferred. If the contingent consideration is classifi ed as equity, it is not re-measured and settlement is accounted for within equity. Otherwise, subsequent changes to the fair value of the contingent consideration are recognised in profi t or loss.
When share-based payment awards (replacement awards) are required to be exchanged for awards held by the acquiree’s employees (acquiree’s awards) and relate to past services, then all or a portion of the amount of the acquirer’s replacement awards is included in measuring the consideration transferred in the business combination. This determination is based on the market-based value of the replacement awards compared with the market-based value of the acquiree’s awards and the extent to which the replacement awards relate to past and/or future service.
Non-controlling interests that are present ownership interests and entitle their holders to a proportionate share of the acquiree’s net assets in the event of liquidation are measured either at fair value or at the non-controlling interests’ proportionate share of the recognised amounts of the acquiree’s identifi able net assets, at the acquisition date. The measurement basis taken is elected on a transaction-by-transaction basis. All other non-controlling interests are measured at acquisition-date at fair value or, when applicable, on the basis specifi ed in another FRS.
Costs related to the acquisition, other than those associated with the issue of debt or equity securities, that the Group incurs in connection with a business combination are expensed as incurred.
Changes in the Group’s interest in a subsidiary that do not result in a loss of control are accounted for as transactions with owners in their capacity as owners and therefore no goodwill is recognised as a result. Adjustments to non-controlling interests arising from transactions that do not involve the loss of control are based on a proportionate amount of the net assets of the subsidiary.
Subsidiaries
Subsidiaries are entities controlled by the Group. The Group controls an entity when it is exposed to, or has rights to, variable returns from its involvement with the entity and has the ability to affect those returns through its power over the entity. The fi nancial statements of subsidiaries are included in the consolidated fi nancial statements from the date that control commences until the date that control ceases.
The accounting policies of subsidiaries have been changed where necessary to align them with the policies adopted by the Group. Losses applicable to the non-controlling interests in a subsidiary are allocated to the non-controlling interests even if doing so causes the non-controlling interests to have a defi cit balance.
26Jun_TatHong_FR15_V.indd 7926Jun_TatHong_FR15_V.indd 79 26/6/15 16:5626/6/15 16:56

8 0 NOTES TO THE FINANCIAL STATEMENTS
Year ended 31 March 2015
ANNUAL REPORT 2015
TAT HONG HOLDINGS LTD
3 SIGNIFICANT ACCOUNTING POLICIES (CONT’D)
3.1 Basis of consolidation (Cont’d)
Loss of control
Upon the loss of control, the Group derecognises the assets and liabilities of the subsidiary, any non-controlling interests and the other components of equity related to the subsidiary. Any surplus or defi cit arising on the loss of control is recognised in profi t or loss. If the Group retains any interest in the previous subsidiary, then such interest is measured at fair value at the date that control is lost. Subsequently, it is accounted for as an equity-accounted investee or as an available-for-sale fi nancial asset depending on the level of infl uence retained.
Investments in associates and joint ventures (equity-accounted investees)
Associates are those entities in which the Group has signifi cant infl uence, but not control, or joint control, over the fi nancial and operating policies of these entities. Signifi cant infl uence is presumed to exist when the Group holds 20% or more of the voting power of another entity. A joint venture is an arrangement in which the Group has joint control, whereby the Group has rights to the net assets of the arrangement, rather than rights to its assets and obligations for its liabilities.
Investments in associates and joint ventures are accounted for using the equity method. They are recognised initially at cost, which includes transaction costs. Subsequent to initial recognition, the consolidated fi nancial statements include the Group’s share of the profi t or loss and other comprehensive income of equity-accounted investees, after adjustments to align the accounting policies with those of the Group, from the date that signifi cant infl uence or joint control commences until the date that signifi cant infl uence or joint control ceases.
When the Group’s share of losses exceeds its interest in an equity-accounted investee, the carrying amount of the investment, together with any long-term interests that form part thereof, is reduced to zero, and the recognition of further losses is discontinued except to the extent that the Group has an obligation to fund the investee’s operations or has made payments on behalf of the investee.
Transactions eliminated on consolidation
Intra-group balances and transactions, and any unrealised income or expenses arising from intra-group transactions, are eliminated in preparing the consolidated fi nancial statements. Unrealised gains arising from transactions with equity-accounted investees are eliminated against the investment to the extent of the Group’s interest in the investee. Unrealised losses are eliminated in the same way as unrealised gains, but only to the extent that there is no evidence of impairment.
Subsidiaries, associates and joint ventures in the separate fi nancial statements
Investments in subsidiaries, associates and joint ventures are stated in the Company’s statement of fi nancial position at cost less accumulated impairment losses.
26Jun_TatHong_FR15_V.indd 8026Jun_TatHong_FR15_V.indd 80 26/6/15 16:5626/6/15 16:56

8 1NOTES TO THE FINANCIAL STATEMENTS
Year ended 31 March 2015
3 SIGNIFICANT ACCOUNTING POLICIES (CONT’D)
3.2 Foreign currency
Foreign currency transactions
Transactions in foreign currencies are translated to the respective functional currencies of Group entities at exchange rates at the date of the transactions. Monetary assets and liabilities denominated in foreign currencies at the reporting date are retranslated to the functional currency at the exchange rate at the reporting date. The foreign currency gain or loss on monetary items is the difference between amortised cost in the functional currency at the beginning of the year, adjusted for effective interest and payments during the year, and the amortised cost in foreign currency translated at the exchange rate at the end of the year.
Non-monetary assets and liabilities denominated in foreign currencies that are measured at fair value are retranslated to the functional currency at the exchange rate at the date that the fair value was determined. Non-monetary items in a foreign currency that are measured in terms of historical cost are translated using the exchange rate at the date of the transaction. Foreign currency differences arising on retranslation are recognised in profi t or loss, except for the following differences which are recognised in the other comprehensive income arising on the retranslation of:
• available-for-sale equity instruments (except on impairment in which case foreign currency differences that have been recognised in other comprehensive income are reclassifi ed to profi t or loss);
• a fi nancial liability designated as a hedge of the net investment in a foreign operation to the extent that the hedge is effective; or
• qualifying cash fl ow hedges to the extent that the hedge is effective.
Foreign operations
The assets and liabilities of foreign operations, excluding goodwill and fair value adjustments arising on acquisition, are translated to Singapore dollars at exchange rates at the reporting date. The income and expenses of foreign operations are translated to Singapore dollars at exchange rates at the dates of the transactions. Goodwill and fair value adjustments arising on the acquisition of a foreign operation on or after 1 April 2005 are treated as assets and liabilities of the foreign operation and translated at the exchange rates at the end of the reporting period. For acquisitions prior to 1 April 2005, the exchange rates at the date of acquisition were used.
Foreign currency differences are recognised in other comprehensive income, and presented in the foreign currency translation reserve (currency translation reserve) in equity. However, if the foreign operation is a non-wholly-owned subsidiary, then the relevant proportionate share of the translation difference is allocated to the non-controlling interests. When a foreign operation is disposed off such that control, signifi cant infl uence or joint control is lost, the cumulative amount in the currency translation reserve related to that foreign operation is reclassifi ed to profi t or loss as part of the gain or loss on disposal. When the Group disposes of only part of its interest in a subsidiary that includes a foreign operation while retaining control, the relevant proportion of the cumulative amount is reattributed to non-controlling interests. When the Group disposes of only part of its investment in an associate or joint venture that includes a foreign operation while retaining signifi cant infl uence or joint control, the relevant proportion of the cumulative amount is reclassifi ed to profi t or loss.
26Jun_TatHong_FR15_V.indd 8126Jun_TatHong_FR15_V.indd 81 26/6/15 16:5626/6/15 16:56

8 2 NOTES TO THE FINANCIAL STATEMENTS
Year ended 31 March 2015
ANNUAL REPORT 2015
TAT HONG HOLDINGS LTD
3 SIGNIFICANT ACCOUNTING POLICIES (CONT’D)
3.2 Foreign currency (Cont’d)
When the settlement of a monetary item receivable from or payable to a foreign operation is neither planned nor likely in the foreseeable future, foreign exchange gains and losses arising from such a monetary item are considered to form part of a net investment in a foreign operation and are recognised in other comprehensive income, and are presented in the currency translation reserve in equity.
3.3 Financial instruments
Non-derivative fi nancial assets
The Group initially recognises loans and receivables and deposits on the date that they are originated. All other fi nancial assets (including assets designated at fair value through profi t or loss) are recognised initially on the trade date, which is the date that the Group becomes a party to the contractual provisions of the instrument.
The Group derecognises a fi nancial asset when the contractual rights to the cash fl ows from the asset expire, or it transfers the rights to receive the contractual cash fl ows on the fi nancial asset in a transaction in which substantially all the risks and rewards of ownership of the fi nancial asset are transferred. Any interest in transferred fi nancial assets that is created or retained by the Group is recognised as a separate asset or liability.
Financial assets and liabilities are offset and the net amount presented in the statement of fi nancial position when, and only when, the Group has a legal right to offset the amounts and intends either to settle on a net basis or to realise the asset and settle the liability simultaneously.
The Group classifi es non-derivative fi nancial assets into the following categories: loans and receivables and available-for-sale fi nancial assets.
Loans and receivables
Loans and receivables are fi nancial assets with fi xed or determinable payments that are not quoted in an active market. Such assets are recognised initially at fair value plus any directly attributable transaction costs. Subsequent to initial recognition, loans and receivables are measured at amortised cost using the effective interest method, less any impairment losses.
Loans and receivables comprise cash and cash equivalents, trade and other receivables, including fi nance lease receivables.
Cash and cash equivalents
Cash and cash equivalents comprise cash balances and bank deposits. Bank overdrafts that are repayable on demand and form an integral part of the Group’s cash management are included as a component of cash and cash equivalents for the purpose of the statement of cash fl ows.
26Jun_TatHong_FR15_V.indd 8226Jun_TatHong_FR15_V.indd 82 26/6/15 16:5626/6/15 16:56

8 3NOTES TO THE FINANCIAL STATEMENTS
Year ended 31 March 2015
3 SIGNIFICANT ACCOUNTING POLICIES (CONT’D)
3.3 Financial instruments (Cont’d)
Finance lease receivables
Leases in terms of which the Group assumes substantially all the risks and rewards of ownership are classifi ed as fi nance leases. Upon initial recognition, the leased asset is measured at an amount equal to the lower of its fair value and the present value of the minimum lease payments. Subsequently to initial recognition, the asset is accounted for in accordance with the accounting policy applicable to that asset.
Available-for-sale fi nancial assets
Available-for-sale fi nancial assets are non-derivative fi nancial assets that are designated as available-for-sale or are not classifi ed in any of the above categories of fi nancial assets. Available-for-sale fi nancial assets are recognised initially at fair value plus any directly attributable transaction costs. For those fi nancial assets where there is no active market and where fair value cannot be measured reliably, they are measured at cost. Subsequent to initial recognition, they are measured at fair value and changes therein, other than impairment losses (see note 3.7) and foreign currency differences on available-for-sale debt instruments, are recognised in other comprehensive income and presented in the fair value reserve in equity. When an investment is derecognised, the cumulative gain or loss in other comprehensive income is reclassifi ed to profi t or loss.
Available-for-sale fi nancial assets comprise equity securities.
Non-derivative fi nancial liabilities
The Group initially recognises debt securities issued and subordinated liabilities on the date that they are originated. Financial liabilities for contingent consideration payable in a business combination are recognised at the acquisition date. All other fi nancial liabilities (including liabilities designated at fair value through profi t or loss) are recognised initially on the trade date, which is the date that the Group becomes a party to the contractual provisions of the instrument.
The Group derecognises a fi nancial liability when its contractual obligations are discharged, cancelled or expire.
Financial liabilities for contingent consideration payable in a business combination are initially measured at fair value. Subsequent changes in the fair value of the contingent consideration are recognised in profi t or loss.
Financial assets and liabilities are offset and the net amount presented in the statement of fi nancial position when, and only when, the Group has a legal right to offset the amounts and intends either to settle on a net basis or to realise the asset and settle the liability simultaneously.
The Group classifi es non-derivative fi nancial liabilities into the other fi nancial liabilities category. Such fi nancial liabilities are recognised initially at fair value plus any directly attributable transaction costs. Subsequent to initial recognition, these fi nancial liabilities are measured at amortised cost using the effective interest method.
26Jun_TatHong_FR15_V.indd 8326Jun_TatHong_FR15_V.indd 83 26/6/15 16:5626/6/15 16:56

8 4 NOTES TO THE FINANCIAL STATEMENTS
Year ended 31 March 2015
ANNUAL REPORT 2015
TAT HONG HOLDINGS LTD
3 SIGNIFICANT ACCOUNTING POLICIES (CONT’D)
3.3 Financial instruments (Cont’d)
Other fi nancial liabilities comprise fi nancial liabilities and trade and other payables.
Intra-group fi nancial guarantees in the separate fi nancial statements
Financial guarantees are fi nancial instruments issued by the Group that require the issuer to make specifi ed payments to reimburse the holder for the loss it incurs because a specifi ed debtor fails to meet payment when due in accordance with the original or modifi ed terms of a debt instrument.
Financial guarantees are recognised initially at fair value and are classifi ed as fi nancial liabilities. Subsequent to initial measurement, the fi nancial guarantees are stated at the higher of the initial fair value less cumulative amortisation and the amount that would be recognised if they were accounted for as contingent liabilities. When the fi nancial guarantees are terminated before their original expiry date, the carrying amount of the fi nancial guarantees is transferred to profi t or loss.
Share capital
Ordinary shares
Ordinary shares are classifi ed as equity. Incremental costs directly attributable to the issue of ordinary shares and share options are recognised as a deduction from equity, net of any tax effects.
Convertible redeemable preference shares
Convertible redeemable preference shares are classifi ed as equity if it is non-redeemable, or redeemable only at the Company’s option, and any dividends are discretionary. Dividends thereon are recognised as distributions within equity upon approval by the Company’s shareholders.
Convertible redeemable preference shares are classifi ed as a fi nancial liability if it is redeemable on a specifi c date or at the option of the shareholders, or if dividend payments are not discretionary. Dividends thereon are recognised as interest expense in profi t or loss as accrued.
Repurchase, disposal and reissue of share capital (treasury shares)
When share capital recognised as equity is repurchased, the amount of the consideration paid, which includes directly attributable costs, net of any tax effects, is recognised as a deduction from equity. Repurchased shares are classifi ed as treasury shares and are presented as a deduction from total equity. When treasury shares are sold or reissued subsequently, the amount received is recognised as an increase in equity, and the resulting surplus or defi cit on the transaction is presented in non-distributable capital reserve.
26Jun_TatHong_FR15_V.indd 8426Jun_TatHong_FR15_V.indd 84 26/6/15 16:5626/6/15 16:56

8 5NOTES TO THE FINANCIAL STATEMENTS
Year ended 31 March 2015
3 SIGNIFICANT ACCOUNTING POLICIES (CONT’D)
3.3 Financial instruments (Cont’d)
Distribution of non-cash assets to owners of the Company
The Group measures a liability to distribute non-cash assets as a dividend to the owners of the Company at the fair value of the assets to be distributed. The carrying amount of the dividend is re-measured at each reporting date and at the settlement dates with any changes recognised directly in equity as adjustments to the amount of the distribution. On settlement of the transactions, the Group recognises the difference, if any, between the carrying amount of the assets distributed and the carrying amount of the liability in profi t or loss.
Compound fi nancial instruments
Compound fi nancial instruments issued by the Group comprise convertible redeemable preference shares denominated in Singapore dollars that can be converted to share capital at the option of the holder, where the number of shares to be issued is fi xed.
The liability component of a compound fi nancial instrument is recognised initially at the fair value of a similar liability that does not have an equity conversion option. The equity component is recognised initially at the difference between the fair value of the compound fi nancial instrument as a whole and the fair value of the liability component. Any directly attributable transaction costs are allocated to the liability and equity components in proportion to their initial carrying amounts.
Subsequent to initial recognition, the liability component of a compound fi nancial instrument is measured at amortised cost using the effective interest method. The equity component of a compound fi nancial instrument is not remeasured subsequent to initial recognition.
Interest and gains and losses related to the fi nancial liability component are recognised in profi t or loss. On conversion, the fi nancial liability is reclassifi ed to equity; no gain or loss is recognised on conversion.
Derivative fi nancial instruments, including hedge accounting
The Group holds derivative fi nancial instruments to hedge its foreign currency and interest rate risk exposures. Embedded derivatives are separated from the host contract and accounted for separately if the economic characteristics and risks of the host contract and the embedded derivative are not closely related, a separate instrument with the same terms as the embedded derivative would meet the defi nition of a derivative, and the combined instrument is not measured at fair value through profi t or loss.
26Jun_TatHong_FR15_V.indd 8526Jun_TatHong_FR15_V.indd 85 26/6/15 16:5626/6/15 16:56

8 6 NOTES TO THE FINANCIAL STATEMENTS
Year ended 31 March 2015
ANNUAL REPORT 2015
TAT HONG HOLDINGS LTD
3 SIGNIFICANT ACCOUNTING POLICIES (CONT’D)
3.3 Financial instruments (Cont’d)
On initial designation of the derivative as the hedging instrument, the Group formally documents the relationship between the hedging instrument and the hedged item, including the risk management objectives and strategy in undertaking the hedge transaction and the hedged risk, together with the methods that will be used to assess the effectiveness of the hedging relationship. The Group makes an assessment, both at the inception of the hedge relationship as well as on an ongoing basis, of whether the hedging instruments are expected to be ‘highly effective’ in offsetting the changes in the fair value or cash fl ows of the respective hedged items attributable to the hedged risk, and whether the actual results of each hedge are within a range of 80 – 125%. For a cash fl ow hedge of a forecast transaction, the transaction should be highly probable to occur and should present an exposure to variations in cash fl ows that could ultimately affect reported profi t or loss.
Derivatives are recognised initially at fair value; any attributable transaction costs are recognised in profi t or loss as incurred. Subsequent to initial recognition, derivatives are measured at fair value, and changes therein are accounted for as described below.
Cash fl ow hedges
When a derivative is designated as the hedging instrument in a hedge of the variability in cash fl ows attributable to a particular risk associated with a recognised asset or liability or a highly probable forecast transaction that could affect profi t or loss, the effective portion of changes in the fair value of the derivative is recognised in other comprehensive income and presented in the hedging reserve in equity. Any ineffective portion of changes in the fair value of the derivative is recognised immediately in profi t or loss.
When the hedged item is a non-fi nancial asset, the amount accumulated in equity is retained in other comprehensive income and reclassifi ed to profi t or loss in the same period or periods during which the non-fi nancial item affects profi t or loss. In other cases as well, the amount accumulated in equity is reclassifi ed to profi t or loss in the same period that the hedged item affects profi t or loss. If the hedging instrument no longer meets the criteria for hedge accounting, expires or is sold, terminated or exercised, or the designation is revoked, then hedge accounting is discontinued prospectively. If the forecast transaction is no longer expected to occur, then the balance in equity is reclassifi ed to profi t or loss.
3.4 Property, plant and equipment
Recognition and measurement
Items of property, plant and equipment are measured at cost less accumulated depreciation and accumulated impairment losses.
26Jun_TatHong_FR15_V.indd 8626Jun_TatHong_FR15_V.indd 86 26/6/15 16:5626/6/15 16:56

8 7NOTES TO THE FINANCIAL STATEMENTS
Year ended 31 March 2015
3 SIGNIFICANT ACCOUNTING POLICIES (CONT’D)
3.4 Property, plant and equipment (Cont’d)
Cost includes expenditure that is directly attributable to the acquisition of the asset. The cost of self-constructed assets includes:
• the cost of materials and direct labour; • any other costs directly attributable to bringing the assets to a working condition for their intended
use;• when the Group has an obligation to remove the asset or restore the site, an estimate of the costs
of dismantling and removing the items and restoring the site on which they are located; and • capitalised borrowing costs.
Purchased software that is integral to the functionality of the related equipment is capitalised as part of that equipment.
When parts of an item of property, plant and equipment have different useful lives, they are accounted for as separate items (major components) of property, plant and equipment.
The gain or loss on disposal of an item of property, plant and equipment (calculated as the difference between the net proceeds from disposal with the carrying amount of the item) is recognised in profi t or loss.
Subsequent costs
The cost of replacing a component of an item of property, plant and equipment is recognised in the carrying amount of the item if it is probable that the future economic benefi ts embodied within the component will fl ow to the Group, and its cost can be measured reliably. The carrying amount of the replaced component is derecognised. The costs of the day-to-day servicing of property, plant and equipment are recognised in profi t or loss as incurred.
Depreciation
Depreciation is based on the cost of an asset less its residual value. Signifi cant components of individual assets are assessed and if a component has a useful life that is different from the remainder of that asset, that component is depreciated separately.
Depreciation is recognised as an expense in profi t or loss on a straight-line basis over the estimated useful lives of each component of an item of property, plant and equipment, unless it is included in the carrying amount of another asset. Leased assets are depreciated over the shorter of the lease term and their useful lives unless it is reasonably certain that the Group will obtain ownership by the end of the lease term. Freehold land is not depreciated.
Depreciation is recognised from the date that the property, plant and equipment are installed and are ready for use, or in respect of internally constructed assets, from the date that the asset is completed and ready for use.
26Jun_TatHong_FR15_V.indd 8726Jun_TatHong_FR15_V.indd 87 26/6/15 16:5626/6/15 16:56

8 8 NOTES TO THE FINANCIAL STATEMENTS
Year ended 31 March 2015
ANNUAL REPORT 2015
TAT HONG HOLDINGS LTD
3 SIGNIFICANT ACCOUNTING POLICIES (CONT’D)
3.4 Property, plant and equipment (Cont’d)
The estimated useful lives for the current and comparative years are as follows:
• Freehold properties 50 years• Leasehold properties Over the terms of the leases between 25 to 43 years• Plant and machinery 10 to 20 years• Furniture, fi ttings, offi ce and workshop equipment 3 to 5 years• Motor vehicles 5 years• Vessels 12 years
No depreciation is provided on assets under construction.
Depreciation methods, useful lives and residual values are reviewed at the end of each reporting period and adjusted if appropriate.
3.5 Intangible assets
Goodwill
Goodwill that arises upon the acquisition of subsidiaries is included in intangible assets. For the measurement of goodwill at initial recognition, see note 3.1 – Business combinations.
Subsequent measurement
Goodwill is measured at cost less accumulated impairment losses. In respect of associates and joint ventures, the carrying amount of goodwill is included in the carrying amount of the investment, and an impairment loss on such an investment is not allocated to any asset, including goodwill, that forms part of the carrying amount of the associates and joint ventures.
Other intangible assets
Other intangible assets that are acquired by the Group and have fi nite useful lives are measured at cost less accumulated amortisation and accumulated impairment losses.
Subsequent expenditure
Subsequent expenditure is capitalised only when it increases the future economic benefi ts embodied in the specifi c asset to which it relates. All other expenditure, including expenditure on internally generated goodwill and brands, is recognised in profi t or loss as incurred.
26Jun_TatHong_FR15_V.indd 8826Jun_TatHong_FR15_V.indd 88 26/6/15 16:5626/6/15 16:56

8 9NOTES TO THE FINANCIAL STATEMENTS
Year ended 31 March 2015
3 SIGNIFICANT ACCOUNTING POLICIES (CONT’D)
3.5 Intangible assets (Cont’d)
Amortisation
Amortisation is calculated based on the cost of the asset, less its residual value.
Amortisation is recognised in profi t or loss on a straight-line basis over the estimated useful lives of intangible assets, other than goodwill, from the date that they are available for use. The estimated useful lives for the current and comparative years are as follows:
• Customer relationships 1 to 7 years• Computer software 3 years
Amortisation methods, useful lives and residual values are reviewed at the end of each reporting period and adjusted if appropriate.
3.6 Inventories
Inventories held for resale are stated at the lower of cost (principally specifi c identifi cation and weighted average cost method) and net realisable value. Net realisable value is the estimated selling price in the ordinary course of business less the estimated costs of completion and selling expenses.
Cost of machinery and equipment is determined on specifi c identifi cation cost basis. Cost of spare parts is calculated using weighted average cost basis.
Cost comprises all costs of purchase, costs of conversion and other costs incurred in bringing the inventories to their present location and condition. In the case of work in progress, cost includes an appropriate share of overheads based on normal operating capacity.
3.7 Impairment
(i) Non-derivative fi nancial assets
A fi nancial asset not carried at fair value through profi t or loss, including an interest in an associate and joint venture, is assessed at the end of each reporting period to determine whether there is any objective evidence that it is impaired. A fi nancial asset is impaired if objective evidence indicates that a loss event(s) has occurred after the initial recognition of the asset, and that the loss event(s) has an impact on the estimated future cash fl ows of that asset that can be estimated reliably.
Objective evidence that fi nancial assets (including equity securities) are impaired can include default or delinquency by a debtor, restructuring of an amount due to the Group on terms that the Group would not consider otherwise, indications that a debtor or issuer will enter bankruptcy, adverse changes in the payment status of borrowers or issuers on the group, economic conditions that correlate with defaults or and the disappearance of an active market for a security. In addition, for an investment in an equity security, a signifi cant or prolonged decline in its fair value below its cost is objective evidence of impairment. The Group considers a decline of 20% to be signifi cant and a period of 9 months to be prolonged.
26Jun_TatHong_FR15_V.indd 8926Jun_TatHong_FR15_V.indd 89 26/6/15 16:5626/6/15 16:56
9 0 NOTES TO THE FINANCIAL STATEMENTS
Year ended 31 March 2015
ANNUAL REPORT 2015
TAT HONG HOLDINGS LTD
3 SIGNIFICANT ACCOUNTING POLICIES (CONT’D)
3.7 Impairment (Cont’d)
(i) Non-derivative fi nancial assets (Cont’d)
Loans and receivables
The Group considers evidence of impairment for loans and receivables at both a specifi c asset and collective level. All individually signifi cant loans and receivables are assessed for specifi c impairment. All individually signifi cant loans and receivables found not to be specifi cally impaired are then collectively assessed for any impairment that has been incurred but not yet identifi ed. Loans and receivables that are not individually signifi cant are collectively assessed for impairment by grouping together loans and receivables with similar risk characteristics.
In assessing collective impairment, the Group uses historical trends of the probability of default, timing of recoveries and the amount of loss incurred, adjusted for the Management’s judgement as to whether current economic and credit conditions are such that the actual losses are likely to be greater or less than suggested by historical trends.
An impairment loss in respect of a fi nancial asset measured at amortised cost is calculated as the difference between its carrying amount and the present value of the estimated future cash fl ows discounted at the asset’s original effective interest rate. Losses are recognised in profi t or loss and refl ected in an allowance account against loans and receivables. Interest on the impaired asset continues to be recognised. When the Group considers that there are no realistic prospects of recovery of the asset, the relevant amounts are written off. If the amount of impairment loss subsequently decreases and the decrease can be related objectively to an event occurring after the impairment was recognised then the previously recognised impairment loss is reversed through profi t or loss.
Available-for-sale fi nancial assets
Impairment losses on available-for-sale equity fi nancial assets are recognised by reclassifying the losses accumulated in the fair value reserve in equity to profi t or loss. The cumulative loss that is reclassifi ed from equity to profi t or loss is the difference between the acquisition cost, net of any principal repayment and amortisation, and the current fair value, less any impairment loss previously recognised in profi t or loss. Changes in cumulative impairment provisions attributable to application of the effective interest method are refl ected as a component of interest income. If, in a subsequent period, the fair value of an impaired available-for-sale debt security increases and the increase can be related objectively to an event occurring after the impairment loss was recognised in profi t or loss, then the impairment loss is reversed. The amount of the reversal is recognised in profi t or loss. However, any subsequent recovery in the fair value of an impaired available-for-sale equity security is recognised in other comprehensive income.
26Jun_TatHong_FR15_V.indd 9026Jun_TatHong_FR15_V.indd 90 26/6/15 16:5626/6/15 16:56
9 1NOTES TO THE FINANCIAL STATEMENTS
Year ended 31 March 2015
3 SIGNIFICANT ACCOUNTING POLICIES (CONT’D)
3.7 Impairment (Cont’d)
(i) Non-derivative fi nancial assets (Cont’d)
Associates and joint ventures
An impairment loss in respect of an associate or joint venture is measured by comparing the recoverable amount of the investment with its carrying amount in accordance with note 3.7 (ii). An impairment loss is recognised in profi t or loss. An impairment loss is reversed if there has been a favourable change in the estimates used to determine the recoverable amount.
(ii) Non-fi nancial assets
The carrying amounts of the Group’s non-fi nancial assets, other than inventories and deferred tax assets, are reviewed at each reporting date to determine whether there is any indication of impairment. If any such indication exists, then the asset’s recoverable amount is estimated. For goodwill, and intangible assets that have indefi nite useful lives or that are not yet available for use, the recoverable amount is estimated each year at the same time. An impairment loss is recognised if the carrying amount of an asset of its related cash-generating unit (CGU) exceeds its estimated recoverable amount.
The recoverable amount of an asset or CGU is the greater of its value in use and its fair value less costs to sell. In assessing value in use, the estimated future cash fl ows are discounted to their present value using a pre-tax discount rate that refl ects current market assessments of the time value of money and the risks specifi c to the asset or CGU. For the purpose of impairment testing, assets that cannot be tested individually are grouped together into the smallest group of assets that generates cash infl ows from continuing use that are largely independent of the cash infl ows of other assets or CGU. Subject to an operating segment ceiling test, for the purposes of goodwill impairment testing, CGUs to which goodwill has been allocated are aggregated so that the level at which impairment is tested refl ects the lowest level at which goodwill is monitored for internal reporting purposes. Goodwill acquired in a business combination is allocated to groups of CGUs that are expected to benefi t from the synergies of the combination.
The Group’s corporate assets do not generate separate cash infl ows and are utilised by more than one CGU. If there is an indication that a corporate asset may be impaired, then the recoverable amount is determined for the CGU to which the corporate asset belongs.
Impairment losses are recognised in profi t or loss. Impairment losses recognised in respect of CGUs are allocated fi rst to reduce the carrying amount of any goodwill allocated to the CGU (group of CGUs) and then to reduce the carrying amount of the other assets in the CGU (group of CGUs) on a pro rata basis.
26Jun_TatHong_FR15_V.indd 9126Jun_TatHong_FR15_V.indd 91 26/6/15 16:5626/6/15 16:56

9 2 NOTES TO THE FINANCIAL STATEMENTS
Year ended 31 March 2015
ANNUAL REPORT 2015
TAT HONG HOLDINGS LTD
3 SIGNIFICANT ACCOUNTING POLICIES (CONT’D)
3.7 Impairment (Cont’d)
(ii) Non-fi nancial assets (Cont’d)
An impairment loss in respect of goodwill is not reversed. In respect of other assets, impairment losses recognised in prior periods are assessed at each reporting date for any indications that the loss has decreased or no longer exists. An impairment loss is reversed if there has been a change in the estimates used to determine the recoverable amount. An impairment loss is reversed only to the extent that the asset’s carrying amount does not exceed the carrying amount that would have been determined, net of depreciation or amortisation, if no impairment loss had been recognised.
Goodwill that forms part of the carrying amount of an investment in an associate is not recognised separately, and therefore is not tested for impairment separately. Instead, the entire amount of the investment in an associate is tested for impairment as a single asset when there is objective evidence that the investment in an associate may be impaired.
3.8 Employee benefi ts
Defi ned contribution plans
A defi ned contribution plan is a post-employment benefi t plan under which an entity pays fi xed contributions into a separate entity and will have no legal or constructive obligation to pay further amounts. Obligations for contributions to defi ned contribution pension plans are recognised as an employee benefi t expense in profi t or loss in the periods during which services are rendered by employees.
Short-term employee benefi ts
Short-term employee benefi t obligations are measured on an undiscounted basis and are expensed as the related service is provided. A liability is recognised for the amount expected to be paid under short-term cash bonus or profi t-sharing plans if the Group has a present legal or constructive obligation to pay this amount as a result of past service provided by the employee, and the obligation can be estimated reliably.
Long service leave
The liability for employee benefi ts for long service leave represents the present value of the estimated future cash outfl ows to be made by the employer resulting from employee’s services provided up to the reporting date.
In determining the provision for long service leave, consideration has been given to future increases in wage and salary rates, expired settlement dates and experience with staff departures. Related on-costs, as described above, have also been included in the liability.
Provision for employee entitlements which are not expected to be settled within twelve months are discounted using the rates attached to certain government securities at the reporting date, which most closely match the terms of maturity of the related liabilities.
26Jun_TatHong_FR15_V.indd 9226Jun_TatHong_FR15_V.indd 92 26/6/15 16:5626/6/15 16:56

9 3NOTES TO THE FINANCIAL STATEMENTS
Year ended 31 March 2015
3 SIGNIFICANT ACCOUNTING POLICIES (CONT’D)
3.8 Employee benefi ts (Cont’d)
Share-based payment transactions
The grant date fair value of equity-settled share-based payment awards granted to employees is recognised as an employee expense, with a corresponding increase in equity, over the period that the employees unconditionally become entitled to the awards. The amount recognised as an expense is adjusted to refl ect the number of awards for which the related service and non-market performance conditions are expected to be met, such that the amount ultimately recognised as an expense is based on the number of awards that meet the related service and non-market performance conditions at the vesting date. For share-based payment awards with non-vesting conditions, the grant date fair value of the share-based payment is measured to refl ect such conditions and there is no true-up for differences between expected and actual outcomes.
The fair value of the amount payable to employees in respect of share appreciation rights, which are settled in cash, is recognised as an expense with a corresponding increase in liabilities, over the period that the employees unconditionally become entitled to payment. The liability is re-measured at each reporting date and at settlement date based on the fair value of the share appreciation rights. Any changes in the fair value of the liability are recognised as employee benefi ts expense in profi t or loss.
Share-based payment arrangements in which the Group receives goods or services as consideration for its own equity instruments are accounted for as equity-settled share-based payment transactions, regardless of how the equity instruments are obtained by the Group.
3.9 Provisions
A provision is recognised if, as a result of a past event, the Group has a present legal or constructive obligation that can be estimated reliably, and it is probable that an outfl ow of economic benefi ts will be required to settle the obligation. Provisions are determined by discounting the expected future cash fl ows at a pre-tax rate that refl ects current market assessments of the time value of money and the risks specifi c to the liability. The unwinding of the discount is recognised as fi nance expense.
Warranties
A provision for warranties is recognised when the underlying products are sold. The provision is based on historical warranty data and a weighting of all possible outcomes against their associated probabilities.
26Jun_TatHong_FR15_V.indd 9326Jun_TatHong_FR15_V.indd 93 26/6/15 16:5626/6/15 16:56

9 4 NOTES TO THE FINANCIAL STATEMENTS
Year ended 31 March 2015
ANNUAL REPORT 2015
TAT HONG HOLDINGS LTD
3 SIGNIFICANT ACCOUNTING POLICIES (CONT’D)
3.9 Provisions (Cont’d)
Reinstatement costs for leased property
A provision for reinstatement costs for leased property is recognised when an underlying make good obligation clause exists in property lease contracts.
The provision is the best estimate of the present value of the expenditure required to settle the make good obligation at the reporting date, based on current legal requirements and technology. Future make good costs are reviewed annually and any changes are refl ected in the present value of the make good provision at the end of the reporting period.
The unwinding of the discount is recognised as fi nance expense.
3.10 Revenue
Rental income
Rental income receivable under operating leases is recognised in profi t or loss on a straight-line basis over the term of the lease. Lease incentives granted are recognised as an integral part of the total rental income to be received. Contingent rentals are recognised as income in the accounting period in which they are earned.
Sale of equipment, machinery and spare parts
Revenue from sale of equipment, machinery and spare parts are recognised upon the delivery to the customer which is taken to be the point in time when the signifi cant risks and rewards of ownership have been transferred to the customer. Revenue excludes goods and services taxes and is arrived at after deduction of trade discounts. No revenue is recognised if there are signifi cant uncertainties regarding recovery of the consideration due, associated costs or the possible return of goods.
3.11 Lease payments
Payments made under operating leases are recognised in profi t or loss on a straight-line basis over the term of the lease. Lease incentives received are recognised as an integral part of the total lease expense, over the term of the lease.
Minimum lease payments made under fi nance leases are apportioned between the fi nance expense and the reduction of the outstanding liability. The fi nance expense is allocated to each period during the lease term so as to produce a constant periodic rate of interest on the remaining balance of the liability.
Contingent lease payments are accounted for by revising the minimum lease payments over the remaining term of the lease when the lease adjustment is confi rmed.
26Jun_TatHong_FR15_V.indd 9426Jun_TatHong_FR15_V.indd 94 26/6/15 16:5626/6/15 16:56

9 5NOTES TO THE FINANCIAL STATEMENTS
Year ended 31 March 2015
3 SIGNIFICANT ACCOUNTING POLICIES (CONT’D)
3.11 Lease payments (Cont’d)
Determining whether an arrangement contains a lease
At inception of an arrangement, the Group determines whether such an arrangement is or contains a lease. This will be the case if the following two criteria are met:
• The fulfi lment of the arrangement is dependent on the use of a specifi c asset or assets; and• The arrangement contains a right to use the asset(s).
At inception or upon reassessment of the arrangement, the Group separates payments and other consideration required by such an arrangement into those for the lease and those for other elements on the basis of their relative fair values. If the Group concludes for a fi nance lease that it is impracticable to separate the payments reliably, then an asset and a liability are recognised at an amount equal to the fair value of the underlying asset. Subsequently, the liability is reduced as payments are made and an imputed fi nance charge on the liability is recognised using the Group’s incremental borrowing rate.
3.12 Finance income and fi nance expense
Finance income comprises interest income on funds invested (including available-for-sale fi nancial assets), dividend income, gains on the disposal of available-for-sale fi nancial assets and gains on hedging instruments that are recognised in profi t or loss. Interest income is recognised as it accrues in profi t or loss, using the effective interest method. Dividend income is recognised in profi t or loss on the date that the Group’s right to receive payment is established, which in the case of quoted securities is normally the ex-dividend date.
Finance expense comprise interest expense on borrowings, changes in the fair value of fi nancial assets at fair value through profi t or loss, and losses on hedging instruments that are recognised in profi t or loss.
Borrowing costs that are not directly attributable to the acquisition, construction or production of a qualifying asset are recognised in profi t or loss using the effective interest method.
3.13 Income tax expense
Income tax expense comprises current and deferred tax. Current tax and deferred tax are recognised in profi t or loss except to the extent that it relates to a business combination, or items recognised directly in equity or in other comprehensive income.
Current tax is the expected tax payable or receivable on the taxable income or loss for the year, using tax rates enacted or substantively enacted at the reporting date, and any adjustment to tax payable in respect of previous years.
26Jun_TatHong_FR15_V.indd 9526Jun_TatHong_FR15_V.indd 95 26/6/15 16:5626/6/15 16:56

9 6 NOTES TO THE FINANCIAL STATEMENTS
Year ended 31 March 2015
ANNUAL REPORT 2015
TAT HONG HOLDINGS LTD
3 SIGNIFICANT ACCOUNTING POLICIES (CONT’D)
3.13 Income tax expense (Cont’d)
Deferred tax is recognised in respect of temporary differences between the carrying amounts of assets and liabilities for fi nancial reporting purposes and the amounts used for taxation purposes. Deferred tax is not recognised for:
• temporary differences on the initial recognition of assets or liabilities in a transaction that is not a business combination and that affects neither accounting nor taxable profi t or loss;
• temporary differences related to investments in subsidiaries, associates and joint ventures to the extent that the Group will be able to control the timing of the reversal of the temporary difference and that it is probable that they will not reverse in the foreseeable future; and
• taxable temporary differences arising on the initial recognition of goodwill.
The measurement of deferred taxes refl ects the tax consequences that would follow the manner in which the Group expects, at the reporting date, to recover or settle the carrying amount of its assets and liabilities. Deferred tax is measured at the tax rates that are expected to be applied to temporary differences when they reverse, based on the laws that have been enacted or substantively enacted by the reporting date.
Deferred tax assets and liabilities are offset if there is a legally enforceable right to offset current tax liabilities and assets, and they relate to income taxes levied by the same tax authority on the same taxable entity, or on different tax entities, but they intend to settle current tax liabilities and assets on a net basis or their tax assets and liabilities will be realised simultaneously.
A deferred tax asset is recognised for unused tax losses, tax credits and deductible temporary differences, to the extent that it is probable that future taxable profi ts will be available against which they can be utilised. Deferred tax assets are reviewed at each reporting date and are reduced to the extent that it is no longer probable that the related tax benefi t will be realised.
In determining the amount of current and deferred tax, the Group takes into account the impact of uncertain tax positions and whether additional taxes and interest may be due. The Group believes that its accruals for tax liabilities are adequate for all open tax years based on its assessment of many factors, including interpretations of tax law and prior experience. This assessment relies on estimates and assumptions and may involve a series of judgements about future events. New information may become available that causes the Group to change its judgement regarding the adequacy of existing tax liabilities; such changes to tax liabilities will impact tax expense in the period that such a determination is made.
26Jun_TatHong_FR15_V.indd 9626Jun_TatHong_FR15_V.indd 96 26/6/15 16:5626/6/15 16:56

9 7NOTES TO THE FINANCIAL STATEMENTS
Year ended 31 March 2015
3 SIGNIFICANT ACCOUNTING POLICIES (CONT’D)
3.14 Earnings per share
The Group presents basic and diluted earnings per share (“EPS”) data for its ordinary and convertible redeemable preference shares. Basic EPS is calculated by dividing the profi t or loss attributable to ordinary and convertible redeemable preference shareholders of the Company by the weighted average number of ordinary and convertible redeemable preference shares outstanding during the year, adjusted for its own shares held. Diluted EPS is determined by adjusting the profi t or loss attributable to ordinary and convertible redeemable preference shareholders and weighted average number of ordinary shares outstanding, adjusted for own shares held, for the effects of all dilutive potential ordinary shares, which comprise warrants issued and share options granted to employees.
3.15 Segment reporting
An operating segment is a component of the Group that engages in business activities from which it may earn revenues and incur expenses, including revenues and expenses that relate to transactions with any of the Group’s other components. All operating segments’ operating results are reviewed regularly by the Group’s chief operating decision maker to make decisions about resources to be allocated to the segment and assess its performance, and for which discrete fi nancial information is available.
Segment results that are reported to the Group’s chief operating decision maker include items directly attributable to a segment as well as those that can be allocated on a reasonable basis. Unallocated items comprise mainly corporate assets, head offi ce expenses, and income tax assets and liabilities.
Segment capital expenditure is the total cost incurred during the period to acquire property, plant and equipment, and intangible assets other than goodwill.
3.16 New standards and interpretations not yet adopted
A number of new standards, amendments to standards and interpretations are effective for annual periods beginning after 1 April 2014, and have not been applied in preparing these fi nancial statements.
The Group is currently assessing those new standards, amendments to standards, and interpretations. They are not expected to have a signifi cant effect on the fi nancial statements of the Group and the Company.
26Jun_TatHong_FR15_V.indd 9726Jun_TatHong_FR15_V.indd 97 26/6/15 16:5626/6/15 16:56

9 8 NOTES TO THE FINANCIAL STATEMENTS
Year ended 31 March 2015
ANNUAL REPORT 2015
TAT HONG HOLDINGS LTD
4 PROPERTY, PLANT AND EQUIPMENT
Freehold
land
Freehold
properties
Leasehold
properties
Plant and
machinery
Furniture,
fi ttings,
offi ce and
workshop
equipmentMotor
vehicles Vessels
Assets
under
construction Total
Group Note $’000 $’000 $’000 $’000 $’000 $’000 $’000 $’000 $’000
Cost
At 1 April 2013 23,494 25,146 67,144 1,012,760 18,966 56,884 44,525 2,815 1,251,734Additions 12,706 17,674 25,303 102,000 2,193 11,181 107 10,487 181,651Disposals/Write
offs – – (1,053) (49,504) (376) (2,114) – – (53,047)Reclassifi cation – – 2,815 – – – – (2,815) –Reclassifi cation
from inventories – – – 28,941 – – – – 28,941
Translation difference on consolidation (1,942) (2,418) (2,431) (37,468) (959) (4,836) 76 – (49,978)
At 31 March 2014 34,258 40,402 91,778 1,056,729 19,824 61,115 44,708 10,487 1,359,301Additions – 5,365 1,082 75,138 4,081 3,245 85 13,813 102,809Disposals/Write
offs (8,789) (15,192) (21,328) (122,973) (3,737) (1,441) – – (173,460)Reclassifi cation 7,240 (7,240) – (186) – 186 13,467 (13,467) –Reclassifi cation to
asset held for sale 11 (1,627) (686) – – – – – – (2,313)
Reclassifi cation from inventories – – – 32,391 – – – – 32,391
Translation difference on consolidation (2,992) (2,578) 87 (3,102) (543) (5,159) 434 – (13,853)
At 31 March 2015 28,090 20,071 71,619 1,037,997 19,625 57,946 58,694 10,833 1,304,875
26Jun_TatHong_FR15_V.indd 9826Jun_TatHong_FR15_V.indd 98 26/6/15 16:5626/6/15 16:56

9 9NOTES TO THE FINANCIAL STATEMENTS
Year ended 31 March 2015
4 PROPERTY, PLANT AND EQUIPMENT (CONT’D)
Freehold
land
Freehold
properties
Leasehold
properties
Plant and
machinery
Furniture,
fi ttings,
offi ce and
workshop
equipmentMotor
vehicles Vessels
Assets
under
construction Total
Group Note $’000 $’000 $’000 $’000 $’000 $’000 $’000 $’000 $’000
Accumulated
depreciation
and impairment
losses
At 1 April 2013 781 7,069 16,615 273,095 12,255 27,071 9,495 – 346,381Depreciation
charge for the year – 761 3,331 72,009 2,385 5,169 2,907 – 86,562
Disposals/Write offs – – (663) (27,816) (247) (2,069) – – (30,795)
Impairment loss (reversed)/made (486) – 8 71 31 11 – – (365)
Translation difference on consolidation – (667) (100) (14,149) (765) (2,271) 48 – (17,904)
At 31 March 2014 295 7,163 19,191 303,210 13,659 27,911 12,450 – 383,879Depreciation
charge for the year – 955 3,382 73,868 2,384 5,081 4,132 – 89,802
Disposals/Write offs (295) (3,751) (8,462) (69,378) (2,680) (941) – – (85,507)
Reclassifi cation to asset held for sale 11 – (73) – – – – – – (73)
Impairment loss made – – – 1,912 – 6,473 – – 8,385
Translation difference on consolidation – (538) 97 (7,392) (551) (2,839) 302 – (10,921)
At 31 March 2015 – 3,756 14,208 302,220 12,812 35,685 16,884 – 385,565
Carrying amounts
At 1 April 2013 22,713 18,077 50,529 739,665 6,711 29,813 35,030 2,815 905,353At 31 March 2014 33,963 33,239 72,587 753,519 6,165 33,204 32,258 10,487 975,422At 31 March 2015 28,090 16,315 57,411 735,777 6,813 22,261 41,810 10,833 919,310
Property, plant and equipment with carrying amount of $257,628,000 (2014: $303,947,000) were acquired under fi nance lease arrangements.
Impairment losses
Impairment loss is recognised when events and circumstances indicate that the property, plant and equipment may be impaired and the carrying amounts of the property, plant and equipment exceed their recoverable amounts.
26Jun_TatHong_FR15_V.indd 9926Jun_TatHong_FR15_V.indd 99 26/6/15 16:5626/6/15 16:56

1 0 0 NOTES TO THE FINANCIAL STATEMENTS
Year ended 31 March 2015
ANNUAL REPORT 2015
TAT HONG HOLDINGS LTD
4 PROPERTY, PLANT AND EQUIPMENT (CONT’D)
Impairment losses (Cont’d)
As a result of the industry slowdown of a certain country in which the Group operates, an impairment assessment on the property, plant and equipment was performed by the Management. The recoverable amount of certain property, plant and equipment for the fi nancial year ended 31 March 2015 was determined based on fair value less costs to sell. The fair value less costs to sell has been determined through a combination of in house market knowledge and comparable sales transactions. Based on the assessment, the Management determined that the impairment loss on those property, plant and equipment was $8,385,000. The impairment loss was recognised in other operating expenses.
In respect of the fi nancial year ended 31 March 2014, the Management determined the recoverable amount of those property, plant and equipment based on value-in-use calculations. The value-in-use calculation used cash fl ow projections over the period of remaining useful lives of these property, plant and equipment, and was discounted using discount rates ranging from 8.52% to 12.58%. Based on the assessment, the Management determined that there was no impairment loss on those property, plant and equipment.
During the fi nancial year ended 31 March 2014, the Group recorded a reversal of impairment losses of $365,000 mainly due to reversal of impairment losses by a subsidiary on a freehold land. The reversal was included in other operating expenses.
Furniture, fi ttings, offi ce and workshop
equipment
Company $’000
Cost
At 1 April 2013 754Additions 117Disposal (1)At 31 March 2014 870Additions 1,524Disposals/Write offs (282)At 31 March 2015 2,112
Accumulated depreciation
At 1 April 2013 96Depreciation charge for the year 167Disposal (1)At 31 March 2014 262Depreciation charge for the year 343Disposals/Write offs (143)At 31 March 2015 462
Carrying amounts
At 1 April 2013 658At 31 March 2014 608At 31 March 2015 1,650
26Jun_TatHong_FR15_V.indd 10026Jun_TatHong_FR15_V.indd 100 26/6/15 16:5626/6/15 16:56

1 0 1NOTES TO THE FINANCIAL STATEMENTS
Year ended 31 March 2015
4 PROPERTY, PLANT AND EQUIPMENT (CONT’D)
The carrying amount of the property, plant and equipment is depreciated on a straight-line basis over the remaining useful life of each property, plant and equipment. The Management reviews and revises the estimates of the remaining useful life and residual values of the property, plant and equipment at the end of each fi nancial year based on their age and condition at that time. Changes in the way the property, plant and equipment are used and other factors (such as market or technological factors) could impact the useful life and residual values of the property, plant and equipment, therefore future depreciation charges could be revised. Any changes in the useful life and residual values of the property, plant and equipment would impact the depreciation charges and consequently affect the Group’s and the Company’s results.
5 SUBSIDIARIES – COMPANY
2015 2014
$’000 $’000
Unquoted shares in subsidiaries, at cost 51,527 47,265Loans to subsidiaries 337,848 337,198
389,375 384,463Less: Impairment loss (2,055) –
387,320 384,463
Loans to subsidiaries which form part of the Company’s net investments in subsidiaries, are interest-free, unsecured and settlement is neither planned nor likely to occur in the foreseeable future. As the amounts are, in substance, a part of the Company’s net investment in subsidiaries, they are stated at cost.
The Company recognises impairment losses at a level considered adequate to provide for potential non-recoverability of investment in subsidiaries. The level of allowance is evaluated by the Company on the basis of factors that affect the recoverability of the investments. These factors include, but are not limited to, the performance, activities and fi nancial position of the entities and market factors.
Due to the performance of certain subsidiaries, an impairment loss of $2,055,000 (2014: $nil) was recognised to the costs of investment during the year. The impairment loss was based on the net assets of the subsidiaries.
The Company reviews and identifi es balances that are to be impaired on a continuous basis. The amount and timing of recorded expenses for any period would differ if the Company made different judgement or utilised different estimates. An increase in the Company’s impairment losses would increase the Company’s recorded other operating expenses and decrease the carrying value of investment in subsidiaries.
26Jun_TatHong_FR15_V.indd 10126Jun_TatHong_FR15_V.indd 101 26/6/15 16:5626/6/15 16:56
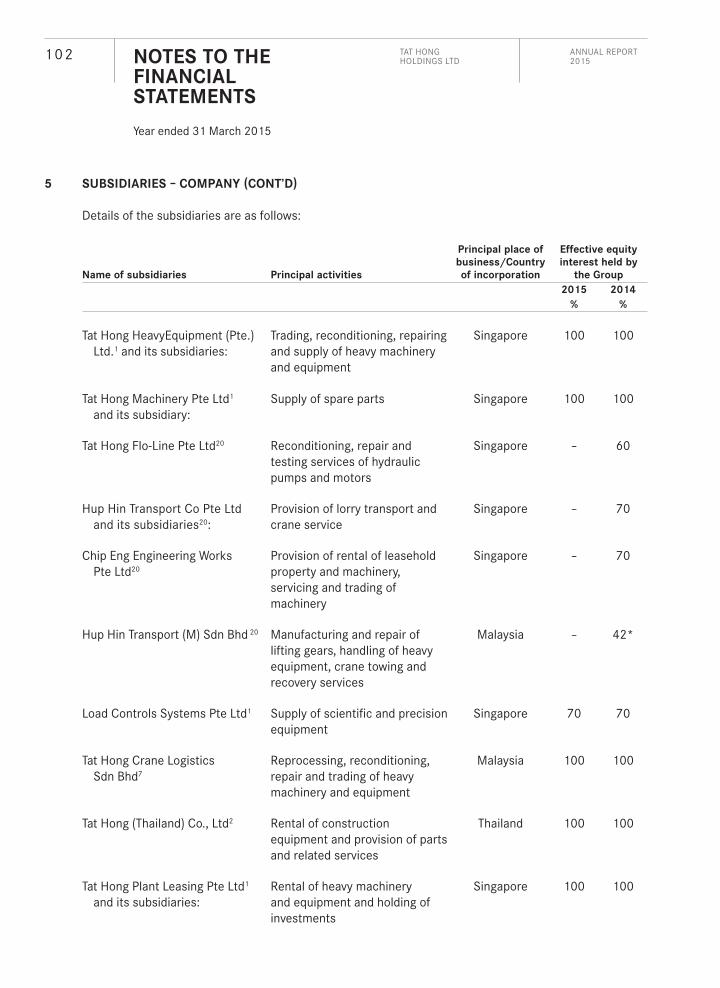
1 0 2 NOTES TO THE FINANCIAL STATEMENTS
Year ended 31 March 2015
ANNUAL REPORT 2015
TAT HONG HOLDINGS LTD
5 SUBSIDIARIES – COMPANY (CONT’D)
Details of the subsidiaries are as follows:
Name of subsidiaries Principal activities
Principal place of
business/Country
of incorporation
Effective equity
interest held by
the Group
2015 2014
% %
Tat Hong HeavyEquipment (Pte.) Ltd.1 and its subsidiaries:
Trading, reconditioning, repairing and supply of heavy machinery and equipment
Singapore 100 100
Tat Hong Machinery Pte Ltd1
and its subsidiary:Supply of spare parts Singapore 100 100
Tat Hong Flo-Line Pte Ltd20 Reconditioning, repair and testing services of hydraulic pumps and motors
Singapore – 60
Hup Hin Transport Co Pte Ltd
and its subsidiaries20: Provision of lorry transport and crane service
Singapore – 70
Chip Eng Engineering Works Pte Ltd20
Provision of rental of leasehold property and machinery, servicing and trading of machinery
Singapore – 70
Hup Hin Transport (M) Sdn Bhd 20 Manufacturing and repair of lifting gears, handling of heavy equipment, crane towing and recovery services
Malaysia – 42*
Load Controls Systems Pte Ltd1 Supply of scientifi c and precision equipment
Singapore 70 70
Tat Hong Crane Logistics Sdn Bhd7
Reprocessing, reconditioning, repair and trading of heavy machinery and equipment
Malaysia 100 100
Tat Hong (Thailand) Co., Ltd2 Rental of construction equipment and provision of parts and related services
Thailand 100 100
Tat Hong Plant Leasing Pte Ltd1 and its subsidiaries:
Rental of heavy machinery and equipment and holding of investments
Singapore 100 100
26Jun_TatHong_FR15_V.indd 10226Jun_TatHong_FR15_V.indd 102 26/6/15 16:5626/6/15 16:56

1 0 3NOTES TO THE FINANCIAL STATEMENTS
Year ended 31 March 2015
5 SUBSIDIARIES – COMPANY (CONT’D)
Name of subsidiaries Principal activities
Principal place of
business/Country
of incorporation
Effective equity
interest held by
the Group
2015 2014
% %
Tat Hong United Logistics Pte Ltd1
Provision of transportation and logistics services
Singapore 100 100
Tat Hong Heavylift Pte Ltd1 Crane rental, heavy lifting, haulage and erection service
Singapore 100 100
Peng Koon Heavy Machinery Pte Ltd1
Supply of heavy machinery and equipment, motor trucks and motor lorries
Singapore 70 70
Tat Hong Offshore and Marine Services Pte Ltd1
Provision of offshore and marine services
Singapore 50* 50*
PT Tat Hong Batam4 Rental of property Indonesia 100 100
PT World Wide Equipment South East Asia4
Repair and maintenance services of machinery and heavy equipment
Indonesia 100 100
Tat Hong Crane Hire Pte Ltd19 Dormant Singapore 100 100
Tat Hong Training Services Pte Ltd1
Provision of training courses and management consultancy work
Singapore 100 100
Leadpoint Pte Ltd1 Investment holding Singapore 70 70
Tat Hong International Pte Ltd1 and its subsidiaries:
Investment holding Singapore 100 100
Tat Hong Plant Hire Sdn Bhd5 Rental of heavy machinery, industrial equipment and cranes
Malaysia 100 100
Tat Hong Crane Rental (Sarawak) Sdn Bhd7
Rental of cranes and heavy equipment
Malaysia 100 100
KP Equipment Services Inc.3 In the process of voluntary liquidation
Philippines 100 100
PT Tatindo HeavyEquipment6 Distribution of heavy equipment and spare parts
Indonesia 95 95
26Jun_TatHong_FR15_V.indd 10326Jun_TatHong_FR15_V.indd 103 26/6/15 16:5626/6/15 16:56
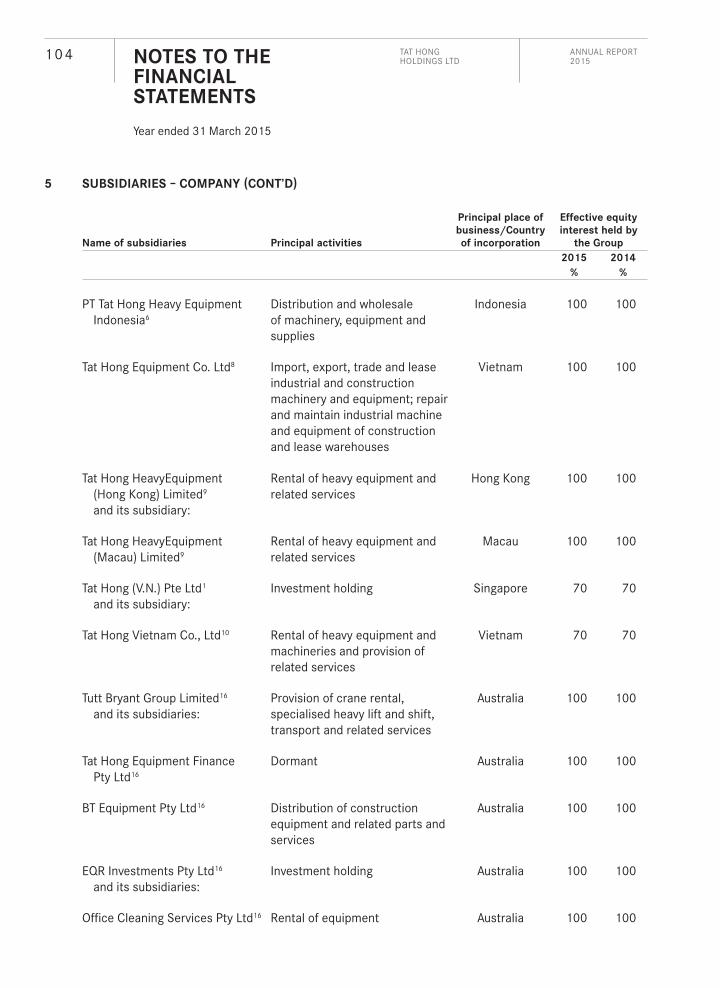
1 0 4 NOTES TO THE FINANCIAL STATEMENTS
Year ended 31 March 2015
ANNUAL REPORT 2015
TAT HONG HOLDINGS LTD
5 SUBSIDIARIES – COMPANY (CONT’D)
Name of subsidiaries Principal activities
Principal place of
business/Country
of incorporation
Effective equity
interest held by
the Group
2015 2014
% %
PT Tat Hong Heavy Equipment Indonesia6
Distribution and wholesale of machinery, equipment and supplies
Indonesia 100 100
Tat Hong Equipment Co. Ltd8 Import, export, trade and lease industrial and construction machinery and equipment; repair and maintain industrial machine and equipment of construction and lease warehouses
Vietnam 100 100
Tat Hong HeavyEquipment (Hong Kong) Limited9 and its subsidiary:
Rental of heavy equipment and related services
Hong Kong 100 100
Tat Hong HeavyEquipment (Macau) Limited9
Rental of heavy equipment and related services
Macau 100 100
Tat Hong (V.N.) Pte Ltd1 and its subsidiary:
Investment holding Singapore 70 70
Tat Hong Vietnam Co., Ltd10 Rental of heavy equipment and machineries and provision of related services
Vietnam 70 70
Tutt Bryant Group Limited16 and its subsidiaries:
Provision of crane rental, specialised heavy lift and shift, transport and related services
Australia 100 100
Tat Hong Equipment Finance Pty Ltd16
Dormant Australia 100 100
BT Equipment Pty Ltd16 Distribution of construction equipment and related parts and services
Australia 100 100
EQR Investments Pty Ltd16 and its subsidiaries:
Investment holding Australia 100 100
Offi ce Cleaning Services Pty Ltd16 Rental of equipment Australia 100 100
26Jun_TatHong_FR15_V.indd 10426Jun_TatHong_FR15_V.indd 104 26/6/15 16:5626/6/15 16:56

1 0 5NOTES TO THE FINANCIAL STATEMENTS
Year ended 31 March 2015
5 SUBSIDIARIES – COMPANY (CONT’D)
Name of subsidiaries Principal activities
Principal place of
business/Country
of incorporation
Effective equity
interest held by
the Group
2015 2014
% %
North Sheridan Pty Ltd16 Rental of equipment Australia 100 100
Kingston Industries Pty Ltd16 and its subsidiaries:
Rental of equipment Australia 100 100
Kingston Industries (WA) Pty Ltd16
Dormant Australia 100 100
Relsok Pty Ltd16 Dormant Australia 100 100
Falconer Administration Trust16 Dormant Australia 100 100
Muswellbrook Crane Services Pty Ltd16
Provision of crane rental, transport and related services
Australia 100 100
Tat Hong Equipment (China) Pte. Ltd.1 and its subsidiaries:
Investment holding Singapore 88 100
Tat Hong Equipment Service Co., Ltd. 18
Investment holding Cayman Islands 88 –
Shanghai Tat Hong Equipment Rental Co., Ltd.11,17
Rental of tower cranes and other construction machineries
People’s Republic of China
87 90
Tat Hong Zhaomao Investment Co., Ltd11,17
Investment holding People’s Republic of China
88 75
China Nuclear Huaxing Tat Hong Machinery Construction Co., Ltd12,17
Rental of construction machinery and heavy lifting equipment, installation and related engineering services and supplies
People’s Republic of China
73 71
Jiangsu Zhongjian Tat Hong Machinery Construction Co., Ltd 13,17
Rental, maintenance and repair of construction machines and equipment, sale of construction equipment and, technology consultancy and related technical services
People’s Republic of China
88 93
26Jun_TatHong_FR15_V.indd 10526Jun_TatHong_FR15_V.indd 105 26/6/15 16:5626/6/15 16:56

1 0 6 NOTES TO THE FINANCIAL STATEMENTS
Year ended 31 March 2015
ANNUAL REPORT 2015
TAT HONG HOLDINGS LTD
5 SUBSIDIARIES – COMPANY (CONT’D)
Name of subsidiaries Principal activities
Principal place of
business/Country
of incorporation
Effective equity
interest held by
the Group
2015 2014
% %
Beijing Tat Hong Zhaomao Equipment Rental Co. Ltd14
Rental of construction machinery and heavy lifting equipment, installation and related engineering services & supplies
People’s Republic of China
88 62
Si Chuan Tat Hong Yuanzheng Machinery Construction Co., Ltd.15
Rental of construction machinery and heavy lifting equipment, installation and related engineering services and supplies
People’s Republic of China
62 53
Jiangsu Hengxingmao Financial Leasing Co., Ltd.11,17
Rental of tower cranes and other construction machineries
People’s Republic of China
88 100
Tat Hong Zhiyuan (Jiangsu) Equipment Rental Co. Ltd11,
Rental of construction machinery and heavy lifting equipment, installation and related engineering services and supplies
People’s Republic of China
88 75
Changzhou Tat Hong Zhaomao Machinery Construction Co., Ltd14, 17
Rental, maintenance and repair of construction machines and equipment, sale of construction equipment and, technology consultancy and related technical services
People’s Republic of China
88 78
* Although the Group owns 50% or less of the voting power, it is able to govern the fi nancial and operating policies of the companies by virtue of agreement with the other investors. Consequently, the Group consolidates its investments in these companies as subsidiaries of the Group.
1 Audited by KPMG Singapore.2 Audited by KPMG Bangkok.3 Not required to be audited as the company is in the process of voluntary liquidation.4 Audited by Jamaludin, Aria, Sukimto & Rekan Registered Public Accountants.5 Audited by KPMG Petaling Jaya.6 Audited by Yuwono, H & Rekan Registered Public Accountant.7 Audited by MS Wong & Co.8 Audited by DNP Auditing-Financial Consulting Co. Ltd.9 Audited by Baker Tilly Hong Kong.10 Audited by HSK Vietnam Audit Company Limited.11 Audited by for local statutory reporting purpose.12 Audited by for local statutory reporting purpose.13 Audited by for local statutory reporting purpose.14 Audited by for local statutory reporting purpose.15 Audited by for local statutory reporting purpose.16 Audited by KPMG Sydney. 17 Audited by PricewaterhouseCoopers, Taiwan for group consolidation purpose.18 Audited by PricewaterhouseCoopers, Taiwan for local statutory reporting purpose.19 Not required to be audited as the company was dormant during the fi nancial year.20 Disposed during the fi nancial year ended 31 March 2015. Refer to note 25.
26Jun_TatHong_FR15_V.indd 10626Jun_TatHong_FR15_V.indd 106 26/6/15 16:5626/6/15 16:56

1 0 7NOTES TO THE FINANCIAL STATEMENTS
Year ended 31 March 2015
6 ASSOCIATES
Group
2015 2014
$’000 $’000
Investments in associates 58,865 69,271
Company
2015 2014
$’000 $’000
Quoted equity shares 18,494 34,046Unquoted equity shares 950 328
19,444 34,374Less: Impairment loss (6,888) (6,888)
12,556 27,486
Details of associates are as follows:
Name of associates Principal activities
Principal place
of business
/ Country of
incorporation
Effective equity
interest held by
the Group
2015 2014
% %
THL Foundation Equipment Pte Ltd and its subsidiaries
Trading and rental of construction equipment and related parts
Singapore 45 45
Tat Hong Properties Sdn Bhd Under liquidation Malaysia 30 30
Kian Ho Bearings Ltd Stockists, distributors and retailers in bearings and seal products
Singapore – 31
Yongmao Holdings Limited and its subsidiaries
Manufacture and sale of tower cranes
Singapore 24 24
R&D Holdings Pte Ltd and its subsidiary
Precision engineering and mould making
Singapore 21 21
Global Heavyequipment Sdn Bhd Dormant Malaysia 49 49
EMC Cranes (KL) Sdn. Bhd. Dormant Malaysia 22 22
26Jun_TatHong_FR15_V.indd 10726Jun_TatHong_FR15_V.indd 107 26/6/15 16:5626/6/15 16:56

1 0 8 NOTES TO THE FINANCIAL STATEMENTS
Year ended 31 March 2015
ANNUAL REPORT 2015
TAT HONG HOLDINGS LTD
6 ASSOCIATES (CONT’D)
All associates are equity accounted. The fair value of ownership interest in listed associates are as follows:
Group and Company
2015 2014
$’000 $’000
Yongmao Holdings Limited* 21,253 21,253Kian Ho Bearings Ltd* – 16,102
21,253 37,355
* Based on the quoted market price at 31 March (Level 1 in the fair value hierarchy).
Impairment losses are recognised to the extent considered adequate to provide for potential non-recoverability of investments in associates. The level of allowance is evaluated on the basis of factors that affect the recoverability of the investments. These factors include, but are not limited to, the activities and fi nancial position of the entities and market factors. The Group reviews and identifi es balances that are to be impaired on a continuous basis. The amount and timing of recorded expenses for any period would differ if the Group made different judgement or utilised different estimates. An increase in the Group’s impairment losses would increase the Group’s recorded other operating expenses and decrease the carrying value of investments in associates.
The recoverable amount for a listed associate was determined based on value-in-use calculation using the discounted cash fl ow projection based on estimated earnings of the listed associate. The pre-tax discount rate is 13.9% (2014: 13.3%). Based on the Management’s assessment for the fi nancial years ended 31 March 2014 and 2015, the carrying amount of the investment was determined to be lower than its recoverable amount and no impairment loss was recognised.
During the fi nancial year ended 31 March 2014, the recoverable amount of the other listed associate was assessed based on fair value less cost to sell. Based on the Management’s assessment, an impairment loss of $3,400,000 was recognised in profi t or loss in 2014. The investment in this listed associate was subsequently sold during the fi nancial year ended 31 March 2015 and the impairment loss was therefore utilised.
26Jun_TatHong_FR15_V.indd 10826Jun_TatHong_FR15_V.indd 108 26/6/15 16:5626/6/15 16:56

1 0 9NOTES TO THE FINANCIAL STATEMENTS
Year ended 31 March 2015
6 ASSOCIATES (CONT’D)
The summarised fi nancial information of the associates, not adjusted for the percentage ownership held by the Group is as follows:
R&D
Holdings
THL
Group
Yongmao
Holdings
Kian Ho
Bearings
Immaterial
associates Total
$’000 $’000 $’000 $’000 $’000 $’000
2015
Revenue 32,906 54,514 173,745 –Profi t from continuing operations and
total comprehensive income 3,808 4,606 17,189 –Attributable to investee’s NCI – 763 3,364 –Attributable to investee’s
shareholders 3,808 3,843 13,825 –
Non-current assets 23,996 42,770 121,631 –Current assets 23,806 65,845 203,977 –Non-current liabilities (2,954) (16,517) (44,588) –Current liabilities (16,078) (37,449) (142,382) –Net assets 28,770 54,649 138,638 –Attributable to investee’s NCI – 6,694 11,526 –Attributable to investee’s
shareholders 28,770 47,955 127,112 –
Group’s interest in net assets of
investee at beginning of the year 6,800 19,534 25,272 17,176 489 69,271Group’s share of:– Profi t from continuing operations 1,142 1,466 2,016 – – 4,624– Other comprehensive income 689 151 2,307 – (2) 3,145– Total comprehensive income 1,831 1,617 4,323 – (2) 7,769Dividends received during the year – (450) (549) (146) – (1,145)Carrying amount of interest in
investee disposed – – – (17,030) – (17,030)Carrying amount of interest in
investee at end of the year 8,631 20,701 29,046 – 487 58,865
26Jun_TatHong_FR15_V.indd 10926Jun_TatHong_FR15_V.indd 109 26/6/15 16:5626/6/15 16:56
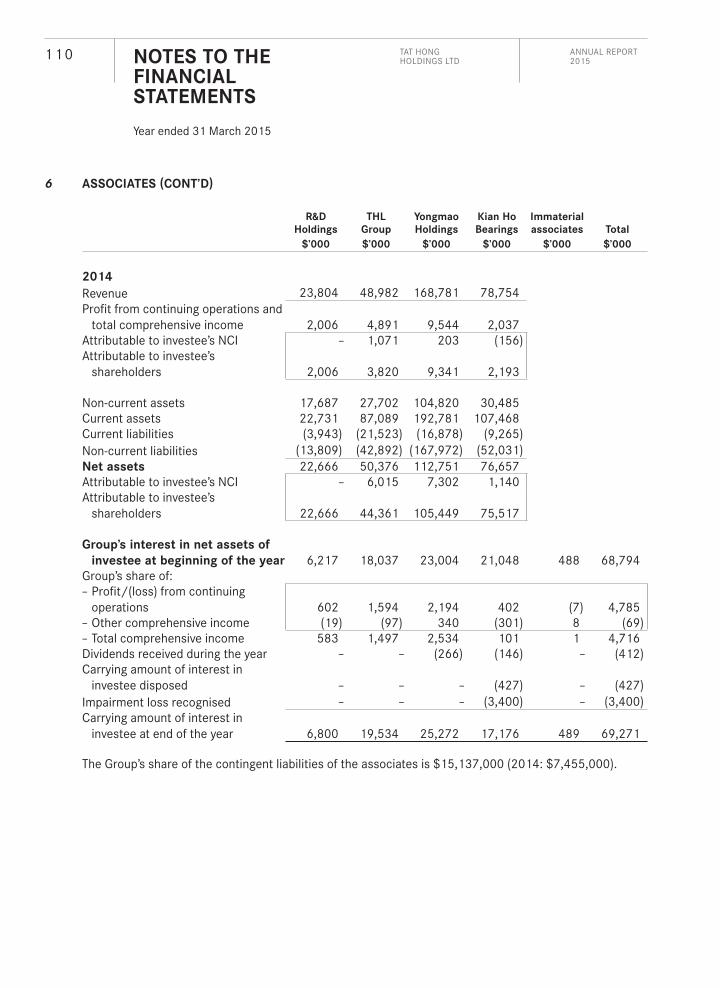
1 1 0 NOTES TO THE FINANCIAL STATEMENTS
Year ended 31 March 2015
ANNUAL REPORT 2015
TAT HONG HOLDINGS LTD
6 ASSOCIATES (CONT’D)
R&D
Holdings
THL
Group
Yongmao
Holdings
Kian Ho
Bearings
Immaterial
associates Total
$’000 $’000 $’000 $’000 $’000 $’000
2014
Revenue 23,804 48,982 168,781 78,754Profi t from continuing operations and
total comprehensive income 2,006 4,891 9,544 2,037Attributable to investee’s NCI – 1,071 203 (156)Attributable to investee’s
shareholders 2,006 3,820 9,341 2,193
Non-current assets 17,687 27,702 104,820 30,485Current assets 22,731 87,089 192,781 107,468Current liabilities (3,943) (21,523) (16,878) (9,265)Non-current liabilities (13,809) (42,892) (167,972) (52,031)Net assets 22,666 50,376 112,751 76,657Attributable to investee’s NCI – 6,015 7,302 1,140Attributable to investee’s
shareholders 22,666 44,361 105,449 75,517
Group’s interest in net assets of
investee at beginning of the year 6,217 18,037 23,004 21,048 488 68,794Group’s share of:– Profi t/(loss) from continuing
operations 602 1,594 2,194 402 (7) 4,785– Other comprehensive income (19) (97) 340 (301) 8 (69)– Total comprehensive income 583 1,497 2,534 101 1 4,716Dividends received during the year – – (266) (146) – (412)Carrying amount of interest in
investee disposed – – – (427) – (427)Impairment loss recognised – – – (3,400) – (3,400)Carrying amount of interest in
investee at end of the year 6,800 19,534 25,272 17,176 489 69,271
The Group’s share of the contingent liabilities of the associates is $15,137,000 (2014: $7,455,000).
26Jun_TatHong_FR15_V.indd 11026Jun_TatHong_FR15_V.indd 110 26/6/15 16:5626/6/15 16:56

1 1 1NOTES TO THE FINANCIAL STATEMENTS
Year ended 31 March 2015
7 JOINT VENTURES
Group Company
2015 2014 2015 2014
$’000 $’000 $’000 $’000
Investments in joint ventures 4,564 2,579 5,733 3,472Less: Impairment loss – – (1,294) (1,294)
4,564 2,579 4,439 2,178
Movement in allowance for impairment losses is as follows:
Company
2015 2014
$’000 $’000
At 1 April 1,294 5,958Utilised – (4,664)At 31 March 1,294 1,294
Impairment losses are recognised to the extent considered adequate to provide for potential non-recoverability of investments in joint ventures. The level of allowance is evaluated on the basis of factors that affect the recoverability of the investments. These factors include, but are not limited to, the activities and fi nancial position of the entities and market factors. The Group reviews and identifi es balances that are to be impaired on a continuous basis. The amount and timing of recorded expenses for any period would differ if the Group made different judgement or utilised different estimates. An increase in the Group’s impairment losses would increase the Group’s recorded other operating expenses and decrease the carrying value of investments in joint ventures.
Details of the joint ventures are as follows:
Name of company Principal activities
Principal place of
business/Country of
incorporation
Effective equity
interest held by
the Group
2015 2014
% %
Tat Hong Intraco Pte Ltd and its subsidiary:
Rental and distribution of heavy machinery
Singapore 40 40
Tat Hong Intraco Heavy Equipment Co Ltd
Crane rental services Myanmar 40 40
Tat Hong Energy Pte Ltd and its subsidiary:
Dormant Singapore 50 50
PT Tat Hong Energy Indonesia Dormant Indonesia 50 50
T.B.F. Oceania Pty Ltd Provide lifting, logistic and transport service
Australia 50 50
26Jun_TatHong_FR15_V.indd 11126Jun_TatHong_FR15_V.indd 111 26/6/15 16:5626/6/15 16:56

1 1 2 NOTES TO THE FINANCIAL STATEMENTS
Year ended 31 March 2015
ANNUAL REPORT 2015
TAT HONG HOLDINGS LTD
7 JOINT VENTURES (CONT’D)
Name of company Principal activities
Principal place of
business/Country of
incorporation
Effective equity
interest held by
the Group
2015 2014
% %
Tat Hong (PNG) Limited Crane hire, general plant and equipment hire, and wholesale of machinery, equipment and suppliers
Papua New Guinea 50 50
THAB Development Sdn Bhd Property development Malaysia 25 25
The joint ventures are individually immaterial to the Group and are equity accounted. The Group’s share of the joint ventures’ results, assets and liabilities is as follows:
2015 2014
$’000 $’000
Revenue 3,387 5,562Expenses (3,552) (4,659)(Loss)/Profi t before tax (165) 903Tax expense (49) (394)Other comprehensive income 337 (325)Total comprehensive income 123 184
Non-current assets 3,604 11,227Current assets 11,407 4,367Current liabilities (9,108) (11,534)
2,299 (7,167)Non-current liabilities (1,339) (1,481)Net assets 4,564 2,579
Carrying amount of interest in investee at beginning of the year 2,579 4,531Investment made during the year 2,261 842Share of total comprehensive income 123 184Dividends received during the year – (2,389)Elimination of unrealised profi t on downstream sales (399) (589)Carrying amount of interest in investee at end of the year 4,564 2,579
The Group’s share of the capital commitments and contingent liabilities of the joint ventures is $nil (2014: $nil) respectively.
26Jun_TatHong_FR15_V.indd 11226Jun_TatHong_FR15_V.indd 112 26/6/15 16:5626/6/15 16:56

1 1 3NOTES TO THE FINANCIAL STATEMENTS
Year ended 31 March 2015
8 OTHER FINANCIAL ASSETS
Group Company
2015 2014 2015 2014
$’000 $’000 $’000 $’000
Available-for-sale fi nancial assets:Unquoted equity securities– at cost 84 518 – 434– at fair value 714 – 714 –
798 518 714 434
9 DEFERRED TAX ASSETS AND LIABILITIES
Unrecognised deferred tax assets – Group
Deferred tax assets of $8,541,000 (2014: $8,005,000) have not been recognised in respect of the following items:
2015 2014
$’000 $’000
Deductible temporary differences 1,513 1,796Unutilised tax losses and capital allowances 32,652 30,490
Tax losses are subject to agreement by the tax authorities and compliance with tax regulations in the respective countries in which certain subsidiaries operate. Tax losses of the Group amounting to $32,652,000 (2014: $30,069,000) expire between 2016 and 2019 (2014: 2016 and 2019). The remaining tax losses and the deductible temporary differences do not expire under current tax legislation. Deferred tax assets have not been recognised in respect of these items because it is not probable that future taxable profi t will be available against which the Group can utilise the benefi ts therefrom.
Recognised deferred tax assets and liabilities
Deferred tax assets and liabilities are attributable to the following:
Assets Liabilities
2015 2014 2015 2014
$’000 $’000 $’000 $’000
Group
Property, plant and equipment – 252 (24,821) (29,638)Unabsorbed wear and tear allowances and
unutilised tax losses 2,312 2,001 – –Allowances 4,299 4,169 – –Other items 513 460 (83) –Deferred tax assets/(liabilities) 7,124 6,882 (24,904) (29,638)
26Jun_TatHong_FR15_V.indd 11326Jun_TatHong_FR15_V.indd 113 26/6/15 16:5626/6/15 16:56

1 1 4 NOTES TO THE FINANCIAL STATEMENTS
Year ended 31 March 2015
ANNUAL REPORT 2015
TAT HONG HOLDINGS LTD
9 DEFERRED TAX ASSETS AND LIABILITIES (CONT’D)
Recognised deferred tax assets and liabilities (cont’d)
Deferred tax liabilities and assets are offset when there is a legally enforceable right to set off current tax assets against current tax liabilities and when the deferred taxes relate to the same taxation authority. The following amounts, determined after appropriate offsetting, are included in the statement of fi nancial position as follows:
2015 2014
$’000 $’000
Deferred tax assets 5,745 5,293Deferred tax liabilities (23,525) (28,049)
(17,780) (22,756)
Movement in temporary differences during the year
At
1 April
2013
Recognised
in profi t
or loss
(note 23)
Translation
difference on
consolidation
At
31 March
2014
Recognised
in profi t
or loss
(note 23)
Disposal of
subsidiaries
Translation
difference on
consolidation
At
31 March
2015
$’000 $’000 $’000 $’000 $’000 $’000 $’000 $’000
Group
Property, plant and equipment (24,970) (4,169) (247) (29,386) 1,811 3,718 (964) (24,821)
Unabsorbed wear and tear allowances and unutilised tax losses 3,075 (1,109) 35 2,001 160 – 151 2,312
Allowances 5,159 (514) (476) 4,169 519 (1) (388) 4,299Other items 1,011 (522) (29) 460 (76) (10) 56 430
(15,725) (6,314) (717) (22,756) 2,414 3,707 (1,145) (17,780)
26Jun_TatHong_FR15_V.indd 11426Jun_TatHong_FR15_V.indd 114 26/6/15 16:5626/6/15 16:56
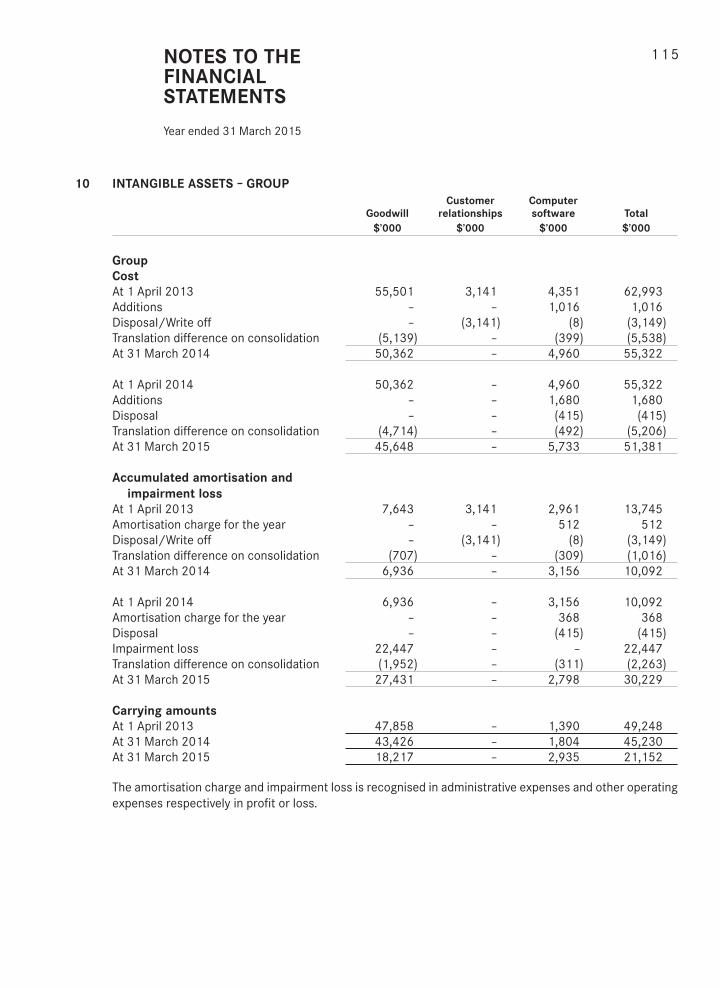
1 1 5NOTES TO THE FINANCIAL STATEMENTS
Year ended 31 March 2015
10 INTANGIBLE ASSETS – GROUP
Goodwill
Customer
relationships
Computer
software Total
$’000 $’000 $’000 $’000
Group
Cost
At 1 April 2013 55,501 3,141 4,351 62,993Additions – – 1,016 1,016Disposal/Write off – (3,141) (8) (3,149)Translation difference on consolidation (5,139) – (399) (5,538)At 31 March 2014 50,362 – 4,960 55,322
At 1 April 2014 50,362 – 4,960 55,322Additions – – 1,680 1,680Disposal – – (415) (415)Translation difference on consolidation (4,714) – (492) (5,206)At 31 March 2015 45,648 – 5,733 51,381
Accumulated amortisation and
impairment loss
At 1 April 2013 7,643 3,141 2,961 13,745Amortisation charge for the year – – 512 512Disposal/Write off – (3,141) (8) (3,149)Translation difference on consolidation (707) – (309) (1,016)At 31 March 2014 6,936 – 3,156 10,092
At 1 April 2014 6,936 – 3,156 10,092Amortisation charge for the year – – 368 368Disposal – – (415) (415)Impairment loss 22,447 – – 22,447Translation difference on consolidation (1,952) – (311) (2,263)At 31 March 2015 27,431 – 2,798 30,229
Carrying amounts
At 1 April 2013 47,858 – 1,390 49,248At 31 March 2014 43,426 – 1,804 45,230At 31 March 2015 18,217 – 2,935 21,152
The amortisation charge and impairment loss is recognised in administrative expenses and other operating expenses respectively in profi t or loss.
26Jun_TatHong_FR15_V.indd 11526Jun_TatHong_FR15_V.indd 115 26/6/15 16:5626/6/15 16:56

1 1 6 NOTES TO THE FINANCIAL STATEMENTS
Year ended 31 March 2015
ANNUAL REPORT 2015
TAT HONG HOLDINGS LTD
10 INTANGIBLE ASSETS – GROUP (CONT’D)
Impairment test
For the purpose of impairment testing, goodwill is allocated to the Group’s operating divisions or cash-generating units (“CGU”), which represents the lowest level within the Group at which the goodwill is monitored for internal management purposes and is not higher than the Group’s operating segments as reported in note 28.
The carrying amounts of goodwill are allocated as follows:
Group
2015 2014
$’000 $’000
Tutt Bryant Group Limited and its subsidiaries (“Tutt Bryant Group”)– Crane Rental CGU 10,122 11,321– General Equipment Rental CGU 6,837 30,949
16,959 42,270Multiple units with insignifi cant goodwill 1,258 1,156
18,217 43,426
The recoverable amounts of the CGUs under Tutt Bryant Group are determined based on value-in-use calculations, using cash fl ow projections derived from fi nancial budgets derived from the Management’s forecast results for the years ending 31 March 2016 to 2018. Cash fl ows are projected using long term growth rates of up to 3% (2014: 0% to 3%), as well as industry outlook based on the Management’s knowledge and past experience of the businesses. Cash fl ows beyond the fi ve-year period are extrapolated using the estimated terminal growth rate of 3% (2014: 3%). A pre-tax discount rate of 12% (2014: 11%) was used in discounting the projected cash fl ows.
Based on the impairment assessment performed by the Management in 2015, the carrying amount of the General Equipment Rental CGU in Tutt Bryant Group was determined to be higher than its recoverable amount and an impairment loss of $22,447,000 was recognised in profi t or loss. There was no impairment loss recognised in 2014 as the carrying amount was determined to be lower than its recoverable amount.
The Group believes that any reasonably possible changes in the above key assumptions applied are not likely to cause the recoverable amount to be signifi cantly lower than its carrying amount.
11 ASSET HELD FOR SALE – GROUP
In February 2015, the Management committed to sell a property within the Crane Rental segment. Accordingly, the property, whose carrying amount at the reporting date was $2,240,000, is presented as an asset held for sale. Subsequent to the balance sheet date, the property was sold for a cash consideration of approximately $6,500,000.
26Jun_TatHong_FR15_V.indd 11626Jun_TatHong_FR15_V.indd 116 26/6/15 16:5626/6/15 16:56
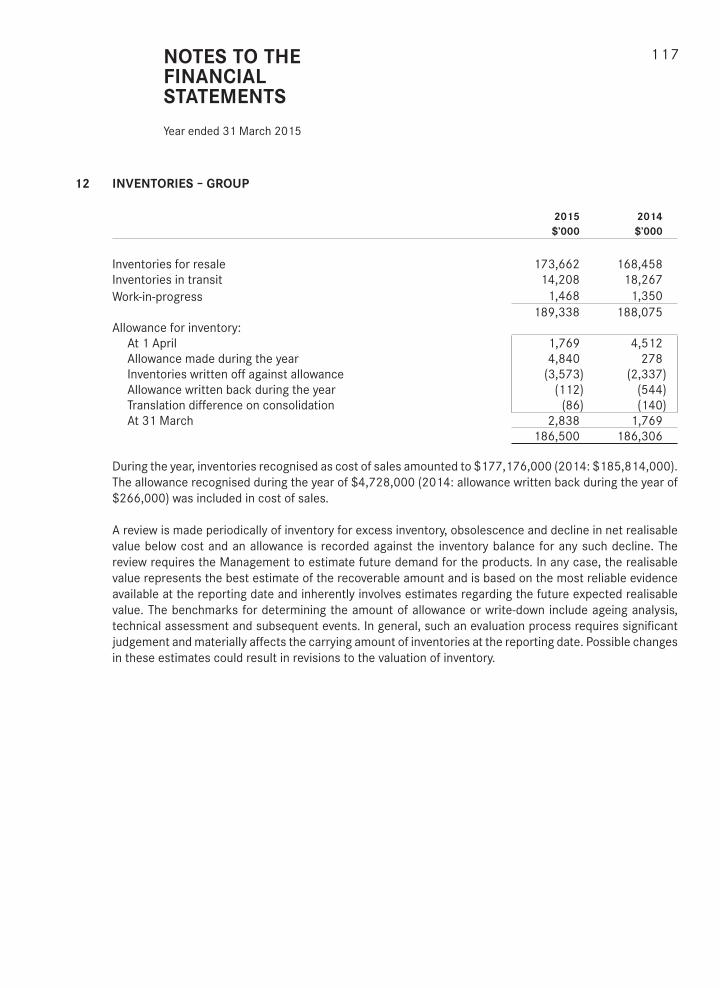
1 1 7NOTES TO THE FINANCIAL STATEMENTS
Year ended 31 March 2015
12 INVENTORIES – GROUP
2015 2014
$’000 $’000
Inventories for resale 173,662 168,458Inventories in transit 14,208 18,267Work-in-progress 1,468 1,350
189,338 188,075Allowance for inventory: At 1 April 1,769 4,512 Allowance made during the year 4,840 278 Inventories written off against allowance (3,573) (2,337) Allowance written back during the year (112) (544) Translation difference on consolidation (86) (140) At 31 March 2,838 1,769
186,500 186,306
During the year, inventories recognised as cost of sales amounted to $177,176,000 (2014: $185,814,000). The allowance recognised during the year of $4,728,000 (2014: allowance written back during the year of $266,000) was included in cost of sales.
A review is made periodically of inventory for excess inventory, obsolescence and decline in net realisable value below cost and an allowance is recorded against the inventory balance for any such decline. The review requires the Management to estimate future demand for the products. In any case, the realisable value represents the best estimate of the recoverable amount and is based on the most reliable evidence available at the reporting date and inherently involves estimates regarding the future expected realisable value. The benchmarks for determining the amount of allowance or write-down include ageing analysis, technical assessment and subsequent events. In general, such an evaluation process requires signifi cant judgement and materially affects the carrying amount of inventories at the reporting date. Possible changes in these estimates could result in revisions to the valuation of inventory.
26Jun_TatHong_FR15_V.indd 11726Jun_TatHong_FR15_V.indd 117 26/6/15 16:5626/6/15 16:56
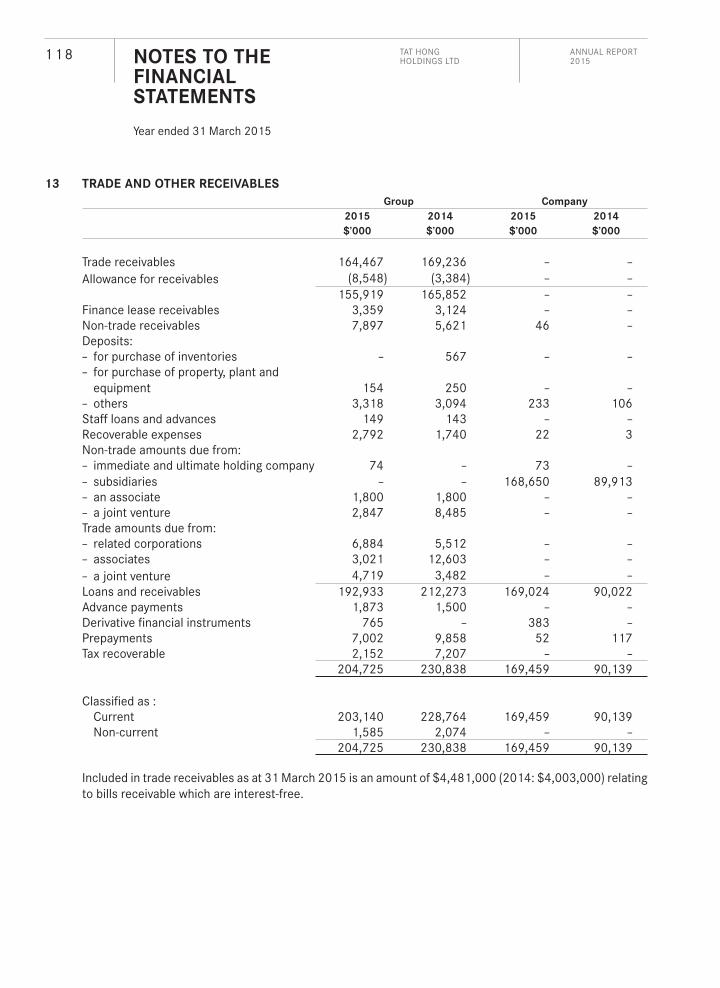
1 1 8 NOTES TO THE FINANCIAL STATEMENTS
Year ended 31 March 2015
ANNUAL REPORT 2015
TAT HONG HOLDINGS LTD
13 TRADE AND OTHER RECEIVABLES
Group Company
2015 2014 2015 2014
$’000 $’000 $’000 $’000
Trade receivables 164,467 169,236 – –Allowance for receivables (8,548) (3,384) – –
155,919 165,852 – –Finance lease receivables 3,359 3,124 – –Non-trade receivables 7,897 5,621 46 –Deposits:– for purchase of inventories – 567 – –– for purchase of property, plant and
equipment 154 250 – –– others 3,318 3,094 233 106Staff loans and advances 149 143 – –Recoverable expenses 2,792 1,740 22 3Non-trade amounts due from:– immediate and ultimate holding company 74 – 73 –– subsidiaries – – 168,650 89,913– an associate 1,800 1,800 – –– a joint venture 2,847 8,485 – –Trade amounts due from:– related corporations 6,884 5,512 – –– associates 3,021 12,603 – –– a joint venture 4,719 3,482 – –Loans and receivables 192,933 212,273 169,024 90,022Advance payments 1,873 1,500 – –Derivative fi nancial instruments 765 – 383 –Prepayments 7,002 9,858 52 117Tax recoverable 2,152 7,207 – –
204,725 230,838 169,459 90,139
Classifi ed as : Current 203,140 228,764 169,459 90,139 Non-current 1,585 2,074 – –
204,725 230,838 169,459 90,139
Included in trade receivables as at 31 March 2015 is an amount of $4,481,000 (2014: $4,003,000) relating to bills receivable which are interest-free.
26Jun_TatHong_FR15_V.indd 11826Jun_TatHong_FR15_V.indd 118 26/6/15 16:5626/6/15 16:56
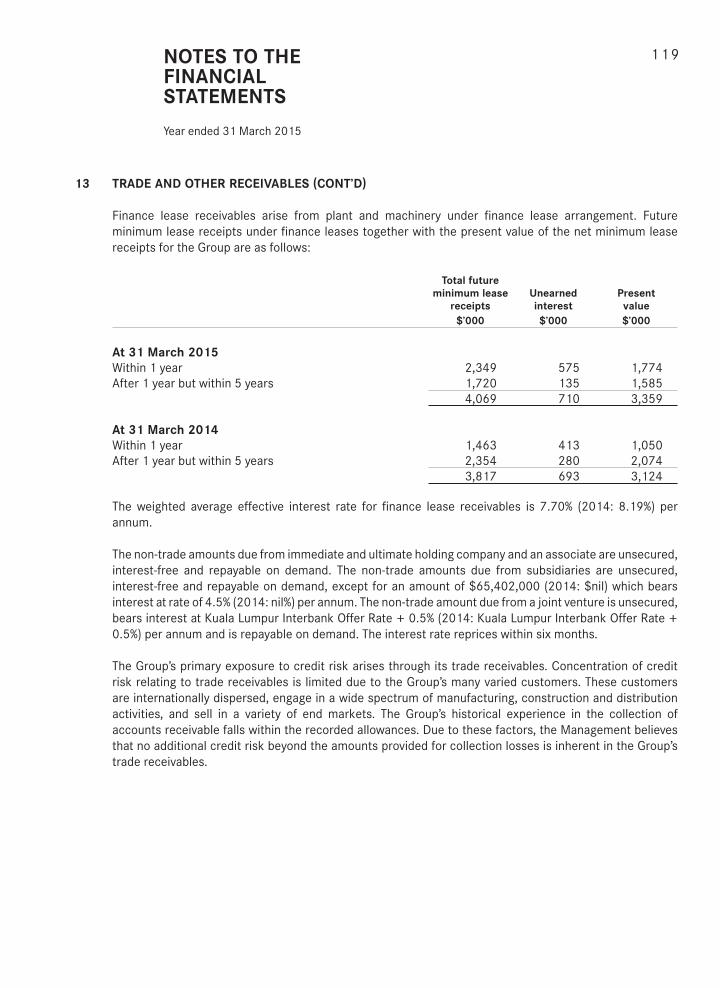
1 1 9NOTES TO THE FINANCIAL STATEMENTS
Year ended 31 March 2015
13 TRADE AND OTHER RECEIVABLES (CONT’D)
Finance lease receivables arise from plant and machinery under fi nance lease arrangement. Future minimum lease receipts under fi nance leases together with the present value of the net minimum lease receipts for the Group are as follows:
Total future
minimum lease
receipts
Unearned
interest
Present
value
$’000 $’000 $’000
At 31 March 2015
Within 1 year 2,349 575 1,774After 1 year but within 5 years 1,720 135 1,585
4,069 710 3,359
At 31 March 2014
Within 1 year 1,463 413 1,050After 1 year but within 5 years 2,354 280 2,074
3,817 693 3,124
The weighted average effective interest rate for fi nance lease receivables is 7.70% (2014: 8.19%) per annum.
The non-trade amounts due from immediate and ultimate holding company and an associate are unsecured, interest-free and repayable on demand. The non-trade amounts due from subsidiaries are unsecured, interest-free and repayable on demand, except for an amount of $65,402,000 (2014: $nil) which bears interest at rate of 4.5% (2014: nil%) per annum. The non-trade amount due from a joint venture is unsecured, bears interest at Kuala Lumpur Interbank Offer Rate + 0.5% (2014: Kuala Lumpur Interbank Offer Rate + 0.5%) per annum and is repayable on demand. The interest rate reprices within six months.
The Group’s primary exposure to credit risk arises through its trade receivables. Concentration of credit risk relating to trade receivables is limited due to the Group’s many varied customers. These customers are internationally dispersed, engage in a wide spectrum of manufacturing, construction and distribution activities, and sell in a variety of end markets. The Group’s historical experience in the collection of accounts receivable falls within the recorded allowances. Due to these factors, the Management believes that no additional credit risk beyond the amounts provided for collection losses is inherent in the Group’s trade receivables.
26Jun_TatHong_FR15_V.indd 11926Jun_TatHong_FR15_V.indd 119 26/6/15 16:5626/6/15 16:56

1 2 0 NOTES TO THE FINANCIAL STATEMENTS
Year ended 31 March 2015
ANNUAL REPORT 2015
TAT HONG HOLDINGS LTD
13 TRADE AND OTHER RECEIVABLES (CONT’D)
Impairment
The ageing of trade and other receivables that were not impaired at the reporting date was:
Gross
Impairment
losses Gross
Impairment
losses
2015 2015 2014 2014
$’000 $’000 $’000 $’000
Group
Not past due 98,621 – 143,936 (254)Past due 0 – 90 days 37,330 – 22,878 (491)Past due 91 – 180 days 16,270 (485) 14,097 (282)Past due 181 – 365 days 13,722 (2,839) 4,140 (1,414)Past due more than one year 13,148 (5,224) 5,782 (943)
179,091 (8,548) 190,833 (3,384)
The change in impairment loss in respect of trade receivables balances during the year is as follows:
Group
2015 2014
$’000 $’000
At 1 April 3,384 8,059Impairment loss recognised 7,198 3,583Amount reversed (1,001) (4,403)Amount utilised (602) (3,696)Disposal of subsidiaries (377) –Translation difference (54) (159)At 31 March 8,548 3,384
Based on historical default rates, the Group believes that no impairment allowance is necessary in respect of trade receivables not past due or past due up to 90 days, unless specifi cally provided for due to uncertainties in the collection of debts. These receivables are mainly arising by customers that have good payment records with the Group.
The Group evaluates whether there is any objective evidence that trade receivables are impaired, and determine the amount of impairment loss as a result of the inability of the debtors to make required payments. The Group bases the estimates on the ageing of the trade receivables balance, credit-worthiness of the debtors and historical write-off experience. If the fi nancial conditions of the debtors were to deteriorate, actual write-offs could be higher than estimated.
26Jun_TatHong_FR15_V.indd 12026Jun_TatHong_FR15_V.indd 120 26/6/15 16:5626/6/15 16:56

1 2 1NOTES TO THE FINANCIAL STATEMENTS
Year ended 31 March 2015
14 CASH AND CASH EQUIVALENTS
Group Company
Note 2015 2014 2015 2014
$’000 $’000 $’000 $’000
Cash at banks and in hand 92,776 58,257 891 178Fixed deposits with banks 490 346 – –
93,266 58,603 891 178Bank balances earmarked for
certain banking facilities (1,029) –Bank overdrafts (unsecured) 18 – (7,412)Cash and cash equivalents in the
consolidated statement of cash fl ows 92,237 51,191
The effective interest rates relating to cash and cash equivalents, excluding bank overdrafts, at the reporting date for the Group ranged between 1.4% to 7.5% (2014: between 0.25% to 7.50%) per annum. Interest rates reprice within one year.
Cash and cash equivalents totalling the equivalent of $15,516,000 (2014: $12,450,000) are held in countries which operate foreign exchange controls.
The bank overdrafts of a subsidiary were guaranteed by the Company. The effective interest rate of the bank overdrafts at 31 March 2014 ranged between 5.50% to 5.75% per annum. Interest rates repriced within one year.
15 SHARE CAPITAL – COMPANY
Ordinary shares
Convertible redeemable
preference shares
2015 2014 2015 2014
No. of shares No. of shares
’000 ’000 ’000 ’000
Issued and fully-paid with no par value:
At 1 April 631,593 631,185 11,700 11,700Issue of shares pursuant to exercise of
options – 408 – –Redemption of convertible redeemable
preference shares – – (11,700) –At 31 March, including treasury shares 631,593 631,593 – 11,700Less: Treasury shares (2,030) (1,769) – –At 31 March, excluding treasury shares 629,563 629,824 – 11,700
26Jun_TatHong_FR15_V.indd 12126Jun_TatHong_FR15_V.indd 121 26/6/15 16:5626/6/15 16:56

1 2 2 NOTES TO THE FINANCIAL STATEMENTS
Year ended 31 March 2015
ANNUAL REPORT 2015
TAT HONG HOLDINGS LTD
15 SHARE CAPITAL – COMPANY (CONT’D)
Convertible redeemable preference shares
Convertible redeemable preferences shares (“CRPS”) do not carry the right to vote unless it is a resolution proposed at a General Meeting to:
1. vary the rights attached to the CRPS;
2. wind-up the Company; or
3. appoint, re-appoint or remove any Director nominated by the Preference Shareholders (or any majority thereof).
The holders of the CRPS are entitled to receive annual dividend based on the following amounts:
– in respect of the fi rst fi ve fi nancial years commencing from 1 April 2009, the dividend on each CRPS will carry similar dividend rights as declared from time to time to the ordinary shareholders of the Company; and
– for the fi nancial year ending after 31 March 2014, unless and until the redemption of all the issued CRPS in full in accordance with the terms and conditions of the CRPS, and provided that the Company at its discretion has declared a dividend to ordinary shareholders at the same time or earlier, a dividend equal to 25% of the issue price of the CRPS will be paid on each CRPS.
Each CRPS shall be convertible into one ordinary share in the share capital of the Company. After the fi rst anniversary of the date of issuance, the outstanding CRPS will be automatically converted into ordinary shares in the event the volume weighted average price of the ordinary shares of the Company as computed over a period of 30 trading days on the Singapore Stock Exchange was over 150% of the issue price (“mandatory conversion condition”). The conversion ratio will be subject to the usual anti-dilution adjustments and shall be mandatorily converted into ordinary share based on the above mandatory conversion condition:
– for the period commencing on the fi rst anniversary and ending on the third anniversary of the date of issuance of CRPS, one-third of the outstanding CRPS shall be converted into ordinary shares;
– for the period commencing on the third anniversary and ending on the fourth anniversary of the date of issuance of CRPS, one-third of the outstanding CRPS plus a further half of the remaining and outstanding CRPS shall be converted into ordinary shares; and
– for the period commencing on the fourth anniversary and ending on the fi fth anniversary of the date of issuance of CRPS, all remaining CRPS shall be converted.
In March 2015, the Company fully redeemed the outstanding 11,700,000 CRPS at $1.15 per CRPS pursuant to the terms and conditions of the CRPS. The difference between the redemption price and the par value of the CRPS, amounting to $1,982,000, was recorded in capital reserve.
26Jun_TatHong_FR15_V.indd 12226Jun_TatHong_FR15_V.indd 122 26/6/15 16:5626/6/15 16:56

1 2 3NOTES TO THE FINANCIAL STATEMENTS
Year ended 31 March 2015
15 SHARE CAPITAL – COMPANY (CONT’D)
Ordinary shares
The holders of ordinary shares (excluding treasury shares) are entitled to receive dividends as declared from time to time and are entitled to one vote per share at meetings of the Company. All shares (excluding treasury shares) rank equally with regard to the Company’s residual assets.
Issue of ordinary shares
During the fi nancial year ended 31 March 2015, no CRPS was converted into ordinary shares.
During the fi nancial year ended 31 March 2014, 408,000 ordinary shares were issued as a result of the exercise of vested options arising from the Tat Hong Employee Share Option Scheme 2006 and 96,000 shares were awarded and deducted from Treasury shares under the Performance Share Plan granted to employees and key management. The options were exercised at $1.08 per option (see note 19).
Treasury shares
Movements in the Company’s treasury shares were as follows:
2015 2014
No. of shares No. of shares
’000 ’000
At 1 April 1,769 1,865Treasury shares transferred pursuant to performance share plan (203) (96)Purchase of treasury shares 464 –At 31 March 2,030 1,769
Capital management
The Board’s policy is to maintain a sound capital base so as to maintain investor, creditor and market confi dence and to sustain future development of the business.
The Group manages its capital structure and makes adjustments to it, in light of changes in economic conditions. To maintain or adjust the capital structure, the Group may adjust the dividend payments to shareholders, return capital to shareholders or issue new shares.
From time to time, the Group purchases its own shares on the market; the timing of these purchases depends on market prices. Primarily, the shares purchased are intended to be used for issuing shares under the Group’s share option programme and performance share plan. Buy and sell decisions are made on a specifi c transaction basis by the Board; the Group does not have a defi ned share buy-back plan.
There were no changes in the Group’s approach to capital management during the year.
26Jun_TatHong_FR15_V.indd 12326Jun_TatHong_FR15_V.indd 123 26/6/15 16:5626/6/15 16:56

1 2 4 NOTES TO THE FINANCIAL STATEMENTS
Year ended 31 March 2015
ANNUAL REPORT 2015
TAT HONG HOLDINGS LTD
15 SHARE CAPITAL – COMPANY (CONT’D)
Capital management (Cont’d)
The Group monitors capital using a gearing ratio, which is net debt divided by total capital. The Group includes within net debt, fi nancial liabilities and trust receipts, less cash and cash equivalents. Capital includes equity attributable to the owners of the Company.
Group
2015 2014
$’000 $’000
Trust receipts 36,520 66,732Financial liabilities 556,536 578,273Less: Cash and cash equivalents (93,266) (58,603)Net debt 499,790 586,402
Total equity attributable to the owners of the Company 650,829 675,535
Gearing ratio 77% 87%
16 RESERVES
The reserves of the Group and the Company comprise the following balances:
Group Company
2015 2014 2015 2014
$’000 $’000 $’000 $’000
Reserve for own shares (1,766) (1,606) (1,766) (1,606)Share-based payment reserve 779 778 779 778Capital reserves 26,258 29,424 (1,951) 28Fair value reserve 273 – 273 –Currency translation reserve (22,234) (20,493) – –Accumulated profi ts 321,670 330,111 43,286 42,586
324,980 338,214 40,621 41,786
Reserve for own shares
Reserve for own shares comprises the cost of the Company’s 2,030,000 (2014: 1,769,000) ordinary shares held by the Company.
Share-based payment reserve
The share-based payment reserve comprises the cumulative value of employee services rendered for the issue of share options and performance shares.
26Jun_TatHong_FR15_V.indd 12426Jun_TatHong_FR15_V.indd 124 26/6/15 16:5626/6/15 16:56

1 2 5NOTES TO THE FINANCIAL STATEMENTS
Year ended 31 March 2015
16 RESERVES (CONT’D)
Fair value reserve
The fair value reserve comprises the effective portion of the cumulative net change in the fair value of hedging instruments used in cash fl ow hedges, as well as the net change in the fair value of available-for-sale fi nancial assets.
Capital reserves
Capital reserves represent the amount capitalised from accumulated profi ts upon bonus issue by subsidiaries and effects arising from changes in ownership interest in subsidiaries without loss of control.
Capital reserves include statutory reserve funds of $4,523,000 (2014: $4,149,000) as at 31 March 2015. These related to the subsidiaries in the People’s Republic of China (“PRC”) which follow the accounting principles and relevant fi nancial regulations of the PRC (“PRC GAAP”) relating to the appropriation of profi t to a statutory reserve fund. Statutory reserve fund is not distributable.
Currency translation reserve
The currency translation reserve comprises all foreign exchange differences arising from the translation of the fi nancial statements of foreign entities as well as the translation of loans which form part of the Company’s net investment in subsidiaries, associates and joint ventures.
17 TRADE AND OTHER PAYABLES
Group Company
2015 2014 2015 2014
$’000 $’000 $’000 $’000
Trade payables 131,212 137,545 595 759Non-trade payables 8,105 16,764 – –Interest payable 380 491 – –Deposits received 5,061 3,864 – –Unclaimed dividends 19 17 19 17Accrued operating expenses 22,602 26,873 2,003 1,786Amounts due to:– immediate and ultimate holding company 298 – 60 –– related corporations 2,736 835 – –– associates 18,966 33,112 – –– a shareholder of a subsidiary 4,436 3,876 – –– a joint venture 1,056 950 750 750Classifi ed as other fi nancial liabilities 194,871 224,327 3,427 3,312Derivative fi nancial instruments 356 1,066 10 162Liability for long service and annual leave 12,350 12,052 200 241Provisions 748 797 – –Advance billings and advance receipts 1,303 1,443 – –
209,628 239,685 3,637 3,715
26Jun_TatHong_FR15_V.indd 12526Jun_TatHong_FR15_V.indd 125 26/6/15 16:5626/6/15 16:56
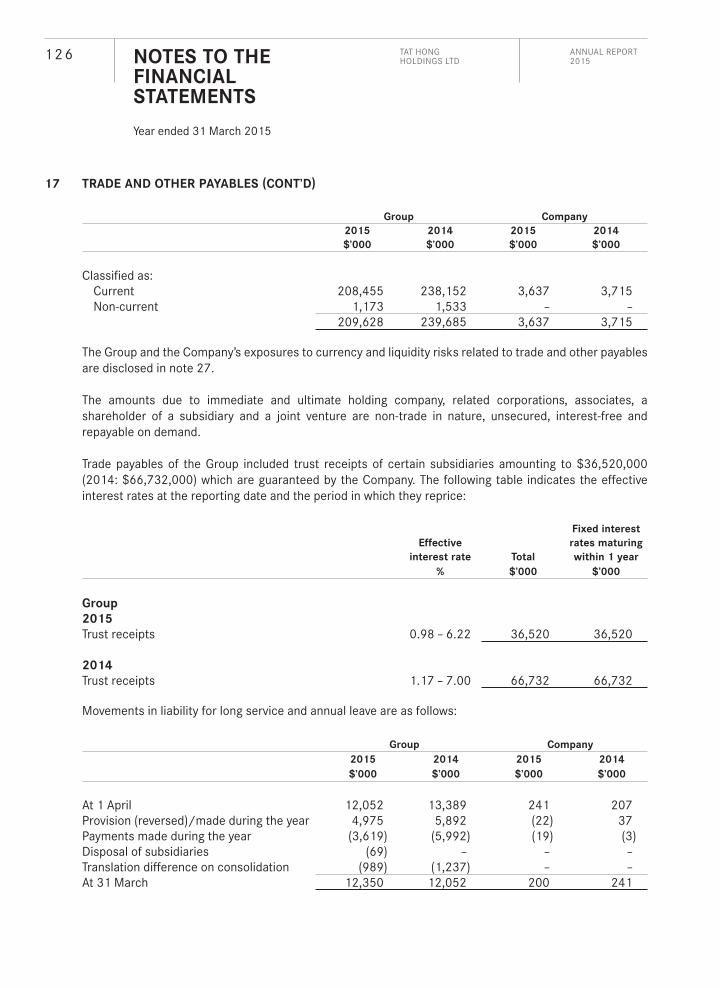
1 2 6 NOTES TO THE FINANCIAL STATEMENTS
Year ended 31 March 2015
ANNUAL REPORT 2015
TAT HONG HOLDINGS LTD
17 TRADE AND OTHER PAYABLES (CONT’D)
Group Company
2015 2014 2015 2014
$’000 $’000 $’000 $’000
Classifi ed as: Current 208,455 238,152 3,637 3,715 Non-current 1,173 1,533 – –
209,628 239,685 3,637 3,715
The Group and the Company’s exposures to currency and liquidity risks related to trade and other payables are disclosed in note 27.
The amounts due to immediate and ultimate holding company, related corporations, associates, a shareholder of a subsidiary and a joint venture are non-trade in nature, unsecured, interest-free and repayable on demand.
Trade payables of the Group included trust receipts of certain subsidiaries amounting to $36,520,000 (2014: $66,732,000) which are guaranteed by the Company. The following table indicates the effective interest rates at the reporting date and the period in which they reprice:
Fixed interest
Effective rates maturing
interest rate Total within 1 year
% $’000 $’000
Group
2015
Trust receipts 0.98 – 6.22 36,520 36,520
2014
Trust receipts 1.17 – 7.00 66,732 66,732
Movements in liability for long service and annual leave are as follows:
Group Company
2015 2014 2015 2014
$’000 $’000 $’000 $’000
At 1 April 12,052 13,389 241 207Provision (reversed)/made during the year 4,975 5,892 (22) 37Payments made during the year (3,619) (5,992) (19) (3)Disposal of subsidiaries (69) – – –Translation difference on consolidation (989) (1,237) – –At 31 March 12,350 12,052 200 241
26Jun_TatHong_FR15_V.indd 12626Jun_TatHong_FR15_V.indd 126 26/6/15 16:5626/6/15 16:56

1 2 7NOTES TO THE FINANCIAL STATEMENTS
Year ended 31 March 2015
18 FINANCIAL LIABILITIES
Group Company
2015 2014 2015 2014
$’000 $’000 $’000 $’000
Non-current liabilities
Secured bank loans 82,181 83,294 – –Unsecured bank loans 98,619 55,007 88,950 9,500Notes payable 99,348 99,170 99,348 99,170Finance lease liabilities 88,899 117,351 – –Intra-group fi nancial guarantees – – 7,084 5,475
369,047 354,822 195,382 114,145
Current liabilities
Secured bank loans 34,334 31,281 – –Unsecured bank overdrafts – 7,412 – –Unsecured bank loans 83,008 109,923 11,510 8,500Finance lease liabilities 70,147 74,835 – –
187,489 223,451 11,510 8,500556,536 578,273 206,892 122,645
Total loans and borrowings 556,536 578,273 199,808 117,170Intra-group fi nancial guarantees – – 7,084 5,475Total fi nancial liabilities 556,536 578,273 206,892 122,645
Information about the Group’s and the Company’s exposure to interest rate, foreign currency and liquidity risks is included in note 27.
On 19 June 2013, the Company established the $500 million Multicurrency Medium Term Note Programme. Notes outstanding as at 31 March 2015 comprise $100 million 5-year unsecured fi xed rate notes due on 31 July 2018. The balance of $99,348,000 (2014: $99,170,000) as at the fi nancial year end represents the notes payable measured at amortised cost. Interest rate at 4.5% per annum is payable semi-annually in arrears. The notes payable are listed on the Singapore Exchange Securities Trading Limited (“SGX-ST”).
26Jun_TatHong_FR15_V.indd 12726Jun_TatHong_FR15_V.indd 127 26/6/15 16:5626/6/15 16:56

1 2 8 NOTES TO THE FINANCIAL STATEMENTS
Year ended 31 March 2015
ANNUAL REPORT 2015
TAT HONG HOLDINGS LTD
18 FINANCIAL LIABILITIES (CONT’D)
Terms and debt repayment schedule
Terms and conditions of outstanding loans and borrowings are as follows:
Nominal
interest
rate
2015 2014
Currency
Year of
maturity
Face
value
Carrying
amount
Face
value
Carrying
amount
$’000 $’000 $’000 $’000
Group
Fixed rate loans SGD 2.91% to 5.25% 2017 – 2018 11,932 11,932 2,742 2,742Floating rate loans SGD SIBOR/SOR/COF
+ 1.10% to 3.40% 2015 – 2019 264,460 261,289 160,400 160,400
Fixed rate loans AUD 5.81% to 8.09% 2016 977 977 21,354 21,354Floating rate loans AUD #BBR + 1.75% 2015 2,116 2,116 – –Floating rate loans RMB *PBOC + 1.15%
to 1.25%2015 – 2019 5,920 5,920 81,958 81,958
Fixed rate loans MYR 5.25% 2014 – – 127 127Floating rate loans MYR ^KLIBOR + 2.00% 2019 4,185 4,185 – –Floating rate loans USD COF + 1.75% 2015 2,284 2,284 5,545 5,545Floating rate loans THB COF + 1.75% 2016 – 2018 9,439 9,439 7,379 7,379Bank overdrafts Prime lending rate
+ 0.5%2014 – – 7,412 7,412
Notes payable SGD 4.50% 2018 100,000 99,348 100,000 99,170Finance lease
liabilities– fi xed rate
SGD 1.50% to 6.19% 2015 – 2020 38,253 38,253 60,310 60,310
Finance lease liabilities
– fl oating rate
SGD Prime lending rate – 1% to 2%
2015 – 2017 7,547 7,547 5,936 5,936
Finance lease liabilities
AUD 5.44% to 6.81% 2015 – 2020 113,246 113,246 125,940 125,940
– fi xed rate560,359 556,536 579,103 578,273
Company
Notes payable SGD 4.50% 2018 100,000 99,348 100,000 99,170Floating rate loans SGD SOR + 1.5% to
2.0% 2016 – 2019 100,000 98,638 18,000 18,000
Floating rate loan SGD SIBOR + 1.3% 2016 1,822 1,822 – –201,822 199,808 118,000 117,170
* PBOC denotes People’s Bank of China interest rates^ KLIBOR denotes Kuala Lumpur Interbank Offer Rate# BBR denotes bank buying rate
The secured bank loans are secured on property, plant and equipment with a carrying amount of $201,036,000 (2014: $194,424,000).
26Jun_TatHong_FR15_V.indd 12826Jun_TatHong_FR15_V.indd 128 26/6/15 16:5626/6/15 16:56

1 2 9NOTES TO THE FINANCIAL STATEMENTS
Year ended 31 March 2015
18 FINANCIAL LIABILITIES (CONT’D)
The following indicates the effective interest rates at the reporting date and the period in which they reprice:
Floating
Fixed interest rates
maturing
Effective interest within within
Currency interest rate Total rate 1 year 1 to 5 years
$’000 $’000 $’000 $’000
Group
2015
Secured loans– Floating rate SGD 1.73% to 2.22% 99,504 99,504 – –– Fixed rate SGD 4.05% 11,932 – 3,836 8,096– Floating rate RMB 7.36% to 7.81% 4,146 4,146 – –– Fixed rate AUD 5.81% to 8.09% 933 – 294 639Unsecured loans– Fixed rate AUD 6.95% 44 – 44 –– Floating rate AUD 4.40% 2,116 2,116 – –– Floating rate USD 6.67% 2,284 2,284 – –– Floating rate RMB 6.42% 1,774 1,774 – –– Floating rate THB 4.30% 9,439 9,439 – –– Floating rate MYR 5.34% 4,185 4,185 – –– Floating rate SGD 1.41% to 4.15% 161,785 161,785 – –Finance lease liabilities SGD 1.50% to 6.19% 45,800 7,547 16,329 21,924Finance lease liabilities AUD 5.44% to 6.81% 113,246 – 50,075 63,171Notes payable SGD 4.50% 99,348 – – 99,348
556,536 292,780 70,578 193,178
2014
Secured loans– Floating rate SGD 1.42% to 4.05% 31,510 31,510 – –– Fixed rate MYR 5.25% 127 – 127 –– Floating rate RMB 1.77% to 7.81% 61,888 61,888 – –– Fixed rate AUD 4.15% to 5.81% 21,050 – 5,470 15,580Unsecured loans– Fixed rate AUD 7.69% to 8.09% 304 – 255 49– Floating rate USD 5.50% 5,545 5,545 – –– Floating rate RMB 1.90% to 8.00% 20,070 20,070 – –– Floating rate THB 4.10% 7,379 7,379 – –– Fixed rate SGD 2.91% to 5.25% 2,742 – 2,742 –– Floating rate SGD 1.15% to 4.05% 128,890 128,890 – –Finance lease liabilities SGD 1.13% to 5.67% 66,246 5,936 26,861 33,449Finance lease liabilities AUD 5.51% to 8.50% 125,940 – 44,038 81,902Bank overdrafts SGD 5.50% to 5.75% 7,412 7,412 – –Notes payable SGD 4.50% 99,170 – – 99,170
578,273 268,630 79,493 230,150
26Jun_TatHong_FR15_V.indd 12926Jun_TatHong_FR15_V.indd 129 26/6/15 16:5626/6/15 16:56
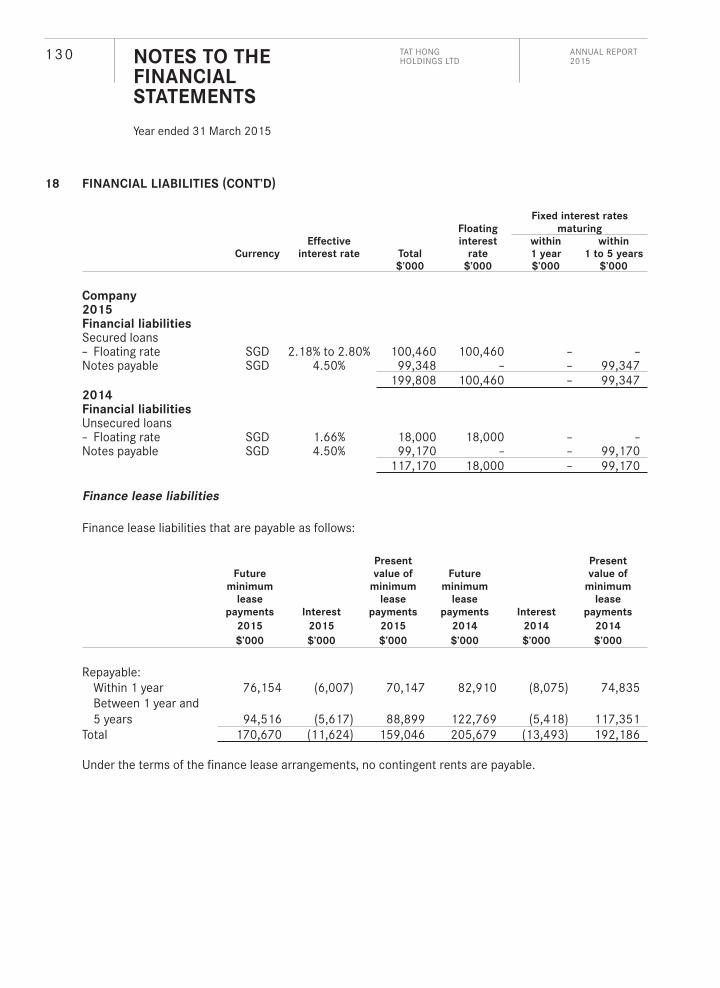
1 3 0 NOTES TO THE FINANCIAL STATEMENTS
Year ended 31 March 2015
ANNUAL REPORT 2015
TAT HONG HOLDINGS LTD
18 FINANCIAL LIABILITIES (CONT’D)
Floating
Fixed interest rates
maturing
Effective interest within within
Currency interest rate Total rate 1 year 1 to 5 years
$’000 $’000 $’000 $’000
Company2015Financial liabilitiesSecured loans– Floating rate SGD 2.18% to 2.80% 100,460 100,460 – –Notes payable SGD 4.50% 99,348 – – 99,347
199,808 100,460 – 99,3472014Financial liabilitiesUnsecured loans– Floating rate SGD 1.66% 18,000 18,000 – –Notes payable SGD 4.50% 99,170 – – 99,170
117,170 18,000 – 99,170
Finance lease liabilities
Finance lease liabilities that are payable as follows:
Future
minimum
lease
payments Interest
Present
value of
minimum
lease
payments
Future
minimum
lease
payments Interest
Present
value of
minimum
lease
payments
2015 2015 2015 2014 2014 2014
$’000 $’000 $’000 $’000 $’000 $’000
Repayable: Within 1 year 76,154 (6,007) 70,147 82,910 (8,075) 74,835 Between 1 year and
5 years 94,516 (5,617) 88,899 122,769 (5,418) 117,351Total 170,670 (11,624) 159,046 205,679 (13,493) 192,186
Under the terms of the fi nance lease arrangements, no contingent rents are payable.
26Jun_TatHong_FR15_V.indd 13026Jun_TatHong_FR15_V.indd 130 26/6/15 16:5626/6/15 16:56

1 3 1NOTES TO THE FINANCIAL STATEMENTS
Year ended 31 March 2015
18 FINANCIAL LIABILITIES (CONT’D)
Intra-group guarantees
Intra-group fi nancial guarantees comprise guarantees granted by the Company to banks in respect of banking facilities amounting to $306,920,000 (2014: $337,241,000). The periods in which the fi nancial guarantees expire are as follows:
Company
2015 2014
$’000 $’000
Less than 1 year 152,383 162,004Between 1 and 5 years 154,537 175,237
306,920 337,241
19 SHARE-BASED PAYMENT
Equity compensation benefi ts
Tat Hong Employee Share Option Scheme 2006 and Performance Share Plan
The Tat Hong Employee Share Option Scheme 2006 (“ESOS 2006”) and Performance Share Plan (“PSP”) (collective the “Scheme”) were approved by the Company at its Extraordinary General Meeting on 8 December 2006. The Scheme is administered by the Option Shares/Performance Shares Plan Committee, comprising four directors, Mak Lye Mun (Chairman), Ng San Tiong Roland, Ng Sun Ho Tony and Ong Tiew Siam.
Other information regarding the Scheme is set out as follows:
– the Board of the Company may specify the vesting conditions which must be satisfi ed or waived by the Board before options and awards allocated under the Scheme may be dealt with;
– the exercise price for each share in respect of which an option is exercisable shall be a price equal to the market price;
– the options can be exercised 1 year after the grant; and
– the options granted expire after 5 years for non-executive directors and 10 years for the employees of the Company and its subsidiaries.
26Jun_TatHong_FR15_V.indd 13126Jun_TatHong_FR15_V.indd 131 26/6/15 16:5626/6/15 16:56

1 3 2 NOTES TO THE FINANCIAL STATEMENTS
Year ended 31 March 2015
ANNUAL REPORT 2015
TAT HONG HOLDINGS LTD
19 SHARE-BASED PAYMENT (CONT’D)
At the end of the fi nancial year, details of the options granted under the Scheme on the unissued ordinary shares of the Company are as follows:
Date of grant
of options
Exercise
price
per share
Options
outstanding
as at 1 April
2014
Options
cancelled
Options
exercised
Options
outstanding
as at
31 March
2015
Number
of option
holders
as at
31 March
2015 Exercise period
30 September 2009
1.08 1,709,000 (75,000) – 1,634,000 43 1 October 2010 – 30 September 2019
30 September 2009
1.08 400,000 (400,000) – – – 1 October 2010 – 30 September 2014
2,109,000 (475,000) – 1,634,000
Details of options granted to directors of the Company under the Scheme are as follows:
Name of director
Options granted
for fi nancial
year ended
31 March 2015
Aggregate options
granted since
commencement
of Scheme to
31 March 2015
Aggregate options
exercised since
commencement
of Scheme to
31 March 2015
Aggregate
options
outstanding as at
31 March 2015
Tan Chok Kian – 100,000 – –Ong Tiew Siam – 200,000 (200,000) –Leong Horn Kee – 100,000 – –Mak Lye Mun – 100,000 – –Low Seow Juan – 100,000 – –
Since the commencement of the Scheme, no options have been granted to the controlling shareholders of the Company or their associates and no participant under the Scheme has been granted 5% or more of the total options available under the Scheme.
26Jun_TatHong_FR15_V.indd 13226Jun_TatHong_FR15_V.indd 132 26/6/15 16:5626/6/15 16:56

1 3 3NOTES TO THE FINANCIAL STATEMENTS
Year ended 31 March 2015
19 SHARE-BASED PAYMENT (CONT’D)
Disclosure of the Scheme
The number and weighted average exercise prices of share options are as follows:
Weighted average
exercise price
Number of
options
Weighted average
exercise price
Number of
options
2015 2015 2014 2014
$ ’000 $ ’000
Outstanding at 1 April 1.08 2,109 1.08 2,542Exercised during the year 1.08 – 1.08 (408)Cancelled during the year 1.08 (475) 1.08 (25)Outstanding at 31 March 1.08 1,634 1.08 2,109Exercisable at 31 March 1.08 1,634 1.08 2,109
The options outstanding at 31 March 2015 have an exercise price of $1.08 (2014: $1.08) and a contractual life of 5 years for non-executive directors and 10 years for executive directors and employees from the date of grant respectively, in accordance with the terms of the Scheme.
Inputs for measurement of grant date fair values
The grant date fair value of the rights granted through the employee share option plan was measured based on Trinomial Option Model Pricing (“TOPM”). Expected volatility is estimated by considering historic average share price volatility. The inputs used in the measurement of the fair values at grant date of the share-based payment plans are the following:
Fair value of share options and assumptions As at 30
September 2009
Fair value at grant date $0.313Share price at grant date $1.05Exercise price $1.08Expected volatility (weighted average volatility) 50%Option life (expected weighted average life) 3 yearsExpected dividends $0.01 – $0.015Risk-free interest rate (based on government bonds) 0.7%
20 REVENUE – GROUP
Revenue comprises income from rental of equipment and machinery, material and related labour charges to customers and invoiced trading sales (refer to note 28).
All inter-company transactions have been eliminated in arriving at the Group’s revenue.
26Jun_TatHong_FR15_V.indd 13326Jun_TatHong_FR15_V.indd 133 26/6/15 16:5626/6/15 16:56

1 3 4 NOTES TO THE FINANCIAL STATEMENTS
Year ended 31 March 2015
ANNUAL REPORT 2015
TAT HONG HOLDINGS LTD
21 FINANCE EXPENSE – GROUP
2015 2014
$’000 $’000
Interest paid and payable to:– banks 14,354 14,283– fi nance lease creditors 10,328 10,929Cost of borrowing 1,453 722Gain on fair value adjustment on derivatives (175) (291)Finance expense 25,960 25,643
22 PROFIT BEFORE INCOME TAX – GROUP
The following items have been included in arriving at profi t for the year:
2015 2014
$’000 $’000
Other operating income
Gain on disposal of property, plant and equipment 21,153 6,459Gain on disposal of an associate 151 –Loss on partial disposal of an associate – (44)Gain on disposal of land rights – 12,961Gain on disposal of subsidiaries 4,823 343Gain on disposal of other fi nancial assets – 294Interest income 846 936Dividend income from other fi nancial assets 174 –Rental income 3,757 2,770Trade receivable recovered 96 48Others 3,534 4,413
34,534 28,180
Staff costs
Wages and salaries 140,009 147,088Contributions to defi ned contribution plans 11,972 9,520Cost of long service leave and annual leave 4,975 5,892Value of employee services received for issue of performance shares 213 110Cancellation of share options – (8)
157,169 162,602
26Jun_TatHong_FR15_V.indd 13426Jun_TatHong_FR15_V.indd 134 26/6/15 16:5626/6/15 16:56

1 3 5NOTES TO THE FINANCIAL STATEMENTS
Year ended 31 March 2015
22 PROFIT BEFORE INCOME TAX – GROUP (CONT’D)
Note 2015 2014
$’000 $’000
Key management personnel compensation:
Compensation payable to key management personnel comprises:Short-term employee benefi ts 11,038 12,686Post employment benefi ts 236 328Value of employee services received for issue of performance
shares 156 10311,430 13,117
Other expenses
Allowance recognised/(written back) for inventories 12 4,728 (266)Allowance recognised/(written back) for trade receivables 13 6,197 (820)Amortisation of intangible assets 10 368 512Audit fees paid to: – auditors of the Company 392 347– other auditors 743 575Trade receivables written off 28 3,915Depreciation of property, plant and equipment 4 89,802 86,562Directors' fees:– directors of the Company: – payable by the Company 470 470 – payable by subsidiary – 32– directors of the subsidiaries 423 630Exchange (gain)/loss (11,109) 12,170Impairment loss on property, plant and equipment recognised/
(reversed) 4 8,385 (365)Impairment loss on investment in associates 6 – 3,400Impairment loss on intangible assets 10 22,447 –Inventories written off – 216Gain on fair value adjustment on derivatives, net (867) (3,810)Non-audit fees paid to:– auditors of the Company 81 75– auditors of subsidiaries 47 40Operating lease expenses 12,338 13,025Property, plant and equipment written off 203 40Provisions made/(reversed) (net) 164 (13)
26Jun_TatHong_FR15_V.indd 13526Jun_TatHong_FR15_V.indd 135 26/6/15 16:5626/6/15 16:56

1 3 6 NOTES TO THE FINANCIAL STATEMENTS
Year ended 31 March 2015
ANNUAL REPORT 2015
TAT HONG HOLDINGS LTD
23 INCOME TAX EXPENSE – GROUP
2015 2014
Income tax recognised in profi t or loss $’000 $’000
Current tax expense
Current year 12,807 5,775(Over)/Under provision in respect of prior years (1,978) 1,384Foreign taxes suffered 3,145 1,696
13,974 8,855Deferred tax expense
Movement in temporary differences (802) 5,935(Over)/Under provision in respect of prior years (1,612) 379
(2,414) 6,314Income tax expense 11,560 15,169
Reconciliation of effective tax rate
Profi t before income tax 18,357 48,948
Tax using the Singapore tax rate of 17% (2014: 17%) 3,121 8,321Effect of tax rates in foreign jurisdictions (893) 247Effect of utilisation of capital allowances and tax losses previously not
recognised (29) (28)Effect of concessionary tax rate (361) (398)Foreign taxes suffered 3,145 1,696Non-deductible expenses 17,252 9,356Non-taxable income (7,104) (7,832)(Over)/Under provision in respect of prior years (3,590) 1,763Unrecognised deferred tax assets during the year 19 1,936Other items, net – 108
11,560 15,169
The Group has exposure to income taxes in numerous jurisdictions. Signifi cant judgement is involved in determining the group-wide provision for income taxes. There are certain transactions and computations for which the ultimate tax determination is uncertain during the ordinary course of business. The Group recognises liabilities for expected tax issues based on estimates of whether additional taxes will be due. Where the fi nal tax outcome of these matters is different from the amounts that were initially recognised, such differences will impact the income tax and deferred tax provisions in the period in which such determination is made.
In addition, certain subsidiaries of the Group have potential tax benefi ts arising from unutilised tax losses, unabsorbed wear and tear allowances and other temporary differences, which are available for set-off against future taxable profi ts. Signifi cant judgement is involved in determining the availability of future taxable profi ts against which the Group can utilise the tax benefi ts therefrom. The use of the potential tax benefi ts is also subject to the agreement of the tax authorities and compliance with certain provisions of the tax legislation of the respective countries in which the subsidiaries operate. Where the fi nal outcome of these matters is different from the amounts that were initially recognised, such differences will impact the income tax provision and recognised deferred tax assets relating to the potential tax benefi ts in the period in which such determination is made.
26Jun_TatHong_FR15_V.indd 13626Jun_TatHong_FR15_V.indd 136 26/6/15 16:5626/6/15 16:56
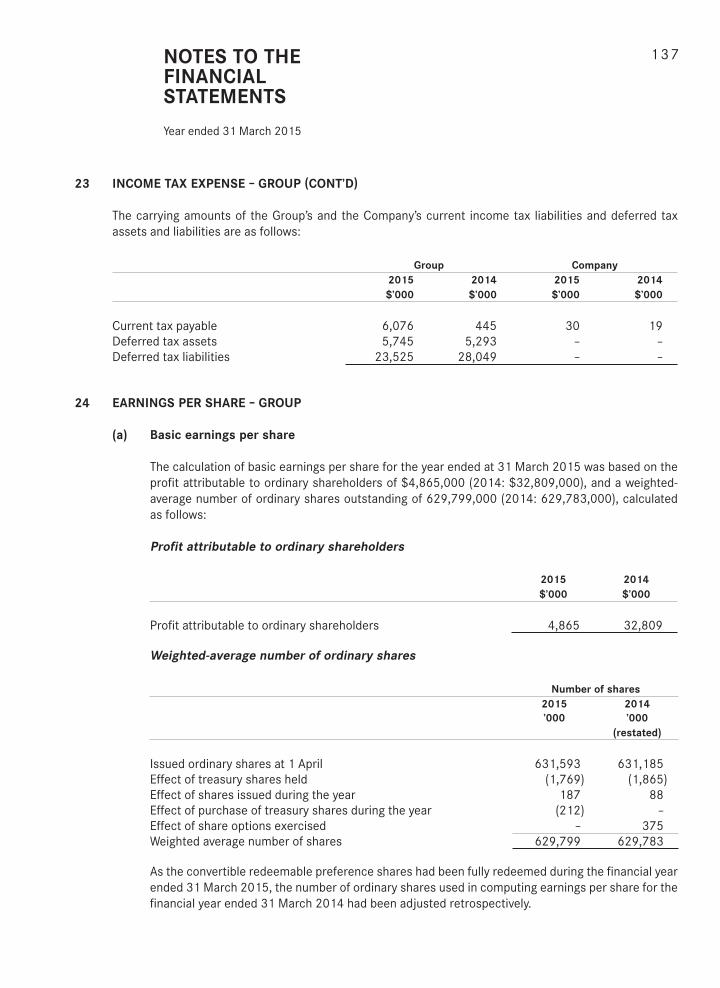
1 3 7NOTES TO THE FINANCIAL STATEMENTS
Year ended 31 March 2015
23 INCOME TAX EXPENSE – GROUP (CONT’D)
The carrying amounts of the Group’s and the Company’s current income tax liabilities and deferred tax assets and liabilities are as follows:
Group Company
2015 2014 2015 2014
$’000 $’000 $’000 $’000
Current tax payable 6,076 445 30 19Deferred tax assets 5,745 5,293 – –Deferred tax liabilities 23,525 28,049 – –
24 EARNINGS PER SHARE – GROUP
(a) Basic earnings per share
The calculation of basic earnings per share for the year ended at 31 March 2015 was based on the profi t attributable to ordinary shareholders of $4,865,000 (2014: $32,809,000), and a weighted-average number of ordinary shares outstanding of 629,799,000 (2014: 629,783,000), calculated as follows:
Profi t attributable to ordinary shareholders
2015 2014
$’000 $’000
Profi t attributable to ordinary shareholders 4,865 32,809
Weighted-average number of ordinary shares
Number of shares
2015 2014
’000 ’000
(restated)
Issued ordinary shares at 1 April 631,593 631,185Effect of treasury shares held (1,769) (1,865)Effect of shares issued during the year 187 88Effect of purchase of treasury shares during the year (212) –Effect of share options exercised – 375Weighted average number of shares 629,799 629,783
As the convertible redeemable preference shares had been fully redeemed during the fi nancial year ended 31 March 2015, the number of ordinary shares used in computing earnings per share for the fi nancial year ended 31 March 2014 had been adjusted retrospectively.
26Jun_TatHong_FR15_V.indd 13726Jun_TatHong_FR15_V.indd 137 26/6/15 16:5626/6/15 16:56

1 3 8 NOTES TO THE FINANCIAL STATEMENTS
Year ended 31 March 2015
ANNUAL REPORT 2015
TAT HONG HOLDINGS LTD
24 EARNINGS PER SHARE – GROUP (CONT’D)
(b) Diluted earnings per share
The calculation of diluted earnings per share for the year ended at 31 March 2015 was based on profi t attributable to ordinary shareholders of $4,865,000 (2014: $32,809,000), and a weighted-average number of ordinary shares outstanding after adjustment for the effects of all dilutive potential ordinary shares of 629,799,000 (2014: 629,783,000), calculated as follows:
Profi t attributable to ordinary shareholders (diluted)
2015 2014
$’000 $’000
Profi t attributable to ordinary shareholders (basic) 4,865 32,809
Weighted-average number of ordinary shares (diluted)
Number of shares
2015 2014
’000 ’000
(restated)
Weighted average number of shares used in the calculation of basic earnings per share 629,799 629,783
Adjustment for potential dilutive shares under Tat Hong Employee Share Option Scheme 2006 – –
629,799 629,783
As at 31 March 2015, there were 1,634,000 (2014: 2,109,000) share options which were issued on 30 September 2009 and are available for conversion to ordinary shares. The share options are deemed to be anti-dilutive (2014: anti-dilutive) and are not included in the weighted-average number of ordinary shares for the purpose of computing diluted earnings per share.
26Jun_TatHong_FR15_V.indd 13826Jun_TatHong_FR15_V.indd 138 26/6/15 16:5626/6/15 16:56
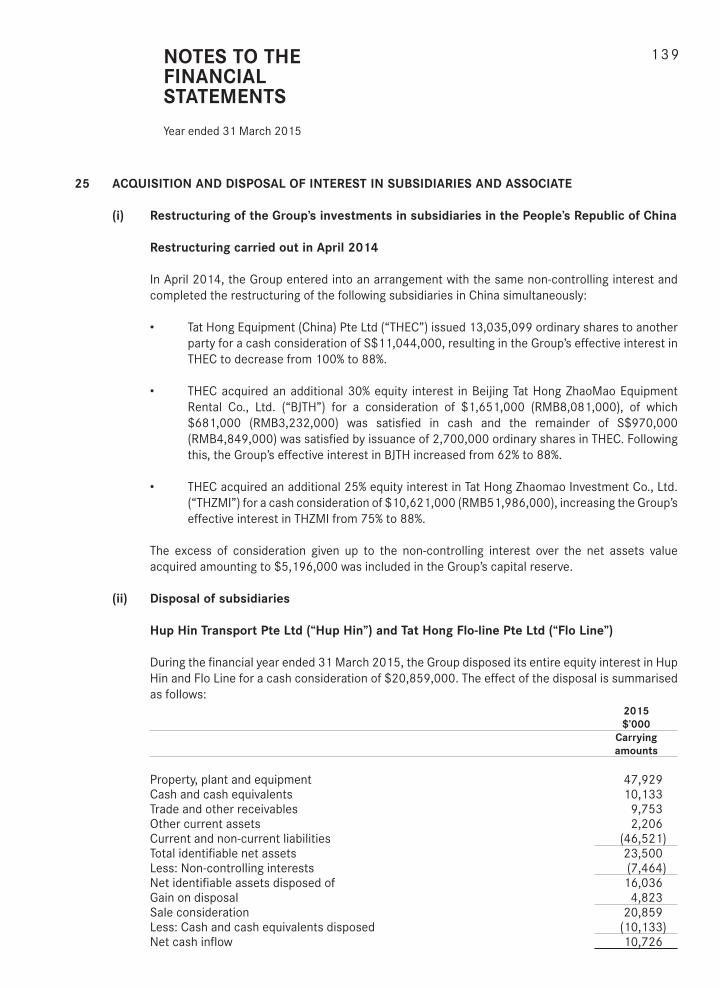
1 3 9NOTES TO THE FINANCIAL STATEMENTS
Year ended 31 March 2015
25 ACQUISITION AND DISPOSAL OF INTEREST IN SUBSIDIARIES AND ASSOCIATE
(i) Restructuring of the Group’s investments in subsidiaries in the People’s Republic of China
Restructuring carried out in April 2014
In April 2014, the Group entered into an arrangement with the same non-controlling interest and completed the restructuring of the following subsidiaries in China simultaneously:
• Tat Hong Equipment (China) Pte Ltd (“THEC”) issued 13,035,099 ordinary shares to another party for a cash consideration of S$11,044,000, resulting in the Group’s effective interest in THEC to decrease from 100% to 88%.
• THEC acquired an additional 30% equity interest in Beijing Tat Hong ZhaoMao Equipment Rental Co., Ltd. (“BJTH”) for a consideration of $1,651,000 (RMB8,081,000), of which $681,000 (RMB3,232,000) was satisfi ed in cash and the remainder of S$970,000 (RMB4,849,000) was satisfi ed by issuance of 2,700,000 ordinary shares in THEC. Following this, the Group’s effective interest in BJTH increased from 62% to 88%.
• THEC acquired an additional 25% equity interest in Tat Hong Zhaomao Investment Co., Ltd. (“THZMI”) for a cash consideration of $10,621,000 (RMB51,986,000), increasing the Group’s effective interest in THZMI from 75% to 88%.
The excess of consideration given up to the non-controlling interest over the net assets value acquired amounting to $5,196,000 was included in the Group’s capital reserve.
(ii) Disposal of subsidiaries
Hup Hin Transport Pte Ltd (“Hup Hin”) and Tat Hong Flo-line Pte Ltd (“Flo Line”)
During the fi nancial year ended 31 March 2015, the Group disposed its entire equity interest in Hup Hin and Flo Line for a cash consideration of $20,859,000. The effect of the disposal is summarised as follows:
2015
$’000
Carrying
amounts
Property, plant and equipment 47,929Cash and cash equivalents 10,133Trade and other receivables 9,753Other current assets 2,206Current and non-current liabilities (46,521)Total identifi able net assets 23,500Less: Non-controlling interests (7,464)Net identifi able assets disposed of 16,036Gain on disposal 4,823Sale consideration 20,859Less: Cash and cash equivalents disposed (10,133)Net cash infl ow 10,726
26Jun_TatHong_FR15_V.indd 13926Jun_TatHong_FR15_V.indd 139 26/6/15 16:5626/6/15 16:56

1 4 0 NOTES TO THE FINANCIAL STATEMENTS
Year ended 31 March 2015
ANNUAL REPORT 2015
TAT HONG HOLDINGS LTD
25 ACQUISITION AND DISPOSAL OF INTEREST IN SUBSIDIARIES AND ASSOCIATE (CONT’D)
(ii) Disposal of subsidiaries (cont’d)
Dyno Engineering Pte Ltd (“Dyno”)
During the fi nancial year ended 31 March 2014, the Group disposed Dyno for a cash consideration of $1,496,000. The effect of the disposal is summarised as follows:
2014
$’000
Carrying
amounts
Property, plant and equipment 3Cash and cash equivalents 1,208Other current assets 254Current liabilities (312)Total identifi able net assets 1,153Gain on disposal 343Sale consideration 1,496Less: Cash and cash equivalents disposed (1,208)Net cash infl ow 288
26 DIVIDENDS
The following exempt (one-tier) dividends were declared and paid by the Group and Company:
Group and Company
2015 2014
$’000 $’000
Final dividend paid of 1.0 cents (2014: 2.5 cents) per ordinary share 6,300 15,745Final dividend paid of 1.0 cents (2014: 2.5 cents) per share to convertible
redeemable preference shareholders 117 293Interim dividend paid of 0.5 cents (2014: 1.0 cents) per ordinary share 3,148 6,298Interim dividend paid of 0.5 cents (2014: 1.0 cents) per share to
convertible redeemable preference shareholders 59 1179,624 22,453
After the reporting date, the directors proposed the following dividends. The dividends have not been provided for.
Group and Company
2015 2014
$’000 $’000
Proposed dividend of 1.0 cents (2014: 1.0 cents) per share to: – ordinary shareholders 6,297 6,298– convertible redeemable preference shareholders – 117
6,297 6,415
26Jun_TatHong_FR15_V.indd 14026Jun_TatHong_FR15_V.indd 140 26/6/15 16:5626/6/15 16:56
1 4 1NOTES TO THE FINANCIAL STATEMENTS
Year ended 31 March 2015
27 FINANCIAL INSTRUMENTS
Financial risk management
Overview
The Group has exposure to the following risks arising from fi nancial instruments:
• credit risk• liquidity risk• market risk
This note presents information about the Group’s exposure to each of the above risks, the Group’s objectives, policies and processes for measuring and managing risk, and the Group’s management of capital.
Risk management framework
The Board of Directors has overall responsibility for the establishment and oversight of the Group’s risk management framework. The Board has established a Risk Management Committee, which oversees how the Management monitors compliance with the Group’s risk management policies and procedures and reviews the adequacy of the risk management framework in relation to the risks faced by the Group. The committee reports to the Board of Directors on the outcome of its review and discussions and makes recommendations from time to time on matters arising and requiring the attention of the Board.
The Group’s risk management policies are established to identify and analyse the risks faced by the Group, to set appropriate risk limits and controls, and to monitor risks and adherence to limits. Risk management policies and systems are reviewed regularly to refl ect changes in market conditions and the Group’s activities. The Group, through its training and management standards and procedures, aims to develop a disciplined and constructive control environment in which all employees understand their roles and obligations.
Credit risk
Credit risk is the risk of fi nancial loss to the Group if a customer or counterparty to a fi nancial instrument fails to meet its contractual obligations to the Group as and when it falls due. Credit risk is managed and monitored through the application of credit approvals, performing credit evaluations and setting credit limits. For trade receivables, the Group adopts the policy of dealing only with customers with appropriate credit history to mitigate credit risk. The Group also monitors the collectability on an on-going basis.
The Group establishes an allowance for impairment that represents its estimates of incurred losses in respect of trade and other receivables. The main components of this allowance are a specifi c loss component that relates to individually signifi cant exposures, and a collective loss component established for groups of similar assets in respect of losses that have been incurred but not yet identifi ed. The collective loss allowance is determined based on historical data of payment statistics for similar fi nancial assets.
26Jun_TatHong_FR15_V.indd 14126Jun_TatHong_FR15_V.indd 141 26/6/15 16:5626/6/15 16:56

1 4 2 NOTES TO THE FINANCIAL STATEMENTS
Year ended 31 March 2015
ANNUAL REPORT 2015
TAT HONG HOLDINGS LTD
27 FINANCIAL INSTRUMENTS (CONT’D)
The allowance account in respect of trade and other receivables is used to record impairment losses unless the Group is satisfi ed that no recovery of the amount owing is possible. At that point, the fi nancial asset is considered irrecoverable and the amount charged to the allowance account is written off against the carrying amount of the impaired fi nancial asset.
Investments and bank transactions are allowed with counter-parties that meet the appropriate credit criteria and are of high credit standing. As such, the Management does not expect any counter-party to fail to meet its obligations. At the reporting date, there were no signifi cant concentrations of credit risk. The maximum exposure to credit risk is represented by the carrying amount of each fi nancial asset in the statement of fi nancial position.
Guarantees
The Group’s policy is to provide fi nancial guarantees only to wholly-owned subsidiaries.
The maximum exposure of the Company in respect of the intra-group fi nancial guarantee (see note 18) at the reporting date is if the facilities are drawn down by the subsidiary in the amount of $306,920,000 (2014: $337,241,000). At the reporting date, the Company does not consider it probable that a claim will be made against the Company under the intra-group fi nancial guarantee.
Liquidity risk
Liquidity risk is the risk that the Group will encounter diffi culty in meeting the obligations associated with its fi nancial liabilities that are settled by delivering cash or another fi nancial asset. The objective of liquidity management is to ensure that the Group has suffi cient funds to meet its contractual and fi nancial obligations as and when they fall due. The Group’s approach to managing liquidity is to ensure, as far as possible, that it will always have suffi cient liquidity to meet its liabilities when due, under both normal and stressed conditions, without incurring unacceptable losses or risking damage to the Group’s reputation.
The Group focuses on ensuring matching maturities of the Group’s assets and liabilities. A suffi cient amount of credit facilities from fi nancial institutions have been secured and an adequate level of funding is maintained. The Group will also maintain a level of cash and cash equivalents deemed adequate by the Management to fi nance the Group’s operations and to mitigate the effects of fl uctuations in cash fl ows. Typically the Group ensures that it has suffi cient cash on demand to meet expected operational expenses for a period of 60 days, including the servicing of fi nancial obligations; this excludes the potential impact of extreme circumstances that cannot reasonably be predicted, such as natural disasters.
26Jun_TatHong_FR15_V.indd 14226Jun_TatHong_FR15_V.indd 142 26/6/15 16:5626/6/15 16:56

1 4 3NOTES TO THE FINANCIAL STATEMENTS
Year ended 31 March 2015
27 FINANCIAL INSTRUMENTS (CONT’D)
The following are the contractual maturities of fi nancial liabilities, including estimated interest payments and excluding the impact of netting agreements:
Cash fl ows
Carrying
amount
Contractual
cash fl ows
Within
1 year
Within
1 to 5 years
More than
5 years
$’000 $’000 $’000 $’000 $’000
Group
2015
Non-derivative fi nancial
liabilities
Variable interest rate loans 285,233 (300,301) (119,348) (180,953) –Fixed interest rate loans 12,909 (13,733) (4,616) (9,117) –Finance lease liabilities 159,046 (170,670) (76,154) (94,516) –Notes payable 99,348 (115,732) (4,500) (111,232) –Trade and other payables 194,871 (194,871) (194,871) – –
751,407 (795,307) (399,489) (395,818) –
Derivative fi nancial
assets designated as
cash fl ow hedges
Interest rate swaps 383 417 109 308 –
Other derivative
fi nancial assets
Forward contracts– infl ow 382 20,760 20,760 – –– outfl ow – (20,378) (20,378) – –
382 382 382 – –
Other derivative
fi nancial liabilities
Interest rate swaps 11 (10) (10) – –Forward contracts– infl ow – 11,460 11,460 – –– outfl ow 345 (11,805) (11,805) – –
356 (355) (355) – –
26Jun_TatHong_FR15_V.indd 14326Jun_TatHong_FR15_V.indd 143 26/6/15 16:5626/6/15 16:56

1 4 4 NOTES TO THE FINANCIAL STATEMENTS
Year ended 31 March 2015
ANNUAL REPORT 2015
TAT HONG HOLDINGS LTD
27 FINANCIAL INSTRUMENTS (CONT’D)
Cash fl ows
Carrying
amount
Contractual
cash fl ows
Within
1 year
Within
1 to 5 years
More than
5 years
$’000 $’000 $’000 $’000 $’000
Group
2014
Non-derivative fi nancial
liabilities
Variable interest rate loans 255,282 (264,142) (137,286) (126,144) (712)Fixed interest rate loans 24,223 (26,264) (9,576) (16,688) –Finance lease liabilities 192,186 (205,679) (82,910) (122,769) –Bank overdrafts 7,412 (7,808) (7,808) – –Notes payable 99,170 (120,232) (4,500) (115,732) –Trade and other payables 224,327 (224,327) (222,794) (1,533) –
802,600 (848,452) (464,874) (382,866) (712)
Other derivative
fi nancial liabilities
Interest rate swap 190 (198) (169) (29) –Forward contracts– infl ow – 49,146 49,146 – –– outfl ow 876 (50,009) (50,009) – –
1,066 (1,061) (1,032) (29) –
Company
2015
Non-derivative fi nancial
liabilities
Variable interest rate loans 100,460 (108,061) (14,185) (93,876) –Notes payable 99,348 (115,732) (4,500) (111,232) –Trade and other payables 3,427 (3,427) (3,427) – –Financial guarantee – (306,920) (306,920) – –
203,235 (534,140) (329,032) (205,108) –
Derivative fi nancial
assets designated as
cash fl ow hedges
Interest rate swaps 383 417 109 308 –
Other derivative
fi nancial liabilities
Interest rate swap 10 (10) (10) – –
26Jun_TatHong_FR15_V.indd 14426Jun_TatHong_FR15_V.indd 144 26/6/15 16:5626/6/15 16:56

1 4 5NOTES TO THE FINANCIAL STATEMENTS
Year ended 31 March 2015
27 FINANCIAL INSTRUMENTS (CONT’D)
Cash fl ows
Carrying
amount
Contractual
cash fl ows
Within
1 year
Within
1 to 5 years
More than
5 years
$’000 $’000 $’000 $’000 $’000
Company
2014
Non-derivative fi nancial
liabilities
Variable interest rate loans 18,000 (18,315) (8,746) (9,569) –Notes payable 99,170 (120,232) (4,500) (115,732) –Trade and other payables 3,312 (3,312) (3,312) – –Financial guarantee – (337,341) (337,341) – –
120,482 (479,200) (353,899) (125,301) –
Other derivative
fi nancial liabilities
Interest rate swap 162 (157) (141) (16) –
Market risk
Market risk is the risk that changes in market prices, such as foreign exchange rates, interest rates and equity prices will affect the Group’s income or the value of the holdings of fi nancial instruments. The objective of market risk management is to manage and control market risk exposures within acceptable parameters, while optimising the return.
It is the Group’s policy not to engage in foreign exchange and/or derivatives speculation or trading. It is not in the interest of the Group to speculate or trade in treasury instruments. The purpose of engaging in treasury transactions is solely for hedging.
The Group has establishments in countries other than Singapore. These establishments are exposed to changes in government regulations and unfavourable political developments, which may limit the realisation of business opportunities and investments in these countries. In addition, the Group’s business operations are exposed to economic uncertainties that continue to affect the global economy and international capital market. Although these circumstances may be beyond its control, the Board and the Management consistently keep themselves up-to-date on the changes in political and industry regulations so as to be able to anticipate or respond to any adverse changes in market conditions in an effi cient and timely manner.
26Jun_TatHong_FR15_V.indd 14526Jun_TatHong_FR15_V.indd 145 26/6/15 16:5626/6/15 16:56

1 4 6 NOTES TO THE FINANCIAL STATEMENTS
Year ended 31 March 2015
ANNUAL REPORT 2015
TAT HONG HOLDINGS LTD
27 FINANCIAL INSTRUMENTS (CONT’D)
Currency risk
The foreign currency risk of the Group arises from sales and purchases that are denominated in a currency other than Singapore dollars. The currencies giving rise to this risk are primarily Japanese Yen, United States dollars, Euro, Thai Baht, Malaysian Ringgit, Vietnam Dong, Hong Kong dollars and the Australian dollars. Exposure to foreign currency risk is monitored on an ongoing basis by the Group to ensure that the net exposure is at an acceptable level.
The Group aims to reduce the exposures of the net position in each currency by using foreign currency borrowings in the respective foreign subsidiaries, and use external forward contracts with fi nancial institution where appropriate. With the exception of Tutt Bryant Group Limited which has their own Board-approved policies and procedures to manage their foreign currency risks, all treasury transactions are approved and/or executed by Group Treasury, whereby only authorised staff can transact with the banks on behalf of the Group.
The Group has established guidelines and procedures to manage its foreign currencies hedging policies. It continuously monitors the exchange rates of the currencies concerned and enters into hedging contracts with banks from time to time to reduce the adverse impact on the Group’s profi tability.
26Jun_TatHong_FR15_V.indd 14626Jun_TatHong_FR15_V.indd 146 26/6/15 16:5626/6/15 16:56
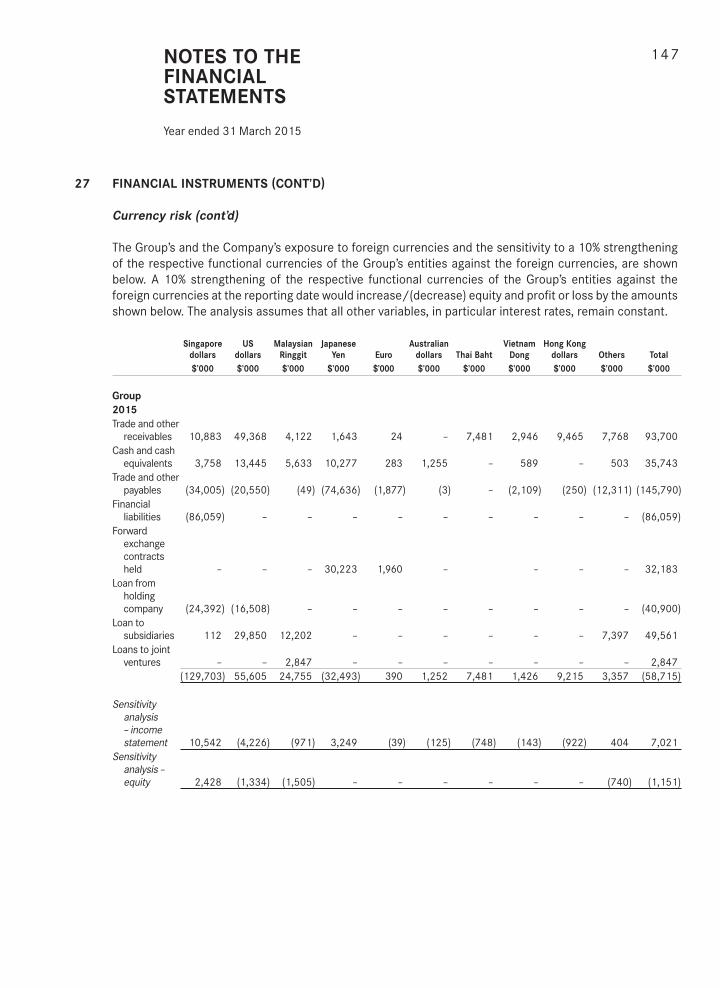
1 4 7NOTES TO THE FINANCIAL STATEMENTS
Year ended 31 March 2015
27 FINANCIAL INSTRUMENTS (CONT’D)
Currency risk (cont’d)
The Group’s and the Company’s exposure to foreign currencies and the sensitivity to a 10% strengthening of the respective functional currencies of the Group’s entities against the foreign currencies, are shown below. A 10% strengthening of the respective functional currencies of the Group’s entities against the foreign currencies at the reporting date would increase/(decrease) equity and profi t or loss by the amounts shown below. The analysis assumes that all other variables, in particular interest rates, remain constant.
Singapore
dollars
US
dollars
Malaysian
Ringgit
Japanese
Yen Euro
Australian
dollars Thai Baht
Vietnam
Dong
Hong Kong
dollars Others Total
$’000 $’000 $’000 $’000 $’000 $’000 $’000 $’000 $’000 $’000 $’000
Group
2015
Trade and other receivables 10,883 49,368 4,122 1,643 24 – 7,481 2,946 9,465 7,768 93,700
Cash and cash equivalents 3,758 13,445 5,633 10,277 283 1,255 – 589 – 503 35,743
Trade and other payables (34,005) (20,550) (49) (74,636) (1,877) (3) – (2,109) (250) (12,311) (145,790)
Financial liabilities (86,059) – – – – – – – – – (86,059)
Forward exchange contracts held – – – 30,223 1,960 – – – – 32,183
Loan from holding company (24,392) (16,508) – – – – – – – – (40,900)
Loan to subsidiaries 112 29,850 12,202 – – – – – – 7,397 49,561
Loans to joint ventures – – 2,847 – – – – – – – 2,847
(129,703) 55,605 24,755 (32,493) 390 1,252 7,481 1,426 9,215 3,357 (58,715)
Sensitivity analysis – income statement 10,542 (4,226) (971) 3,249 (39) (125) (748) (143) (922) 404 7,021
Sensitivity analysis – equity 2,428 (1,334) (1,505) – – – – – – (740) (1,151)
26Jun_TatHong_FR15_V.indd 14726Jun_TatHong_FR15_V.indd 147 26/6/15 16:5626/6/15 16:56

1 4 8 NOTES TO THE FINANCIAL STATEMENTS
Year ended 31 March 2015
ANNUAL REPORT 2015
TAT HONG HOLDINGS LTD
27 FINANCIAL INSTRUMENTS (CONT’D)
Singapore
dollars
US
dollars
Malaysian
Ringgit
Japanese
Yen Euro
Australian
dollars Thai Baht
Vietnam
Dong
Hong Kong
dollars Others Total
$’000 $’000 $’000 $’000 $’000 $’000 $’000 $’000 $’000 $’000 $’000
Group
2014
Trade and other receivables 7,930 38,583 3,613 2,252 297 432 8,220 1,826 9,692 7,690 80,535
Cash and cash equivalents 1,708 556 9,976 6,969 187 180 – 1,478 – 931 21,985
Trade and other payables (21,690) (38,040) (3,945) (43,415) (10,625) (15) – (814) (8) (2,677) (121,229)
Forward exchange contracts held – 12,756 – 27,814 9,440 – – – – – 50,010
Loan from holding company (29,071) – (83) – – – – – – – (29,154)
Loan to subsidiaries – 9,473 – – – – – – – 8,366 17,839
Loans to joint ventures – – 8,485 – – – – – – – 8,485
(41,123) 23,328 18,046 (6,380) (701) 597 8,220 2,490 9,684 14,310 28,471
Sensitivity analysis – income statement 1,205 (1,386) (964) 638 70 (60) (822) (249) (968) (594) (3,130)
Sensitivity analysis – equity 2,907 (947) (840) – – – – – – (837) 283
26Jun_TatHong_FR15_V.indd 14826Jun_TatHong_FR15_V.indd 148 26/6/15 16:5626/6/15 16:56
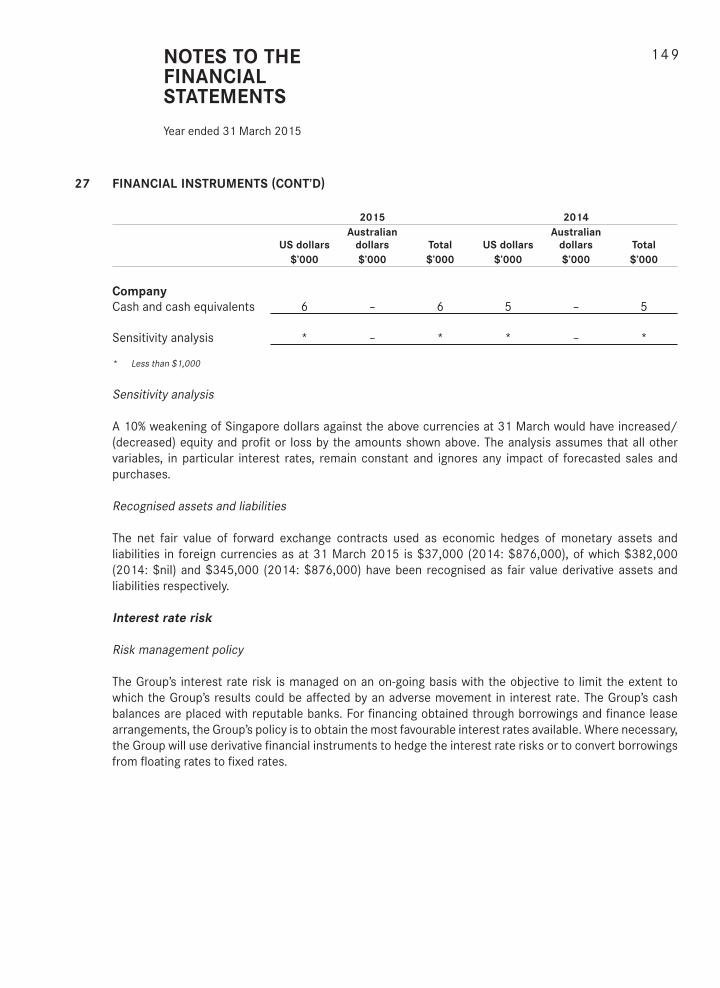
1 4 9NOTES TO THE FINANCIAL STATEMENTS
Year ended 31 March 2015
27 FINANCIAL INSTRUMENTS (CONT’D)
2015 2014
US dollars
Australian
dollars Total US dollars
Australian
dollars Total
$’000 $’000 $’000 $’000 $’000 $’000
Company
Cash and cash equivalents 6 – 6 5 – 5
Sensitivity analysis * – * * – *
* Less than $1,000
Sensitivity analysis
A 10% weakening of Singapore dollars against the above currencies at 31 March would have increased/(decreased) equity and profi t or loss by the amounts shown above. The analysis assumes that all other variables, in particular interest rates, remain constant and ignores any impact of forecasted sales and purchases.
Recognised assets and liabilities
The net fair value of forward exchange contracts used as economic hedges of monetary assets and liabilities in foreign currencies as at 31 March 2015 is $37,000 (2014: $876,000), of which $382,000 (2014: $nil) and $345,000 (2014: $876,000) have been recognised as fair value derivative assets and liabilities respectively.
Interest rate risk
Risk management policy
The Group’s interest rate risk is managed on an on-going basis with the objective to limit the extent to which the Group’s results could be affected by an adverse movement in interest rate. The Group’s cash balances are placed with reputable banks. For fi nancing obtained through borrowings and fi nance lease arrangements, the Group’s policy is to obtain the most favourable interest rates available. Where necessary, the Group will use derivative fi nancial instruments to hedge the interest rate risks or to convert borrowings from fl oating rates to fi xed rates.
26Jun_TatHong_FR15_V.indd 14926Jun_TatHong_FR15_V.indd 149 26/6/15 16:5626/6/15 16:56
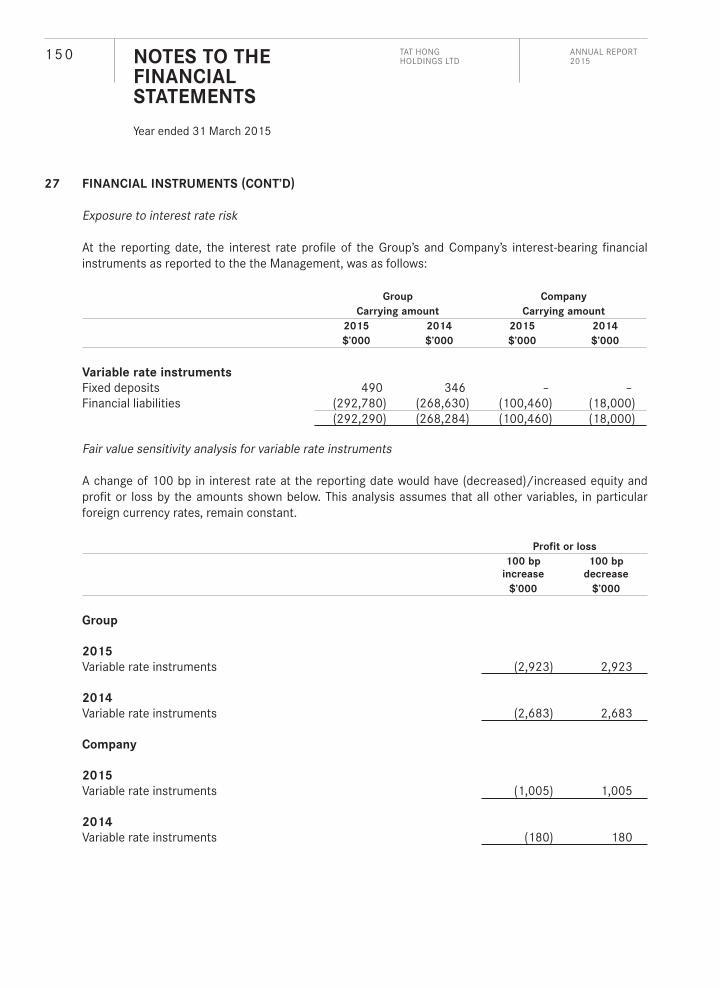
1 5 0 NOTES TO THE FINANCIAL STATEMENTS
Year ended 31 March 2015
ANNUAL REPORT 2015
TAT HONG HOLDINGS LTD
27 FINANCIAL INSTRUMENTS (CONT’D)
Exposure to interest rate risk
At the reporting date, the interest rate profi le of the Group’s and Company’s interest-bearing fi nancial instruments as reported to the the Management, was as follows:
Group Company
Carrying amount Carrying amount
2015 2014 2015 2014
$’000 $’000 $’000 $’000
Variable rate instruments
Fixed deposits 490 346 – –Financial liabilities (292,780) (268,630) (100,460) (18,000)
(292,290) (268,284) (100,460) (18,000)
Fair value sensitivity analysis for variable rate instruments
A change of 100 bp in interest rate at the reporting date would have (decreased)/increased equity and profi t or loss by the amounts shown below. This analysis assumes that all other variables, in particular foreign currency rates, remain constant.
Profi t or loss
100 bp
increase
100 bp
decrease
$’000 $’000
Group
2015
Variable rate instruments (2,923) 2,923
2014
Variable rate instruments (2,683) 2,683
Company
2015
Variable rate instruments (1,005) 1,005
2014
Variable rate instruments (180) 180
26Jun_TatHong_FR15_V.indd 15026Jun_TatHong_FR15_V.indd 150 26/6/15 16:5626/6/15 16:56

1 5 1NOTES TO THE FINANCIAL STATEMENTS
Year ended 31 March 2015
27 FINANCIAL INSTRUMENTS (CONT’D)
Recognised assets and liabilities
The fair value of interest rate swaps used as economic hedges as at 31 March 2015 is $11,000 (2014: $190,000) which has been recognised as fair value derivative liabilities.
The fair value of interest rate swaps designated as hedging instruments in cash fl ow hedges as at 31 March 2015 is $383,000 (2014: $nil) which has been recognised as fair value derivative assets.
Accounting classifi cations and fair values
The carrying amounts and fair values of fi nancial assets and fi nancial liabilities, including their levels in the fair value hierarchy are as follows. It does not include fair value information for fi nancial assets and fi nancial liabilities not measured at fair value if the carrying amount is a reasonable approximation of fair value.
Carrying amount Fair value
Loans and
receivables
Available-
for-sale
Other
fi nancial
liabilities
Hedging
instruments
Financial
assets/
(liabilities)
at fair
value
through
profi t or
loss Total Level 1 Level 2 Level 3 Total
$’000 $’000 $’000 $’000 $’000 $’000 $’000 $’000 $’000 $’000
Group
31 March 2015
Financial assets
measured at fair
value
Interest rate swaps used for hedging – – – 383 – 383 383 383
Other forward exchange contracts – – – – 382 382 382 382
Available-for-sale equity securities – 714 – – – 714 714 714
– 714 – 383 382 1,479
Financial assets not
measured at fair
value
Cash and cash equivalents 93,266 – – – – 93,266
Trade and other receivables 192,933 – – – – 192,933
Available-for-sale equity securities – 84 – – – 84
286,199 84 – – – 286,283
26Jun_TatHong_FR15_V.indd 15126Jun_TatHong_FR15_V.indd 151 26/6/15 16:5626/6/15 16:56
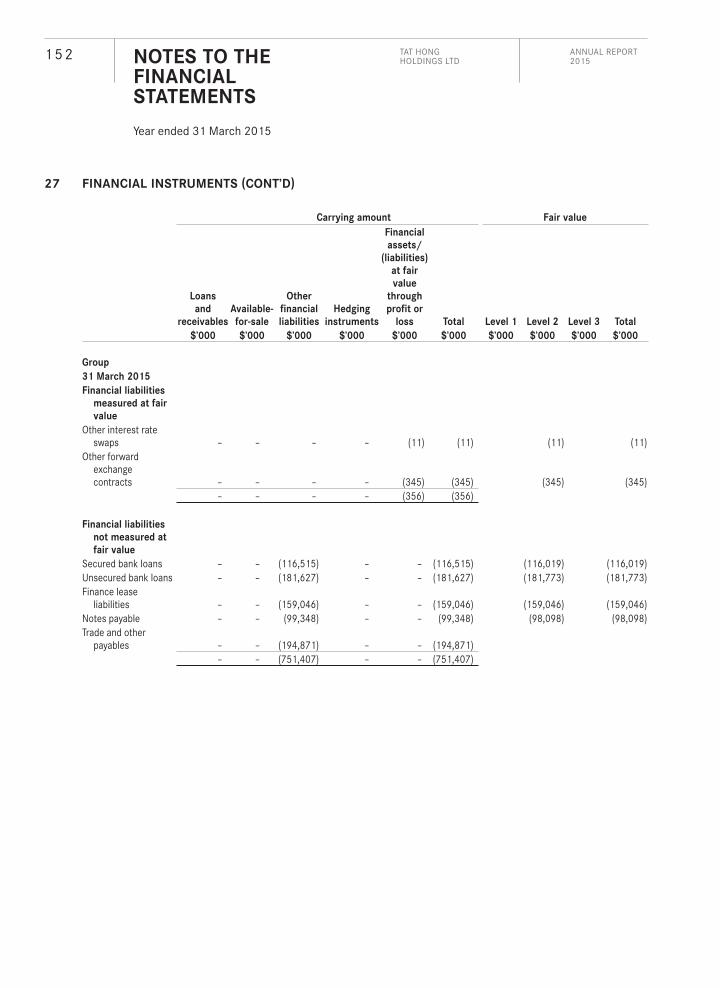
1 5 2 NOTES TO THE FINANCIAL STATEMENTS
Year ended 31 March 2015
ANNUAL REPORT 2015
TAT HONG HOLDINGS LTD
27 FINANCIAL INSTRUMENTS (CONT’D)
Carrying amount Fair value
Loans
and
receivables
Available-
for-sale
Other
fi nancial
liabilities
Hedging
instruments
Financial
assets/
(liabilities)
at fair
value
through
profi t or
loss Total Level 1 Level 2 Level 3 Total
$’000 $’000 $’000 $’000 $’000 $’000 $’000 $’000 $’000 $’000
Group
31 March 2015
Financial liabilities
measured at fair
value
Other interest rate swaps – – – – (11) (11) (11) (11)
Other forward exchange contracts – – – – (345) (345) (345) (345)
– – – – (356) (356)
Financial liabilities
not measured at
fair value
Secured bank loans – – (116,515) – – (116,515) (116,019) (116,019)Unsecured bank loans – – (181,627) – – (181,627) (181,773) (181,773)Finance lease
liabilities – – (159,046) – – (159,046) (159,046) (159,046)Notes payable – – (99,348) – – (99,348) (98,098) (98,098)Trade and other
payables – – (194,871) – – (194,871)– – (751,407) – – (751,407)
26Jun_TatHong_FR15_V.indd 15226Jun_TatHong_FR15_V.indd 152 26/6/15 16:5626/6/15 16:56

1 5 3NOTES TO THE FINANCIAL STATEMENTS
Year ended 31 March 2015
27 FINANCIAL INSTRUMENTS (CONT’D)
Carrying amount Fair value
Loans and
receivables
Available-
for-sale
Other
fi nancial
liabilities
Financial
liabilities at
fair value
through
profi t or
loss Total Level 1 Level 2 Level 3 Total
$’000 $’000 $’000 $’000 $’000 $’000 $’000 $’000 $’000
Group
31 March 2014
Financial assets not
measured at fair
value
Cash and cash equivalents 58,603 – – – 58,603
Trade and other receivables 212,273 – – – 212,273
Available-for-sale equity securities – 518 – 518
270,876 518 – – 271,394
Financial liabilities
measured at fair
value
Interest rate swaps used for hedging – – – (190) (190) (190) (190)
Forward exchange contracts used for hedging – – – (876) (876) (876) (876)
– – – (1,066) (1,066)
Financial liabilities
not measured at
fair value
Secured bank loans – – (114 ,575) – (114,575) (109,044) (109,044)Unsecured bank loans – – (164,930) – (164,930) (156,968) (156,968)Finance lease
liabilities – – (192,186) – (192,186) (192,186) (192,186)Bank overdrafts – – (7,412) – (7,412) (7,412) (7,412)Notes payable – – (99,170) – (99,170) (99,170) (99,170)Trade and other
payables – – (224,327) – (224,327)(802,600) – (802,600)
26Jun_TatHong_FR15_V.indd 15326Jun_TatHong_FR15_V.indd 153 26/6/15 16:5626/6/15 16:56

1 5 4 NOTES TO THE FINANCIAL STATEMENTS
Year ended 31 March 2015
ANNUAL REPORT 2015
TAT HONG HOLDINGS LTD
27 FINANCIAL INSTRUMENTS (CONT’D)
Carrying amount Fair value
Loans and
receivables
Available-
for-sale
Other
fi nancial
liabilities
Hedging
instruments
Financial
liabilities
at fair
value
through
profi t or
loss Total Level 1 Level 2 Level 3 Total
$’000 $’000 $’000 $’000 $’000 $’000 $’000 $’000 $’000 $’000
Company
31 March 2015
Financial assets
measured at
fair value
Interest rate swaps used for hedging – – – 383 – 383 383 383
Available-for-sale equity securities – 714 – – – 714 714 714
– 714 – 383 – 1,097
Financial assets
not measured
at fair value
Cash and cash equivalents 891 – – – – 891
Trade and other receivables 169,024 – – – – 169,024
169,915 – – – – 169,915
Financial
liabilities
measured at
fair value
Other interest rate swaps – – – – (10) (10) (10) (10)
Financial
liabilities not
measured at
fair value
Unsecured bank loans – – (100,460) – – (100,460) (100,460) (100,460)
Intra-group fi nancial guarantees – – (7,084) – – (7,084) (7,084) (7,084)
Notes payable – – (99,348) – – (99,348) (98,098) (98,098)Trade and other
payables – – (3,427) – – (3,427)– – (210,319) – – (210,319)
26Jun_TatHong_FR15_V.indd 15426Jun_TatHong_FR15_V.indd 154 26/6/15 16:5626/6/15 16:56

1 5 5NOTES TO THE FINANCIAL STATEMENTS
Year ended 31 March 2015
27 FINANCIAL INSTRUMENTS (CONT’D)
Carrying amount Fair value
Loans and
receivables
Available-
for-sale
Other
fi nancial
liabilities
Financial
liabilities
at fair
value
through
profi t or
loss Total Level 1 Level 2 Level 3 Total
$’000 $’000 $’000 $’000 $’000 $’000 $’000 $’000 $’000
Company
31 March 2014
Financial assets not
measured at fair value
Cash and cash equivalents 178 – – – 178Trade and other receivables 90,022 – – – 90,022Available-for-sale equity
securities – 434 – – 43490,200 434 – – 90,634
Financial liabilities
measured at fair value
Interest rate swaps used for hedging – – – (162) (162) (162) (162)
Financial liabilities not
measured at fair value
Unsecured bank loans – – (18,000) – (18,000) (18,000) (18,000)Intra-group fi nancial
guarantees – – (5,475) – (5,475) (5,475) (5,475)Notes payable – – (99,170) – (99,170) (99,170) (99,170)Trade and other payables – – (3,312) – (3,312)
– – (125,957) – (125,957)
26Jun_TatHong_FR15_V.indd 15526Jun_TatHong_FR15_V.indd 155 26/6/15 16:5626/6/15 16:56

1 5 6 NOTES TO THE FINANCIAL STATEMENTS
Year ended 31 March 2015
ANNUAL REPORT 2015
TAT HONG HOLDINGS LTD
27 FINANCIAL INSTRUMENTS (CONT’D)
Measurement of fair values
Valuation techniques and signifi cant unobservable inputs
The following tables show the valuation techniques used in measuring fair values, as well as the signifi cant unobservable inputs used.
Financial instruments measured at fair value
Type Valuation technique
Signifi cant
unobservable
inputs
Inter-relationship between key
unobservable inputs and fair value
measurement
Foreign exchange contracts and interest rate swaps
Market comparison technique: The fair values are based on broker quotes. Similar contracts are traded in an active market and the quotes refl ect the actual transactions in similar instruments.
Not applicable Not applicable
Available-for-sale equity securities
Valuation provided by fund managers based on non-observable data.
Not applicable Not applicable
Financial instruments not measured at fair value
Type Valuation technique Signifi cant unobservable inputs
Financial liabilities* Discounted cash fl ows. Not applicable.
* Financial liabilities include secured and unsecured bank loans and fi nance lease liabilities.
The carrying amounts of fi nancial assets and liabilities with a maturity of less than one year (including trade and other receivables, cash and cash equivalents, and trade and other payables) are assumed to approximate their fair values because of the short period to maturity.
26Jun_TatHong_FR15_V.indd 15626Jun_TatHong_FR15_V.indd 156 26/6/15 16:5626/6/15 16:56

1 5 7NOTES TO THE FINANCIAL STATEMENTS
Year ended 31 March 2015
28 OPERATING SEGMENTS
(a) Business segments
The Group has four reportable segments as described below, which are the Group’s strategic business units. The strategic business units offer different products and services, and are managed separately because they are located in different geographical areas and require different marketing strategies. For each of the strategic business unit, the Group’s chief operating decision maker reviews internal management reports on at least a quarterly basis. The following summary describes the operations in each of the Group’s reportable segments:
Crane rental: The rental income of cranes.
Tower crane rental: The rental income of tower cranes.
General equipment rental: The rental income of other construction equipment.
Distribution: The sale of cranes and other construction equipment, spare parts, and provision of other ancillary services.
Information regarding the results of each reportable segment is included below. Performance is measured based on segment profi t as included in the internal management reports that are reviewed by the Group’s chief operating decision maker. Segment profi t is used to measure performance as the Management believe that such information is the most relevant in evaluating the results of certain segments relative to other entities that operate within these industries.
Information about reportable segments
Crane
rental
Tower
crane rental
General
equipment
rental Distribution Total
$’000 $’000 $’000 $’000 $’000
2015
Revenue and expenses
Total revenue from external customers 237,623 96,645 55,922 218,407 608,597
Inter-segment revenue 22,430 11,521 – 56,969 90,920Total revenue 260,053 108,166 55,922 275,376 699,517
Results
Interest income 320 80 40 54 494Depreciation expense (49,821) (19,391) (16,963) (3,285) (89,460)Amortisation expense (158) (57) (80) (73) (368)Reportable segment profi t/(loss) 45,520 22,130 (19,061) 4,396 52,985Finance expense (10,185) (4,528) (2,615) (1,860) (19,188)Share of results of associates
(net of tax) 1,465 – – 3,159 4,624Share of results of joint ventures
(net of tax) 17 – – (231) (214)
26Jun_TatHong_FR15_V.indd 15726Jun_TatHong_FR15_V.indd 157 26/6/15 16:5626/6/15 16:56

1 5 8 NOTES TO THE FINANCIAL STATEMENTS
Year ended 31 March 2015
ANNUAL REPORT 2015
TAT HONG HOLDINGS LTD
28 OPERATING SEGMENTS (CONT’D)
(a) Business segments (Cont’d)
Cranerental
Tower crane rental
General equipment
rental Distribution Total
$’000 $’000 $’000 $’000 $’000
2015
Other material non-cash items:
– Allowance made for receivables (2,991) (447) (88) (2,671) (6,197)– Allowance made for inventories – – – (4,728) (4,728)– Impairment loss on property, plant
and equipment (8,385) – – – (8,385)– Impairment loss on intangible
assets (22,447) – – – (22,447)– Gain/(Loss) on disposal of property,
plant and equipment 15,989 (233) 2,995 2,784 21,535– Gain on disposal of an associate – – – 151 151– Gain on disposal of subsidiaries 4,810 – – 13 4,823– Inventories written off – – – – –
Other segment information
Reportable segment assets 677,765 362,277 74,819 304,684 1,419,545
Investment in associates 21,187 – – 37,678 58,865Investment in joint ventures 2,184 – – 2,380 4,564
23,371 – – 40,058 63,429
Capital expenditure 45,829 36,243 13,369 7,524 102,965
Reportable segment liabilities 38,274 31,534 4,924 131,497 206,229
2014
Revenue and expenses
Total revenue from external customers 259,775 89,771 67,549 266,992 684,087Inter-segment revenue 29,274 10,727 – 84,530 124,531Total revenue 289,049 100,498 67,549 351,522 808,618
Results
Interest income 473 70 66 141 750 Depreciation expense (48,063) (17,029) (17,768) (3,536) (86,396)Amortisation expense (215) (51) (142) (104) (512)Reportable segment profi t 61,475 10,611 2,514 7,569 82,169Finance expense (11,617) (4,508) (2,908) (2,014) (21,047)Share of results of associates
(net of tax) 1,588 – – 3,197 4,785Share of results of joint ventures
(net of tax) 570 – – 75 645
26Jun_TatHong_FR15_V.indd 15826Jun_TatHong_FR15_V.indd 158 26/6/15 16:5626/6/15 16:56

1 5 9NOTES TO THE FINANCIAL STATEMENTS
Year ended 31 March 2015
28 OPERATING SEGMENTS (CONT’D)
(a) Business segments (Cont’d)
Crane
rental
Tower
crane
rental
General
equipment
rental Distribution Total
$’000 $’000 $’000 $’000 $’000
2014
Other material non-cash items:
– Allowance (made)/reversed for receivables 1,070 – (125) (125) 820
– Allowance written back for inventories – – – 266 266
– Impairment loss on investment in associates – – – (3,400) (3,400)
– Gain on disposal of property, plant and equipment 4,590 – 711 1,158 6,459
– Inventories written off – – – (216) (216)
Other segment information
Reportable segment assets 761,565 318,961 116,371 293,123 1,490,020
Investment in associates 19,919 – – 49,352 69,271Investment in joint ventures 2,037 – – 542 2,579
21,956 – – 49,894 71,850
Capital expenditure 79,831 59,947 11,874 30,897 182,549
Reportable segment liabilities 42,963 30,446 9,408 153,366 236,183
Reconciliations of reportable segment revenues, profi t or loss, assets and liabilities and
other material items2015 2014
$’000 $’000
Revenues
Total revenue for reportable segments 699,517 808,618Elimination of inter-segment revenue (90,920) (124,531)Consolidated revenue 608,597 684,087
Profi t or loss
Total profi t or loss for reportable segment 52,985 82,169Elimination of inter-segment profi ts (6,454) (5,457)Unallocated amounts:– Other corporate expenses (32,584) (33,194)Share of results of associates (net of tax) 4,624 4,785Share of results of joint ventures (net of tax) (214) 645Consolidated profi t before income tax 18,357 48,948
26Jun_TatHong_FR15_V.indd 15926Jun_TatHong_FR15_V.indd 159 26/6/15 16:5626/6/15 16:56
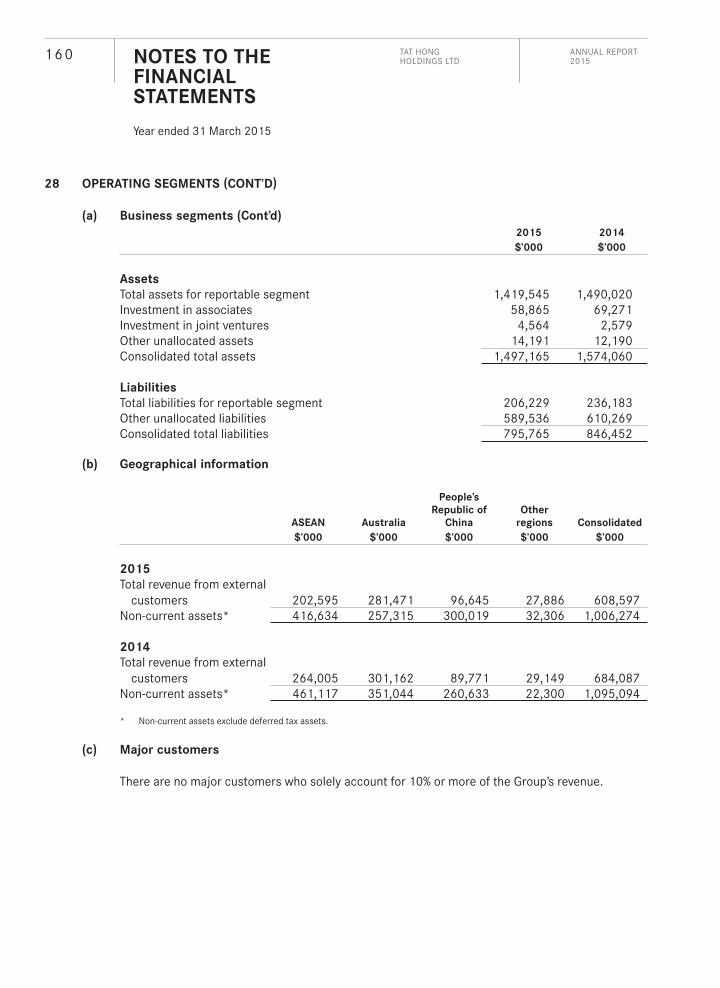
1 6 0 NOTES TO THE FINANCIAL STATEMENTS
Year ended 31 March 2015
ANNUAL REPORT 2015
TAT HONG HOLDINGS LTD
28 OPERATING SEGMENTS (CONT’D)
(a) Business segments (Cont’d)
2015 2014
$’000 $’000
Assets
Total assets for reportable segment 1,419,545 1,490,020Investment in associates 58,865 69,271Investment in joint ventures 4,564 2,579Other unallocated assets 14,191 12,190Consolidated total assets 1,497,165 1,574,060
Liabilities
Total liabilities for reportable segment 206,229 236,183Other unallocated liabilities 589,536 610,269Consolidated total liabilities 795,765 846,452
(b) Geographical information
ASEAN Australia
People’s
Republic of
China
Other
regions Consolidated
$’000 $’000 $’000 $’000 $’000
2015
Total revenue from external customers 202,595 281,471 96,645 27,886 608,597
Non-current assets* 416,634 257,315 300,019 32,306 1,006,274
2014
Total revenue from external customers 264,005 301,162 89,771 29,149 684,087
Non-current assets* 461,117 351,044 260,633 22,300 1,095,094
* Non-current assets exclude deferred tax assets.
(c) Major customers
There are no major customers who solely account for 10% or more of the Group’s revenue.
26Jun_TatHong_FR15_V.indd 16026Jun_TatHong_FR15_V.indd 160 26/6/15 16:5626/6/15 16:56

1 6 1NOTES TO THE FINANCIAL STATEMENTS
Year ended 31 March 2015
29 COMMITMENTS – GROUP
Operating lease commitments
Leases as lessee
Non-cancellable operating lease rentals are payable as follows:
2015 2014
$’000 $’000
Within 1 year 15,434 11,992Between 1 and 5 years 29,809 14,748More than 5 years 37,117 13,253
82,360 39,993
The Group leases motor vehicles and a number of premises for production, warehouse and offi ce purposes under operating leases. The leases typically run for an initial period of two to thirty-nine years, with options to renew the leases after that date. Lease payments are subject to increases annually to refl ect market rentals. None of the leases includes contingent rentals.
Leases as lessor
The Group leases out its plant and machinery (refer to note 4). The future minimum lease payments under non-cancellable lease are as follows:
2015 2014
$’000 $’000
Within 1 year 57,681 41,177Between 1 and 5 years 3,702 2,989More than 5 years 3,185 2,998
64,568 47,164
Capital commitments
Authorised cost not contracted for – 3,344Contracted for but not provided for 8,664 1,566
26Jun_TatHong_FR15_V.indd 16126Jun_TatHong_FR15_V.indd 161 26/6/15 16:5626/6/15 16:56

1 6 2 NOTES TO THE FINANCIAL STATEMENTS
Year ended 31 March 2015
ANNUAL REPORT 2015
TAT HONG HOLDINGS LTD
30 NON-CONTROLLING INTERESTS
The following summarises the fi nancial information of each of the Group’s subsidiaries with non-controlling interests (NCI).
Name of subsidiaries
Principal places of business/
Country of incorporation
Effective equity
interest held by
non-controlling interests
2015 2014
% %
Tat Hong Flo-Line Pte Ltd Singapore – 40
Load Controls Systems Pte Ltd Singapore 30 30
Peng Koon Heavy Machinery Pte Ltd Singapore 30 30
Tat Hong Offshore and Marine Services Pte Ltd Singapore 50 50
Leadpoint Pte Ltd Singapore 30 30
PT Tatindo HeavyEquipment Indonesia 5 5
Tat Hong (V.N.) Pte Ltd and its subsidiary:
Singapore 30 30
Tat Hong Vietnam Co., Ltd Vietnam 30 30
Tat Hong Equipment (China) Pte. Ltd. and its subsidiaries:
Singapore 12 –
Tat Hong Equipment Service Co., Ltd. Cayman Islands 12 –
Shanghai Tat Hong Equipment Rental Co., Ltd. People’s Republic of China 13 10
Tat Hong Zhaomao Investment Co., Ltd
People’s Republic of China 12 25
China Nuclear Huaxing Tat Hong Machinery Construction Co., Ltd
People’s Republic of China 27 29
26Jun_TatHong_FR15_V.indd 16226Jun_TatHong_FR15_V.indd 162 26/6/15 16:5626/6/15 16:56

1 6 3NOTES TO THE FINANCIAL STATEMENTS
Year ended 31 March 2015
30 NON-CONTROLLING INTERESTS (CONT’D)
Name of subsidiaries
Principal places of business/
Country of incorporation
Effective equity
interest held by
non-controlling interests
2015 2014
% %
Jiangsu Zhongjian Tat Hong Machinery Construction Co., Ltd
People’s Republic of China 12 7
Beijing Tat Hong Zhaomao Equipment Rental Co. Ltd
People’s Republic of China 12 38
Si Chuan Tat Hong Yuanzheng Machinery Construction Co., Ltd.
People’s Republic of China 38 47
Jiangsu Hengxingmao Financial Leasing Co., Ltd.
People’s Republic of China 12 25
Tat Hong Zhiyuan (Jiangsu) Equipment Rental Co. Ltd
People’s Republic of China 12 22
Changzhou Tat Hong Zhaomao Machinery Construction Co., Ltd
People’s Republic of China 12 22
Hup Hin Transport Co Pte Ltd and its subsidiaries:
Singapore – 30
Chip Eng Engineering Works Pte Ltd Singapore – 30
Hup Hin Transport (M) Sdn Bhd Malaysia – 58
26Jun_TatHong_FR15_V.indd 16326Jun_TatHong_FR15_V.indd 163 26/6/15 16:5626/6/15 16:56

1 6 4 NOTES TO THE FINANCIAL STATEMENTS
Year ended 31 March 2015
ANNUAL REPORT 2015
TAT HONG HOLDINGS LTD
30 NON-CONTROLLING INTERESTS (CONT’D)
The following summarises the fi nancial information of each of the Group’s subsidiaries with material NCI, based on their respective fi nancial statements prepared in accordance with FRS, modifi ed for fair value adjustments on acquisition and differences in the Group’s accounting policies.
Hup Hin
Transport
Co Pte Ltd
and its
subsidiaries
Tat Hong
Offshore
and Marine
Services Pte
Ltd
Tat Hong
Equipment
China and its
subsidiaries
Other
individually
immaterial
subsidiaries Total
$’000 $’000 $’000 $’000 $’000
2015
Revenue 11,008 13,779 96,645 19,489Profi t 1,415 (605) 11,820 (1,697)Other comprehensive income – – 13,774 952Total comprehensive income 1,415 (605) 25,594 (745)Attributable to non-controlling
interests:– Profi t 459 (302) 1,953 (178) 1,932– Other comprehensive income – – 114 17 131– Total comprehensive income 459 (302) 2,067 (161) 2,063
Non-current assets – 47,931 271,915 23,076Current assets – 3,924 108,347 28,864Non-current liabilities – (10,806) (72,939) (1,767)Current liabilities – (14,694) (120,421) (36,127)Net assets – 26,355 186,902 14,046Net assets attributable to non-
controlling interests – 13,178 31,984 5,409 50,571
Cash fl ows from operating activities – 5,552 46,902 3,507Cash fl ows from investing activities – (3,979) (55,390) (2,887)Cash fl ows from fi nancing activities – (594) 24,492 (484)Net increase in cash and cash
equivalents – 979 16,004 136
26Jun_TatHong_FR15_V.indd 16426Jun_TatHong_FR15_V.indd 164 26/6/15 16:5626/6/15 16:56
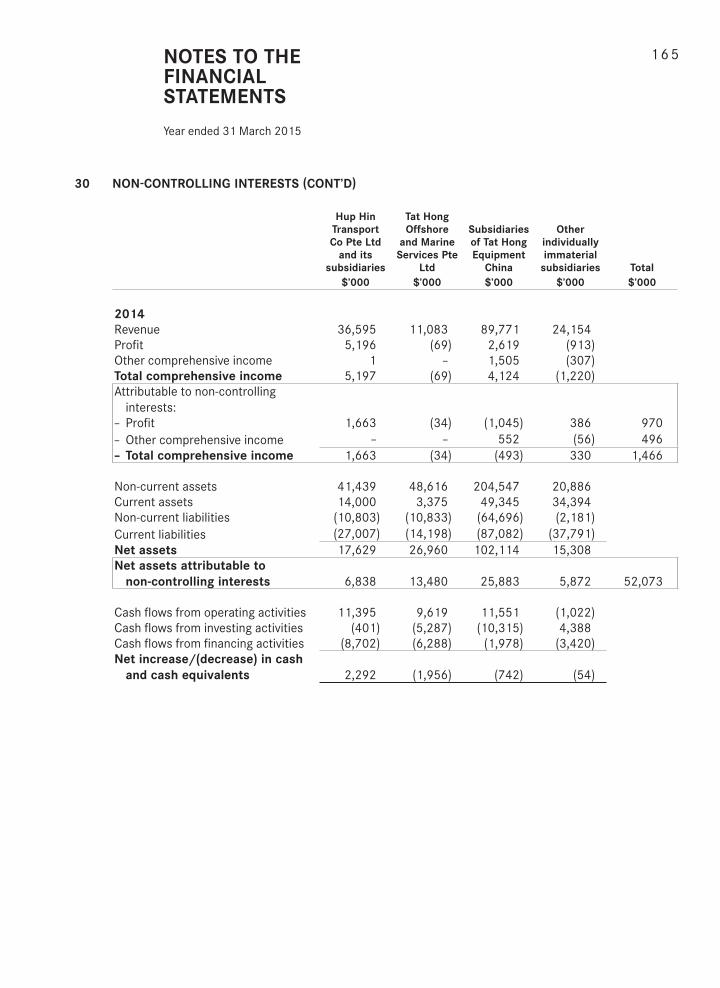
1 6 5NOTES TO THE FINANCIAL STATEMENTS
Year ended 31 March 2015
30 NON-CONTROLLING INTERESTS (CONT’D)
Hup Hin
Transport
Co Pte Ltd
and its
subsidiaries
Tat Hong
Offshore
and Marine
Services Pte
Ltd
Subsidiaries
of Tat Hong
Equipment
China
Other
individually
immaterial
subsidiaries Total
$’000 $’000 $’000 $’000 $’000
2014
Revenue 36,595 11,083 89,771 24,154Profi t 5,196 (69) 2,619 (913)Other comprehensive income 1 – 1,505 (307)Total comprehensive income 5,197 (69) 4,124 (1,220)Attributable to non-controlling
interests:– Profi t 1,663 (34) (1,045) 386 970– Other comprehensive income – – 552 (56) 496– Total comprehensive income 1,663 (34) (493) 330 1,466
Non-current assets 41,439 48,616 204,547 20,886Current assets 14,000 3,375 49,345 34,394Non-current liabilities (10,803) (10,833) (64,696) (2,181)Current liabilities (27,007) (14,198) (87,082) (37,791)Net assets 17,629 26,960 102,114 15,308Net assets attributable to
non-controlling interests 6,838 13,480 25,883 5,872 52,073
Cash fl ows from operating activities 11,395 9,619 11,551 (1,022)Cash fl ows from investing activities (401) (5,287) (10,315) 4,388Cash fl ows from fi nancing activities (8,702) (6,288) (1,978) (3,420)Net increase/(decrease) in cash
and cash equivalents 2,292 (1,956) (742) (54)
26Jun_TatHong_FR15_V.indd 16526Jun_TatHong_FR15_V.indd 165 26/6/15 16:5626/6/15 16:56

1 6 6 NOTES TO THE FINANCIAL STATEMENTS
Year ended 31 March 2015
ANNUAL REPORT 2015
TAT HONG HOLDINGS LTD
31 SIGNIFICANT RELATED PARTY TRANSACTIONS – GROUP
For the purposes of these fi nancial statements, parties are considered to be related to the Group if the Group has the ability, directly or indirectly, to control the party or exercise signifi cant infl uence over the party in making fi nancial and operating decisions, or vice versa, or where the Group and the party are subject to common control. Related parties may be individuals or other entities.
In addition to the related party information disclosed elsewhere in the fi nancial statements, there were signifi cant related party transactions which were carried out in the normal course of business on terms agreed between the parties during the fi nancial year as follows:
2015 2014
$’000 $’000
Transactions with companies in which certain directors
of the Company have substantial fi nancial interests
Rental income receivable 1,781 2,161Sales 2,481 1,829Purchases 9,571 1,221Hiring charges payable – 80
Transactions with immediate and ultimate holding company
Rental income receivable 141 87Purchases 298 –
Transactions with associates of the Group
Rental income receivable 987 844Sales 60 24Purchases 30,428 643Hiring charges payable 11 170
Transactions with joint ventures of the Group
Rental income receivable 1,838 2,396Sales 5,799 36Purchases 30 3,280Other income 248 13,949
Transactions with related parties
Rental income receivable 8,754 9,150Rental expense payable 337 –
26Jun_TatHong_FR15_V.indd 16626Jun_TatHong_FR15_V.indd 166 26/6/15 16:5626/6/15 16:56

1 6 7NOTES TO THE FINANCIAL STATEMENTS
Year ended 31 March 2015
32 SUBSEQUENT EVENT
Subsequent to the balance sheet date, the Group entered into an agreement to dispose a leasehold property with a carrying value of $11,760,000 as at 31 March 2015 for a cash consideration of $25,000,000. The completion of the disposal is subject to regulatory approval.
33 COMPARATIVE INFORMATION
During the current year, the classifi cation of certain operating expenses in the income statement has been modifi ed to refl ect more appropriately the nature of the operating expenses and the manner in which economic benefi ts are derived in the Group. The changes in the classifi cation are as follows:
As previously
stated Reclassifi cation Restated
2014 2014 2014
Group $’000 $’000 $’000
Consolidated income statement
Distribution expenses (29,830) (13,050) (42,880)Administrative expenses (54,541) (95,311) (149,852)Other operating expenses (120,388) 108,361 (12,027)
Since the amounts are reclassifi cations within operating activities in the income statement, these reclassifi cations did not have any effect on the statements of fi nancial position and statement of cash fl ows.
26Jun_TatHong_FR15_V.indd 16726Jun_TatHong_FR15_V.indd 167 26/6/15 16:5626/6/15 16:56
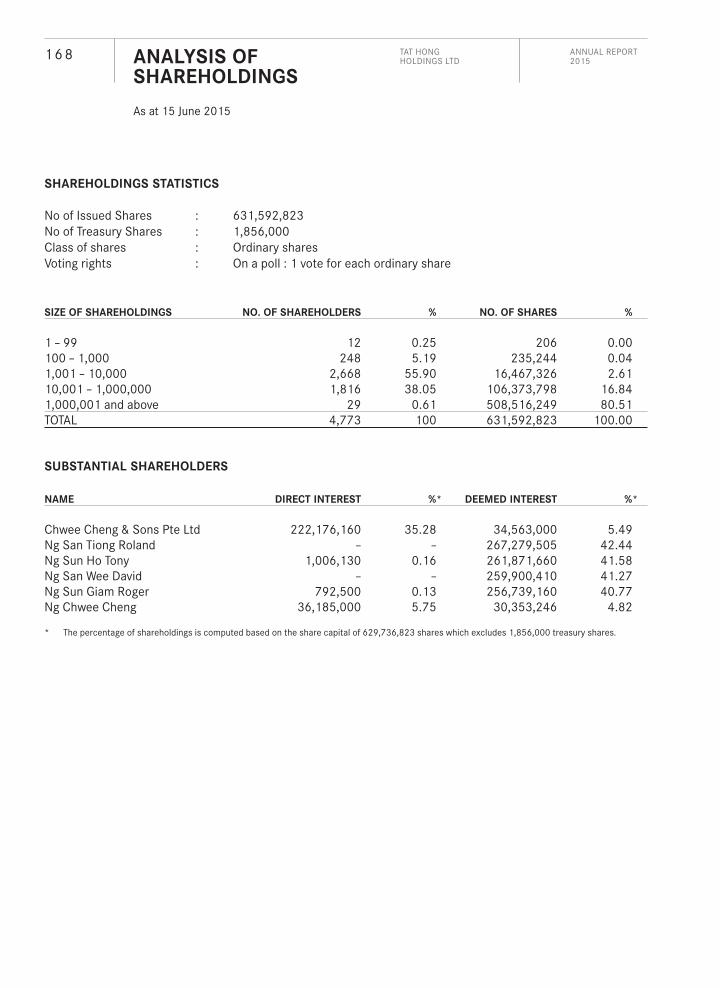
ANNUAL REPORT 2015
TAT HONG HOLDINGS LTD1 6 8 ANALYSIS OF
SHAREHOLDINGS
As at 15 June 2015
SHAREHOLDINGS STATISTICS
No of Issued Shares : 631,592,823No of Treasury Shares : 1,856,000Class of shares : Ordinary sharesVoting rights : On a poll : 1 vote for each ordinary share
SIZE OF SHAREHOLDINGS NO. OF SHAREHOLDERS % NO. OF SHARES %
1 – 99 12 0.25 206 0.00100 – 1,000 248 5.19 235,244 0.041,001 – 10,000 2,668 55.90 16,467,326 2.6110,001 – 1,000,000 1,816 38.05 106,373,798 16.841,000,001 and above 29 0.61 508,516,249 80.51TOTAL 4,773 100 631,592,823 100.00
SUBSTANTIAL SHAREHOLDERS
NAME DIRECT INTEREST %* DEEMED INTEREST %*
Chwee Cheng & Sons Pte Ltd 222,176,160 35.28 34,563,000 5.49Ng San Tiong Roland – – 267,279,505 42.44Ng Sun Ho Tony 1,006,130 0.16 261,871,660 41.58Ng San Wee David – – 259,900,410 41.27Ng Sun Giam Roger 792,500 0.13 256,739,160 40.77Ng Chwee Cheng 36,185,000 5.75 30,353,246 4.82
* The percentage of shareholdings is computed based on the share capital of 629,736,823 shares which excludes 1,856,000 treasury shares.
26Jun_TatHong_FR15_V.indd 16826Jun_TatHong_FR15_V.indd 168 26/6/15 16:5626/6/15 16:56

1 6 9ANALYSIS OF SHAREHOLDINGS
As at 15 June 2015
SHAREHOLDINGS HELD IN HANDS OF PUBLIC
Based on information available to the Company as at 15 June 2015, approximately 42.0% of the Company’s shares listed on the Singapore Exchange Securities Trading Limited were held by the public and the Company has complied with Rule 723 of the Listing Manual.
TOP 20 SHAREHOLDERS
S/NO. NAME OF SHAREHOLDER NO. OF SHARES %*
1 Chwee Cheng & Sons Pte Ltd 222,176,160 35.272 HSBC (Singapore) Nominees Pte Ltd 58,158,000 9.233 Citibank Nominees Singapore Pte Ltd 50,943,921 8.094 Ng Chwee Cheng 36,185,000 5.745 Raffl es Nominees (Pte) Ltd 35,279,061 5.606 Phillip Securities Pte Ltd 15,500,478 2.467 DBS Nominees Pte Ltd 12,339,900 1.968 CIMB Securities (S) Pte Ltd 12,078,180 1.929 Maybank Kim Eng Securities Pte Ltd 11,501,700 1.8310 United Overseas Bank Nominees Pte Ltd 5,356,600 0.8511 OCBC Securities Private Ltd 5,058,029 0.8012 Bank of Singapore Nominees Pte Ltd 4,667,000 0.7413 UOB Kay Hian Pte Ltd 4,540,200 0.7214 Ng Sang Kuey 3,565,350 0.5715 DBSN Services Pte Ltd 3,502,123 0.5616 Ong Tiew Siam 2,799,500 0.4417 Ng Sun Eng 2,778,328 0.4418 DBS Vickers Securities (S) Pte Ltd 2,772,000 0.4419 Starich Investments Pte Ltd 2,557,000 0.4120 Ng Sun Hoe 2,332,065 0.37
TOTAL 494,090,595 78.44
* The percentage of shareholdings is computed based on the share capital of 629,736,823 shares which excludes 1,856,000 treasury shares
26Jun_TatHong_FR15_V.indd 16926Jun_TatHong_FR15_V.indd 169 26/6/15 16:5626/6/15 16:56

ANNUAL REPORT 2015
TAT HONG HOLDINGS LTD1 7 0 NOTICE OF
ANNUAL GENERAL MEETING
NOTICE IS HEREBY GIVEN that the Annual General Meeting of Tat Hong Holdings Ltd (the “Company”) will be held at 10 Eunos Road 8, Singapore Post Centre, Level 5 Theatrette, Singapore 408600 on 29 July 2015 at 10.00 a.m. for the following purposes:
AS ORDINARY BUSINESS
1. To receive and adopt the Directors’ Report and the Audited Accounts of the Company and the Group for the year ended 31 March 2015 together with the Auditors’ Report thereon. (Resolution 1)
2. To declare a fi nal dividend of 1.0 Singapore Cent per share for the year ended 31 March 2015 (previous year: 1.0 Singapore Cent per share). (Resolution 2)
3. To re-elect the following Directors of the Company retiring pursuant to Article 113 of the Articles of Association of the Company:Mr Low Seow Juan (Resolution 3)
Mr Ong Tiew Siam (Resolution 4)
Mr Ng Sun Ho Tony (Resolution 5)
[See Explanatory Note (i)]
4. To approve the payment of Directors’ fees of S$470,000 for the year ended 31 March 2015 (previous year: S$470,000).[See Explanatory Note (ii)] (Resolution 6)
5. To re-appoint Messrs KPMG LLP as the Auditors of the Company and to authorise the Directors of the Company to fi x their remuneration. (Resolution 7)
6. To transact any other ordinary business which may properly be transacted at an Annual General Meeting.
AS SPECIAL BUSINESS
To consider and if thought fi t, to pass the following resolutions as Ordinary Resolutions, with or without any modifi cations:
7. Authority to issue shares in the capital of the Company (excluding treasury shares) pursuant
to Section 161 of the Companies Act, Chapter 50 and Rule 806 of the Listing Manual of the
Singapore Exchange Securities Trading Limited (the “SGX-ST”)
That pursuant to Section 161 of the Companies Act, Chapter 50 of Singapore and Rule 806 of the Listing Manual of the SGX-ST, the Directors of the Company be authorised and empowered to:
(a) (i) issue shares in the Company (“Shares”) whether by way of rights, bonus or otherwise; and/or;
(ii) make or grant offers, agreements or options (collectively, “Instruments”) that might or would require shares to be issued, including but not limited to the creation and issue of (as well as adjustments to) options, warrants, debentures or other instruments convertible into Shares,
29Jun_TatHong_FR15_V2.indd 17029Jun_TatHong_FR15_V2.indd 170 29/6/15 16:3729/6/15 16:37

1 7 1
at any time and upon such terms and conditions and for such purposes and to such persons as the Directors of the Company may in their absolute discretion deem fi t; and
(b) (notwithstanding the authority conferred by this Resolution may have ceased to be in force) issue shares in pursuance of any Instrument made or granted by the Directors of the Company while this Resolution was in force,
(the “Share Issue Mandate”)
provided that:
(1) the aggregate number of shares (including shares to be issued in pursuance of the Instruments, made or granted pursuant to this Resolution) and Instruments to be issued pursuant to this Resolution shall not exceed fi fty per centum (50%) of the total number of issued shares (excluding treasury shares) in the capital of the Company (as calculated in accordance with sub-paragraph (2) below), of which the aggregate number of shares and Instruments to be issued other than on a pro rata basis to existing shareholders of the Company shall not exceed twenty per centum (20%) of the total number of issued shares (excluding treasury shares) in the capital of the Company (as calculated in accordance with sub-paragraph (2) below);
(2) (subject to such calculation as may be prescribed by the SGX-ST) for the purpose of determining the aggregate number of shares and Instruments that may be issued under the sub-paragraphs above, the total number of issued shares (excluding treasury shares) shall be based on the total number of issued shares (excluding treasury shares) in the capital of the Company at the time of the passing of this Resolution, after adjusting for:
(a) new shares arising from the conversion or exercise of the Instruments or any convertible securities;
(b) new shares arising from exercising share options or vesting of share awards outstanding and subsisting at the time of the passing of this Resolution; and
(c) any subsequent consolidation or subdivision of shares;
(3) in exercising the Share Issue Mandate conferred by this Resolution, the Company shall comply with the provisions of the Listing Manual of the SGX-ST for the time being in force (unless such compliance has been waived by the SGX-ST) and the Articles of Association of the Company; and
(4) unless revoked or varied by the Company in a general meeting, the Share Issue Mandate shall continue in force (i) until the conclusion of the next Annual General Meeting of the Company or the date by which the next Annual General Meeting of the Company is required by law to be held, whichever is earlier or (ii) in the case of shares to be issued in pursuance of the Instruments, made or granted pursuant to this Resolution, until the issuance of such shares in accordance with the terms of the Instruments.[See Explanatory Note (iii)] (Resolution 8)
NOTICE OF ANNUAL GENERAL MEETING
26Jun_TatHong_FR15_V.indd 17126Jun_TatHong_FR15_V.indd 171 26/6/15 16:5626/6/15 16:56
ANNUAL REPORT 2015
TAT HONG HOLDINGS LTD1 7 2
8. Authority to issue shares under the Tat Hong Share Option Scheme 2006
That pursuant to Section 161 of the Companies Act, Chapter 50, the Directors of the Company be authorised and empowered to offer and grant options under the Tat Hong Share Option Scheme 2006 (the “Scheme 2006”) and to issue from time to time such number of shares in the capital of the Company as may be required to be issued pursuant to the exercise of options granted by the Company under the Scheme 2006, whether granted during the subsistence of this authority or otherwise, provided always that the total aggregate number of additional ordinary shares to be issued pursuant to the Scheme 2006 and the Share Plan shall not exceed fi fteen per centum (15%) of the total number of issued shares (excluding treasury shares) in the capital of the Company from time to time and that such authority shall, unless revoked or varied by the Company in a general meeting, continue in force until the conclusion of the next Annual General Meeting of the Company or the date by which the next Annual General Meeting of the Company is required by law to be held, whichever is earlier.[See Explanatory Note (iv)] (Resolution 9)
9. Authority to issue shares under the Tat Hong Performance Shares Plan
That pursuant to Section 161 of the Companies Act, Chapter 50, the Directors of the Company be authorised and empowered to offer and grant awards under the Tat Hong Performance Shares Plan (the “Share Plan”) and to issue from time to time such number of shares in the capital of the Company as may be required to be issued pursuant to the vesting of awards under the Share Plan, whether granted during the subsistence of this authority or otherwise, provided always that the total aggregate number of additional ordinary shares to be issued pursuant to the Scheme 2006 and the Share Plan shall not exceed fi fteen per centum (15%) of the total number of issued shares (excluding treasury shares) in the capital of the Company from time to time and that such authority shall, unless revoked or varied by the Company in a general meeting, continue in force until the conclusion of the next Annual General Meeting of the Company or the date by which the next Annual General Meeting of the Company is required by law to be held, whichever is earlier. [See Explanatory Note (v)] (Resolution 10)
10. Proposed Renewal of Mandate for Interested Person Transactions
That:
(a) approval be and is hereby given for the Company, its subsidiaries and associated companies that are entities at risk (as that term is used in Chapter 9 of the SGX-ST Listing Manual), or any of them to enter into any of the transactions falling within the categories of Interested Person Transactions particulars of which are set out in the appendix to this Notice of Annual General Meeting to Shareholders dated 10 July 2015 (the “Appendix”), with the Interested Persons as described in the Appendix, provided that such transactions are made on normal commercial terms in accordance with the guidelines and procedures for review and administration of Interested Person Transactions as described in the Appendix (the “IPT Mandate”);
(b) the IPT Mandate shall, unless revoked or varied by the Company in a general meeting, continue to be in force until the conclusion of the next Annual General Meeting of the Company;
NOTICE OF ANNUAL GENERAL MEETING
26Jun_TatHong_FR15_V.indd 17226Jun_TatHong_FR15_V.indd 172 26/6/15 16:5626/6/15 16:56
1 7 3
(c) the Audit Committee of the Company be and is hereby authorised to take such action as it deems proper in respect of procedures and/or to modify or implement such procedures as may be necessary to take into consideration any amendment to Chapter 9 of the SGX-ST Listing Manual which may be prescribed by SGX-ST from time to time; and
(d) the Directors of the Company be and are hereby authorised and empowered to complete and to do all such acts and things, and to approve, modify, ratify and execute such documents, acts and things as they may consider necessary, desirable or expedient to give effect to the IPT Mandate and this Resolution.[See Explanatory Note (vi)] (Resolution 11)
11. Proposed Renewal of Share Buyback Mandate
That:
(a) for the purposes of Section 76C and 76E of the Companies Act, Chapter 50 of Singapore (the “Companies Act”), and such other laws and regulations as may for the time being be applicable, the exercise by the Directors of the Company (“Directors”) to purchase or otherwise acquire issued ordinary shares in the capital of the Company (“Shares”) not exceeding in aggregate the Prescribed Limit (as hereafter defi ned) at such price(s) as may be determined by the Directors in the Company from time to time up to the Maximum Price (as hereafter defi ned), whether by way of:
(i) on-market purchase (“On-Market Share Purchase”), transacted on the Singapore Exchange Securities Trading Limited (“SGX-ST”); and/or
(ii) off-market purchases (“Off-Market Share Purchases”) if effected otherwise than on the SGX-ST in accordance with an equal access scheme(s) as may be determined or formulated by the Directors as they may consider fi t, which scheme(s) shall satisfy all the conditions prescribed by the Companies Act and the SGX-ST Listing Manual,
(the “Share Buyback Mandate”);
(b) any Share that is purchased or otherwise acquired by the Company pursuant to the Share Buyback Mandate shall, at the discretion of the Directors of the Company, either be cancelled or held as treasury shares and dealt with in accordance with the Companies Act;
(c) unless varied or revoked by the Company in a general meeting, the authority conferred on the Directors of the Company pursuant to the Share Buyback Mandate may be exercised by the Directors at any time and from time to time during the period commencing from the passing of this Resolution and the expiring on the earlier of:
(i) the date on which the next Annual General Meeting of the Company is held or required to be held;
(ii) the date on which the share purchases are carried out to the full extent mandated; or
(iii) the date on which the authority contained in the Share Buyback Mandate is varied or revoked;
NOTICE OF ANNUAL GENERAL MEETING
29Jun_TatHong_FR15_V2.indd 17329Jun_TatHong_FR15_V2.indd 173 29/6/15 17:1929/6/15 17:19

ANNUAL REPORT 2015
TAT HONG HOLDINGS LTD1 7 4
(d) in this Ordinary Resolution:
“Prescribed Limit” means 10% of the total number of Shares as at the date of the passing of this Resolution;
“Maximum Price” in relation to a Share to be purchased, means a purchase price (excluding related brokerage, commission, applicable goods and services tax, stamp duties, clearance fees and other related expenses) which shall not exceed:
in the case of a Market Purchase, 105% of the Average Closing Price of the Shares; and
in the case of an Off-Market Purchase, 110% of the Average Closing Price.
For the above purposes:
“Average Closing Price” means the average of the closing market prices of a Share over the last 5 Market Days, on which the transactions in the Shares were recorded, immediately preceding the date of the Market Purchase by the Company or, as the case may be, the date of the making of the offer pursuant to the Off-Market Purchase, and deemed to be adjusted, in accordance with the rules of the SGX-ST, for any corporate action that occurs after the relevant 5-day period;
“date of making of the offer” means the day on which the Company announces its intention to make an offer for the purchases of Shares from Shareholders, stating the purchase price (which shall not be more than the Maximum Prices calculated on the foregoing basis) for each Share and the relevant terms of the equal access scheme effecting the Off-Market Share Purchase; and
(e) the Directors of the Company and/or any of them be and are hereby authorised to complete and do all such acts and things (including without limitation, executing such documents as may be required) as they may consider desirable, expedient or necessary to give effect to the transactions contemplated by this Ordinary Resolution.[See explanatory note (vii)] (Resolution 12)
By Order of the Board
Lional Tseng/Ong Beng HongJoint Company SecretariesSingapore10 July 2015
NOTICE OF ANNUAL GENERAL MEETING
26Jun_TatHong_FR15_V.indd 17426Jun_TatHong_FR15_V.indd 174 26/6/15 16:5626/6/15 16:56

1 7 5
Explanatory Notes:
(i) Mr Low Seow Juan will, upon re-election as a Non-Executive Independent Director of the Company, remain as a member of the Audit Committee, the Nominating Committee and the Remuneration Committee. Mr Low’s personal profi le can be found on page 26 of the Annual Report 2015.
Mr Ong Tiew Siam will, upon re-election as a Non-Executive Independent Director of the Company, remain as a member of the Risk Management Committee and the Share Option/Performance Shares Plan Committee. Mr Ong’s personal profi le can be found on page 27 of the Annual Report 2015.
Mr Ng Sun Ho Tony will, upon re-election, remain as an Executive Director of the Company. Details of Mr Ng Sun Ho Tony’s personal profi le and duties and responsibilities are found on pages 27 and 28 of the Annual Report 2015.
(ii) The Company will disregard any votes cast on this resolution by Non-Executive Directors who are eligible to be paid fees. However, the Company need not disregard a vote if it is cast by a person as proxy for a person who is entitled to vote, in accordance with the directions on the proxy form, or it is cast by the person who is entitled to vote, in accordance with the discretions on the proxy form to vote as the proxy decides provided that the person entitled to vote excludes any Non-Executive Director who is eligible to be paid fees.
Ordinary Resolutions 8 – 12, if passed will take effect from 29 July 2015 until the date of the next Annual General Meeting of the Company, or the date by which the next Annual General Meeting of the Company is required by law to be held or such authority is varied or revoked by the Company in a general meeting, whichever is the earlier.
(iii) Ordinary Resolution 8, if passed, will empower the Directors of the Company to issue shares, make or grant instruments convertible into shares and to issue shares pursuant to such Instruments, up to a number not exceeding, in total, 50% of the total number of issued shares (excluding treasury shares) in the capital of the Company, of which up to 20% may be issued other than on a pro-rata basis to such persons as the Directors of the Company may in their absolute discretion deem fi t.
The calculation of the aggregate number of shares that may be issued shall be based on the total number of issued shares in the capital of the Company (excluding treasury shares) at the time this Ordinary Resolution is passed after adjusting for new shares arising from the conversion or exercise of the Instruments or any convertible securities, the exercise of share options or the vesting of share awards outstanding or subsisting at the time when this Ordinary Resolution is passed and any subsequent consolidation or subdivision of shares.
(iv) Ordinary Resolution 9, if passed, will empower the Directors of the Company to issue shares in the Company pursuant to the exercise of options granted or to be granted under the Scheme 2006 provided always that the total aggregate number of additional ordinary shares to be issued pursuant to the Scheme 2006 and the Share Plan does not exceed in total (for the entire duration of the Scheme 2006) 15% of the total number of issued shares (excluding treasury shares) in the capital of the Company from time to time.
NOTICE OF ANNUAL GENERAL MEETING
29Jun_TatHong_FR15_V2.indd 17529Jun_TatHong_FR15_V2.indd 175 29/6/15 16:4729/6/15 16:47

ANNUAL REPORT 2015
TAT HONG HOLDINGS LTD1 7 6
(v) Ordinary Resolution 10, if passed, will empower the Directors of the Company, to issue shares in the Company pursuant to the vesting of awards under the Share Plan provided always that the total aggregate number of additional ordinary shares to be issued pursuant to the Share Plan and the Scheme 2006 does not exceed in total (for the entire duration of the Share Plan) 15% of the total number of issued shares (excluding treasury shares) in the capital of the Company from time to time.
(vi) Ordinary Resolution 11, if passed, will allow the Company, its subsidiaries and associated companies or any of them to enter into any of the transactions falling within the categories of Interested Persons Transactions as defi ned in Chapter 9 of the SGX-ST Listing Manual. Please refer to the Appendix for details.
(vii) Ordinary Resolution 12, if passed, will authorise the Directors of the Company to acquire up to 10% of the total number of issued ordinary shares in the capital of the Company to be cancelled or held as treasury shares. Please refer to the Appendix for details.
Notes:
1. A member entitled to attend and vote at the Annual General Meeting (the “Meeting”) is entitled to appoint not more than two proxies to attend and vote in his/her stead. A proxy need not be a Member of the Company.
2. If the appointer is a corporation, the instrument of proxy must be executed under seal or the hand of its duly authorised offi cer or attorney.
3. The instrument appointing a proxy must be deposited at the Registered Offi ce of the Company at 82 Ubi Avenue 4 #05-01, Edward Boustead Centre, Singapore 408832 not less than forty-eight (48) hours before the time appointed for holding the Meeting.
Personal Privacy Protection
By submitting an instrument appointing a proxy(ies)/and/or representative(s) to attend, speak or vote at the Annual General Meeting and/or any adjournment thereof, a member of the Company:
(i) consents to the collection, use and disclosure of the member’s personal data by the Company (or its agents or service providers) for the purpose of processing, administration and analysis of proxies and representatives appointed for the Annual General Meeting (including adjournment thereof) and the preparation and compilation of the attendance lists, minute and other documents relating to the Annual General Meeting (including any adjournment thereof), and in order for the Company (or its agents or services providers) to comply with any applicable laws, listing rules, regulations and/or guidelines (collectively, the “Purposes”);
(ii) warrants that where the member discloses the personal data of his proxy(ies) and/or representative(s) to the Company (or its agents or service providers), the member has obtained the prior consent of such proxy(ies) and/or representative(s) for the collection, use and disclosure by the Company (or its agents or service providers) of the personal data of such proxy(ies) and/or representative(s) for the Purposes; and
(iii) agrees that the member shall indemnify the Company in respect of any penalties, liabilities, claims, demands, losses and damages as a result of the member breach of warranty.
NOTICE OF ANNUAL GENERAL MEETING
29Jun_TatHong_FR15_V2.indd 17629Jun_TatHong_FR15_V2.indd 176 29/6/15 16:5029/6/15 16:50

I/We (name) of (address) being a member/members of Tat Hong Holdings Ltd (the “Company”), hereby appoint:
Name Address NRIC/
Passport Number
Proportion of Shareholding
No. of Shares %
and/or (delete as appropriate)
Name Address NRIC/
Passport Number
Proportion of Shareholding
No. of Shares %
or failing him/her, the Chairperson of the Meeting, as my/our proxy/proxies to attend and vote for me/us on my/our behalf at the Annual General Meeting (the “AGM”) of the Company to be held at 10 Eunos 8, Singapore Post Centre, Level 5 Theatrette, Singapore 408600 on 29 July 2015 at 10.00 a.m. and at any adjournment thereof. I/We direct my/our proxy/proxies to vote for or against the resolution to be proposed at the AGM as indicated hereunder. If no specifi c direction as to voting is given or in the event of any other matter arising at the AGM and at any adjournment thereof, the proxy/proxies will vote or abstain from voting at his/her discretion.
(Please indicate your vote “For” or “Against” with a tick [√] within the box provided.)
No. Ordinary Resolution For Against
1. Directors’ Report and Audited Financial Statements for the year ended 31 March 20152. Payment of a proposed fi nal dividend of 1.0 Singapore Cents per Share for the
fi nancial year ended 31 March 20153. Re-election of Mr Low Seow Juan as a Director4. Re-election of Mr Ong Tiew Siam as a Director5. Re-election of Mr Ng Sun Ho Tony as a Director6. Approval of Directors’ fees amounting to S$470,000 for the fi nancial year ended
31 March 20157. Re-appointment of Messrs KPMG LLP as Auditors8. Authority to allot and issue new Shares9. Authority to allot and issue Shares under the Tat Hong Share Option Scheme 200610. Authority to allot and issue Shares under the Tat Hong Performance Shares Plan11. Renewal of Mandate for Interested Person Transactions12. Renewal of Share Buyback Mandate
Dated this day of 2015
Signature(s) of Member(s)or Common Seal of Corporate Member* IMPORTANT: PLEASE READ NOTES OVERLEAF
IMPORTANT
1. For investors who have used their Central Provident Fund (“CPF”) monies to buy shares in the capital of Tat Hong Holdings Ltd, this Circular is forwarded to them at the request of their CPF Approved Nominees and is sent solely FOR INFORMATION ONLY.
2. This Proxy Form is not valid for use by CPF Investors and shall be ineffective for all intents and purposes if used or purported to be used by them.
3. CPF investors who wish to attend the Meeting as an observer must submit their requests through their CPF Approved Nominees within the time frame specifi ed. If they also wish to vote, they must submit their voting instructions to the CPF Approved Nominees within the time frame specifi ed to enable them to vote on their behalf.
TAT HONG HOLDINGS LTD(UEN: 199105392H) (Incorporated in Singapore)
ANNUAL GENERAL MEETINGPROXY FORM(Please see notes overleaf before completing this Form)
Total number of Shares held:
(a) Depository Register(b) Register of Shareholders
26Jun_TatHong_FR15_V.indd 17726Jun_TatHong_FR15_V.indd 177 26/6/15 16:5626/6/15 16:56

Notes:
1. Please insert the total number of Shares held by you. If you have Shares entered against your name in the Depository Register (as define in Section 130A of the Companies Act, Chapter 50), you should insert that number of Shares. If you have Shares registered in your name in the Register of Members, you should insert the number of Shares. If you have Shares registered in your name in the Depository and Shares registered in your name in the Register of Members, you should insert the aggregate number of Shares entered against your name in the Depository Register and registered in your name in the Register of Members. If no number is inserted, the instrument appointing a proxy or proxies shall be deemed to relate to all the Shares held by you.
2. A member entitled to attend and vote at the AGM is entitled to appoint not more than 2 proxies to attend and vote on his/her behalf. A proxy need not be a member of the Company.
3. Where a member appoints more than one proxy, he shall specify the proportion of his shareholding (expressed as a percentage of the whole) to be represented by each proxy. If no such proportion or number is specified the first named proxy may be treated as representing 100% of the shareholding and any second named proxy as an alternate to the first named.
4. The submission of an instrument or form appointing a proxy by a Shareholder of the Company does not preclude him from attending and voting in person at the AGM, if he is able to do so. Any appointment of a proxy or proxies shall be deemed to be revoked if a member attends the AGM in person, and in such event, the Company reserves the right to refuse to admit any person or persons appointed under the instrument of proxy to the AGM.
5. The instrument appointing a proxy or proxies must be deposited at the Company’s registered office at 82 Ubi Avenue 4 #05-01, Edward Boustead Centre, Singapore 408832, not less than 48 hours before the time set for the AGM.
6. The instrument appointing a proxy or proxies must be under the hand of the appointor or of his attorney duly authorised in writing. Where the instrument appointing a proxy or proxies is executed by a corporation, it must be executed either under its common seal or under the hand of its attorney or a duly authorised officer.
7. Where an instrument appointing a proxy is signed on behalf of the appointor by an attorney, the letter or power of attorney or a duly certified copy thereof must (failing previous registration with the Company) be lodged with the instrument of proxy, failing which the instrument may be treated as invalid.
8. A corporation which is a member may authorise by resolution of its directors or other governing body such person as it thinks fit to act as its representative at the meeting, in accordance with Section 179 of the Companies Act, Chapter 50.
9. The Company shall be entitled to reject an instrument of proxy which is incomplete, improperly completed, illegible or where the true intentions of the appointor are not ascertainable from the instructions of the appointor specified on the instrument of proxy. In addition, in the case of Shares entered in the Depository Register, the Company may reject an instrument of proxy if the member, being the appointor, is not shown to have Shares entered against his name in the Depository Register as at 48 hours before the time set for the AGM, as certified by The Central Depository (Pte) Limited to the Company.
10. A Depositor’s name must appear in the Depository Register maintained by the Central Depository (Pte) Limited not less than 48 hours before the time appointed for the holding of the AGM in order for him to be entitled to vote at the AGM.
15_0126 TatHong_FR15_FA02.indd 178 29/6/15 10:56 am

15_0126 Tat Hong AR 2015 FA03.indd 41 29/6/15 10:34 am

UEN: 199105392H
82 Ubi Avenue 4 #05-01Edward Boustead Centre
Singapore 408832
T (65) 6709 0300F (65) 6269 6888
www.tathong.com
15_0126 Tat Hong AR 2015 FA03.indd 42 29/6/15 10:34 am