25 - mit opencourseware
TRANSCRIPT

Harvard Business School
TRANSLATING RESEARCH INTO ACTION
Threats and AnalysisThreats and Analysis
Shawn Cole
povertyactionlab.org1
Harvard Business School

Course Overview
• What is Evaluation?
Course Overview
What is Evaluation?
• Measuring Impacts
h d ?• Why Randomise?
• How to Randomise
• Sampling and Sample Size
• Threats and AnalysisThreats and Analysis
• Project from Start to Finish
2

Lecture OverviewLecture Overview
• Attrition
• Spillovers • Partial Compliance and Sample Selection Bias
• Intention to Treat & Treatment on Treated
• Choice of outcomes
• External validity
• Cost Effectiveness
3
I i bl if f h l i h
d t ?
y p
AttritionAttrition
• Is t a problem experiment vanish before you collect your
• It is a problem if the type of people who disappear is correlated with the treatment.
• Why is it a problem?
• Why should we expect this to happen?
4
if some of the people in the
data?
i

l i
Attrition bias: an example
• The problem you want to address:
Attrition bias: an example
– Some children don’t come to school because they are too weak (undernourished)
• You start a school feeding program and want to do an evaluation – You have a treatment and a control group
• Weak, stunted children start going to school more if they live next to a treatment school
• First impact of your program: increased enrollment. • In addition you want to measure the impact on child’s growth In addition, you want to measure the impact on child s growth
– Second outcome of interest: Weight of children
• You go to all the schools (treatment and control) and measure everyone who is in school on a given dayeveryone who is in school on a given day
• Will the treatment‐control difference in weight be over‐stated or understated? 5
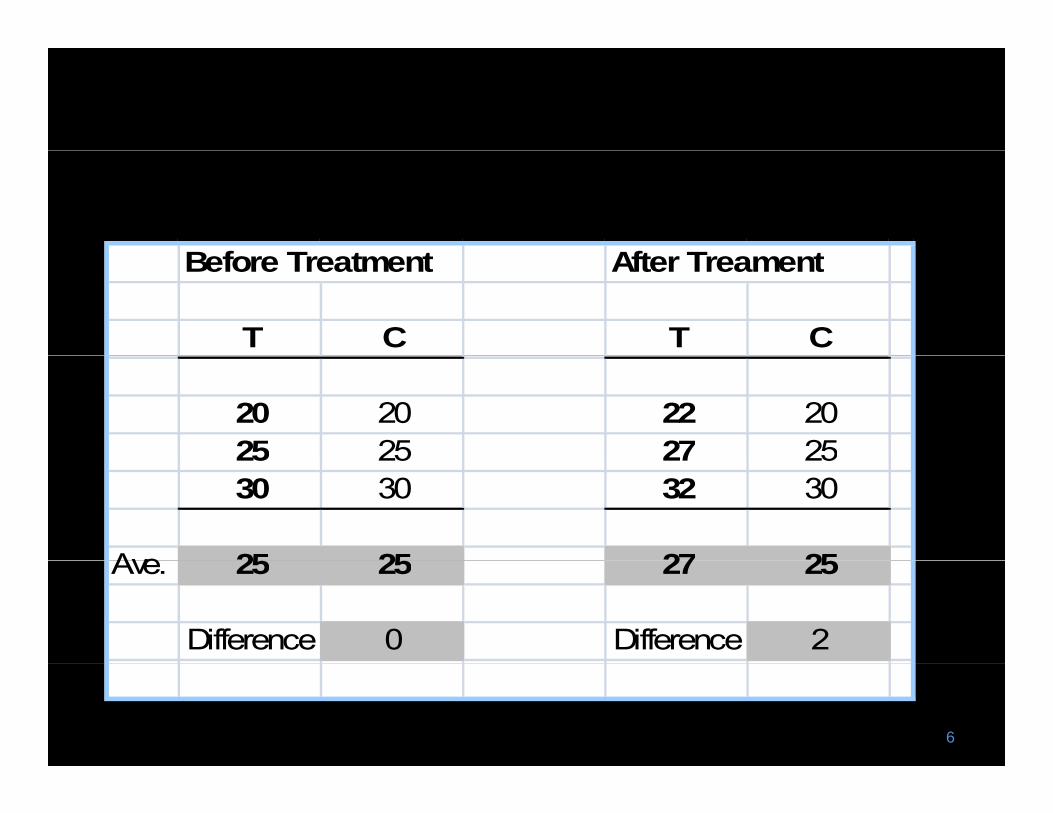
B f T t t Aft T tBefore Treatment After Treament
T C T C
20 20 22 20 25 25 27 2525 25 27 25 30 30 32 30
Ave 25 25 27 25Ave. 25 25 27 25
Difference 0 Difference 2
6

What if only children > 20 Kg come to school?What if only children > 20 Kg come to school?
7

What if only children > 20 Kg come to What if only children > 20 Kg come to
Before Treatment After Treament T C T C
[absent] [absent] 22 [absent] 25 25 27 2525 25 27 25 30 30 32 30
A 27 5 27 5 27 27 5Ave. 27.5 27.5 27 27.5
Difference 0 Difference -0.5
8
school?

d i i h d i
Attrition BiasAttrition Bias
• What source of attrition bias did they worry about in the de‐worming case with regards to testing?
• If worms keep children out of school and have adverse cognitive consequences, then deworming medicine might induce the weaker students
9

Attrition BiasAttrition Bias
• Devote resources to tracking participants after theyDevote resources to tracking participants after they leave the program
• If there is still attrition, check that it is not different in , treatment and control. Is that enough?
• Also check that it is not correlated with observables.
• Try to bound the extent of the bias – suppose everyone who dropped out from the treatment pp y pp got the lowest score that anyone got; suppose everyone who dropped out of control got the highest score that anyone gotanyone got…
– Why does this help? 10

Lecture OverviewLecture Overview
• Attrition
• Spillovers • Partial Compliance and Sample Selection Bias
• Intention to Treat & Treatment on Treated
• Choice of outcomes
• External validity
• Cost Effectiveness
11

–
p
Example: Deworming
• Previous studies randomize deworming
Example: Deworming
Previous studies randomize deworming treatment within schools
Suppose that deworming prevents theSuppose that deworming prevents the transmission of disease, what problems does this create for evaluation?
– Suppose externalities are local? How can we measure total impact?
12
–
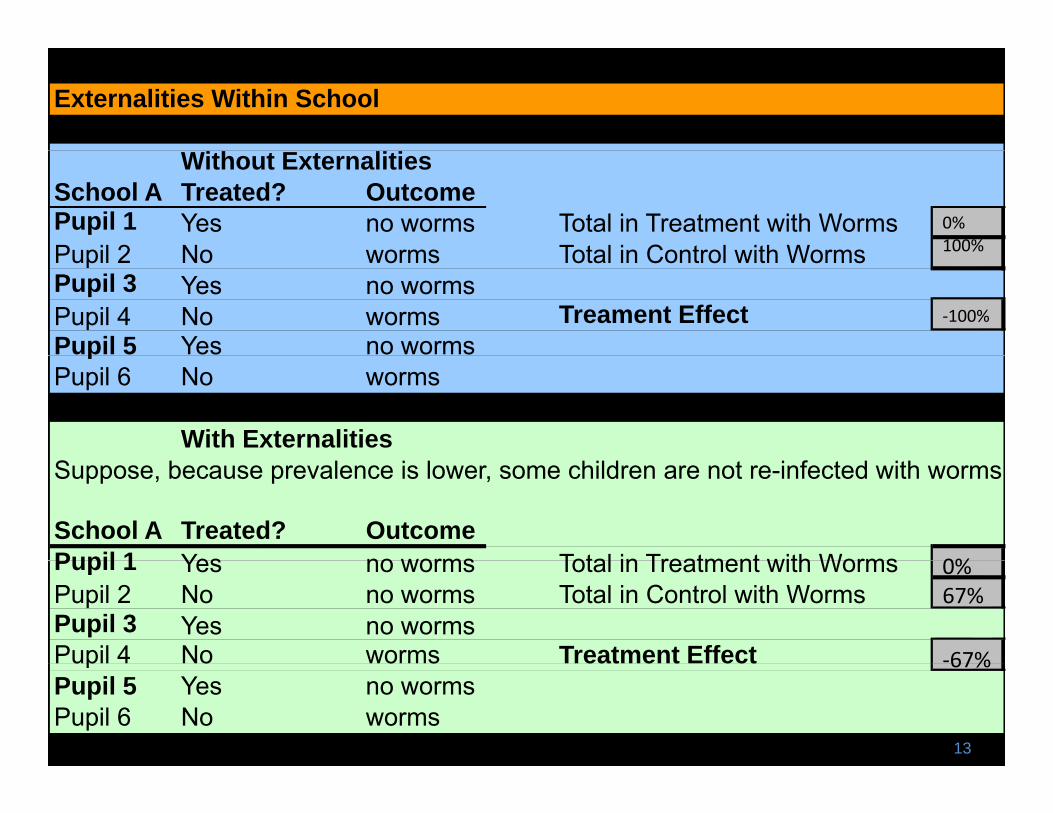
Externalities Within School
Without Externalities School A Treated? OutcomePupil 1 Yes no worms Total in Treatment with Worms Pupil 2 Pupil 2 No worms Total in Control with Worms No worms Total in Control with Worms Pupil 3 Yes no worms
0% 100%
‐100%Pupil 4 No worms Treament Effect Pupil 5 Yes no worms
With Externalities
0%
Suppose, because prevalence is lower, some children are not re-infected with worms
School A Treated? Outcome Pupil 1 Yes no worms Total in Treatment with Worms 0%
67%
‐67%
Pupil 1 Yes no worms Total in Treatment with Worms Pupil 2 No no worms Total in Control with Worms Pupil 3 Yes no worms Pupil 4 No worms Treatment Effect 67%Pupil 4 No worms Treatment Effect Pupil 5 Yes no worms Pupil 6 No worms
p Pupil 6 No worms
13

How to measure program impact in
• Design the unit of randomization so that it
the presence of spillovers? Design the unit of randomization so that it encompasses the spillovers
school: –
estimation of the overall effect
14
If we expect externalities that are all within
Randomization at the level of the school allows for

Measuring total impact in the presence of spillovers
15

•
B i l b 12 ld t b t t d i th
Within‐school health externalities
• What if we wanted to measure the spillovers?
Within school health externalities
What if we wanted to measure the spillovers?
• Deworming study – Because girls above 12 could not be treated in the treatment schools, we can compare girls above 12 in treatment schools to girls above 12 inin treatment schools to girls above 12 in comparison schools.
• More generally: need to randomize treatmentMore generally: need to randomize treatment within the unit so as to be able to learn about spilloversspillovers.
16
Example: Price InformationExample: Price Information
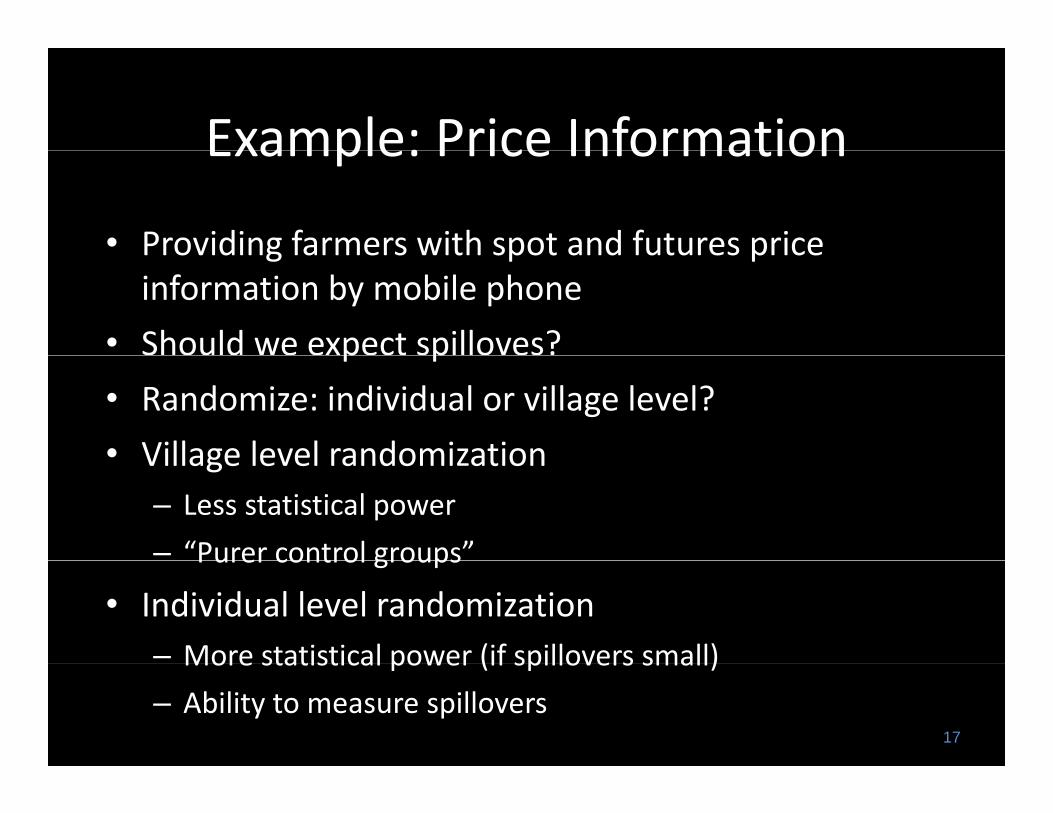
• Providing farmers with spot and futures priceProviding farmers with spot and futures price information by mobile phone
• Should we expect spilloves? p p
• Randomize: individual or village level?
• Village level randomizationVillage level randomization – Less statistical power – “Purer control groups”Purer control groups
• Individual level randomization – More statistical power (if spillovers small)More statistical power (if spillovers small)
– Ability to measure spillovers 17

t t
p y
SMS i i f i d l l d 25% f i di id l i h
Example: Price InformationExample: Price Information
• Can we do both?
• Randomly assign villages into one of four groups, A, B, C, and D
• Group A Villages SMS i i f i ll i di id l ith h– SMS price information to all individuals with phones
• Group B Villages – SMS price information to randomly selected 75% of individuals with
phones
• Group C Villages – SMS price information to randomly selected 25% of individuals with
phones
• Group D Villages – No SMS price information
18
Lecture OverviewLecture Overview
• Attrition
• Spillovers • Partial Compliance and Sample Selection Bias
• Intention to Treat & Treatment on Treated
• Choice of outcomes
• External validity
• Cost Effectiveness
19

Basic setup of a randomized evaluation
Target Target
Not in evaluation
Not in evaluation
gPopulation
gPopulation
TreatmentTreatment ParticipantsParticipants
Evaluation Sample
Evaluation Sample
Random Assignment
Random Assignment
group
Treatment group
ParticipantsParticipants
No-ShowsNo-Shows
Control groupControl groupNon-
ParticipantsNon-
Participants
20
ParticipantsParticipants
Cross-oversCross-overs
Treatment

Sample selection bias
• Sample selection bias could arise if factors
Sample selection bias
Sample selection bias could arise if factors other than random assignment influence program allocationprogram allocation – Even if intended allocation of program was random the actual allocation may not berandom, the actual allocation may not be
21

Sample selection bias
• Individuals assigned to comparison group could
Sample selection bias
Individuals assigned to comparison group could attempt to move into treatment group – De‐worming program: parents could attempt to move their children from comparison school to treatment school
• Alternatively, individuals allocated to treatment group may not receive treatment – De‐worming program: some students assigned to treatment in treatment schools did not receive medicaltreatment in treatment schools did not receive medical treatment
22

& d
Lecture Overview
• Spillovers
Lecture Overview
Spillovers
• Partial Compliance and Sample Selection Bias
• Intention to Treat & Treatment on Treated
• Choice of outcomes
• External validity
• Cost EffectivenessCost Effectiveness
23

y
ITT and ToT
• Vaccination campaign in villages
ITT and ToT
Vaccination campaign in villages
• Some people in treatment villages not treatedSome people in treatment villages not treated – 78% of people assigned to receive treatment received some treatment
• What do you do? – Compare the beneficiaries and non‐beneficiaries?
– Why not?
24

g p p
l
Which groups can be compared ?
Treatment Group:Treatment Group:
vaccination Control Group
Acceptent :
TREATEDTREATED NON‐TREATED
Refusent :
NON‐TREATED
25

t t
– –
What is the difference between the 2 random groups?
T G C t l G Treatment Group Control Group
1: treated not infected 5: non treated infected1: treated not infected 2: treated – not infected 3: treated – infected
5: non-treated infected 6: non-treated – not infected 7: non-treated – infected 8: non-treated – infected
4: non-treated – infected
26

%
ITT 50% 75% 25
Intention to treat ‐ ITT Intention to treat ITT
Treatment Group: 50% infectedp Control Group: 75% infected
● Y(T)= Average Outcome in Treatment Group ● Y(C)= Average Outcome in Control Group
ITT = Y(T) - Y(C)
● ITT = 50% - 75% = -25 percentage pointspercentage points povertyactionlab.org
27

•
Intention To Treat (ITT)
• What does “intention to treat” measure?
Intention To Treat (ITT)
What does intention to treat measure? “What happened to the average child who is in a treated school in this population?”in a treated school in this population?
Is this difference the causal effect of theIs this difference the causal effect of the intervention?
•
28

d ' h d i di i h'
l
When is ITT useful?
• May relate more to actual programs
When is ITT useful?
May relate more to actual programs
• For example, we may not be interested in the
what would happen under an actual
• If students often miss school and therefore don t get the deworming medicine, the intention to treat estimate may actually be most relevant.
29
medical effect of deworming treatment, but
deworming program.

What NOT to do!What NOT to do!
School 1:Avg. Change among Treated 3 (A)School 2: Avg. Change among not-treated (B)0.9
Observed Intention
School 1 to Treat ? Treated? Pupil 1 yes yes 4 Pupil 2 yes yes 4 P pil 3 es yes 4
Observed Change in
weight
Pupil 3 yes yes 4 Pupil 4 yes no 0 Pupil 5 yes yes 4 Pupil 6 yes no 2 Pupil 7 yes no 0 Pupil 8 yesyes yes yes 6Pupil 8 6 School 1:
3
Pupil 9 yes yes 6 Pupil 10 yes no 0
Avg. Change among Treated A=
A BA-B 2 12.1 School 2 School 2 Pupil 1 no no 2 Pupil 2 no no 1 Pupil 3 no yes 3 Pupil 4 no no 0 Pupil 5 no no 0Pupil 5 no no 0 Pupil 6 no yes 3 Pupil 7 no no 0 Pupil 8 no no 0 Pupil 9 no no 0 Pupil 10 no no 0
0.9 Pupil 10 no no 0
Avg. Change among Not-Treated B=
30

• erence pr•
ll hi i d b “i i ” h”
i
From ITT to effect of treatment on
• The point is that if there is leakage across the
the treated (TOT) The point is that if there is leakage across the groups, the comparison between those originally assigned to treatment and thoseoriginally assigned to treatment and those originally assigned to control is smaller
But the of But the of treated is also smaller
• Formally this is done by “instrumenting the probability of treatment by the original assignment
31 38
difference in the probability getting

–
g g g
Treatment on the treated (TOT)
• The effect of the treatment on those who got
Treatment on the treated (TOT)
The effect of the treatment on those who got the treatment:
Suppose children who got the treatment had aSuppose children who got the treatment had a weight gain of A, irrespective of whether they were in a treatment or a control school
– Suppose children who got no treatment had a weight gain of B, again in both kinds of schools
– We want to know A‐B, the difference between treated and non‐treated students
32
–

=
( ) * b[ d| ] ( b[ d| ])
Treatment on the treated (TOT)
• Then
Treatment on the treated (TOT)
Then…
• Y(T)=A*Prob[treated|T]+B(1‐Prob[treated|T]) • Y(C)=A*Prob[treated|C]+B(1‐Prob[treated|C]) • A‐B= (Y(T)‐Y(C)) /
(Prob[treated|T] – Prob[treated|C])
“treatment on the treated” effect treatment on the treated effect.
33
= The

TOT estimatorTOT estimator Observed Intention
School 1 to Treat ? Treated? Pupil 1 yes yes 4 Pupil 2 yes yes 4 Pupil 3 yes yes 4 A = Gain if Treated
Change in weight
Pupil 3 yes yes 4 A Gain if Treated Pupil 4 yes no 0 B = Gain if not Treated Pupil 5 yes yes 4 Pupil 6 yes no 2 Pupil 7 yes no 0 ToT Estimator: A-B Pupil 8 yes yes 6
3
Pupil 8 yes yes 6 Pupil 9 yes yes 6 Pupil 10 yes no 0 A-B = Y(T)-Y(C)
Avg. Change Y(T)= Prob(Treated|T)-Prob(Treated|C)
School 2 3 0.9 60% 20%
School 2 Pupil 1 no no 2 Y(T) Pupil 2 no no 1 Y(C) Pupil 3 no yes 3 Prob(Treated|T) Pupil 4 no no 0 Prob(Treated|C) Pupil 5 no no 0
2.1 40%
Pupil 5 no no 0 Pupil 6 no yes 3 Pupil 7 no no 0 Y(T)-Y(C) Pupil 8 no no 0 Prob(Treated|T)-Prob(Treated|C) Pupil 9 no no 0 P il 10 0
34
0.9 5.25 Pupil 10 no no 0
Avg. Change Y(C) = A-B

( )
Estimating TOTEstimating TOT
• What values do we need?What values do we need?
• Y(T) • Y(C)
• Prob[treated|T] • Prob[treated|C]Prob[treated|C]
35

,
TOT not always appropriate…
• Example: send 50% of MIT staff a letter warning of
TOT not always appropriate…
p g flu season, encourage them to get vaccines
• Suppose 50% in treatment, 0% in control getpp g vaccines
• Suppose incidence of flu in treated group drops 35% relative to control group
• Is (.35) / (.5 – 0 ) = 70% the correct estimate?
• What effect might letter alone have?
• Excel Examplep
36

•
•
Lecture Overview
• Spillovers
Lecture Overview
Spillovers
• Partial Compliance and Sample Selection Bias
• Intention to Treat & Treatment on Treated
• Choice of outcomes
• External validity
• Cost EffectivenessCost Effectiveness
37

h l k h h h
ff d b h
Multiple outcomes
• Can we look at various outcomes?
Multiple outcomes
Can we look at various outcomes?
• The more outcomes you look at, the higher the chance you find at least one significantly affected by the program – Pre‐specify outcomes of interest
– Report results on all measured outcomes, even null results
– Correct statistical tests (Bonferroni) 38

•
–
Oth i tRule: Report both “raw” differences and regression‐adjusted results
Covariates
• Why include covariates?
Covariates
Why include covariates? – May explain variation, improve statistical power
• Why not include covariates? – Appearances of “specification searching”
• What to control for? If stratified randomization: add strata fixedIf stratified randomization: add strata fixed effects
Rule: Report both “raw” differences and regression‐adjusted results
– covariates
–
39
Other
Lecture Overview
• Spillovers
Lecture Overview
Spillovers
• Partial Compliance and Sample Selection Bias
& d• Intention to Treat & Treatment on Treated
• Choice of outcomes
• External validity
• Cost EffectivenessCost Effectiveness
40

Threat to external validity:Threat to external validity:
• Behavioral responses to evaluations
• Generalizability of results
41

h l l
Consider controls who are measured
Threat to external validity:
• One limitation of evaluations is that the evaluation
Behavioral responses to evaluations One limitation of evaluations is that the evaluation itself may cause the treatment or comparison group to change its behavior – Treatment group behavior changes: Hawthorne effect
– Comparison group behavior changes: John Henry effect
●Minimize salience of evaluation as much as possible
●at endline only
42
Consider including controls who measured

–
Generalizability of results
• Depend on three factors:
Generalizability of results
Depend on three factors: – Program Implementation: can it be replicated at a large (national) scale?large (national) scale?
– Study Sample: is it representative?
– Sensitivity of results: would a similar but slightlySensitivity of results: would a similar, but slightly different program, have same impact?
43

Lecture Overview
• Spillovers
Lecture Overview
Spillovers
• Partial Compliance and Sample Selection Bias
& d• Intention to Treat & Treatment on Treated
• Choice of outcomes
• External validity
• ConclusionConclusion
44

t t t–
Conclusion
• There are many threats to the internal and external
Conclusion
There are many threats to the internal and external validity of randomized evaluations…
• …as are there for every other type of studyy yp y
• Randomized trials: – Facilitate simple and transparent analysisp p y
• Provide few “degrees of freedom” in data analysis (this is a good thing)
All l f lidit f iAllow clear tests of validity of experiment
45
–

•
Further resourcesFurther resources
• Using Randomization in DevelopmentUsing Randomization in Development Economics Research: A Toolkit (Duflo, Glennerster Kremer) Glennerster, Kremer)
• Mostly Harmless Econometrics (Angrist and Pischke)Pischke)
• Identification and Estimation of Local Average Treatment Effects (Imbens and Angrist, Econometrica, 1994)
46

MIT OpenCourseWare http://ocw.mit.edu
Resource: Abdul Latif Jameel Poverty Action Lab Executive Training: Evaluating Social Programs Dr. Rachel Glennerster, Prof. Abhijit Banerjee, Prof. Esther Duflo
The following may not correspond to a particular course on MIT OpenCourseWare, but has been provided by the author as an individual learning resource.
For information about citing these materials or our Terms of Use, visit: http://ocw.mit.edu/terms.