23rd dec, 2009 july 24, 2015 january 2, 2010 sutapa roy ... fundamental report july 24 ,2015.… ·...
TRANSCRIPT
23rd Dec, 2009
Sutapa Roy E-mail: [email protected]
January 2, 2010
Research Analyst Sutapa Roy
E-mail: [email protected]
July 24, 2015
Ujjala Choudhary
E-mail: [email protected]
MARKET UPDATE
OUTLOOK
WEEKLY CHART OF SENSEX
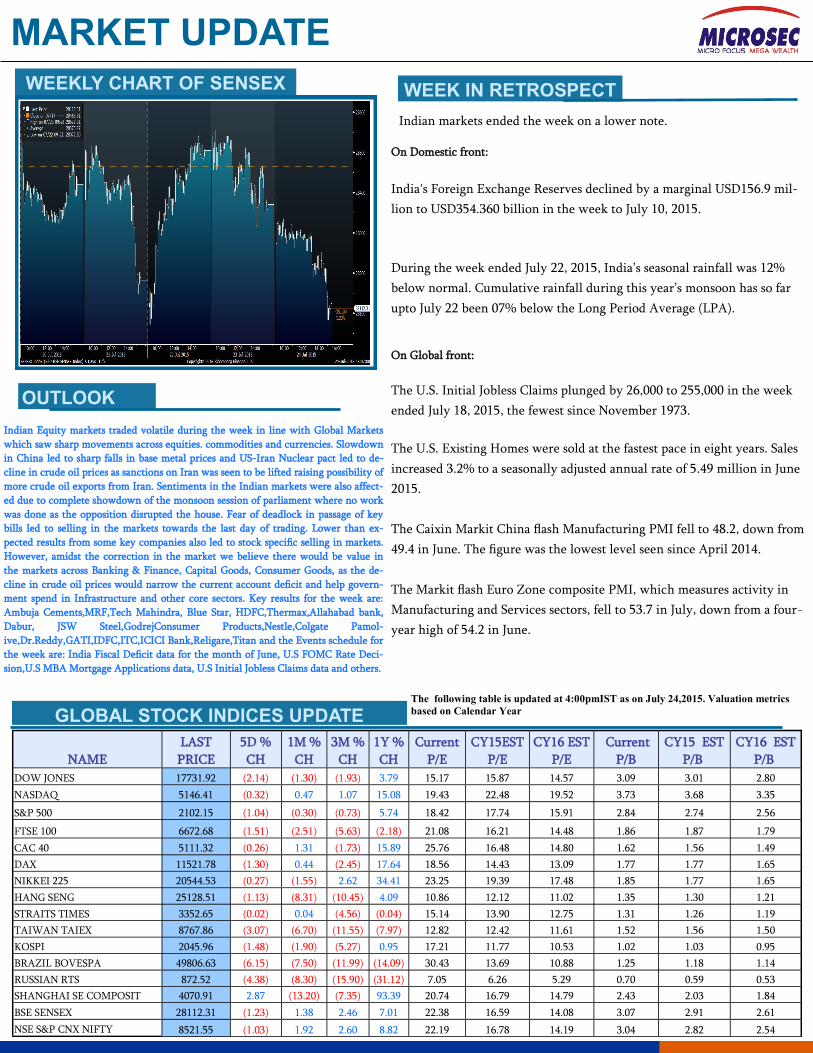
Indian markets ended the week on a lower note.
GLOBAL STOCK INDICES UPDATE
NAME
LAST
PRICE
5D %
CH
1M %
CH
3M %
CH
1Y %
CH
Current
P/E
CY15EST
P/E
Current
P/B
CY15 EST
P/B
CY16 EST
P/E
CY16 EST
P/B
DOW JONES 17731.92 (2.14) (1.30) (1.93) 3.79 15.17 15.87 3.09 3.01 14.57 2.80
NASDAQ 5146.41 (0.32) 0.47 1.07 15.08 19.43 22.48 3.73 3.68 19.52 3.35
S&P 500 2102.15 (1.04) (0.30) (0.73) 5.74 18.42 17.74 2.84 2.74 15.91 2.56
FTSE 100 6672.68 (1.51) (2.51) (5.63) (2.18) 21.08 16.21 1.86 1.87 14.48 1.79
CAC 40 5111.32 (0.26) 1.31 (1.73) 15.89 25.76 16.48 1.62 1.56 14.80 1.49
DAX 11521.78 (1.30) 0.44 (2.45) 17.64 18.56 14.43 1.77 1.77 13.09 1.65
NIKKEI 225 20544.53 (0.27) (1.55) 2.62 34.41 23.25 19.39 1.85 1.77 17.48 1.65
HANG SENG 25128.51 (1.13) (8.31) (10.45) 4.09 10.86 12.12 1.35 1.30 11.02 1.21
STRAITS TIMES 3352.65 (0.02) 0.04 (4.56) (0.04) 15.14 13.90 1.31 1.26 12.75 1.19
TAIWAN TAIEX 8767.86 (3.07) (6.70) (11.55) (7.97) 12.82 12.42 1.52 1.56 11.61 1.50
KOSPI 2045.96 (1.48) (1.90) (5.27) 0.95 17.21 11.77 1.02 1.03 10.53 0.95
BRAZIL BOVESPA 49806.63 (6.15) (7.50) (11.99) (14.09) 30.43 13.69 1.25 1.18 10.88 1.14
RUSSIAN RTS 872.52 (4.38) (8.30) (15.90) (31.12) 7.05 6.26 0.70 0.59 5.29 0.53
SHANGHAI SE COMPOSIT 4070.91 2.87 (13.20) (7.35) 93.39 20.74 16.79 2.43 2.03 14.79 1.84
BSE SENSEX 28112.31 (1.23) 1.38 2.46 7.01 22.38 16.59 3.07 2.91 14.08 2.61
NSE S&P CNX NIFTY 8521.55 (1.03) 1.92 2.60 8.82 22.19 16.78 3.04 2.82 14.19 2.54
WEEK IN RETROSPECT
Indian Equity markets traded volatile during the week in line with Global Markets
which saw sharp movements across equities. commodities and currencies. Slowdown
in China led to sharp falls in base metal prices and US-Iran Nuclear pact led to de-
cline in crude oil prices as sanctions on Iran was seen to be lifted raising possibility of
more crude oil exports from Iran. Sentiments in the Indian markets were also affect-
ed due to complete showdown of the monsoon session of parliament where no work
was done as the opposition disrupted the house. Fear of deadlock in passage of key
bills led to selling in the markets towards the last day of trading. Lower than ex-
pected results from some key companies also led to stock specific selling in markets.
However, amidst the correction in the market we believe there would be value in
the markets across Banking & Finance, Capital Goods, Consumer Goods, as the de-
cline in crude oil prices would narrow the current account deficit and help govern-
ment spend in Infrastructure and other core sectors. Key results for the week are:
Ambuja Cements,MRF,Tech Mahindra, Blue Star, HDFC,Thermax,Allahabad bank,
Dabur, JSW Steel,GodrejConsumer Products,Nestle,Colgate Pamol-
ive,Dr.Reddy,GATI,IDFC,ITC,ICICI Bank,Religare,Titan and the Events schedule for
the week are: India Fiscal Deficit data for the month of June, U.S FOMC Rate Deci-
sion,U.S MBA Mortgage Applications data, U.S Initial Jobless Claims data and others.
On Domestic front:
India's Foreign Exchange Reserves declined by a marginal USD156.9 mil-
lion to USD354.360 billion in the week to July 10, 2015.
During the week ended July 22, 2015, India’s seasonal rainfall was 12%
below normal. Cumulative rainfall during this year’s monsoon has so far
upto July 22 been 07% below the Long Period Average (LPA).
On Global front:
The U.S. Initial Jobless Claims plunged by 26,000 to 255,000 in the week
ended July 18, 2015, the fewest since November 1973.
The U.S. Existing Homes were sold at the fastest pace in eight years. Sales
increased 3.2% to a seasonally adjusted annual rate of 5.49 million in June
2015.
The Caixin Markit China flash Manufacturing PMI fell to 48.2, down from
49.4 in June. The figure was the lowest level seen since April 2014.
The Markit flash Euro Zone composite PMI, which measures activity in
Manufacturing and Services sectors, fell to 53.7 in July, down from a four-
year high of 54.2 in June.
The following table is updated at 4:00pmIST as on July 24,2015. Valuation metrics
based on Calendar Year
MARKET STATS
MSCI INDICES
NAME LAST
PRICE
1Y%
CH
1M%
CH
5D%
CH
3M%
CH
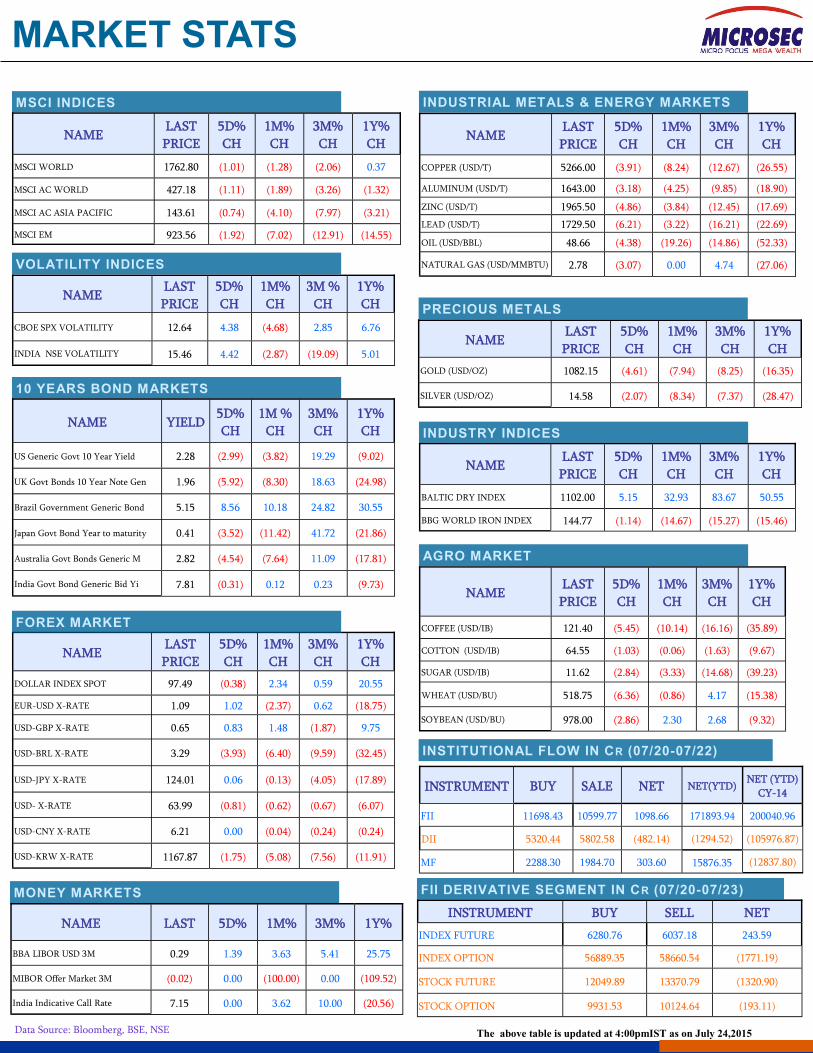
MSCI WORLD 1762.80 0.37 (1.28) (1.01) (2.06)
MSCI AC WORLD 427.18 (1.32) (1.89) (1.11) (3.26)
MSCI AC ASIA PACIFIC 143.61 (3.21) (4.10) (0.74) (7.97)
MSCI EM 923.56 (14.55) (7.02) (1.92) (12.91)
NAME LAST
PRICE
3M%
CH
5D%
CH
1M%
CH
1Y%
CH
DOLLAR INDEX SPOT 97.49 0.59 (0.38) 2.34 20.55
EUR-USD X-RATE 1.09 0.62 1.02 (2.37) (18.75)
USD-GBP X-RATE 0.65 (1.87) 0.83 1.48 9.75
USD-BRL X-RATE 3.29 (9.59) (3.93) (6.40) (32.45)
USD-JPY X-RATE 124.01 (4.05) 0.06 (0.13) (17.89)
USD- X-RATE 63.99 (0.67) (0.81) (0.62) (6.07)
USD-CNY X-RATE 6.21 (0.24) 0.00 (0.04) (0.24)
USD-KRW X-RATE 1167.87 (7.56) (1.75) (5.08) (11.91)
FOREX MARKET
INDUSTRIAL METALS & ENERGY MARKETS
NAME LAST
PRICE
5D%
CH
1M%
CH
3M%
CH
1Y%
CH
COPPER (USD/T) 5266.00 (3.91) (8.24) (12.67) (26.55)
ALUMINUM (USD/T) 1643.00 (3.18) (4.25) (9.85) (18.90)
ZINC (USD/T) 1965.50 (4.86) (3.84) (12.45) (17.69)
LEAD (USD/T) 1729.50 (6.21) (3.22) (16.21) (22.69)
OIL (USD/BBL) 48.66 (4.38) (19.26) (14.86) (52.33)
NATURAL GAS (USD/MMBTU) 2.78 (3.07) 0.00 4.74 (27.06)
PRECIOUS METALS
NAME 1M%
CH
3M%
CH
LAST
PRICE
5D%
CH
1Y%
CH
GOLD (USD/OZ) (7.94) (8.25) 1082.15 (4.61) (16.35)
SILVER (USD/OZ) (8.34) (7.37) 14.58 (2.07) (28.47)
AGRO MARKET
NAME LAST
PRICE
3M%
CH
1M%
CH
5D%
CH
1Y%
CH
COFFEE (USD/IB) 121.40 (16.16) (10.14) (5.45) (35.89)
COTTON (USD/IB) 64.55 (1.63) (0.06) (1.03) (9.67)
SUGAR (USD/IB) 11.62 (14.68) (3.33) (2.84) (39.23)
WHEAT (USD/BU) 518.75 4.17 (0.86) (6.36) (15.38)
SOYBEAN (USD/BU) 978.00 2.68 2.30 (2.86) (9.32)
10 YEARS BOND MARKETS
NAME YIELD 3M%
CH
1M %
CH
5D%
CH
1Y%
CH
US Generic Govt 10 Year Yield 2.28 19.29 (3.82) (2.99) (9.02)
UK Govt Bonds 10 Year Note Gen 1.96 18.63 (8.30) (5.92) (24.98)
Brazil Government Generic Bond 5.15 24.82 10.18 8.56 30.55
Japan Govt Bond Year to maturity 0.41 41.72 (11.42) (3.52) (21.86)
Australia Govt Bonds Generic M 2.82 11.09 (7.64) (4.54) (17.81)
India Govt Bond Generic Bid Yi 7.81 0.23 0.12 (0.31) (9.73)
MONEY MARKETS
NAME 1M% 3M%LAST 5D% 1Y%
BBA LIBOR USD 3M 3.63 5.41 0.29 1.39 25.75
MIBOR Offer Market 3M (100.00) 0.00 (0.02) 0.00 (109.52)
India Indicative Call Rate 3.62 10.00 7.15 0.00 (20.56)
INSTITUTIONAL FLOW IN CR (07/20-07/22)
INSTRUMENT BUY SALE NET NET (YTD)
CY-14 NET(YTD)
FII 11698.43 10599.77 1098.66 200040.96 171893.94
DII 5320.44 5802.58 (482.14) (105976.87) (1294.52)
MF 2288.30 1984.70 303.60 (12837.80) 15876.35
FII DERIVATIVE SEGMENT IN CR (07/20-07/23)
INSTRUMENT BUY SELL NET
INDEX FUTURE 6280.76 6037.18 243.59
INDEX OPTION 56889.35 58660.54 (1771.19)
STOCK FUTURE 12049.89 13370.79 (1320.90)
STOCK OPTION 9931.53 10124.64 (193.11)
VOLATILITY INDICES
NAME LAST
PRICE
3M %
CH
5D%
CH
1M%
CH
1Y%
CH
CBOE SPX VOLATILITY 12.64 2.85 4.38 (4.68) 6.76
INDIA NSE VOLATILITY 15.46 (19.09) 4.42 (2.87) 5.01
INDUSTRY INDICES
NAME LAST
PRICE
5D%
CH
3M%
CH
1M%
CH
1Y%
CH
BALTIC DRY INDEX 1102.00 5.15 83.67 32.93 50.55
BBG WORLD IRON INDEX 144.77 (1.14) (15.27) (14.67) (15.46)
Data Source: Bloomberg, BSE, NSE The above table is updated at 4:00pmIST as on July 24,2015
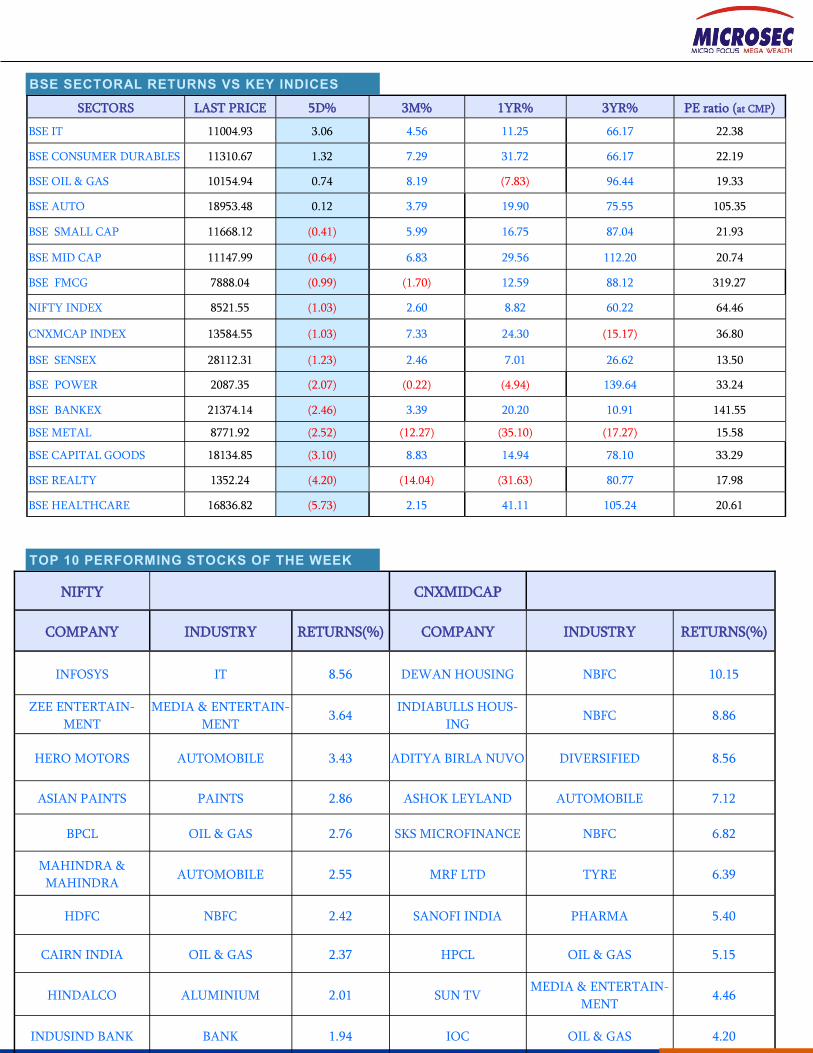
NIFTY CNXMIDCAP
COMPANY INDUSTRY RETURNS(%) COMPANY INDUSTRY RETURNS(%)
INFOSYS IT 8.56 DEWAN HOUSING NBFC 10.15
ZEE ENTERTAIN-
MENT
MEDIA & ENTERTAIN-
MENT 3.64
INDIABULLS HOUS-
ING NBFC 8.86
HERO MOTORS AUTOMOBILE 3.43 ADITYA BIRLA NUVO DIVERSIFIED 8.56
ASIAN PAINTS PAINTS 2.86 ASHOK LEYLAND AUTOMOBILE 7.12
BPCL OIL & GAS 2.76 SKS MICROFINANCE NBFC 6.82
MAHINDRA &
MAHINDRA AUTOMOBILE 2.55 MRF LTD TYRE 6.39
HDFC NBFC 2.42 SANOFI INDIA PHARMA 5.40
CAIRN INDIA OIL & GAS 2.37 HPCL OIL & GAS 5.15
HINDALCO ALUMINIUM 2.01 SUN TV MEDIA & ENTERTAIN-
MENT 4.46
INDUSIND BANK BANK 1.94 IOC OIL & GAS 4.20
SECTORS LAST PRICE 5D% 3M% 1YR% 3YR% PE ratio (at CMP)
BSE IT 11004.93 3.06 4.56 11.25 66.17 22.38
BSE CONSUMER DURABLES 11310.67 1.32 7.29 31.72 66.17 22.19
BSE OIL & GAS 10154.94 0.74 8.19 (7.83) 96.44 19.33
BSE AUTO 18953.48 0.12 3.79 19.90 75.55 105.35
BSE SMALL CAP 11668.12 (0.41) 5.99 16.75 87.04 21.93
BSE MID CAP 11147.99 (0.64) 6.83 29.56 112.20 20.74
BSE FMCG 7888.04 (0.99) (1.70) 12.59 88.12 319.27
NIFTY INDEX 8521.55 (1.03) 2.60 8.82 60.22 64.46
CNXMCAP INDEX 13584.55 (1.03) 7.33 24.30 (15.17) 36.80
BSE SENSEX 28112.31 (1.23) 2.46 7.01 26.62 13.50
BSE POWER 2087.35 (2.07) (0.22) (4.94) 139.64 33.24
BSE BANKEX 21374.14 (2.46) 3.39 20.20 10.91 141.55
BSE METAL 8771.92 (2.52) (12.27) (35.10) (17.27) 15.58
BSE CAPITAL GOODS 18134.85 (3.10) 8.83 14.94 78.10 33.29
BSE REALTY 1352.24 (4.20) (14.04) (31.63) 80.77 17.98
BSE HEALTHCARE 16836.82 (5.73) 2.15 41.11 105.24 20.61
BSE SECTORAL RETURNS VS KEY INDICES
TOP 10 PERFORMING STOCKS OF THE WEEK
NEWS
AGROCHEMICAL SECTOR
Bayer Corp. Science Limited announces Quarterly Results for the Quarter ended June
30, 2015
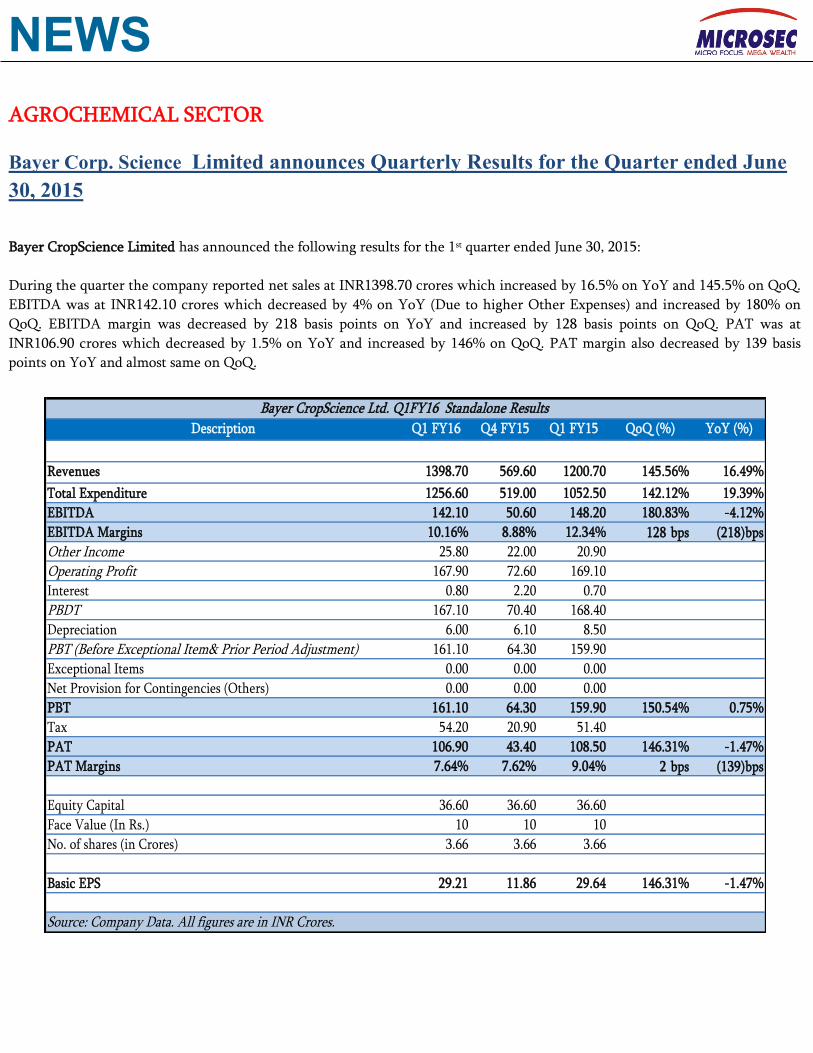
Bayer CropScience Limited has announced the following results for the 1st quarter ended June 30, 2015:
During the quarter the company reported net sales at INR1398.70 crores which increased by 16.5% on YoY and 145.5% on QoQ.
EBITDA was at INR142.10 crores which decreased by 4% on YoY (Due to higher Other Expenses) and increased by 180% on
QoQ. EBITDA margin was decreased by 218 basis points on YoY and increased by 128 basis points on QoQ. PAT was at
INR106.90 crores which decreased by 1.5% on YoY and increased by 146% on QoQ. PAT margin also decreased by 139 basis
points on YoY and almost same on QoQ.
Description Q1 FY16 Q4 FY15 Q1 FY15 QoQ (%) YoY (%)
Revenues 1398.70 569.60 1200.70 145.56% 16.49%
Total Expenditure 1256.60 519.00 1052.50 142.12% 19.39%
EBITDA 142.10 50.60 148.20 180.83% -4.12%
EBITDA Margins 10.16% 8.88% 12.34% 128 bps (218)bps
Other Income 25.80 22.00 20.90
Operating Profit 167.90 72.60 169.10
Interest 0.80 2.20 0.70
PBDT 167.10 70.40 168.40
Depreciation 6.00 6.10 8.50
PBT (Before Exceptional Item& Prior Period Adjustment) 161.10 64.30 159.90
Exceptional Items 0.00 0.00 0.00
Net Provision for Contingencies (Others) 0.00 0.00 0.00
PBT 161.10 64.30 159.90 150.54% 0.75%
Tax 54.20 20.90 51.40
PAT 106.90 43.40 108.50 146.31% -1.47%
PAT Margins 7.64% 7.62% 9.04% 2 bps (139)bps
Equity Capital 36.60 36.60 36.60
Face Value (In Rs.) 10 10 10
No. of shares (in Crores) 3.66 3.66 3.66
Basic EPS 29.21 11.86 29.64 146.31% -1.47%
Source: Company Data. All figures are in INR Crores.
Bayer CropScience Ltd. Q1FY16 Standalone Results
NEWS
PAINT SECTOR
Asian Paints Limited announces Quarterly Results for the Quarter ended June
30,2015
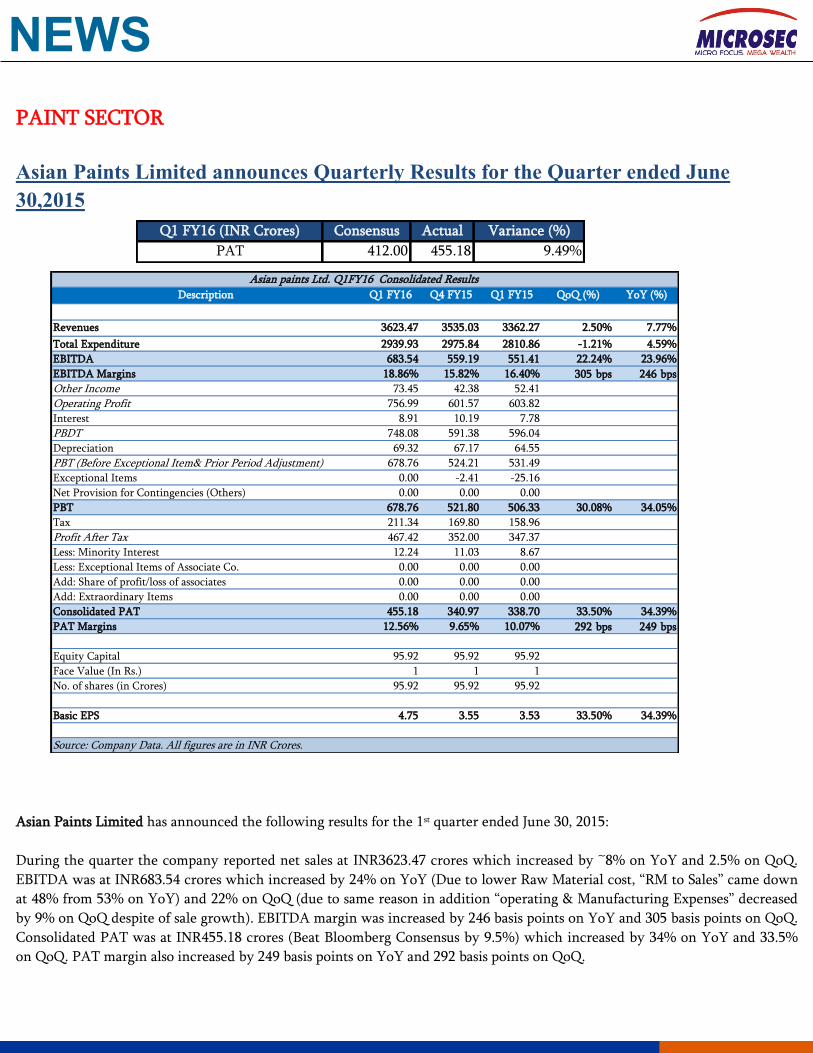
Asian Paints Limited has announced the following results for the 1st quarter ended June 30, 2015:
During the quarter the company reported net sales at INR3623.47 crores which increased by ~8% on YoY and 2.5% on QoQ.
EBITDA was at INR683.54 crores which increased by 24% on YoY (Due to lower Raw Material cost, “RM to Sales” came down
at 48% from 53% on YoY) and 22% on QoQ (due to same reason in addition “operating & Manufacturing Expenses” decreased
by 9% on QoQ despite of sale growth). EBITDA margin was increased by 246 basis points on YoY and 305 basis points on QoQ.
Consolidated PAT was at INR455.18 crores (Beat Bloomberg Consensus by 9.5%) which increased by 34% on YoY and 33.5%
on QoQ. PAT margin also increased by 249 basis points on YoY and 292 basis points on QoQ.
Q1 FY16 (INR Crores) Consensus Actual Variance (%)
PAT 412.00 455.18 9.49%
Description Q1 FY16 Q4 FY15 Q1 FY15 QoQ (%) YoY (%)
Revenues 3623.47 3535.03 3362.27 2.50% 7.77%
Total Expenditure 2939.93 2975.84 2810.86 -1.21% 4.59%
EBITDA 683.54 559.19 551.41 22.24% 23.96%
EBITDA Margins 18.86% 15.82% 16.40% 305 bps 246 bps
Other Income 73.45 42.38 52.41
Operating Profit 756.99 601.57 603.82
Interest 8.91 10.19 7.78
PBDT 748.08 591.38 596.04
Depreciation 69.32 67.17 64.55
PBT (Before Exceptional Item& Prior Period Adjustment) 678.76 524.21 531.49
Exceptional Items 0.00 -2.41 -25.16
Net Provision for Contingencies (Others) 0.00 0.00 0.00
PBT 678.76 521.80 506.33 30.08% 34.05%
Tax 211.34 169.80 158.96
Profit After Tax 467.42 352.00 347.37
Less: Minority Interest 12.24 11.03 8.67
Less: Exceptional Items of Associate Co. 0.00 0.00 0.00
Add: Share of profit/loss of associates 0.00 0.00 0.00
Add: Extraordinary Items 0.00 0.00 0.00
Consolidated PAT 455.18 340.97 338.70 33.50% 34.39%
PAT Margins 12.56% 9.65% 10.07% 292 bps 249 bps
Equity Capital 95.92 95.92 95.92
Face Value (In Rs.) 1 1 1
No. of shares (in Crores) 95.92 95.92 95.92
Basic EPS 4.75 3.55 3.53 33.50% 34.39%
Source: Company Data. All figures are in INR Crores.
Asian paints Ltd. Q1FY16 Consolidated Results
NEWS
AUTO SECTOR
Eicher Motors Limited announces Quarterly Results for the Quarter ended June
30,2015
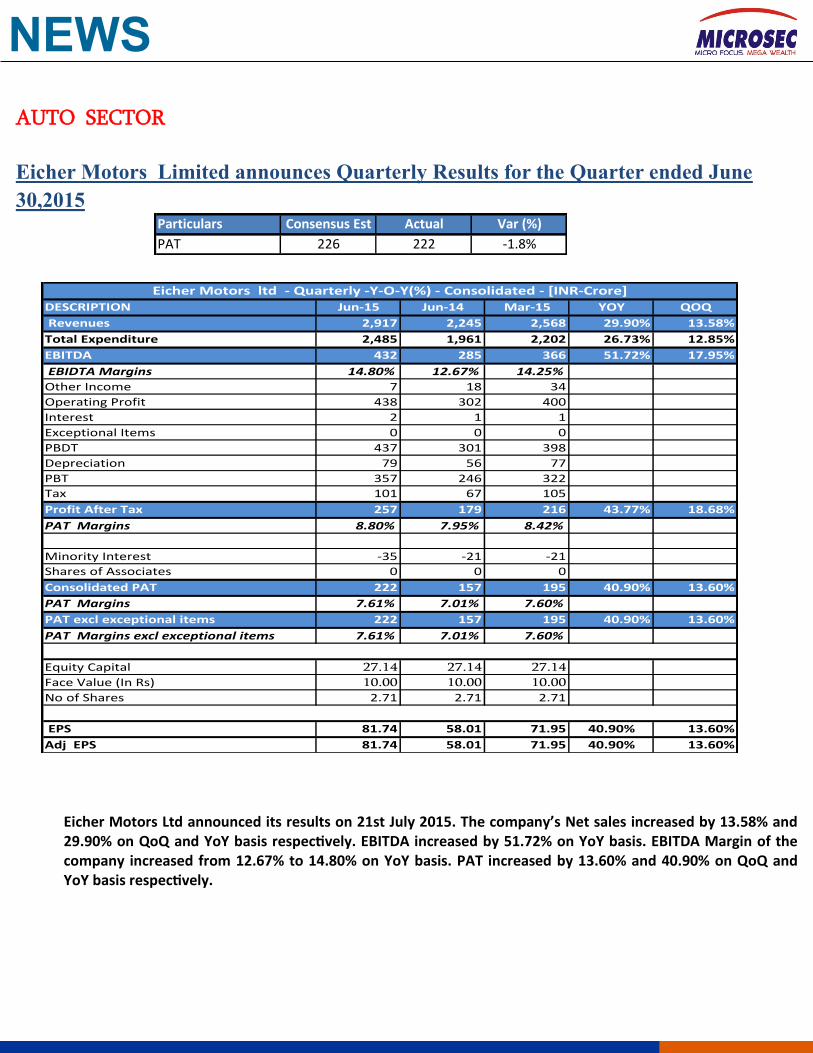
Eicher Motors Ltd announced its results on 21st July 2015. The company’s Net sales increased by 13.58% and 29.90% on QoQ and YoY basis respectively. EBITDA increased by 51.72% on YoY basis. EBITDA Margin of the company increased from 12.67% to 14.80% on YoY basis. PAT increased by 13.60% and 40.90% on QoQ and YoY basis respectively.
Particulars Consensus Est Actual Var (%)
PAT 226 222 -1.8%
DESCRIPTION Jun-15 Jun-14 Mar-15 YOY QOQ
Revenues 2,917 2,245 2,568 29.90% 13.58%
Total Expenditure 2,485 1,961 2,202 26.73% 12.85%
EBITDA 432 285 366 51.72% 17.95%
EBIDTA Margins 14.80% 12.67% 14.25%
Other Income 7 18 34
Operating Profit 438 302 400
Interest 2 1 1
Exceptional Items 0 0 0
PBDT 437 301 398
Depreciation 79 56 77
PBT 357 246 322
Tax 101 67 105
Profit After Tax 257 179 216 43.77% 18.68%
PAT Margins 8.80% 7.95% 8.42%
Minority Interest -35 -21 -21
Shares of Associates 0 0 0
Consolidated PAT 222 157 195 40.90% 13.60%
PAT Margins 7.61% 7.01% 7.60%
PAT excl exceptional items 222 157 195 40.90% 13.60%
PAT Margins excl exceptional items 7.61% 7.01% 7.60%
Equity Capital 27.14 27.14 27.14
Face Value (In Rs) 10.00 10.00 10.00
No of Shares 2.71 2.71 2.71
EPS 81.74 58.01 71.95 40.90% 13.60%
Adj EPS 81.74 58.01 71.95 40.90% 13.60%
Eicher Motors ltd - Quarterly -Y-O-Y(%) - Consolidated - [INR-Crore]
NEWS
TVS Motors Limited announces Quarterly Results for the Quarter ended June
30,2015
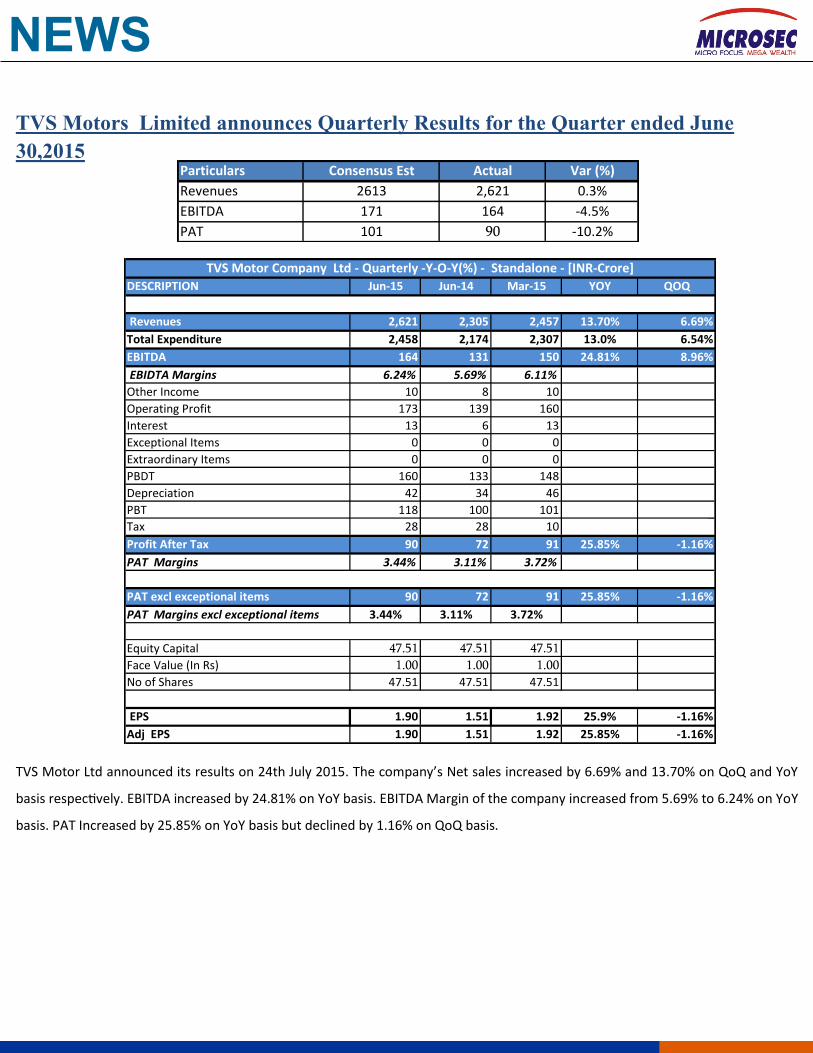
TVS Motor Ltd announced its results on 24th July 2015. The company’s Net sales increased by 6.69% and 13.70% on QoQ and YoY
basis respectively. EBITDA increased by 24.81% on YoY basis. EBITDA Margin of the company increased from 5.69% to 6.24% on YoY
basis. PAT Increased by 25.85% on YoY basis but declined by 1.16% on QoQ basis.
Particulars Consensus Est Actual Var (%)
Revenues 2613 2,621 0.3%
EBITDA 171 164 -4.5%
PAT 101 90 -10.2%
DESCRIPTION Jun-15 Jun-14 Mar-15 YOY QOQ
Revenues 2,621 2,305 2,457 13.70% 6.69%
Total Expenditure 2,458 2,174 2,307 13.0% 6.54%
EBITDA 164 131 150 24.81% 8.96%
EBIDTA Margins 6.24% 5.69% 6.11%
Other Income 10 8 10
Operating Profit 173 139 160
Interest 13 6 13
Exceptional Items 0 0 0
Extraordinary Items 0 0 0
PBDT 160 133 148
Depreciation 42 34 46
PBT 118 100 101
Tax 28 28 10
Profit After Tax 90 72 91 25.85% -1.16%
PAT Margins 3.44% 3.11% 3.72%
PAT excl exceptional items 90 72 91 25.85% -1.16%
PAT Margins excl exceptional items 3.44% 3.11% 3.72%
Equity Capital 47.51 47.51 47.51
Face Value (In Rs) 1.00 1.00 1.00
No of Shares 47.51 47.51 47.51
EPS 1.90 1.51 1.92 25.9% -1.16%
Adj EPS 1.90 1.51 1.92 25.85% -1.16%
TVS Motor Company Ltd - Quarterly -Y-O-Y(%) - Standalone - [INR-Crore]
NEWS
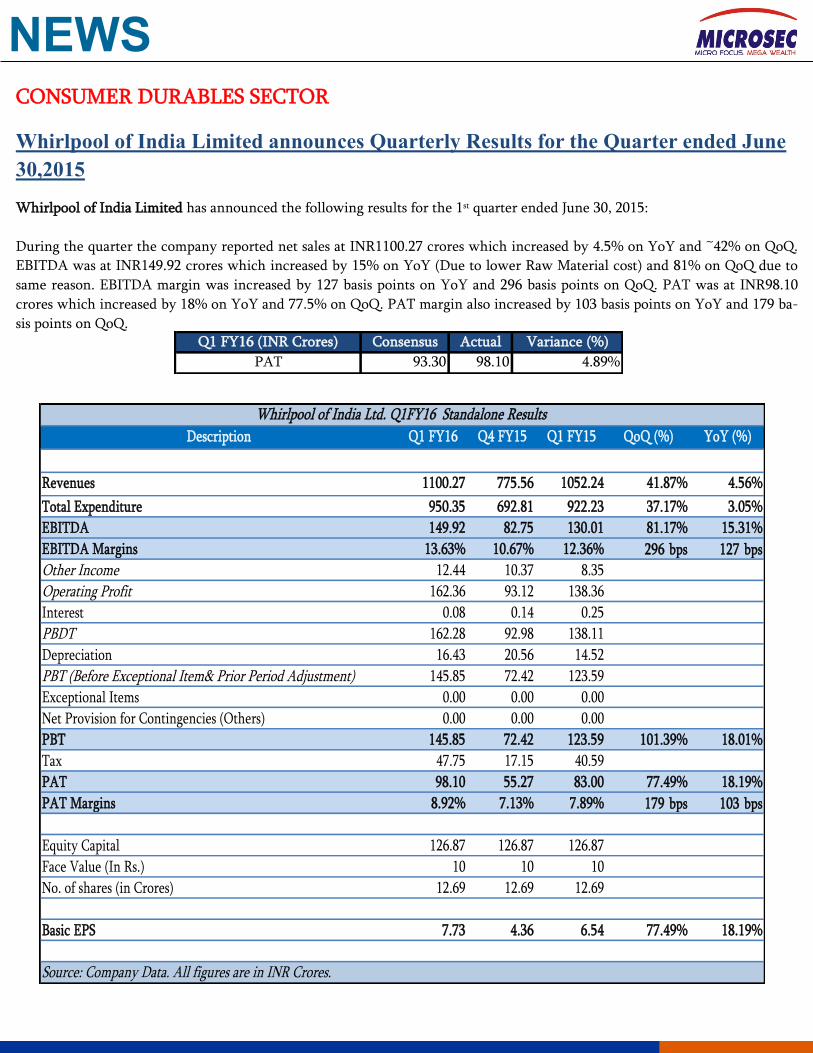
CONSUMER DURABLES SECTOR
Whirlpool of India Limited announces Quarterly Results for the Quarter ended June
30,2015
Whirlpool of India Limited has announced the following results for the 1st quarter ended June 30, 2015:
During the quarter the company reported net sales at INR1100.27 crores which increased by 4.5% on YoY and ~42% on QoQ.
EBITDA was at INR149.92 crores which increased by 15% on YoY (Due to lower Raw Material cost) and 81% on QoQ due to
same reason. EBITDA margin was increased by 127 basis points on YoY and 296 basis points on QoQ. PAT was at INR98.10
crores which increased by 18% on YoY and 77.5% on QoQ. PAT margin also increased by 103 basis points on YoY and 179 ba-
sis points on QoQ. Q1 FY16 (INR Crores) Consensus Actual Variance (%)
PAT 93.30 98.10 4.89%
Description Q1 FY16 Q4 FY15 Q1 FY15 QoQ (%) YoY (%)
Revenues 1100.27 775.56 1052.24 41.87% 4.56%
Total Expenditure 950.35 692.81 922.23 37.17% 3.05%
EBITDA 149.92 82.75 130.01 81.17% 15.31%
EBITDA Margins 13.63% 10.67% 12.36% 296 bps 127 bps
Other Income 12.44 10.37 8.35
Operating Profit 162.36 93.12 138.36
Interest 0.08 0.14 0.25
PBDT 162.28 92.98 138.11
Depreciation 16.43 20.56 14.52
PBT (Before Exceptional Item& Prior Period Adjustment) 145.85 72.42 123.59
Exceptional Items 0.00 0.00 0.00
Net Provision for Contingencies (Others) 0.00 0.00 0.00
PBT 145.85 72.42 123.59 101.39% 18.01%
Tax 47.75 17.15 40.59
PAT 98.10 55.27 83.00 77.49% 18.19%
PAT Margins 8.92% 7.13% 7.89% 179 bps 103 bps
Equity Capital 126.87 126.87 126.87
Face Value (In Rs.) 10 10 10
No. of shares (in Crores) 12.69 12.69 12.69
Basic EPS 7.73 4.36 6.54 77.49% 18.19%
Source: Company Data. All figures are in INR Crores.
Whirlpool of India Ltd. Q1FY16 Standalone Results
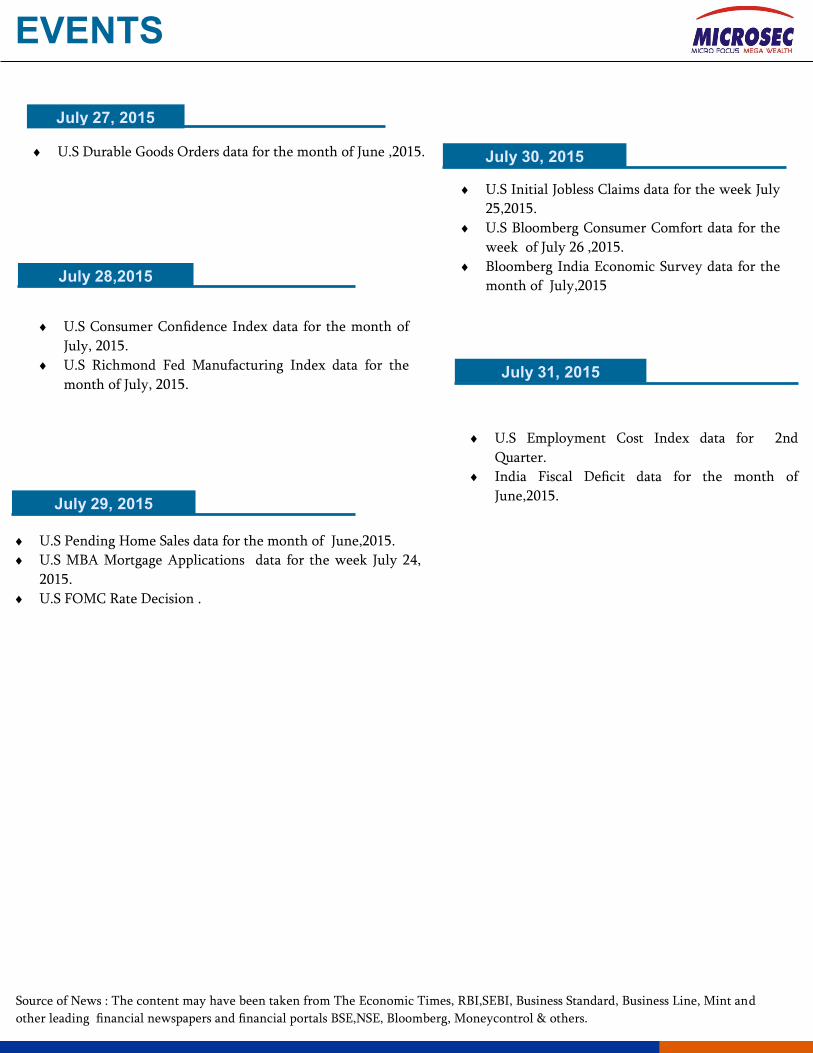
EVENTS
July 27, 2015
U.S Durable Goods Orders data for the month of June ,2015.
July 28,2015
July 29, 2015
July 30, 2015
U.S Consumer Confidence Index data for the month of
July, 2015.
U.S Richmond Fed Manufacturing Index data for the
month of July, 2015.
U.S Pending Home Sales data for the month of June,2015.
U.S MBA Mortgage Applications data for the week July 24,
2015.
U.S FOMC Rate Decision .
July 31, 2015
U.S Employment Cost Index data for 2nd
Quarter.
India Fiscal Deficit data for the month of
June,2015.
U.S Initial Jobless Claims data for the week July
25,2015.
U.S Bloomberg Consumer Comfort data for the
week of July 26 ,2015.
Bloomberg India Economic Survey data for the
month of July,2015
Source of News : The content may have been taken from The Economic Times, RBI,SEBI, Business Standard, Business Line, Mint and
other leading financial newspapers and financial portals BSE,NSE, Bloomberg, Moneycontrol & others.
DISCLAIMER
Disclaimer: Any document, including this report, which is prepared by the research team of Microsec Capital Ltd (Microsec) is circulated for purely information purpose only to the authorized recipient and should not be replicated or quoted or circulated to any person/corporate or legal entities in any form. This document/documents/reports/opinion should not be interpreted as an Investment / tax-ation/ legal advice. While the information contained in the report has been procured in good faith, from sources considered to be reliable, all statement/statements/opinion/opinions/view/views in the report may not be considered to be complete or accurate. Therefore, it should only be relied upon at the recipients own risk. Research/Equity analysts/ Economists/Editors/advisors/strategists of Microsec are often sought after for expressing their views on print/electronic/web media. The views expressed are purely based on their assumption/understanding on fundamental approach/technical and historic facts on the subject. The views expressed should not be construed as an offer to buy/sell or hold equity/commodity/currencies or their derivatives. The views/opinions expressed is for infor-mation purpose only, and may change due to underlying factors, related or unrelated or other market conditions and may or may not be updated. Neither Microsec Capital Ltd, subsidiaries of Microsec Group, nor its directors, employees, agents, representatives shall be liable for any damages whether direct or indirect, incidental, special or consequential including lost revenue or lost profits that may arise from or in connection with the use of the information/research reports/opinions expressed. Disclosure: Clients/associates of Microsec Group may be holding positions in equities or their derivates on which the research report is made or opinion is formed or views are expressed in print or electronic media. We ensure all compliance is ad-hered to with this reports/opinion or views. Analyst ownership of the stock – NIL Analyst’s dependent relatives’ ownership in the stock – NIL Analyst Certification: The matter related to the report has been taken from sources believed reliable and the views ex-pressed about the subject or issues in this report accurately reflect the personal views of the analyst/analysts. Microsec does not compensate partly or in full, directly or indirectly, related to specific recommendations or views expressed by the research ana-lysts/ market strategists. Our application for registration as required under SEBI (Research Analyst) Regulation 2014 is under process. Offices: Brokerage and Wealth Management 42A , Mittal Tower, Shivam Chambers, 1st Floor, 4th Floor 210, Nariman Point, 53, Syed Amir Ali Avenue, Kolkata-700 019, India Mumbai-400 021, India Tel.: 91 33 3051 2100, Fax: 91 33 30512020 Tel.: 91 22 2285 5544, Fax: 91 22 2285 5548 Email:[email protected] Website: www.microsec.in For queries related to the report, contact: Subhabrata Boral 03366512131