23 march 2006 preliminary results presentation 2005
TRANSCRIPT

23 March 200623 March 2006
Preliminary Results Presentation2005
Preliminary Results Presentation2005
Preliminary Results Presentation
• Overview Martin Barber
• Financials William Sunnucks
• Divisional reports
– Shopping Centres Ken Ford
– Retail Parks Andy Lewis-Pratt
– Leisure PY Gerbeau
– Germany Xavier Pullen
• Questions
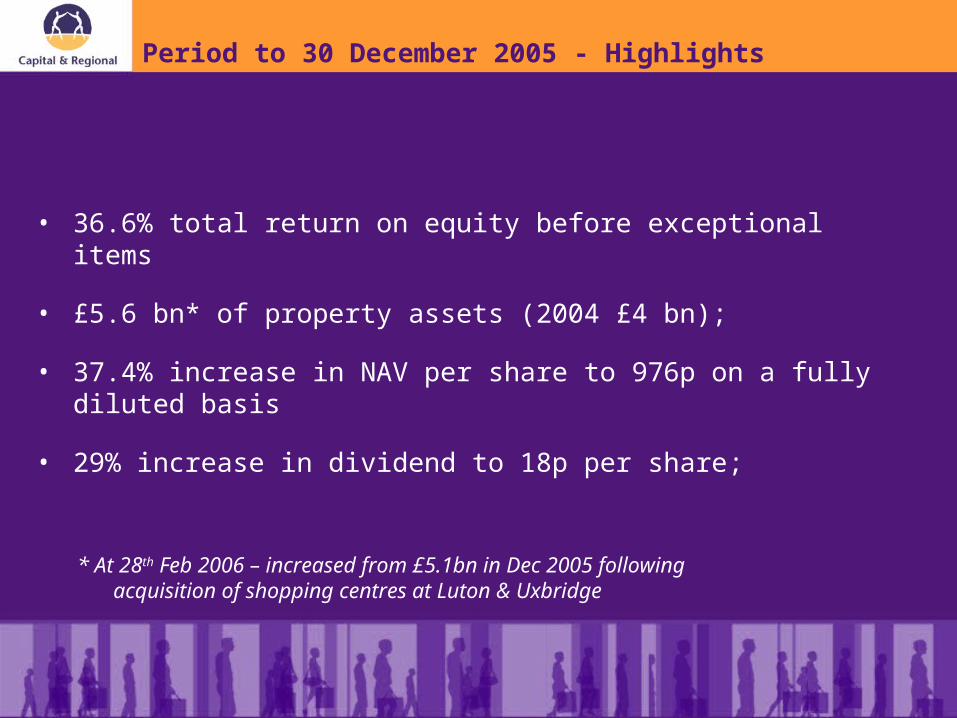
Period to 30 December 2005 - Highlights
• 36.6% total return on equity before exceptional items
• £5.6 bn* of property assets (2004 £4 bn);
• 37.4% increase in NAV per share to 976p on a fully diluted basis
• 29% increase in dividend to 18p per share;
* At 28th Feb 2006 – increased from £5.1bn in Dec 2005 following acquisition of shopping centres at Luton & Uxbridge
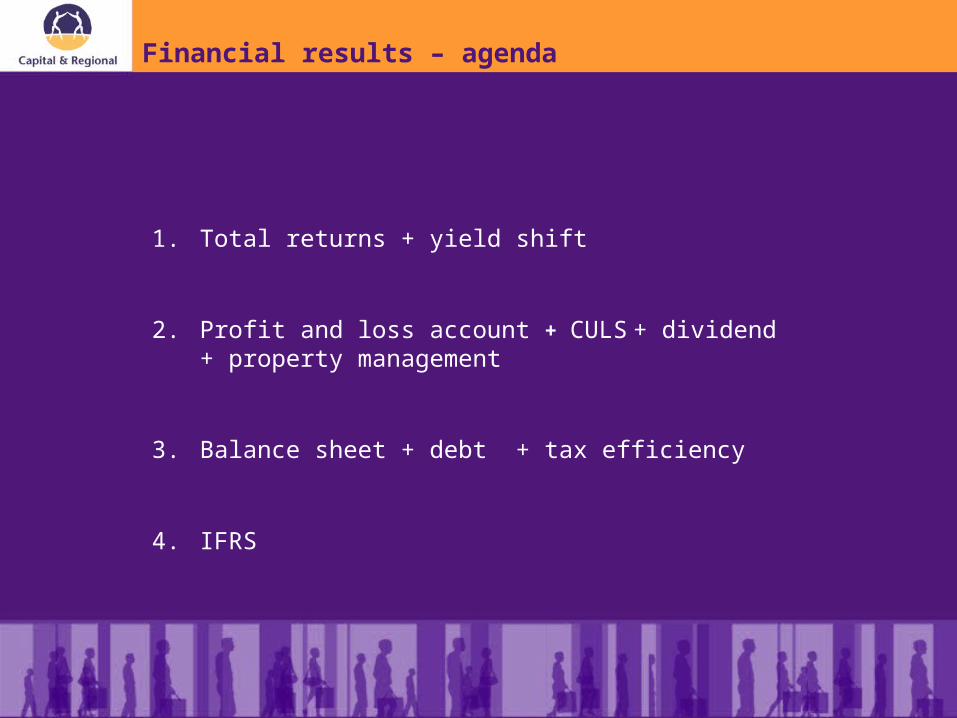
Financial results – agenda
1. Total returns + yield shift
2. Profit and loss account + CULS + dividend + property management
3. Balance sheet + debt + tax efficiency
4. IFRS
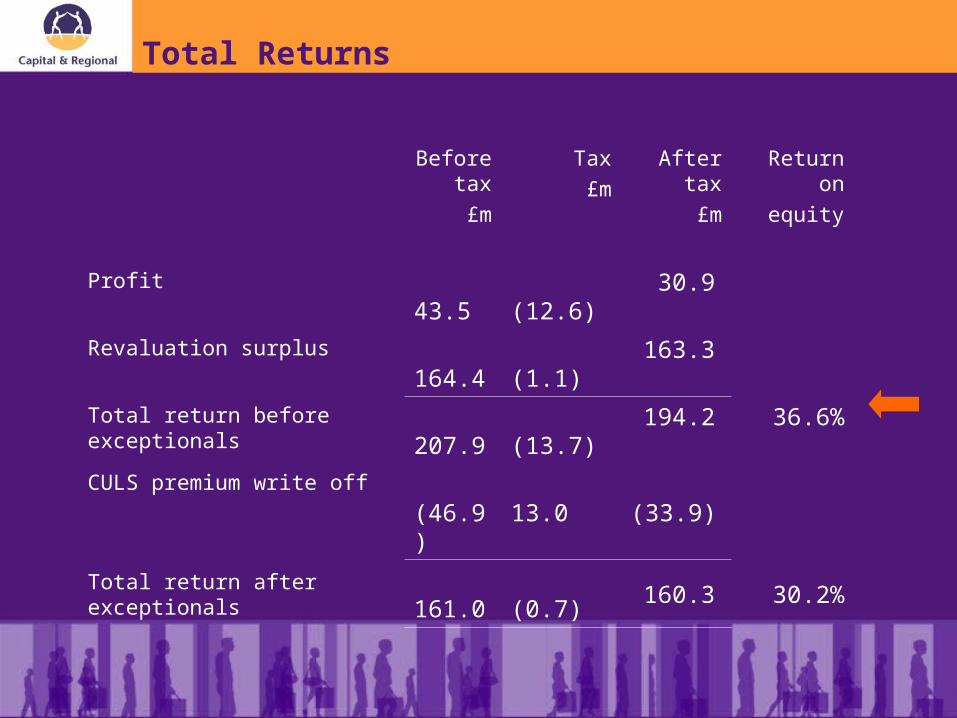
Total Returns
Before tax
£m
Tax
£m
After tax
£m
Return on
equity
Profit 43.5(12.6)
30.9
Revaluation surplus 164.4(1.1)
163.3
Total return before exceptionals 207.9(13.7)
194.2 36.6%
CULS premium write off
(46.9)13.0 (33.9)
Total return after exceptionals 161.0(0.7)
160.3 30.2%
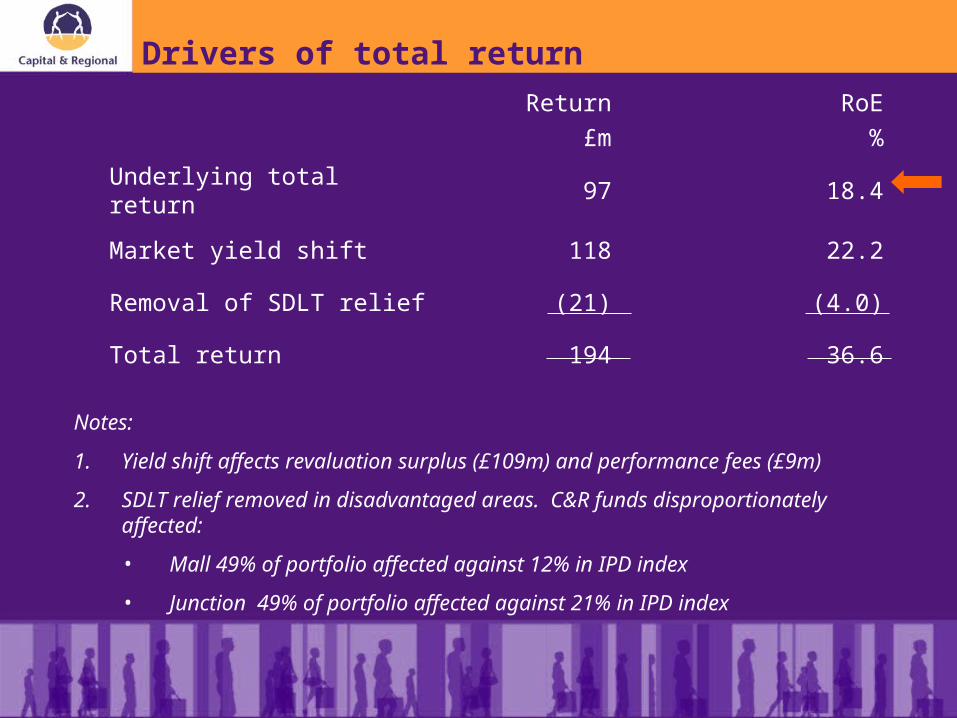
Drivers of total return
Notes:
1. Yield shift affects revaluation surplus (£109m) and performance fees (£9m)
2. SDLT relief removed in disadvantaged areas. C&R funds disproportionately affected:
• Mall 49% of portfolio affected against 12% in IPD index
• Junction 49% of portfolio affected against 21% in IPD index
Return
£m
RoE
%
Underlying total return 97 18.4
Market yield shift 118 22.2
Removal of SDLT relief (21) (4.0)
Total return 194 36.6
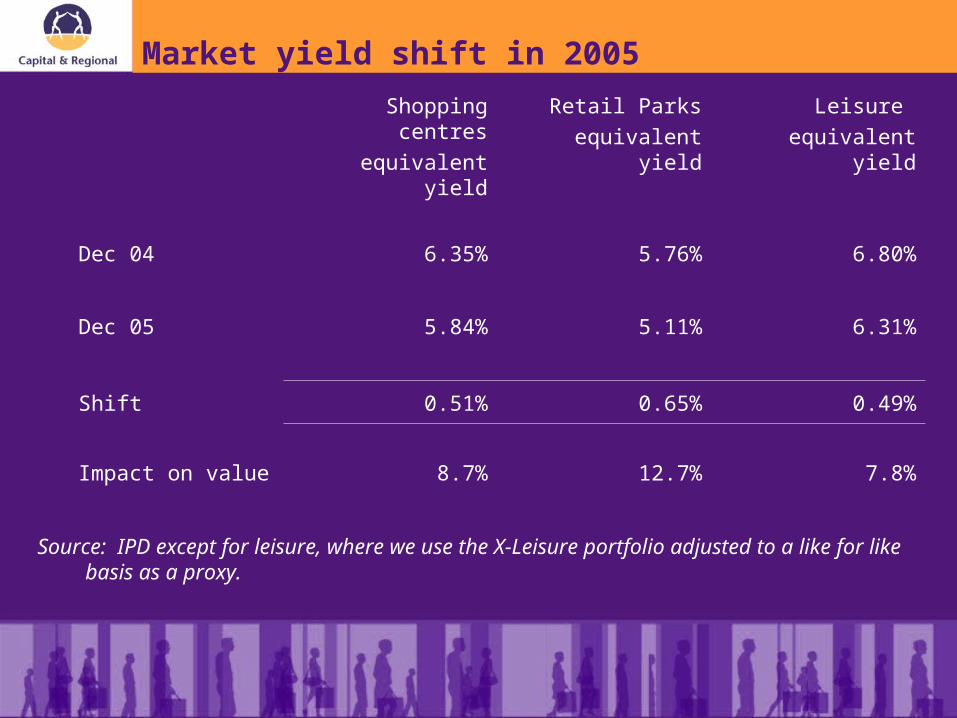
Market yield shift in 2005
Source: IPD except for leisure, where we use the X-Leisure portfolio adjusted to a like for like basis as a proxy.
Shopping centres
equivalent yield
Retail Parks
equivalent yield
Leisure
equivalent yield
Dec 04 6.35% 5.76% 6.80%
Dec 05 5.84% 5.11% 6.31%
Shift 0.51% 0.65% 0.49%
Impact on value 8.7% 12.7% 7.8%

Revaluation Uplifts – C&R share
Revaluation surplus
£m
Mall 58.8
Junction 58.3
X-Leisure 6.1
Swansea 17.1
Xscapes 11.3
Gt Northern 9.6
Germany 5.8
Other (2.6)
Total 164.4
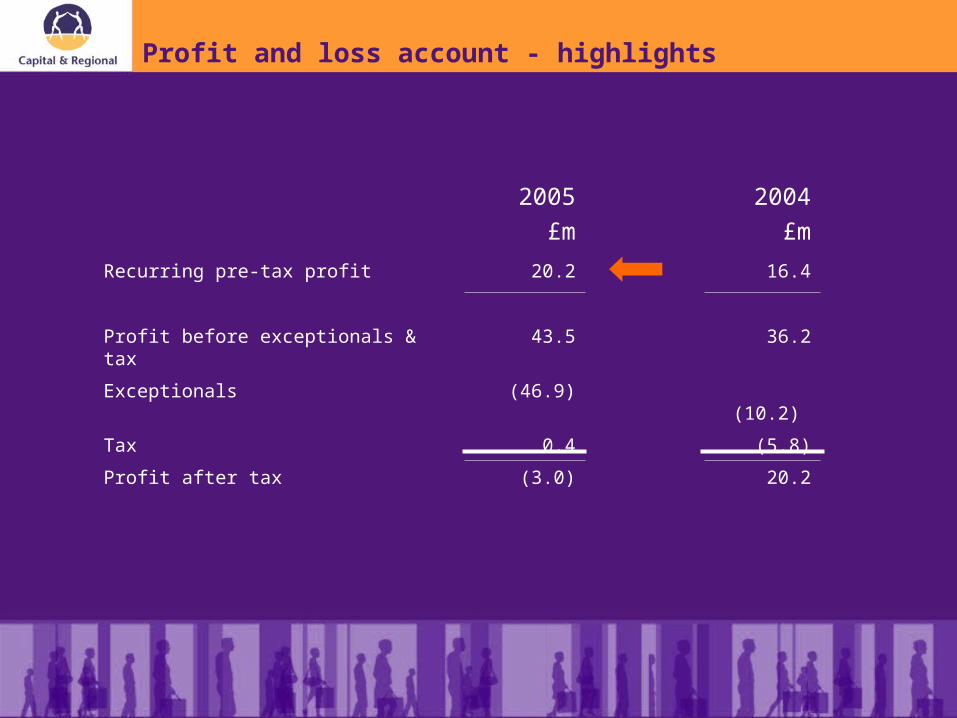
Profit and loss account - highlights
2005
£m
2004
£m
Recurring pre-tax profit 20.2 16.4
Profit before exceptionals & tax 43.5 36.2
Exceptionals (46.9) (10.2)
Tax 0.4 (5.8)
Profit after tax (3.0) 20.2
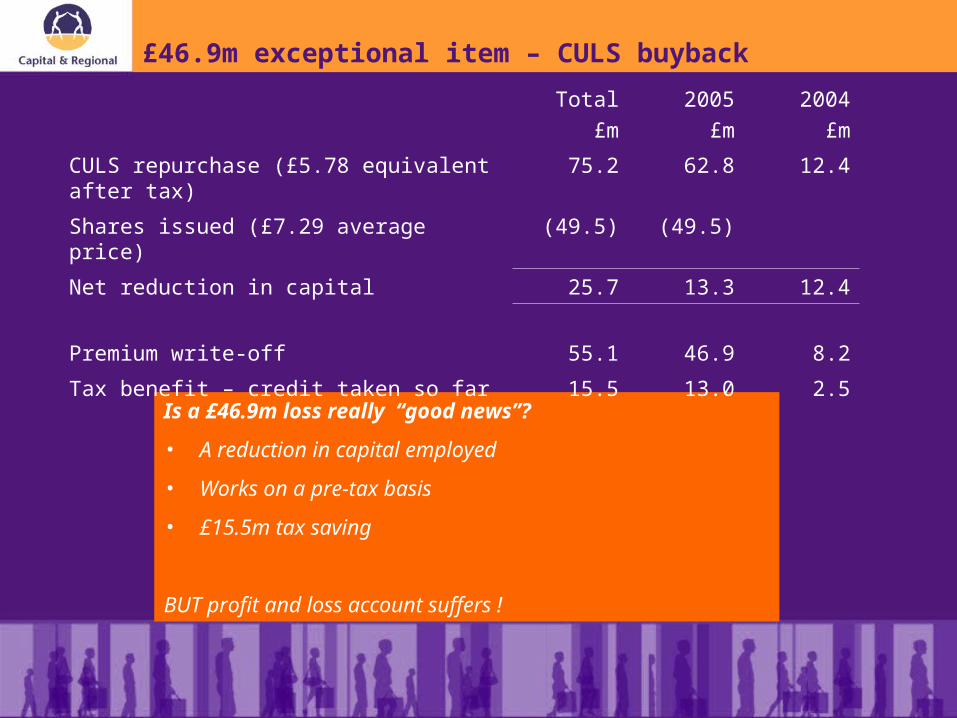
£46.9m exceptional item – CULS buyback
Is a £46.9m loss really “good news”?
• A reduction in capital employed
• Works on a pre-tax basis
• £15.5m tax saving
BUT profit and loss account suffers !
Total
£m
2005
£m
2004
£m
CULS repurchase (£5.78 equivalent after tax) 75.2 62.8 12.4
Shares issued (£7.29 average price) (49.5) (49.5)
Net reduction in capital 25.7 13.3 12.4
Premium write-off 55.1 46.9 8.2
Tax benefit – credit taken so far 15.5 13.0 2.5

Recurring profits and dividends2005 2004
£m £m
Net rental income – our share 55.4 47.1
Management fees 22.8 19.3
Snozone profit 1.8 1.4
Fixed management expense (17.1) (14.9)
Interest expense (42.7) (34.5)
Recurring profit before tax 20.2 16.4
Dividend 12.5m 9.0m
Coverage by recurring profit before tax 1.6x 1.8x
Coverage by profit after tax (before exceptionals) 2.5x 3.4x
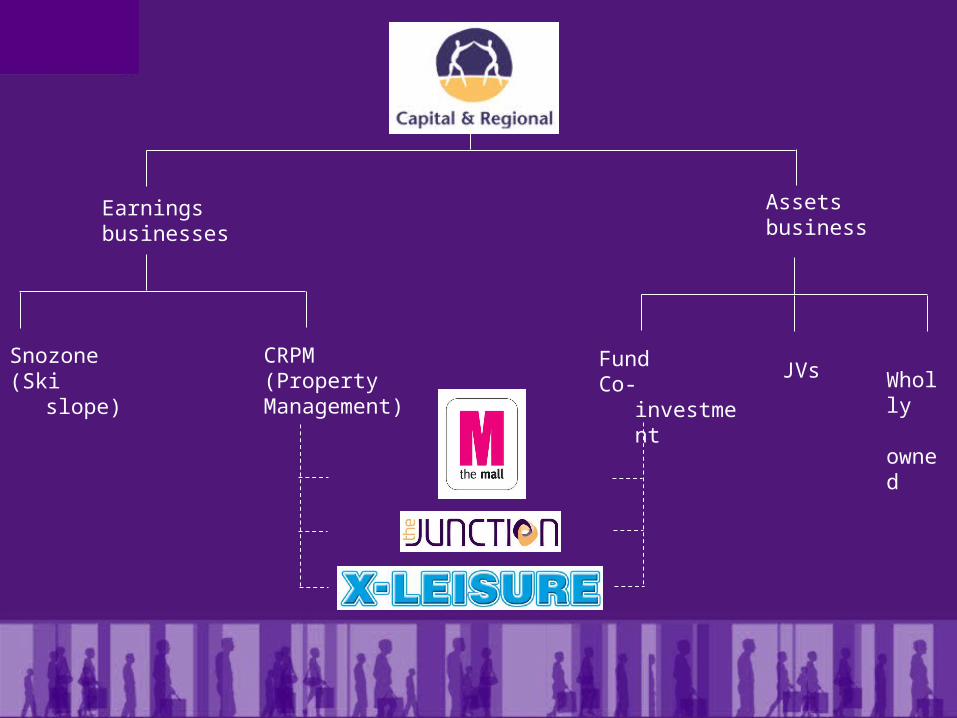
Earningsbusinesses
Assets business
Snozone(Ski slope)
CRPM(PropertyManagement)
FundCo-investment
JVs Wholly owned
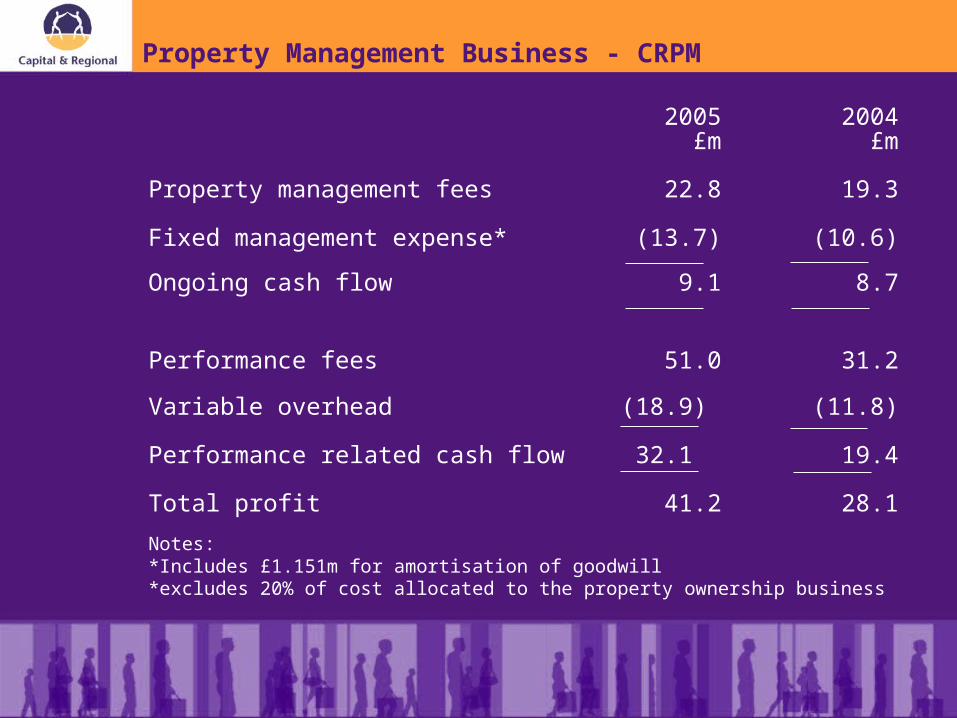
Property Management Business - CRPM
2005 2004£m £m
Property management fees 22.8 19.3
Fixed management expense* (13.7) (10.6)
Ongoing cash flow 9.1 8.7
Performance fees 51.0 31.2
Variable overhead (18.9) (11.8)
Performance related cash flow 32.1 19.4
Total profit 41.2 28.1
Notes:*Includes £1.151m for amortisation of goodwill*excludes 20% of cost allocated to the property ownership business
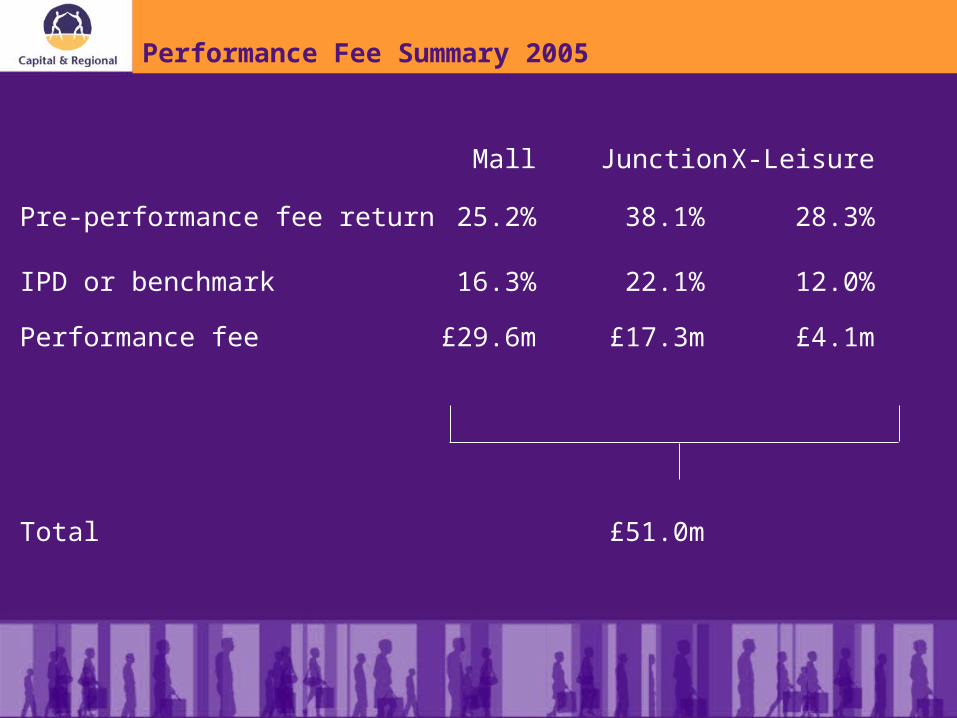
Mall Junction X-Leisure
Pre-performance fee return 25.2% 38.1% 28.3%
IPD or benchmark 16.3% 22.1% 12.0%
Performance fee £29.6m £17.3m £4.1m
Total £51.0m
Performance Fee Summary 2005
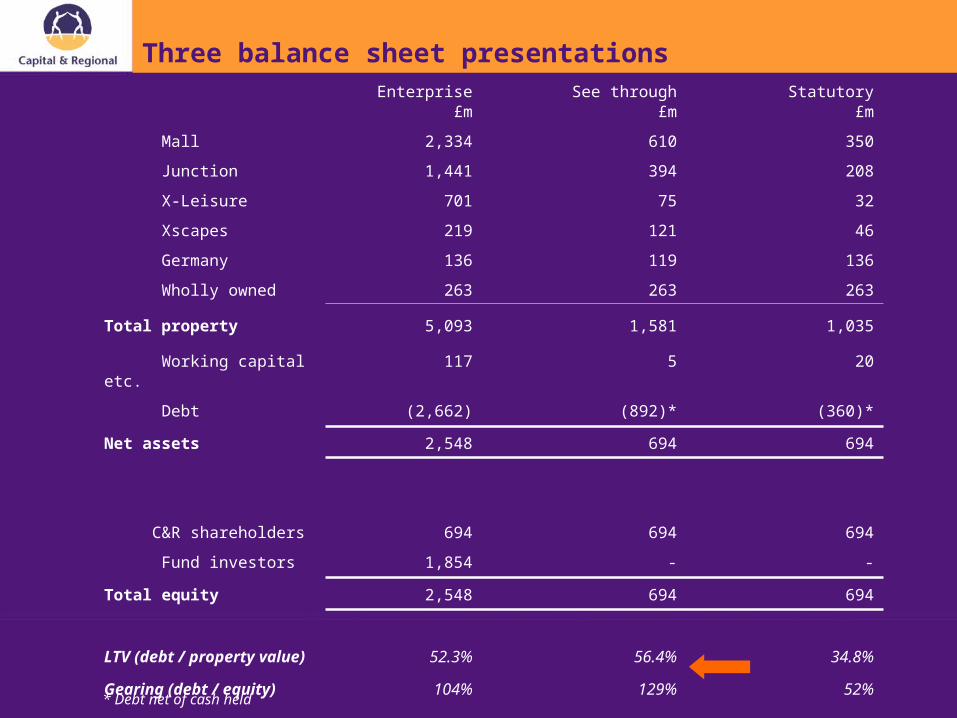
Three balance sheet presentationsEnterprise
£mSee through
£mStatutory
£m
Mall 2,334 610 350
Junction 1,441 394 208
X-Leisure 701 75 32
Xscapes 219 121 46
Germany 136 119 136
Wholly owned 263 263 263
Total property 5,093 1,581 1,035
Working capital etc. 117 5 20
Debt (2,662) (892)* (360)*
Net assets 2,548 694 694
C&R shareholders 694 694 694
Fund investors 1,854 - -
Total equity 2,548 694 694
LTV (debt / property value) 52.3% 56.4% 34.8%
Gearing (debt / equity) 104% 129% 52%
* Debt net of cash held
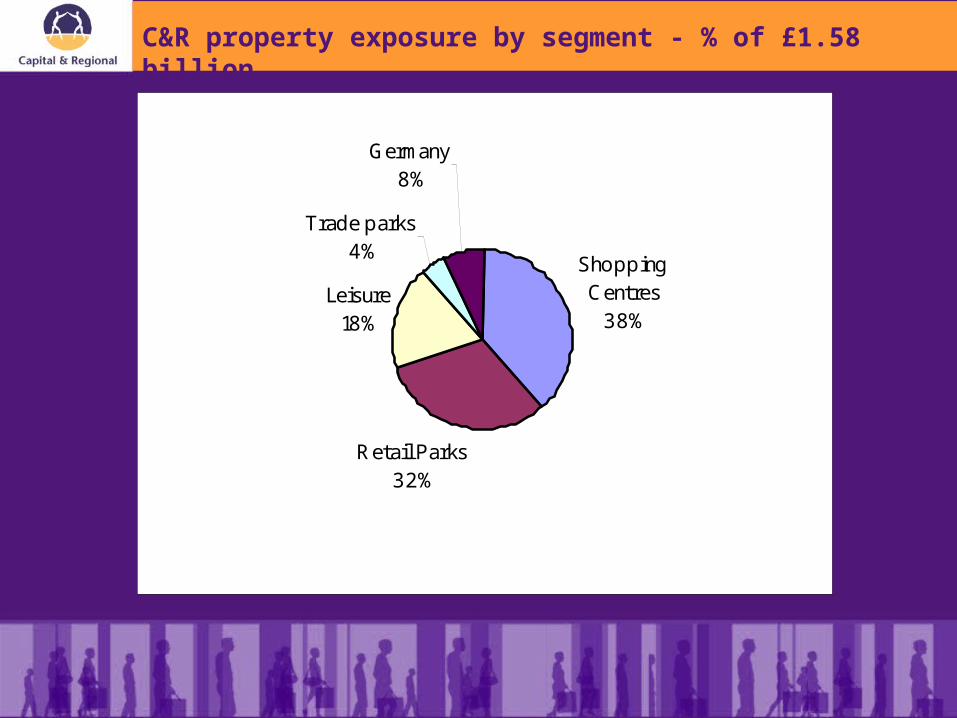
C&R property exposure by segment - % of £1.58 billion
Shopping Centres
38%
Retail Parks32%
Leisure18%
Trade parks4%
Germany8%
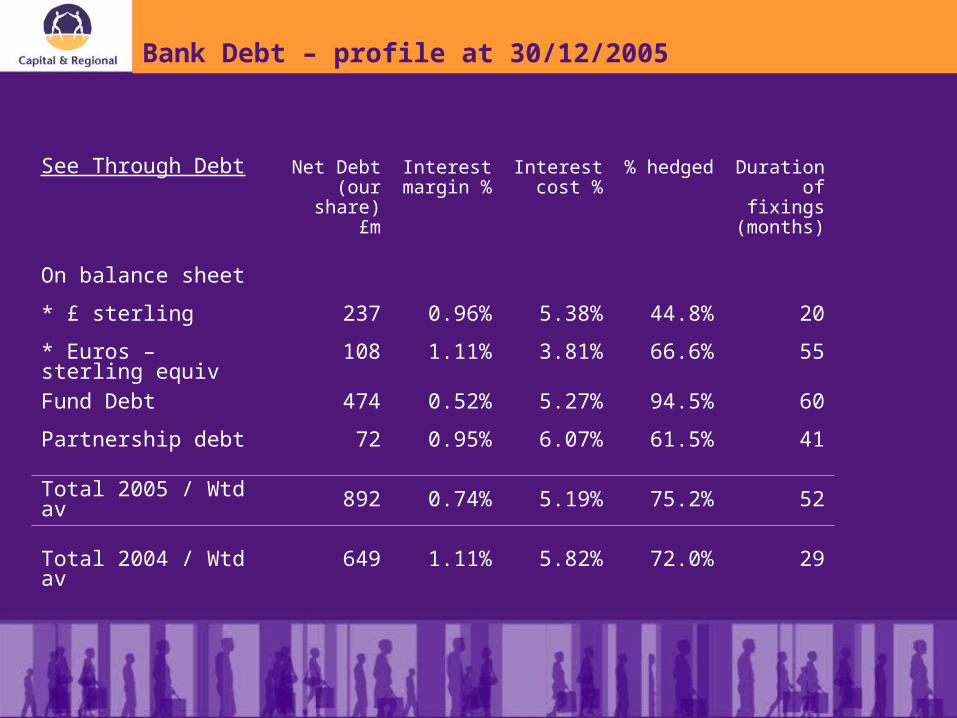
Bank Debt – profile at 30/12/2005
See Through Debt Net Debt(our share)
£m
Interest margin %
Interest cost %
% hedged Duration offixings
(months)
On balance sheet
* £ sterling 237 0.96% 5.38% 44.8% 20
* Euros – sterling equiv 108 1.11% 3.81% 66.6% 55
Fund Debt 474 0.52% 5.27% 94.5% 60
Partnership debt 72 0.95% 6.07% 61.5% 41
Total 2005 / Wtd av 892 0.74% 5.19% 75.2% 52
Total 2004 / Wtd av 649 1.11% 5.82% 72.0% 29
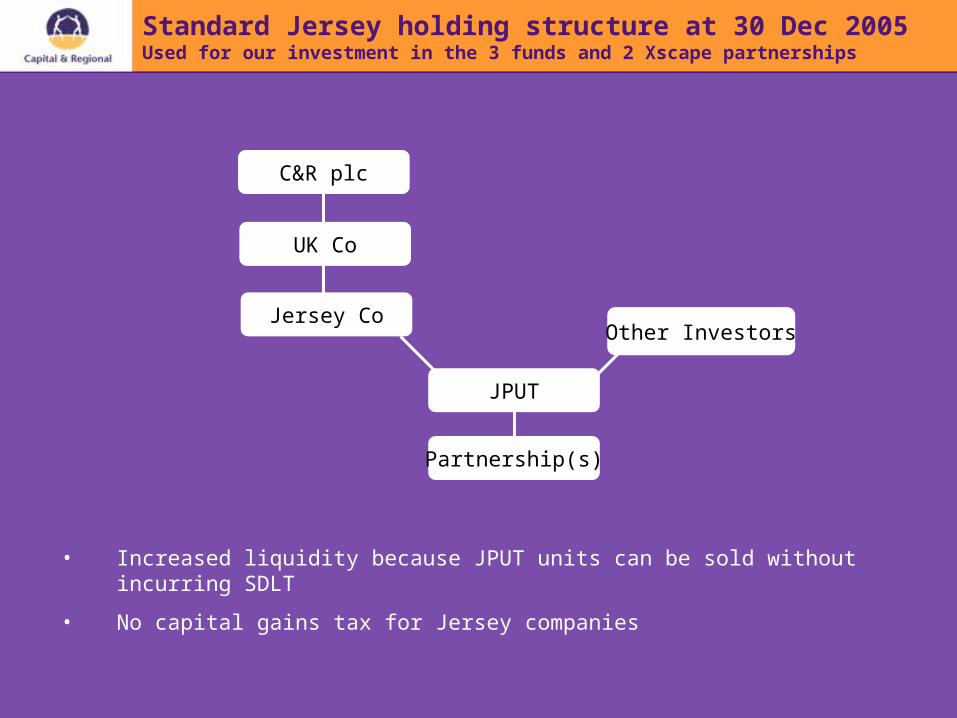
Standard Jersey holding structure at 30 Dec 2005Used for our investment in the 3 funds and 2 Xscape partnerships
Other Investors
• Increased liquidity because JPUT units can be sold without incurring SDLT
• No capital gains tax for Jersey companies
Partnership(s)
C&R plc
JPUT
UK Co
Jersey Co
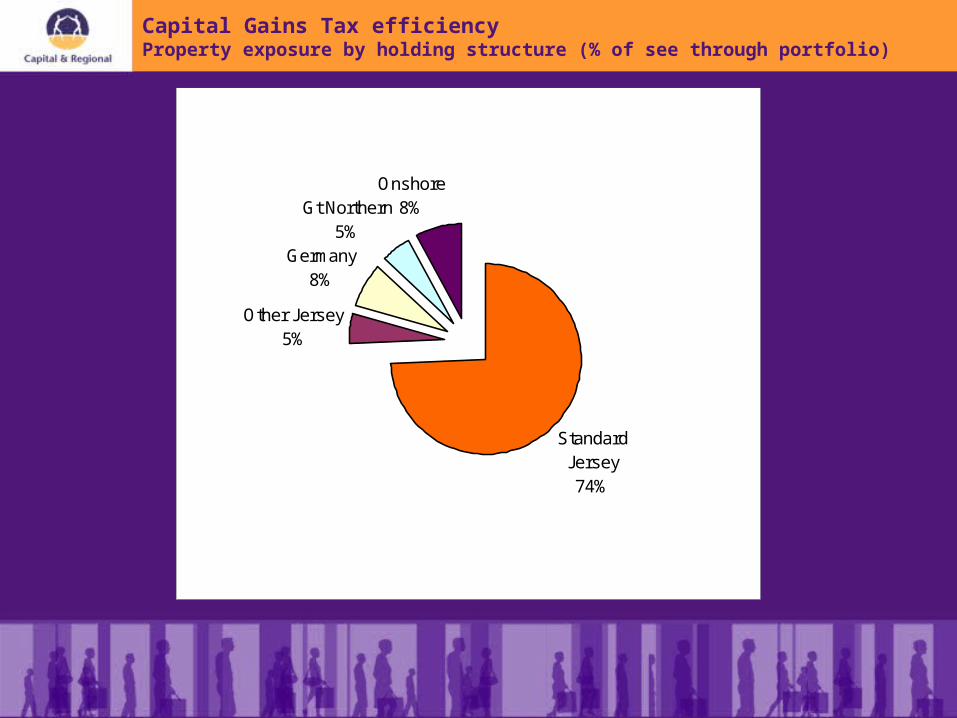
Capital Gains Tax efficiencyProperty exposure by holding structure (% of see through portfolio)
Standard Jersey74%
Other Jersey5%
Germany8%
Gt Northern5%
Onshore8%
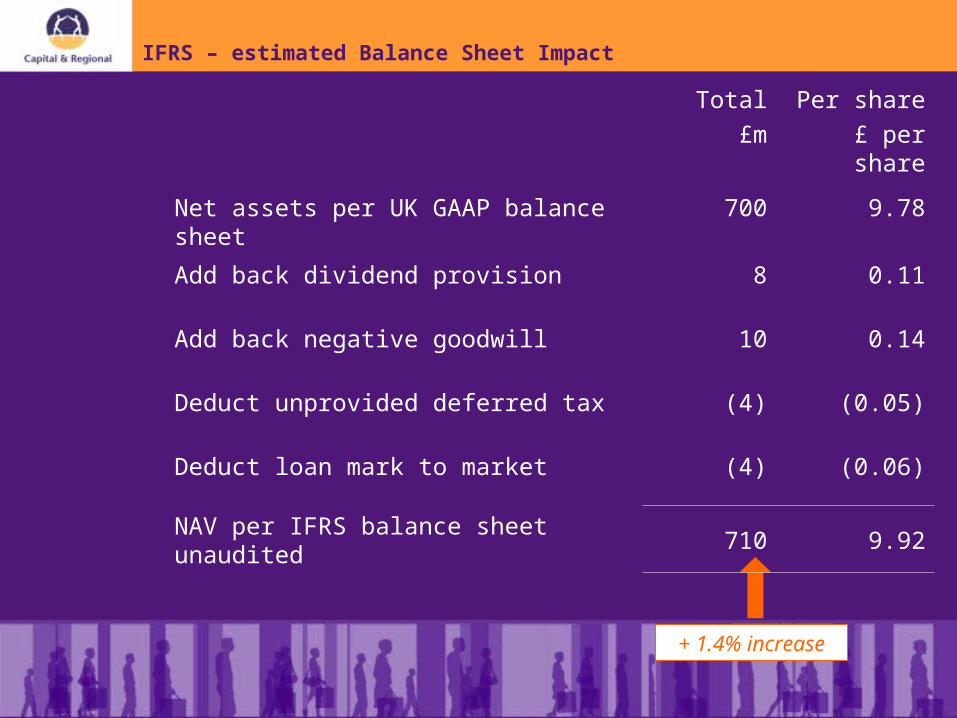
IFRS – estimated Balance Sheet Impact
+ 1.4% increase
Total
£m
Per share
£ per share
Net assets per UK GAAP balance sheet 700 9.78
Add back dividend provision 8 0.11
Add back negative goodwill 10 0.14
Deduct unprovided deferred tax (4) (0.05)
Deduct loan mark to market (4) (0.06)
NAV per IFRS balance sheet unaudited 710 9.92
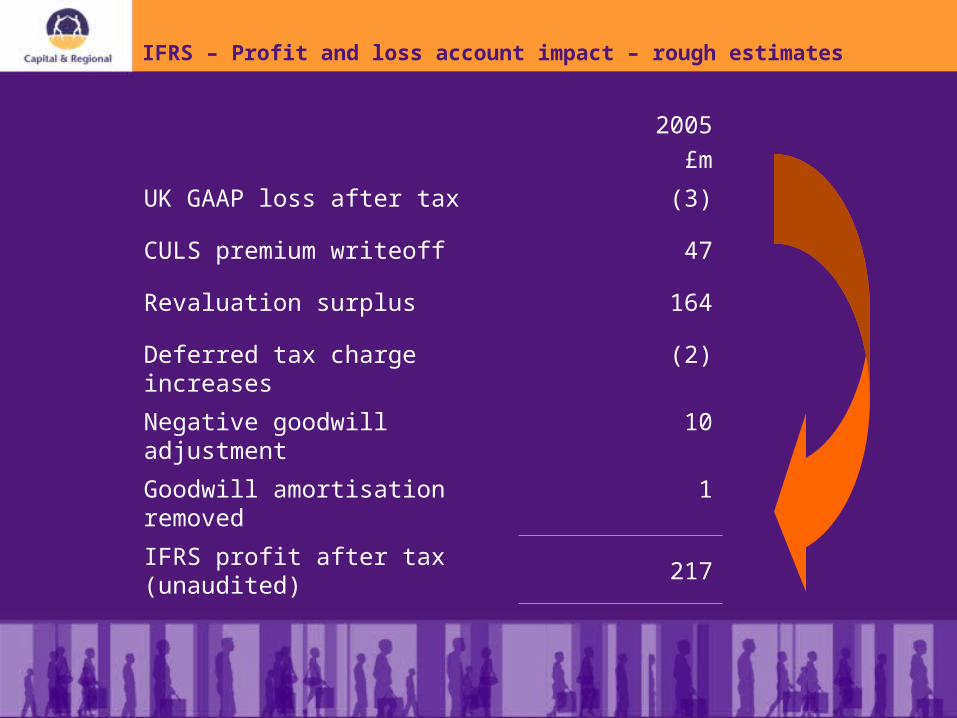
IFRS – Profit and loss account impact – rough estimates
2005
£m
UK GAAP loss after tax (3)
CULS premium writeoff 47
Revaluation surplus 164
Deferred tax charge increases (2)
Negative goodwill adjustment 10
Goodwill amortisation removed 1
IFRS profit after tax (unaudited) 217
Conclusion – Financials
Three key messages:
• It’s not just yield shift…….
• Valuable earnings businesses
• Increasingly tax efficient
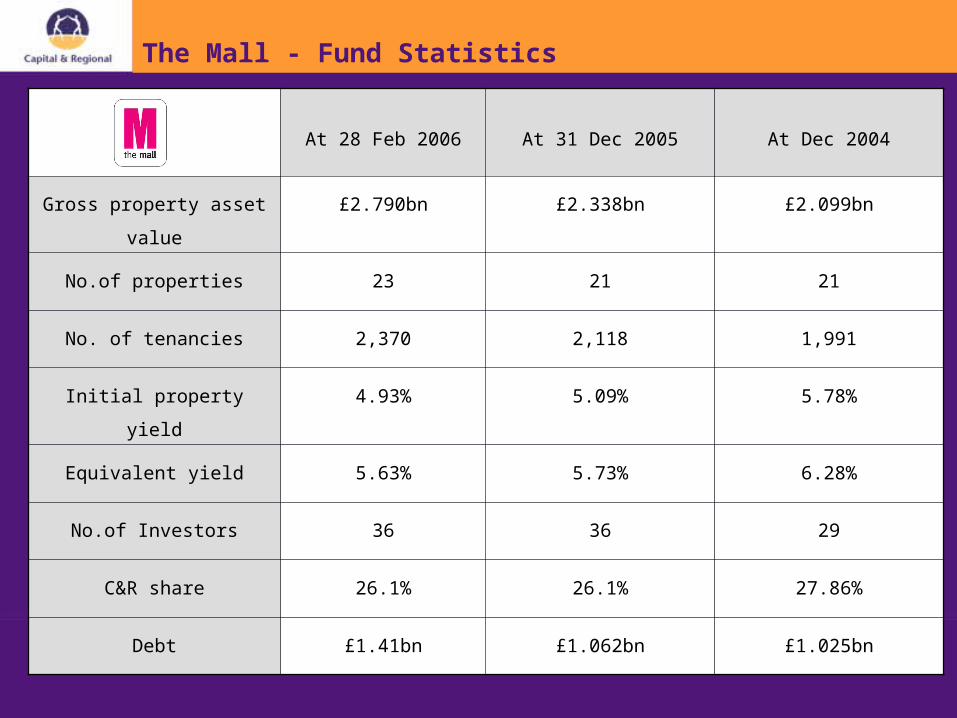
The Mall - Fund Statistics
At 28 Feb 2006 At 31 Dec 2005 At Dec 2004
Gross property asset value £2.790bn £2.338bn £2.099bn
No.of properties 23 21 21
No. of tenancies 2,370 2,118 1,991
Initial property yield 4.93% 5.09% 5.78%
Equivalent yield 5.63% 5.73% 6.28%
No.of Investors 36 36 29
C&R share 26.1% 26.1% 27.86%
Debt £1.41bn £1.062bn £1.025bn
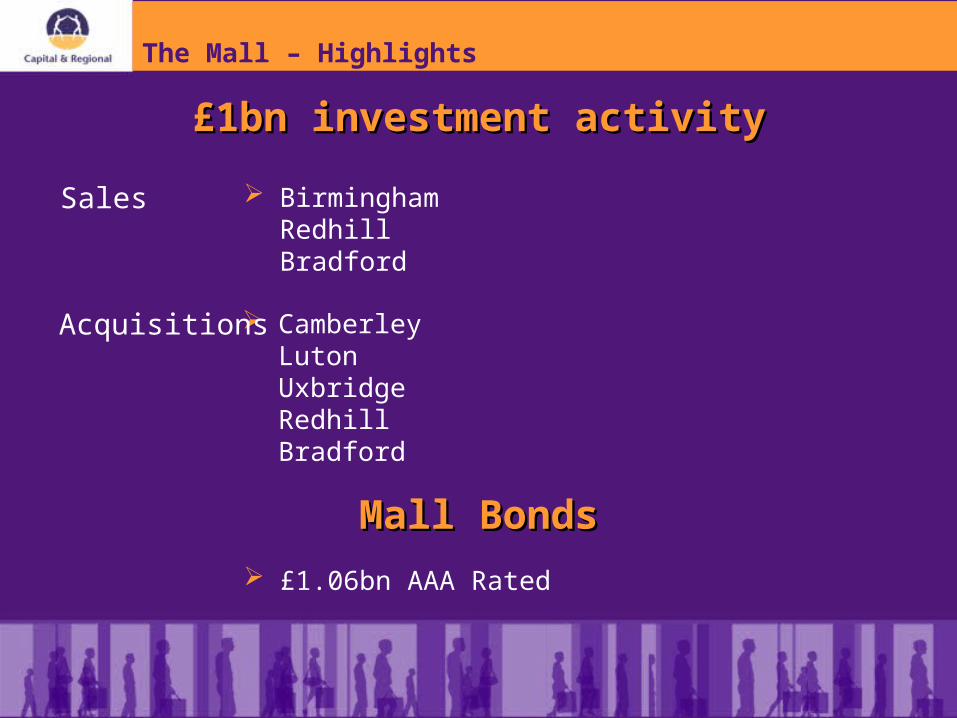
The Mall – Highlights
BirminghamRedhillBradford
CamberleyLutonUxbridgeRedhillBradford
£1.06bn AAA Rated
Sales
Acquisitions
£1bn investment activity£1bn investment activity
Mall BondsMall Bonds
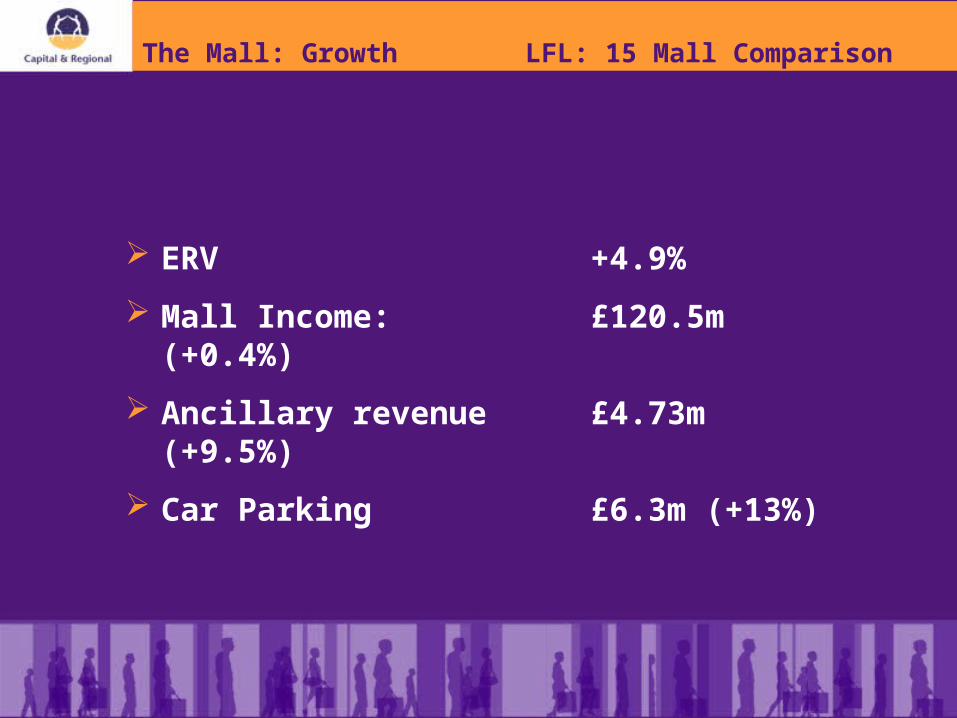
The Mall: Growth LFL: 15 Mall Comparison
ERV +4.9%
Mall Income: £120.5m (+0.4%)
Ancillary revenue £4.73m (+9.5%)
Car Parking £6.3m (+13%)
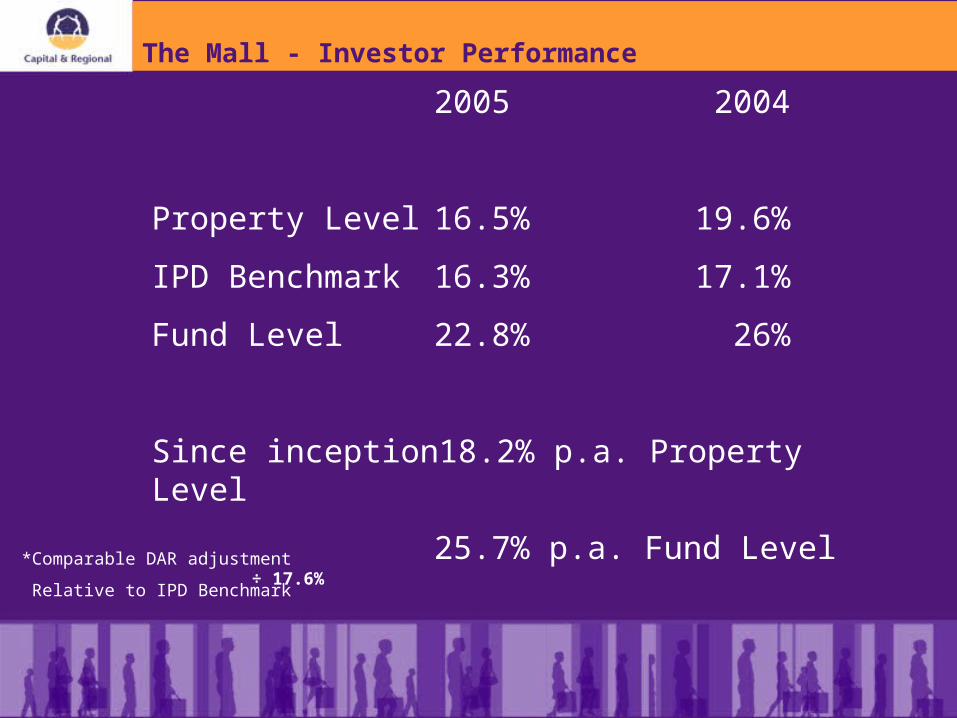
The Mall - Investor Performance
2005 2004
Property Level 16.5% 19.6%
IPD Benchmark 16.3% 17.1%
Fund Level 22.8% 26%
Since inception 18.2% p.a. Property Level
25.7% p.a. Fund Level*Comparable DAR adjustment
Relative to IPD Benchmark÷ 17.6%
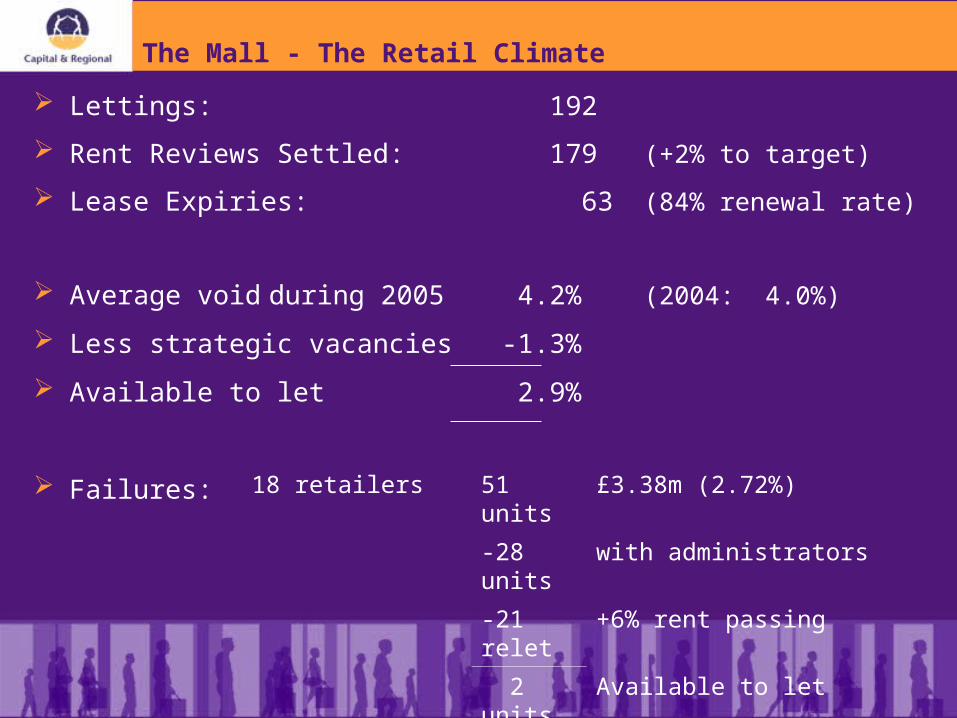
The Mall - The Retail Climate
Lettings: 192
Rent Reviews Settled: 179 (+2% to target)
Lease Expiries: 63 (84% renewal rate)
Average void during 2005 4.2% (2004: 4.0%)
Less strategic vacancies -1.3%
Available to let 2.9%
Failures: 18 retailers 51 units £3.38m (2.72%)
-28 units with administrators
-21 relet +6% rent passing
2 units Available to let
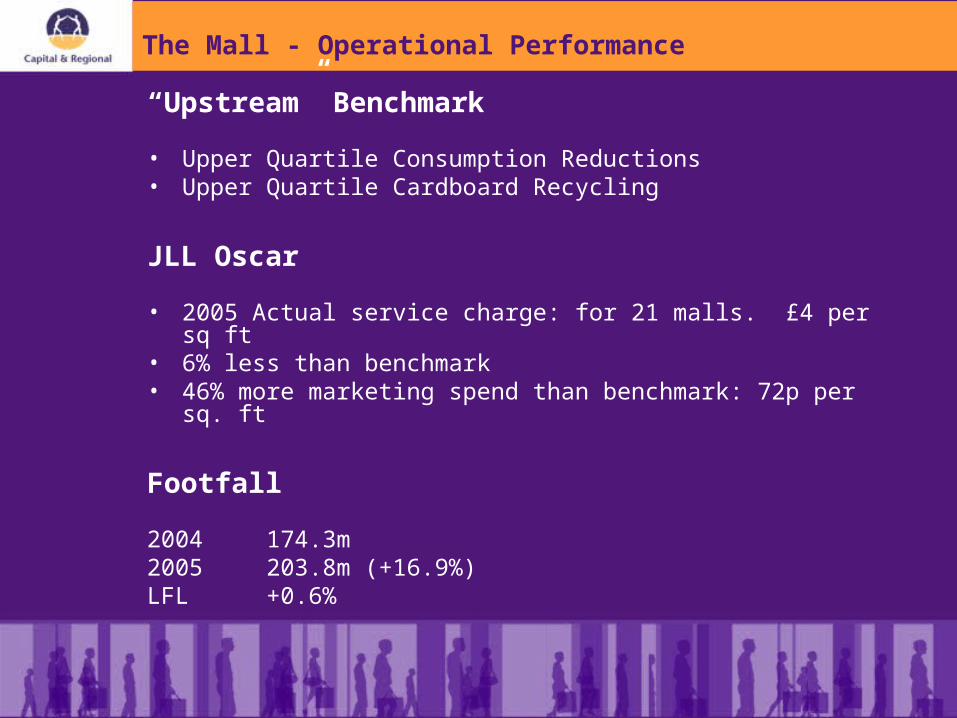
The Mall - Operational Performance
“Upstream” Benchmark
• Upper Quartile Consumption Reductions• Upper Quartile Cardboard Recycling
JLL Oscar
• 2005 Actual service charge: for 21 malls. £4 per sq ft• 6% less than benchmark• 46% more marketing spend than benchmark: 72p per sq. ft
Footfall
2004 174.3m2005 203.8m (+16.9%)LFL +0.6%
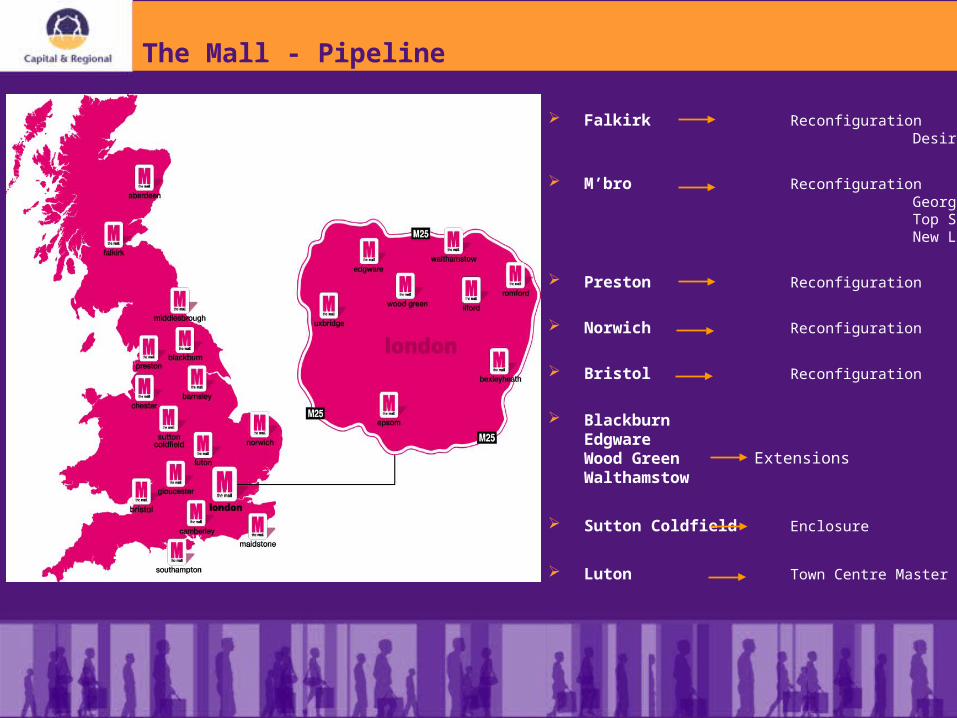
The Mall - Pipeline
Falkirk Reconfiguration Debenhams Desire
M’bro Reconfiguration H&MGeorge Top ShopNew Look
Preston Reconfiguration New Look
Norwich Reconfiguration TK Maxx
Bristol Reconfiguration TK Maxx
BlackburnEdgwareWood GreenWalthamstow
Sutton Coldfield Enclosure
Luton Town Centre Master Plan
Extensions

Retail Park and Trade Park Activities
• The Junction Fund
• Morfa Shopping Park, Swansea
• Capital Retail Park, Cardiff
• Trade Parks Portfolio
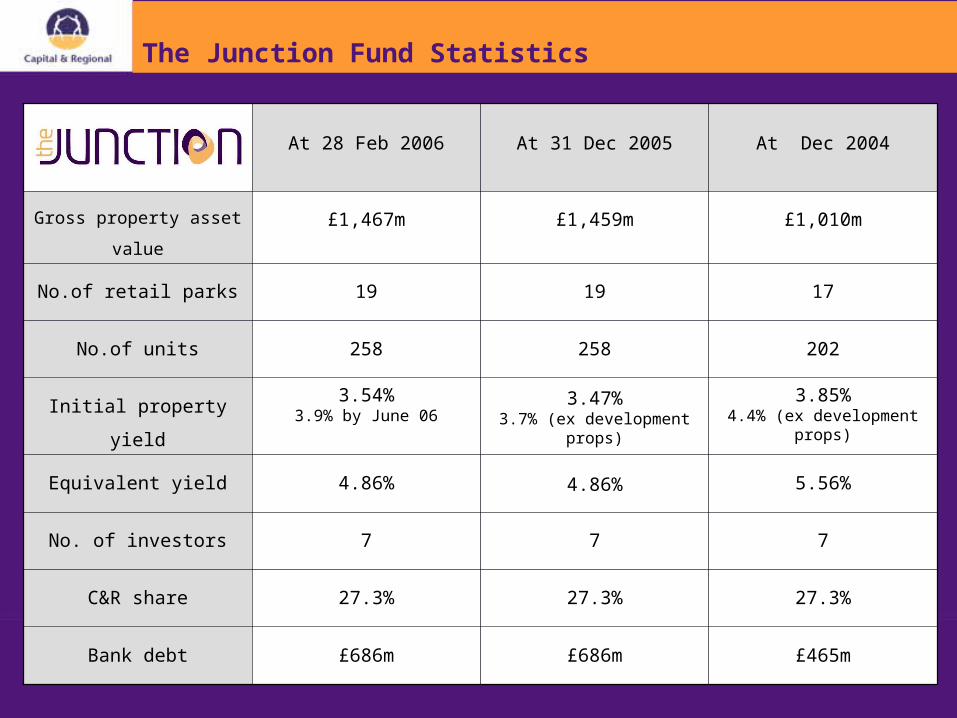
The Junction Fund Statistics
At 28 Feb 2006 At 31 Dec 2005 At Dec 2004
Gross property asset value £1,467m £1,459m £1,010m
No.of retail parks 19 19 17
No.of units 258 258 202
Initial property yield3.54%
3.9% by June 063.47%
3.7% (ex development props)
3.85%4.4% (ex development props)
Equivalent yield 4.86% 4.86% 5.56%
No. of investors 7 7 7
C&R share 27.3% 27.3% 27.3%
Bank debt £686m £686m £465m
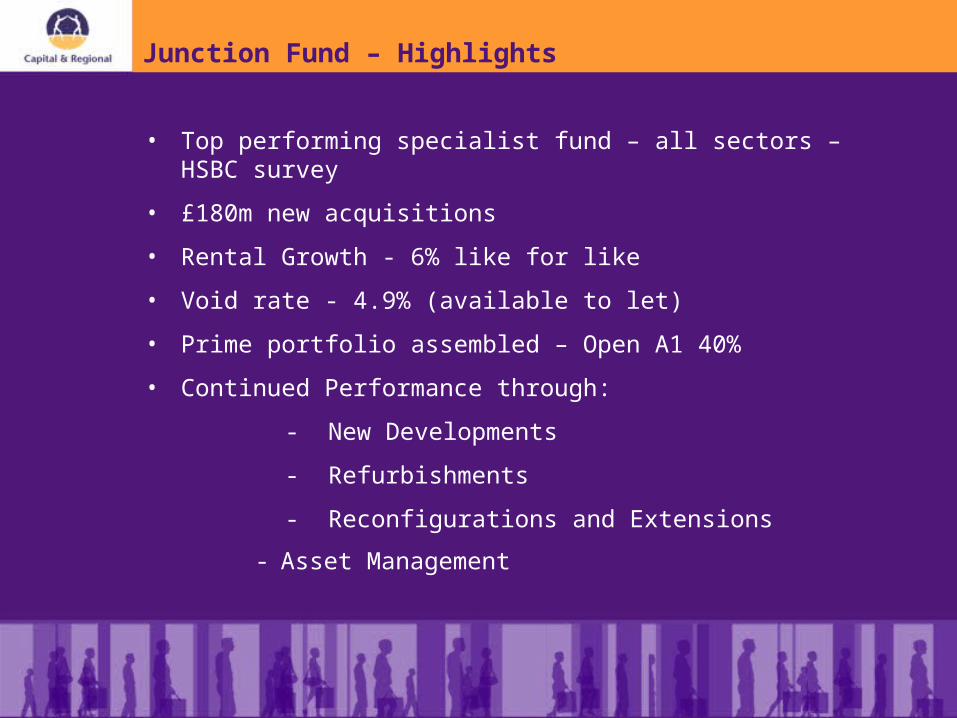
Junction Fund – Highlights
• Top performing specialist fund – all sectors – HSBC survey
• £180m new acquisitions
• Rental Growth - 6% like for like
• Void rate - 4.9% (available to let)
• Prime portfolio assembled – Open A1 40%
• Continued Performance through:
- New Developments
- Refurbishments
- Reconfigurations and Extensions
- Asset Management
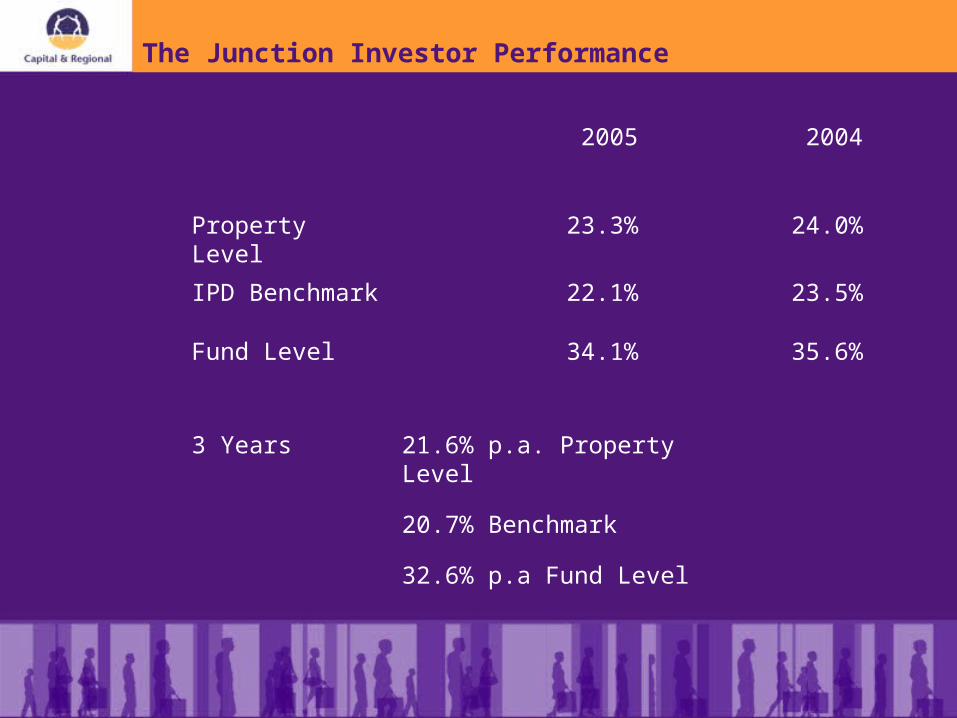
2005 2004
Property Level 23.3% 24.0%
IPD Benchmark 22.1% 23.5%
Fund Level 34.1% 35.6%
3 Years 21.6% p.a. Property Level
20.7% Benchmark
32.6% p.a Fund Level
The Junction Investor Performance
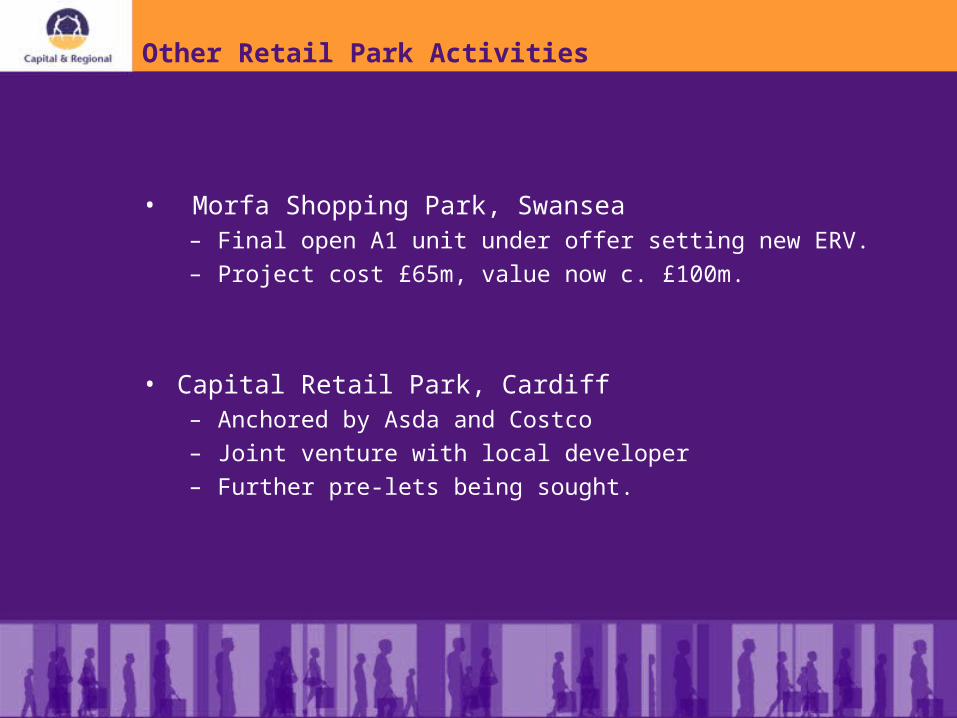
Other Retail Park Activities
• Morfa Shopping Park, Swansea– Final open A1 unit under offer setting new ERV.
– Project cost £65m, value now c. £100m.
• Capital Retail Park, Cardiff– Anchored by Asda and Costco
– Joint venture with local developer
– Further pre-lets being sought.

Trade Park Portfolio
So Why Trade Parks?
• Not industrial sheds but a retailing based operation.
• Tenants – supply builders, tradesmen and ancillary sales to public.
• Estimated 1000 trade parks across UK with a value of circa £5bn.
• Rapidly expanding unsophisticated and fragmented market.
• Over 100 national and regional occupiers of stature.
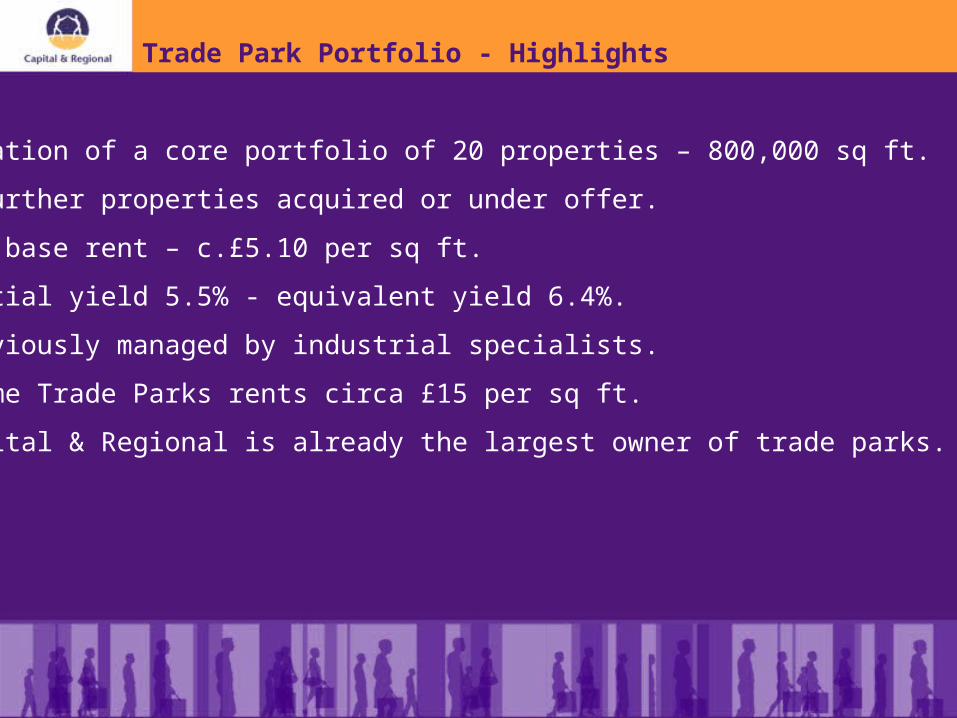
Trade Park Portfolio - Highlights
• Creation of a core portfolio of 20 properties – 800,000 sq ft.
• 4 further properties acquired or under offer.
• Low base rent – c.£5.10 per sq ft.
• Initial yield 5.5% - equivalent yield 6.4%.
• Previously managed by industrial specialists.
• Prime Trade Parks rents circa £15 per sq ft.
• Capital & Regional is already the largest owner of trade parks.

Trade Park Portfolio
Objectives• Grow the portfolio to £150-£200m within 12-18 months.• We bring more specialised management to the sector.• To create a branded portfolio• Outperformance through:
– Development– Refurbishment/Reconfiguration– Portfolio transactions– Increase un-expired terms
.
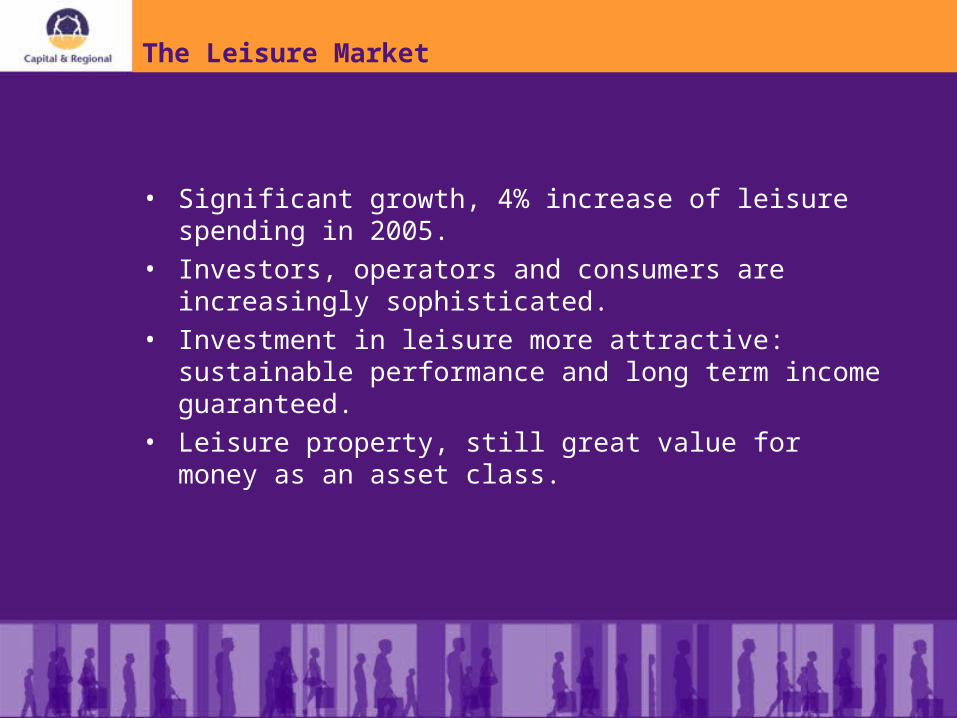
• Significant growth, 4% increase of leisure spending in 2005.• Investors, operators and consumers are increasingly
sophisticated.• Investment in leisure more attractive: sustainable
performance and long term income guaranteed.• Leisure property, still great value for money as an asset
class.
The Leisure Market

Leisure Activities
• X-Leisure Fund
• Xscape
• Other activities:
– Snozone Holdings
– Gt Northern
– Hemel Hempstead
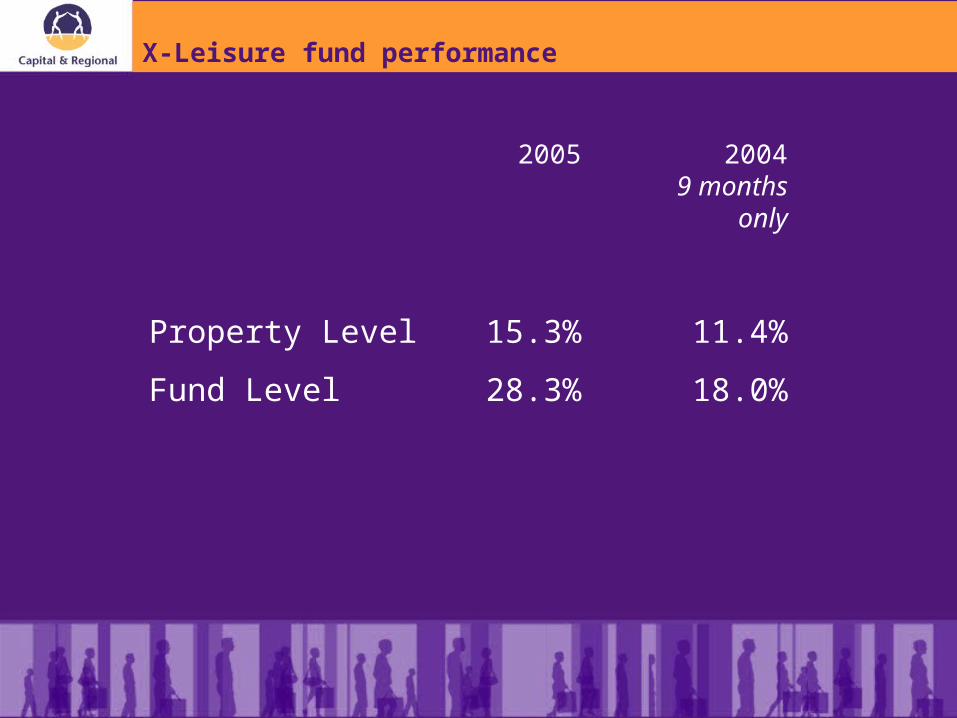
X-Leisure fund performance
2005 20049 months
only
Property Level 15.3% 11.4%
Fund Level 28.3% 18.0%
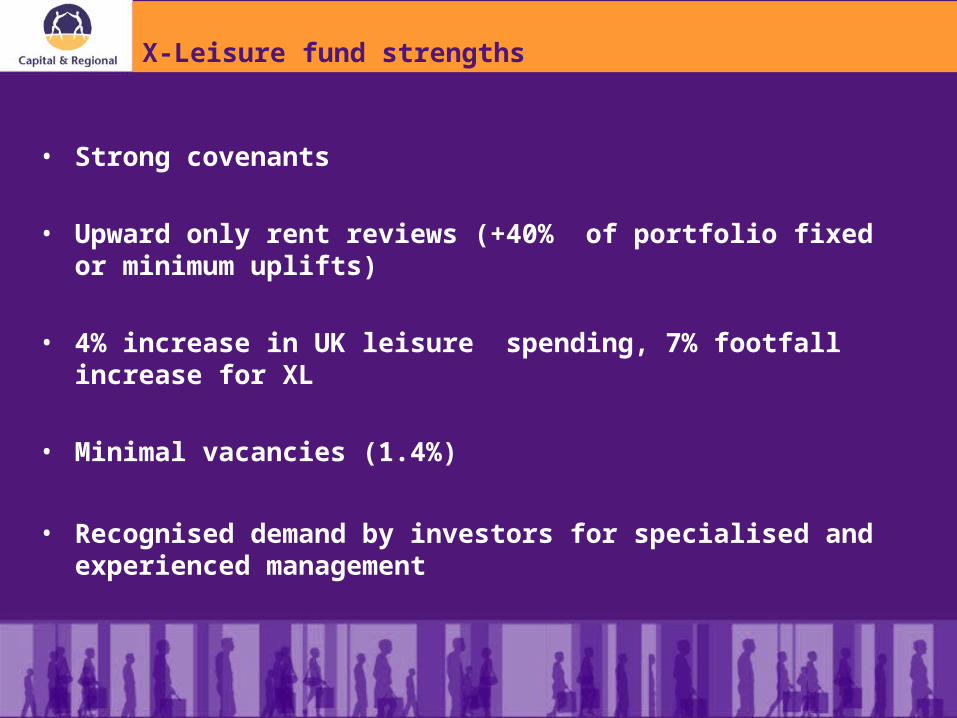
X-Leisure fund strengths
• Strong covenants
• Upward only rent reviews (+40% of portfolio fixed or minimum uplifts)
• 4% increase in UK leisure spending, 7% footfall increase for XL
• Minimal vacancies (1.4%)
• Recognised demand by investors for specialised and experienced management
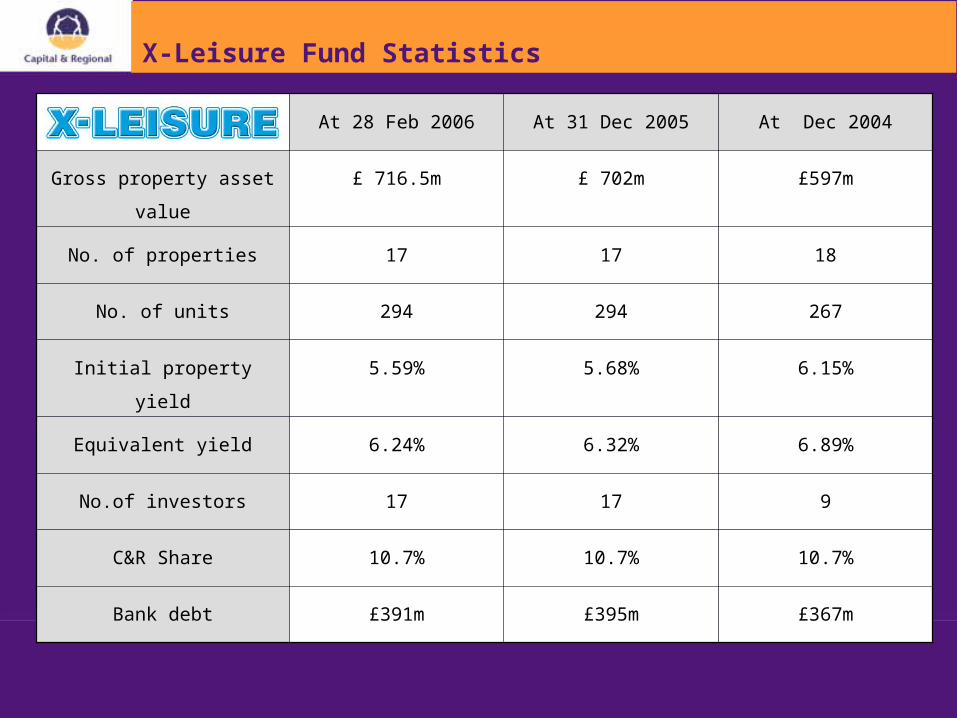
X-Leisure Fund Statistics
At 28 Feb 2006 At 31 Dec 2005 At Dec 2004
Gross property asset value £ 716.5m £ 702m £597m
No. of properties 17 17 18
No. of units 294 294 267
Initial property yield 5.59% 5.68% 6.15%
Equivalent yield 6.24% 6.32% 6.89%
No.of investors 17 17 9
C&R Share 10.7% 10.7% 10.7%
Bank debt £391m £395m £367m
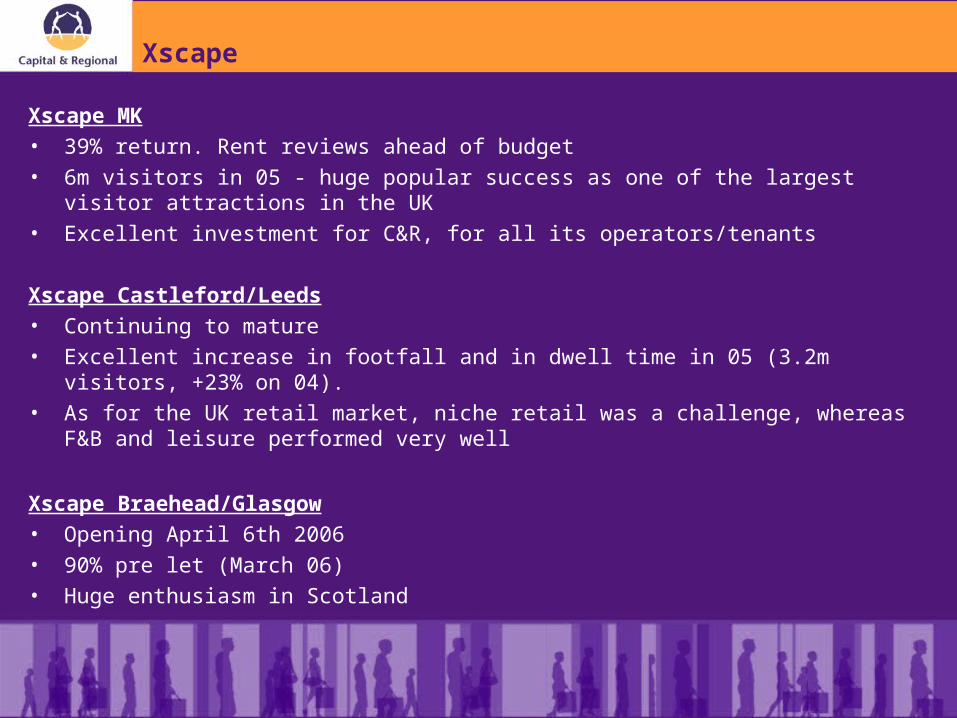
Xscape
Xscape MK • 39% return. Rent reviews ahead of budget • 6m visitors in 05 - huge popular success as one of the largest visitor attractions in the UK • Excellent investment for C&R, for all its operators/tenants
Xscape Castleford/Leeds • Continuing to mature • Excellent increase in footfall and in dwell time in 05 (3.2m visitors, +23% on 04). • As for the UK retail market, niche retail was a challenge, whereas F&B and leisure
performed very well
Xscape Braehead/Glasgow• Opening April 6th 2006• 90% pre let (March 06)• Huge enthusiasm in Scotland
Other Leisure Activities
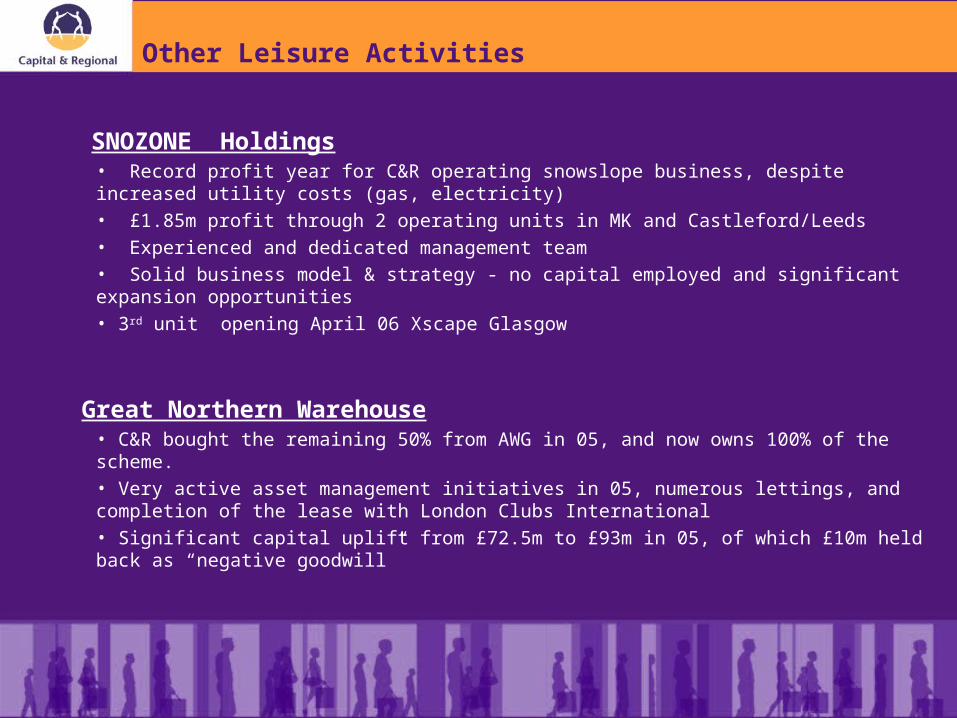
SNOZONE Holdings• Record profit year for C&R operating snowslope business, despite increased utility costs (gas, electricity)• £1.85m profit through 2 operating units in MK and Castleford/Leeds • Experienced and dedicated management team • Solid business model & strategy - no capital employed and significant expansion opportunities• 3rd unit opening April 06 Xscape Glasgow
Great Northern Warehouse• C&R bought the remaining 50% from AWG in 05, and now owns 100% of the scheme.• Very active asset management initiatives in 05, numerous lettings, and completion of the lease with London Clubs International• Significant capital uplift from £72.5m to £93m in 05, of which £10m held back as “negative goodwill”
• 90/10% J.V. with Hahn• Focus big box retail (mostly supermarket
anchored)
German Portfolio
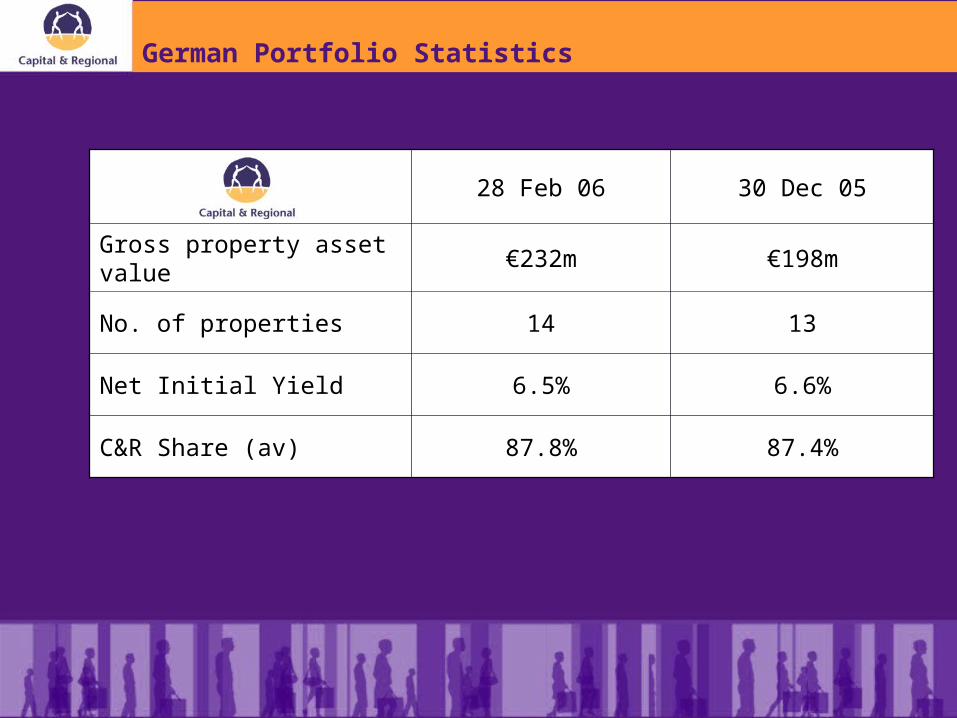
German Portfolio Statistics
28 Feb 06 30 Dec 05
Gross property asset value €232m €198m
No. of properties 14 13
Net Initial Yield 6.5% 6.6%
C&R Share (av) 87.8% 87.4%
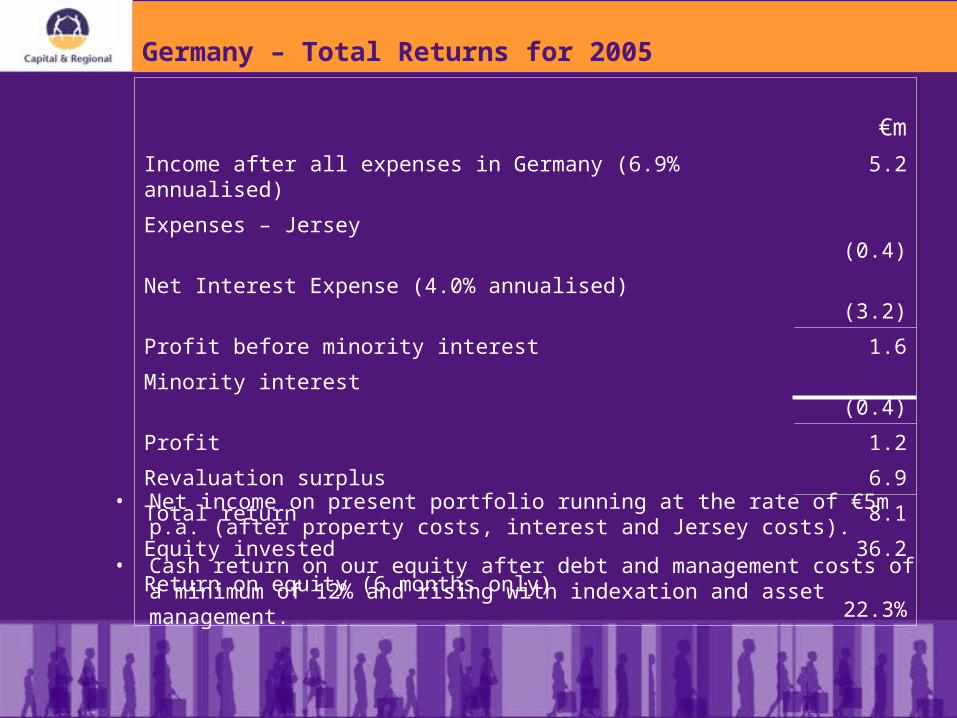
Germany – Total Returns for 2005
€m
Income after all expenses in Germany (6.9% annualised) 5.2
Expenses – Jersey (0.4)
Net Interest Expense (4.0% annualised) (3.2)
Profit before minority interest 1.6
Minority interest (0.4)
Profit 1.2
Revaluation surplus 6.9
Total return 8.1
Equity invested 36.2
Return on equity (6 months only)22.3%
• Net income on present portfolio running at the rate of €5m p.a. (after property costs, interest and Jersey costs).
• Cash return on our equity after debt and management costs of a minimum of 12% and rising with indexation and asset management.
Germany – Total Returns for 2005
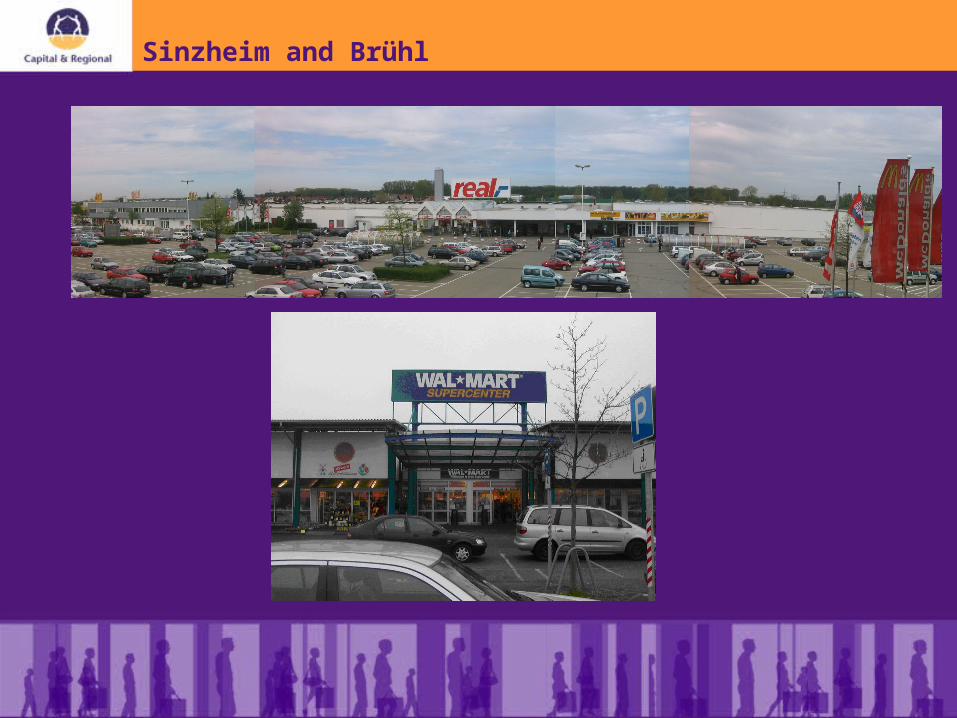
Sinzheim and Brühl
• Severe restrictions on further out of town development
• Good tenant covenants and long leases• Index linked rents• High yield off low rental value base• No security of tenure after lease expiry• Many asset management opportunities
German retail warehouse market
• Opportunities to add value to existing portfolio• Good pipeline of additional properties to buy• Yield compression under way (both good and bad news)• Early signs of consumer confidence returning
The Future
Summary
• Great year
• Tenant market tough but not as hard as we expected last September
• Good expansion of funds from £4bn to £5.6bn now
Outlook
• We expect further yield shift this year
• We hope to see further expansion of all three funds. Also additions to our trade park and German assets
• Our business model is working well
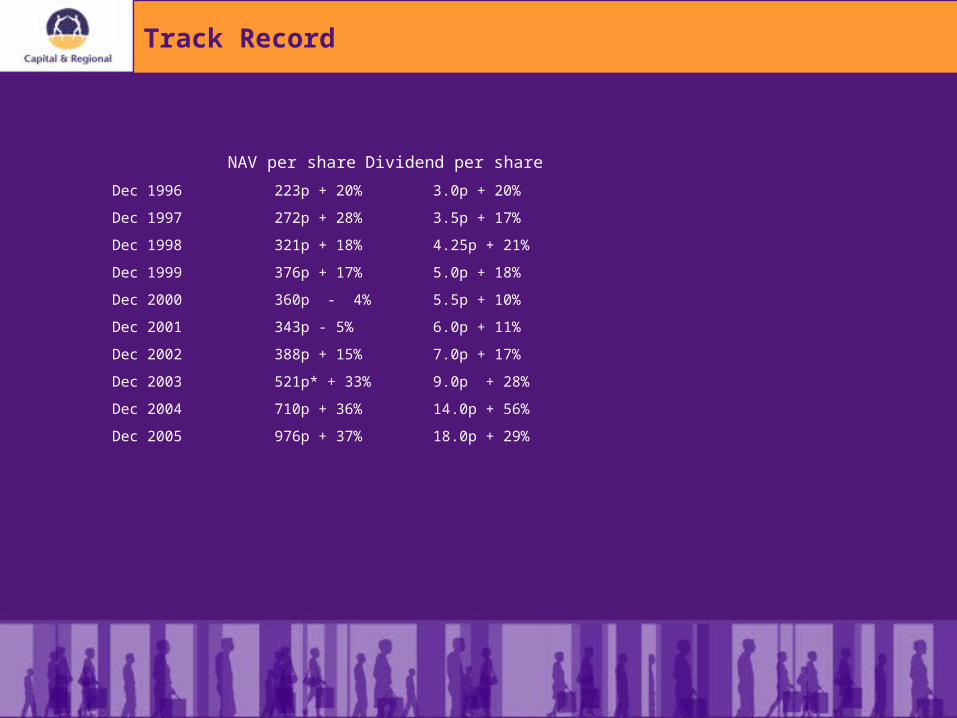
NAV per share Dividend per share
Dec 1996 223p + 20% 3.0p + 20%
Dec 1997 272p + 28% 3.5p + 17%
Dec 1998 321p + 18% 4.25p + 21%
Dec 1999 376p + 17% 5.0p + 18%
Dec 2000 360p - 4% 5.5p + 10%
Dec 2001 343p - 5% 6.0p + 11%
Dec 2002 388p + 15% 7.0p + 17%
Dec 2003 521p* + 33% 9.0p + 28%
Dec 2004 710p + 36% 14.0p + 56%
Dec 2005 976p + 37% 18.0p + 29%
Track Record