22nd no frills refereed papers - national centre for ... · web view22nd national vocational...
TRANSCRIPT


© Commonwealth of Australia, 2014
With the exception of the Commonwealth Coat of Arms, the Department’s logo, any material protected by a trade mark and where otherwise noted all material presented in this document is provided under a Creative Commons Attribution 3.0 Australia <http://creativecommons.org/licenses/by/3.0/au> licence.
The details of the relevant licence conditions are available on the Creative Commons website (accessible using the links provided) as is the full legal code for the CC BY 3.0 AU licence <http://creativecommons.org/licenses/by/3.0/legalcode>.
The Creative Commons licence conditions do not apply to all logos, graphic design, artwork and photographs. Requests and enquiries concerning other reproduction and rights should be directed to the National Centre for Vocational Education Research (NCVER).
This document should be attributed as O’Connor, L (ed.) 2014, 22nd National Vocational Education and Training Research Conference ‘No Frills’: refereed papers, NCVER, Adelaide.
The views and opinions expressed in this document are those of the authors/project teams and do not necessarily reflect the views of the Australian Government, state and territory governments or NCVER. Any interpretation of data is the responsibility of the authors/project teams.
ISBN 978 1 922056 96 2
TD/TNC 116.06
Published by NCVER, ABN 87 007 967 311
Level 11, 33 King William Street, Adelaide SA 5000PO Box 8288 Station Arcade, Adelaide SA 5000, Australia
Phone +61 8 8230 8400 Fax +61 8 8212 3436
Email [email protected] Web <http://www.ncver.edu.au> <http://www.lsay.edu.au>
Follow us: <http://twitter.com/ncver> <http://www.linkedin.com/company/ncver>

About the research22nd National Vocational Education and Training Research Conference ‘No Frills’: refereed papers
Edited by Laura O’Connor, NCVER
The 22nd National Vocational Education and Training Research Conference, colloquially known as ‘No Frills’, was held in July 2013 in Mooloolaba in Queensland.
The conference provided researchers and practitioners from a range of disciplines in the vocational education and training (VET) sector with the opportunity to come together to share information about the key issues confronting the sector. A small number of speakers at the conference were also offered the opportunity to have their papers peer-reviewed, and these nine refereed papers constitute this book of conference proceedings.
The papers span a broad range of topics, including the value of VET qualifications for those seeking or wanting to keep a job; the partnerships that exist between VET and higher education; support systems or programs which engage marginalised groups in the workforce; the impact of low socioeconomic status and language, literacy and numeracy issues on student engagement; and an overview of online education and its value.
It is hoped that these papers will provide an insight into the array of topics presented at the National Vocational Education and Training Research Conferences and generate interest in readers in attending future conferences.
Rod CammManaging Director, NCVER


Contents Introduction 6
Are mid-level qualifications effective? An analysis of employment, study and skills outcomes, Nick Fredman 9
VET qualifications and the employment outcomes of early school leavers, Jenny Chesters 21
Workplace change and skill needs: workers’ perceptions, Darryl Dymock and Mark Tyler 29
Language, literacy and numeracy and vocational education collaboration: enablers and barriers, Ruth Walker 36
Implications for learning and teaching in higher education delivered by
private provider and TAFE and the role of university partners, Lorraine Bennett, Mahsood Shah and Chenicheri Sid Nair 46
The effect of a mentoring program on Indigenous apprenticeship completion in Queensland, Bernard Trendle 53
Collaborative approaches to achieving Aboriginal vocational education and employment outcomes in remote South Australia, Ian Hodgson, Marg Mibus and Amanda Tulloch-Hoskins 61
Intergenerational mobility: new evidence from LSAY data, Gerry Redmond, Melissa Wong, Bruce Bradbury and Ilan Katz 68
MOOCs in VET and higher education, Jamie Murphy, Alan Williams and Amy Lennox 76
NCVER 5

Introduction The 22nd Annual National Vocational Education and Training Research Conference, colloquially known as ‘No Frills’, was held in Mooloolaba in Queensland from 10 to 12 July 2013. Co-hosted by the National Centre for Vocational Education Research (NCVER) and Sunshine Coast TAFE, and with support from the Australian Department of Industry (formerly the Department of Industry, Innovation, Climate Change, Science, Research and Tertiary Education), the conference aimed to promote discussion about the key issues confronting researchers and practitioners in the vocational education and training (VET) sector. Both informative and practical, the conference provided opportunities for professional development and networking through lively exchanges about VET and exposed practitioners to the value of research, in terms of their teaching and their organisation’s business development. The conference aligned with NCVER’s strategic goals of disseminating research to the wider community and broadening its research effort.
The three keynote speakers looked at issues currently facing the VET sector. In his opening presentation, Tom Karmel delivered his final conference address before retiring as NCVER Managing Director, with his presentation, ‘Implications of increasing education levels on job prospects from a “quality of job” perspective’. Nik Babovic, Deputy Vice-Chancellor, Central Queensland University, gave a presentation entitled ‘Establishing a dual-sector university, a reflection on the operational challenges and new opportunities surrounding teaching and research’. And finally, Daniel Gschwind, Chief Executive, Queensland Tourism Industry Council, highlighted the potential economic benefits to tourism in Australia in his address, ‘Tourism in Australia: reaching our potential’.
The 2013 program offered a number of practical workshops, including a hands-on workshop on accessing and using NCVER statistics and research; a workshop providing tips on how to develop and refine a research question; and a third which provided guidance on writing a research proposal and accessing published research using NCVER resources, including VOCEDplus. The conference also showcased a wide variety of presentations relating to research and practitioner experience in the VET sector. Topics ranged from VET in Schools to literacy and numeracy, social equity and student aspirations and outcomes. In all, 43 parallel sessions were presented, and this rich and varied program was very well received, attracting delegates from government and industry as well as researchers, training providers and consultants.
Nine of the 43 presentations were selected for inclusion in a refereed papers stream for the conference — and these papers constitute this book of conference proceedings. The papers, which were subject to a ‘double blind’ review process, represent a good cross-section of topical issues, ranging from the effectiveness of vocational education and training for marginalised groups, and the partnerships that exist between VET and higher education, to the value of VET qualifications for those seeking or wanting to keep a job.
Three of the papers focus on this last point, the importance of undertaking VET qualifications in order to maintain employability or to obtain work. The first two papers, by Nick Fredman and Jenny Chesters, consider the impact of VET training for those wanting to get a job.
6 22nd National Vocational Education and Training Research Conference ‘No Frills’:refereed papers

Using data from NCVER’s Student Outcomes Survey, Dr Fredman identifies varying outcomes for students who complete a mid-level qualification, noting that student outcomes vary considerably and depend on the field of education associated with the qualification, likely due to differences in labour market requirements between industries. This paper also finds that mid-level qualifications play different roles for young people and for older people, with those aged over 25 years more likely to be employed after training. This compares with those aged under 25 years, where there is little difference in the proportions employed full-time before and after training.
This finding is reinforced in Dr Chesters’s paper, which considers the value of VET qualifications in terms of employment outcomes for early school leavers. The paper, which focuses on young people aged under 25 years, finds that, although they may have a better chance of getting a job, neither males nor females without a senior secondary school certificate were better off in terms of their occupational status or earnings following their VET training.
Darryl Dymock and Mark Tyler’s paper focused on the value of VET training for those wanting to keep their job in a changing environment. In their paper, Dr Dymock and Dr Tyler note that workplaces are changing at a rapid rate and in this changing environment it is essential that employees are able to upgrade their skills and knowledge, in order to maintain their competence and hence their employability. The challenge is determining how best to provide new learning, which according to the authors comes down to understanding how individual workers perceive the impact of changes on their work practices. On the basis of interview responses the authors found that learning situated in the workplace, and with a focus on individual work practices, was most effective.
Two of the papers consider partnerships, either between practitioners from different disciplines, or between institutions from the VET and higher education sectors.
Following the introduction in 2012 of the National Foundation Skills Strategy for Adults, a Foundation Skills Training Package was developed. This provided an opportunity for VET and language, literacy and numeracy (LLN) practitioners to work together to develop materials for the training package, which meant they were able to share and build their knowledge in this area. A paper by Ruth Walker provides an insight into the enablers and barriers that influenced the practitioners’ ability to work together.
Lorraine Bennet, Mahsood Shah and Chenicheri Sid Nair in their paper consider the implications of learning and teaching in an ever-changing tertiary education sector, where boundaries are being blurred between vocational and higher education. Specifically, these authors were interested in partnership arrangements between the two sectors and the factors that influenced the success or failure of these arrangements in terms of student outcomes.
Two of the refereed papers considered the importance of supporting our Indigenous population, in order to increase their engagement in the workforce. Specifically, these papers highlight the importance of mentors in supporting Indigenous apprentices and improving rates of completion.
Apprenticeships provide an important pathway from school into the workforce; however, cancellation rates can be very high, particularly for Indigenous Australians. Bernard Trendle
NCVER 7

examines this issue in his paper, focusing specifically on the value of mentoring to support Indigenous apprentices. Trendle’s research found that well-designed mentoring programs significantly increase the likelihood of completion for Indigenous apprentices, with, as a consequence, these programs being a cost-effective means for increasing the supply of skilled labour to the Australian workforce.
These findings accord with those contained in the paper prepared by Ian Hodgson, Marg Mibus and Amanda Tulloch-Hoskins. Their paper, which evaluates a pre-employment program offered to Indigenous people in Coober Pedy and Port Augusta, focuses primarily on the value of mentoring — finding that this is a critical factor influencing the successful outcomes of Indigenous people seeking employment at OZ Minerals, a mining company based in remote South Australia.
In his paper Gerry Redmond considered another ‘at risk’ group of students, those from a low socioeconomic background.
Specifically, Dr Redmond investigated intergenerational mobility by considering young people’s literacy and numeracy test scores in relation to their parents’ socioeconomic status. The research found that, although overall educational achievements have improved from the 1970s to today, the association between parents’ relative socioeconomic status and their children’s relative academic performance has not changed.
In the final paper of this compilation Jamie Murphy, Alan Williams and Amy Lennox provide an overview of innovations in education, particularly in relation to Massive Open Online Courses (MOOCs). This research outlines different types of MOOCs and explains why they have gained such strong momentum and participation rates across both academia and industry.
Presentations, these papers and further information regarding the 22nd National Vocational Education and Training Research Conference ‘No Frills’ can be found at the VOCEDplus website: <http://hdl.voced.edu.au/10707/266469>.
8 22nd National Vocational Education and Training Research Conference ‘No Frills’:refereed papers

Are mid-level qualifications effective? An analysis of employment, study and skills outcomesNick FredmanThe University of Melbourne
AbstractVaried expectations have been placed upon mid-level qualifications — examined here as qualifications at Australian Qualifications Framework (AQF) levels 5 and 6; that is, diplomas, advanced diplomas and associate degrees. Such qualifications have been seen as needing to support labour market entry, as providing access to higher-skilled work throughout the working life, as a transition to higher-level qualifications, and as a means for making access to higher-level qualifications more socially equitable. It could also be argued that the role of mid-level qualifications has become less clear, with evidence that, for many work roles, mid-level qualifications are losing labour market currency to bachelor degrees.
This paper is based on findings from the second year of a three-year NCVER-supported project entitled ‘Vocations: post-compulsory education and the labour market’. The first component of this project identified the underdevelopment of mid-level qualifications as a particular problem in the link between education and work in Australia. This paper examines this further by considering whether the stated purposes of mid-level qualifications are being achieved.
Using data from NCVER’s 2011 Student Outcomes Survey, various labour market and further study outcomes have been investigated, while cross-tabulations of outcomes, aggregated by field of education and qualification levels, are presented. Furthermore, logistic regression models have been used to model the outcomes, by age, controlling for relevant background variables.
Considerable variation was found in the outcomes by field of education, suggesting that mid-level qualifications play different roles in different areas of education and work. It was also found that mid-level qualifications have, by comparison with other qualification levels, proved distinctly useful in accessing higher education and, for young people, enabling them to move to more highly skilled work; however, they indicate little apparent usefulness for moving older people to more highly skilled work.
IntroductionVaried expectations have been placed upon mid-level qualifications — examined here as qualifications at AQF levels 5 and 6; that is, diplomas, advanced diplomas and associate degrees. Although Gallacher (2011) and an AQF policy document (Australian Qualifications
NCVER 9

Framework Council 2013) suggest that these qualifications should facilitate pathways to higher-level qualifications and provide individuals with access to higher-skilled work, others suggest that the roles of mid-level qualifications have become less clear and have suffered from labour market change. There is evidence that the mid-level of the labour market has been hollowed out (Wheelahan, Moodie & Buchanan 2012, pp. 30—1) and specifically that the skill level of the jobs commensurate with mid-level qualification graduates is falling, with many jobs previously requiring a mid-level qualification now requiring at least a bachelor degree (Karmel 2011). Wheelahan et al. (2012) argue that the underdevelopment of mid-level qualifications constitutes a ‘missing link’ in flows within and between education and work in Australia. This paper examines this contention by analysing the employment, further study and skills outcomes of mid-level qualifications.
The paper derives from a three-year project funded by NCVER and entitled ‘Vocations: post-compulsory education and the labour market’ (hereafter called the ‘Vocations Project’). In earlier work relating to this project, Moodie and Fredman (2013) found that vocational diplomas maintained their share of the student load for mid-level qualifications from 2002 to 2011, but with considerable variation by field of education. This research found that the bachelor degree share fell, while the certificate IV share rose, and that these changes were not related to employment rates, but instead were linked to the Global Financial Crisis. The variation found in Moodie and Fredman (2013) prompted the research contained in this paper.
A great deal quantitative research that used NCVER’s Student Outcomes Survey exists on the employment outcomes of VET students. Karmel and Nguyen (2006) used the 2003 survey to identify the employment and wage benefits of completing different levels of VET qualifications by comparison with non-completion. Their findings indicated doubt about the effectiveness of mid-level qualifications compared with the benefits of higher certificates in terms of these outcomes. They found that the probability of people being employed was highest for graduates of bachelor and postgraduate degrees, with the lowest probability for diploma or advanced diploma graduates. Returns from completing a qualification in terms of increased wages were found to be related to previous qualification: those with low-level qualifications received a return, while those with a previous certificate IV or higher qualification did not. The overall probabilities of outcomes presented in this work account for field of education and age differences, and the regression coefficients presented indicate the relative independent effects of age and field of education as well as qualification level. However, differences due to age and field within qualification levels are not evident.
Karmel and Fieger (2012) used the 2009 Student Outcomes Survey to examine the value of completing a VET qualification, but used a broader range of employment and skills outcomes and explanatory variables than did Karmel and Nguyen (2006). They found that completing a qualification, compared with not completing one, had a clear wage benefit for those who had studied at the diploma or above level, except for those who were not employed before training and who had undertaken a certificate III or IV. Again, however, while overall differences by age and field were accounted for and presented, differences within qualification level were not evident.
Stanwick (2006) used the 2003 survey to investigate whether upper-level VET qualifications — defined as diplomas and advanced diplomas — successfully led to employment at
10 22nd National Vocational Education and Training Research Conference ‘No Frills’:refereed papers

associate professional level or higher or to university study. These two outcomes were found to vary markedly, by age group and field of education. While just over a quarter of graduates aged 15—24 years were employed as associate professionals or higher, over half of those aged 25 years or higher were so employed. Movement to university study also varied by age and field, with 32% of the younger group moving to higher education and 14% of the older group doing so. In this case, while split cross-tabulations showed important differences by field and age group in actual outcomes for mid-level qualification graduates, independent explanatory variables, such as gender, labour force status, and skill level of jobs before training, were not accounted for.
This previous research provides a mixed picture of the effectiveness of mid-level qualifications by comparison with higher certificates, in particular pointing to the importance of differences related to field of education. This paper seeks to add to this discussion by investigating the extent to which the stated purposes of mid-level qualifications — labour market entry, further study and skills progression — are being achieved. As these purposes may vary for people in different stages of their working lives and for different fields of education and work, the way the qualification outcomes vary with field of education and with age are examined.
Data and methodThe paper follows Karmel and Nguyen (2006), Stanwick (2006) and Karmel and Fieger (2012) in examining a range of educational and occupational outcomes available in NCVER’s Student Outcomes Survey. It uses the results of the survey carried out in March 2011 relating to study undertaken in 2010.
Because of the small sample numbers of some qualification levels in some fields, I follow the approach of Karmel and Nguyen (2006) and Karmel and Fieger (2012) in this study and use a qualification-level category of ‘diploma and above’. The paper considers qualifications in this category as mid-level to compare their outcomes with those of certificates III and IV. (Lower-level certificates are less relevant for occupational outcomes, and also in many fields of education in the Student Outcomes Survey the sub-sample sizes of those graduating from the lower certificates are quite small.)
The paper firstly examines how the rates of employment before and after study and of further study varies among VET graduates by broad age group, the aim being to suggest some difference in the purposes of mid-level qualifications by age group. Following this a range of outcomes is examined in more detail. Each outcome, as defined in the findings and discussion sections, has been coded as a binary variable; for example, being employed or not at the time of the survey. To examine how each outcome varies by qualification level and by field of education, cross-tabulations of the proportions of the ‘positive’ outcome (for example, being employed) by qualification level and field of education are presented. Broad fields of education (that is, those coded with two digits in the Australian Standard Classification of Education [ASCED]) are presented, along with selected narrow (four-digit) fields of education with relevance to the case studies in the Vocations Project. These are cited in the discussion as pertinent examples of the varied nature of occupational and educational progression. It should be carefully noted that such cross-tabulations do not account for how other variables such as gender and labour force status before study may affect outcomes: it would be unwieldy to further split what are already three-way tables.
NCVER 11

However, with this in mind, it is suggested that, when examined with other evidence, important information about the actual occupational and educational flows in different fields emerges, which is presented in these tables. An indication of the reliability of the results is given by showing which proportions have a standard error greater than 50% of its value or less than that but greater than 25%.
To examine the overall effects of each qualification level on outcomes by comparison with other levels and while controlling for other explanatory factors such as gender, field of education, labour force status before study and previous study history, the regression methods of Karmel and colleagues cited above are used. While the earlier studies were concerned with the effects of completions, this study, by examining the effectiveness of qualifications in the labour market, restricts the sample examined to those who have graduated from a qualification. The outcomes are each examined with a binary logistic regression model; that is, a model of the probability of one outcome by comparison with another, such as the probability of a graduate being employed by comparison with not being employed. The results presented are the average probabilities of an outcome for each qualification level. These are given for the whole sample, and also for separate models for each of the three broad age groups used. These probabilities are derived from the regression equation, accounting for the effects of each explanatory factor other than qualification level by holding the values of each such factor constant at its average value. To examine the statistical significance of the differences between probabilities, z-tests were conducted between every pair of probabilities across levels and across age groups for each outcome, and the significance of differences (at the 95% level of confidence) are noted below as relevant.
Findings and discussionThe diversity of mid-level qualification studentsKarmel and Nguyen (2006) emphasise the diversity of the VET student population, with younger people more likely to be studying full-time and older people more likely to be in the labour market and studying part-time to gain specific skills. Table 1 shows some overall differences by age in the employment and study patterns of those graduating from VET programs studied in 2010 and in this compares those graduating from diploma or higher-level programs with all graduates. Those aged over 25 years are more likely to be employed before and after training and in contrast to the youngest group show little difference in the proportions employed full-time before and after training. Among graduates aged under 25 years, those who completed a program at a diploma or higher level are less likely to be in full-time work after study and more likely to be in further study than graduates of other levels. Among the older groups, the diploma and higher graduates are more likely to have been in full-time employment before study and to be in full-time employment after study and only slightly more likely to be in further study.
Table 1 Employment and further study characteristics of each broad age group of graduates of all qualifications and of diplomas and above, 2011, %
Age group Employed full-time before training
Employed full-time after training
In further study after training
All Diplomas and above
All Diplomas and above
All Diplomas and above
15–24 23.9 23.2 40.7 34.1 40.1 44.1
12 22nd National Vocational Education and Training Research Conference ‘No Frills’:refereed papers

Age group Employed full-time before training
Employed full-time after training
In further study after training
25–44 54.5 63.1 55.7 61.1 29.4 31.5
45+ 50.0 61.6 48.9 60.2 23.6 27.7
All age groups 41.3 51.2 48.2 53.1 32.4 34.2Source: NCVER (2011).
Table 1 provides some initial support for the suggestion that mid-level qualifications have a differing balance of purposes for different age groups. The paper will now consider how a range of outcomes varies by qualification level, field of education and age group.
Outcomes, levels, fields and ageEmployed after studyTable 1 shows the first outcome examined, that of being employed or not six months after study, by qualification level and field of education. Diploma and above graduates have a similar employment rate to that of certificate III and IV graduates. However, the differences across levels are more stark in some fields: in engineering, certificate III and IV graduates have a considerably higher employment rate than the diploma and higher graduates, while in nursing the diploma and above graduates have a somewhat higher employment rate than do the certificate III or IV graduates.
Table 2 Graduates in employment six months after training, by level of qualification and broad and selected narrow field of education, 2011, %
Field of education Cert. III Cert. IV Diplomas and above
All levels
Natural and physical sciences 64.7 59.6 61.4 62.2Information technology 48.4 58.2 63.1 56.1Engineering and related technologies 90.8 94.6 83.0 85.6Architecture and building 93.4 88.3 83.9 86.3Agriculture, environmental and related studies 87.4 90.1 92.3 82.8Health 83.2 87.7 91.0 84.3Nursing 86.8 86.0 91.0 88.4Education 78.0 91.2 98.2 89.9Management and commerce 75.8 83.7 85.7 76.3Banking and finance 72.7 72.9 68.6 70.8Society and culture 77.0 83.7 83.0 77.6Creative arts 53.4 60.3 68.2 60.1Food, hospitality and personal services 77.5 85.8 71.8 73.3All fields 80.8 83.1 83.4 77.4
Notes: Blank cells indicate a zero sample size. * Relative standard error > 25%. ** Relative standard error > 50% or cell sample size < 10.
Source: NCVER (2011).
Table 3 shows the predicted probabilities of being employed after study for each level within each broad age group, controlling for sex, broad field of education and whether employed or not before study. The probabilities for the diploma and above graduates are similar to those for certificates III and IV, although with a statistically significant higher probability than for certificate III graduates among the 25 to 44-year-olds and a significantly higher probability for certificate IV and III graduates among graduates aged over 44 years.
NCVER 13

Table 3 Predicted probabilities of being in employment six months after training, all ages and split by age group, 2011
Qualification level Age 15–24 Age 25–44 Age 45+ All ages
Diplomas and above 0.62 0.63 0.60 0.64Certificate IV 0.62 0.63 0.54 0.62Certificate III 0.65 0.59 0.54 0.62
Notes: Probabilities are derived by holding the variables for sex, broad field of education and whether employed or not before training constant at their average values.
Source: NCVER (2011).
These results reinforce previous findings in the Vocations Project relating to labour market change. The higher rate for nursing graduates at the diploma and higher level compared with that at certificate III or IV reflects the change in registration requirements for an enrolled nurse from a certificate to a diploma, meaning that certificates are now more of an articulation qualification, while the diploma has a clear occupational outcome (Fredman 2012, p.10). The lower rate for diploma and above graduates in banking and finance perhaps reflects the increased use of higher education qualifications as screening for work within finance (Yu, Bretherton & Schultz 2012). It can also be noted that in the two older age groups the diploma and above probabilities are significantly higher than those for certificate III, and in the oldest age group the probability for diploma and above graduates is also significantly greater than that for certificate IV graduates. This suggests that certificates, particularly certificate III for apprenticeships and traineeships, are clearer labour market pathways for younger people.
Further study after trainingThe value of qualifications as study pathways is assessed in the following four tables. Table 4 shows the proportions of graduates in any further study. Results for diploma and above graduates are only a little higher than those for certificate III and IV graduates. There are differences within fields, with the diploma and above results considerably higher in engineering, suggesting a pathway rather than labour market role for the mid-level qualification, while the reverse could be said for mid-level qualifications in nursing, in which the diploma now has a clear job outcome, compared with the certificate IV.
Table 4 Graduates in further study six months after training, by level of qualification and broad and selected narrow field of education, 2011, %
Field of education Cert. III Cert. IV Diplomas and above
All levels
Natural and physical sciences 29.8 40.1 37.7 35.2Information technology 52.4 44.4 44.4 46.6Engineering and related technologies 19.6 22.4 41.9 24.9Architecture and building 21.4 27.9 33.7 26.2Agriculture, environmental and related studies 22.3 21.9 22.9 25.1Health 29.7 37.9 34.1 31.0
Nursing 20.1** 37.7 32.6 33.8Education 26.7 27.0 32.7 27.3Management and commerce 36.3 30.1 33.6 35.4
Banking and finance 42.9 46.0 41.4 43.2Society and culture 36.1 38.1 31.7 36.2Creative arts 49.2 57.6 39.4 48.2Food, hospitality and personal services 26.3 26.5 25.8 30.2All fields 29.0 32.9 34.2 32.4
14 22nd National Vocational Education and Training Research Conference ‘No Frills’:refereed papers

Field of education Cert. III Cert. IV Diplomas and above
All levels
Notes: Blank cells indicate a zero sample size. * Relative standard error > 25%; ** Relative standard error > 50% or cell sample size < 10.
Source: NCVER (2011).
The regression results in table 5 also show similar probabilities across levels, apart from the group aged 15 to 24 years. Among this group the probabilities for graduates of certificate IV and III programs are significantly higher; for graduates of certificate III programs the probability is significantly lower than that for graduates of diploma and above programs. Within each level there is a similar pattern of decrease from the youngest to oldest age group (all significant differences). Diploma and higher qualifications therefore do not seem distinct in leading to further study, and this reinforces the findings of the Vocations Project: that people are increasingly gaining multiple qualifications by varied pathways, with variations across fields (Wheelahan et al. 2012; Wheelahan, Moodie & Buchanan 2012). Further study does appear to be a particular concern for young people. One question in the Student Outcomes Survey asks the main reason for study. Considering the responses of those having graduated from diploma and higher programs, the response ‘to get into another course of study’ was
NCVER 15

nominated by 17% of those aged 15—24 years, 3% of those aged 25—44 years and 1% of those aged 45 years and over.1
Table 5 Predicted probabilities of being in further study six months after training, all ages and split by age group, 2011
Qualification level Age 15–24 Age 25–44 Age 45+ All agesDiplomas and above 0.32 0.27 0.24 0.28Certificate IV 0.38 0.27 0.23 0.28Certificate III 0.29 0.25 0.22 0.26
Notes: Probabilities are derived by holding the variables for sex, broad field of education, whether employed or not before training and highest level of qualification before training constant at their average values.
Source: NCVER (2011).
Further study at bachelor degree or higherMid-level qualifications may however be distinct as a ‘cross-over’ qualification between VET and higher education, leading to further study at a bachelor degree or higher level (Karmel & Nguyen 2003, p.11). Table 6 shows the proportions of all graduates who are studying at a bachelor degree or higher. Overall, these proportions increase as the qualification level becomes higher. Within diploma and above qualifications the proportions are particularly high in the natural and physical sciences (29%), information technology (27%) and nursing (20%).
Table 6 Graduates in further study at bachelor level or higher six months after training, by level of qualification and broad and selected narrow field of education, 2011, %
Field of education Cert. III Cert. IV Diplomas and above
All levels
Natural and physical sciences 6.7* 7.2* 29.3 13.3Information technology 7.1 4.1* 26.7 11.9Engineering and related technologies 1.5 1.9* 18.2 3.0Architecture and building 0.6** 3.5* 16.5 2.3Agriculture, environmental and related studies 2.4* 3.2* 4.8* 3.0Health 6.5 10.1 15.6 7.9Nursing 1.5** 22.3 19.6 19.6Education 4.5 5.1 11.5* 5.4Management and commerce 7.0 5.6 13.5 7.9Banking and finance 4.6 7.1 23.7 12.6Society and culture 4.6 8.3 16.7 7.5Creative arts 9.0 6.6 18.6 11.1Food, hospitality and personal services 7.0 3.3* 7.2* 5.7All fields 4.2 6.9 15.2 6.1
1 In this paper I do not examine the question for reasons of study systematically, or use this variable as a control in the regression models of outcomes even though I acknowledge outcomes are probably related to prior reasons, because I have some concerns about the validity of the relevant question in the Student Outcomes Survey. This question allows only a single ‘main reason’. In Fredman (2013) I discuss study motivation using data from the ABS Survey of Education and Training, which allows for multiple responses to a question similar to that in the SOS. As I examined, many people nominate multiple reasons, and the pattern of reasons given is quite different for second qualifications than for first qualifications. Further, I consider that interpretations of the SOS question might vary; for example, 14% of all those who already have a job before training nominate ‘to get a job’ for this question. Presumably these respondents do not actually need to get any job, and some may mean they studied to get a better job. Due to validity concerns about this question not fully capturing and perhaps misinterpreting motivation, I make some general points about how responses to this question vary between age groups of diploma and higher graduates, rather than make a systematic presentation of all the results to this question, or use the variable as a regression control.
16 22nd National Vocational Education and Training Research Conference ‘No Frills’:refereed papers

Field of education Cert. III Cert. IV Diplomas and above
All levels
Notes: Blank cells indicate a zero sample size. * Relative standard error > 25%; ** Relative standard error > 50% or cell sample size < 10.
Source: NCVER (2011).
NCVER 17

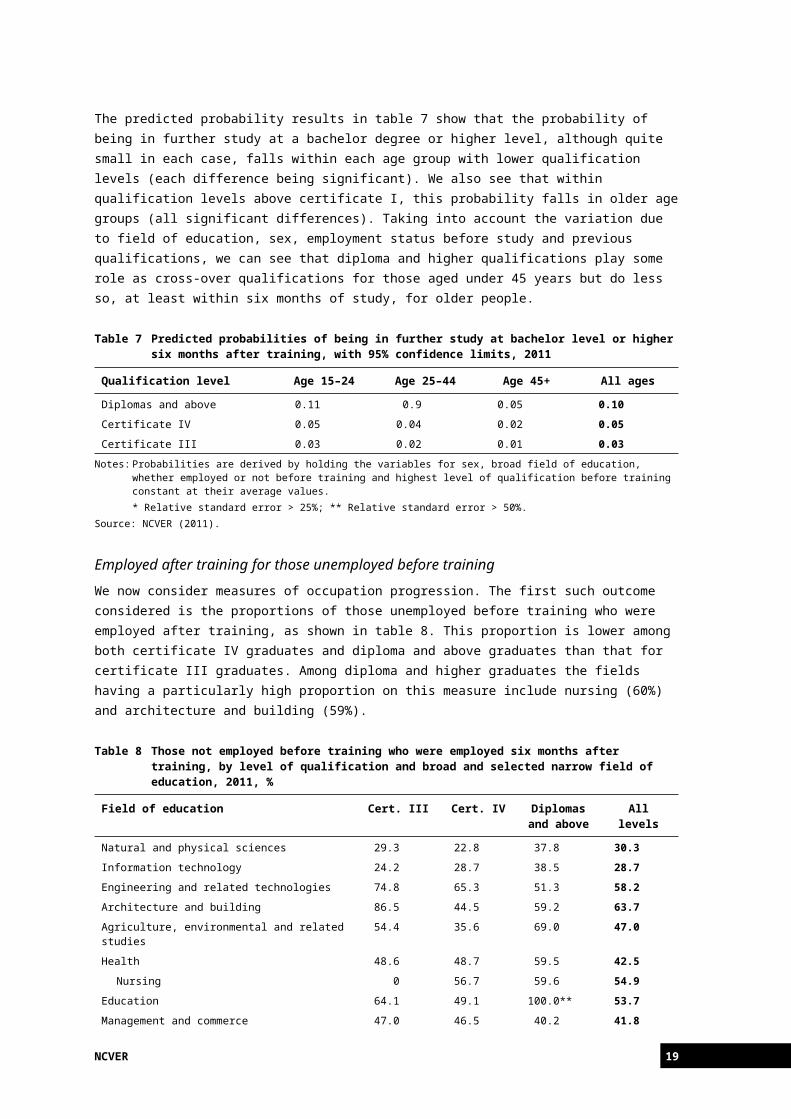
The predicted probability results in table 7 show that the probability of being in further study at a bachelor degree or higher level, although quite small in each case, falls within each age group with lower qualification levels (each difference being significant). We also see that within qualification levels above certificate I, this probability falls in older age groups (all significant differences). Taking into account the variation due to field of education, sex, employment status before study and previous qualifications, we can see that diploma and higher qualifications play some role as cross-over qualifications for those aged under 45 years but do less so, at least within six months of study, for older people.
Table 7 Predicted probabilities of being in further study at bachelor level or higher six months after training, with 95% confidence limits, 2011
Qualification level Age 15–24 Age 25–44 Age 45+ All ages
Diplomas and above 0.11 0.9 0.05 0.10Certificate IV 0.05 0.04 0.02 0.05Certificate III 0.03 0.02 0.01 0.03
Notes: Probabilities are derived by holding the variables for sex, broad field of education, whether employed or not before training and highest level of qualification before training constant at their average values.* Relative standard error > 25%; ** Relative standard error > 50%.
Source: NCVER (2011).
Employed after training for those unemployed before trainingWe now consider measures of occupation progression. The first such outcome considered is the proportions of those unemployed before training who were employed after training, as shown in table 8. This proportion is lower among both certificate IV graduates and diploma and above graduates than that for certificate III graduates. Among diploma and higher graduates the fields having a particularly high proportion on this measure include nursing (60%) and architecture and building (59%).
Table 8 Those not employed before training who were employed six months after training, by level of qualification and broad and selected narrow field of education, 2011, %
Field of education Cert. III Cert. IV Diplomas and above
All levels
Natural and physical sciences 29.3 22.8 37.8 30.3Information technology 24.2 28.7 38.5 28.7Engineering and related technologies 74.8 65.3 51.3 58.2Architecture and building 86.5 44.5 59.2 63.7Agriculture, environmental and related studies 54.4 35.6 69.0 47.0Health 48.6 48.7 59.5 42.5
Nursing 0 56.7 59.6 54.9Education 64.1 49.1 100.0** 53.7Management and commerce 47.0 46.5 40.2 41.8
Banking and finance 41.3 35.0 31.9 36.0Society and culture 54.9 41.8 50.5 48.3Creative arts 28.4 34.4 38.2 32.0Food, hospitality and personal services 45.9 50.7 45.7 43.7All fields 53.0 42.2 44.8 44.0
Notes: Blank cells indicate a zero sample size. * Relative standard error > 25%; ** Relative standard error > 50% or cell sample size < 10.
Source: NCVER (2011).
18 22nd National Vocational Education and Training Research Conference ‘No Frills’:refereed papers
The predicted probability results given in table 9 show that in the youngest group the probability of being employed for diploma and higher graduates is statistically as indistinguishable as that for certificate IV graduates; it is also significantly less than that for certificate III graduates. It appears that diploma and higher qualifications play less of a role in helping unemployed young people gain work than the apparently clearer pathways to work available through certificate IIIs, many of which are undertaken as apprenticeships and traineeships. Among the older two groups, the apparent differences in these probabilities between diploma and above, certificate IV and certificate III graduates are not significant. It should be noted that labour market entry appears to be a particular reason for young people to study. Considering the ‘main reason for study’ responses of those who have graduated from diploma and higher programs, labour market entry appears particularly important for young people, with 35% giving the response ‘to get a job’ compared with 8% of those aged 25—44 and 4% of those aged 45 and over (noting my concerns about this question footnoted above).
Table 9 Predicted probabilities of being in employment six months after training for those who were not employed before training
Qualification level Age 15–24 Age 25–44 Age 45+ All ages
Diplomas and above 0.49 0.46 0.35 0.46Certificate IV 0.47 0.47 0.31 0.44Certificate III 0.54 0.48 0.36 0.50
Notes: Probabilities are derived by holding the variables for sex, broad field of education and whether employed or not before training constant at their average values.
Source: NCVER (2011).
Working at a higher skill levelI also examined progression to more highly skilled occupations. The outcome variable used here relates to those who were working both before training and six months after training, and whether or not the skill level of the occupation after training is higher than the skill level of the occupation before training. The results are shown in table 10. Occupations and their skill levels are defined according to the Australian and New Zealand Standard Classification of Occupations (ANZSCO) at the unit group (4-digit) level. Overall, the highest proportion is for certificate III (22%) followed by diploma and higher (17%) and certificate IV (12%). A high proportion among diploma and higher graduates is seen among those who have studied for the regulated occupation of nursing (41%).
NCVER 19

Table 10Those employed six months after training working at a higher skill level, by level of qualification and broad and selected narrow field of education, 2011, %
Field of education Cert. III Cert. IV Diplomas and above
All levels
Natural and physical sciences 26.3 31.5 25.7* 27.6Information technology 25.7 16.5 29.6 22.8Engineering and related technologies 24.5 9.6 20.0 20.5Architecture and building 27.0 12.8 23.7 22.3Agriculture, environmental and related studies 10.1 9.6* 10.2 9.8Health 14.3 24.0 32.3 18.2
Nursing 10.6* 47.0 40.6 41.0Education 21.4 7.9 3.5* 8.5Management and commerce 23.2 12.0 11.9 15.8
Banking and finance 17.1 9.9 12.2 13.1Society and culture 20.9 13.8 15.8 17.1Creative arts 15.6 10.2 25.3 18.4Food, hospitality and personal services 25.8 16.2 22.4 20.9All fields 22.2 12.3 16.6 17.3
Notes: Blank cells indicate a zero sample size. * Relative standard error > 25%; ** Relative standard error > 50% or cell sample size < 10.
Source: NCVER (2011).
In the more extensive exposition of the results examined in Fredman, Moodie and Bexley (2013), we also examined whether the occupational classification of graduates employed after study matched the occupation associated with their study. We found that this measure varied with qualification level and field of study, and also that those working in the same occupation as their area of study were more likely to be working a higher skill level than before study. The latter result indicates that it is appropriate to include the variable defining whether the job is in the same occupation as the training as a factor in a regression model of the probability of moving to a higher-skilled job, along with sex and broad field of education.
Examining the probabilities of moving to a higher-skilled job, shown in table 11, it can be seen that the highest probability for working at a higher skill level is for young people graduating from diploma and higher qualifications, at 0.36. This is a significantly higher probability than that for graduates of the other levels in this age group. For all levels, the probabilities fall quite markedly (and significantly) for the two older age groups. Notwithstanding the variation suggested by table 10, mid-level qualifications, along with other qualifications, seem on average to do little to help workers aged over 24 years to move into more highly skilled work, at least within six months of graduation.
Table 11Predicted probabilities of those employed six months after training working at a higher skill level, 2011
Qualification level Age 15–24 Age 25–44 Age 45+ All ages
Diplomas and above 0.36 0.07 0.03 0.18Certificate IV 0.26 0.07 0.03 0.16Certificate III 0.31 0.09 0.04 0.23
Notes: Probabilities are derived by holding the variables for sex, broad field of education and whether working is in the same occupation as training constant at their average values.
Source: NCVER (2011).
20 22nd National Vocational Education and Training Research Conference ‘No Frills’:refereed papers

The low probabilities for graduates aged over 24 years moving to higher-skilled work appear particularly stark if the main reason stated for study among those with a job before study is considered. The response ‘to get a better job or promotion’ is given as a main reason by 8% of graduates of diploma and higher programs aged 15—24 years with a job before study, 20% of such graduates aged 25—44 years and 15% of graduates aged 45 years and over (again noting my validity concerns around this question discussed at footnote 1).
ConclusionsPrevious research has suggested that the value of VET qualifications varies markedly across fields and by previous work and study history. It also seems that in recent years, while diploma enrolments have increased, the employment rates of diploma graduates remained largely steady, again with considerable variation across fields. Further, it seems clear that mid-level qualifications play somewhat different roles for young people and for older people. This paper has further explored these questions by examining employment, study and skills outcomes in the 2011 Student Outcomes Survey. The findings reinforce the conclusion that outcomes vary considerably by field of education. Fields of education are generally related to occupations, which differ in labour market conditions and by the extent of regulation, highlighting the segmented nature of the labour market (Yu, Bretherton & Schultz 2012). Such differences should caution us against universal prescriptions for the purposes of qualifications. The regression results presented here — showing the average probabilities of outcomes by qualification levels, while accounting for variations by field, sex and, as relevant, previous employment status and previous study — suggest that diploma and higher qualifications are as a whole distinctive, compared with lower qualification levels, in leading to higher education and, for people aged under 25 years, in accessing more highly skilled work. The results also suggest that mid-level qualifications fare no better than other qualifications in terms of the very low probabilities of graduates aged over 25 years moving to more highly skilled work. It should be borne in mind that the regression models explain some, but by no means all, of the variation in outcomes. However, such very low probabilities, when substantial numbers of workers over 25 years appear to want to use diploma and above qualifications to gain more highly skilled work, suggest that there may be a need in many fields for mid-level qualifications that are strongly connected to occupational progression, and that this need is not being met.
AcknowledgmentsThis paper derives from a project funded by NCVER.
ReferencesAustralian Qualifications Framework Council 2013, Australian Qualifications Framework, 2nd edn,
Adelaide, viewed 20 April 2013, <http://www.aqf.edu.au/PoliciesPublications/tabid/196/Default.aspx>.
Fredman, N 2012, ‘Student movement: pathways, fields and links to work’, paper to Australian Vocational Education and Training Research Association 15th annual conference, 11—13 May, Canberra, viewed 5 June 2012, <http://avetra.org.au/wp-content/uploads/2012/05/Nick-Fredman-Paper-582.doc>.
NCVER 21

——2013, ‘Pathways, student motivations and human capital theory’, in 21st National Vocational Education and Training Research Conference ‘No Frills’: refereed papers, ed. T Griffin, NCVER, Adelaide, <http://www.ncver.edu.au/publications/2595.html>.
Fredman, N, Moodie, G & Bexley, E 2013, Vocational education’s variable links to vocations, NCVER, Adelaide, viewed 8 May 2013, <http://www.ncver.edu.au/publications/2689.html>.
Gallacher, J 2011, Enhancing the role of higher education in Scotland’s colleges: a discussion paper, Centre for Research in Lifelong Learning, Glasgow Caledonian University, Glasgow.
Karmel, T 2011, ‘The implications of skills deepening for vocational education and training in Australia’, International Journal of Training Research, vol.9, no.1—2, pp.72—94.
Karmel, T & Fieger, P 2012, The value of completing a VET qualification, NCVER, Adelaide, viewed 20 October 2012, <http://www.ncver.edu.au/publications/2526.html>.
Karmel, T & Nguyen, N 2003, ‘Australia’s tertiary education sector’, paper to Centre for the Economics of Education and Training 7th National Conference, 15 September 2003, Monash University, Melbourne, viewed 1 November 2012, <http://www.ncver.edu.au/publications/1442.html>.
——2006, The value of completing a vocational education and training qualification, NCVER, Adelaide, viewed 10 July 2012, <http://www.ncver.edu.au/publications/1713.html>.
Moodie, G & Fredman, N 2013, Student load and employment outcomes attached to mid-level qualifications, NCVER, Adelaide, viewed 8 May 2013, <http://www.ncver.edu.au/publications/2609.html>.
NCVER (National Centre for Vocational Education Research) 2011, ‘Australian vocational education and training statistics: student outcomes 2011’, CURF, findings based on use of NCVER CURF data, NCVER, Adelaide.
Stanwick, J 2006, Outcomes from higher-level vocational education and training qualifications, NCVER, Adelaide, viewed 10 February 2012, <http://www.ncver.edu.au/publications/1702.html>.
Wheelahan, L, Moodie, G & Buchanan, J 2012, Revitalising the vocational inflows of learning and labour, NCVER, Adelaide, viewed 16 October 2012, <http://www.ncver.edu.au/publications/2535.html>.
Wheelahan, L, Leahy, M, Fredman, N, Moodie, G, Arkoudis, S & Bexley, E 2012, Missing links: the fragmented relation between tertiary education and jobs, NCVER, Adelaide, <http://www.ncver.edu.au/publications/2554.html>.
Yu, S, Bretherton, T & Schultz, H 2012, Vocational trajectories within the Australian labour market, NCVER, Adelaide, viewed 8 November 2012, <http://www.ncver.edu.au/publications/2557.html>.
22 22nd National Vocational Education and Training Research Conference ‘No Frills’:refereed papers

VET qualifications and the employment outcomes of early school leaversJenny ChestersUniversity of Canberra
AbstractOver time, the Australian economy has moved from one focused on the production of goods to a service economy. Consequently, the employment options for young school leavers have diminished, with opportunities for low-skilled employment becoming concentrated in the retail and hospitality sectors, typically on a casual part-time basis. Currently, just 29% of employed 15 to 19-year-olds are in full-time work. The unemployment rate of those aged between 15 and 19 years is around 17%, more than three times the overall unemployment rate (5.5%). Both full-time employment and unemployment are related to the level of educational qualifications. Those with low levels of education are less likely to be employed and, if employed, are less likely to be working full-time. For those who did not complete secondary school, the vocational education and training (VET) sector provides a second chance to gain educational qualifications. This paper presents the results of analyses of the first ten waves of the Household, Income and Labour Dynamics in Australia (HILDA) Survey data and provides an insight into the role of the VET sector in facilitating transitions into full-time employment for young people who leave school before completing their senior secondary school certificate. The results presented here show that early school leaver males and females who completed a VET certificate-level qualification were no better off in terms of occupational status or earnings.
Introduction Over the past four decades, the Australian economy has undergone a restructuring from a goods-producing economy to a service economy. Consequently, the labour market has also undergone restructuring, whereby many full-time permanent jobs in manufacturing have been eliminated to be replaced by part-time, casual jobs in the service sector (Teese & Polesel 2003). Between 2005 and 2010, jobs growth was concentrated in highly skilled occupations, with 70% of new jobs requiring managerial or professional skills (Australian and New Zealand Standard Classification of Occupations [ANZSCO] skill levels 1 and 2) and just 2% of new jobs requiring low-level skills (ANZSCO skill level 5) (Department of Education, Employment and Workplace Relations 2010). Opportunities for low-skilled employment are concentrated in the retail and hospitality sectors, where fewer than half of all employees are employed on a full-time basis (Department of Education, Employment and Workplace Relations 2012). Marks (2006, p.4) suggests that, for many young people, these jobs are millstones, leading to churning between being employed part-time, unemployed or not in the labour force, rather than stepping stones providing pathways into
NCVER 23

full-time work. Without full-time work, young people are unable to establish their financial independence, being forced to delay long-term commitments such as marriage and mortgage finance.
According to the Australian Bureau of Statistics (ABS), 25% of young people aged between 15 and 24 years who want to work were either unemployed or underemployed in February 2013 (ABS 2013).The unemployment rate for school leavers aged between 15 and 19 years was 17%. For working-age Australians, those aged 15 to 64 years, the unemployment rate was 5.5% and the underemployment rate was 7.1%. Figure 1 tracks the trend over time in unemployment and underemployment rates between 1993 and 2013, showing that young people had higher rates of both unemployment and underemployment over this 20-year period. Between 1993 and 2008, the Australian economy experienced an extended period of growth (Pomfret 2009), during which the overall unemployment rate steadily declined from 11% to 4.2% (ABS 2013). The onset of the Global Financial Crisis (GFC) in 2009 pushed overall unemployment to 5.9%. Despite 15 years of continuous economic growth, the Australian economy has been unable to provide appropriate employment opportunities for a sizeable proportion of Australian youth. In February 2008, the unemployment rate for 15 to 24-year-olds was 8.8% and the underemployment rate was 11%, indicating that at the peak of the boom years one in five young Australians was unable to find suitable employment. In February 2013, the unemployment rate for young people was 12% and the underemployment rate was 13%.
Figure 1 Underemployment and unemployment rates, 1993–2013
Source: ABS (2013).
As in other liberal market economies (Bosch & Charest 2008), the links between the education system and the labour market in Australia are weak, with governments largely controlling the education system through funding and setting the curriculum, and employers controlling the labour market. The 15-year period of continuous economic growth was accompanied by increasing labour flexibility, increasing casualisation and increasing credential inflation, making it particularly difficult for low-educated/low-skilled youth to secure full-time employment.
24 22nd National Vocational Education and Training Research Conference ‘No Frills’:refereed papers
Feb93
Feb96
Feb99
Feb02
Feb05
Feb08
Feb11
0.0
2.0
4.0
6.0
8.0
10.0
12.0
14.0
16.0
18.0
20.0
Underemployment rate 15 - 24 Underemployment rate 15-64Unemployment rate 15-24Unemployment rate 15-64
Per
cen
t
The link between level of education and employment status is well documented. Figure 2 shows that those with higher levels of education have higher rates of labour force participation, higher rates of full-time employment and lower rates of unemployment compared with those with low levels of education. For example, 72% of postgraduate degree holders were employed on a full-time basis, whereas just 40% of those with no post-school qualification were employed on a full-time basis. Those with no post-school qualification were the most likely to be unemployed, closely followed by those with a certificate I/II.
Figure 2 Labour force status by highest level of education, those aged 15–64 years, 2012
Source: ABS ( 2012).
The ABS (2012) estimates show that 88 000 young people aged between 15 and 24 years in 2012 had exited the education system before completing Year 12. These young people are particularly vulnerable in the current labour market, now that the completion of Year 12 has become the minimum entry requirement for many jobs (Biddle 2007). Early school leavers have little chance of securing full-time employment and many return to education via the VET sector to undertake certificate-level qualifications. In 2012, the ABS (2012) estimated that 206 000 school leavers aged between 15 and 24 years were studying for an educational qualification. The majority of school leavers aged between 15 and 24 years who were studying a certificate III/IV or a higher-level educational qualification were working, whereas the majority of those studying a Year 12 equivalent or lower qualification were not employed. Figure 3 shows the proportion of school leavers aged between 15 and 24 years who were employed, by the level of the qualification being studied in 2012.
Figure 3 Employment status by level of current study, those aged 15–24 years, 2012
NCVER 25
Postgraduate Degree
Grad Dipl/Grad Cert
Bachelor Degree
Diploma/Adv Dip
Certificate III/IV
Certificate I/II
Certificate n.f.d.
school only
0.0 20.0 40.0 60.0 80.0 100.0
% Employed full time
%Employed part time
%Unemployed
%Not in labour force
School only

Source: ABS ( 2012).
Although half of early school leavers engage in vocational education and training after leaving school (Curtis & McMillan 2008), previous research has shown that the completion rates of VET qualifications are relatively low, with just 30% of students aged 25 years and under enrolled in certificate I or certificate II level courses completing and 40% of those enrolled in certificate III level courses completing (NCVER 2011, cited in Oliver 2012).
Whether the successful completion of certificate-level qualifications improves the chances of avoiding unemployment and securing full-time work is the focus of this paper. This research addresses the following questions: Is the completion of a certificate-level post-school qualification associated with securing
full-time employment? Is the completion of a certificate-level post-school qualification associated with higher
occupational status and/or annual earnings?
Data This project will analyse the first ten waves of the Housing, Income and Labour Dynamics in Australia Survey dataset. The data are collected from each individual aged 15 years or more in selected households throughout Australia (Summerfield et al. 2011). For this paper, I conduct analyses of one cohort of youth aged between 15 and 19 years in 2001 (n = 1245). Only 722 members of this cohort participated in Wave 10 of the data collection. In order to compare the outcomes of early school leavers who completed a certificate-level qualification after leaving school with early school leavers who did not complete a certificate-level qualification after leaving school, I restrict the analytical sample to the 143 individuals who left school before completing Year 12.
The descriptive statistics of the sample in 2001 and 2010 are presented in table 1. The SEIFA (Socio-Economic Index For Areas) Index of Relative Socio-economic Advantage/Disadvantage is compiled by the ABS using information such as income, occupation and levels of education as markers of relative advantage/disadvantage in a geographical area (ABS 2006). Although only half of the respondents provided data in Wave 10, the characteristics of those remaining in the sample are similar. Those aged 15 years in
26 22nd National Vocational Education and Training Research Conference ‘No Frills’:refereed papers
Bachelor Degree/post grad
Diploma /Advanced Diploma
Certificate III/IV
Year 12 or below
Not enrolled in study
0.0 20.0 40.0 60.0 80.0 100.0
employed
not em-ployed

2001 accounted for a slightly larger proportion of the sample in 2010 (20% compared with 23%) and those aged 18 years in 2001 accounted for a slightly smaller proportion of the sample (19% compared with 17%). Those in the lowest decile of the SEIFA index accounted for a slightly larger proportion of the sample in 2010 (13% compared with 11% in 2001), whereas those in the fifth decile accounted for a slightly smaller proportion of the sample in 2010 (8% compared with 10% in 2001).
NCVER 27

Table 1 Selected characteristics of the sample in 2001 and 2010
Characteristic 2001 n = 1245%
2010 n = 722%
Male 50 49
Female 50 51
Age in 2001
15 years 20 23
16 years 22 22
17 years 20 20
18 years 19 17
19 years 19 18
SEIFA
Lowest decile 11 13
2nd decile 13 13
3rd decile 11 11
4th decile 8 7
5th decile 10 8
6th decile 9 8
7th decile 9 8
8th decile 8 9
9th decile 11 11
Highest decile 11 11
Source: HILDA release 10.
Findings and discussionDue to the small size of the analytical sample, descriptive statistics were used to answer the first research question: is the completion of a certificate-level post-school qualification associated with securing full-time employment? Early school leavers are divided into four groups: early school leaver males with no post-school certificate-level qualifications; early school leaver males with post-school certificate-level qualifications; early school leaver females with no post-school certificate-level qualifications and early school leaver females with post-school certificate-level qualifications.
Table 2 shows that early school leaver males who completed a certificate-level qualification were more likely to be employed on a full-time basis in 2010 than early school leaver males who did not complete a certificate-level qualification (88% compared with 72%). Early school leaver females with and those without a certificate-level qualification have similar full-time employment rates; however, those without a certificate-level qualification are far less likely to be participating in the labour force than those with a certificate-level qualification (45% compared with 25%).
Table 2 Employment status in 2010 by sex and education
Male Female<Year 12 n = 53
%Certificate n = 17
%<Year 12 n = 53
%Certificate n = 20
%Employed full-time 72 88 26 25
Employed part-time 11 0 23 40
Unemployed 6 6 6 10
Not in the labour force 11 6 45 25
28 22nd National Vocational Education and Training Research Conference ‘No Frills’:refereed papers

Source: HILDA release 10.
To answer the second research question: is the completion of a certificate-level post-school qualification associated with higher occupational status and/or earnings? T-tests were conducted, comparing the outcomes for early school leaver males with and without post-school certificate-level qualifications and the outcomes for early school leaver females with and without post-school certificate-level qualifications. The results presented in table 3 show that the completion of a certificate-level post-school qualification is not associated with higher occupational status or higher earnings. Values on the occupational status variable were assigned by the HILDA team using the AUSEI06 scale compiled by McMillan, Beavis and Jones (2009). For respondents who were not employed in Wave 10, the occupational status score refers to that of their last job.
Early school leaver males with a certificate-level qualification scored, on average, 30 on the occupational status scale and early school leaver males scored, on average, 33 on the occupational status scale. Early school leaver females with a certificate-level qualification scored, on average, 37 and early school leaver females scored, on average, 33 on the occupational status scale. Further, early school leavers males with a certificate-level qualification reported higher earnings than other early school leaver males, and early school leaver females with a certificate-level qualification reported higher earnings than other early school leaver females. In both cases however, the p-values indicated that these differences were not statistically significant.
Table 3 Mean occupational status and earnings, by sex and education
N = Occupa-tional status
Difference P-value n = Earnings Difference P-value
Male <Year 12 53 33 -3.0 0.4297 39 44 529 4 563 0.5901
Male certificate 17 30 12 49 092
Female <Year 12 53 33 4.8 0.3579 31 28 167 2 763 0.6845
Female certificate 20 37 10 30 930
Source: HILDA release 10.
These findings are not altogether unexpected, with previous researchers finding little tangible benefit from the completion of certificate-level qualifications. Using LSAY data, Oliver (2012) found that males who had completed a certificate I or II had similar outcomes to males without these certificates and that females with certificate I or II qualifications had poorer outcomes. Furthermore, Oliver concluded that these lower-level qualifications were not associated with increased wages. Over the longer-term, graduates with lower-level certificates were more likely to be enrolled in higher-level VET courses than individuals with similar characteristics who had not completed certificate I or II. Ryan’s (2011) examination of the LSAY data showed that the completion of certificate II or III level qualifications was not associated with improved labour market outcomes, concluding that the completion of Year 12 provided better outcomes than the completion of certificate II or III qualifications.
The effect of completing a certificate-level qualification differs for each individual. To capture the distribution of these effects on an individual basis, I calculated the differences in occupational status scores and gross annual earnings at two time points: T3 refers to the year after completion of the certificate and T1 refers to the year before completion of the
NCVER 29

certificate. The particular year for each of these two time points may differ for each individual. To measure change in occupational status, I deduct occupational status score at T1 from occupational status score at T3. To measure change in earnings, I deduct earnings at T1 from earnings at T3. To account for inflation, earnings at each time point are converted to 2010 dollars using the Consumer Price Index (CPI), provided by the ABS (2013b). The descriptive statistics for those with values at both T1 and T3 are presented in table 4. The median score for difference in occupational status is zero, which is not surprising for those completing a certificate III/IV since they were likely to be completing apprenticeships and therefore would be employed in the same occupation before and after completion of their qualification. That there is no difference for those completing a certificate I/II is harder to explain. The median increase in annual gross earnings for those completing a certificate was around $13 000.
Table 4 Differences between occupational status and earnings at T3 and T1
Cert. level n = Range Mean Median Std dev.
Status difference I/II 68 -39 to 52 5.6 0 16.1
Status difference III/IV 105 -25 to 76 7.9 0 16.3
Earnings I/II 31 -7 952 to 33 333 11 646 13 263 8 280
Earnings III/IV 58 -25 220 to 75 913 15 907 13 212 16 192
Source: HILDA release 10.
ConclusionsThis paper set out to determine whether the successful completion of a VET qualification after exiting school before completing Year 12 was associated with an increased probability of being employed on a full-time basis and with having a higher-status occupation and/or higher earnings. The results presented here show that early school leaver females who had completed a certificate-level qualification were more likely to be employed than other early school leaver females but there was no difference in the percentages employed on a full-time basis. Compared with their peers, males and females who completed a VET certificate-level qualification were no better off in terms of occupational status or annual earnings.
Acknowledgment This paper uses unit record data from the Household, Income and Labour Dynamics in Australia Survey. The HILDA Project was initiated and is funded by the Australian Government Department of Social Services (DSS) and is managed by the Melbourne Institute of Applied Economic and Social Research (MIAESR). The findings and views reported in this paper, however, are those of the author and should not be attributed to either DSS or the MIAESR.
ReferencesABS (Australian Bureau of Statistics) 2006, Introduction to Socio-Economic Indexes for Areas
(SEIFA), Information paper, ABS, Canberra.——2012, Education and work, Australia, May 2012, cat.no.6227.0, ABS, Canberra.——2013, Labour force, Australia, cat.no.6202.0, ABS, Canberra.——2013b Consumer Price Index, Australia, cat.no.6401.0, ABS, Canberra.
30 22nd National Vocational Education and Training Research Conference ‘No Frills’:refereed papers

Biddle, N 2007, ‘The labour market status of Australian students: who is unemployed, who is working and for how many hours?’, Journal of Education and Work, vol.20, no.3, pp.179—209.
Bosch, G & Charest, J 2008, ‘Vocational training and the labour market in liberal and coordinated economies’, Industrial Relations Journal, vol.39, no.5, pp.428—47.
Curtis, D & McMillan, J 2008, School non-completers: profiles and initial destinations, LSAY research reports no.54, ACER, Melbourne.
Department of Education, Employment and Workplace Relations 2010, Australian jobs 2010, DEEWR, Canberra.
——2012, Australian jobs 2012, DEEWR, Canberra.Marks, G 2006, The transitions to full-time work of young people who do not go to university,
LSAY research report no.49, ACER, Melbourne.McMillan, J, Beavis, A & Jones, FL 2009, ‘The AUSEI06: a new socioeconomic index for Australia’,
Journal of Sociology, vol.45, no.2, pp.123—49.Oliver, D 2012, Lower-level qualifications as a stepping stone for young people, NCVER,
Adelaide.Pomfret, R 2009, ‘The post-2007 financial and policy challenges facing Australia’, Economic
Papers, vol.28, no.3, pp.255—63.Summerfield, M, Dunn, R, Freidin, S, Hahn, M, Ittak, P, Kecmanovic, P, Li, N, Macalalad, N,
Watson, N, Wilkins, R & Wooden, M 2011, HILDA user manual — release 10, Melbourne Institute of Applied Economic and Social Research, University of Melbourne.
Ryan, C 2011, Year 12 completion and youth transitions, LSAY research report no.56, NCVER, Adelaide.
Teese, R & Polesel, J 2003, Undemocratic schooling: equity and quality in mass secondary education in Australia, University of Melbourne Press, Melbourne.
NCVER 31

Workplace change and skill needs: workers’ perceptions Darryl Dymock and Mark TylerGriffith University
AbstractThis paper reports on worker perceptions of workplace change and the determinants that drove the need to change workplace practices and skills for a particular cluster of Australian workers. It takes the position that in developed countries change in the workplace is inevitable and ubiquitous, and that whatever the forces, external or internal, the demand for different and varied sets of knowledges and skills is high and dynamic.
This paper contends that the impact of reported changes to a workforce’s productivity — through globalisation of industry, introduction of new technology, and organisational restructuring — are not necessarily directly experienced by workers, but are more causal in their relationship to how they affect the enterprise level of operations in organisations. This position was deduced from an examination of the impact of change on workers in four different industries. These workers were asked about changes in the way they carried out their work practices, both current and anticipated. Using a qualitative methodology it was found that these workers considered change primarily as a factor of their work tasks, and that their responses to this change was to maintain their workplace competence and hence their employment. The implications from these findings highlight a position that the most appropriate setting for a worker’s individual learning is the workplace itself, and that this alone necessitates a sharper focus on how learning in the workplace is supported.
Introduction The continually changing economic and industrial environment in Australia has meant that organisations have had to find ways of responding to the various influences that affect their operations, in order to remain productive and competitive. Changes emanate from such factors as the globalisation of industry, introduction of new technology, and organisational restructuring. The extent and nature of the influences, and hence the type of response required, differs from industry to industry and is also dependent on the size and nature of the organisation. For example, globalisation may arguably have a greater impact on a manufacturer than on a service provider.
One way of responding to change is through upskilling the workforce. An employer may provide training in order to ensure that employees are equipped to cope with the changes imposed on them by external and internal influences. Not all changes require substantial training, however, and may be better met through the responses of individual workers. In fact, the significance of workers learning on the job has been highlighted In recent research on workplace learning (e.g. Billett 2001, 2010; Fuller & Unwin 2004, 2011). Learning on the job may therefore be a key element in how a worker responds to change.
32 22nd National Vocational Education and Training Research Conference ‘No Frills’:refereed papers

In the study reported in this paper, part of a larger research project on continuing education and training (Billett et al. 2012), 86 Australian workers from four different industries were asked about recent changes in their jobs and the changes they anticipated in the future. Some of them identified broader influences at the industry or enterprise level; others saw change in terms of their own careers, and a small number claimed their job had remained the same and that they foresaw that this would continue. However, the largest group nominated specific changes to their own workplace practice as having the greatest impact to date and in the future. This finding has implications for how such learning might be organised or facilitated and how the workers might best be engaged in that learning.
The interviewees’ responses are discussed in this paper within conceptual frameworks established by the literature on workplace change and workplace learning. Examples include a report by the Australian Workforce and Productivity Agency (2013), which identified the broad yet prominent workplace changes mentioned in the introduction above. At the intermediate level — the enterprises — the workplace changes are productivity, competition and new products and services, as a response to the broader changes given above (Watson et al. 2009). Misko (2010) offered a micro perspective in relation to the demands on worker skills and practices — she showed that advances in information communication technology (ICT), an increase in the number of regulatory frameworks concerned with how jobs are done, and the increasing demand on workplace cultural sensitivity, environmental sustainability and consumer demand had contributed to the demands on workers to upskill and tackle new tasks. Stern and Sommerlad (1999, cited in Lee at al. 2004) suggested that three broad approaches to workplace learning had developed: the workplace as a site for learning; the workplace as a learning environment; and learning and working as being inextricably linked. Such conclusions all highlight the increasing importance of the workplace as a context for learning.
This paper argues that workers mainly have their own workplace practice as their focus for learning in response to change, and that the implication arising from this focus is that the most appropriate setting for individual learning in response to change is likely to be the workplace itself. Those conclusions are based on an analysis of the findings from semi-structured interviews with 86 workers from four industry sectors: services; mining; health and community services; and financial services. The workers were asked about recent changes in their current jobs, and about changes they anticipated in the future. All interviews were audio-recorded and transcribed, and a thematic analysis (Liamputtong 2009) was employed to note patterns of meaning across worker responses on current and anticipated changes in their workplace.
Workers’ responses Current changesAsked what changes they had experienced in their current work, 15% of those interviewed indicated that the nature of their jobs had remained the same over the years. For example, one mine worker said, ‘my current job has not changed in the last six and a half years’. But interestingly, he did note that he was not selected for particular work tasks, due to his level of literacy. A cleaner stated, ‘it’s pretty much the same’, when referring to his cleaning role, and another in the same occupation said, ‘I was employed to do a specific job, and I’m still doing that specific job’.
NCVER 33

The rest of the interviewees, however, identified 93 instances of change in their current workplaces, several nominating more than one. Those changes can be categorised as: variations in workplace-wide policy or procedures that affected what they did; being asked to perform a different role; and changes in the nature of the work performed.
Instances of recent changes in policy or procedures that affected workers’ current jobs accounted for 35% of responses, by far the highest-scoring category. For example, a mining worker drew on an example associated with safety: ‘a brand new permit-to-work system … of checks and balances … on machinery or well heads’. This worker also noted the sometimes confusing aspects in dealing with these changes, particularly when they are seen to be ‘obstructive and almost contradictory’. This worker’s aim in this circumstance was to ‘settle and balance’ new practices within the workflow. A services worker told of how her employer was seeking to ‘better create a bond between [themselves] and community’. Staff were therefore expected to take on ‘community engagement and community relations roles’ because of the not-for-profit standing of the organisation. A finance worker explained how their employer enrolled workers in different courses ‘to teach you about how to do certain things and how to use a certain system’ and that this is augmented with a new buddy system for teaching new practices.
Twenty per cent of workers indicated that they had experienced recent changes to the role they performed within the enterprise. None actually spoke about promotion or demotion. However, all indicated that undertaking new roles was not associated with the role they originally occupied when starting with the organisation. For example, a person employed in the finance industry stated, ‘I moved from corporate to litigation’, and a colleague moved from economics and finance to tax. Both instances are indicative of a degree of mobility in the enterprise that was beneficial to them, in that they experienced a tighter fit between their skills and knowledge of particular work roles. An office worker in mining said, ‘I started as a cleaner’ and now this worker occupies the role of administration officer dealing with payrolls. A colleague in the same office reflected some positive sentiments relating to the experience of these kinds of changes: ‘it’s been different procedures … so my job runs smoother and so everyone else’s job runs smoother as well’. But this position of more fluent workflows is not necessarily experienced by all, as seen in the following category.
Fifteen per cent of participants indicated there had been changes in the nature of the work they undertook. For a few, the expansion of tasks was related to the aim of obtaining more efficiencies in work practices, while the majority of this group indicated that the change produced more work for them; that is, work intensified as a result of these changes. For example, a services industry worker in a tourist facility stated: ‘I’m now working in four or five different fields’, indicating that a broadening of expertise is necessary to carry out his responsibilities effectively. An animal trainer at the same facility said, ‘I also do a lot of cleaning, preparation [and] commentary … we do a big variety’. A fast food worker indicated how expanding work tasks, as a result of ‘organisational changes happening — the structure and that kind of thing’, have created work intensification: ‘It took a long time for me to catch up on all that work’. An administrative support person reported that she moved from receptionist to personal assistant (PA) and with that move came changes to the number of managers for whom she became PA. She stated that ‘temps’ were employed but they were limited in their skills, so she had to deploy a particular attitude, ‘just rolling your sleeves up and doing what you need to do and not be precious about that’s your job or my job’. In the aged sector, a worker reported that a change in work tasks was a result
34 22nd National Vocational Education and Training Research Conference ‘No Frills’:refereed papers

of changes in resident capability. In recent times ‘clients are coming in who are particularly vulnerable’. The level of care and attention was more intense for these less able clients, producing an increase in workload.
For a few of the participants, workplace change came as a result of changing their employment. For example, a financial services worker said, ‘last year I finished my degree … got this job which isn’t in health for a change … I love being in management’. A colleague in the same unit said, ‘I was a systems facilitator; now I’m new to management’, while a person in mining said ‘I do the same thing, but just a different company’, and ‘I don’t mind it at all. It keeps your mind busy and that, but it’s good’. These participants indicated a positive outcome in relation to their enterprise moves.
Among the interviewees, there was also a strong anticipation of future changes in work practices, as discussed in the next section.
Future changesFrom the 86 interviews, 78 responded to the question about the future changes they foresaw in their jobs. A handful answered the question in the context of their own career goals, identifying their individual aspirations and intentions; for example, ‘I want to be an operations manager one day’ (mines worker); I’m hopefully going into management into the future, so looking forward to that’ (hospitality worker); ‘I’ve expressed interest in doing the accounts and [my boss] said he would probably let me do that in the future’ (services worker); and ‘I do have visions of where I want to go’ (finance worker).
Almost a quarter thought there would be no change or very little change in their jobs, which suggests they were also not anticipating any changing skill composition; for example, ‘I honestly don’t know’ (mines worker); ‘It’s fairly standard [work]’ (hospitality worker); ‘I’m not expecting my job to change in any way’ (services worker); and ‘I don’t see much change in regards to my job’ (aged care worker).
The balance of those interviewed predicted that more changes were coming, however. For example, 20% of the interviewees identified broader influences on future changes in their work, more in line with those generally discussed in research about workplace change. For example, a finance worker in a government institution anticipated that change might arise through a growth in grant income, which would lead to an increase in the amount of project activity, while another in the same field, but in a private company, said that the nature of their work depended on what was happening in the marketplace. A services industry worker replied that ‘It depends who is in the government — which way the wind changes’, and a professional in aged care was waiting to see if a new registration board might bring amendments to professional development requirements. In the mining industry, a worker anticipated changes to ways of working with the introduction of a company-wide policy of ‘working leaner’.
The largest proportion of responses to the question about future change, almost two-thirds, identified examples of future work-related job changes, with some interviewees nominating more than one likely change specific to their own workplaces. The examples included changing personal work roles, the introduction of new systems, changed or uncertain personnel arrangements and internal policy. Most often mentioned was the introduction of new technology of various kinds, followed by instances of services for new clients or
NCVER 35

customers. In relation to aged care, new services requiring the learning of new skills reflected changing societal practices, such as people continuing to live in their homes for longer than in the past and therefore presenting at an older age for institutional care with potentially more advanced care needs. Only two interviewees mentioned the introduction of new products as elements of change, but only a few of the 86 interviewed for the project were from retail, so the number is likely to be low in any case.
DiscussionMost of the small number of respondents who thought there had been no change in their current job or anticipated there would be no change in the future were in low-skilled jobs: several were cleaners, who believed, perhaps not unreasonably, that cleaning methods had not changed and were unlikely to change, while others were in jobs in mining such as sand-blasting and general maintenance. Several people in administrative positions initially indicated that their jobs had not changed until the researchers asked probe questions; the interviewees then realised they could cite instances of change, for example, of new technology. In these cases, it seems likely that the new learning was so much part of their work that they simply absorbed it into their work practices without recognising the upskilling that had taken place. This is very much in line with the third of the approaches to workplace learning identified by Stern and Sommerlad (1999), in which learning and working are inextricably linked.
Of the broader influences affecting jobs, those directly nominated fell mainly into the categories of economic, social and regulatory developments, and are among those identified by the Australian Workplace Productivity Agency (2013), Burke and Ng (2006) and Misko (2010). Wider influences noted in the research literature but not evident in the interviewees’ responses include environment and population sustainability (Australian Workforce and Productivity Agency 2013), offshoring (Burke & Ng 2006) and an increased need for cultural sensitivity (Misko 2010).
In considering the sources of the changes identified by the interviewees in relation to the suggestion by Skills Australia (2010, p.18) that ‘new skill demands may flow from the changing skill composition of existing occupations, resulting from new technology, services or products’, the majority of the examples did not lie within these three areas: respondents claimed that both current and future change had emerged from within the organisation itself. Some of the examples of change were concerned with their changing role within the enterprise — workers indicating changes that came about as a result of them taking on new roles; for example, moving from receptionist to office clerk. Others related to expanded work tasks: instances where workers were in their same work role, but the scope of work had increased and included additional tasks. There were also instances of change resulting from moving to a new job within the organisation. Another key area of change was associated with internal policies and systems, which required employees to learn new skills.
This analysis of responses indicates that, of the three potential influences on change in the workplace, the workers interviewed perceived only the introduction of new technology as a major driver of changing work skills. However, it is noteworthy that the examples given, even when organisation-wide, were related to how that new technology would affect their work practices, such as in recording patient data in aged care. That emphasis on how
36 22nd National Vocational Education and Training Research Conference ‘No Frills’:refereed papers

changes would impact on work practices is pervasive throughout the transcripts of interviews, as is the perception that the main pressures for change arose from within their own organisations. These findings have major implications for how new learning might best be organised.
The first key factor that needs to be considered is the context-specific nature of the way that change influences work practices. Interviewees overwhelmingly saw their own job as the focus of any change, which suggests that forms of workplace learning are likely to be the most effective in fostering the development of new skills and knowledge. This is in line with Lave and Wenger’s (1991) concern with situated cognition, and confirms Watson et al.’s (2009) observation about workers seeing organisational practices in terms of those that affect their own work.
The examples provided also tend to substantiate the conclusions of Hetzner et al. (2009), who propose a link between learning (in response to change) and both the nature of the work and the working environment. The second key factor that emerges from the analysis of the data is therefore the role of the workplace in supporting learning. This brings into play Fuller and Unwin’s (2004) notion of the expansive workplace, where a diversity of experiences encourages workplace learning. It also supports Billett’s (2001) argument for the ‘co-participation’ of individual engagement and workplace affordances; that is, that learning in the workplace occurs through the interaction of a worker's effort and the support provided by the employer and the working environment. Lee et al. (2004) argued that it is difficult to distinguish between those two concepts, and there is evidence from the interviews that workers respond to the change happening around them as part of their everyday work role, without necessarily consciously ‘engaging’ in new learning. Nevertheless, it can be argued, as Fuller and Unwin (2011, p.13) do, that each worker will ‘exert their individual agency in terms of how far they decide to participate in (and help to shape) the opportunities that the workplace offers to them’.
There is also clearly a key role for the workplace in this process. If workers see the need to update their skill sets in order to carry out their job more effectively in response to change and are apparently willing to undertake new learning of their own accord, an expansive workplace (Fuller & Unwin 2004) seems a desirable attribute. There is also a case for a workplace curriculum, as Billett proposes (2001), which can help ‘structure’ new learning to make it more effective through such strategies as coaching, mentoring and guiding.
ConclusionOn the basis of the interview responses reported in this paper, the most effective learning for the sorts of changes the workers perceived in their current jobs and in the future appears to be through a focus on individual work practices. The ideal scenario seems therefore to be one where the individual motivation of the learners is enhanced by support from their organisation. Although this concept of situated learning in the workplace is not new, this paper has shown that such learning appears to be particularly appropriate for the changing skill composition that workers require in order to remain competent in the face of constant change. This is not to say that more significant enterprise- or industry-wide reformations will not require more structured approaches, possibly including accredited training. Further research is needed to explore the extent of differentiation between the
NCVER 37

sorts of changes that engender individual learning in the workplace and those that require a more substantial whole-of-workforce development response.
ReferencesAustralian Workforce and Productivity Agency 2013, Future focus: 2013 National Workforce
Development Strategy, AWPA, Canberra.Billett, S 2010, ‘Workplace participatory practices: conceptualising workplaces as learning
environments’, Journal of Workplace Learning, vol.16, no.6, pp.312—24.——2001, ‘Learning through work: workplace affordances and individual engagement’, Journal of
Workplace Learning, vol.13, no.5, pp.209—14.Billett, S, Henderson, A, Choy, S, Dymock, D, Kelly, A, Smith, R, James, I, Beven, F, & Lewis, J
2012, Continuing education and training models and strategies: an initial appraisal, NCVER, Adelaide.
Burke, RJ & Ng, E 2006. ‘The changing nature of work and organizations: implications for human resource management’, Human Resource Management Review, vol.16, no.2, pp.86—94.
Fuller, A & Unwin, L 2004, ‘Expansive learning environments’, in Workplace learning in context, eds H Rainbird, A Fuller & A Munro, Routledge, London.
——2011, ‘Workplace learning and the organization’, in The SAGE handbook of workplace learning, Sage, Thousand Oaks, CA, pp.46—59.
Hetzner, S, Gartmeier, M, Heid, H &Gruber, H 2009, ‘The interplay between change and learning at the workplace: a qualitative study from retail banking’, Journal of Workplace Learning, vol.21, no.5, pp.398—415.
Lave, J & Wenger, E 1991, Situated learning: legitimate peripheral participation, Cambridge University Press, Cambridge.
Lee, T, Fuller, A, Ashton, D, Butler, P, Felstead, A, Unwin, L & Walters, S 2004, ‘Workplace learning: main themes & perspectives’, Learning as work research: paper 2, University of Huddersfield, Eng.
Liamputtong, P 2009, ‘Qualitative data analysis: conceptual and practical considerations’, Health Promotion Journal of Australia, vol.20, no.2, pp.133—9.
Misko, J 2010, Responding to changing skill demands: training packages and accredited courses, NCVER, Adelaide.
Skills Australia 2010, Australian workforce futures: a national workforce development strategy, Commonwealth of Australia, Canberra.
Stern, E & Sommerlad, E 1999, Workplace learning, culture and performance, viewed 12 April 2013, <http://hdl.voced.edu.au/10707/129523>.
Watson, D, Galway, J, O’Connell, P & Russell, H 2009, The changing workplace: a survey of employers’ views and experiences, National Centre for Partnership and Performance, Dublin.
38 22nd National Vocational Education and Training Research Conference ‘No Frills’:refereed papers

Language, literacy and numeracy and vocational education collaboration: enablers and barriersRuth WalkerCooperative Learning Limited
AbstractThe introduction of the National Foundation Skills Strategy for Adults (Standing Council on Tertiary Education, Skills and Employment [SCOTESE] 2012) and the Foundation Skills Training Package (FSK) will demand a greater focus on developing language, literacy and numeracy (LLN) skills in all vocational education and training (VET) programs. To achieve this outcome it will be necessary for VET practitioners and language, literacy and numeracy practitioners to work collaboratively, each contributing their particular skills and knowledge. To accomplish this collaboration they will need the appropriate environment, resources, skills and attitudes. But what environment, resources, skills and attitudes will they need? What will be the enablers and barriers to their working together? The Language Literacy and Numeracy Vocational Education and Training Community of Practice (LLN/VET CoP) was created to explore these questions.
The community of practice research project was conducted by Cooperative Learning Limited in 2012 with funding from the New South Wales Department of Education and Communities. Using a combination of online discussions, face-to-face meetings, formal and informal learning, the Language Literacy and Numeracy VET Community of Practice allowed VET and LLN practitioners to share and build their knowledge and skills and to work together to develop materials for the Foundation Skills Training Package. The community of practice successfully modelled a particular type of collaboration involving literacy and numeracy and VET practitioners working together as equal partners in course development. Participants in the community of practice reported a greater awareness of and respect for the skills, knowledge and pedagogy of each other. They identified a range of enablers and barriers to their working together.
Introduction There are increasing demands for literacy and numeracy and VET practitioners to work collaboratively and yet this is not necessarily a simple process, as each often has different pathways into teaching, different pedagogical knowledge, and possibly different goals for their learners.
The need to work collaboratively is indicated by a number of factors, including the low levels of literacy and numeracy in the Australian workforce (ABS 2007; Australian Industry
NCVER 39

Group 2010; Innovation & Business Skills Australia 2010; Industry Skills Councils 2010; Skills Australia 2010), the increasing literacy demands of the modern Australian workplace (Australian Industry Group 2010; Industry Skills Councils 2010; National Quality Council 2009; Skills Australia 2010; Shomos 2010; Wheelahan & Moodie 2011), and the introduction of the Foundation Skills Training Package and the National Foundation Skills Strategy (NFSS). The National Foundation Skills Strategy sets a target that by 2022 at least two-thirds of working-age Australians will have literacy and numeracy skills at Level 3 (Adult Literacy and Life Skills Survey scale; ABS 2007) or above. In order to achieve this target it will be necessary to build the capacity of the education and training workforce to deliver foundation skills (Standing Council on Tertiary Education, Skills and Employment 2012).
Black and Yasukawa (2011) suggest that most current models of literacy and numeracy and VET practitioners working together are based on ‘deficit’ approaches, where LLN trainers work with those students who are pre-assessed as lacking in literacy and numeracy skills. In most of these models, the literacy and numeracy trainer is relegated to the role of support teacher. Such deficit models, they explain, contrast with alternatives where teachers work with all VET learners to develop the specific literacies and numeracies required for their chosen vocational field.
Black and Yasukawa call for a new ‘shared delivery’ approach with the potential to challenge both literacy and numeracy and VET practitioners to reconsider their way of teaching. A ‘shared delivery’ approach may take many forms, but essentially involves both trainers having equal status and input into the learning program as well as having the opportunity to influence each other’s pedagogy to better suit the needs of the students. The Language Literacy and Numeracy VET Community of Practice is one such ‘shared delivery’ model, because it involves LLN and VET practitioners working together in the planning stage of the course, developing training and assessment strategies and assessment tools.
The community of practice was designed to trial a shared delivery model, in response to the perceived need for literacy and numeracy and VET practitioners to find an effective way of working collaboratively and to answer the question: What are the enablers and barriers to LLN and VET practitioners working together?
Enablers are factors that make the job of working collaboratively easier, while barriers are those factors that make the job more difficult. Enablers and barriers may include such areas as support from management, funding, workplace culture, resources, skills, knowledge and practitioner attitude.
The community of practice gave VET and literacy and numeracy practitioners the opportunity to share their knowledge and skills and to work together. The researcher observed their interactions and drew the participants into reflective discussions about their experiences in the community of practice and what they considered to be the enablers and barriers to their working together.
The community of practice provided professional development for participants, piloted a shared delivery model, developed some useful resources and provided some valuable insight into the enablers and barriers for LLN and VET practitioners working together.
40 22nd National Vocational Education and Training Research Conference ‘No Frills’:refereed papers

MethodologyThe Language Literacy and Numeracy VET Community of Practice was conducted by Cooperative Learning Limited with funding from the NSW Department of Education and Communities. Cooperative Learning Limited is a cooperative of 16 community colleges in Northern NSW.
Participants in the community of practice were selected via an expression of interest process, which took into consideration their skills, knowledge and motivation. The competitive selection process resulted in six participants who represented an even mix of literacy and numeracy and VET practitioners. However, after an early withdrawal and replacement, the project was launched with four LLN and two VET practitioners. Participants were supported by a project facilitator, whose role included managing the expression of interest process, selecting participants, facilitating communication between participants, directing work timetables and deadlines, coordinating online sessions, facilitating validation sessions, promoting the project, observing the discussion and progress of the participants and researching the theoretical framework for the project.
The community of practice ran from February to December 2012 and involved two face-to-face meetings; ten online meetings, involving knowledge-sharing, validation and reflection; many asynchronous online discussions; two online surveys; and formal training in the unit of competency, TAELLN401A (Address adult language literacy and numeracy from TAE10 — Training and Education Training Package). The participants also spent many hours working in pairs to develop training and assessment strategies for qualifications from the Foundation Skills Training Package.
The project was conducted in four distinct stages: exploring participants’ current perspectives and experiences working together — developing skills working together — developing materials reflection.
The findings of the community of practice has certain limitations from a research perspective, considering that it captures the reflections and experiences of only six participants and focuses on a very specific aspect of shared delivery — the planning stage of shared delivery. Therefore, the findings may not necessarily be applicable to a broader group of practitioners or to other models of shared delivery.
Theoretical frameworkIn order to analyse the potential enablers and barriers of literacy and numeracy and VET practitioners working together, an ‘Integral Theory’ framework was chosen. Integral Theory was developed by Ken Wilber in the 1990s and provides a methodology or framework for analysing complex problems. Integral Theory tells us that there are four quadrants or aspects to reality through which we can experience or view the world: The Individual Interior (I); The Collective Interior (We); The Individual Exterior (It); The Collective Exterior (Its) (see figure 1).
NCVER 41

According to Integral Theory, any reality, situation, event, project etc. can be broken down into these quadrants and analysed to explore how that particular quadrant impacts on or contributes to the situation. Integral Theory allows us to bring multiple perspectives to bear in the analysis of a situation and suggests that a situation should be considered from the perspective of each of the quadrants. Ignoring any quadrant may lead to disharmony.
42 22nd National Vocational Education and Training Research Conference ‘No Frills’:refereed papers

Figure 1 Integral Theory overview
Integral Theory was applied to the situation of literacy and numeracy and VET practitioners working together in a shared delivery model (see figure 2). These analyses helped to identify some of the forces, ideas, concepts and infrastructure that may underpin the situation of LLN and VET practitioners working together.
Figure 2 Integral Theory applied to LLN and VET practitioners working collaboratively
NCVER 43

The community of practice sought to challenge typical practice in the upper right quadrant (individual exterior) and provide a model of ‘shared delivery’. It also sought to explore aspects of the upper and lower left (individual interior and collective interior) by exploring the reflections and experiences of the community of practice participants as they went about the business of working together.
The exploration of potential differences in pedagogy (lower left — collective interior) was of significant interest to the community of practice project and the reflections of the participants indicate an increased awareness of the differences in pedagogy1 between LLN and VET practitioners.
The teacher’s philosophy is one of the main factors underpinning the choice of methods and practice in teaching. In the case of LLN and VET practitioners, there may be differences in their philosophies and intended outcomes for students. That is, they may have different views about what literacy means and what they are trying to achieve for their students with regard to LLN development.
Lonsdale and McCurry (2004) argue that there are three main concepts of what language, literacy and numeracy means and that these three concepts may impact on pedagogy: The acquisition of language, literacy and numeracy skills is a cognitive, individual-based
activity involving the acquisition of a set of quantifiable skills. If an individual has not acquired these skills there is a problem with that individual. This model is commonly known as a deficit approach.
An economics-driven model is associated with workforce training, productivity and ‘functional’ literacy. This model is commonly known as a human capital approach.
A socio-cultural approach views literacy as a lifelong learning experience, where literacy is contextualised with multiple literacies developing over a person’s life.
More recently there has been much use of the term ‘social capital approach’. This approach suggests that literacy builds networks with others rather than for specific vocational and employment outcomes. A social capital pedagogy demands the creation of opportunities to make many links: teacher to student, student to student and student to outside networks such as employer, community organisations etc. (Leske 2010).
These four concepts of language, literacy and numeracy underpin the researcher’s interpretation of the community of practice participants’ reflections regarding their pedagogy.
Discussion and findingsPhase 1: Exploring current perspectives and practicesDuring this phase, participants took part in an online survey and both asynchronous and synchronous online discussions. They discussed current perspectives of their role as a literacy and numeracy or VET trainer and their experiences of embedding LLN in VET. They
1 In adult education we should perhaps use the term andragogy rather than pedagogy, but generally pedagogy is used as an overarching term and used in this paper to mean the method, practice and philosophy of teaching.
44 22nd National Vocational Education and Training Research Conference ‘No Frills’:refereed papers

discussed their initial views on the barriers to both categories of practitioners working together. The responses are summarised below:
▪ time management▪ ownership of intellectual property ▪ different focus/emphasis for student outcome. Limited knowledge in the other’s
domain▪ lack of experience or knowledge about the scope, conditions and practices of each
other’s worlds ▪ the VET trainer may only be looking at the level of course and not the ability to
adapt the content to allow the student to absorb the information and complete the qualification successfully
▪ lack of understanding of role of each teacher. No willingness to work as part of a team. Personality clash — different expectations. Lack of resources.
Also in this phase of the project, participants discussed their current practices with integrating language, literacy and numeracy and VET. The following comments are revealing with regard to perspectives and pedagogical approaches:
In LLN support in VET, I have always taken a 2-pronged approach — ‘getting the students through’ the VET component (i.e. modifying materials, making it accessible etc.) and improving LLN skills of students. Obviously, the improvements in LLN skills will be slow and in a short VET course probably minimal. This does not, however, mean it is insignificant.
The concern of ‘engaging students with LLN issues is difficult when their focus is vocational skills development’ points us clearly in the direction of utilising the vocational motivation as the vehicle for LLN development. I see the vocational motivation as the in-build [sic] rationale for students engaging in LLN skills development.
Pre-assessment may be an answer … maybe similar to the Naplan test … informing the trainer of the LLN level of skills for the individual and a suggestion of what VET courses are appropriate for them … This would solve the majority of VET trainer’s problems, I think.
Phase 2: Working together – learning togetherIn this phase the community of practice participants engaged in both formal and informal learning activities. They together attended a workshop on the Australian Core Skills Framework (ACSF) and all achieved the unit TAELLN401A, Address adult language literacy and numeracy, some via recognition of prior learning and some via course work. They provided training to each other via online sessions covering topics such as: introduction to the ACSF scaffolding as a strategy to facilitate LLN modes of LLN and VET integration streamlining training packages industry skills councils’ plans for representing the ACSF in units of competency case study of embedding LLN in food safety training.
NCVER 45

These opportunities to learn from each other allowed the participants to really appreciate the skills and knowledge of individuals in the group (individual interior) and the environment in which they were operating (collective exterior).
Phase 3: Working together – developing materialsIn this phase participants developed materials for the Foundation Skills Training Package.
This process involved a VET practitioner and a literacy and numeracy practitioner working together to develop the training and assessment strategy (TAS) for one qualification and the assessment tool for one of the units of competency from the qualification.
In this way they were required to work together, the process allowing the opportunity to learn from each other and become more aware of each other’s areas of expertise.
The approach involved a face-to-face workshop followed by email and telephone contact and online validation sessions.
Phase 4: ReflectionParticipants engaged in reflective practice throughout the process of working together in the community of practice. Reflection was conducted using both focus group sessions and individual written responses. Integral Theory was applied to develop the focus questions (see figure 3).
A full account of reflections can be read in the project report located at <www.http://www.chace.org.au/>. For this paper only those comments that relate to enablers and barriers have been recorded.
Figure 3 Reflective questions using Integral Theory
Some of the potential barriers to working together were identified as fear and personality concerns (individual interior):
46 22nd National Vocational Education and Training Research Conference ‘No Frills’:refereed papers

I think a lot of people are hesitant about team teaching, because they feel they might be judged.
Working together, it’s OK in principle, but it doesn’t just work in saying ‘we will work together’ because it’s a personality thing as well, but there must be some strategies and awareness training for both people.
Another barrier identified was lack of funding (collective exterior):it’s important that what we’re saying is backed up with funding so that people aren’t saying ‘oh we can’t do that because we don’t have time’ because really in relation to what I said before about outcomes, the funding will improve if you do your, if you conduct your courses well, and therefore it justifies the idea of spending more money in talking, planning and doing preliminary assessments and providing extra support.
Many of the comments from participants with regard to the likely success of working together referred to the importance of communication and personality (individual interior). They stated that the right people must be chosen to work together or at the very least they are afforded plenty of time and support to communicate and learn to work together.
We need to make sure that in the course planning there is time to talk together, this program shows a practical model of it, now I can get a visual picture of how it (working together) may work.
The experience of the community of practice shows that learning to understand each other’s ‘roles’ and perspectives is critical to ensuring that the working together is successful. The concept of ‘roles’ refers to an understanding of each other’s pedagogy (collective interior) as well as the practical considerations of who is going to do what and when.
I have learnt that mostly the LLN practitioner is about life skills and getting them to live a better life, whereas the VET practitioner is about gaining work, employment outcomes.
As an LLN teacher … from my early training, it was sort of always about educating people for life … But I get the idea that (now) it is really about employment, and this philosophy has really gone into LLN … and even the Foundation Skills Training Package, it’s a training package, it’s not a curriculum, it’s training people for work, it’s not training the whole person. So we [LLN practitioners] are having to shift a little bit … we have had a lot of freedom in the past as LLN teachers, and now I think we have to change our thinking.
I am concerned that the VET system will expect that after the trainers have done the TAELLN401A they can then work with the students from an LLN approach. My experience has been this is not enough and we are trying to put too many things on one person.
Many of the participants commented on the importance of learning each other’s language, terminology and processes (collective interior). This process of learning a common language allows for a merging of the LLN and VET practices.
I learnt a lot about training and assessment strategies, VET language, I have a better idea of RTOs and the paperwork required. I appreciated working with someone from the VET industry and understanding their side of things.
NCVER 47

I learnt a lot about the language LLN practitioners use within their training. For example ‘scaffolding’ — I associated this with the building trade not LLN requirements.
I really had no experience with training and assessment strategies (TAS), and I have learnt a great deal about reading the qualifications and writing the TAS and being informed about that connection with industry.
There were many comments relating to being given the opportunity to work together and how such experiences provide an excuse for LLN and VET practitioners to talk to each other.
What I really like about the fact that there are quite a few trainers doing that unit TAELLN401A is that they will have the conversations with the LLN people. That’s a stimulus for that conversation and … I think over time, because I know I have been having conversations over the last two years with the VET trainers about how we can best provide support for students in their programs but I think this is part of a really good step forward because it’s really engaging them it’s a requirement, so yes people do what they have to do, but I think in a really positive way, it prompts the conversations with LLN people.
By participating in the CoP it’s prompted me to have more discussion with the VET staff here in the college locally.
Participants were asked to identify their experiences and perceptions of enablers and barriers to working together. Figure 4 provides a summary of their ideas.
Figure 4 Summary of enablers and barriers
Enablers Barriers
LLN/VET ‘champions’ in organisations – LLN or VET practitioners with a commitment to working together and a knowledge of different models for working together
Limited understanding of the benefits of LLN and VET practitioners working together
Little experience in team teaching/shared delivery
Management support for LLN–VET collaboration Lack of direction regarding LLN qualifications required by those working with learners with LLN needs
Projects designed to allow LLN–VET collaboration
Creating a shared language and culture of sharing Not enough time for communication and development of the relationship between the two practitioners
Time for planning, communication and evaluation
Guidelines for LLN–VET collaboration Lack of direction regarding roles/expectations in a shared delivery situation
Acknowledgment of pedagogical differences Limited appreciation for skills/knowledge of the other practitioner (LLN or VET)
ConclusionThis project has contributed to a growing body of information about assisting literacy and numeracy and VET practitioners to work together. The community of practice has modelled a particular type of shared delivery, one that involves the LLN and the VET practitioner working together as equal partners in course development. Participants have reported a greater awareness of and respect for the skills and knowledge of each other and now have a greater awareness of each other’s pedagogy.
48 22nd National Vocational Education and Training Research Conference ‘No Frills’:refereed papers

The opportunity for working together afforded by the introduction of the Foundation Skills Training Package allowed both parties — LLN and VET practitioners — to exercise their skills with a new product for which neither had ‘ownership’. It allowed them to focus on the product — the training package — as the source of learning need, rather than on the ‘deficiencies’ of their potential students. In this way, the community of practice provided a direct focus on the language, literacy and numeracy demands of the units and on industry requirements.
Reflections show that this was a significant change in approach for at least some of the LLN practitioners, who in the past have focused their attention more on the literacy and numeracy needs of individual students, which is arguably a ‘deficit’ approach to LLN practice. For the VET trainers, the focus on the demands of the training package is more familiar, and for them the learning in the community of practice centred on gaining a deeper understanding of the LLN demands of the units and identifying strategies for facilitating LLN development.
The community of practice participants identified a range of enablers and barriers to LLN and VET practitioners working together.2 They demonstrated that there needs to be support from management, the trainers and the registered training organisation to encourage collaborative practice. This support must include funding. There also needs to be awareness and acknowledgment of the potential differences that may cause barriers to successful collaboration. Clearly defined roles are critical to successful collaboration, as is a shared language and a common understanding of pedagogical approaches.
AcknowledgmentsThe LLN/VET Community of Practice Project was managed by Cooperative Learning Ltd and funded by the NSW Department of Education and Communities.
Many thanks to the fantastic and dedicated CoP participants: Kirsten Elliott, Janette Jones, Margaret Kernahan, Yvonne Newman, Myola Woods and Vicki Zammitt.
Thanks to all the individuals who contributed to the project by taking part in online discussions and validation sessions.
ReferencesABS (Australian Bureau of Statistics) 2007, Adult Literacy Life Skills Survey, summary results,
Australia, ABS, Canberra.Australian Industry Group (AIG) 2010, National Workforce Literacy Project Report, viewed
January 2013, <http://www.aigroup.com.au/portal/binary/com.epicentric.contentmanagement.servlet.ContentDeliveryServlet/LIVE_CONTENT/Publications/Reports/2010/8783_Workforce_Literacy_Project_Report.pdf>.
Black, S & Yasukawa, K 2011, Working together: integrated language, literacy and numeracy support in vocational education and training, Centre for Research in Learning and Change, UTS, Sydney.
Information & Business Skills Australia 2010, VET workforce skills in language literacy and numeracy, IBSA, Melbourne.
2 It should be noted that the LLN/VET CoP represents a very small sample of practitioners working in a specific aspect of shared delivery; that is, the planning stage of shared delivery, and their findings may not necessarily be applicable to other situations or other shared delivery arrangements.
NCVER 49

Industry Skills Councils 2010, No more excuses, viewed January 2013, <http://www.isc.org.au/pdf/NoMoreExcuses_FINAL%20single%20page.pdf>.
Lonsdale, M & McCurry, D 2004, Literacy in the new millennium, NCVER, Adelaide, viewed December 2012, <http://www.ncver.edu.au/publications/1490.html>.
Leske, A 2010, Blind date: an exploration of potential partnerships between literacy teachers and community service workers, NCVER, Adelaide, viewed December 2012, <http://www.ncver.edu.au/publications/2307.html>.
National Quality Council (NQC) 2009, VET products for the 21st century: final report, TVET Australia, Melbourne.
Standing Council on Tertiary Education Skills & Employment (SCOTESE) 2012, National Foundation Skills Strategy for Adults, SCOTESE, Canberra.
Skills Australia 2010, Australian workforce futures: a national workforce development strategy, Skills Australia, Canberra.
Shomos, A 2010, Links between literacy and numeracy skills and labour market outcomes, Productivity Commission, Canberra.
Wheelahan, L & Moodie, G 2011, Quality of teaching in VET: options paper and the quality of teaching in VET: final report and recommendations, Australian College of Educators, Melbourne.
50 22nd National Vocational Education and Training Research Conference ‘No Frills’:refereed papers

Implications for learning and teaching in higher education delivered by private providers and TAFE and the role of university partners Lorraine BennettUniversity of BallaratMahsood ShahUniversity of NewcastleChenicheri Sid NairUniversity of Western Australia
AbstractGovernment ideology, funding and regulatory policies at the national and state levels, growth in technologies and a market-driven culture are having a significant impact on the tertiary education landscape in Australia. This is particularly evident in the blurring of the boundaries between universities and vocational education and training (VET) providers, including TAFE (technical and further education) institutes. It is also evident in the growth of private providers offering VET and/or higher education (HE) programs. Partnerships and collaborations across the sector are emerging in response to changing cultural and government policies, priorities and incentives. An important question for those interested in the learning experience and learning outcomes at the tertiary education level is: ‘what are the implications for learning and teaching of this changing landscape?’ To shed light on this question this paper examines the findings from three external reviews of private providers offering higher education programs. It also draws on initial feedback from TAFE institutes offering higher education programs through a partnership arrangement with a university. The paper identifies areas of strength and areas where improvement is required in the private provider programs. With respect to university partnerships with private providers and TAFE institutes, the paper discusses some positive aspects of these collaborations and suggests ways by which these partnerships could be strengthened to have a more positive impact on the learning experience and outcomes for students.
Introduction Tertiary education in the twenty-first century has already undergone substantial transformation, with further change predicted. The transformation is being driven by a number of factors, including economic pressures; political ideology and policies; social
NCVER 51

influences; advances in technology and online learning systems; market forces; and student demand. The boundaries between the higher education and the VET sectors are becoming blurred and another significant outcome of the change is the entry of a range of external private providers into both sectors.
The private providers have arisen from not-for-profit service and community organisations as well as from business and industry. According to the former Australian Universities Quality Agency (AUQA), in 2011 there were 194 registered higher education providers in Australia, made up of 150 private providers, 42 self-accreditation institutions, and two overseas universities (Australian Universities Quality Agency 2011). At a 2013 presentation at Victoria University to members of the Council of Australian Directors of Academic Development (CADAD), the Chief Commissioner of the Tertiary Education Quality Standards Agency (TEQSA) indicated that the 2013 figures are: 170 registered higher education providers, made up of 129 private providers, 40 universities and one university of specialisation; and, in addition two overseas universities.
The proliferation of providers, competition for students and a focus on alternative pathways have resulted in many Australian universities forming partnership arrangements with TAFE institutes, with private providers and with other universities throughout Australia and overseas. The agenda underpinning the partnership arrangements is framed by a desire to expand the university’s sphere of influence and offerings, to reach a wider pool of potential students, to increase participation in tertiary education and in particular higher education, and in many cases to maintain the viability of the institutions (Commonwealth of Australia 2009; Shah & Nair 2013).
Partnership arrangements across the sector are quite diverse (Wheelahan et al. 2012). They include co-teaching models, licensing models, moderation models, pathway models and recognition of prior learning (RPL) models, to name just a few. The impact on learning and teaching of these arrangements is substantial. The challenge of supporting the academic needs of diverse cohorts of learners, developing flexible and contextualised curriculum, providing engaging and sustainable delivery modes across disparate locations, creating positive learning environments, ensuring the appropriate professional development of partner staff and overseeing the quality assurance of programs and assessment are just a few of the areas for consideration and monitoring. This paper primarily draws upon a case study of three external quality reviews of higher education private providers to illuminate the diversity and complexity of the issues that should influence the negotiation and management of partnerships between universities and private higher education providers.
Approach and methodologyThe discussion in this paper is informed by three external quality reviews, undertaken by the authors, of private providers that offer higher education programs. Two of the private providers are based in Sydney and one in Melbourne. Each of the institutions offers VET programs as well as higher education programs and has arrangements with universities which include articulation and pathways into higher degree programs. None of the institutions had partnership arrangements that involved teaching university-badged programs. The purpose of the reviews was to examine the systems, processes and structures in place to monitor and ensure the quality of the learning and teaching of the
52 22nd National Vocational Education and Training Research Conference ‘No Frills’:refereed papers

higher education programs in the respective institutes. The reviews were framed by the priority areas in the Australian Universities Quality Agency’s quality audit factors nominated by the institutions for review and focused on governance and management; learning and teaching; enabling support; and quality assurance and enhancements.
The reviews included an analysis of a self-review portfolio prepared by each of the institutes. The self-review contained details on: governance structure; staff profiles; course materials; and, where available, the quality assurance processes for collecting and monitoring student and staff evaluation and feedback. A two-day visit to each of the institutes enabled the panel members to meet and interview academic board members, senior management, teaching staff, support and administration staff, and employers of graduates as well as past and current students, and to examine teaching spaces, study spaces and other learning support resources. The findings from these reviews were used to inform the discussion in this paper.
In terms of the private providers investigated, the questions of interest in this paper were: What did the external reviews of higher education programs reveal about the quality of
learning and teaching at these institutions? Which aspects of learning and teaching were handled well by the private providers and
what areas for improvement were identified?
The second source of data referred to in this paper is from a partnership between a regional university and six rural and regional TAFE institutes in Victoria. The underlying aim of the project is to increase participation opportunities for rural and regional students for undertaking university studies close to where they live and work. The focus of the project is to provide professional development to TAFE staff through a Graduate Certificate in Education (Tertiary Teaching) (GCETT) to enable them to better understand the higher education environment and to build their capacity to deliver applied degree and undergraduate degree programs locally. The project is underwritten by a $3 million grant from the Victorian Government
The Graduate Certificate in Education (Tertiary Teaching) is a four-course program and the participants undertake one course per semester over a two-year period. The program utilises a blended-learning approach, with six days of compulsory face-to-face participation and a choice of either face-to-face or online modules on topics relevant to learning and teaching in the higher education sector. The program is collaborative, contextualised and customised to provide flexibility and choice, which enables participants to select study areas of interest or address gaps in their knowledge and skill base.
The TAFE partners in this project were currently delivering or preparing to deliver university-badged higher education programs. The data used in the discussion in this paper were primarily captured in participant reflections, course feedback surveys and ePortfolio postings.
In terms of this paper, the questions of interest were: What are the skills, knowledge and values that TAFE teachers already demonstrate? What are the gaps or areas that need to be developed and supported in order for TAFE
teachers to operate effectively in a higher education environment?
NCVER 53
How valuable is professional development delivered through the Graduate Certificate in Education (Tertiary Education) in preparing TAFE staff to teach in higher education programs?
A subset of questions related to university and non-university partnerships were also considered. These questions were: What can universities do to support partnerships with non-university providers to ensure
the delivery of quality higher education programs? What risk management strategies are universities putting in place to ensure that the
quality and standards of higher education programs being delivered through partnership arrangements are monitored and maintained?
Should universities be concerned about the proliferation of non-university private providers in the higher education sector?
Findings and discussionPrivate provider reviewsThe external reviews of the higher education programs revealed a number of strengths with respect to the provision of quality learning and teaching at the three private provider institutes. Feedback from students indicated strong satisfaction with the calibre of the teaching staff. This was due to the fact that most of the teaching staff were practising professionals who were employed at the institutes on a sessional basis. Student comments frequently referred to the benefit of being exposed to current, authentic industry issues and practices. They felt motivated and inspired by the real-life, timely case studies, scenarios and situations with which they could readily identify. Several students also referred to the value of the industry connections made through their placements and through their teachers’ contacts and networks.
Students also spoke of the value of small class sizes. Some students had previously attended large universities and found them to be impersonal and overwhelming. A sense of connectivity and greater engagement and ready access to staff were cited as factors contributing to a positive learning experience. Other students indicated that they were not able to access university education due to demanding entry requirements and that the private provider option had given them a second chance. Staff reported that many of the second-chance students were highly motivated and achieved positive results when their learning was scaffolded with personalised and incremental learning. This was particularly evident among late developers.
Many of the students also endorsed the interactive and practical-oriented approaches used by the teaching staff. They were appreciative of the fact that they were being exposed to data, systems, tools and processes currently being implemented in industry. They felt that studying with the private provider had made them ‘work ready’ and some employers even described them as ‘the graduates of choice’.
The staff at the three institutions expressed their satisfaction with teaching part-time. They indicated that it gave them a chance to give back to their industry and they welcomed the opportunity to inspire and mentor the next generation of practising professionals. Teaching staff also referred to the value of the administrative support they received from the
54 22nd National Vocational Education and Training Research Conference ‘No Frills’:refereed papers

provider, which freed them to concentrate on their teaching. The administrative support was significant and ranged from routine communication with students, to reproduction of course resources and materials.
While the review found evidence of good learning and teaching practice across the three providers, it also identified some areas for improvement. The review noted that the providers were lagging behind the higher education sector with respect to the development and implementation of systematic quality assurance frameworks and processes. Although there were examples of ad hoc student surveys, overall the ‘student voice’ was not routinely being heard and acknowledged in any of the providers reviewed.
Support for the students’ academic skill development was patchy. The small classes meant that the teaching staff were often able to provide additional assistance to students but convincing evidence of well-resourced and readily accessible student learning support was minimal. This was an area that the panel recommended for attention and action in all three private provider institutes. Full-time academic leadership to direct curriculum renewal, assessments, and improvement in overall pedagogy was another area needing improvement. Clarity on who is responsible to find host employers to undertake placements was also inconsistent. The need to define expectations with students at the beginning of placements was also identified as an area for improvement. An issue common to all providers was a lack of planning for growth. In all cases, the rapid growth of students did not align with the adequacy of resources, for example, library materials.
There was also minimal evidence of systematic staff professional development amongst the providers reviewed. While most of the teaching staff were practising professionals, the link between practice and learning and teaching principles was not overtly supported or demonstrated. More attention to systematically building staff capacity through professional development activities and building a research agenda was recommended by the panel. A lack of attention to ongoing professional development, underpinned by research activities, for teaching staff was viewed as a significant missing element in the private provider culture, structures and processes examined. Performance in these areas is below expectation for a higher education provider. It was recommended that these areas be addressed in order to meet the current threshold standards monitored by the Tertiary Education Quality Standards Agency. These findings are consistent with the thematic analysis of audit reports by the Australian Universities Quality Agency undertaken by Winchester (2010), as well as analyses undertaken by Shah and Nair (2012), Shah and Lewis (2010) and Shah and Nair (2011).
TAFE staff capacity building projectIn the first 12 months of the delivery of the Graduate Certificate in Education (Tertiary Teaching) to TAFE staff a number of trends have emerged that help to inform the initial questions raised in this paper. With respect to the question: ‘what are the skills, knowledge and values that the TAFE teachers already demonstrate?’, it is clear that the TAFE staff engaged in the program already bring significant expertise to a higher education learning and teaching environment. For example, the well-established focus on the learner and the learning-centred teaching practised in VET settings mean that TAFE staff already acknowledge the need to start with what the learner brings to the learning environment. This demonstrates that TAFE teachers operate within a recognition of prior learning
NCVER 55

framework, in which industry skills and experience are acknowledged. Further, TAFE teachers are familiar with individual learning plans, which allow students to progress through their studies according to their needs and abilities.
Most traditional TAFE courses have a vocational focus and as a consequence TAFE staff are more connected to and aware of employability skills and industry trends than their counterparts in higher education. TAFE staff approach learning and teaching from a practical perspective. They regularly engage in activity-based learning and teaching and are aware of and in many cases utilise approaches to learning such as the ‘flipped classroom’ and the ‘jigsaw’ strategy, which have only recently gained traction in universities.
From the professional development work undertaken with the TAFE staff to date, it is apparent that, while many TAFE staff engage in innovative and learner-centred teaching, they sometimes lack the theoretical underpinnings to describe and report on their teaching approaches, in terms of the scholarship of learning and teaching. This is an issue more of unfamiliarity with the nomenclature and discourse of academia and an inability to describe their practice using academic language than a deficit in their teaching. At a recent learning and teaching conference, which was part of the TAFE Graduate Certificate in Education (Tertiary Teaching) program, participants were exposed to a range of inspirational academic presentations. At the end of one such presentation one of the TAFE teachers, close to tears, jumped up and exclaimed: ‘Thank you! Thank you!, you have given me the theoretical tools and language to enable me to understand, articulate and validate what I have been doing for years’.
Another area worthy of development in TAFE teachers relates to their exposure to and engagement in research. On the whole there is limited evidence among the TAFE participants in the Graduate Certificate in Education (Tertiary Teaching) cohort of their drawing upon or engaging in research related to their teaching practice.
University and non-university partnerships In terms of the question: ‘what can universities can do to support partnerships with non-university providers to ensure the delivery of quality higher education programs?’, both the review of the private providers and the university—TAFE partnership program strongly suggest that it would be wise for universities to support their partners by collaborating in such areas as quality assurance, professional development, student learning support and research into learning and teaching.
With respect to the question: ‘what risk management strategies are universities putting in place to ensure that the quality and standards of higher education programs being delivered through partnership arrangements are monitored and maintained?’, the data investigated was less clear. The limited evidence of embedded quality assurance processes in the private providers reviewed is of concern, while in the TAFE project, although there was evidence of assessment moderation, more work needs to be undertaken before this question can be fully considered.
The final question raised in this paper, ‘should universities be concerned about the proliferation of non-university private providers in the higher education sector?’, is not easy to answer. The investigation undertaken for this paper recognises the gap that private
56 22nd National Vocational Education and Training Research Conference ‘No Frills’:refereed papers

providers and TAFE institutes fill in the sector in terms of second-chance participants, practical-oriented programs, reduced student—staff ratios and localised delivery. While there is some concern about the lack of systematic professional development, quality assurance frameworks and strong theoretical underpinnings supported by a research culture in both the private providers and TAFEs, these deficiencies can and should be addressed by university partners to ensure the sustainability of quality higher education programs wherever they are delivered.
ConclusionThe findings from the external reviews of three private higher education providers and the university partnership project designed to build TAFE staff knowledge, skills and values to teach in higher education revealed several striking similarities. It is clear that professional and industry practitioners and vocational education-oriented TAFE teachers bring significant experience and work credibility to the higher education sector. This knowledge and skill needs to be respected and celebrated by university partners. However, in a highly regulated higher education environment, with an increased focus on assessing the level of risks to quality outcomes and the monitoring of academic standards, it is important to ensure that internal quality assurance meets the Tertiary Education Quality Standards Agency’s requirements. The current threshold standards have increased the focus on academic leadership and governance, staff qualifications and professional development. The identification in 2013 of international offshore as a high-risk area and third-party education delivery and English language support as two key quality assessment areas signal an increased focus on learning and teaching outcomes. Universities that adopt partnership strategies with national and international providers need to undertake regular risk analysis assessments to ensure that these arrangements meet the regulatory and review standards and processes of the Tertiary Education Quality Standards Agency and that all their students receive a high-quality education.
ReferencesAustralian Universities Quality Agency 2011, ‘Higher education private providers and non self-
accrediting institutions in Australia’, viewed 29 April 2014, <http://www.teqsa.gov.au/sites/default/files/auditreport_uow_2011.pdf>.
Commonwealth of Australia 2009, Transforming Australia’s higher education system, viewed 18 April 2014, <http://www.innovation.gov.au/HigherEducation/Documents/TransformingAusHigherED.pdf>.
Nair, CS, Bennett, L & Shah, M 2012, ‘Student experience in private higher education in Australia’, The ACPET Journal for Private Higher Education, vol.1, no.2. pp.24—30.
Shah, M & Lewis, I 2010, ‘Private higher education in Australia: growth, quality and standards’, Journal of Institutional Research (South East Asia), vol.8, no.2, pp.80—95.
Shah, M & Nair, CS 2011, ‘Engaging with quality: quality assurance and capacity building in private higher education’, Australian Quality Forum 2011, Australian University Quality Agency, Melbourne, pp.138—44.
——2012, ‘New dynamic in Australian higher education: the emergence of private for-profit higher education’, European Journal of Higher Education, vol.2, no.2—3, pp.307—17.
——2013, ‘Private for–profit higher education in Australia: widening access and participation and opportunities for public—private collaboration’, Higher Education Research and Development (HERD), in press.
Wheelahan, L, Arkoudis, S, Moodie, G, Fredman, N & Bexley, E 2012, Shaken not stirred? The development of one tertiary education sector in Australia, NCVER, Adelaide, viewed 18 April 2014, <http://www.ncver.edu.au/publications/2450.html>.
NCVER 57

Winchester, H 2010, ‘Executive summary of a review of the first 20 NSAI Audit Reports’, Australian Universities Quality Agency, viewed 18 April 2014, <http://pandora.nla.gov.au/pan/127066/20110826-0004/www.auqa.edu.au/qualityenhancement/publications/other/index.html>.
58 22nd National Vocational Education and Training Research Conference ‘No Frills’:refereed papers

The effect of a mentoring program on Indigenous apprenticeship completion in QueenslandBernard TrendleDepartment of Education, Training and Employment0
AbstractThis paper provides an analysis of completions and cancellations from apprenticeship training contracts in Queensland, focusing on the differences between Indigenous apprentices with and without a mentor. Interest lies in this topic because of the observed high cancellation rate among apprentices, and the generally higher rate for Indigenous apprentices. The study uses administrative data collected and maintained by the Queensland Department of Education, Training and Employment. A multistate modelling approach is adopted to account for the fact that many apprentices experience multiple episodes of training. Overall, the results indicate that apprentices with a mentor face a significantly lower risk of cancellation.
IntroductionApprenticeship remains an important pathway for young people making the transition from school into full-time participation in the labour force. Despite the importance of this pathway, Mangan and Trendle (2008) note that, of the 8078 complete records in the Queensland Direct Entry Level Training Administration (DELTA) database of people who commenced their apprenticeship in 2001, around 50% cancelled at least once up to the beginning of 2006.
Cancellation rates vary across demographic groups (See Bilginsoy 2003; Mangan & Trendle 2010), and an important issue is whether these differences are due to the characteristics of the group in question, or other factors such as the gender composition, age or occupational choice across the demographic groups that take up apprenticeships. One category with high rates of cancellation is Indigenous people, and it is well established that Indigenous Australians face considerable disadvantage in the Australian and Queensland labour markets.
While there have been a number of studies looking at the factors associated with increasing the probability of completion, including the largely descriptive analysis of Karmel and Mlotkowski (2010), overall little empirical work has been undertaken into the causes of cancellation among apprenticeship training contracts in Australia. Papers similar to the
0 This paper does not necessarily reflect the opinions or views of the Department of Education, Training and Employment or the Queensland Government.
NCVER 59

current one are provided by Ball (2004) and Stromback and Mahendran (2010), both of which looked at traineeship and apprenticeship cancellations and completions, and Mangan and Trendle (2008, 2010), who studied apprenticeship cancellation using Queensland data. Unlike these earlier studies, which focused on the time to first event, that is, cancellation or completion, this paper adopts a multistate modelling approach, which allows recognition of the fact that many of those apprentices who exit a training contract will recommence and perhaps complete at a later date. This modelling strategy is possible because the Queensland DELTA database includes a unique student identifier, which means that individuals can be followed through multiple apprenticeship training contracts.
DiscussionThe importance of mentoring can be explained from several perspectives. According to
social capital theory (see Coleman 1987), a mentoring relationship constitutes social capital that is critical to human development because it enables students to develop the necessary attitudes, efforts and conception of self they require to succeed. Social researchers have also found that human performance is influenced by perceptions of competence, positive expectations, perceived control and will. Similarly, poor performance derives not only from deficits in skills and abilities, but also from doubts, anxieties, negative expectations, pessimism and low self-esteem (Scheier, Weintraub & Carver 1986). Other researchers have examined the role of future expectations or aspirations on current performance, while Torrance (1983) noted that the way students see their future is directly related to their academic performance as well as their ability to live, cope, and grow in a high-change society.
The program which forms the basis of the case study shared many characteristics with case-management type approaches. One of the characteristics that set the program apart from ‘classic’ mentoring programs is its cultural context. All of the mentors were mature-aged Indigenous Australians of some standing in their respective communities. Further, classic programs tend to have a formal structure, with regularly spaced meetings. In contrast, mentors in the program under consideration could and often were contacted outside normal working hours. The cultural background of the mentors meant they had an understanding of the types of problems their mentees confronted. For example, in some situations an Indigenous apprentice, after sleeping in and missing the bus or train to work, might feel ‘shamed’ (that is, they have let themselves and their employer down), to the extent that they consider leaving employment without contacting the employer. Alternatively, because extended family plays a large role in Indigenous society, an Indigenous apprentice might miss work to attend the funeral of what wider society might consider a distant relative. In these situations, the mentor may play the role of an intermediary, often being required to contact the employer on behalf of the apprentice to explain the cultural context, and in the first example, perhaps also attempt to convince the apprentice to persist with employment.
The clients of the scheme were sourced from DELTA, which includes a variable to capture Indigenous status. The primary targets were those recently commencing their apprenticeship training contracts, as these apprentices are considered at a high risk of cancelling a training contract by comparison with apprentices who have been employed for
60 22nd National Vocational Education and Training Research Conference ‘No Frills’:refereed papers

some time. However, the mentors were in touch with all apprentices and used their links in the community and impressions gained during initial contact to determine those they considered most at risk. The mentors also took on a small number of apprentices and trainees, based on referrals from training consultants and other apprentices and trainees, or word-of-mouth in the Indigenous community.
The number of mentors increased significantly after the scheme’s inception in 2001, when five were employed. By 2006, when the apprentices used in this analysis commenced training, there were around 40 mentors. At the peak of this scheme, these mentors supported about 2000 apprentices and trainees in any given year. Under the scheme, individuals received assistance for as long as needed, with constant monitoring in the final year to ensure completion. The rise in the number of mentors meant that a high proportion of Indigenous apprentices and trainees received assistance. For those 666 Indigenous apprentices commencing in 2006, 273, or 41.0%, participated in the program.
Figure 1 provides a graphical presentation of the effect of the scheme on the probability of completion. The vertical axis records the cumulative incidence of completion, while the horizontal axis records the number of months from enrolment. The results indicate that a higher proportion of Indigenous apprentices with a mentor complete training than do those without a mentor. The gap widens as the term of the training contract increases. In contrast, the cumulative incidence of completion for the non-Indigenous and Indigenous apprentices with a mentor behave quite similarly over the 60 months from the point of enrolment, with the difference in the proportion completing being much less noticeable at the end point.
Figure 1 Completions for apprentices, with and without mentors, 2001–06
NCVER 61

MethodologyThe core of the current study is the Queensland DELTA administrative database, with Indigenous apprentices who commenced their first apprenticeship training contract in the 2006 calendar year being the focus of the analysis. The choice of the 2006 calendar year was motivated by two factors. Firstly, it takes a number of years to observe the outcome of a training contract, and the 2006 data allow an analysis of transitions in and out of training towards completion over a 60-month period. Secondly, rather than using dummy variables for each trade occupation, this analysis uses the occupational category to derive a measure of the average income for each trade. The idea is that differences in the expected income of each occupation provide more or less incentive to complete training, and 2006 coincides with a census year, with ABS census data providing an opportunity to calculate detailed (4-digit) occupational incomes.
The data used in this study have some unique characteristics. In particular, apprentices may either enrol and complete their apprenticeship in a single episode or record multiple episodes of training, with the last observed episode ending in cancellation, completion, or a still-active training contract. Some studies of apprenticeship have used combined end points to study the effects of various factors in determining the outcome of an apprenticeship training contract (see for example, Bilginsoy 2003; Mangan & Trendle 2008, 2010). Other studies, such as Ball (2004) and Stromback and Mahendran (2010), are even more wasteful of the information in the data and reduce the study to a binary outcome type-analysis (cancellation or completion, with the time dimension of training omitted completely).
The approach adopted here sought to use as much information as possible. Survival analysis, the study of the time to a particular event; for example, recovery or death after the onset of a disease, has been a common and well-accepted strategy to study treatment effect when using event history data. During the last few years in biomedical research, however, there has been an increasing interest in assessing the therapy effect, not only by using time to death, but also time to surrogate events, such as time to hospitalisations. A parallel exists in the data covering apprenticeship training contracts, where many apprentices cycle through multiple training contracts before acquiring a qualification.
The inclusion of a unique student identifier in the Queensland DELTA administrative database allows apprentices to be followed through multiple episodes of training, enabling the use of techniques which include this information. Several modelling strategies could be used to study the impact of various factors on the probability that apprentices will complete their training contract as they cycle through multiple episodes of training. In this study we initially considered two broad types of modelling strategies, these being marginal models and multistate models. While marginal models offer flexibility in the formation of strata and risk sets, they do not capture the distinction between the types of events, and a very important feature of our data is that cancellation, return, and completion cannot be considered equal. This limitation led to the adoption of a multistate model. (For a simple introduction see Castañeda & Gerritse 2010.)0
0 A multistate process is a stochastic process with a finite number of state spaces (events) with right continuous sample paths (events occur in time, with time moving from a start point [enrolment] to some truncated end point, which is 60 months after enrolment in our sample).
62 22nd National Vocational Education and Training Research Conference ‘No Frills’:refereed papers
Non-Indigenous

Cancellations 1 through 5
Entry
1
Completion
2 3 4 5
Figure 2 presents a diagrammatic representation of our multistate model, with the boxes representing the states, while the arrows between the states represent possible transitions. With the data from time of enrolment censored at 60 months,0 the maximum number of cancellations recorded by the 666 Indigenous apprentices in our dataset is five. Some apprentices have more than one episode of training before completion. For this reason the model includes re-entry into training (shown by the four horizontal arrows) and distinguishes the event of completion from the event of cancellation.
Figure 2 Schematic representation for full multistate model of apprenticeship
The proposed multistate model, a schema of which is provided in figure 2, does not fit neatly into the assumptions underlying the nature of the transitions made in the marginal modelling strategies. The first event can be either a cancellation or completion (competing risks); an apprentice is not at risk for a second cancellation until he/she experiences a first cancellation (ordered events), and the underlying risk for the transition from first cancellation to completion cannot be assumed to be the same for the transition from the first cancellation to the second cancellation and so on. A similar argument holds for the different risks of apprentices with two or three (plus) episodes of training. The data have 14 strata, one for each transition, with all these possible transitions outlined in table 1.
Table 1 Strata for the multistate model
Description Code
1 Enrolment to completion E → Com
2 Enrolment to 1st cancellation E → Can1
3 1st cancellation to 1st return Can1 → Rtn1
4 1st return to completion Rtn1 → Com
5 1st return to 2nd cancellation Rtn1 → Can2
6 2nd cancellation to 2nd return Can2 → Rtn2
7 2nd return to completion Rtn2 → Com
8 2nd return to 3rd cancellation Rtn2 → Can3
9 3rd cancellation to 3rd return Can3 → Rtn3
10 3rd return to completion Rtn3 → Com
11 3rd return to 4th cancellation Rtn3 → Can4
12 4th cancellation to 4th return Can4 → Rtn4
13 4th return to completion Rtn4 → Com
14 4th return to 5th cancellation Rtn4 → Can5
Figure 3 Number of apprentices by cancellation and completion
0 The data are event history format, showing changes in status for a period of up to 60 months after the apprentices’ initial enrolment.
NCVER 63

The data in figure 3 provide details of the number of apprentices at each cancellation or completion. Of the 666 Indigenous apprentices who commenced training in 2006, just over 450 recorded at least one cancellation. The numbers at each event fall rapidly, so that there were only two who cancelled five times.
FindingsTable 2 provides the results from the empirical application of the multistate model to our data on Indigenous apprentices.0
The advantage of this multistate model is that it fully describes the characteristics of the multiple events recorded in the dataset and it is able to detect a significant difference between the two groups (Indigenous apprentices with and without mentors) after controlling for other characteristics of the individual, including their age, gender, highest level of school education (highyr), disability and language status, the average income (income) of the occupation, and the accessibility of the postcode given as their place of residence (aria5).
Table 2 Multistate model of Indigenous cancellation
coef exp (coef) se (coef) robust s.e. z Pr(>|z|)
Factor (program) -0.200 0.819 0.074 0.071 -2.836 0.005
Age -0.005 0.995 0.006 0.005 -0.891 0.373
Gender -0.135 0.873 0.101 0.111 -1.224 0.221
Disability 0.207 1.230 0.211 0.194 1.069 0.285
Language -0.254 0.776 0.153 0.122 -2.082 0.037
Highyr 0.085 1.089 0.028 0.027 3.103 0.002
Income 0.000 1.000 0.000 0.000 -1.894 0.058
Aria5 -0.053 0.948 0.026 0.027 -1.954 0.051
0 The model is estimated using the Survival package of the R statistical software program, with the command lines provided in Castañeda and Gerritse (2010) used to generate the multistate model. Due to the assumption of unequal risk for the different transitions, the analysis is stratified by transition.
64 22nd National Vocational Education and Training Research Conference ‘No Frills’:refereed papers
cance
l 1
return
1
cance
l 2
return
2
cance
l 3
return
3
cance
l 4
return
4
cance
l 50
50
100
150
200
250
300
350
400
450
500
Transition
No.
of a
ppre
ntic
es

Concordance = 0.575 (se = 0.018 )
R2 = 0.017 (max. possible = 0.995 )
Likelihood ratio test = 35.07 on 8 df, p = 0.000
Wald test = 39.69 on 8 df, p = 0.000
Score (logrank) test = 33.95 on 8 df, p = 0.000, Robust = 30.98, p=0.000
The results presented in table 2 indicate that Indigenous apprentices who participated in the mentoring program have a rate of ‘state’ change that is approximately 82% (81.9) of that of the Indigenous apprentices who were non-participants in the program. The conclusion is that participating in the program reduces the risk of cancellation and subsequent episodes of training by a large and statistically significant amount. In this way the program contributed positively to the probability of completing the apprenticeship training contract.
Of the other variables included in the model, age, gender and disability status were found not to influence the risk of cancellation for Indigenous apprentices in the sample frame, all turning out to be statistically insignificant in the multistate version of the model presented in table 2. In contrast, language was found to be significant.
The exponentials of the coefficient in the second column are interpreted as the multiplicative effect on the hazard of completion of the variable in question. Holding all else constant at average values, changing status from English to non-English speaking sees the hazard of cancellation rise by 22.6% (that is, 1 — 0.776 = 0.226). For our education variable, highyr, a one-year increase in the number of years of schooling decreases the risk of cancellation by 8.9%, while a one-unit increase in the index of accessibility, say, moving from Very accessible to Accessible, is associated with a 5.2% rise in the risk of cancellation. Higher incomes are associated with a small (but statistically significant) increase in the risk of cancellation (at four decimal points the exponential is 0.9995). However, like the accessibility index (aria5) this variable is significant between the 5% and 10% level, providing only weak evidence that occupational income and regional accessibility influence the risk of cancellation.
Following Castañeda and Gerritse (2010), it is also possible, by looking at program participation by transition interactions, to explore whether participation in the program affects some transitions more than others. The results from this exercise are shown in table 3. The program effect is strongest for the initial transition, that is, enrolment to completion, with participation in the program increasing the estimated probability of a direct transition to completion by 212%. By contrast, participants in the program face only 24.2% of the risk faced by non-participants in making the second transition, enrolment to the first cancellation. Unfortunately, in this database there were insufficient observations at higher-level transitions to make modelling feasible.
Table 3 Multistate model with transition interaction
Transition coef exp (coef) se (coef) robust se z Pr(>|z|)
E → Com 0.754 2.126 0.127 0.124 6.105 0.000
E → Can1 -1.418 0.242 0.112 0.110 -12.845 0.000
NCVER 65

ConclusionsResults from the application of a multistate modelling strategy indicate that the mentoring program resulted in a large increase in the probability of participants completing their apprenticeship. Overall, participation in the program is associated with a reduction in the probability of wasteful multiple episodes of training, along with a rise in the probability of a completion. Other factors which are found to be associated with an increase in the probability of an apprenticeship completion are additional years of schooling, an English-speaking background and living in a more accessible area.
Further, the results also provide evidence that the effects of the mentoring program are stronger in the earlier episode. Data limitations mean that it is not possible to study the impact of the program beyond the second transition. However, the impact of the program was clearly stronger for the first transition than for the second. If this trend could be confirmed, it might suggest that the program is most valuable for earlier episodes of training, thus arguing for interventions in the early stages of the training contract.
Overall, the results provide strong evidence that the mentoring program resulted in a large increase in the probability of the participants obtaining a trade qualification. Given changes in the age profile of the population, the high costs associated with programs focused on subsidising employers to hire additional apprentices, and the potentially high personal and social costs associated with the failure of individuals to complete training, well-designed mentoring programs may provide a cost-effective strategy to increase completion rates and the supply of skilled labour.
AcknowledgmentsThe author would like to thank Trinh Le for providing the inspiration to undertake this project, and also acknowledge the thoughtful feedback of Elizabeth Padgham of the Department of Education, Training and Employment, Bill Kingston of the Department of Aboriginal and Torres Strait Islander and Multicultural Affairs (DATSIMA) and two anonymous referees. All errors and omissions remain the responsibility of the author.
ReferencesBall, K 2004, ‘Factors influencing completion of apprenticeship and traineeships’, paper
presented at the Australian Labour Market Research Workshop, 6—7 December 2004, at the Centre of Labour Market Research, University of Western Australia, Perth.
Bilginsoy, C 2003, ‘The hazards of training: attrition and retention in construction industry apprenticeship programs’, Industrial and Labour Relations Review, vol.57, no.1. pp.54—66.
Castañeda, J & Gerritse, B 2010, ‘Appraisal of several methods of time to multiple events per subject: modeling time to hospitalizations and death’, Revista Colombiana de Estadistica, vol.33, no.1, pp.43—61.
Coleman, J 1987, ‘Families and schools’, Educational Researcher, vol.16, no.6, pp.32—8. Department of Education and Training 2006, Queensland skills plan: a white paper, Department
of Education and Training, Queensland Government, Brisbane.Karmel, T & Mlotkowski, P 2010, How reasons for not completing apprenticeships and
traineeships change with duration, NCVER occasional paper series, viewed 18 April 2014, <http://www.ncver.edu.au/publications/2234.html>.
Mangan, J & Trendle, B 2008, ‘Surviving apprenticeship training: a duration analysis of apprenticeship contracts in Australia’, The Journal of Interdisciplinary Economics, vol.19, pp.379—98.
66 22nd National Vocational Education and Training Research Conference ‘No Frills’:refereed papers

——2010, ‘Cancellation of Indigenous Australians from the apprenticeship training contract’, Education Economics, vol.19, no.1, pp.1—18.
Scheier, MF, Weintraub, JK & Carver, CS 1986, ‘Coping with stress: divergent strategies of optimists and pessimists’, Journal of Personality and Social Psychology, vol.51, pp.1257—64.
Stromback, T & Mahendran, A 2010, ‘An analysis of factors contributing to apprenticeship and traineeship completion’, International Journal of Training Research, vol.8, pp.63—79.
Torrance, EP 1983, ‘Role of mentors in creative achievement’, Creative Child and Adult Quarterly, vol.8, no.1, pp.8—15, 18.
NCVER 67

Collaborative approaches to achieving Aboriginal vocational education and employment outcomes in remote South Australia
Ian HodgsonMarg MibusAmanda Tulloch-HoskinsComplete Personnel SATAFE SA Aboriginal Access CentreAffiliated organisations: OZ Minerals, Prominent Hill via Coober Pedy,
South Australia, and Department of Education, Employment and Workplace Relations (DEEWR)
AbstractThis paper describes a pre-employment program that combined vocational education and training (VET), a structured mentoring program, and guaranteed employment for local Aboriginal people. The result of this collaboration was a series of eight pre-employment programs that achieved sustainable employment for 200 Aboriginal people and had the effect of changing workplace culture at a mining and resources company in remote South Australia, namely, OZ Minerals. This program is an example of collaborative best practice to achieve sustainable outcomes for Aboriginal people. The development of the VET program was undertaken in consultation with the employer to ensure that the accredited training met their needs.
Introduction The phrase ‘Closing the Gap’ has come to paraphrase the very real and complex challenges that exist to improving the participation of Aboriginal Australians in education, training and employment in both urban and remote settings. Twenty-five per cent of Aboriginal and Torres Strait Islander people aged 15 years and over have completed Year 12 or equivalent (highest year of school completed), compared with 52% of non-Aboriginal people (ABS 2013). This is an improvement over five years, but it still highlights the need to take what we know about Aboriginal culture, community and learning and apply it to our teaching practice to improve participation and outcomes for Aboriginal people undertaking vocational education.
The TAFE SA Aboriginal Access Centre (AAC) and the Complete Personnel Group are two Aboriginal-managed organisations that collaborated over a five-year period to devise and
68 22nd National Vocational Education and Training Research Conference ‘No Frills’:refereed papers

deliver a series of pre-employment projects (PEPs), with the aim of achieving the dual goals of VET outcomes and employment outcomes for Aboriginal people living in remote South Australia. The projects used best practice in Indigenous employment and education to achieve these outcomes.
NCVER 69

This paper will focus on the following themes: the development of entry-level skills within a structured program to achieve ongoing
skills development in the workplace the strategies used to achieve successful structuring of VET to meet industry demand culturally competent mentoring to achieve sustainable attachment to training and the
workplace the importance of guaranteed employment opportunities in achieving successful
outcomes in vocational education and training for Aboriginal people the achievement of this type of collaboration in remote Australia and when working with
highly disadvantaged students/job seekers.
Findings and discussionThe partnersComplete Personnel (Complete) is an employment service provider with Aboriginal ownership
and management, which began operation in the Mid-North of South Australia in 1998. Complete’s vision is to address the social and economic disadvantage experienced by Aboriginal people, through the promotion of employment opportunities, with a particular focus on the mining, heavy industry and construction industries. The TAFE SA Aboriginal Access Centre (AAC) was launched in November 2007 with the aim of leading prospective Aboriginal students from unemployment to vocational education and training to meaningful employment. The Aboriginal Access Centre has a strong Aboriginal leadership, with five Aboriginal managers, and has staff with family and community links across South Australia. Complete and the Aboriginal Access Centre have worked together since Complete was established in 1998, partnering to deliver employment and training projects in regional South Australia.
Project goals and rationaleThe Prominent Hill mine is located southeast of Coober Pedy, 540 km northwest of Port Augusta in South Australia. The local Aboriginal people are the Antakarinja people. While the mine itself at the time employed approximately 700 people, employment of local Aboriginal people was non-existent. Like many mining companies, OZ Minerals has responsibilities under the Native Title Act 1993, including Native Title Agreements and Indigenous Land Use Agreements with the local Antakarinja people of the Coober Pedy region. The agreements require that they employ local people at the Prominent Hill site. The goal of the pre-employment projects devised by Complete and the Aboriginal Access Centre was to address some of the challenges for Aboriginal people living in the Coober Pedy region and the surrounding remote regions by leveraging the requirement for OZ Minerals to employ local people. These challenges included high unemployment, low educational attainment, and low levels of literacy and numeracy.
The pre-employment projects placed local people living in the remote regions into entry-level positions at the mining and resources company, OZ Minerals, supported them to undertake language, literacy and numeracy (LLN) and accredited training, and mentored
70 22nd National Vocational Education and Training Research Conference ‘No Frills’:refereed papers

them to achieve a high level of retention. The project design was based on research and our experience in Aboriginal employment and education best practice.
NCVER 71

ResearchAboriginal people living in remote locations have specific challenges to participation not experienced by Aboriginal people living in regional or urban locations. These challenges include higher levels of unemployment, poverty and violence, English as a second language, health issues and substance misuse, overcrowding or poor-quality housing, and overall poorer-quality education services in remote areas, which can result in language, literacy and numeracy deficits and problems adjusting to study workloads (Pearson & Daff 2011; West et al. 2011; Parmenter & Kemp 2007). The further challenges of cultural and community responsibilities interfering with workplace and training attendance is distinctive to Aboriginal people living in rural and remote communities. Moreover, the limited labour markets in remote areas have resulted in a historical absurdity, whereby Aboriginal people have been trained and retrained in courses for which no obvious job prospects exist, quite reasonably reducing their motivation to continue participating in ‘training for training’s sake’ (Gibson 2010).
It was imperative then that the project design addressed all of these factors. Recent research into improving training outcomes for Aboriginal people across a range of industries has found that training needs to be designed and implemented with an acknowledgment of the specific needs and barriers of this group of learners (Pearson & Daff 2011; West et al. 2011). The pre-employment projects approach was designed as a wraparound service, offering recruitment, assessment, accredited training, and language, literacy and numeracy training developed specifically for and by Aboriginal people. Most critically, the training was coupled with an offer of guaranteed employment upon completion and structured workplace mentoring. Structured mentoring has been demonstrated to improve the retention of Aboriginal people (Tiplady & Barclay 2007).
Development and designThe project design and development was a best practice approach, as described by the University of Queensland’s Centre for Responsibility in Mining, which has articulated four critical ‘success factors’ for achieving Aboriginal employment and retention. These are: having an employer with a public commitment to improving Indigenous employment and supporting that commitment with adequate human resources and financial support; transparent engagement with community; the engagement of a ‘corporate champion’ who will support Aboriginal employees and champion the Aboriginal employment agenda; and skilled trainers with the respect of the Indigenous community (Tiplady & Barclay 2007).
The pre-employment projects included each of these ‘success factors’. Extensive and ongoing community consultation was undertaken to ensure that community and cultural factors were addressed. This process included meeting with Elders and with the whole community to explain the project goals and training. Importantly, all participants were offered ‘cooling off’ periods before they made a commitment to training. This gave them time to think about and discuss their participation with their families — to ensure they had family and community support. A sense of isolation and lack of family support are common reasons for Aboriginal people not completing study and leaving employment (Tiplady & Barclary 2007). The ‘cooling off’ period was particularly important for women, who have additional pressures relating to cultural responsibilities and gender roles in the community. These pressures require further time and discussion with family members before a
72 22nd National Vocational Education and Training Research Conference ‘No Frills’:refereed papers

commitment to training and working outside the community can be made (Parmenter & Kemp 2007).
OZ Minerals made a public commitment to offering local Aboriginal people ongoing and sustainable employment opportunities across a range of roles at the Prominent Hill site. This included requiring that their contractors comply with their policies and commitments in this regard. These commitments proved to be fundamental in developing a long-term collaborative relationship between OZ Minerals, their contractors, Complete Personnel, TAFE SA Aboriginal Access Centre, and later TAFE SA Regional APY Lands for the delivery of what eventually became a series of pre-employment and training projects across the Far North.
To ensure they had the best chance of success, our Aboriginal job seekers required a wraparound service that would scaffold them from the recruitment and assessment phase, through to pre-employment training, and finally through to employment.
Recruitment and assessmentComplete Personnel undertook the assessment and recruitment of participants, in collaboration with the Aboriginal Access Centre and the employer and in consultation with the local community, to ensure that the assessments met the needs of both the trainer and the employer. The assessment process was flexible, in recognition of the fact that many of the students would have been screened out of traditional assessment processes due to high levels of barriers like lack of literacy and numeracy, drug and alcohol problems, and previous records of offending. For example, the Australian Qualifications Framework principles were used as an assessment and diagnostic benchmark, after which intensive literacy and numeracy supports were put in place to ensure successful completions. Additional screening and assessment ensured that participants met the employers’ requirements for employment onsite, including meeting Australian Federal Police checks, passing fitness for work medicals and having a valid Australian drivers licence. Some of these requirements were barriers for our students, but they were mandatory conditions of the employer.
TrainingThe training offered to participants was accredited training in the form of Certificate I Resources and Infrastructure and Certificate II Metalliferous Mining, combined with language, literacy and numeracy support for job seekers with literacy and numeracy issues.
The TAFE SA Aboriginal Access Centre methodology has been developed over 27 years and in recognition of the needs of Aboriginal students differs from mainstream VET approaches. It comprises a unique flexible delivery, assessment and program design, which has been tailored to the region and the remoteness of the client groups. All training is delivered by staff who have demonstrated their capacity to offer a culturally competent program and delivery. Cultural competence in training delivery for Aboriginal students requires: understanding the cultural responsibilities and ties that impact on training success for students; the ability to assess differently when required (for example, adapting a theoretical assessment to a practical assessment for students with English as a second language); and using plain or simple English and visual aids in the delivery of complex material. This delivery also changes, depending on the region in which training is being
NCVER 73

delivered. For example, in regional areas where more students have English as a first language, more traditional training methods are appropriate; in remote South Australia, where many more people speak Aboriginal languages as their first language, flexible training methodologies are necessary to ensure engagement and completion rates.
Employability skills training was also delivered as part of this program. Many of the participants were very long-term unemployed people and required support to develop workplace skills such as time-keeping, communication and team work. It was important that part of this training included mirroring the work environment of the mine site, which is a very challenging place to work, even for those with a long work history. This included intensive work experience, requiring the participants to work long hours, similar to mine site hours, and offering tickets and licences relevant to the workplace in addition to their certificates I and II.
Guaranteed employment and mentoringParticipants who undertook the training and graduated with their certificates were offered employment at Prominent Hill mine site and were matched to entry-level jobs such as pit technicians, dump truck operators, administration roles, and process technicians. The offer of employment was guaranteed to all participants before they joined the training component of the program, conditional on the training being successfully completed. A contractor to OZ at Prominent Hill, Thiess, also took on the responsibility of employing Aboriginal people at the Prominent Hill site, as part as of its Reconciliation Action Plan obligations and its contractual obligations to OZ Minerals.
The offer of employment following training has been critical to the success of this program and has led to high retention rates for both training and employment. This has been followed by a structured career development program delivered by Complete at OZ Minerals to support the career advancement of Aboriginal employees and the ongoing delivery of the Workplace English Language and Literacy program (WELL) by the Aboriginal Access Centre.
Mentoring was offered to all participants, both during the training phase and once employed at Prominent Hill. Complete has adopted the mentoring model recommended by the University of Queensland’s Centre for Social Responsibility in Mining (Tiplady & Barclay 2007). The model comprises three key elements: advice and guidance (pastoral); support to balance cultural obligations with demands of the workforce (cultural); and workplace skills and experience (technical). This holistic approach delivers one-to-one support for Aboriginal mentees at both the pre- and post-placement stages of the individual’s journey, with the aim of achieving sustainable employment. The approach addresses both the Aboriginal mentee and the employer, while working with the entire community to develop wraparound services that support the individual to achieve sustainable employment. Since the development of the first pre-employment program in 2006, OZ Minerals has employed an in-house Aboriginal mentor, who is supported by the Complete Personnel mentors off site.
ConclusionsChallenges and outcomes
74 22nd National Vocational Education and Training Research Conference ‘No Frills’:refereed papers

The first pre-employment program was undertaken with five Aboriginal students from the Coober Pedy and Port Augusta regions. Participants were sourced from local Aboriginal communities and family groups, including people who were part of existing Native Title claims in the region. All students were long-term unemployed. No participants had completed Year 12. In total, 28 Aboriginal people participated in the four programs run from 2009 to 2012. Five of the 28 participants were women. One hundred per cent of the participants successfully completed the program, gaining a Certificate II in Mining, and 26 were employed at Prominent Hill, by OZ Minerals, Thiess, or Ausdrill. Of the two who were not employed, one was incarcerated and the other was not offered a contract because his work experience performance was not satisfactory. Twenty-five of the 26 participants achieved 13 weeks retention at the site, and 23 of the 26 achieved a 26-week employment outcome.
The pre-employment programs and the associated employment initiatives resulting from the programs have led to the ongoing training and employment of 200 Aboriginal people from the Coober Pedy, Oodnadatta and APY Lands regions. This has increased the ratio of Aboriginal people employed at the site to over 10% of the 1500 employees. This includes job seekers hired by OZ Minerals contractor Thiess.
Language barriers and cultural responsibilities are the main challenges to delivering training in remote communities. Deaths in traditional communities can result in absences of trainees for up to two weeks. During Sorry Business it is not appropriate to deliver training in communities. The extent of this challenge is significant: during one pre-employment program, training delivery was interrupted for up to two terms due to a series of deaths in the APY Lands community of Amata.
In this instance, working in the mining sector proved an additional test. Moving people from the traditional cultural environment of remote communities to the institutionalised Westernised environment of a mine site was a considerable challenge: mining is not an easy job, requiring that people work very long hours away from their families and communities in intensive situations. It was important that the training offered mirrored the work environment, and that the mentoring was intensive, regular, and effective.
Participants did not face racism issues at Prominent Hill. A commitment was made by the company to offer cultural awareness training and facilitate the appointment of an internal Aboriginal Liaison Officer, who provided ongoing support in the workplace to Aboriginal employees and who was supported by Complete Personnel.
Key learning outcomesThe pre-employment programs were a place-based approach to the need for one mining and resources company to meet their Native Title obligations. However, the programs increased the workforce diversity of the Prominent Hill site, to achieve an Aboriginal workforce of 10%, which was higher than had been anticipated. This was done through the collaboration of the employer, the community, the employment service provider and the VET provider. Achieving outcomes for Aboriginal employment is one of the greatest equity challenges in the current Australian workforce; this project demonstrated that it can be achieved by using the current research and building upon it.
NCVER 75
Ensuring that the critical ‘success factors’, as outlined by the University of Queensland, were maintained required ongoing discussion and collaboration with the employer to ensure that the project met their needs as well as the needs of the participants. The relationship with OZ Minerals is ongoing and the project work with them is developing over time and as the business changes. Ongoing dialogue is important to safeguard a commitment to Indigenous employment at Prominent Hill over the long-term.
Finally, the collaboration between Complete Personnel and the Aboriginal Access Centre involved developing a joint strategy based on mutual respect and understanding. Over the past 15 years the two organisations have delivered programs to the same communities. This is important because remote communities are compact and intimate: working with the same stakeholders has resulted in a shared understanding of the needs of job seekers and students in communities. The level of trust built up with communities over the past 15 years made it possible to engage and consult with them during the development stage; it was also important that promises made were promises kept. Building that level of respect and shared understanding takes time: it is the work of years, not months. In remote communities, it is crucial to start small, delivering small initiatives together with a shared goal and demonstrating to communities that goals can be met. Most importantly, the employer, community, students, and job seekers are the key stakeholders: they are the critical ‘success factors’.
Acknowledgments We would also like to acknowledge the support of OZ Minerals, in particular Ross Sawers and Debbie Alexander, and Brenton Zubrinich and Debbie Klingberg from the Aboriginal Access Centre, Port Augusta, for their support in the development of the pre-employment program. We would also like to acknowledge the funding body at the time, the Department of Education, Employment and Workplace Relations (DEEWR), (now known separately as the Department of Employment, the Department of Education and the Department of Prime Minister and Cabinet) which supported the Indigenous Employment Program.
ReferencesABS (Australian Bureau of Statistics) 2013, Census of Population and Housing: characteristics of
Aboriginal and Torres Strait Islander Australians 2011, Commonwealth of Australia, Canberra.Department of Education, Employment and Workplace Relations 2013, Changes to the
Aboriginal Employment Program (IEP) assessment and funding processes: discussion paper, Commonwealth of Australia, Canberra.
Gibson, L 2010, ‘Making a life: getting ahead and getting a living in Aboriginal New South Wales’, Oceania, vol.80, pp.143—60.
Parmenter, J & Kemp, D 2007, ‘Indigenous women and mining employment in Australia’, paper delivered to the Sustainable Development Conference — A climate of change, October 2007, Minerals Council of Australia, Cairns.
Pearson, AL & Daff, S 2011, ‘Extending boundaries of human resource concepts and practices: an innovative recruitment method for Aboriginal Australians in remote regions’, Asia Pacific Journal of Human Resources, vol.49, no.3, pp.325—43.
Tiplady, T & Barclay, M 2007, Aboriginal employment in the Australian minerals industry, University of Queensland Centre for Social Responsibility in Mining, Brisbane.
West, R, West, L, West, K, & Usher, K 2011, ‘Tjirtamai — “To care for”: a nursing education model designed to increase the number of Aboriginal nurses in a rural and remote Queensland community’, Contemporary Nurse, vol.37, no.1, pp.39—48.
76 22nd National Vocational Education and Training Research Conference ‘No Frills’:refereed papers

NCVER 77

Intergenerational mobility: new evidence from LSAY dataGerry Redmond, Flinders University; Melissa Wong, Bruce Bradbury and Ilan Katz, University of New South Wales
AbstractThis paper examines data from the Youth in Transition (YIT) survey and the Longitudinal Surveys of Australian Youth (LSAY) to investigate change in one measure of intergenerational mobility in Australia since the mid-1970s — the relation between parents’ socioeconomic status (SES) and children’s educational achievements at age 14—15 years. Covering a period from 1975 to 2006, this analysis examines the relation between a ranking of young people’s performance in literacy and numeracy tests at age 14—15 years on the one hand and parents’ socioeconomic status on the other in selected Youth in Transition or LSAY surveys. The analysis suggests that in general, while overall educational achievements have improved, the association between parents’ relative socioeconomic status and their children’s relative academic performance has not weakened in the 2000s by comparison with the 1970s. Nonetheless, some aspects of the relation between socioeconomic status and relative student outcomes have changed. In particular, the strength of the relation between school socioeconomic status and student outcomes appears to have increased significantly since 1975. This finding would tend to support other research which reports relatively high levels of stratification by socioeconomic status among Australian schools.
IntroductionThe idea that young people’s educational and employment achievements should be a result of their efforts and abilities rather than their family background is an important policy objective in Australia and internationally. However, in all developed countries family background continues to play a significant role in determining young people’s outcomes. Although a number of Australian studies have examined the link between parents’ socioeconomic status and children’s outcomes, the policy and demographic forces which drive social mobility are still poorly understood. The purpose of this study is to examine how the relationship between young people’s educational attainment and their parents’ socioeconomic status has changed since the 1970s. In addition the paper reflects on potential policy in this area and on other drivers of these changes.
This study uses data from the Youth in Transition and Longitudinal Surveys of Australian Youth (1975—2006) series to examine changes in the relationship between children’s educational outcomes at ages 14—15 years and their parents’ socioeconomic status, as measured by their educational outcomes and occupational status in selected YIT or LSAY surveys. The focus on children’s educational outcomes, while dictated to some extent by the data available to us, also has strong precedent in the literature on intergenerational mobility (Checchi, Fiorio & Leonardi 2013; Hertz et al. 2007). Educational outcomes towards
78 22nd National Vocational Education and Training Research Conference ‘No Frills’:refereed papers

the end of universal schooling are also arguably the point in the intergenerational mobility chain where policy has already exerted its greatest influence; for example, by setting aims and aspirations for public education systems, and directing resources to further those aims.
The Youth in Transition survey comprises longitudinal studies of four nationally representative cohorts of young people born in 1961, 1965, 1970 and 1975. The project followed respondents for ten years, interviewing them annually to study their transitions between school, post-school education and training, and work. LSAY interviews cohorts of young Australians annually to study their transitions from school to further education or work. Data are available for cohorts of students who were in Year 9 in 1995 (that is, students who were born around 1981), 1998, 2003 and 2006. Apart from literacy and numeracy assessment scores, the background variables for both YIT and LSAY include date of birth, sex, country of birth, type of school attended, parents’ level of education and occupation, and main language spoken at home.
Australian educational policy has long prioritised maximising all school students’ educational outcomes to promote equity and to increase productivity and economic development (Gonski 2011; Ministerial Council on Education, Employment, Training and Youth Affairs 2008). From the point of view of economic efficiency, the goal of increased intergenerational mobility is associated with the meritocratic principle that all children should achieve to their fullest potential so that they can later maximise their productivity in the labour force (Marks 2009). Equity, however, is only one aim of the education system in Australia. Parents’ choice is also embedded in the education system in a number of ways: by parents’ involvement in the schooling of their children; and by facilitating parental choice in the school their child attends. Parental choice has become a major strand in Australian education policy at both the federal and state levels since the 1970s (Teese & Polesel 2003; Watson & Ryan 2010) and is seen as an important driver for improving excellence in Australian education. However, increased parental choice is also often seen as perpetuating inequality, since it is one mechanism by which the social, economic and cultural capital of one generation can be passed onto the next generation (Bourdieu 1986; Brighouse & Swift 2009; Reay 2004).
The overall success of policy in increasing intergenerational mobility also depends on wider macro-social and economic changes in society. For example, in times of increased economic and social inequality, policies to promote mobility by providing education will arguably have to ‘work harder’ to achieve their goals. Migration policies and trends in family formation can also confound policy goals for achieving greater equality. Moreover, the effects of policies or social and economic trends on intergenerational mobility may not be felt immediately, but can take decades to work their way through.
Identifying policy effects in analysing the trends in the relation between children’s education and their parents’ socioeconomic status is therefore not straightforward. The approach in this paper is to use Youth in Transition and LSAY data to examine changes in one indicator of intergenerational mobility — the relation between parents’ socioeconomic status and their children’s educational outcomes. Research suggests that performance in academic tests at age 14—15 years has a strong correlation with more general tests of ability and is a strong predictor of adult socioeconomic status (Marks & McMillan 2003; OECD 2008). And while the YIT and LSAY data do follow respondents up to the age of about 25 years, the most representative and fine-grained information (for example, academic test
NCVER 79

scores) is available only at ages 14—15 years. It is on these data that we focus this analysis.
Findings and discussionWe first examine the unadjusted relationship between parents’ socioeconomic status and their children’s educational outcomes using concentration curves. A concentration curve provides a method of assessing the degree of inequality in explanatory variable X (in this case parents’ socioeconomic status) in the distribution of a dependent variable Y (in this case respondents’ educational outcomes). A concentration curve is like a Lorenz curve, where a cumulative distribution of an indicator is compared with a hypothetical distribution where all values are equal (or in this case, where all parents’ socioeconomic status is equal to the sample mean). The size of the gap between the Lorenz curve and the hypothetical distribution represents the extent of inequality in the distribution (which can be expressed as a gini coefficient). In this analysis, our aim is to compare curves derived from different years of the YIT and LSAY, to examine trends in inequalities over time.
Figure 1 shows concentration curves that map the cumulative distribution of parents’ socioeconomic status among respondents in the bottom quarter (left-hand graph) and the top fifth (right-hand graph) of the distribution of literacy scores in 1975 and 2006.0 The further a curve is from the diagonal line, the greater the concentration of low-achieving students among parents with low SES rankings (left-hand graph), or the concentration of high-achieving students among parents with high socioeconomic status (right-hand graph). Comparison of the two curves in each graph gives an intuitive visual picture of how the relationship between students’ academic achievement and parents’ socioeconomic status changed between 1975 and 2006. In the left-hand panel, the curves lie above the diagonal line because in both years there is a concentration of parents with lower SES rankings among respondents at the bottom of the literacy distribution. In the right-hand panel, the curves lie below the diagonal line because parents with higher SES rankings are concentrated among respondents at the top of the literacy distribution.
Figure 1 Concentration curve of being in bottom quarter and top fifth of literacy distribution at age 14–15 years by parents’ socioeconomic status
Bottom quarter Top fifth
0 Examination of parents’ socioeconomic status in the bottom quartile and the top fifth of the literacy distributions is necessary because of the concentration of students in the 1975 YIT (according to teachers’ assessments) into relatively few categories of achievement.
80 22nd National Vocational Education and Training Research Conference ‘No Frills’:refereed papers

0
10
20
30
40
50
60
70
80
90
100
0 10 20 30 40 50 60 70 80 90 100
% in
bott
om q
uart
er o
f lite
racy
sco
res
by p
aren
ts' S
ES
% of children by parents' SES
1975
2006
Equal distribution
0
10
20
30
40
50
60
70
80
90
100
0 10 20 30 40 50 60 70 80 90 100
% in
top
fifth
of li
tera
cy s
core
s by
par
ents
' SES
% of children by parents' SES
1975
2006
Equal distribution
Source: YIT and LSAY, authors’ calculations.
At the bottom of the literacy distribution, there is little difference between the 1975 and the 2006 distributions of parents’ socioeconomic status. At the top of the literacy distribution, however, the 2006 result is further curved away from the diagonal than the 1975 result. This suggests that more students whose parents were of high socioeconomic status were in the top literacy quartile in 2006 than was the case in 1975. Among students in the bottom quartile, the difference between the 1975 and 2006 curves is most evident in the top half of the socioeconomic status distribution. Students in the bottom quartile at the 90th percentile of parents’ social and economic status were at about the 83rd percentile of parents’ socioeconomic status overall in 1975, but at about the 79th percentile in 2006. Among students in the top fifth, the 50th percentile of parents’ socioeconomic status was equivalent to about the 60th percentile of parents’ SES overall in 1975, and about the 68th percentile in 2006, suggesting a strengthening of the relationship between the two variables over the past 30 years. Similar patterns are evident for numeracy scores.
Moving to a more summary measure of association, the correlation coefficient in figure 2 shows the correlations between literacy and numeracy scores and the four different composite measures of socioeconomic status across all four waves of the YIT and LSAY surveys examined in this analysis. In no case is there a consistent decrease in association, while in most cases there is an apparent increase. The exception is the correlation between fathers’ socioeconomic status and literacy, which declines between 1975 and 1995 and increases thereafter — ending at about the same level as in 1975. (However, the difference between coefficients for the different years is not statistically significant.) The trend in association between socioeconomic status and children’s outcomes is generally clear in the post-1995 period, where the associations between the measures of socioeconomic status and both literacy and numeracy almost all increase.
The low correlations between mothers’ socioeconomic status and both literacy and numeracy rankings in 1975 are worth noting. It is possible that this reflects the fact that occupation was a poor predictor of mothers’ personal capabilities in 1975. If so, this suggests caution in interpreting the results for the mothers’ and parents’ socioeconomic status measures, as the increase in correlation might be simply reflecting the fact that mothers’ occupation is becoming a better measure of socioeconomic status over time (that
NCVER 81

is, this change might imply less measurement error in socioeconomic status). However, the fathers’ socioeconomic status measure is not influenced by this and the school socioeconomic status measure is only indirectly affected.
Figure 2 Correlations between literacy and numeracy at age 14–15 years, and socioeconomic status over time
Literacy Numeracy
0.00
0.05
0.10
0.15
0.20
0.25
0.30
0.35
0.40
fathers' SESmothers' SESparents' SESschool SES
0.00
0.05
0.10
0.15
0.20
0.25
0.30
0.35
0.40
fathers' SESmothers' SESparents' SESschool SES
Source: YIT and LSAY, authors’ calculations.
How can we explain this apparent increase in the relation between parents’ socioeconomic status and their children’s academic outcomes at age 14—15 years in Australia between the mid-1970s and the early 2000s? Certainly, Australia has changed significantly over this period. It is immensely richer but also perhaps more unequal in terms of income distribution (Whiteford, Redmond & Adamson 2011); it is more diverse in ethnic make-up and family formation; it is a more urban society; women’s roles have changed immeasurably, and women, on average, have overtaken men in their educational achievements; and new inequalities have arisen in access to digital technologies. Furthermore, assortative mating has meant that people are more likely to partner within their own social class than was the case previously. The importance of education to Australian society has also increased greatly. Governments spend more on education than they did in the 1970s and they pay more attention to improving educational performance among disadvantaged groups. However, governments have also facilitated greater parental choice in education, which could be associated with cementing inequalities in educational outcomes.
We use regression analyses to examine the relation between parents’ socioeconomic status and their children’s academic outcomes at age 14—15 years, controlling for a range of factors. The dependent variable is literacy score, but models using numeracy score provided similar results. We focus in particular on measures of mothers’, fathers’ and parents’ joint socioeconomic status, and school indicators — the school sector (state, Catholic, independent) and school socioeconomic status. We also add the following respondent characteristics as control variables: sex, whether the student lives in a
82 22nd National Vocational Education and Training Research Conference ‘No Frills’:refereed papers

metropolitan or a non-metropolitan area, whether the student is Indigenous, and whether the respondent speaks a language other than English at home.
To facilitate comparison across cohorts, literacy scores and socioeconomic status scores are in z-scores (mean = 0, standard deviation = 1). All other indicators in the model are dummy variables.
Table 1 shows the results of the model in the 1975 YIT, and in the 1995, 2003 and 2006 LSAY. We focus here on the relationship between socioeconomic status and literacy scores, as this is the focus of the paper. It is notable that the marginal association of parents’ socioeconomic status with literacy scores is stable over time: it stays within the range 0.175 to 0.186. However, school sector (independent or Catholic) is significantly associated with literacy scores in the early cohorts, but not in the later cohorts. This may in part be an effect of increasing proportions of students attending private schools. The association of school socioeconomic status with outcomes steadily increases from 0.06 to 0.23 (a highly statistically significant increase). This suggests that the impact of school sector has been displaced somewhat over the past 30 years by the impact of school socioeconomic status, an impact that has likely been strengthened by the growing homogeneity, in terms of socioeconomic status, in Australian schools. But note also that the proportion of variation in literacy scores explained by the model is considerably higher in 2006 (19.5%) than in 1975 (10.5%). This suggests the increased importance of socioeconomic status (at the parent or school level) in determining students’ academic outcomes. However, it is important to acknowledge that even in 2006, the model does not explain over 80% of variation in literacy scores.
NCVER 83

Table 1 OLS regression of explanatory and control variables on literacy scores at age 14–15 years, YIT and LSAY surveys
1975 1995 2003 2006
Female 0.088** 0.193*** 0.366*** 0.430***
(0.036) (0.023) (0.022) (0.018)
Lives in a metropolitan area -0.036 0.014 -0.006 0.056***
(0.039) (0.024) (0.023) (0.021)
Aboriginal or Torres Strait Islander -0.379 -0.566*** -0.543*** -0.499***
(0.245) (0.091) (0.070) (0.059)
Non-English-speaking background -0.620*** -0.472*** -0.114** -0.225***
(0.102) (0.046) (0.046) (0.036)
Independent school 0.337*** 0.045 0.004 0.022
(0.073) (0.037) (0.035) (0.027)
Catholic school 0.209*** -0.028 0.022 0.031
(0.049) (0.030) (0.027) (0.022)
Parents’ socioeconomic status 0.186*** 0.181*** 0.180*** 0.175***
(0.020) (0.013) (0.012) (0.011)
School socioeconomic status 0.062** 0.163*** 0.275*** 0.229***
(0.024) (0.015) (0.014) (0.012)
Constant -0.058 -0.054** -0.163*** -0.173***
(0.038) (0.024) (0.024) (0.021)
Observations 4 187 8 074 9 514 12 711
R-squared 0.105 0.138 0.203 0.195
Note: Standard errors in parentheses; *** p<0.01, ** p<0.05, * p<0.1. PLS = ordinary least squares.Source: YIT and LSAY, authors’ calculations.
ConclusionsOur major conclusions about the relationship between Youth in Transition and LSAY respondents’ educational achievements and their parents’ socioeconomic status are that, first of all, socioeconomic status is a major influence on school performance. In relative outcomes (ranks in literacy tests at age 14—15 years), there is no evidence of an increase in social mobility. This finding of little overall change (and perhaps a decrease) in relative mobility is not inconsistent with other developments in Australian society over recent decades. The great increase in public expenditure on education in Australia since the 1950s may have allowed more Australians to reach their educational potential. On the other hand, international evidence suggests that increased choice in education (for example, allowing state schools to attract ‘out of zone’ students, or increasing subsidies to non-government schools), reinforced by greater spatial inequality0 between suburbs, is associated with a greater divergence in students’ educational performance (Jenkins, Micklewright & Schnepf 2008). The impact of increased parental choice in education in Australia may perhaps be seen in the growing association between school socioeconomic status and academic performance between 1975 and 2006, the effects of which have been noted elsewhere (Bonnor 2012; Teese & Polesel 2003).
Other changes in Australian society may also have had contradictory effects. The expansion of education to people from lower SES backgrounds, the considerable resources expended on schools with low-SES students, and increased government cash transfers
0 The income gap between the richest and the poorest postcodes in Australia.
84 22nd National Vocational Education and Training Research Conference ‘No Frills’:refereed papers

targeted at the most disadvantaged families have softened rising inequality in disposable incomes and promoted social mobility. But there have been very powerful factors working in the opposite direction. These include increased credentialism in occupations (the lack of a qualification is now more of a handicap in the labour market than it was in earlier generations), a trend towards assortative mating, and increasingly skilled migrant intakes. All of these factors could have dampened intergenerational mobility.
It is also possible that the social and educational policies and demographic changes have not been powerful drivers of intergenerational mobility because of underlying features of Australian society, which are more important determinants of intergenerational social mobility. In this, our findings do not contradict the international evidence, which indicates remarkable consistencies over time in the level of intergenerational inequalities in different countries, despite changes in social and educational policies (Blanden & Machin 2007; Checchi, Fiorio & Leonardi 2013; Hertz et al. 2007; OECD 2008).
Our study has a number of limitations that may also have impacted on the results presented here. The Youth in Transition and LSAY datasets are constrained in the operationalisation of parents’ socioeconomic status as well as in the operationalisation of outcomes for the young people. Comparison of indicators across different years is always problematic, not least because the meaning of both educational attainment and occupation has changed considerably since the 1970s. Some professions have risen in social status while others have fallen, and so comparisons over this time period, even in the absence of data issues, are challenging to make. Finally the YIT and LSAY data do not capture some of the more subtle cumulative aspects of parenting and schooling that may have important effects on school completion (Todd & Wolpin 2003). By the time children reach school, they may already be stratified by ability and family background. The effects of parents’ socioeconomic status do not necessarily cause these differences to grow as the child progresses through school. However, characteristics associated with socioeconomic status are important in maintaining this gap through the school years. With the data available to us, we cannot estimate the relation between early childhood experiences and later intergenerational mobility (what Todd & Wolpin 2003 conceptualise as the cumulative effect of family and schooling up to a given age) in our analysis.
Caveats aside, our findings nonetheless have important implications for understanding how students’ backgrounds affect their outcomes, and how these factors have changed over time. In particular, the finding that school socioeconomic status has grown in importance since the 1970s as a driver of intergenerational mobility is a pointer towards how educational and social policy might move forward to facilitate social mobility across future generations.
AcknowledgmentsThis paper is an outcome of a joint project between the School of Social and Policy Studies, the Flinders University of South Australia, and the Social Policy Research Centre, the University of New South Wales, funded by NCVER. The final report for the project is available as a research report on the NCVER Portal <http://www.ncver.edu.au/publications/2712.html>. The authors are grateful to Grace Skrzypiec for research assistance, and to Jo Hargreaves, Patrick Lim and Ronnie Semo, as well as participants at a seminar at NCVER on 31 August 2012, at a webinar hosted by
NCVER 85

NCVER on 18 June 2013, and at the ‘No Frills’ Conference, Mooloolaba (Qld), 10—12 July 2013. The authors also extend thanks to Sam Rothman at the Australian Council for Educational Research for extensive help in augmenting and interpreting the data. The opinions, comments and analysis expressed in this document are those of the authors and do not necessarily represent the views of NCVER.
86 22nd National Vocational Education and Training Research Conference ‘No Frills’:refereed papers

ReferencesBlanden, J & Machin, S 2007, Recent changes in intergenerational mobility in Britain, Sutton
Trust, London, viewed 28 April 2014, <http://thest57.demonweb.co.uk/reports/mainreport.pdf>.
Bonnor, C 2012, ‘Beyond the school fence: the outside impact on our schools’, viewed 7 February 2013, <https://docs.google.com/file/d/0B8UbZRpTfT_5Qzh3V05MNktTNjI5UUlzdWNTdjhNZw/edit?pli=1>.
Bourdieu, P 1986, ‘The (three) forms of capital’, in Handbook of theory and research in the sociology of education, ed. JG Richardson, Greenwald Press, New York, pp.241—58.
Brighouse, H & Swift, A 2009, ‘Legitimate parental partiality’, Philosophy & Public Affairs, vol.37, no.1, pp.43—80.
Checchi, D, Fiorio, CV & Leonardi, M 2013, ‘Intergenerational persistence of educational attainment in Italy’, Economics Letters, vol.118, no.1, pp.229—32.
Gonski, D 2011, Review of funding for schooling — final report, Department of Education, Employment and Workplace Relations, Canberra.
Hertz, T, Jayasundera, T, Piraino, P, Selcuk, S, Smith, N & Verashchagina, A 2007, ‘The inheritance of educational inequality: international comparisons and fifty-year trends’, The B.E. Journal of Economic Analysis & Policy, vol.7, no.2, December 2007, article 10.
Jenkins, SP, Micklewright, J & Schnepf, SV 2008, ‘Social segregation in secondary schools: how does England compare with other countries?’, Oxford Review of Education, vol.34, no.1, pp.21—37.
Marks, GN 2009, ‘Modernization theory and changes over time in the reproduction of socioeconomic inequalities in Australia’, Social Forces, vol.88, no.2, pp.917—44.
Marks, GN & McMillan, J 2003, ‘Declining inequality? The changing impact of socio-economic background and ability on education in Australia’, The British Journal of Sociology, vol.54, no.4, pp.453—71.
Ministerial Council on Education, Employment, Training and Youth Affairs (MCEETYA) 2008, Melbourne Declaration on Educational Goals for Young Australians, December 2008, MCEETYA, Carlton, Vic.
OECD (Organisation for Economic Co-operation and Development) 2008, Growing unequal? Income distribution and poverty in OECD countries, OECD, Paris.
Reay, D 2004, ‘Exclusivity, exclusion, and social class in urban education markets in the United Kingdom’, Urban Education, vol.39, no.5, pp.537—60.
Teese, R & Polesel, J 2003, Undemocratic schooling: equity and quality in mass secondary education in Australia, Melbourne University Press, Melbourne.
Todd, PE & Wolpin, KI 2003, ‘On the specification and estimation of the production function for cognitive achievement’, The Economic Journal, vol.113, no.485, pp.F3—F33.
Watson, L & Ryan, C 2010, ‘Choosers and losers: the impact of government subsidies on Australian secondary schools’, Australian Journal of Education, vol.54, no.1, pp.86—106.
Whiteford, P, Redmond, G & Adamson, E 2011, ‘Middle class welfare in Australia: how has the distribution of cash benefits changed since the 1980s?’, Australian Journal of Labour Economics, vol.14, no.2, pp.81—102.
NCVER 87

MOOCs in vocational education and training and higher educationJamie MurphyAlan Williams Amy LennoxAustralian College of Applied Education
AbstractThis paper offers a brief overview of innovations in education, specifically Massive Open Online Courses (MOOCs), and proposes MOOC research and applications in tertiary education. The overview helps to inform funding bodies, educators and administrators on MOOCs. The paper uses the Diffusion of Innovations theory to contextualise research into MOOCs and other future scientific endeavours.
The overview also illustrates two effects in the organisational diffusion of educational technologies — bandwagon and leapfrog effects. Bandwagon effects stem from social pressure rather than strategic planning driving the adoption of innovations. This ‘me-too’ behaviour often results in poor innovation use. In contrast to bandwagon effects, leapfrog effects hinder adoption and improve innovation use relative to early-adopter organisations. Leapfrogging organisations take a wait-and-see attitude towards adopting new technologies, and then use the technology more efficiently than many early-adopter organisations.
IntroductionTeaching and innovation have ploughed forward, at least since Greek scholars about two-and-a-half millennia ago lamented an emerging innovation. Thanks to the advent of writing, learners would rely on written records, rather than solely on their memories (Gumport & Chun 1999). Similarly today, scholars, government agencies, administrators, teachers and learners face a growing universe of educational innovations — ideas and technologies — to lament and laud (Commonwealth of Australia 2013; Barber, Donnelly & Rizvi 2013; Daniel 2012). Administrators and teachers in the background and at the coalface seek efficient and effective teaching innovations (Daniel, Kanwar & Uvalić-Trumbić 2009; Murphy 2012).
Massive Open Online Courses, one such efficient and effective teaching possibility, could affect tertiary education. These learning behemoths educate and assess in excess of 150 000 students in a single class, free of charge (Daniel 2012). Gaining momentum and increased participation across academia and industry, MOOCs have the capacity to range from global jokes to roaring successes. Google, for example, has run two MOOCs on searching and one MOOC on maps, with hundreds of thousands of students across the three MOOCs.
88 22nd National Vocational Education and Training Research Conference ‘No Frills’:refereed papers

Higher education research suggests two distinct MOOC styles: cMOOCs and xMOOCs, which differ in pedagogy and technology use (Daniel 2012). cMOOCs, the original MOOC, have less structure and rely more on student-generated content than the xMOOCs, which resemble traditional bricks-and-mortar classes with lectures, drills and tests.
Addressing federal and industry vocational education training (VET) compliance standards could open the door for the adoption and implementation of a third type of MOOC. Australia’s National Broadband Network, the National VET e-Learning Strategy and New Generation Technologies for Learning highlight the potential and to a lesser extent the peril that the VET sector faces in diffusing — adopting and implementing — today’s educational innovations.
To date, few if any, VET studies address MOOCs. Correspondingly, there is a call for increased VET scholarship (Williams, Goulding & Seddon 2013). This paper takes a small step towards addressing these gaps by drawing on the Diffusion of Innovations (DOI) theory, perhaps the most popular theory to explain organisational technology use (Jeyaraj, Rottman & Lacity 2006; Rogers 2003), to review online learning and MOOCs. The paper suggests applications and research streams for MOOCs in the VET sector.
The paper opens with a brief history of educational innovations, which sets the stage for open access and today’s latest innovation, MOOCs. The historical perspective underscores the usefulness of the Diffusion of Innovations theory, offering two broad effects in how organisations adopt and use innovations. Bandwagon effects, adoption due to social pressure, drive the adoption of innovations and often lead to poor innovation implementation. Leapfrog effects, late adopters bypassing early adopters in innovation use, attenuate the adoption of innovations but accelerate effective innovation implementation. The diffusion of online learning ideas and technologies, such as MOOCs, should demonstrate similar bandwagon and leapfrog effects.
The methodology is a literature review of peer-reviewed articles, along with related information from respectable online publishers such as NCVER, The Chronicle of Higher Education and New York Times.
Literature reviewTechnology and education: a brief historical perspectiveIn the fifth century BC, education faced a seemingly major technological impediment and controversy: ‘Written materials would undermine the learning process and diminish the quality of the personal relationship between tutor and student’ (Gumport & Chun 1999, p.6). Thanks to the advent of writing, learners could now rely on written records rather than solely on their memories. The blackboard’s inventor, over two millennia later in 1841, was hailed among the best contributors to learning and science (Daniel 2012).
Postal courses, the rage in the 1920s, had four times the enrolment of all US universities and colleges combined (Carr 2012). Scholars and the press have hailed radio, motion pictures, television, programmed learning, computers and the internet as the most important educational developments since Gutenberg’s printing press, yet another educational innovation (Daniel 2012). One bullish forecast for the latest innovation, MOOCs, is that half the US higher education institutions will cease to exist in 50 years, or much
NCVER 89

sooner, and Harvard will have ten million students (Harden 2013). History is replete with new technologies touted to change education forever.
The National VET e-Learning Strategy has three complementary goals, to: benefit from Australia’s National Broadband Network; support workforce development; and increase e-learning participation (Commonwealth of Australia 2013). If history is any gauge, e-learning and MOOCs are yet other innovations that should improve learning, but are not a panacea and are controversial and have unintended consequences.
Closed and open accessOver the last few decades, due particularly to internet technologies, the pendulum has swung from closed to open educational access. Last century state-funded universities in the US often offered the elderly free or reduced tuition (Sheppard 1980). Today, Austrian and Belgian universities offer free access but face financial burdens due to an influx of migrant students, particularly in expensive courses such as medicine and veterinary science (deWitte 2012). Mexico’s Universidad Virtual del Estado de Michoacán (<univim.edu.mx/>) offers free tertiary education such as diplomas and bachelor degrees to Michoacán residents, but online only.
However, most tertiary education institutions today practise learning management system (LMS) teaching, restricting access to copyrighted class materials to registered students during the term (Martin 2012; Murphy 2012). A learning management system, such as Blackboard or Moodle, manages access and usually without open access or lifelong learning. The system can improve student access to educational materials during the term, but offers nothing for alumni or those interested in learning for the joy of learning.
At the other end of the educational access pendulum, institutions such as Massachusetts Institute of Technology are part of an open course movement and proudly share online class materials such as syllabi, lectures, videos and readings (Daniel 2012; Murphy 2012). Anyone with internet access can view the class materials, freely, at any time. In the VET sector, the Irish-based <Alison.com> offers about 500 free VET courses in a MOOC-type model.
MOOCs, a recent open course extension, go beyond providing educational information access. MOOCs provide assessment, feedback and recognition such as class rankings and certificates of participation. MOOCs highlight and challenge traditional teaching’s closed and proprietary nature.
MOOCsTypical MOOC features include openness, assessment, free enrolment, massive scale and synchronous operation with a current class (Daniel 2012; Kolowich 2012). Given the nascent nature of MOOCs, these typical features are guidelines rather than fixed requirements. Three poster MOOCs — Google’s power searching, Stanford’s artificial intelligence and MIT’s circuits and electronics — each enrolled over 150 000 students (Daniel 2012; Martin 2012).
Two key differences between MOOCs and traditional tertiary education are motivation and attrition. Tertiary education provides extrinsic rewards, credit, rather than the intrinsic rewards of learning something personal, such as a language or chess (Armstrong 2012). In
90 22nd National Vocational Education and Training Research Conference ‘No Frills’:refereed papers
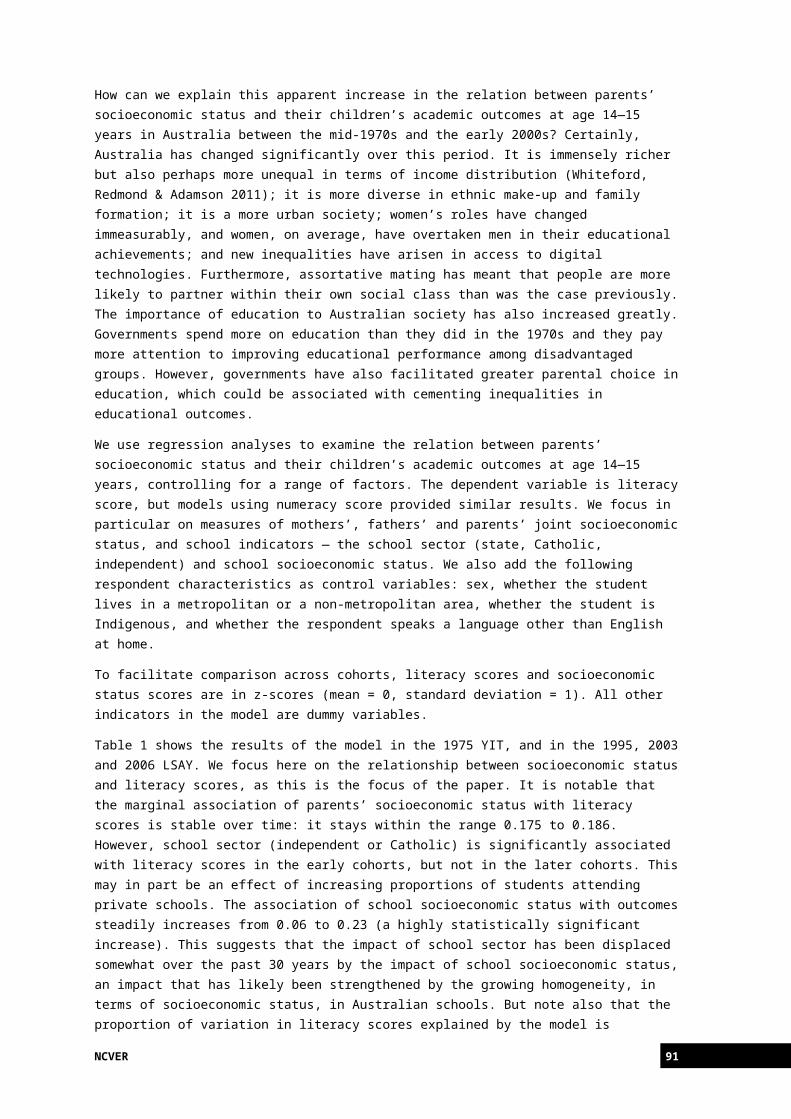
part due to no entry barriers, MOOC completion rates are under 10%. By contrast, Phoenix, a leading online university, has 35% undergraduate and 60% graduate course completion rates (Daniel 2012).
A Duke University MOOC in bioelectricity began with 12 725 registered students, of whom 7761 watched at least one video and 3658 took at least one quiz (Belanger & Thornton 2013). By week four, just 561 students scored above a zero on the quiz. Only 346 attempted the final exam, 313 students earned a certificate of participation (2.5% of all enrolled students) and 261 of these earned a high distinction.
Early indications are that traditional students with access to a MOOC attend fewer classes, although the classes have more interaction time, as most lectures are available online (Daniel 2012; Martin 2012). For external students, Martin (2012, p.28) questions MOOCs’ large-scale applicability as, ‘the weaker students struggled, and a few strong students were bored’.
Sceptics note the negative consequences and challenges of MOOCs. MOOCs may foster plagiarism (Gibbs 2012) and counter-intuitively discriminate against the less wealthy and less well-prepared students (Carlson & Blumenstyk 2012). Two recent MOOCs that ran amok led to a cancellation of the MOOC and the resignation of a University of California Irvine professor from the MOOC (Kolowich 2013a, 2013b). In the former, design flaws and technical glitches turned the subject, Fundamentals of Online Education: Planning and Application, into an internet punch line. The instructional designer and her colleagues at Georgia Tech suspended the course (Kolowich 2013a).
Online learningTwo statewide US community and technical college studies — 24 000 Virginia students in beginning math or English (Xu & Jaggars 2011) and 40 000 Washington students across 500 000 courses (Xu & Jaggars 2013) — found that students in traditional face-to-face classes outperformed their online counterparts. In Washington, relative online performance varied across student demographics and subject areas (Xu & Jaggars 2013). Online learning had an above average negative effect on learners studying English and social sciences, whereas the effect for those studying computer science, the applied professions, and natural sciences was less negative (Xu & Jaggars 2013).
Regarding students, young, male, black and those with low grade-point averages were more likely to underperform online (Xu & Jaggars 2013). This same demographic cohort is more likely to take gate-keeping courses such as English and social science and performs poorly in online classes. Rather than ameliorate, online classes exacerbate face-to-face performance gaps between demographic groups (Xu & Jaggars 2013). This unintended discrimination supports a possible negative MOOC outcome, handicapping the less-wealthy and less well-prepared students (Carlson & Blumenstyk 2012).
In Virginia, the estimated negative online learning effect did not change significantly from 2004 and 2008, ‘suggesting that evolving technologies were either not adopted or did not have a strong impact on online success rates’ (Xu & Jaggars 2011, p.375). A popular theory for investigating and explaining how organisations adopt and subsequently use innovations, such as online learning, is the Diffusion of Innovations.
NCVER 91

Diffusion of Innovations theoryDiffusion research and the popular press tend to adopt a pro-innovation bias (Jeyaraj, Rottman & Lacity 2006; Rogers 2003). Georgia Tech and the University of California Irvine’s MOOC experiences suggest bandwagon effects — social pressure rather than reasoned decisions led to developing the MOOCs — and exemplify that organisational adoption of an innovation does not equate to implementing that innovation well (Kolowich 2013a, 2013b). Individuals and organisations usually overestimate an innovation’s short-term impacts and underestimate both its long-term impacts and unintended consequences (Rogers 2003; Tenner 1996). As effective innovation use takes about 30 years to mature (Fidler 1997), online education may come of age in the mid-2020s, three decade after the web’s debut.
Despite abundant unanswered MOOC questions, universities seem to be hopping on the MOOC bandwagon for fear of being left behind. More so than other arguments about access or cost, bandwagon effects seem to drive much of the commentary relating to why use MOOCs and why they are important now (Watters 2013). Bandwagon effects often drive innovation adoption and lead to poor implementation of that innovation (Abrahamson 1991; Murphy et al. 2003).
In contrast to bandwagon effects, leapfrog effects relate to organisations and individuals slow to adopt an innovation but quick to use that innovation effectively (Ismail et al. 2012). For example, organsations late to adopt websites would use the website better than some organisations early to adopt websites.
A growing MOOC ‘leapfrogging’ trend is blended courses (Martin 2012). Rather than launch and maintain MOOCs, lecturers and their students appropriate an existing MOOC. Professors personalise the MOOC with classroom time, assignments and readings. For example, two community colleges in Massachusetts use the same computer programming MOOC from MIT, but at different speeds (Lewin 2013).
ConclusionsReviewing MOOCs, a recent and dynamic phenomenon, is difficult (Daniel 2012). There is little research, and, similar to most new technology research, what there is often has a pro-innovation bias (Rogers 2003). This literature review suggests that MOOCs are yet another innovation promoted as changing education forever. In common with other educational innovations, MOOCs should exhibit bandwagon and leapfrog effects. Funding bodies, educators and administrators should want to avoid bandwagon effects and profit from leapfrog effects.
Although both the popular and scholarly press promote the benefits of e-learning and MOOCs, the results of a few studies show that traditional face-to-face learning seems to outperform e-learning, particularly so for young, male students from minority groups and with low grade-point averages. Finally, the popularity and availability of MOOCs may force tertiary institutions to open rather than restrict access to their educational materials. And, over time, one or two MOOCs may own the space for popular VET areas.
How MOOCs will evolve in the VET sector seems a fruitful area for research. For example, how might MOOCs work for vocational education and training, globally and in the Australian
92 22nd National Vocational Education and Training Research Conference ‘No Frills’:refereed papers

context of training packages and qualification framework requirements? Furthermore, due to the need to demonstrate compliance, some courses may not be suited to MOOCs.
Rather than develop their own MOOCs, particularly due to bandwagon effects, VET providers and their staff should consider combining MOOCs with existing courses to form a blended course. For example, a computer science professor organised for his students to take a MOOC and a similar university class simultaneously (Martin 2012). The combination freed traditional lecture time for fruitful discussions. Although this research found no VET MOOCs per se, they seem to exist at <Alison.com> and possibly other websites.
MOOCs with less time and depth than a typical class could enhance and alter the MOOC landscape. Google’s Power Searching MOOCs run for three weeks (<powersearchingwithgoogle.com>). And Cornell University offers an asynchronous three-week MOOC, ‘Marketing the Hospitality Brand through New Media: Social, Mobile, and Search’ (Mangan 2013). VET providers, with shorter classes/units than higher education institutions, could customise a MOOC or augment an existing course by combining Massive Open Online Modules (MOOMs), such as Google’s Power Searching and Cornell’s Brand Marketing.
In addition to investigating the potential of Massive Open Online Modules, this paper proposes the diffusion of innovations as a theoretical perspective for studying e-learning and future research streams. One possible area particularly relevant to the VET sector is how e-learning can meet Australian Skills Qualifications Authority standards <asqa.gov.au/>. Another research area relates to how e-learning success can be measured, for example, completion and performance in online classes (Belanger & Thornton 2013), and in relation to these issues, how do blended courses (that is, MOOCs used in combination with traditional classes) compare with MOOCs and traditional courses? Finally, research could examine what student types and courses work well, or not well, with MOOCs.
AcknowledgmentsThis paper draws on and extends three accepted conference papers (Murphy, Hofacker, Brogan & Kim 2013; Ryan, Williams & Murphy 2013; Murphy, Williams, Ryan, Kalbaska & Cantoni 2013). The authors kindly thank the Asia Pacific Council on Hotel, Restaurant and Institutional Education, the European Council on Hotel, Restaurant and Institutional Education and the American Marketing Association conference organisers and paper reviewers, in addition to thanking and acknowledging colleagues on these three papers.
ReferencesAbrahamson, E 1991, ‘Managerial fads and fashions: the diffusion and rejection of innovations’,
Academy of Management Review, vol.16, no.3, pp.586—612. Armstrong, JS 2012, ‘Natural learning in higher education’, in Encyclopedia of the Sciences of
Learning, ed. NM Seel, Springer, New York, pp.2426—433.Barber, M, Donnelly, K & Rizvi, S 2013, An avalanche is coming: higher education and the
revolution ahead, Institute for Public Policy Research, London.Belanger, Y & Thornton, J 2013, Bioelectricity: a quantitative approach: Duke University’s first
MOOC, Duke University, Durham, NC.
NCVER 93
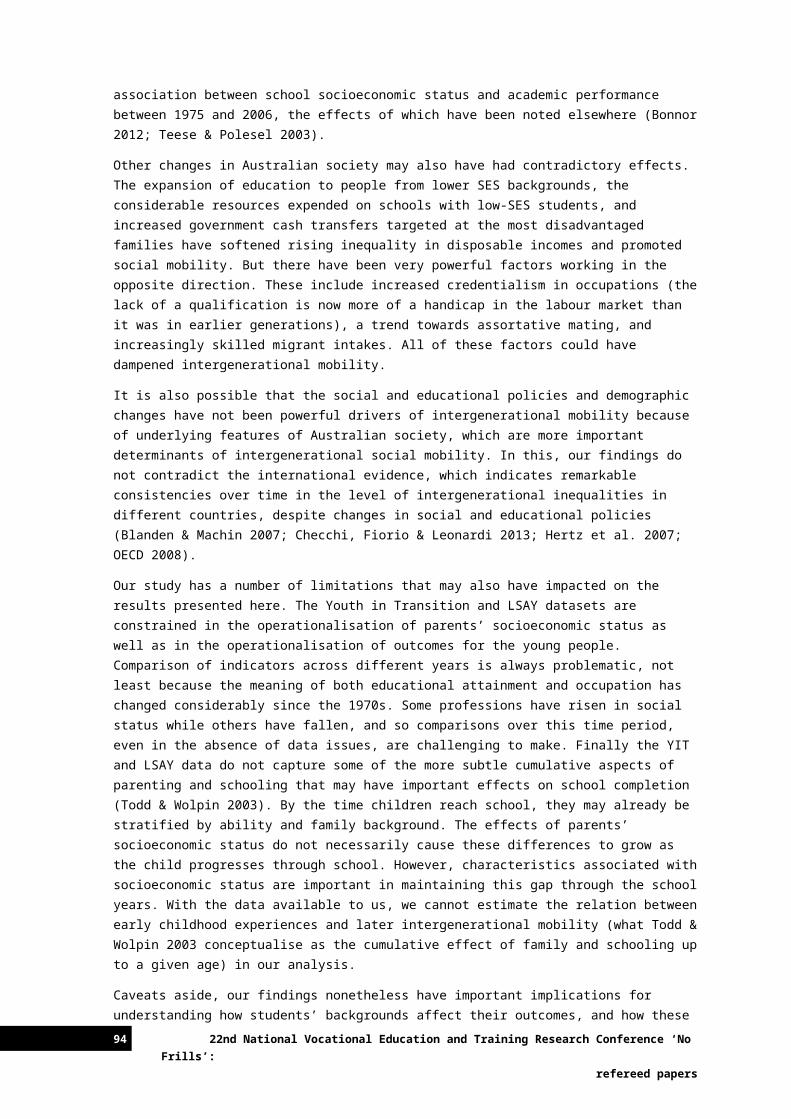
Carlson, S & Blumenstyk, Goldie 2012, ‘For whom is college being reinvented? The chronicle of higher education’, viewed 22 April 2014, <http://chronicle.com/article/The-False-Promise-of-the/136305/>.
Carr, N 2012, ‘The crisis in higher education’, MIT Technology Review, 27 September.Commonwealth of Australia 2013, National VET E-learning Strategy, Commonwealth of Australia,
Canberra.Daniel, J 2012, ‘Making sense of MOOCs: musings in a maze of myth, paradox and possibility’,
Journal of Interactive Media in Education, vol.3.Daniel, J, Kanwar, A & Uvalić-Trumbić, S 2009, ‘Breaking higher education’s iron triangle: access,
cost, and quality’, Change: The Magazine of Higher Learning, vol.41, no.2, pp.30—5. deWitte, Floris 2012, ‘Transnational solidarity and the mediation of conflicts of justice in Europe’,
European Law Journal, vol.18, no.5, pp.694—701. Fidler, RF 1997, Mediamorphosis — understanding new media, Pine Forge Press, Thousand Oaks,
CA.Gibbs, L 2012, ‘Yes, plagiarism: how sad is that?’, Coursera Fantasy: Blogging My Way through a
MOOC, viewed 19 April 2014, <http://courserafantasy.blogspot.kr/2012/08/yes-plagiarism-how-sad-is-that.html>.
Gumport, PJ & Chun, M 1999, ‘Technology and higher education: opportunities and challenges for the new era’, National Center for Postsecondary Improvement, viewed 24 April 2014, <http://www.stanford.edu/group/ncpi/documents/pdfs/1-02_techhighered.pdf>.
Harden, N 2013, ‘The end of the university as we know it’, The American Interest, no.8.Ismail, AF, Hashim, NH, Gemignani, G & Murphy, J 2012, ‘Leapfrogging and internet
implementation by tourism organizations’, Journal of Information Technology and Tourism, vol.13, no.3, pp.177—89.
Jeyaraj, A, Rottman, JW & Lacity, MC 2006, ‘A review of the predictors, linkages, and biases in IT innovation adoption research’, Journal of Information Technology, vol.21, no.1, pp.1—23.
Kolowich, S 2012, ‘How “open” are MOOCs?’, Inside Higher Ed, viewed 24 April 2014, <http://www.insidehighered.com/news/2012/11/08/educause-discussion-about-oer>.
——2013a, ‘Georgia Tech and Coursera try to recover from MOOC stumble’, Chronicle of Higher Education, 4 February, viewed 24 April 2014, <http://chronicle.com/blogs/wiredcampus/georgia-tech-and-coursera-try-to-recover-from-mooc-stumble/42167>.
——2013b, ‘Professor leaves a MOOC in mid-course in dispute over teaching’, Chronicle of Higher Education,18 February, viewed 24 April 2014, <http://chronicle.com/blogs/wiredcampus/professor-leaves-a-mooc-in-mid-course-in-dispute-over-teaching/42381>.
Lewin, T 2013, ‘Adapting to blended courses, and finding early benefits, The New York Times, 29 April, viewed 24 April 2014, <http://www.nytimes.com/2013/04/30/education/adapting-to-blended-courses-and-finding-early-benefits.html>.
Mangan, K 2013, ‘eCornell offers a MOOC that steers students to a paid follow-up’, Chronicle of Higher Education, 8 January, viewed 24 april 2014, <http://chronicle.com/blogs/wiredcampus/ecornell-to-offer-mooc-that-steers-students-to-for-credit-follow-up>.
Martin, FG 2012, ‘Will massive open online courses change how we teach?’, Communications of the ACM, vol.55, no.8, pp.26—8.
Murphy, J 2012, ‘LMS teaching versus community learning: a call for the latter’, Asia Pacific Journal of Marketing and Logistics, vol.25, no.5, pp.826—41.
Murphy, J, Hofacker, C, Brogan, P & Kim, P 2013, ‘Massive open online courses: a MOOC overview and research agenda’, paper presented at the American Marketing Association Summer Educators’ Conference, Boston.
Murphy, J, Olaru, D, Schegg, R & Frey, S 2003, ‘The bandwagon effect: Swiss Hotels’ website and e-mail management’, Cornell Hotel and Restaurant Administration Quarterly, vol.44, no.1, pp.71—87.
Murphy, J, Williams, A, Ryan, P, Kalbaska, N & Cantoni, L 2013, ‘Tourism and hospitality massive open online courses (MOOCs): an overview and diffusion considerations’, paper presented at the European Council on Hotel, Restaurant and Institutional Education, Frieburg.
Rogers, EM 2003, Diffusion of innovations, 5th edn, Simon & Schuster, New York.
94 22nd National Vocational Education and Training Research Conference ‘No Frills’:refereed papers

Ryan, P, Williams, A & Murphy, J 2013, ‘Current and future trends in hospitality and tourism higher education’, paper presented at the Asia Pacific Council on Hotel, Restaurant and Institutional Education, Macao.
Sheppard, NA 1980’, ‘The response of higher education to older adults: a federal perspective’, Alternative Higher Education, vol.5, no.1, pp.7—17.
Tenner, E 1996, Why things bite back: technology and the revenge of unintended consequences, Alfred Knopf, New York.
Watters, A 2013, ‘MOOC mania: debunking the hype around massive open online courses’, The Digital Shift. 13 April, viewed 24 April 2014, <http://www.thedigitalshift.com/2013/04/featured/got-mooc-massive-open-online-courses-are-poised-to-change-the-face-of-education/>.
Williams, M, Goulding, F & Seddon, T 2013, Towards a culture of scholarly practice in mixed-sector institutions, NCVER, Adelaide.
Xu, D & Jaggars, SS 2011, ‘The effectiveness of distance education across Virginia’s community colleges: evidence from introductory college-level math and English courses’, Educational Evaluation and Policy Analysis, vol.33, no.3, pp.360—77.
——2013, ‘Adaptability to online learning: differences across types of students and academic subject areas’, CCRC Working Papers, vol.54, Teachers College, Columbia University, New York.
NCVER 95