2291-13 joint ictp-iaea course on science and technology...
TRANSCRIPT
2291-13
Joint ICTP-IAEA Course on Science and Technology of Supercritical Water Cooled Reactors
Mark ANDERSON
27 June - 1 July, 2011
University of Wisconsin Department of Engineering Physics Heat Transfer Laboratory, 737 Engineering Research Building
1500 Engineering Dr. Madison 53706 WI
U.S.A.
PRESSURE DROP & CRITICAL FLOW OF SCF

(SC12)(SC12)(SC12)(SC12)Pressure drop &
C i i l fl f SCFCritical flow of SCFJoint ICTP-IAEA Course on Science and Technology of SCWRsJoint ICTP-IAEA Course on Science and Technology of SCWRs,
Trieste, Italy, 27 June - 1 July
Mark AndersonDirector Thermal Hydraulics Laboratory
University of Wisconsin – Madison (USA)University of Wisconsin Madison (USA)

ObjectivesObjectives
• Motivation
R i f i l h d t h d• Review of single-phase and two-phase pressure drop
• Outline issues associated with calculating pressure drop for supercritical fluids
• Discussion of depressurization – critical flow
• Review of Single-phase/two-phase critical flow – depressurization
• Look at experiments conducted for depressurization from SC conditions
• Issues with estimating the critical flow at supercritical pressure
• Planned future experiments on rapid depressurization• Planned future experiments on rapid depressurization
International Atomic Energy AgencyJoint ICTP-IAEA Course on Science and Technology of SCWRs, Trieste, Italy, 27 June - 1 July 2011 (SC12) Pressure drop & depressurization of SCF
2
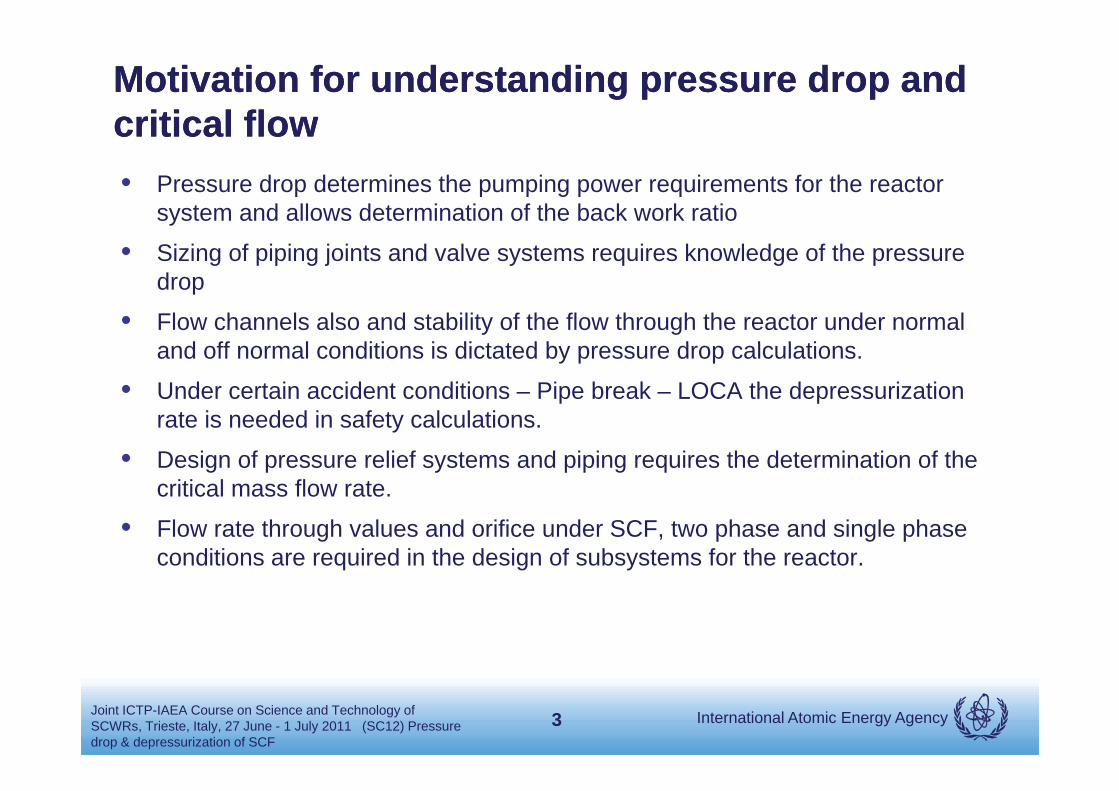
Motivation for understanding pressure drop and Motivation for understanding pressure drop and critical flow critical flow • Pressure drop determines the pumping power requirements for the reactor
system and allows determination of the back work ratio
• Sizing of piping joints and valve systems requires knowledge of the pressure drop
• Flow channels also and stability of the flow through the reactor under normal d ff l diti i di t t d b d l l tiand off normal conditions is dictated by pressure drop calculations.
• Under certain accident conditions – Pipe break – LOCA the depressurization rate is needed in safety calculations.
• Design of pressure relief systems and piping requires the determination of the critical mass flow rate.
• Flow rate through values and orifice under SCF, two phase and single phase diti i d i th d i f b t f th tconditions are required in the design of subsystems for the reactor.
International Atomic Energy AgencyJoint ICTP-IAEA Course on Science and Technology of SCWRs, Trieste, Italy, 27 June - 1 July 2011 (SC12) Pressure drop & depressurization of SCF
3
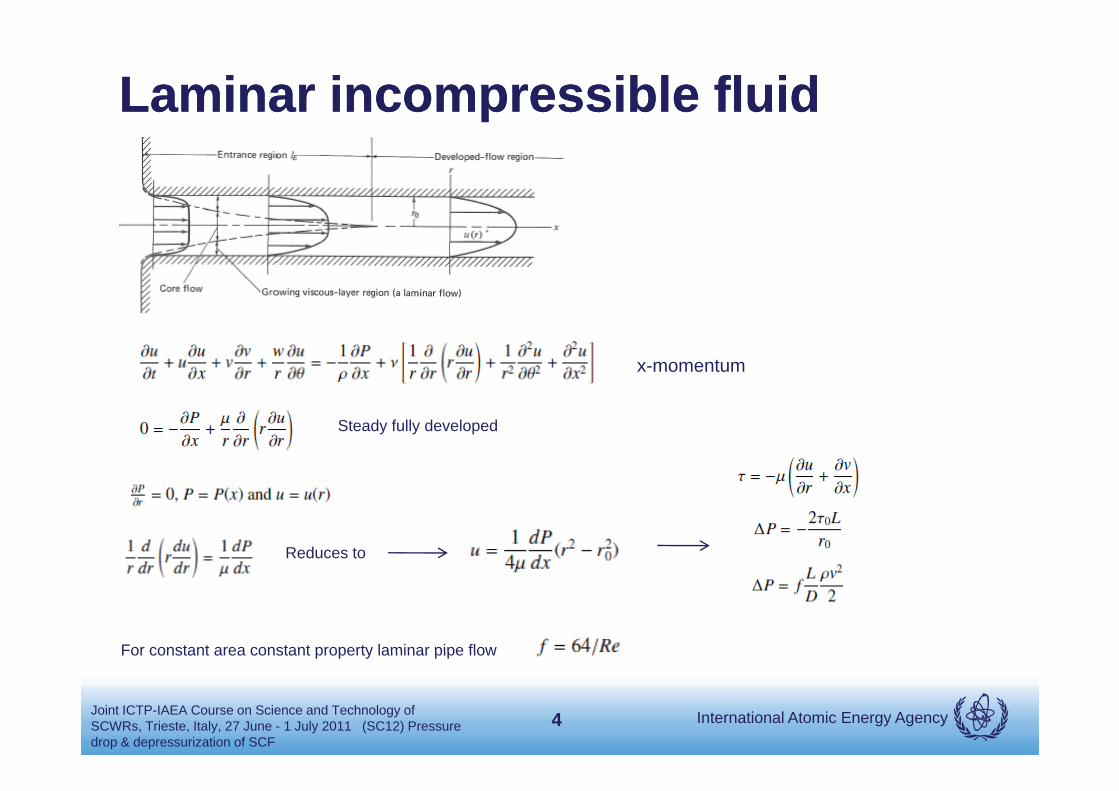
Laminar incompressible fluidLaminar incompressible fluid
x-momentum
Steady fully developed
R d tReduces to
For constant area constant property laminar pipe flow
International Atomic Energy AgencyJoint ICTP-IAEA Course on Science and Technology of SCWRs, Trieste, Italy, 27 June - 1 July 2011 (SC12) Pressure drop & depressurization of SCF
4
For constant area constant property laminar pipe flow
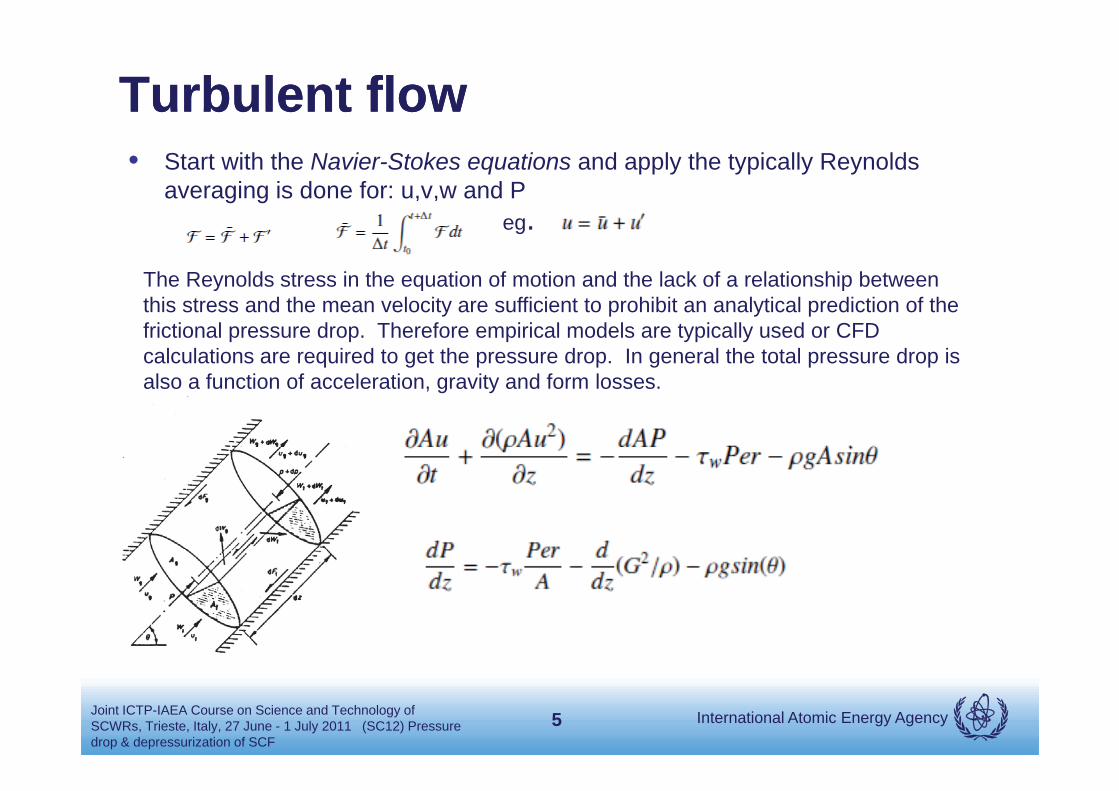
Turbulent flowTurbulent flow• Start with the Navier-Stokes equations and apply the typically Reynolds
averaging is done for: u,v,w and Peg.
The Reynolds stress in the equation of motion and the lack of a relationship between this stress and the mean velocity are sufficient to prohibit an analytical prediction of the frictional pressure drop. Therefore empirical models are typically used or CFD calculations are required to get the pressure drop. In general the total pressure drop is also a function of acceleration, gravity and form losses.
International Atomic Energy AgencyJoint ICTP-IAEA Course on Science and Technology of SCWRs, Trieste, Italy, 27 June - 1 July 2011 (SC12) Pressure drop & depressurization of SCF
5

Pressure Drop Pressure Drop –– Single Single phase Turbulentphase Turbulent
W PAu
The pumping power required by coolant to overcome pressure losses through a complete loop is
Where is the sum of frictional, entrance and exit losses, flow obstructions, acceleration and gravity
P
P P P P Pfric oss accel gravP P P P P2
2fricL uP fD
Moody diagram0.2
0.184Re
f
Turbulent smooth pipe
(Re, / )f f e d2eD
2
2lossuP K K Form loss coefficient – empirical found
2 2accel out out in inP u u
sin sinL
out out in ingrav
h hP dz g g Lh h
International Atomic Energy AgencyJoint ICTP-IAEA Course on Science and Technology of SCWRs, Trieste, Italy, 27 June - 1 July 2011 (SC12) Pressure drop & depressurization of SCF
0g
out inh h
6

Moody friction factor
International Atomic Energy AgencyJoint ICTP-IAEA Course on Science and Technology of SCWRs, Trieste, Italy, 27 June - 1 July 2011 (SC12) Pressure drop & depressurization of SCF
7
A h i i l h li id
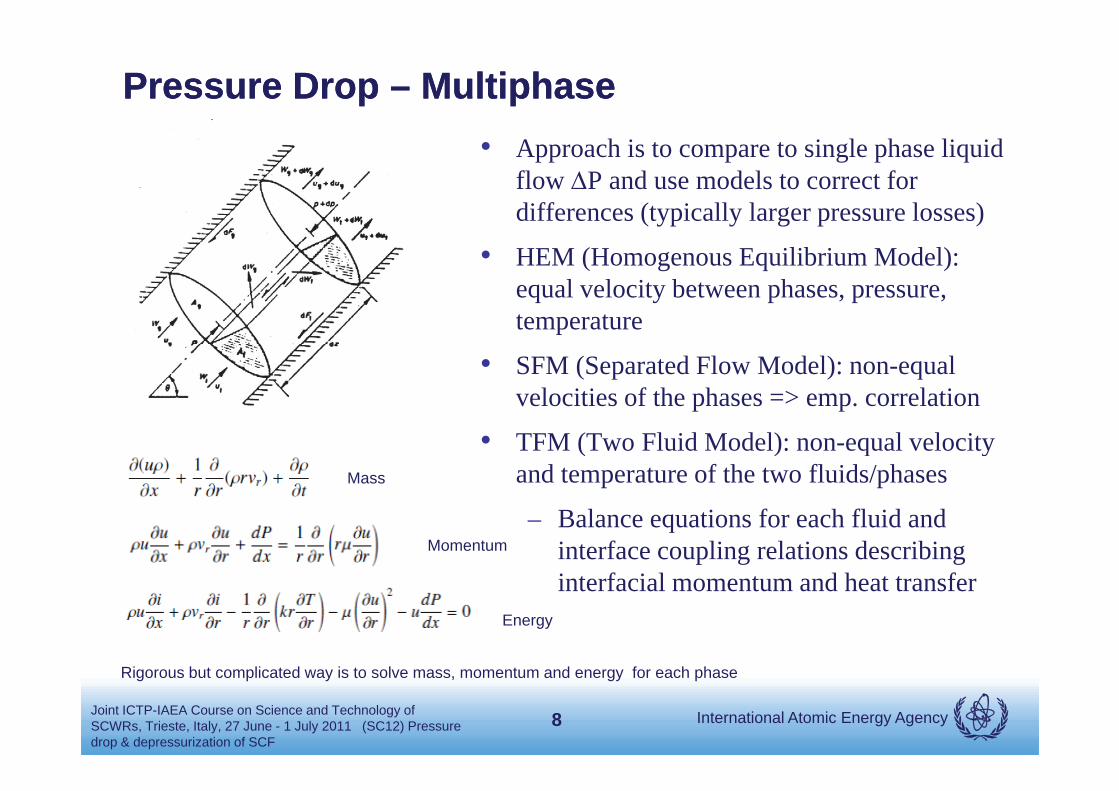
Pressure Drop Pressure Drop –– MultiphaseMultiphase• Approach is to compare to single phase liquid
flow P and use models to correct for differences (typically larger pressure losses)
• HEM (Homogenous Equilibrium Model): equal velocity between phases, pressure, temperature
• SFM (Separated Flow Model): non-equal velocities of the phases => emp. correlation
• TFM (Two Fluid Model): non-equal velocityTFM (Two Fluid Model): non equal velocityand temperature of the two fluids/phases
– Balance equations for each fluid and interface coupling relations describing
Mass
Momentum interface coupling relations describinginterfacial momentum and heat transfer
Momentum
Energy
International Atomic Energy AgencyJoint ICTP-IAEA Course on Science and Technology of SCWRs, Trieste, Italy, 27 June - 1 July 2011 (SC12) Pressure drop & depressurization of SCF
8
Rigorous but complicated way is to solve mass, momentum and energy for each phase

HEM (Homogenous Equilibrium Model) HEM (Homogenous Equilibrium Model) Pressure DropPressure Drop• Consider terms with a HEM model phases are at equal velocity, temperature
and pressure – the only thing that changes is how to evaluate terms
pp
F i i
fric oss accel gravP P P P P
• Friction:
h f
2,fric fric f fP P
m
( )G u
where for
• Gravity:
• Acceleration:
2 1 / /m
f avg fg f fx v v ( ) ( m in )0 1tu rb la a rm
( / ) ln 1 ( / )grav f f vg exit fg fP gL v v x v v2 21/( )P G v x cAcceleration:
• Note that xavg =xexit/2; all properties evaluated at xavg
1/( )accel fg exitP G v x c
( / ( * )x q PerL G A h
International Atomic Energy AgencyJoint ICTP-IAEA Course on Science and Technology of SCWRs, Trieste, Italy, 27 June - 1 July 2011 (SC12) Pressure drop & depressurization of SCF
( / ( )exit fgx q PerL G A h
9
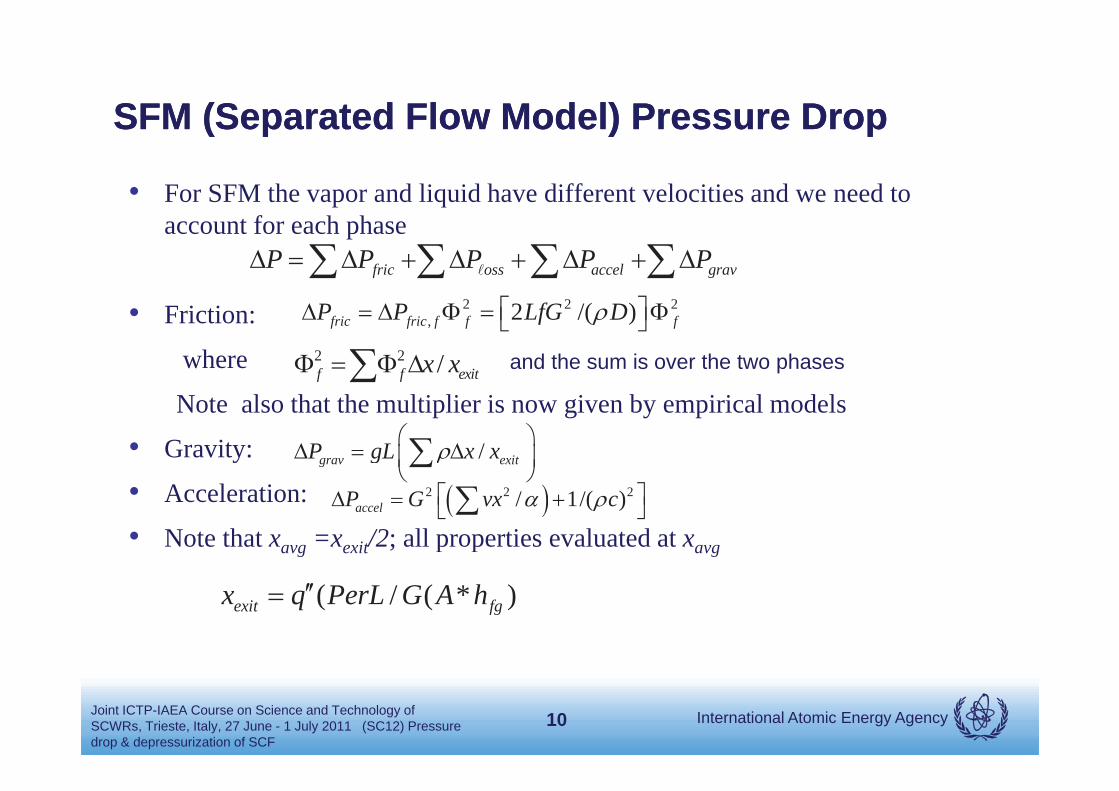
SFM (Separated Flow Model) SFM (Separated Flow Model) Pressure DropPressure Drop
• For SFM the vapor and liquid have different velocities and we need to account for each phase
• Friction:
fric oss accel gravP P P P P2 2 2
, 2 /( )fric fric f f fP P LfG D
where
Note also that the multiplier is now given by empirical models
• Gravity:
2 2 /f f exitx x
/P L
and the sum is over the two phases
• Gravity:
• Acceleration:
• Note that xavg =xexit/2; all properties evaluated at xavg
/grav exitP gL x x2 2 2/ 1/( )accelP G vx c
avg exit ; p p avg
( / ( * )exit fgx q PerL G A h
International Atomic Energy AgencyJoint ICTP-IAEA Course on Science and Technology of SCWRs, Trieste, Italy, 27 June - 1 July 2011 (SC12) Pressure drop & depressurization of SCF
10

While there is a lot of data on single and two phase pressure drop there is not much experimental data on SCF pressure drop and what is available is not well documented (It is however a single phase as long as we are above the vapor dome)
Reference p, MPa t, ºC(H in kJ/kg)
q, MW/m2 G, kg/m2s Flow geometry
Tubes (vertical)Tarasova and 22.6–26.5 tb or Hb were 0.58–1.32 2000; 5000 SS tube (D=3.34 mm, L=0.134 m; D=8.03 mm, L=0.602 m)
g p g p )
Leont’ev 1968b bnot provided (selected data are shown in Figure 12.2)
Krasyakova et al. 1973
23; 25 Hb=450–2400 0.2–1 500–3000 Vertical (D=20 mm, L=2.2; 7.73 m) and horizontal (D=20 mm, L=2.2; 4.2 m) SS tubes, upward and horizontal flows
Chakrygin et al. 1974
26.5 tin=220–300 q was not provided
445–1270 SS tube (D=10 mm, L=0.6 m), upward and downward flows
Ishigai et al. 1976 24.5; 29.5; 39.2
Hb=220–800 0.14–1.4 500; 1000; 1500
Vertical (D=3.92 mm, L=0.63 m) and horizontal (D=4.44 mm, L=0.87 m) SS polished tubes
Razumovskiy 1984;Razumovskiy et al. 1984, 1985
23.5 Hin=1400;1600; 1800
0.657–3.385 2190 Smooth tube (D=6.28 mm, L=1.44 m), upward flow (selected data are shown in Figure 12.5)
Horizontal tubesKondrat’ev 1969 22 6; 24 5; t =105 540 0 12 1 2 Re=105 Polished SS tube (D=10 5 mm L=0 52 m) (selected data areKondrat ev 1969 22.6; 24.5;
29.4tb=105–540 0.12–1.2 Re=105 Polished SS tube (D=10.5 mm, L=0.52 m) (selected data are
shown in Figure 12.3)
Krasyakova et al. 1973
23; 25 tb or Hb werenot provided
0.2–1 500–3000 SS tube (D=20 mm, L=2.2; 4.2 m)
Ishigai et al. 1976 24.5; 29.5; 39 2
Hb=220–800 0.14–1.4 500; 1000; 1500
Horizontal (D=4.44 mm, L=0.87 m) and vertical (D=3.92 mm, L=0 63 m) SS polished tubes (selected data are shown in
International Atomic Energy AgencyJoint ICTP-IAEA Course on Science and Technology of SCWRs, Trieste, Italy, 27 June - 1 July 2011 (SC12) Pressure drop & depressurization of SCF
39.2 1500 L=0.63 m) SS polished tubes (selected data are shown inFigure 12.4)
11
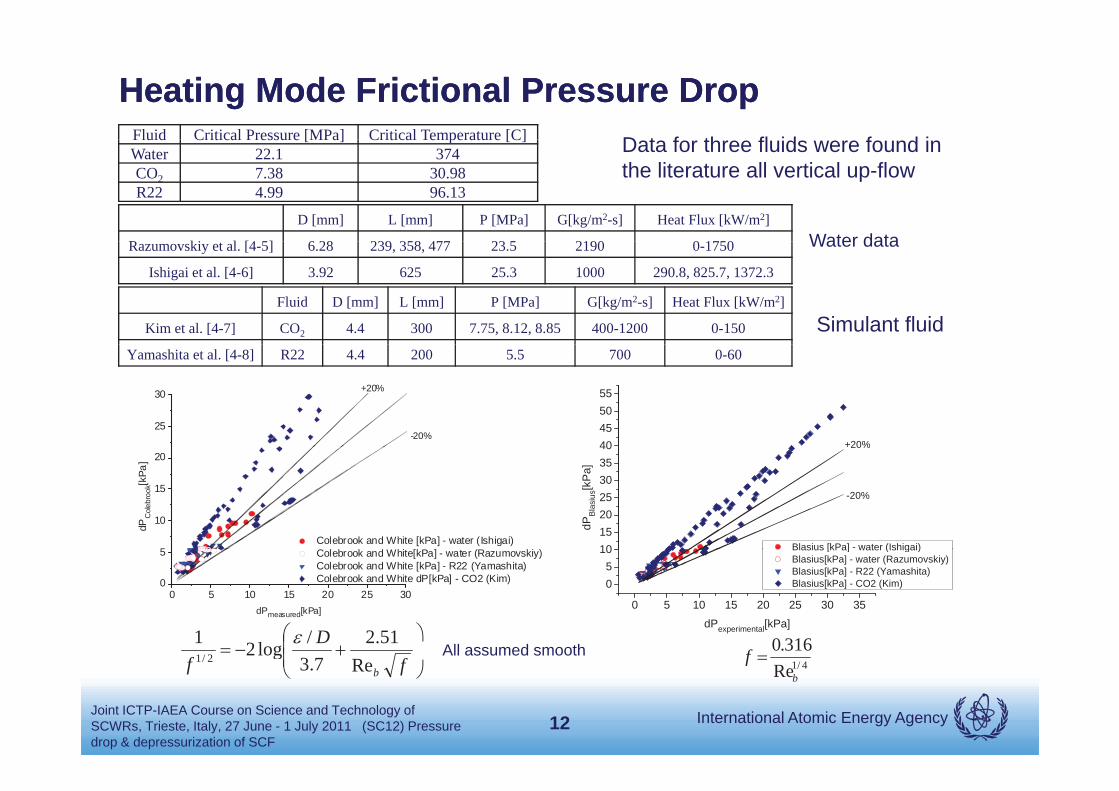
Heating Mode Frictional Pressure DropHeating Mode Frictional Pressure DropFluid Critical Pressure [MPa] Critical Temperature [C] D t f th fl id f d iFluid Critical Pressure [MPa] Critical Temperature [C]Water 22.1 374CO2 7.38 30.98R22 4.99 96.13
Data for three fluids were found in the literature all vertical up-flow
D [mm] L [mm] P [MPa] G[kg/m2-s] Heat Flux [kW/m2]
R ki l [4 5] 6 28 239 358 477 23 5 2190 0 1750 Water dataRazumovskiy et al. [4-5] 6.28 239, 358, 477 23.5 2190 0-1750
Ishigai et al. [4-6] 3.92 625 25.3 1000 290.8, 825.7, 1372.3
Water data
Fluid D [mm] L [mm] P [MPa] G[kg/m2-s] Heat Flux [kW/m2]
Kim et al. [4-7] CO2 4.4 300 7.75, 8.12, 8.85 400-1200 0-150 Simulant fluid
40455055
+20%
25
30 +20%
-20%
Yamashita et al. [4-8] R22 4.4 200 5.5 700 0-60
10152025303540
-20%
Blasius [kPa] - water (Ishigai)
dPB
lasi
us[k
Pa]
20%
5
10
15
20
Colebrook and White [kPa] - water (Ishigai)C l b k d Whit [kP ] t (R ki )
dPC
oleb
rook
[kPa
]
316.0fD 51.2/log21
All assumed smooth
0 5 10 15 20 25 30 35
05
10 Blasius [kPa] water (Ishigai) Blasius[kPa] - water (Razumovskiy) Blasius[kPa] - R22 (Yamashita) Blasius[kPa] - CO2 (Kim)
dPexperimental[kPa]
0 5 10 15 20 25 300
5 Colebrook and White[kPa] - water (Razumovskiy) Colebrook and White [kPa] - R22 (Yamashita) Colebrook and White dP[kPa] - CO2 (Kim)
dPmeasured[kPa]
International Atomic Energy AgencyJoint ICTP-IAEA Course on Science and Technology of SCWRs, Trieste, Italy, 27 June - 1 July 2011 (SC12) Pressure drop & depressurization of SCF
4/1Reb
fff bRe7.3log22/1 All assumed smooth
12

Water and R22 dataWater and R22 dataTh t i t i th t t ti l th f thThere was some uncertainty in the test section length for the Kim et al. data. But over all it seems we can fit to a single friction factor equation
16
20
-20%
+20%
16
20 +20%
-20%
8
12
dPB
lasi
us[k
Pa]
4
8
12
dPC
oleb
rook
[kP
a]
0 4 8 12 16 200
4 Blasius [kPa] - water (Ishigai) Blasius[kPa] - water (Razumovskiy) Blasius[kPa] - R22 (Yamashita)
dPexperimental[kPa]
0 4 8 12 16 200
4 C&W [kPa] - water (Ishigai) C&W[kPa] - water (Razumovskiy) C&W [kPa] - R22 (Yamashita)
dPmeasured[kPa]experimental
fD
f bRe51.2
7.3/log21
2/1 4/1Re316.0
b
f
International Atomic Energy AgencyJoint ICTP-IAEA Course on Science and Technology of SCWRs, Trieste, Italy, 27 June - 1 July 2011 (SC12) Pressure drop & depressurization of SCF
13
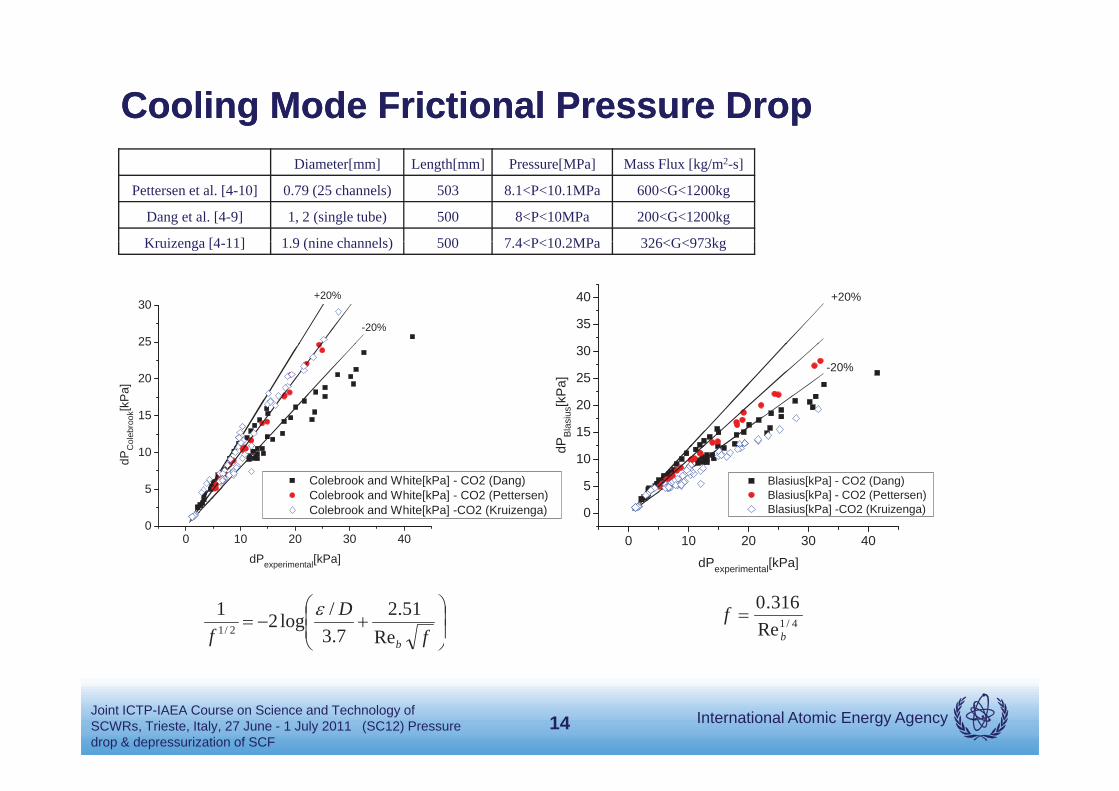
Cooling Mode Frictional Pressure DropCooling Mode Frictional Pressure DropDiameter[mm] Length[mm] Pressure[MPa] Mass Flux [kg/m2-s]
Pettersen et al. [4-10] 0.79 (25 channels) 503 8.1<P<10.1MPa 600<G<1200kg
Dang et al. [4-9] 1, 2 (single tube) 500 8<P<10MPa 200<G<1200kg
Kruizenga [4 11] 1 9 (nine channels) 500 7 4<P<10 2MPa 326<G<973kgKruizenga [4-11] 1.9 (nine channels) 500 7.4<P<10.2MPa 326<G<973kg
35
40 +20%
25
30
-20%
+20%
15
20
25
30-20%
PBl
asiu
s[kP
a]
15
20
25
Col
ebro
ok[k
Pa]
0 10 20 30 40
0
5
10 Blasius[kPa] - CO2 (Dang) Blasius[kPa] - CO2 (Pettersen) Blasius[kPa] -CO2 (Kruizenga)
d
0 10 20 30 400
5
10
Colebrook and White[kPa] - CO2 (Dang) Colebrook and White[kPa] - CO2 (Pettersen) Colebrook and White[kPa] -CO2 (Kruizenga)
dPC
dPexperimental[kPa]
4/1Re316.0
b
f
dPexperimental[kPa]
fD
f bRe51.2
7.3/log21
2/1
International Atomic Energy AgencyJoint ICTP-IAEA Course on Science and Technology of SCWRs, Trieste, Italy, 27 June - 1 July 2011 (SC12) Pressure drop & depressurization of SCF
14

SCF Pressure Drop ConclusionsSCF Pressure Drop Conclusions• Pressure-loss calculations in the heat-transfer system are required in design and safety analyses. Those calculations
for piping components outside the core region are relatively straight forward. However, a lack of relevant experimental data for these components in supercritical fluids may affect the overall accuracy.
• Predictions of the pressure loss over the core region are quite complex, due to the fact that fluid properties vary considerably (drastically at the pseudo-critical point) along the fuel assembly. A two-region approach is recommended to minimize the impact of rapid fluid-property changes at the pseudo-critical point.
• A number of friction factor equations have been reported in the literature. In most cases, the C-W equation appears toA number of friction factor equations have been reported in the literature. In most cases, the C W equation appears to be applicable for SC Conditions there is no relevant data on form losses.
1 / 2 51D2L uP f
fric oss accel gravP P P P P
1/ 21 / 2.512log
3.7 Resc b sc
Df f2fric sc
e
P fD where
2
2lossuP K K Form loss coefficient – Needs to be measured empirically
2 2accel out out in inP u u
sin sinL
out out in ingrav
h hP dz g g Lh h
Split the flow up in segments to deal with large variation in density
International Atomic Energy AgencyJoint ICTP-IAEA Course on Science and Technology of SCWRs, Trieste, Italy, 27 June - 1 July 2011 (SC12) Pressure drop & depressurization of SCF
15
0 out inh h large variation in density
SCF Pressure drop (cont)SCF Pressure drop (cont)
• The effect of surface heating (or cooling) on frictional pressure loss is noticeable. A reduction in pressure loss has been observed with the surface in heating mode while the pressure loss appears to be higher in the cooling modeheating mode while the pressure loss appears to be higher in the cooling mode as compared to adiabatic flow.
E t bli h t f f l ffi i t l i t l d t bt i d• Establishment of form-loss coefficients rely on experimental data obtained specifically for the piping component and the fuel assembly appendage designs in supercritical flows. The lack of relevant experimental data affects significantly the calculation accuracy of the overall pressure loss and in g y y pparticular the pressure loss over the fuel assembly.
• Once the fluid enters the 2 phase dome a HEM model is recommended for theOnce the fluid enters the 2 phase dome a HEM model is recommended for the 2 phase liquid/vapor
International Atomic Energy AgencyJoint ICTP-IAEA Course on Science and Technology of SCWRs, Trieste, Italy, 27 June - 1 July 2011 (SC12) Pressure drop & depressurization of SCF
16

References for pressure drop dataReferences for pressure drop dataPioro, I.L. 2006, Heat transfer and hydraulic resistance at supercritical pressures in power engineering applications, ASME Press, New
York.
Pioro, I.L. and Duffey, R.B., 2005, “Experimental Heat Transfer to Supercritical Water Flowing inside Channels (Survey)”, Nucl. Eng. Des., 235 (22), 2407-2420.
Cheng L Ribatski G & Thome J R 2008 "Analysis of supercritical CO2 cooling in macro- and micro-channels" International JournalCheng, L., Ribatski, G. & Thome, J.R. 2008, Analysis of supercritical CO2 cooling in macro and micro channels , International Journal of Refrigeration, vol. 31, no. 8, pp. 1301-16.
Colebrook, C.F. 1939, "Turbulent flow in pipes, with particular reference to transition region between smooth and rough pipe laws", Institution of Civil Engineers of London -- Journal, vol. 12, no. 4, pp. 393-422.
Razumovskiy et al. 1984
I hi i t l 1976Ishigai et al. 1976
Kim, H.Y., Kim, H., Song, J.H., Cho, B.H. & Bae, Y.Y. 2007, "Heat transfer test in a vertical tube using CO2 at supercritical pressures", Journal of Nuclear Science and Technology, vol. 44, no. 3, pp. 285-293.
Yamashita, T., Mori, H., Yoshida, S. & Ohno, M. 2003, "Heat transfer and pressure drop of a Supercritical pressure fluid flowing in a tube of small diameter", Memoirs of the Faculty of Engineering, Kyushu University, vol. 63, no. 4, pp. 227-244.
Dang, C. & Hihara, E. 2004, "In-tube cooling heat transfer of supercritical carbon dioxide. Part 1. Experimental measurement", International Journal of Refrigeration, vol. 27, no. 7, pp. 736-747.
Pettersen, J., Rieberer, R., Munkejord, S.T. 2000, "Heat Transfer and Pressure Drop for Flow of Supercritical and Subcritical CO2 in Microchannel Tubes".
Kruizenga, Heat Transfer and Pressure Drop Measurements in Prototypic Heat Exchangers for the Supercritical Carbon Dioxide Brayton g p yp g p yPower Cycle, PhD thesis, University of Wisconsin Madison.
Corradini, Fundementals of Multiphase flow, (http://wins.engr.wisc.edu/teaching/mpfBook/main.html)
Henry R E, Fauske H K. The two-phase critical flow of one-component mixtures in nozzles, orifices, and short tubes. ASME Trans C, J Heat Transfer, 1971, 93(2): 179–187
International Atomic Energy AgencyJoint ICTP-IAEA Course on Science and Technology of SCWRs, Trieste, Italy, 27 June - 1 July 2011 (SC12) Pressure drop & depressurization of SCF
17
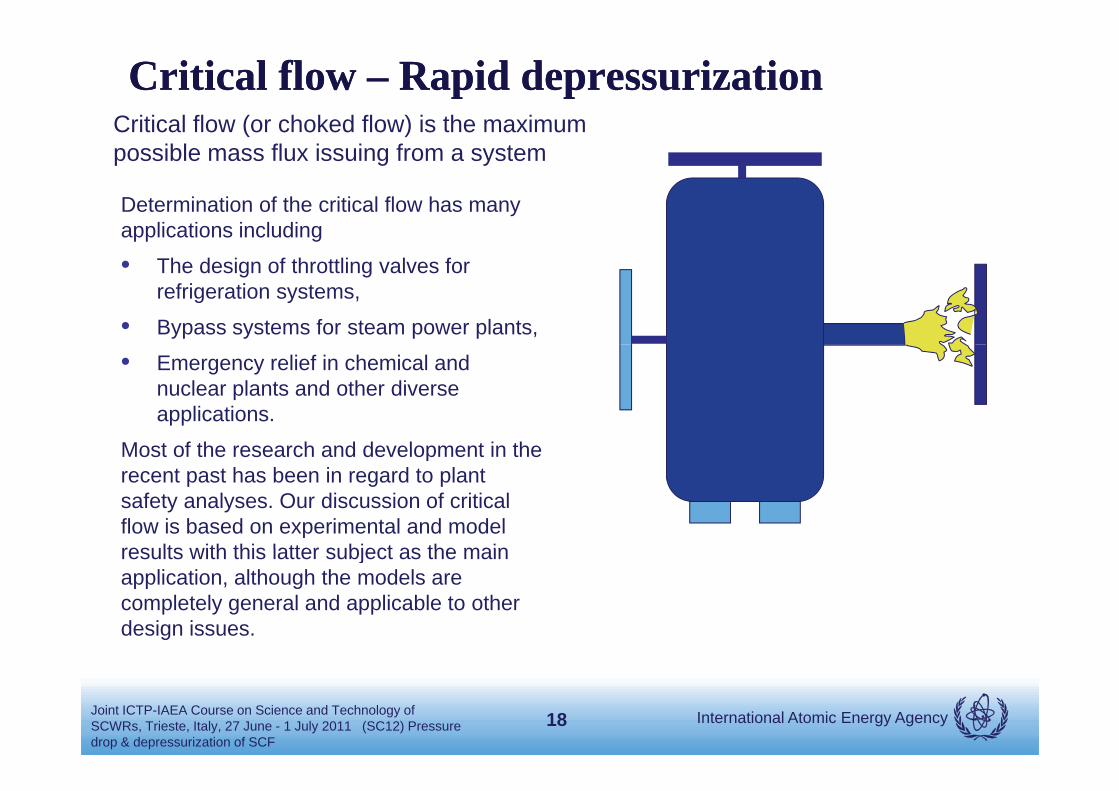
Critical flow Critical flow –– Rapid depressurization Rapid depressurization Critical flow (or choked flow) is the maximum
Determination of the critical flow has many applications including
possible mass flux issuing from a system
g
• The design of throttling valves for refrigeration systems,
• Bypass systems for steam power plants,
• Emergency relief in chemical and nuclear plants and other diverse applications.
Most of the research and development in theMost of the research and development in the recent past has been in regard to plant safety analyses. Our discussion of critical flow is based on experimental and model results with this latter subject as the mainresults with this latter subject as the main application, although the models are completely general and applicable to other design issues.
International Atomic Energy AgencyJoint ICTP-IAEA Course on Science and Technology of SCWRs, Trieste, Italy, 27 June - 1 July 2011 (SC12) Pressure drop & depressurization of SCF
18
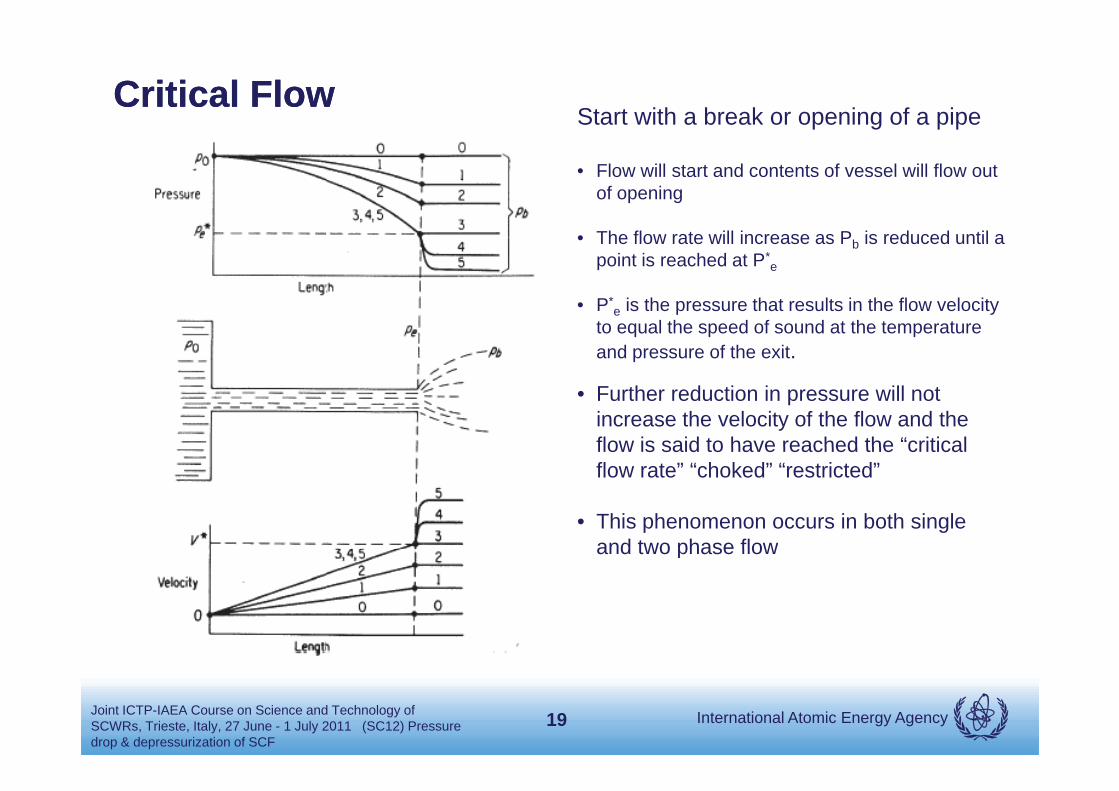
Critical FlowCritical FlowStart with a break or opening of a pipe
• Flow will start and contents of vessel will flow out of opening
• The flow rate will increase as Pb is reduced until aThe flow rate will increase as Pb is reduced until a point is reached at P*
e
• P*e is the pressure that results in the flow velocity
to equal the speed of sound at the temperature and pressure of the exit.
• Further reduction in pressure will not increase the velocity of the flow and the flow is said to have reached the “criticalflow is said to have reached the critical flow rate” “choked” “restricted”
• This phenomenon occurs in both single and two phase flowand two phase flow
International Atomic Energy AgencyJoint ICTP-IAEA Course on Science and Technology of SCWRs, Trieste, Italy, 27 June - 1 July 2011 (SC12) Pressure drop & depressurization of SCF
19
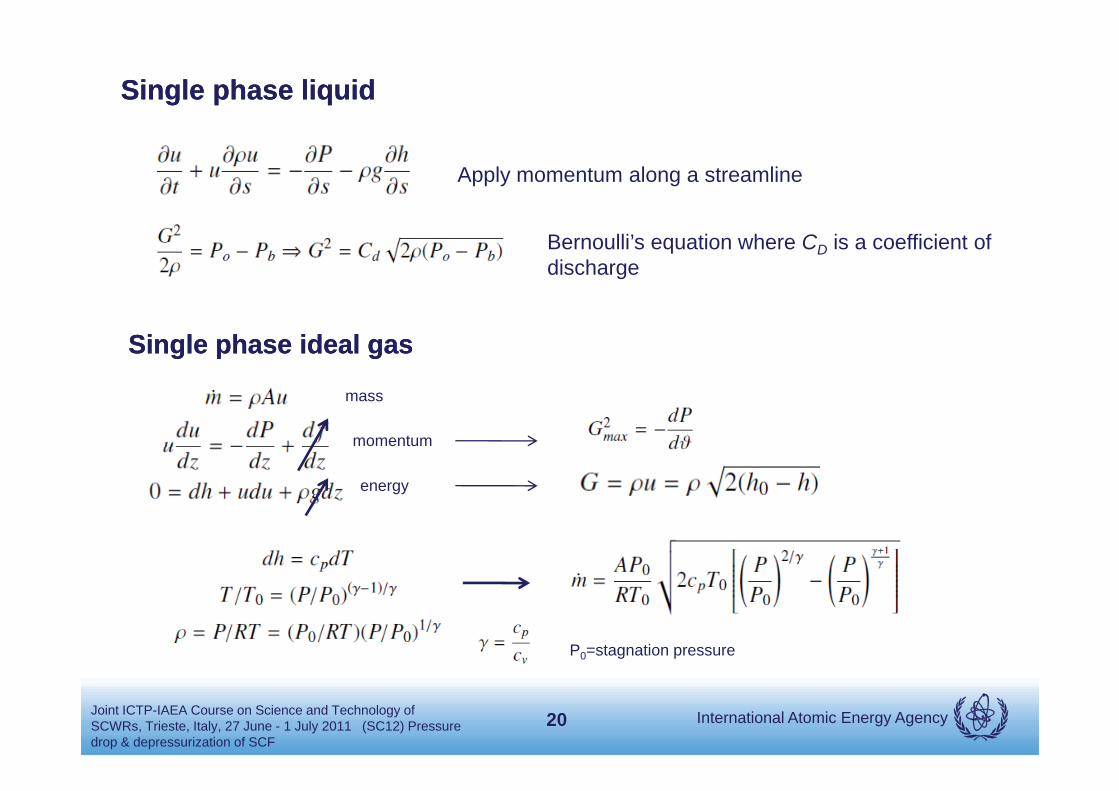
Single phase liquidSingle phase liquid
Apply momentum along a streamline
Bernoulli’s equation where C is a coefficient ofBernoulli s equation where CD is a coefficient of discharge
Single phase ideal gasSingle phase ideal gasSingle phase ideal gasSingle phase ideal gas
mass
momentum
energy
P0=stagnation pressure
International Atomic Energy AgencyJoint ICTP-IAEA Course on Science and Technology of SCWRs, Trieste, Italy, 27 June - 1 July 2011 (SC12) Pressure drop & depressurization of SCF
20
P0=stagnation pressure

Single Phase Critical flowSingle Phase Critical flow
• The mass flow increase as Pb/P0 is loweredThe mass flow increase as Pb/P0 is lowered
• Until it reaches its maximum at
• At this point is fixedmaxm *
pr
maxm*• The value of is obtained by
differentiating the above equation wrt P and setting equal to zero
• For air =0 53 i =1 4
pr
*rFor air 0.53, air 1.4
• For single phase steam – high temperature water vapor =0.545, steam=1.3
pr
*pr
International Atomic Energy AgencyJoint ICTP-IAEA Course on Science and Technology of SCWRs, Trieste, Italy, 27 June - 1 July 2011 (SC12) Pressure drop & depressurization of SCF
21
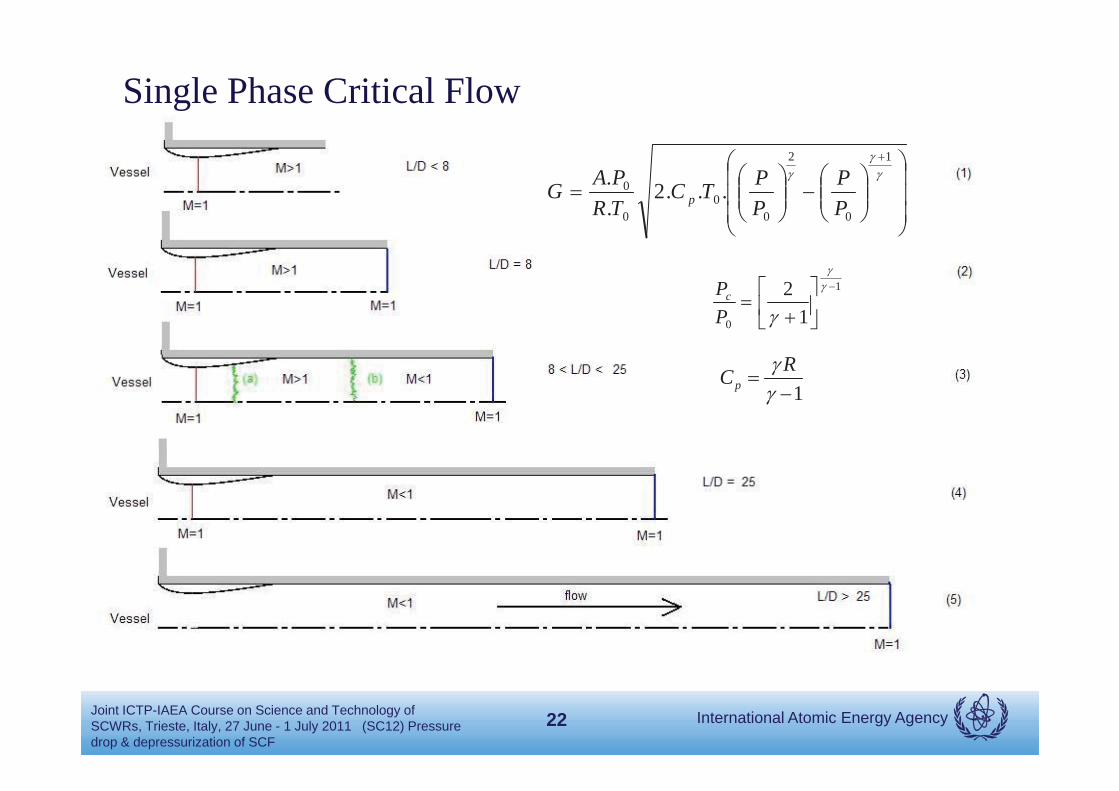
Single Phase Critical Flow1
0
2
00
0
0 ...2..
PP
PPTC
TRPAG p
1
0 12
PPc
1pRC
International Atomic Energy AgencyJoint ICTP-IAEA Course on Science and Technology of SCWRs, Trieste, Italy, 27 June - 1 July 2011 (SC12) Pressure drop & depressurization of SCF
22

Two Phase FlowTwo Phase Flow
• It is assumed, as in single phase flow, that critical flow occurs when the pressure gradient at the channel exit has reached a maximum value.
• In long channels, residence time is sufficiently long such that thermodynamic g , y g yequilibrium between phases is attained.
• Homogeneous equilibrium model (Isentropic,P, Tg=Tl, vg= vl):
1/ 2
0 g l
l g
2( [ (1 ) ])2( ) ,
(1 ) / /o
h xh x hG v h h
x x
0 ls s dG
• A better but, much more complicated model is the Fauske Separated flow
Starkman et al.0 l
g l
xs s max
d 0.d pGGP
model which allows Vg to be different than Vf and includes a slip ratio Sbetween the phases to account for the difference this requires dealing with the separate phases
International Atomic Energy AgencyJoint ICTP-IAEA Course on Science and Technology of SCWRs, Trieste, Italy, 27 June - 1 July 2011 (SC12) Pressure drop & depressurization of SCF
23

Separated flow model Separated flow model
For frictionless liquid and vapor flow
Where the quality (x) is determined from the energyWhere the quality (x) is determined from the energy equation the specific volume is given below and
are evaluated at the critical pressure
International Atomic Energy AgencyJoint ICTP-IAEA Course on Science and Technology of SCWRs, Trieste, Italy, 27 June - 1 July 2011 (SC12) Pressure drop & depressurization of SCF
24

FauskeFauske’’s Critical Flow Model s Critical Flow Model -- SFMSFM
International Atomic Energy AgencyJoint ICTP-IAEA Course on Science and Technology of SCWRs, Trieste, Italy, 27 June - 1 July 2011 (SC12) Pressure drop & depressurization of SCF
25
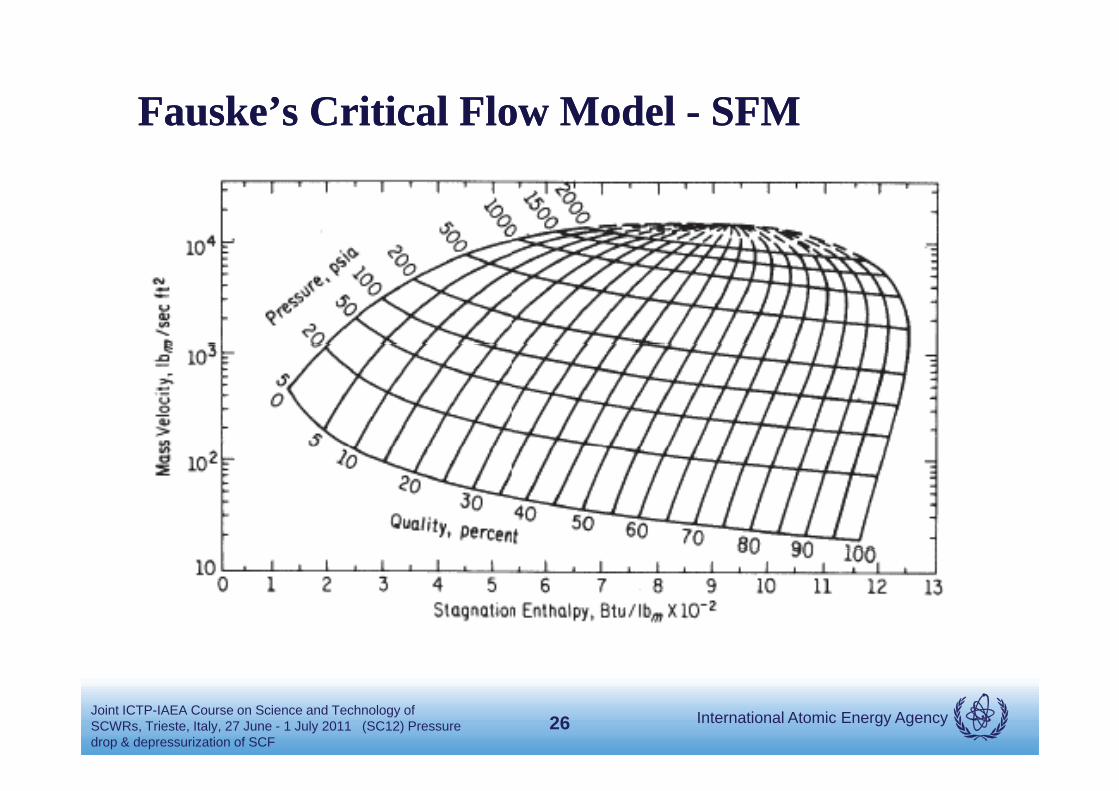
FauskeFauske’’s Critical Flow Model s Critical Flow Model -- SFMSFM
International Atomic Energy AgencyJoint ICTP-IAEA Course on Science and Technology of SCWRs, Trieste, Italy, 27 June - 1 July 2011 (SC12) Pressure drop & depressurization of SCF
26

CRITICAL FLOW CRITICAL FLOW COMPARISONSCOMPARISONS
International Atomic Energy AgencyJoint ICTP-IAEA Course on Science and Technology of SCWRs, Trieste, Italy, 27 June - 1 July 2011 (SC12) Pressure drop & depressurization of SCF
27
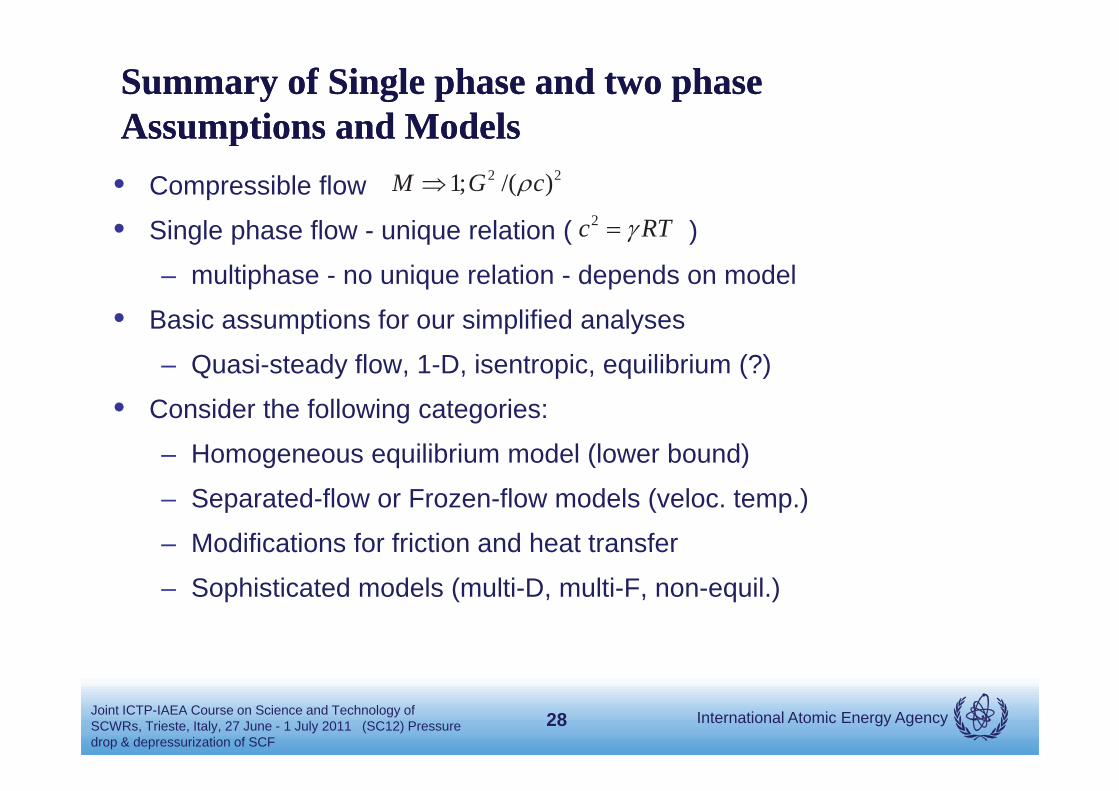
Summary of Single Summary of Single phase and two phase phase and two phase Assumptions and ModelsAssumptions and Modelspp• Compressible flow
• Single phase flow - unique relation ( )
2 21; /( )M G c2c RTg p q ( )
– multiphase - no unique relation - depends on model
• Basic assumptions for our simplified analyses
– Quasi-steady flow, 1-D, isentropic, equilibrium (?)
• Consider the following categories:
H ilib i d l (l b d)– Homogeneous equilibrium model (lower bound)
– Separated-flow or Frozen-flow models (veloc. temp.)
– Modifications for friction and heat transferModifications for friction and heat transfer
– Sophisticated models (multi-D, multi-F, non-equil.)
International Atomic Energy AgencyJoint ICTP-IAEA Course on Science and Technology of SCWRs, Trieste, Italy, 27 June - 1 July 2011 (SC12) Pressure drop & depressurization of SCF
28

Summary of Summary of 11--D Isentropic Choking ModelsD Isentropic Choking Models
• Single-Phase liquid flow rate
0 b2 ( ) ,D lG C p p Bernoulli equation
• Single-phase perfect gas has unique solution:
• Homogeneous equilibrium model (Isentropic P T =T v = v ):
11/ 22 2(1 )20
0 0
12( ) 1 ,2o
PG u h h M MR T
maxd 0.d pGGP
1D gas dynamics
• Homogeneous equilibrium model (Isentropic,P, Tg=Tl, vg= vl):1/ 2
0 g l
l g
2( [ (1 ) ])2( ) ,
(1 ) / /o
h xh x hG v h h
x xStarkman et al.0 l
g l
s sxs s max
d 0.d pGGP
• Separated flow model (vg different than vf):
– Fauske and Moody assumed vg/vf ~ f/ g)m; m= 0.33-0.5
l g(1 ) / /x x
– Fauske model correlated to data for a range of L/D s
– L/D~0 (orifice eqn), 0<L/D<10 (P* - fit), L/D>10 (P*=.55)
International Atomic Energy AgencyJoint ICTP-IAEA Course on Science and Technology of SCWRs, Trieste, Italy, 27 June - 1 July 2011 (SC12) Pressure drop & depressurization of SCF
29

Discussion of nozzle lengths (L/D) ratioDiscussion of nozzle lengths (L/D) ratio
L/D>12Flow thermal equilibrium
• For L/D =0, i.e., orifices, Flashing occurs outside of the orifice and no critical pressure existed and the flow rate is governed by
• For Region I (0 < L/D < 3) the liquid speeds up and a metastable liquid core jet with evaporation on the surface occurs, the mass flow falls between models
• For Region II (3 < L/D < 12) two phase starts to become significant in the nozzle and reduces the f fmax flow rate further.
• For L/D > 12 thermal equilibrium is a better assumption and models seem to work better
• The effects of a rounded entrance nozzles typically reduces fluctuations, resulting in more stable flow with typical increases in the exiting mass flow rate
International Atomic Energy AgencyJoint ICTP-IAEA Course on Science and Technology of SCWRs, Trieste, Italy, 27 June - 1 July 2011 (SC12) Pressure drop & depressurization of SCF
30
flow with typical increases in the exiting mass flow rate
Two phase critical Two phase critical flow summaryflow summary• The Homogeneous-Equilibrium Model (HEM) under predicts the critical flow rates for short pipes and near
liquid saturation or subcooled upstream conditions.
• The equilibrium slip models of Fauske, Moody and others, although successful for long tubes, under-predict the critical flow rates for short pipes This is particularly true if the upstream condition is subcooledpredict the critical flow rates for short pipes. This is particularly true if the upstream condition is subcooledor near saturation.
• Effects of thermal non-equilibrium must be taken into account for short pipes. However, it is not clear whether the pipe length, L, or the pipe length-to-diameter ratio, L/D, or both are important in determining the effects of thermal non-equilibrium.
• More mechanistic models do exist for critical flow that can account for the nonequilibrium effects of velocity differences and temperature differences between the phases; but require iterative or numerical solutionsolution.
• At present, there is no general model or correlation for critical flow which is valid for a broad range of pipe lengths, pipe diameters, and upstream conditions including subcooled liquid. The more sophisticated the model used for a more precise design, the more prudent it is to consider some data benchmarking under similar conditions.
• Recommend: Simple first (HEM, SFM) then complex numerical schemes
International Atomic Energy AgencyJoint ICTP-IAEA Course on Science and Technology of SCWRs, Trieste, Italy, 27 June - 1 July 2011 (SC12) Pressure drop & depressurization of SCF
schemes
31
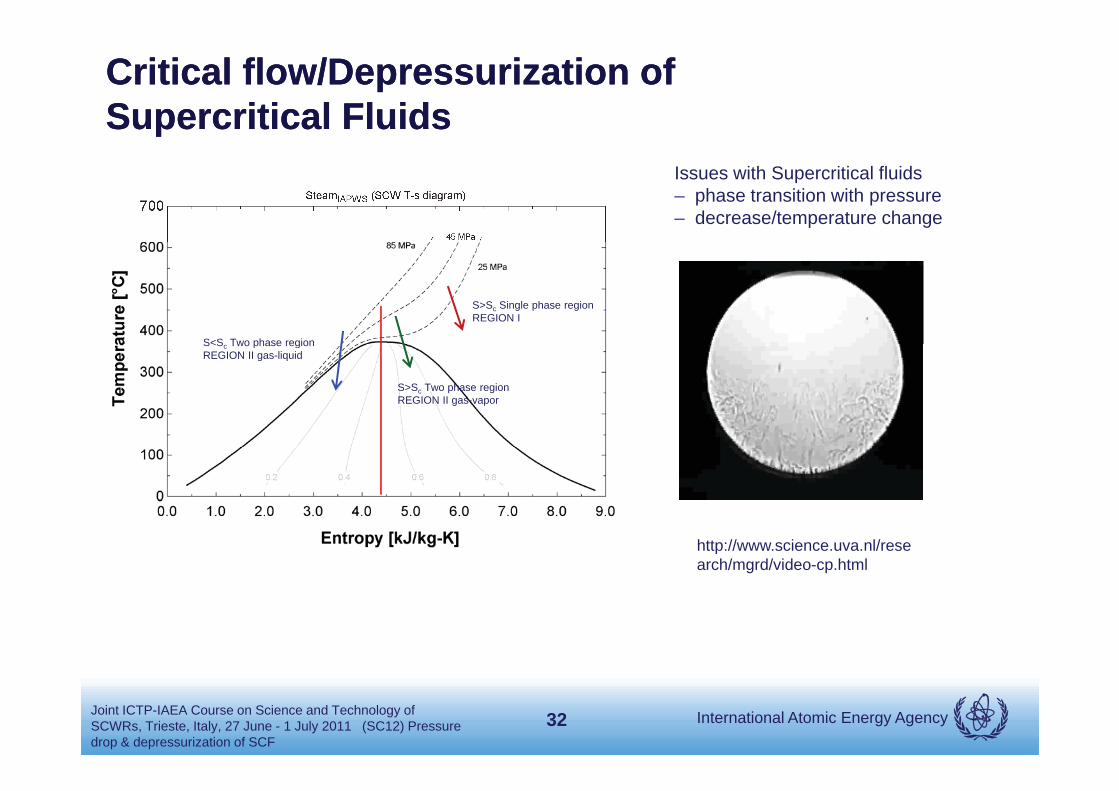
CriticalCritical flow/Depressurization of flow/Depressurization of Supercritical FSupercritical Fluidsluids
Issues with Supercritical fluids – phase transition with pressure– decrease/temperature change
S>Sc Single phase regionREGION I
S<S Two phase region
S>Sc Two phase regionREGION II gas-vapor
S<Sc Two phase regionREGION II gas-liquid
http://www.science.uva.nl/resehttp://www.science.uva.nl/research/mgrd/video-cp.html
International Atomic Energy AgencyJoint ICTP-IAEA Course on Science and Technology of SCWRs, Trieste, Italy, 27 June - 1 July 2011 (SC12) Pressure drop & depressurization of SCF
32

SCF Depressurization TestsSCF Depressurization Tests::Single phase critical flow – Well known analytical theories can predict very accurately
Two phase critical flow – lots of data Fauske et al. Several models have been developed
Past SCF – Depressurization Lee Swinnerton: EPRI-NP-3086
EPRI study – P=3.4-31 Mpa, T=200-400C• 4 different nozzles
• Compared to RETRAN, HEM, Extended Fauske
and Modified Bernoulli modeland Modified Bernoulli model
• RETRAN, Modified Fauske and Bernoulli worked well HEM
is not suitable for subcooled and saturated liquid conditions
University of Hamberg-HarburgCO2 i t f CO2 d H2OCO2, mixtures of CO2 and H2O
-studied the evolution of the void fraction and phase separation in a 0.05 m3 vessel during blow down.
A. Fredenhagen (2002): PhD Thesis.
Current experiments1. China Institute of Atomic Energy - SC- Water experiments
2. University of Wisconsin – SC-CO2 critical flow experiments
Planed experiments
International Atomic Energy AgencyJoint ICTP-IAEA Course on Science and Technology of SCWRs, Trieste, Italy, 27 June - 1 July 2011 (SC12) Pressure drop & depressurization of SCF
p
33
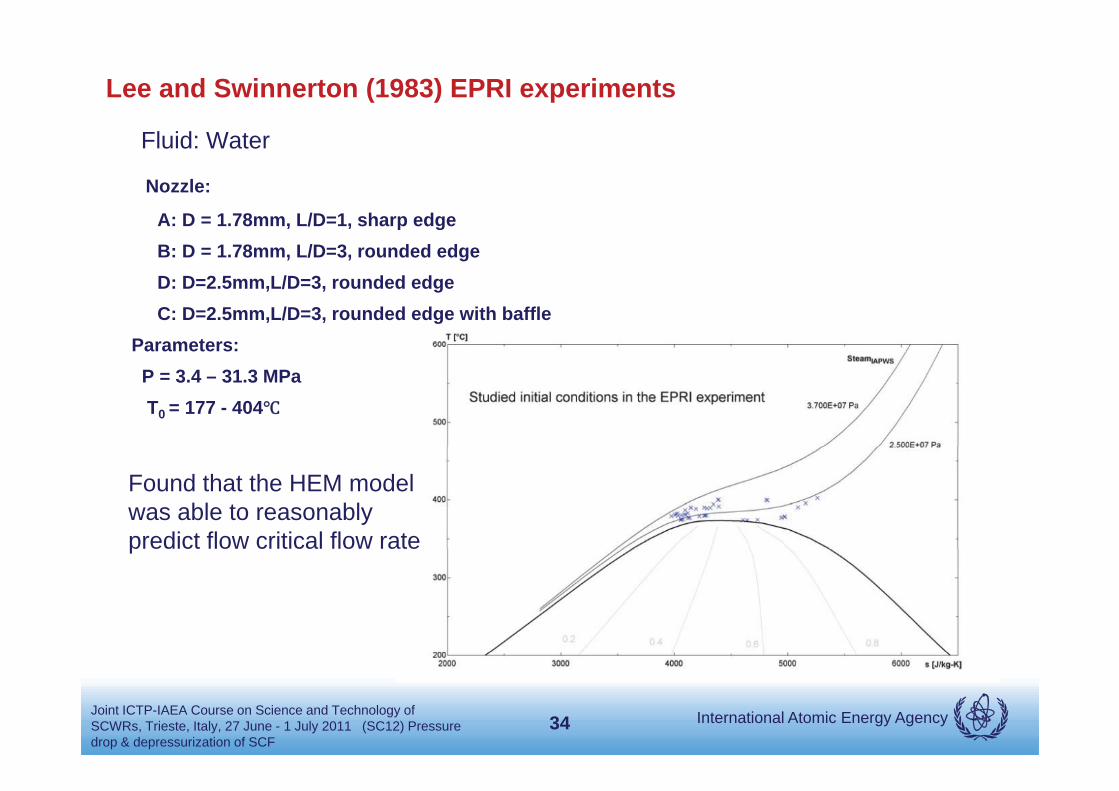
Lee and Swinnerton (1983) EPRI experiments
Fluid: WaterFluid: Water
Nozzle:
A: D = 1.78mm, L/D=1, sharp edgeB: D = 1.78mm, L/D=3, rounded edgeD: D=2.5mm,L/D=3, rounded edgeC: D=2.5mm,L/D=3, rounded edge with baffle
Parameters:Parameters:P = 3.4 – 31.3 MPaT0 = 177 - 404
Found that the HEM model was able to reasonably predict flow critical flow ratep
International Atomic Energy AgencyJoint ICTP-IAEA Course on Science and Technology of SCWRs, Trieste, Italy, 27 June - 1 July 2011 (SC12) Pressure drop & depressurization of SCF
34

CIAE Critical flow tests with SCWCIAE Critical flow tests with SCW
Fluid: Water 200 data points
Nozzle:
A: D = 1.78mm, L/D=3.1, rounded edgeB: D = 1.41mm, L/D=3.1, sharp edge
Parameters:
P = 22.1 – 29.1 MPaT0 = 38 - 474
(a) Nozzle A with rounded-edge
International Atomic Energy AgencyJoint ICTP-IAEA Course on Science and Technology of SCWRs, Trieste, Italy, 27 June - 1 July 2011 (SC12) Pressure drop & depressurization of SCF
(b)Nozzle B with sharp-edge
35
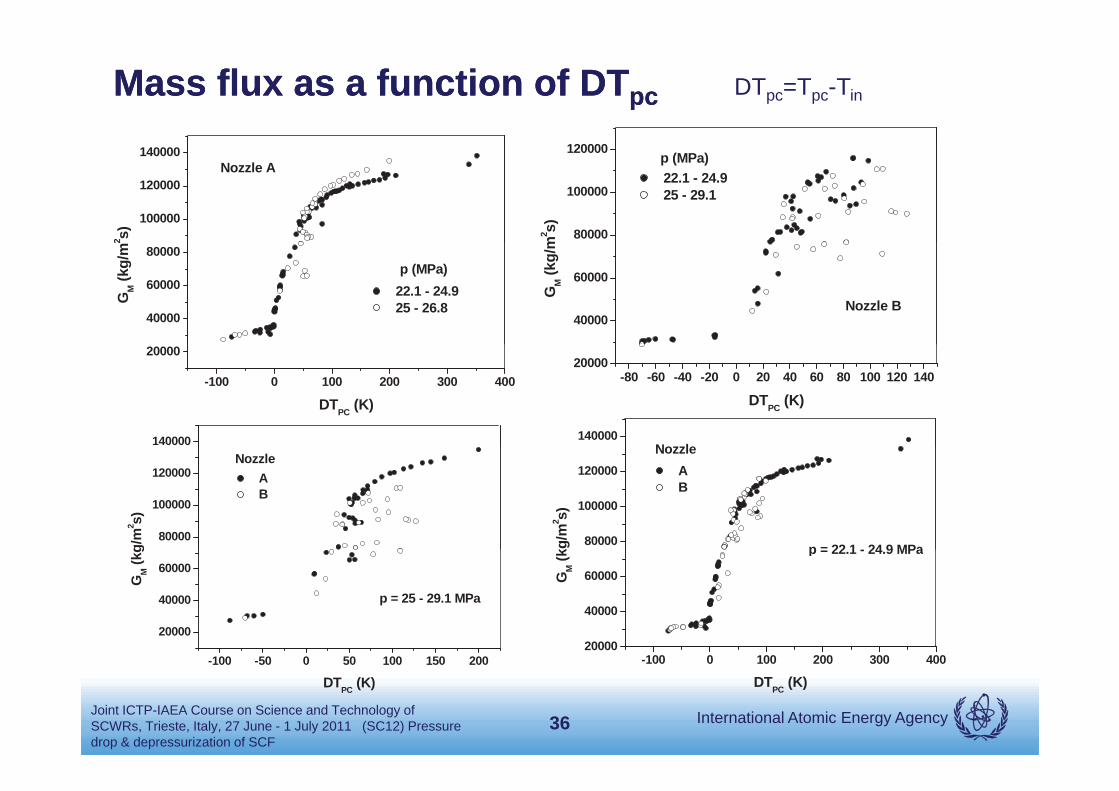
Mass flux as a function of Mass flux as a function of DTDTpcpc DTpc=Tpc-Tin
100000
120000
140000Nozzle A
2 s) 80000
100000
120000p (MPa)
m2 s)
22.1 - 24.9 25 - 29.1
40000
60000
80000p (MPa)
GM (k
g/m
2
22.1 - 24.9 25 - 26.8
40000
60000
Nozzle B
GM (k
g/m
-100 0 100 200 300 400
20000
DTPC (K)
-80 -60 -40 -20 0 20 40 60 80 100 120 14020000
DTPC (K)
140000 140000Nozzle
80000
100000
120000Nozzle
g/m
2 s)
A B
80000
100000
120000
p = 22 1 24 9 MPa
Nozzle
kg/m
2 s)
A B
20000
40000
60000
p = 25 - 29.1 MPa
GM (k
g
20000
40000
60000
p = 22.1 - 24.9 MPaG
M (k
International Atomic Energy AgencyJoint ICTP-IAEA Course on Science and Technology of SCWRs, Trieste, Italy, 27 June - 1 July 2011 (SC12) Pressure drop & depressurization of SCF
-100 -50 0 50 100 150 200
DTPC (K)-100 0 100 200 300 400
DTPC (K)
36

Effect of nozzle geometryEffect of nozzle geometryThe nozzle geometry has a strong effect on the mass flux along with L/D
International Atomic Energy AgencyJoint ICTP-IAEA Course on Science and Technology of SCWRs, Trieste, Italy, 27 June - 1 July 2011 (SC12) Pressure drop & depressurization of SCF
37
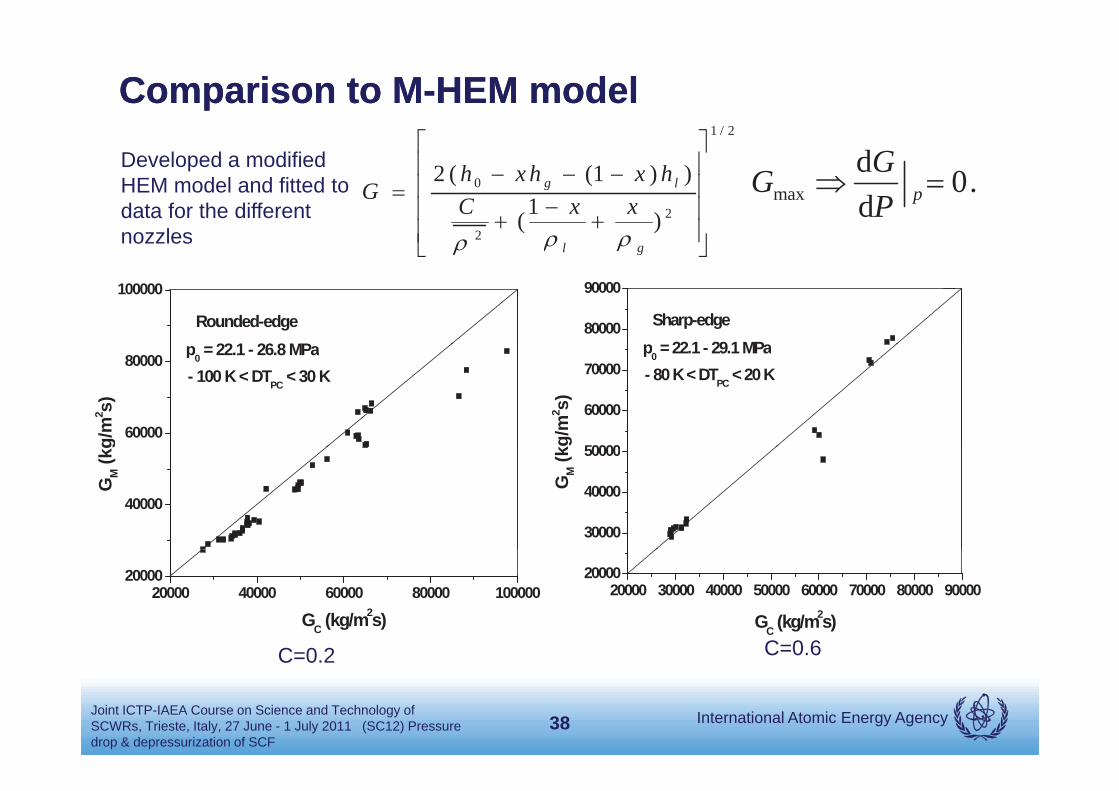
Comparison to MComparison to M--HEM modelHEM model1 / 2
0
22
2 ( (1 ) )1( )
g lh x h x hG C x x max
d 0.d pGGP
Developed a modified HEM model and fitted to data for the different nozzles
100000
22 1 26 8 MPRounded-edge 80000
90000
221 291MPSharp-edge
l gnozzles
60000
80000 p0 = 22.1 - 26.8 MPa- 100 K < DTPC < 30 K
g/m
2 s)
50000
60000
70000p0 = 22.1 - 29.1MPa- 80 K < DTPC < 20 K
kg/m
2 s)
40000
GM (k
g
30000
40000
50000
GM (k
20000 40000 60000 80000 10000020000
GC (kg/m2s)20000 30000 40000 50000 60000 70000 80000 90000
20000
GC (kg/m2s)
C=0 2 C=0 6
International Atomic Energy AgencyJoint ICTP-IAEA Course on Science and Technology of SCWRs, Trieste, Italy, 27 June - 1 July 2011 (SC12) Pressure drop & depressurization of SCF
38
C=0.2 C 0.6

Comparison to Modified HEM and Bernoulli modelComparison to Modified HEM and Bernoulli model
G = Min (GM-HEM, GBernoulli)
1 / 2
0
22
2 ( (1 ) )1( )
g lh x h x hG C x x 0 b2 ( ),D lG C p p
M-HEM Bernoulli
140000120000
140000
2l g
80000
100000
120000
kg/m
2 s)
80000
100000
kg/m
2 s)
20000
40000
60000G (k
data (A) p0- 22.1 - 25 MPa M-HEM p0=24 MPa Bernoulli
20000
40000
60000G (k
data (B) p0 = 25 - 29 MPa M - HEM p0 = 27 MPa Bernoulli
-100 0 100 200 300 400
DTPC (K)Comparison of the experimental results of nozzle A with calculation of the M-HEM and Bernoulli equation ( p0 <
-100 -50 0 50 100 150 200 250
DTPC (K)
Comparison of the experimental results of nozzle B with calculations of the M-HEM and Bernoulli equation for p > 25 MPa
International Atomic Energy AgencyJoint ICTP-IAEA Course on Science and Technology of SCWRs, Trieste, Italy, 27 June - 1 July 2011 (SC12) Pressure drop & depressurization of SCF
25 MPa) equation for p0 > 25 MPa
39
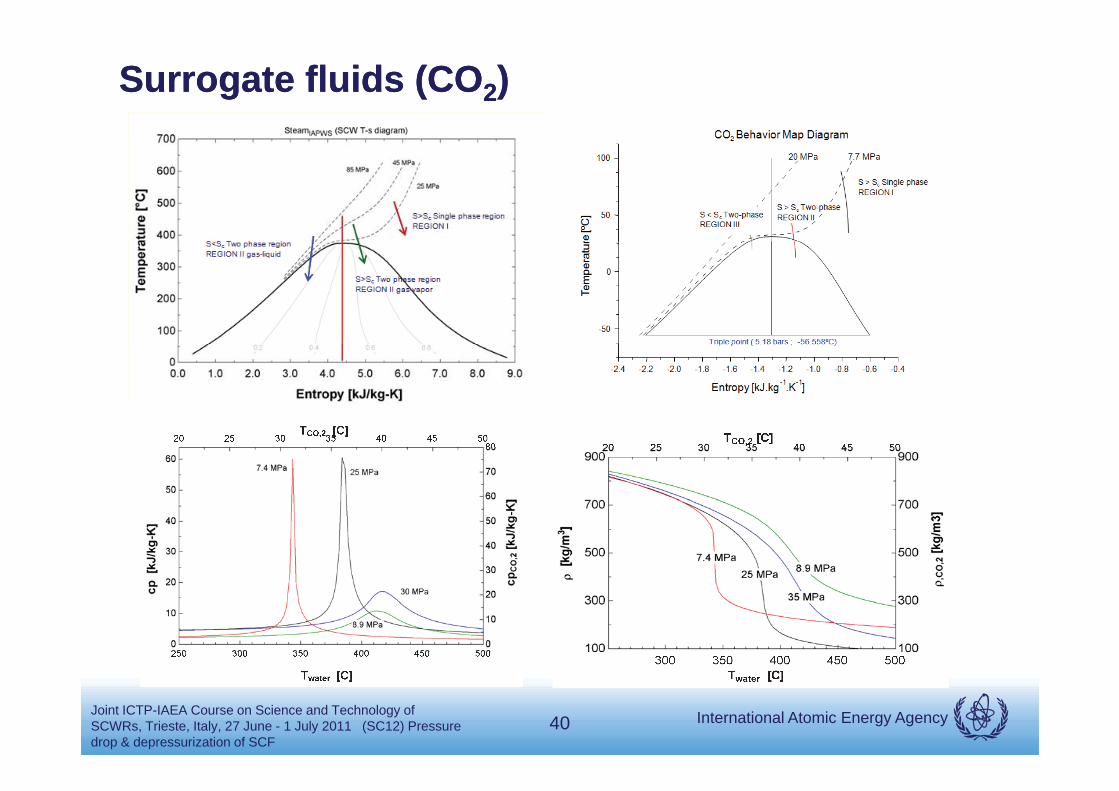
Surrogate fluids (COSurrogate fluids (CO22))
International Atomic Energy AgencyJoint ICTP-IAEA Course on Science and Technology of SCWRs, Trieste, Italy, 27 June - 1 July 2011 (SC12) Pressure drop & depressurization of SCF
40

University of Wisconsin University of Wisconsin ––SS--COCO22 Critical flowCritical flowFluid: CO2
Internal Sealing Plug
Support Ring
Nozzle: D= 12.5-3.18 mmL/D= 0-170
Parameters:
Nozzle
P = 9.23 - 32MPaT0 = 37 - 500
Guiding Tube
Sliding Shaft
Tin 1
Volume : 0.123 m3
Vessel Diameter: 0.26 mNozzle Diameter (Max.): 0.0127 mMaximum density : 650 kg.m-3
Maximum Pressure: 32 MPa @ 25ºC
Pressure Transducer
20 MPa @ 500ºCEmpty Vessel Mass: 712 kg
Compressed air actuated piston to initiate blowdown
Tnozzle
International Atomic Energy AgencyJoint ICTP-IAEA Course on Science and Technology of SCWRs, Trieste, Italy, 27 June - 1 July 2011 (SC12) Pressure drop & depressurization of SCF
41
Light sourceFast Cam Optical TableCollimating Lenses

Supercritical COSupercritical CO22 DepressurizationDepressurization
7 0 0
8 0 0C a rb o n D io x id e
M IT c y c le c o n d it io n sU W te s t c o n d it io n s
2 0 M P a
5 0 0
6 0 0
7 0 0 U W te s t c o n d it io n s6 5 0 C
5 2 7 C4 8 1 C
= 1 0 9 k g .m -3
3 0 0
4 0 0U W -d e s ig n lim it
T [C ]
1 0 0
2 0 0
6 1 C= 6 0 4 k g .m -3
7 .7 M P a
-2 .0 -1 .8 -1 .6 -1 .4 -1 .2 -1 .0 -0 .8 -0 .6 -0 .4 -0 .2 0 .0 0 .2 0 .4 0 .6-1 0 0
07 1 C
3 2 Cs [k J /k g -K ]
International Atomic Energy AgencyJoint ICTP-IAEA Course on Science and Technology of SCWRs, Trieste, Italy, 27 June - 1 July 2011 (SC12) Pressure drop & depressurization of SCF
42
2 .0 1 .8 1 .6 1 .4 1 .2 1 .0 0 .8 0 .6 0 .4 0 .2 0 .0 0 .2 0 .4 0 .6
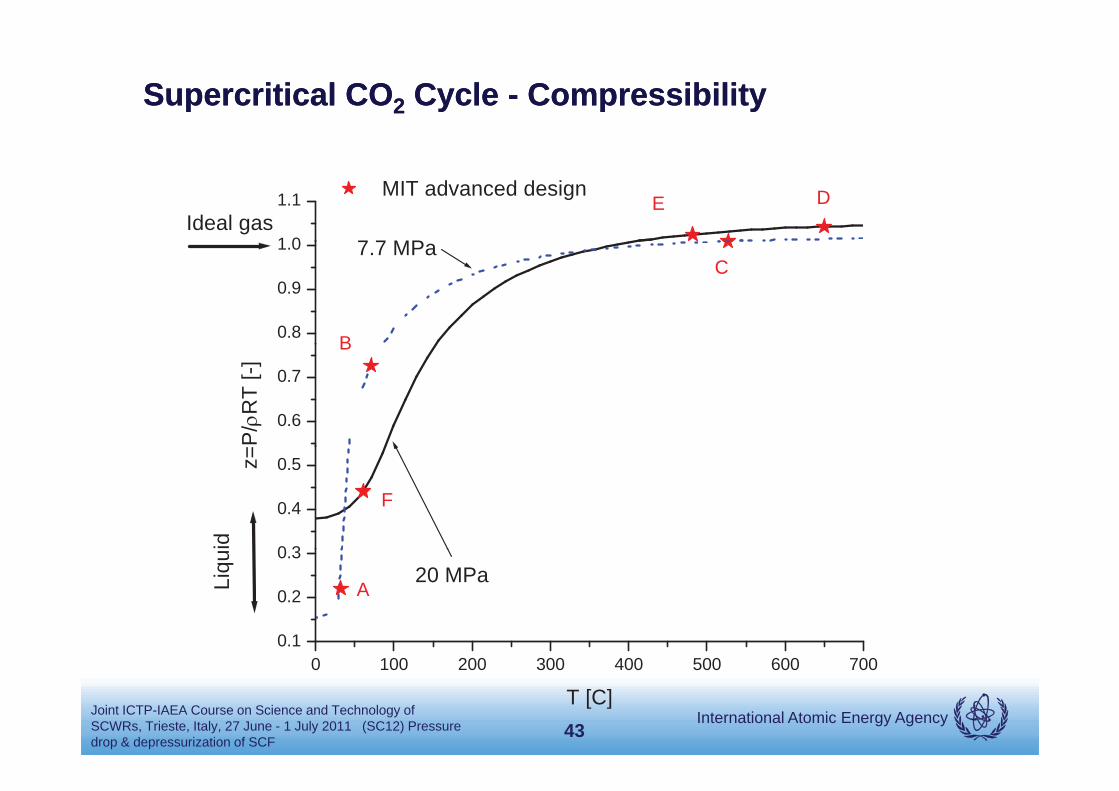
Supercritical COSupercritical CO22 CycleCycle -- CompressibilityCompressibility
1 0
1.1 MIT advanced design
7 7 MP
DEIdeal gas
0.8
0.9
1.0 7.7 MPaC
B
0.6
0.7
B
P/
RT
[-]
0 3
0.4
0.5
F
idz=
0.1
0.2
0.320 MPa
ALiqu
International Atomic Energy AgencyJoint ICTP-IAEA Course on Science and Technology of SCWRs, Trieste, Italy, 27 June - 1 July 2011 (SC12) Pressure drop & depressurization of SCF
0 100 200 300 400 500 600 700
T [C]43

Short Tubes – High Pressure >19MPa14.7 mm nozzle, 2830 psi, 140 C
International Atomic Energy AgencyJoint ICTP-IAEA Course on Science and Technology of SCWRs, Trieste, Italy, 27 June - 1 July 2011 (SC12) Pressure drop & depressurization of SCF
44Pressure drop & Rapid depressurization of SCF
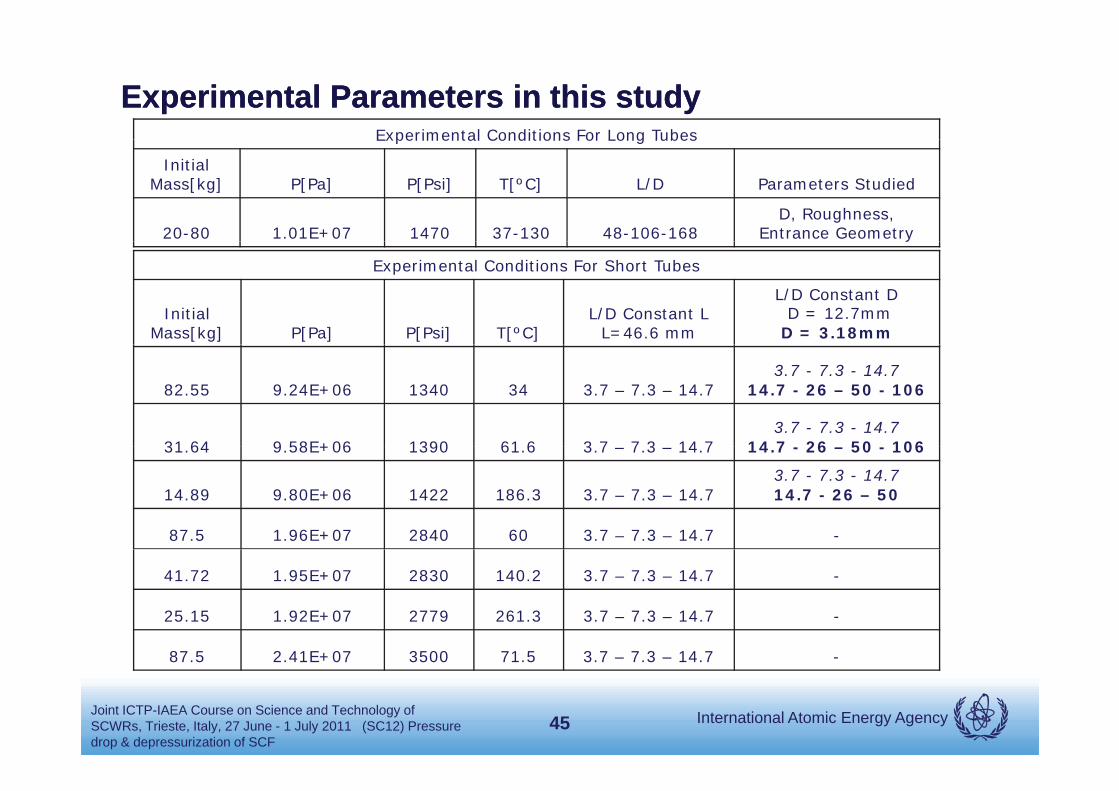
Experimental Parameters in this studyExperimental Parameters in this studyExperimental Conditions For Long TubesExperimental Conditions For Long Tubes
InitialMass[kg] P[Pa] P[Psi] T[ºC] L/D Parameters Studied
20-80 1.01E+07 1470 37-130 48-106-168D, Roughness,
Entrance Geometry
Experimental Conditions For Short Tubes
InitialMass[kg] P[Pa] P[Psi] T[ºC]
L/D Constant L L=46.6 mm
L/D Constant DD = 12.7mm
D = 3.18mm
y
82.55 9.24E+06 1340 34 3.7 – 7.3 – 14.73.7 - 7.3 - 14.7
14.7 - 26 – 50 - 106
31 64 9 58E+06 1390 61 6 3 7 – 7 3 – 14 73.7 - 7.3 - 14.7
14 7 - 26 – 50 - 10631.64 9.58E+06 1390 61.6 3.7 – 7.3 – 14.7 14.7 - 26 – 50 - 106
14.89 9.80E+06 1422 186.3 3.7 – 7.3 – 14.73.7 - 7.3 - 14.714.7 - 26 – 50
87.5 1.96E+07 2840 60 3.7 – 7.3 – 14.7 -
41.72 1.95E+07 2830 140.2 3.7 – 7.3 – 14.7 -
25.15 1.92E+07 2779 261.3 3.7 – 7.3 – 14.7 -
87 5 2 41E 07 3500 71 5 3 7 7 3 14 7
International Atomic Energy AgencyJoint ICTP-IAEA Course on Science and Technology of SCWRs, Trieste, Italy, 27 June - 1 July 2011 (SC12) Pressure drop & depressurization of SCF
87.5 2.41E+07 3500 71.5 3.7 – 7.3 – 14.7 -
45
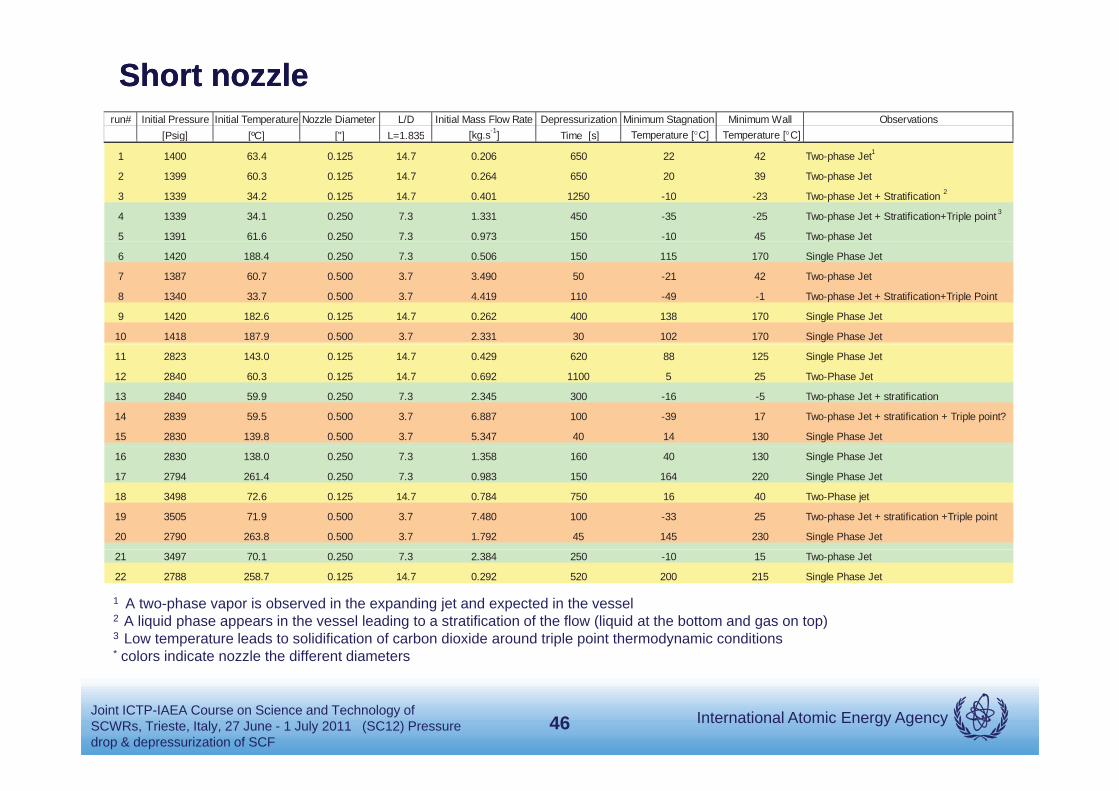
Short nozzleShort nozzlerun# Initial Pressure Initial Temperature Nozzle Diameter L/D Initial Mass Flow Rate Depressurization Minimum Stagnation Minimum Wall Observations
[Psig] [ºC] ["] L=1.835 [kg.s-1] Time [s] Temperature [ C] Temperature [ C][ s g] [ C] [ ] 835 [ g ] e [s] p [ ] p [ ]
1 1400 63.4 0.125 14.7 0.206 650 22 42 Two-phase Jet1
2 1399 60.3 0.125 14.7 0.264 650 20 39 Two-phase Jet
3 1339 34.2 0.125 14.7 0.401 1250 -10 -23 Two-phase Jet + Stratification 2
4 1339 34.1 0.250 7.3 1.331 450 -35 -25 Two-phase Jet + Stratification+Triple point 3
5 1391 61.6 0.250 7.3 0.973 150 -10 45 Two-phase Jetp
6 1420 188.4 0.250 7.3 0.506 150 115 170 Single Phase Jet
7 1387 60.7 0.500 3.7 3.490 50 -21 42 Two-phase Jet
8 1340 33.7 0.500 3.7 4.419 110 -49 -1 Two-phase Jet + Stratification+Triple Point
9 1420 182.6 0.125 14.7 0.262 400 138 170 Single Phase Jet
10 1418 187.9 0.500 3.7 2.331 30 102 170 Single Phase Jet
11 2823 143.0 0.125 14.7 0.429 620 88 125 Single Phase Jet
12 2840 60.3 0.125 14.7 0.692 1100 5 25 Two-Phase Jet
13 2840 59.9 0.250 7.3 2.345 300 -16 -5 Two-phase Jet + stratification
14 2839 59.5 0.500 3.7 6.887 100 -39 17 Two-phase Jet + stratification + Triple point?
15 2830 139.8 0.500 3.7 5.347 40 14 130 Single Phase Jet
16 2830 138.0 0.250 7.3 1.358 160 40 130 Single Phase Jet
17 2794 261.4 0.250 7.3 0.983 150 164 220 Single Phase Jet
18 3498 72.6 0.125 14.7 0.784 750 16 40 Two-Phase jet
19 3505 71.9 0.500 3.7 7.480 100 -33 25 Two-phase Jet + stratification +Triple point
20 2790 263.8 0.500 3.7 1.792 45 145 230 Single Phase Jet
21 3497 70.1 0.250 7.3 2.384 250 -10 15 Two-phase Jet
22 2788 258.7 0.125 14.7 0.292 520 200 215 Single Phase Jet
1 A two-phase vapor is observed in the expanding jet and expected in the vessel2 A liquid phase appears in the vessel leading to a stratification of the flow (liquid at the bottom and gas on top)3 Low temperature leads to solidification of carbon dioxide around triple point thermodynamic conditions* l i di t l th diff t di t
International Atomic Energy AgencyJoint ICTP-IAEA Course on Science and Technology of SCWRs, Trieste, Italy, 27 June - 1 July 2011 (SC12) Pressure drop & depressurization of SCF
* colors indicate nozzle the different diameters
46

Experimental Data for Long Tubes
Diameter: 2mm Operating Pressure: 10 1 MPa
0.11Smooth Entrance Quartz
0.110.11
Diameter: 2mm Operating Pressure: 10.1 MPa
0.10
Smooth Entrance Quartzg.
s-1.m
-2]
0.100.10
0.08
0.09
Smooth Entrance Steel
Flow
rate
[kg
0.08
0.09
0.08
0.09
0.06
0.07
ritic
al M
ass
0.06
0.07
0.06
0.07
30 40 50 60 70 80 90 1000.05
0.06Sharp Entrance SteelC
r
S C30 40 50 60 70 80 90 100
0.05
0.06
30 40 50 60 70 80 90 1000.05
0.06
International Atomic Energy AgencyJoint ICTP-IAEA Course on Science and Technology of SCWRs, Trieste, Italy, 27 June - 1 July 2011 (SC12) Pressure drop & depressurization of SCF
47
Initial Stagnation Temperature T0 [C]

Results for long tubes: Comparison with HEMResults for long tubes: Comparison with HEMOperating Pressure: 10 1 MPa L/D=106
0 180.190.20
- rough (steel)- smooth (quartz) 1.0
Operating Pressure: 10.1 MPa
l lit ( h)
L/D=106
0.150.160.170.18
Quality
[kg.
s-1]
0 8
0.9
- calc.quality (rough)- calc. quality (smooth)
0.110.120.130.14
Calculated-isentropic
Flow
Rat
e
0.7
0.8
ality
[-]
0 070.080.090.10
Experiment
itica
l Mas
s
0.5
0.6 Qu
40 50 60 70 80 90 1000.040.050.060.07
Calculated-friction
Cr
0.4
International Atomic Energy AgencyJoint ICTP-IAEA Course on Science and Technology of SCWRs, Trieste, Italy, 27 June - 1 July 2011 (SC12) Pressure drop & depressurization of SCF
48
40 50 60 70 80 90 100
Initial Stagnation Temperature T0 [C]
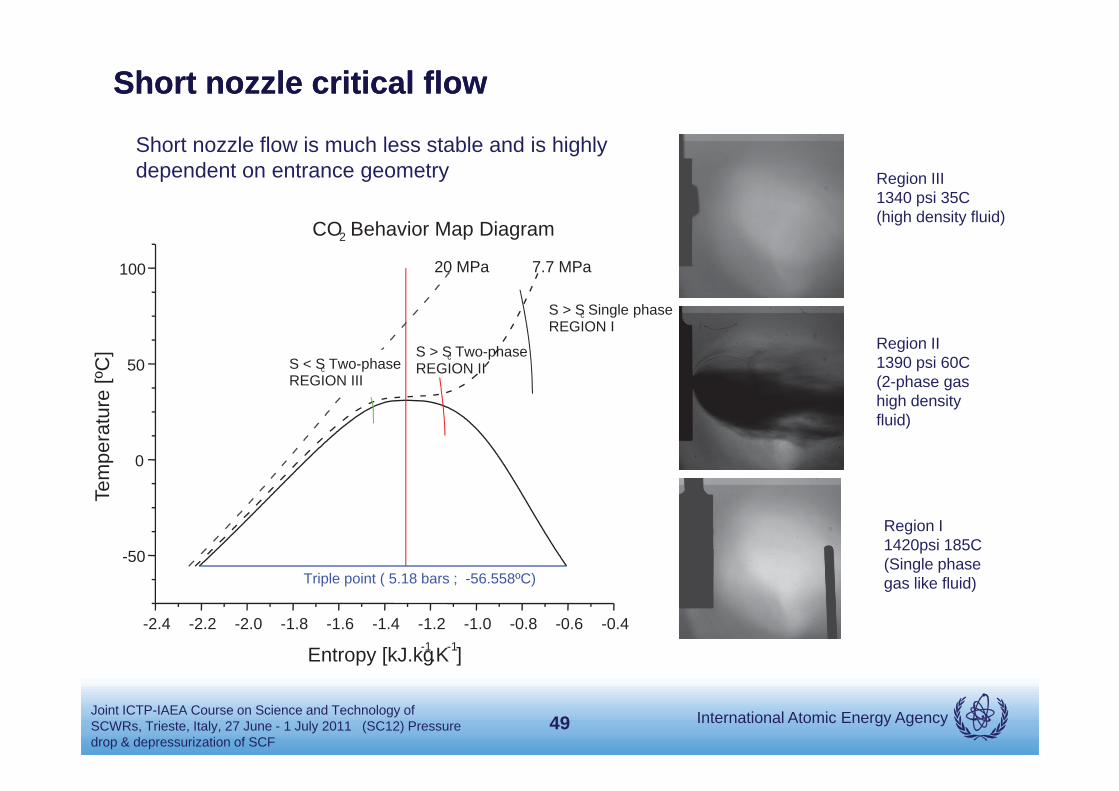
Short nozzle critical flow Short nozzle critical flow
Sh t l fl i h l t bl d i hi hlRegion III 1340 psi 35C(high density fluid)
CO2 Behavior Map Diagram
Short nozzle flow is much less stable and is highly dependent on entrance geometry
Region II
100 20 MPa 7.7 MPa
cS > S Single phaseREGION I
Region II 1390 psi 60C(2-phase gas high density fluid)
50cS > S Two-phase
REGION IIcS < S Two-phaseREGION III
erat
ure
[ºC]
Region I 1420psi 185C
0
Tem
pe
1420psi 185C(Single phase gas like fluid)
-2.4 -2.2 -2.0 -1.8 -1.6 -1.4 -1.2 -1.0 -0.8 -0.6 -0.4
-50Triple point ( 5.18 bars ; -56.558ºC)
Entropy [kJ kg-1 K-1]
International Atomic Energy AgencyJoint ICTP-IAEA Course on Science and Technology of SCWRs, Trieste, Italy, 27 June - 1 July 2011 (SC12) Pressure drop & depressurization of SCF
49
Entropy [kJ.kg.K ]

Observations from depressurization of SCFObservations from depressurization of SCF
• Large Length to diameter ratio nozzle (L\D>14.7) depressurization exhibited flows consistent with HEM model for all regions studied. The critical mass flux scaled with L/D d t f i ti l d i t t ith thdue to frictional pressure drop consistent with theory.
• Short nozzle depressurization was dominated by the vena-contracta and did not show any effect of L/D for ratios between 3.7 and 14.7. Essentially constant depressurization as a f nction of L/D for specific initial condition dictated b entrancefunction of L/D for specific initial condition – dictated by entrance
• Thermal dynamic initial condition changes the short nozzle depressurization rate significantly.
– Region one: exhibited gas like characteristics consistent with ideal gas– Region two: was a transition and there were significant liquid/solid phase present and the flow was
stratified with the gas phase on top and the liquid/solid particulate on the bottom– Region three: appeared to have liquid/solid phases within the entire exiting jet stream
International Atomic Energy AgencyJoint ICTP-IAEA Course on Science and Technology of SCWRs, Trieste, Italy, 27 June - 1 July 2011 (SC12) Pressure drop & depressurization of SCF
50

SummarySummary• Flow rate decreases as the inlet temperature increases and it varies drastically• Flow rate decreases as the inlet temperature increases, and it varies drastically
in the near pseudo-critical region (unstable).
• Below the pseudo-critical region the results of mass flux exhibit a scattered feature as a result of the hysteresis in the onset of vaporization The inlet shapefeature as a result of the hysteresis in the onset of vaporization. The inlet shape of nozzle has a substantial effect, especially at higher pressure (dominated by two phase phenomena advanced models are needed).
• In the region of near or beyond pseudo-critical point, the thermal-equilibrium is g y p p , qdominant, and the critical flow rate can be estimated reasonably by the modified homogeneous equilibrium model.
• At the inlet temperature well below the pseudo-critical point, the choking condition does not take place and the Bernoulli equation can be used.
• Flow rate is highly dependent on initial conditions and geometry the suggested analytical method is as follows, but further data is needed in the near pseudo-critical region. 1 / 2
0
22
2 ( (1 ) )1( )
g l
l g
h x h x hG C x xG = Min (GM-HEM, GBernoulli) 0 b2 ( ),D lG C p pwhere
International Atomic Energy AgencyJoint ICTP-IAEA Course on Science and Technology of SCWRs, Trieste, Italy, 27 June - 1 July 2011 (SC12) Pressure drop & depressurization of SCF
51
g
M-HEM Bernoulli
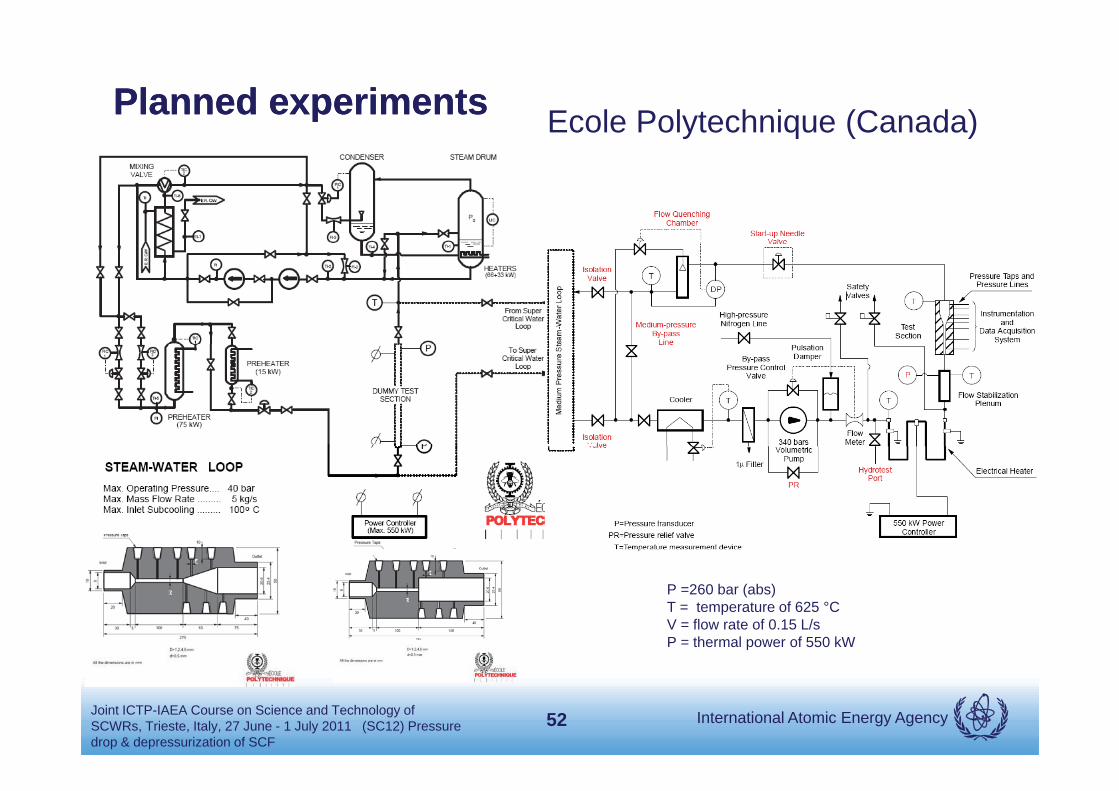
Planned experimentsPlanned experiments Ecole Polytechnique (Canada)
P =260 bar (abs)T = temperature of 625 °C V = flow rate of 0.15 L/sP = thermal power of 550 kW
International Atomic Energy AgencyJoint ICTP-IAEA Course on Science and Technology of SCWRs, Trieste, Italy, 27 June - 1 July 2011 (SC12) Pressure drop & depressurization of SCF
52
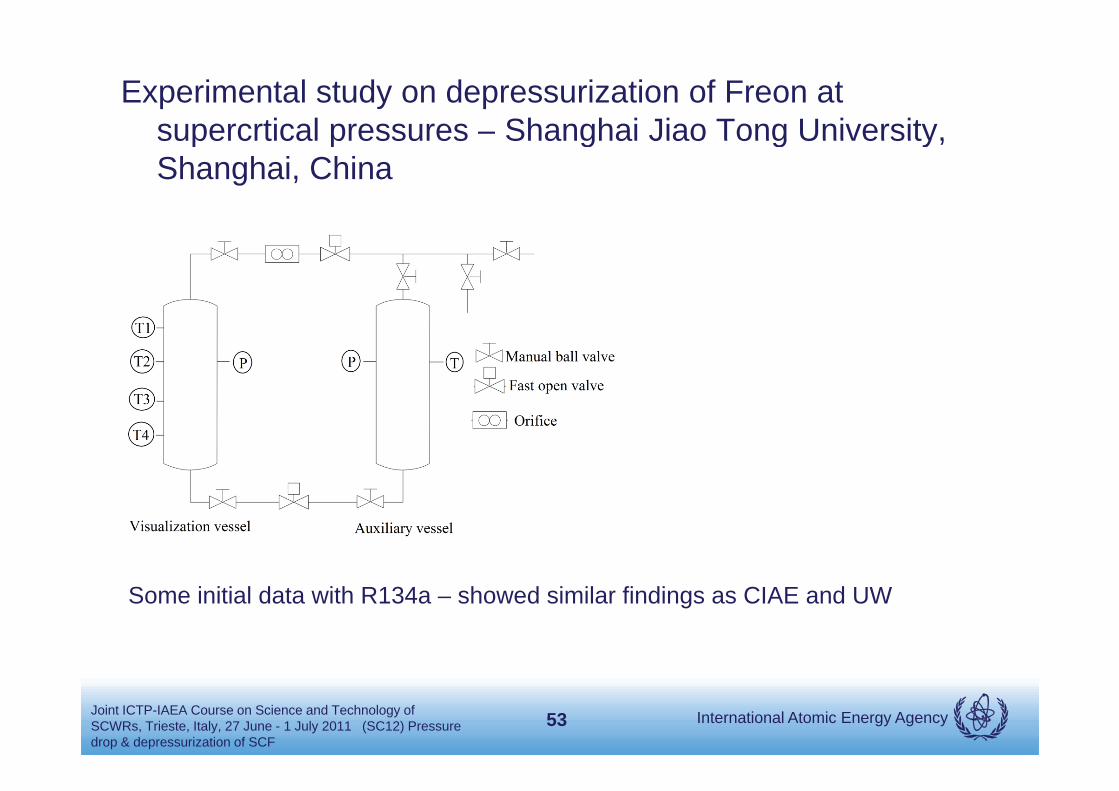
Experimental study on depressurization of Freon at supercrtical pressures – Shanghai Jiao Tong University,supercrtical pressures Shanghai Jiao Tong University, Shanghai, China
Some initial data with R134a – showed similar findings as CIAE and UW
International Atomic Energy AgencyJoint ICTP-IAEA Course on Science and Technology of SCWRs, Trieste, Italy, 27 June - 1 July 2011 (SC12) Pressure drop & depressurization of SCF
53

Modeling effortsModeling efforts• RELAP5 code modifications (REactor Leak Analysis Program)
Developed for best-estimate transient simulation of light water reactor coolant systems during postulated accident situations (developed at INL). Is being y g p ( p ) gmodified to deal with SCF
– Increase of discretization points in the steam tables– Implementation of bilinear interpolation scheme at four corner points to compute derivatives of the
Gibbs functions. In such a way, smoother values are obtained, in the vicinity of the critical point, y y pfor density and temperature derivatives with respect to pressure and internal energy.
• CATHARE code – System code for PWR safety analysis, accident management.g
– Based on a two-fluid six equation model including non-condensable gas equations and radio-chemical transport. 1st order implicit finite volume – finite difference scheme.
– Modified to calculate thermo-physical properties based on the IAPWS-97 formulation. High order polynomials using Horner Factorization are used to determine properties. Void fraction is set to either zero or unity based on the critical temperature– Void fraction is set to either zero or unity based on the critical temperature.
– Pressure drop correlation: Petrov and Popov– Heat transfer correlation: Jackson, Bishop, Dittus-Boelter, Swenson
International Atomic Energy AgencyJoint ICTP-IAEA Course on Science and Technology of SCWRs, Trieste, Italy, 27 June - 1 July 2011 (SC12) Pressure drop & depressurization of SCF
54

Modeling effort Modeling effort -- contcont
• APROS code (Advanced PROcess Simulator) multifunctional simulation environment for the dynamic simulation of nuclear and conventional power plant processes.
– Six-equation, two fluid model based on formalism developed by Ishii et al. Solves mass, momentum and energy for each fluid and gas phase.
– Thermo-physical models for supercritical water were added based on the IAPWS97 using tables of pressure and enthalpy. o p essu e a d e t a py
– No phase change occurs at the pseudo critical point but the properties change smoothly from liquid-like to vapor-like. Code assigns void fraction of 0 or 1
– Wall friction model of Kirillov is used.
– Dittus_Boelter, Bishop, Jackson and Hall, and Watts and Chou heat transfer correlations are used.
• Some work with full CFD codes has been attempted although there are issues as you pass across the vapor dome and results need to be compared with as you pass ac oss t e apo do e a d esu ts eed to be co pa ed texperimental data for the specific geometry.
International Atomic Energy AgencyJoint ICTP-IAEA Course on Science and Technology of SCWRs, Trieste, Italy, 27 June - 1 July 2011 (SC12) Pressure drop & depressurization of SCF
55

Where to find DataWhere to find DataThe IAEA in cooperation with the OECD/NEA has made a data base ofThe IAEA in cooperation with the OECD/NEA has made a data base of relevant experimental data at the following site; http://www.oecd-nea.org/crp_scwr_ht/ (At this time the data is not open to the public.
AECLAECL Supercritical carbon dioxide test in a tube
BARC Supercritical pressure natural circulation experiments with CO2
IPPE Experimental data on heat transfer to carbon dioxide under supercritical pressure
KAERIKAERI E1 : Upward flow in eccentric annular channelR1 : Upward flow in concentric annular channelR1D : Downward flow in concentric annular channelT4 : Upward flow in tube with 4.4 mm inner diameterT457 : Upward flow in tube with 4.57 mm inner diameterT457D : Downward flow in tube with 4 57 mm inner diameterT457D : Downward flow in tube with 4.57 mm inner diameterT6 : Upward flow in tube with 6.32 mm inner diameterT6D : Downward flow in tube with 6.32 mm inner diameterT6W : Upward flow in tube with 6.32 mm inner diameter (with wire type turbulence generator)T9 : Upward flow in tube with 9.0 mm inner diameterT9D : Downward flow in tube with 9.0 mm inner diameter
U i it f Wi i M diUniversity of Wisconsin - Madison S-CO2 depressurizationS-CO2 mini-channel heat transferAnnular heat transfer measurements in upflow geometryFluid flow measurements in supercritical water in upflow geometry
Shanghai Jiao Tong University
International Atomic Energy AgencyJoint ICTP-IAEA Course on Science and Technology of SCWRs, Trieste, Italy, 27 June - 1 July 2011 (SC12) Pressure drop & depressurization of SCF
Heat Transfer of Supercritical Water
56

Where to find data (open literature)Where to find data (open literature)• Major Conferences:
NURETH – International Topical meeting on Nuclear Reactor thermalhydraulicsICAPP – International Congress on Advances in Nuclear Power PlantsICONE – International Conference on Nuclear EngineeringInternational symposium on supercritical-water-cooled ReactorsSupercritical CO2 power cycle symposium
• Books
International conference GLOBALAmerican Nuclear Society (ANL) International meeting
Fundamentals of Multiphase Flow, Corradini (http://wins.engr.wisc.edu/teaching/mpfBook/main.html)
Heat transfer and Hydraulic Resistance at Supercritical Pressures in Power Engineering Applications – Pioro and DuffeyPioro and Duffey
Super light water Reactors and Super fast Reactors – Oka, Koshizuka, Ishiwateri, Yamaji
International Atomic Energy AgencyJoint ICTP-IAEA Course on Science and Technology of SCWRs, Trieste, Italy, 27 June - 1 July 2011 (SC12) Pressure drop & depressurization of SCF
57
ReferencesReferencesPioro and Duffy, Heat transfer and hydraulic Resistance at supercritical pressures in power engineering applicationsCheng, X., and Schulenberg, T. Heat transfer at supercritical pressures–literature review and application to an HPLWR. PhD
thesis, Karlsruhe, Germany,FZKA 6609. (2001)Dittus, F. W., and Boelter, L. M. K. Heat transfer in automobile radiators of the tubular type. University of California
Publication in English Berkeley 2 443–461 (1930)Publication in English, Berkeley 2, 443 461.(1930)Hall, W. B., and Jackson, J. D. Laminarization of turbulent pipe flow by buoyancy forces. American Society of Mechanical
Engineers (ASME), pp. 1–8. Paper number 69- HT-55. (1969)Jackson, J. D., and Hall, W. B. Forced convection heat transfer to fluids at supercritical pressure. In Turbulent forced
convection in channels and bundles,vol. 2. Hemisphere Publishing Company, pp. 563–611. (1979)K W M C f d M E W i d B C ti h t d t f M G Hill N Y k (2005)Kays, W.M., Crawford, M.E., Weigand, B. Convective heat and mass transfer. McGraw Hill, New York. (2005)Pioro, I. L., and Duffey, R. B. Experimental heat transfer is supercritical water flowing inside channels (survey). Nuclear
Engineering and Design, V 235, n 22, November, pg. 2407-2430. (2005)Shitsman, M. E. Impairment of the heat transfer at supercritical pressures. High Temperatures (Teplofzika Vysokikh
Temperaure ctp. 267-275) 1, 2, 237– 44.(1963)Yamagata, K., Nishikawa, K., Hasegawa, S., and Fujii, T. Forced convective heat transfer to supercritical water flowing in
tubes. International Journal of Heat and Mass Transfer 15, 12, 2575–2593. (1971)Licht, “Heat transfer and Fluid Flow Characteristics in Supercritical water”, University of Wisconsin- Madison, PhD Thesis
(2008). Incoropera and Dewitt, Introduction to heat transfer, John Wiley & Sons, 1990p yLicht, Anderson and Corradini, “Heat transfer to water at supercritical pressures in a circular and square annular flow
geometry”, Int. J. of Heat and Fluid Flow, 29 (2008) 156-166Licht, Anderson and Corradini, “ Heat transfer and fluid flow characteristics in supercritical pressure water”, J. Heat Transfer,
2009 vol. 131 Levy S, Abdollahian D, Healzer J, et al. Critical flow data review and analysis. NP-2192, 1982Saha P A review of two-phase steam-water critical flow models with emphasis on thermal non-equilibrium BNL-NUREG-
International Atomic Energy AgencyJoint ICTP-IAEA Course on Science and Technology of SCWRs, Trieste, Italy, 27 June - 1 July 2011 (SC12) Pressure drop & depressurization of SCF
Saha P. A review of two-phase steam-water critical flow models with emphasis on thermal non-equilibrium. BNL-NUREG-50907, 1978
58
Lee D H and Swinnerton D. Evaluation of critical flow for supercritical steam-water. NP-3086, 1983
Mignot G, Anderson M, Corradini M., Measurement and Modelling of Critical Flow for Sopercritical CO2 Emphasis on Roughness and Diameter Influence, Presented at the 12th International Topical Meeting on Nuclear Reactor Thermal Hydraulics (NURETH-12), LN 111, Sept. 30 – Oct.4 2007, USA
Starkman E S, Schrock V E, Neusen K F, et al. Expansion of a very low quality two-phase fluid through a convergent-divergent nozzle. ASME Trans D, J Basic Engineering, 1964, 86(2): 247–256
Moody F J. Maximum Flow Rate of a Single Component, Two-Phase Mixture. ASME Trans C, J Heat Transfer, 1965, 87(1): 134–142134 142
Henry R E, Fauske H K. The two-phase critical flow of one-component mixtures in nozzles, orifices, and short tubes. ASME Trans C, J Heat Transfer, 1971, 93(2): 179–187
Yuzhou Chen, Chunsheng Yang, Shuming Zhang, Minfu Zhao, Kaiwen Du, An Experimental Study of Critical Flow of Water under near-critical and Supercritical Pressures, Presented at the 13th International Topical Meeting on Nuclear Reactor Th l H d li (NURETH 13) N13P1048 S t 27 O t 3 2009 JThermal Hydraulics (NURETH-13), N13P1048, Sept. 27 – Oct.3 2009, Japan
Yuzhou Chen, Chunsheng Yang, Kaiwen Du, et al. An experimental study of critical flow of water at steady-state with pressure of up to 22 MPa. Proc 7th International Symposium of Heat Transfer, Beijing, 2008
Alamgir, Mid and Lienhard, J.H., Correlation of pressure undershoot during hot-water depressurization, Trans. ASME, J. Heat Transfer, 1981, 103, 52-55Transfer, 1981, 103, 52 55
J.D. Anderson, Modern Compressible flow with historical perspective, McGraw-Hill, New York 3rd ed., 2003.
K.H Ardron. and R.A. Furness, A study of the critical flow models used in reactor analysis”, Nuclear Engineering and Design, 39 (1976), pp. 257-266.
H.F. Fauske, The discharge of saturated water through tubes, Chemical Engineering Progress- Symposium Series, 61 g g g g g y p(1965), pp. 210-216.
D.H. Lee, D. Swinnerton, Evaluation of critical flow for supercritical steam-water, EPRI-NP-3086 (1983).
A. Fredenhagen, Druckentlastung binarer Gemische aus Kohlendioxid und Stickstoff sowie Kohlendioxid und Wasser, Thesis, Technischen Universitat Hamburg-Harburg (2002).
International Atomic Energy AgencyJoint ICTP-IAEA Course on Science and Technology of SCWRs, Trieste, Italy, 27 June - 1 July 2011 (SC12) Pressure drop & depressurization of SCF
J. H. Lee, et al., Ann. Nucl. Energy, 25 (1998), 1341
D. Dostal, M.J. Driscoll and D. Hezzlar, A supercritical CO2 cycle for next
59
A. Fredenhagen, Druckentlastung binarer Gemische aus Kohlendioxid und Stickstoff sowie Kohlendioxid und Wasser, Thesis, Technischen Universitat Hamburg-Harburg (2002).
G. Gebbeken, R. Eggers, J. Loss Prev. Process Ind., 9 (1996), pp. 285-293.
H.F. Fauske, The discharge of saturated water through tubes, Chemical Engineering Progress- Symposium Series, 61 (1965), pp. 210-216.
R.E. Henry and H.F. Fauske, The Two-phase critical flow of one-component mixtures in nozzles, orifices and short tubes, Journal of Heat Transfer, (1971).
“RELAP5/Mod 3.3 Code Manual, Volume I: Code Structure, System Models, and Solution Methods” ISL, Rockville, MD, and Idaho Falls,ID, USA, NUREG/CR-5535/Rev. P3-Vol. I, March 2003
Wagner, W., Kruse, A., 1997. The industrial standard IAPWS-IF97 for the thermodynamic properties and supplementary equations forother properties. Properties of Water and Steam. Springer, Heidelberg, Germany.
Antoni, O., Dumaz, P., “Preliminary calculations of a Supercritical Light Water Reactor Concept using the CATHARE Code”, ICAPP’03, May 4-7, 2003
Cheng, X., T. Schulenberg, T., Souyri, A., Sanchez, V., Aksan, N., “ Heat Transfer and Pressure Drop at Supercritical Pressure -Literature Review and Application to an HPLWR” HPLWR Deliverable D 07 (FIKI-CT-2000-00033), September 2001
M. Ishii & T. Hibiki, Thermo-Fluid Dynamics of Two-Phase Flow, Springer Science + Business Media, LLC, New York, USA (2006).
I. Pioro & R. Duffey, “Hydraulic Resistance of Fluids Flowing in Channels at Supercritical Pressures (survey),” Nuclear Engineering and Design, 231, pp.187-197 (2004).Design, 231, pp.187 197 (2004).
Dittus, F.W., Boelter, L.M.K., 1930. Heat transfer in automobile radiators of tubular type. Publ. Eng. 2 (13), Univ. California, Berkley, pp. 443–461.
A. Bishop, R. Sandberg & L. Tong, Forced convection heat transfer to water at near critical temperatures and supercritical pressures, Report WCAP-5449, Westinghouse Electric Corporation, Atomic Power Division (1965).
J Jackson & W Hall “Forced Convection Heat Transfer to Fluids at Supercritical Pressure” Turbulent Forced Convection in ChannelsJ. Jackson & W. Hall, Forced Convection Heat Transfer to Fluids at Supercritical Pressure , Turbulent Forced Convection in Channels and Bundles, 2, S. Kakaç & D. Spalding (edts.), Hemisphere (1979).
M. Watts & C. Chou, “Mixed Convection Heat Transfer to Supercritical Pressure Water”, Proceedings of the 7th International Heat Transfer Conference, 3, pp. 495-500 (1982).`10
Edwards, A. & O’Brien, T., “Studies of phenomena connected with the depressurization of water reactors”, in Journal of British Nuclear Energy Society 9 125 135 (1970)
International Atomic Energy AgencyJoint ICTP-IAEA Course on Science and Technology of SCWRs, Trieste, Italy, 27 June - 1 July 2011 (SC12) Pressure drop & depressurization of SCF
Energy Society, 9, 125—135 (1970)
60

Moody, F., “Maximum flow rate of a single component, two-phase mixture”, Journal of Heat Transfer (Transactions of ASME), 87, 134—142 (1965)
Teyssedou, A., Olekhnovitch, A., Tapucu, A., Champagne, P. & D.C. Groeneveld; Nucl. Eng. Design, 149, (1994) 185-194.
Olekhnovitch, A., Teyssedou, A. & P. Tye; Int. J. Therm. Sci., 39 (2000) 63-73.
Olekhnovitch, A., Sun, J., Tye, P. & A. Teyssedou, J. Heat And Mass Transfer, 51 (2008), 2041-2054.
Olekhnovitch, A., Teyssedou, A., Tye, P. & R. Felisari; Int. J. Multiphase Flow, 31 (2005) 358-370.
Leung, L.K.H., Groeneveld, D.C., Teyssedou, A. & F. Aubé; Nucl. Eng. Design, 235 (2005) 53-65.
Olekhnovitch, A., Teyssedou, A., Tye, P. & P. Champagne; Nucl. Eng. Design, 205 (2001a) 159-173.
Olekhnovitch, A., Teyssedou, A. & P. Tye, Nucl. Eng. Design, 205 (2001b) 175-190.
Pioro, I.L., & R.B. Duffey; “Heat Transfer and Hydraulic Resistance At Supercritical Pressure In Power Engineering Applications,” Asme Press, New York, 2006.
Pioro I Khartabil H & R Duffey Nucl Eng Design 230 (2004) 69 91Pioro, I., Khartabil, H. & R. Duffey, Nucl. Eng. Design, 230, (2004) 69-91.
International Atomic Energy AgencyJoint ICTP-IAEA Course on Science and Technology of SCWRs, Trieste, Italy, 27 June - 1 July 2011 (SC12) Pressure drop & depressurization of SCF
61

…Thank you for your attention!…Thank you for your attention!email: manderson@engr wisc edu
International Atomic Energy AgencyJoint ICTP-IAEA Course on Science and Technology of SCWRs, Trieste, Italy, 27 June - 1 July 2011 (SC12) Pressure drop & depressurization of SCF
email: [email protected]
62