223 final rpt bd15 - valuergeneral.nsw.gov.au · 1.3 liverpool lga demographics ... growth over the...
TRANSCRIPT

Independent Property Valuers& Consultants ACN : 099 913 210 ABN : 80 099 913 210 5/2 East Street, Five Dock, NSW 2046 PO Box 697 Five Dock NSW 2046 phone : (02) 9713-9077 Fax : (02) 9713-9022 email : [email protected]
FINAL REPORT
LAND TAX PROGRAMME DISTRICT 223 - LIVERPOOL BASE DATE - 1 JULY 2015
Prepared by SOUTHERN ALLIANCE VALUATION SERVICES PTY LTD
for VALUER GENERAL &
LAND & PROPERTY INFORMATION

Liverpool Final Report
__________________________________________________________________________________________________________________
_______________________________________________________________________________ Southern Alliance Valuation Services Pty Ltd – Liverpool Final Report – BD 1 July 2015 Page 2 of 63
Table of Contents
EXECUTIVE SUMMARY .......................................................................................................................... 4
1.0 GENERAL DESCRIPTION OF LOCAL GOVERNMENT AREA ................................................ 6
1.1 Introduction ....................................................................................................................................................................... 6
1.2 Liverpool LGA Built & Natural Environment .................................................................................................................. 7
1.2.1 Dwellings and Housing Tenure ................................................................................................................................. 7
1.3 Liverpool LGA Demographics .......................................................................................................................................... 8
1.3.1 Population Growth & Age ......................................................................................................................................... 8
1.3.2 Indigenous Population ............................................................................................................................................... 8
1.3.3 Birthplaces, Languages Spoken and Religion ........................................................................................................... 8
1.3.4 Income and Housing Costs ........................................................................................................................................ 9
2.0 NUMBER OF VALUATIONS IN THE ZONE CATEGORIES .................................................... 10
2.1 Zone Category Break-Up ................................................................................................................................................ 10
2.1.1 Table: All Zones ...................................................................................................................................................... 10
2.1.2 Table: Residential Uses ........................................................................................................................................... 10
2.1.3 Graph: All Zones ..................................................................................................................................................... 11
2.1.4 Graph: Residential Uses .......................................................................................................................................... 11
3.0 TOWN PLANNING & ZONING INSTRUMENTS ........................................................................ 12
3.1 Environmental Planning Instruments .............................................................................................................................. 12
3.1.1 Liverpool Local Environmental Plan 2008 .............................................................................................................. 12
3.1.2 State Environmental Planning Policy (Major Development) 2005 .......................................................................... 12
3.1.3 State Environmental Planning Policy (Sydney Region Growth Centres) 2006 ....................................................... 13
3.1.4 State Environmental Planning Policy (Western Sydney Parklands) ........................................................................ 13
3.2 Development Controls Plans ........................................................................................................................................... 13
3.3 State Environmental Planning Policies (SEPP) ............................................................................................................... 14
3.4 Regional Environmental Plans ........................................................................................................................................ 15
4.0 IDENTIFIED SIGNIFICANT CHANGES IN USE OR DEVELOPMENTS OF PROPERTY AND OTHER FACTORS WHICH MAY AFFECT VALUATIONS .................................................... 16
4.1 South West Growth Centre .............................................................................................................................................. 16
4.2 South West Rail Link ...................................................................................................................................................... 17
4.2.1 Status of the South West Rail Link .......................................................................................................................... 17
4.3 Moorebank Freight Intermodal Terminals....................................................................................................................... 18
4.3.1 Overview of Moorebank Freight Intermodal Terminals .......................................................................................... 18
4.3.2 Location of Moorebank Intermodal Freight Terminal ............................................................................................. 19
4.3.3 SIMTA Intermodal – Conditional Approval ............................................................................................................ 20
4.3.4 Alternate Locations – Badgerys Creek .................................................................................................................... 20
4.4 Badgerys Creek – Western Sydney Airport ..................................................................................................................... 21
4.4.1 Western Sydney Airport Timeline ........................................................................................................................... 21
4.4.2 Planning an airport for Western Sydney .................................................................................................................. 21

Liverpool Final Report
__________________________________________________________________________________________________________________
_______________________________________________________________________________ Southern Alliance Valuation Services Pty Ltd – Liverpool Final Report – BD 1 July 2015 Page 3 of 63
Table of Contents
4.5 Property Market Overview .............................................................................................................................................. 24
4.6 Economy Overview ......................................................................................................................................................... 25
4.7 Court Cases ..................................................................................................................................................................... 29
5.0 ADDED VALUE OF IMPROVEMENTS ......................................................................................... 30
5.1 Residential ....................................................................................................................................................................... 30
5.1.1 Paired Analysis ........................................................................................................................................................ 33
5.2 Commercial / Retail / Industrial ...................................................................................................................................... 40
6.0 CHANGES TO COMPONENTS ILLUSTRATED BY CHANGES TO THE EXISTING VALUE RELATIONSHIPS. ............................................................................................................................ 41
6.1 Value Levels - Typical Properties ................................................................................................................................... 41
6.2 Value Totals .................................................................................................................................................................... 46
6.3 Component Movement Graphs ........................................................................................................................................ 47
7.0 MARKET COMMENTARY: ............................................................................................................ 49
7.1 Residential ....................................................................................................................................................................... 49
7.1.2 Sales and Resales ..................................................................................................................................................... 52
7.1.3 Change in Median Values ........................................................................................................................................ 56
7.1.4 Building Approvals .................................................................................................................................................. 56
7.2 Commercial / Retail ......................................................................................................................................................... 58
7.3 Industrial.......................................................................................................................................................................... 59
8.0 MANAGEMENT OF COMPONENTS, VERIFICATION& HANDCRAFTING ....................... 60
8.1 Verification ...................................................................................................................................................................... 60
9.0 QUALITY ASSURANCE ................................................................................................................... 61
9.1 Overview ......................................................................................................................................................................... 61
9.2 Coefficient of Dispersion (COD) .................................................................................................................................... 61
9.3 Mean Value to Price Ratio (MVP) .................................................................................................................................. 61
9.4 Price Related Differential (PRD) ..................................................................................................................................... 61
9.4 Subsequent Valuations upon Objection / Reascertainment ............................................................................................. 62
10.0 CONCLUSION .................................................................................................................................. 63
10.1 Purpose of this Report ................................................................................................................................................... 63
10.2 Signatory ....................................................................................................................................................................... 63

Liverpool Final Report
__________________________________________________________________________________________________________________
_______________________________________________________________________________ Southern Alliance Valuation Services Pty Ltd – Liverpool Final Report – BD 1 July 2015 Page 4 of 63
EXECUTIVE SUMMARY
All properties in NSW are valued each year for rating and land tax purposes. All valuations are issued to the Office of State Revenue for land tax. Valuations are also issued to councils either each year or every 2nd, 3rd or 4th year. This report details the land valuation programme for the Liverpool Local Government Area (LGA). The majority of land values are determined using mass valuation techniques. The Valuer-General's mass valuation system is applied as follows: 1) Properties that react to market forces in a similar way are grouped together in a component, and 2) The existing values of those properties in a component are updated by a market-based factor that is then used as a multiplier of the prior Land Value. The result is then checked by the Contract Valuer and individually verified values applied as appropriate. The use of mass valuation techniques does have limitations, particularly over a period of time. The continued application of factors may lead to a distortion in the relativity of values within a geographical area. Some types of properties are so few in number or likely to be so sensitive to localised changes that individually verifying values is the only appropriate method. Although a mass valuation system is used to determine the majority of land values, the Valuation of Land Act requires that each land value be a market value. Each land value must be capable of being tested and supported on its own against all the available market evidence. The total number of valuation entries (as at 5 November 2015) within Liverpool LGA – 55,929. The total land value in dollars (as at 5 November 2015) for BD 1 July 2015 within Liverpool LGA - $26,923,422,520.
The last local government base date or year when the valuation notice was issued was for the Base Date 1 July 2014. The total land value for Base Date 1 July 2014 (as at 5 November 2015) was $21,414,148,976 which represents a percentage change of 26% to Base Date 1 July 2015. The percentage change reflects the overall movement for land values within the Liverpool LGA based on market sales evidence. Residential – Overall the residential market within the Liverpool LGA exhibited signs of strong positive growth over the 12 months ending 30 June 2015. As a whole, components within each respective zone illustrated the following movement over the 2015 valuing year: ‘R1 – General Residential’ at 32.2%, ‘R2 – Low Density Residential’ at 29.7%, ‘R3 – Medium Density Residential’ at 28.9%, ‘R4 – High Density Residential’ at 39.3% and ‘R5 – Large Lot Residential’ at 29.0%. On average, residential land within each component, depending on locality and development potential, moved within a band of 9.8%% and 65.1% between the Base Date 1 July 2014 and 1 July 2015. In total, there are 44 residential components in the residential zones (noted above). 25 residential components recorded positive growth in excess of 30% between base date 1 July 2014 and base date 1 July 2015. There are 26 components in the ‘R2 – Low Density Residential’ zone, with 15 of those components recording positive growth greater than 30% over the 12 months ending 30 June 2015. Some components in the ‘R2’ zone which had shown considerable growth over the 2015 valuing year are: ‘AFF – Chipping Norton’ at 35.1%, ‘ALL – Warwick Farm’ at 35.4%, ‘AWW – Austral’ at 65.1%, ‘LPP – Moorebank (Western Part)’ at 37.7% and ‘MLL – Medium Density (LGA Wide)’ at 38%. Component ‘AWW’ recorded to the largest growth over the 2015 valuing year partly attributable to a rezoning of the land from ‘RU4 – Primary Production (Small Lots)’ under Liverpool LEP 2008 to ‘R2 – Low Density Residential’ under the SEP 2006 – Sydney Regional Growth Centres – the ‘R2’ zoning allowing a greater development potential of the land than that allowable under the ‘RU4’ zone. Other single residential component areas in the residential zoning that exhibited strong positive growth over the 2015 valuing year are: ‘MUU – R1 Large Parcels’ at 35.8% and ‘JAD – R3 Sites (Austral / Leppington)’ at 42.7%. Furthermore, density / development sites continued to be in demand as developers seek quality assets which can meet the market demand for residential property while providing more affordable housing options. Individual pockets can move against the trend for varying reasons, however on the whole properties within the Liverpool Municipality were relatively consistent.
Commercial / Retail – As a whole, from 1 July 2014 to 1 July 2015, commercial and retail property markets within the Liverpool LGA recorded mixed levels of growth. Overall, components within each respective zone illustrated the following movement over the 2015 valuing year: ‘B1 – Neighbourhood Centre’ at 12.0%, ‘B2 – Local Centre’ at 16.3%, ‘B3 – Commercial Core’ at 16.0%, ‘B4 – Mixed Use’ at 21.6%, ‘B5 – Business Development’ at 10.0% and ‘B6 – Enterprise Corridor’ at 16.5%.

Liverpool Final Report
__________________________________________________________________________________________________________________
_______________________________________________________________________________ Southern Alliance Valuation Services Pty Ltd – Liverpool Final Report – BD 1 July 2015 Page 5 of 63
EXECUTIVE SUMMARY (Cont.)
Individual components within each business zone show varying levels of growth for numerous reasons including, but not limited to, location, development potential and access to infrastructure / public transport – however, as a whole, business zoned components generally moved within a band of 8.0% and 29.5% over the 2015 valuation year. Component ‘TMM – B4 Town Centre Mixed Use’ in the ‘B4 – Mixed Use’ zone recorded strong positive growth over the 12 months ending 30 June 2015. Component ‘TMM’ comprises commercial, retail & mixed use properties and potential development sites within the Liverpool Town Centre and recorded growth of 29.5% over the valuation period. Retail properties across the Liverpool LGA have recorded good growth over the 2015 land valuing year with all retail sites (excluding components ‘BGG’ and ‘TSS’ – predominantly larger sites) exhibiting growth between 12% and 29.5%. Growth in retail spending (and ultimately retail asset values) is being supported by various factors. For example, increases in household net worth, driven by the uplift in residential dwelling values, are resulting in providing support for discretionary retail spending and retail spending on household goods. Additionally, a low Australian dollar and low interest rates are providing some overall support to retail properties and retail land values. Colliers International report that Neighbourhood Retail properties for the first half of 2015 illustrated a prime yield range from 6.50% up to 7.75% and a secondary yield range from 8.00% up to 10.00%. Additionally, Colliers International report that Sub-Regional shopping centres’ for the first half of 2015 exhibited a prime yield range from 6.50% up to 7.50% and a secondary yield range from 7.50% up to 9.50%.
Industrial – Overall, the industrial market within Liverpool LGA was fairly subdued with 6 components recording nil growth, 3 components recording a modest increase in values and 4 components exhibiting a contraction in values. Overall, each industrial zone exhibited the following results over the 2015 valuing year: ‘IN1 – General Industrial’ at 0.3%, ‘IN2 – Light Industrial’ at -1.4% and ‘IN3 – Heavy Industrial’ at -2.7%. Generally, industrial sites situated to the ‘East of Liverpool CBD’ performed better than those industrial sites situated to the ‘West of Liverpool CBD’. Colliers International report as a result of a reduction in available stock within the southern Sydney industrial market displacing owners and investors to assets located in the southwest Sydney region, combined with infrastructure upgrades and other developments within the southwest region including the Moorebank Intermodal Freight Precinct and Badgerys Creek Airport, have led to further yield compression with the yield range for prime assets, as at September 2015, being 6.5-7.5 per cent and 8-9 per cent for secondary assets. However, as highlighted in the body of this report, over the 2015 valuing year ending 30 June 2015, some industrial locale’s performed better than others and the above summarised comments are general in nature and may not apply to all industrial properties/locales within the Liverpool LGA.
TABLE OF TYPICAL VALUES Location Zone Size (square metres) 2015 Land Value Brearley Ave, Middleton Grange General Residential 364.1 $368,000 Weir Cres, Lurnea Low Density Residential 556.4 $340,000 Nottingham Cres, Chipping Norton Low Density Residential 693.9 $534,000 Pritchard Ave, Hammondville Low Density Residential 556.4 $381,000 Craig Ave, Moorebank Medium Density Residential 663.9 $410,000 Galloway St, Busby Medium Density Residential 607 $293,000 Bigge St, Warwick Farm High Density Residential 651 $599,000 Dwyer Rd, Bringelly Large Lot Residential 20,250 $869,000 Findley Rd, Bringelly Primary Production 386,200 $1,510,000 Denham Court Rd, Denham Court Rural Landscape 20,230 $1,120,000 Bellfield Ave, Rossmore Primary Production (small lots) 20,230 $780,000 Marsh Pde, Casula Neighbourhood Centre 297.2 $138,000 George St, Liverpool Commercial Core 613.3 $980,000 Moore St, Liverpool Mixed Use 501.2 $757,000 Regent Cres, Moorebank General Industrial 1,859 $647,000 Alfred Rd, Chipping Norton Light Industrial 9,194 $2,940,000 Enterprise Cct, Prestons Heavy Industrial 3,887 $1,160,000
Murray Edmondson Southern Alliance Valuation Services Pty Ltd

Liverpool Final Report
__________________________________________________________________________________________________________________
_______________________________________________________________________________ Southern Alliance Valuation Services Pty Ltd – Liverpool Final Report – BD 1 July 2015 Page 6 of 63
1.0 GENERAL DESCRIPTION OF LOCAL GOVERNMENT AREA
1.1 Introduction
Liverpool Local Government Area (LGA) is situated approximately 28 kilometres southwest of Sydney’s Central Business District and covers an area of 306 square kilometres, comprising 42 suburbs from Greendale in the west to Hammondville in the east. The 42 suburbs include: 1. Ashcroft 15. Green Valley 29. Middleton Grange 2. Austral 16. Greendale 30. Miller 3. Badgery’s Creek 17. Hammondville 31. Moorebank 4. Bringelly 18. Heckenberg 32. Mount Pritchard 5. Busby 19. Hinchinbrook 33. Pleasure Point 6. Carnes Hill 20. Holsworthy 34. Prestons 7. Cartwright 21. Horningsea Park 35. Rossmore 8. Casula 22. Hoxton Park 36. Sadleir 9. Cecil Hills 23. Kemps Creek 37. Silverdale 10. Cecil Park 24. Len Waters Estate 38. Voyager Point 11. Chipping Norton 25. Leppington 39. Wallacia 12. Denham Court 26. Liverpool 40. Warwick Farm 13. Edmondson Park 27. Luddenham 41. Wattle Grove 14. Elizabeth Hills 28. Lurnea 42. West Hoxton
Source: Liverpool Council Website – Maps of Liverpool

Liverpool Final Report
__________________________________________________________________________________________________________________
_______________________________________________________________________________ Southern Alliance Valuation Services Pty Ltd – Liverpool Final Report – BD 1 July 2015 Page 7 of 63
1.0 GENERAL DESCRIPTION OF LOCAL GOVERNMENT AREA (CONT.)
1.2 Liverpool LGA Built & Natural Environment Liverpool LGAs main commercial / retail facilities are located in the Liverpool Town Centre and the adjoining main road frontages to the Hume Highway, The Cumberland Highway and Newbridge Road. Liverpool LGAs main industrial locations include Moorebank, Chipping Norton, Warwick Farm and Prestons. It is understood the industrial lands account for only 2.73% of the total area in the Liverpool LGA (as at 2009). Prestons includes a higher proportion of vacant / yet to be developed sites, including the western section of the area which was rezoned form a rural zoning in 2007. Natural assets include the Georges River and Nepean River, Chipping Norton Lakes, Bents Basin and 7,459 hectares of bush land including Cumberland Plain Woodland. Liverpool also has over 250 parks, with recreation accounting for 5.83% of total land area and national parks 12.14% of total land area of the LGA (as at 2009). Major features of the Liverpool LGA include the Holsworthy Military Camp, Warwick Farm Racecourse, Westfield Liverpool, Sydney International Shooting Centre and Powerhouse Regional Arts Centre. Key educational facilities include TAFE NSW South Western Institute with colleges in Liverpool and Miller. Major health facilities include Liverpool Hospital and Sydney Southwest Private Hospital. Liverpool is well serviced by public transport with both the East Hills and Main South West railway lines passing through the LGA. Liverpool LGA also has access to many arterial roads including M5 & M7 motorways and the Hume Highway & Cumberland Highway. Urban areas of the Liverpool LGA are well serviced by local transportation options.
1.2.1 Dwellings and Housing Tenure
The overall number of occupied private dwellings grew by 6,709 (12%) to 55,958 in the five years to 2011. At the 2011 Census, 24% of occupied private dwellings in Liverpool were fully owned, 42% were being purchased and 30% were rented. The combined owned and being purchased tenure in Liverpool, at 66% of all dwellings, is almost identical to Sydney generally at 65%. At the same time, 8.1% of Liverpool residents were social housing tenants, a considerable drop from 19% in 1991. This is compared to 5% of people renting social housing in the Greater Sydney region in 2011. Separate houses continue as the dominant form of housing in Liverpool at 75% of all dwellings. This is significantly higher than the Sydney proportion of 61% of all dwellings. It is however far less than some of Liverpool's neighbours (95% in Wollondilly, 92% in Camden and 81% in Campbelltown).
(Source: Information summarised / data extracted from Liverpool City Council Website)

Liverpool Final Report
__________________________________________________________________________________________________________________
_______________________________________________________________________________ Southern Alliance Valuation Services Pty Ltd – Liverpool Final Report – BD 1 July 2015 Page 8 of 63
1.0 GENERAL DESCRIPTION OF LOCAL GOVERNMENT AREA (CONT.)
1.3 Liverpool LGA Demographics 1.3.1 Population Growth & Age
As at the 2011 Census, Liverpool's population was 180,143. This represents an increase of 15,181 people (8%) over the 2006 population figure of 164,962 and a 15% increase over the last ten years. The rate of population growth in Liverpool between 2006 and 2011 exceeded that of the Greater Sydney region (6%) and New South Wales (5%).
The Estimated Resident Population of Liverpool as at 30 June 2014 was 199,928. Liverpool continues to be a young city: the median age was 33 years in 2011. It is younger compared to neighbouring areas, and Greater Sydney which was 36 years. In Liverpool, 38% of the population was less than 25 years of age. Liverpool also has an ageing population: the 55+ age group was the fastest growing age group in 2011. There has been a 17% increase in this population since 2006.
1.3.2 Indigenous Population The number of Indigenous people in 2011 grew by 483 to 2,677 people and has increased to 1.5% since 2006. Liverpool has a larger proportion of Indigenous people compared to Greater Sydney's 1.2%.
1.3.3 Birthplaces, Languages Spoken and Religion
The number of persons born overseas increased by 9,548 (13%) to 71,715. The overseas born population rose to 40% of the population, an increase of 9% in the last 20 years. By comparison, 34% of Sydney's population was born overseas. Liverpool's people come from over 150 different birthplaces. The top ten overseas birthplaces in 2011 were Fiji (6,395), Iraq (6,114), Vietnam (5,230), India (4,213), Philippines (3,580), Lebanon (3,573), New Zealand (3,076), Italy (2,893), England (2,177) and Serbia / Montenegro (2,233). At the 2011 Census, English was stated as the only language spoken at home by 44.4% of Liverpool's population. Around half of Liverpool's residents said they spoke a language other than English at home. 8.7% of residents said they spoke English not well or not at all. Liverpool residents speak more than 140 different languages. The top ten languages spoken at home after English are: Arabic, Hindi, Vietnamese, Italian, Spanish, Serbian, Greek, Assyrian, Cantonese and Macedonian.

Liverpool Final Report
__________________________________________________________________________________________________________________
_______________________________________________________________________________ Southern Alliance Valuation Services Pty Ltd – Liverpool Final Report – BD 1 July 2015 Page 9 of 63
1.0 GENERAL DESCRIPTION OF LOCAL GOVERNMENT AREA (CONT.) The Catholic and Anglican religions remain the top two religious affiliations, however overall proportions have declined since 2006. The Islamic and Eastern Orthodox religions have seen increased proportions since the last Census, as has the proportion of people who have stated they have no religion. Buddhism and Hinduism have also increased since 2006.
1.3.4 Income and Housing Costs Median individual, household and family incomes in Liverpool have increased slightly since 2006, however people in Liverpool continue to pay a large proportion of their income on rent – 12% pay more than 30% of their household income on rent. Compared to its neighbours, Liverpool has higher median household incomes ($1,299) compared with Fairfield ($1,022), Bankstown ($1,091) or Campbelltown ($1,251), but lower compared with Camden ($1,727), Sutherland ($1,674), Wollondilly ($1,478) or Penrith ($1,398). Median monthly mortgage repayments in Liverpool are the same as the Sydney median at $2,167. This represents a 20% increase since 2006. However, more people in Liverpool pay over 30% of their household incomes on mortgage repayments - 17% compared to 12% in Sydney. This demonstrates the considerable "housing stress" in Liverpool. Compared to its neighbours, median monthly mortgage repayments are equal to Camden, Wollondilly and Penrith, higher than in Fairfield, Campbelltown and Bankstown but lower than in Sutherland.
(Source: Liverpool City Council Website)

Liverpool Final Report
__________________________________________________________________________________________________________________
_______________________________________________________________________________ Southern Alliance Valuation Services Pty Ltd – Liverpool Final Report – BD 1 July 2015 Page 10 of 63
2.0 NUMBER OF VALUATIONS IN THE ZONE CATEGORIES
2.1 Zone Category Break-Up 2.1.1 Table: All Zones
Zone Category Break-Up as at 5 November 15
Residential 50,947 91.09% Business 840 1.50% Industrial 696 1.24% Rural 1,722 3.08% Environmental 147 0.26% Open Space 885 1.58% Special Uses 570 1.02% SEPP – Parklands 122 0.22%
Totals 55,929 100.00%
2.1.2 Table: Residential Uses
Residential Uses Break-Up as at 5 November 15
Single Dwelling Sites 49,800 97.75% Medium Density 815 1.60% High Density 332 0.65%
Totals 50,947 100.00%
NOTE: The ‘Medium Density’ and ‘High Density’ numbers above exclude single residential sites within the ‘R3 – Medium Density Residential’ and ‘R4 – High Density Residential’ zones.

Liverpool Final Report
__________________________________________________________________________________________________________________
_______________________________________________________________________________ Southern Alliance Valuation Services Pty Ltd – Liverpool Final Report – BD 1 July 2015 Page 11 of 63
2.0 NUMBER OF VALUATIONS IN THE ZONE CATEGORIES (Cont.)
2.1.3 Graph: All Zones
2.1.4 Graph: Residential Uses

Liverpool Final Report
__________________________________________________________________________________________________________________
_______________________________________________________________________________ Southern Alliance Valuation Services Pty Ltd – Liverpool Final Report – BD 1 July 2015 Page 12 of 63
3.0 TOWN PLANNING & ZONING INSTRUMENTS 3.1 Environmental Planning Instruments
Environmental Planning Instruments are the statutory controls for land use and major development standards. They usually consist of a written statement and a series of maps. They include:
Controls for land uses
Controls for key development standards such as height of buildings, subdivision sizes and floor space limitations
Controls for other matters such as heritage, flooding, tree preservation
Identification of land acquisition by Council and government authorities
In Liverpool there are currently 4 primary Environmental Planning Instruments that apply to land and provide land use zoning. These are:
1. Liverpool Local Environmental Plan 2008 2. State Environmental Planning Policy (Major Development) 2005 – Edmondson Park South 3. State Environmental Planning Policy (Sydney Region Growth Centres) 2006 – Austral and
Leppington North 4. State Environmental Planning Policy (Western Sydney Parklands)
3.1.1 Liverpool Local Environmental Plan 2008 On 29 August 2008 Liverpool City Council adopted the Liverpool Local Environmental Plan (LLEP) 2008. It complies with the standardised LEP format required by NSW Planning. The Liverpool Local Environmental Plan 2008 (written statement and maps) applies to all land in Liverpool except for areas where other planning instruments have overridden the plan. Some new growth centre areas no longer use the Liverpool Local Environmental Plan 2008 and have now been overridden by new planning instruments listed below.
3.1.2 State Environmental Planning Policy (Major Development) 2005
The State Environmental Planning Policy (Major Development) 2005 (written statement and maps) applies to certain land at Edmondson Park South. This Planning Policy was applied to parts of Edmondson Park by the NSW Government and has overridden the Liverpool Local Environmental Plan 2008. Planning controls are found in Schedule 3 State Significant Sites – Part 31 Edmondson Park South Site. The Edmondson Park South Development Control Plan 2012 is to be used in conjunction with the Major Development State Environmental Planning Policy 2005. To find out if your land is located within the Edmondson Park South site please view the Land Application Maps, found under the maps tab of the Major Development SEPP 2005.

Liverpool Final Report
__________________________________________________________________________________________________________________
_______________________________________________________________________________ Southern Alliance Valuation Services Pty Ltd – Liverpool Final Report – BD 1 July 2015 Page 13 of 63
3.0 TOWN PLANNING & ZONING INSTRUMENTS (CONT.)
3.1.3 State Environmental Planning Policy (Sydney Region Growth Centres) 2006
The State Environmental Planning Policy (Sydney Region Growth Centres) 2006 (written statement and maps) applies to land at Austral and Leppington North and has overridden Liverpool Local Environmental Plan 2008. Planning controls for development in Austral and Leppington North are found under Appendix 8 Liverpool Growth Centres Precinct and are used in place of the Liverpool Local Environmental Plan 2008. The Liverpool Growth Centre Precincts Development Control Plan is to be used along with the Sydney Region Growth Centres State Environmental Planning Policy. To find out if land is located within the Austral and Leppington North area please view the Land Application Maps, found under the maps tab of the Sydney Region Growth Centres SEPP 2006.
3.1.4 State Environmental Planning Policy (Western Sydney Parklands)
The State Environmental Planning Policy (Western Sydney Parklands) 2009 applies to land in the Western Sydney Parklands.
3.2 Development Controls Plans Development Control Plans provide detailed design controls for development. They consist of a written statement, illustrations and in some areas include maps. They include controls that apply to:
All land covered by the Development Control Plan
Certain land use zones
Certain localities
In Liverpool there are currently 4 Development Control Plans that apply. These are:
1. The Liverpool Development Control Plan 2008 [adopted 28 July 2008] (written statement and maps) applies to all land in Liverpool except where the following Plans apply.
2. The Edmondson Park South Development Control Plan 2012(written statement and maps) applies to all land in Edmondson Park South that is specified in the State Environmental Planning Policy (Major Development) 2005 Land Application Maps.
3. The Liverpool Growth Centre Precincts Development Control Plan (written statement and maps) applies to all land in Austral and Leppington North that is specified in the State Environmental Planning Policy (Sydney Region Growth Centres) 2006 Land Application Maps
4. Austral Leppington North DCP Road Network

Liverpool Final Report
__________________________________________________________________________________________________________________
_______________________________________________________________________________ Southern Alliance Valuation Services Pty Ltd – Liverpool Final Report – BD 1 July 2015 Page 14 of 63
3.0 TOWN PLANNING & ZONING INSTRUMENTS (CONT.)
3.3 State Environmental Planning Policies (SEPP)
The NSW Government has established State Environmental Planning Policies (SEPP) to address significant issues of the state and the people of NSW. SEPPs provide flexibility with standard provisions and various SEPPs must be considered as part of any development application process. SEPPs fall under the Environmental Planning and Assessment Act 1979 and are classified as an environmental planning instrument. Please be advised that when assessing a development application, a SEPP overrides, or can be applied in conjunction with, the requirements of Council’s LEP or DCP.
The following SEPPs may be used when assessing development applications within Liverpool City Council:
SEPP 4 ‐ Development without Consent and Miscellaneous Exempt and Complying Development
(Only certain parts apply, please check the Liverpool Local Environmental Plan as to what parts
of the SEPP apply.)
SEPP 6 ‐ Number of Storeys in a Building
SEPP 19 ‐ Bushland in Urban Areas
SEPP 21 ‐ Caravan Parks
SEPP 22 ‐ Shops and Commercial Premises
SEPP 30 ‐ Intensive Agriculture
SEPP 32 ‐ Urban Consolidation (Redevelopment of Urban Land)
SEPP 33 ‐ Hazardous and Offensive Development
SEPP 44 ‐ Koala Habitat Protection
SEPP 50 ‐ Canal Estate Development (this SEPP prohibits all canal estate development)
SEPP 55 ‐ Remediation of Land
SEPP 62 ‐ Sustainable Aquaculture
SEPP 64 ‐ Advertising and Signage
SEPP 65 ‐ Design Quality of Residential Flat Development
SEPP 70 ‐ Affordable Housing (Revised Schemes)
SEPP ‐ (Building Sustainability Index: BASIX) 2004
SEPP ‐ (Housing for Older People or People with Disability) 2004
SEPP ‐ (Major Projects) 2005
SEPP ‐ (Sydney Region Growth Centres) 2006
SEPP ‐ (Infrastructure) 2007
SEPP ‐ (Mining, Petroleum Production and Extractive Industries) 2007
SEPP ‐ (Temporary Structures and Places of Public Entertainment) 2007
SEPP ‐ (Exempt and Complying Development Codes) 2008
SEPP ‐ (Rural Lands) 2008
SEPP ‐ (Western Sydney Parklands) 2009
SEPP ‐ (Affordable Rental Housing) 2009

Liverpool Final Report
__________________________________________________________________________________________________________________
_______________________________________________________________________________ Southern Alliance Valuation Services Pty Ltd – Liverpool Final Report – BD 1 July 2015 Page 15 of 63
3.0 TOWN PLANNING & ZONING INSTRUMENTS (CONT.) 3.4 Regional Environmental Plans Regional Environmental Plans help provide a framework for detailed local planning by Council. LEPs are required to be consistent with the objectives and intent of the relevant REP. REPs considered relevant to development applications within Liverpool City Council:
GMREP No. 2 ‐ Georges River Catchment
SREP No. 9 ‐ Extractive Industry (No. 2 ‐ 1995)
SREP No. 20 ‐ Hawkesbury‐Nepean River (No. 2 ‐ 1997)
Council is legally bound to follow the requirements of these policies where applicable to the Liverpool LGA.
Please Note:
The above information on planning controls were sourced from Liverpool’s Council Website.
It is understood the various planning policies may be amended or superseded over time, thus it is imperative that any person check the above planning information is current, at date of viewing, via Liverpool Councils Website (http://www.liverpool.nsw.gov.au/) or the relevant State Planning Website (http://www.planning.nsw.gov.au/) or NSW Legislation Website (http://www.legislation.nsw.gov.au/).
Liverpool Final Report
__________________________________________________________________________________________________________________
_______________________________________________________________________________ Southern Alliance Valuation Services Pty Ltd – Liverpool Final Report – BD 1 July 2015 Page 16 of 63
4.0 IDENTIFIED SIGNIFICANT CHANGES IN USE OR DEVELOPMENTS OF PROPERTY AND OTHER FACTORS WHICH MAY AFFECT VALUATIONS
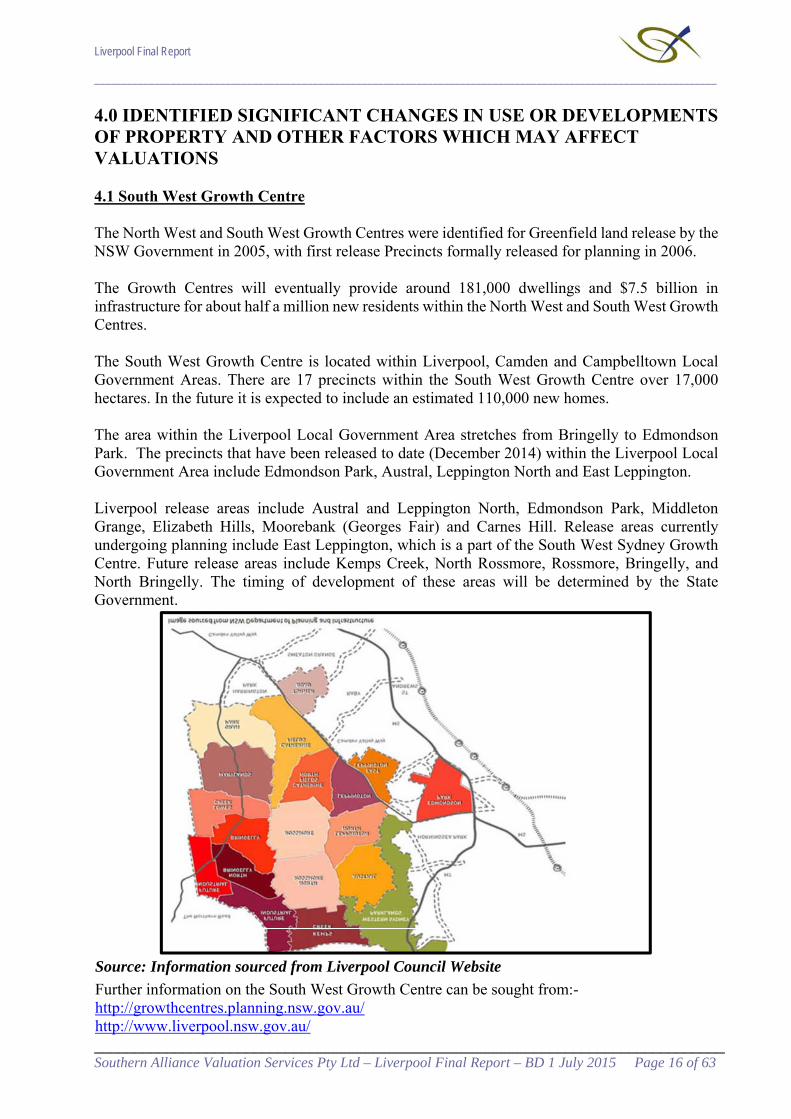
4.1 South West Growth Centre The North West and South West Growth Centres were identified for Greenfield land release by the NSW Government in 2005, with first release Precincts formally released for planning in 2006. The Growth Centres will eventually provide around 181,000 dwellings and $7.5 billion in infrastructure for about half a million new residents within the North West and South West Growth Centres. The South West Growth Centre is located within Liverpool, Camden and Campbelltown Local Government Areas. There are 17 precincts within the South West Growth Centre over 17,000 hectares. In the future it is expected to include an estimated 110,000 new homes. The area within the Liverpool Local Government Area stretches from Bringelly to Edmondson Park. The precincts that have been released to date (December 2014) within the Liverpool Local Government Area include Edmondson Park, Austral, Leppington North and East Leppington. Liverpool release areas include Austral and Leppington North, Edmondson Park, Middleton Grange, Elizabeth Hills, Moorebank (Georges Fair) and Carnes Hill. Release areas currently undergoing planning include East Leppington, which is a part of the South West Sydney Growth Centre. Future release areas include Kemps Creek, North Rossmore, Rossmore, Bringelly, and North Bringelly. The timing of development of these areas will be determined by the State Government.
Source: Information sourced from Liverpool Council Website
Further information on the South West Growth Centre can be sought from:- http://growthcentres.planning.nsw.gov.au/ http://www.liverpool.nsw.gov.au/

Liverpool Final Report
__________________________________________________________________________________________________________________
_______________________________________________________________________________ Southern Alliance Valuation Services Pty Ltd – Liverpool Final Report – BD 1 July 2015 Page 17 of 63
4.0 IDENTIFIED SIGNIFICANT CHANGES IN USE OR DEVELOPMENTS OF PROPERTY AND OTHER FACTORS WHICH MAY AFFECT VALUATIONS (Cont.)
4.2 South West Rail Link The South West Rail Link (SWRL) is a under construction and comprises of a 12 km twin track passenger rail line from Glenfield to Leppington via Edmondson Park. It includes stations at Edmondson Park and Leppington, an upgrade to Glenfield Station and a new train stabling (train parking) facility west of Leppington. Commuter car parks will be located at Edmondson Park and Leppington and will provide over 1,000 car spaces. The project is expected to be completed by 2016 with train services operating to Glenfield, Liverpool, Sydney CBD, and Parramatta. This rail link is the key to the success of the Edmondson Park and Leppington Town Centres. The project provides benefits to the areas directly serviced by the stations as well as the broader South West Sydney region including:
Promoting viability of higher residential densities close to the future Edmondson Park and Leppington Town Centres,
Improved viability of affordable housing in close proximity to the rail line and future town centres,
Supports development of large retail outlets at the future Edmondson Park and Leppington Town Centres,
Reduced reliance on the private vehicle and road based transport,
Reduced air pollution in western Sydney,
Improved mobility and independence for the community (particularly teenagers and the elderly), and
Reduced congestion on all roads, particularly motorway systems.
Source: Information sourced from Liverpool Council Website
4.2.1 Status of the South West Rail Link
The new South West Rail Link (SWRL) was opened to the public on 8 February 2015. The new Glenfield Transport Interchange and Glenfield Station were opened to the community on Sunday 23 September 2012. Major construction of the Glenfield to Leppington rail line component of the South West Rail Link commenced at the beginning of 2012 and works are 12 months ahead of schedule, with revenue services now commencing in 2015.
The Glenfield Junction northern flyover was built as part of the South West Rail Link project. The flyover was commissioned in early June 2014 and is helping to deliver a more efficient rail network for customers. The flyover separates T2 South Line services from T2 Airport Line services, reducing flow-on effects to other trains across the Sydney rail network if a service is delayed. Previously trains from the two lines had to take turns at Glenfield, slowing them down and creating a bottleneck whenever a train was delayed. The flyover now allows two trains to cross at the same time, one over the top of the other, meaning the network will flow much more effectively and predictably.
Source: Transport for NSW

Liverpool Final Report
__________________________________________________________________________________________________________________
_______________________________________________________________________________ Southern Alliance Valuation Services Pty Ltd – Liverpool Final Report – BD 1 July 2015 Page 18 of 63
4.0 IDENTIFIED SIGNIFICANT CHANGES IN USE OR DEVELOPMENTS OF PROPERTY AND OTHER FACTORS WHICH MAY AFFECT VALUATIONS (Cont.)
4.3 Moorebank Freight Intermodal Terminals 4.3.1 Overview of Moorebank Freight Intermodal Terminals
Two intermodal freight terminals have been proposed in Moorebank, on either side of Moorebank Avenue. The proposed intermodal terminal to the east of Moorebank Avenue is a private intermodal terminal. The proponent of this project is SIMTA. SIMTA is a joint venture, formed in 2007, comprising of Qube Logistics and Aurizon (formerly QR National). The proponent for the proposed intermodal terminal to the west of Moorebank Avenue is the Australian Government Department of Finance and Deregulation. It is known as the Moorebank Intermodal Terminal (MIT). The freight intermodals will be a destination for freight containers transported from the port via rail. From this terminal the freight containers will be distributed by trucks to their various destinations. The development is categorised as heavy industrial and is proposed to be operational 24 hours a day 7 days a week. The SIMTA intermodal has a maximum capacity of 1 million twenty foot equivalent unit (TEU) containers per year and the Moorebank Intermodal Terminal proposal is expected to have a maximum capacity of 1.2 million TEU containers per year. The proposals both also include warehousing and distributions facilities associated with the intermodal terminal. Intermodal terminals currently operating in Sydney
Enfield – 300 000 TEUs per year
Chullora – 300 000 TEUs per year
Minto – 45 000 TEUs per year
Yennora – 115 000 TEUs per year
Villawood – 15 to 20 000 TEUs per year
Total Maximum Capacity – 780 000 TEUs per year These sites are too small and too constrained to be able to move the forecast container demand. This is why the Government has identified a number of proposed sites for the development of additional intermodal facilities. If these freight intermodals are constructed, Moorebank will have more than double the total containers compared to the remainder of Sydney. It is considered that the distribution of containers should be more equitably spread across Sydney to better reflect the ultimate destination of the goods in the containers.

Liverpool Final Report
__________________________________________________________________________________________________________________
_______________________________________________________________________________ Southern Alliance Valuation Services Pty Ltd – Liverpool Final Report – BD 1 July 2015 Page 19 of 63
4.0 IDENTIFIED SIGNIFICANT CHANGES IN USE OR DEVELOPMENTS OF PROPERTY AND OTHER FACTORS WHICH MAY AFFECT VALUATIONS (Cont.) 4.3.2 Location of Moorebank Intermodal Freight Terminal
Image Source: http://www.micl.com.au/the-precinct/where-is-it-located.aspx
Liverpool Final Report
__________________________________________________________________________________________________________________
_______________________________________________________________________________ Southern Alliance Valuation Services Pty Ltd – Liverpool Final Report – BD 1 July 2015 Page 20 of 63
4.0 IDENTIFIED SIGNIFICANT CHANGES IN USE OR DEVELOPMENTS OF PROPERTY AND OTHER FACTORS WHICH MAY AFFECT VALUATIONS (Cont.)
4.3.3 SIMTA Intermodal – Conditional Approval
On 29th September 2014 the Planning Assessment Commission (PAC) released its determination in relation to the SIMTA intermodal terminal facility. The PAC have granted the project conditional approval, meaning that there are conditions and requirements that the applicant needs to meet before they can proceed with construction. The draft environmental assessment (EA) for the SIMTA intermodal terminal was publicly exhibited as required by NSW Planning and Infrastructure. The first draft of the EA exhibited from March to May 2012 was not adequate and a review of the EA and second exhibition period was undertaken in September and October 2013. Both times Council provided a comprehensive submission, prepared by the consultant Cardno, to the exhibition. Throughout this process, Council has maintained its objection to the SIMTA intermodal at Moorebank. Despite Councils objections, NSW Planning and Infrastructure provided Council with a draft conditional concept approval for the SIMTA intermodal terminal project in April 2014. The application was referred to the PAC for determination. The PAC held a public meeting as well as a meeting with Council officers in July 2014. The key condition to note is contained within the Schedule 2 titled "Limits of Approval". SIMTA have applied for approval to move 1 million containers per year with this concept approval. The conditions require that the operation not exceed 250 000 containers per year, with a potential to increase this to 500 000 containers subject to a further application.
4.3.4 Alternate Locations – Badgerys Creek
The announcement of the Badgerys Creek International Airport is a game changer for Western Sydney. A Deloitte report estimated that up to 28,500 jobs alone will be created as a result. It is a significant piece of infrastructure that demands a revisiting of the existing strategic framework for Sydney and New South Wales. As we speak, NSW Planning and Environment are updating the draft Metropolitan Strategy for Sydney to 2031 to incorporate the opportunities of the second airport at Badgerys Creek. The intermodal requirements of Western Sydney are a key consideration when discussing Sydney's second airport. The Badgerys Creek airport freight traffic would enhance existing land freight activity in Western Sydney. There are substantial efficiency opportunities when intermodals and international airports are co-located. This would create a strategic intermodal transportation hub connected to the outer Sydney Orbital and the rail network, and would potentially provide world-class global logistics to international and domestic transportation companies, while also being more cost effective. An intermodal would generate economic activity at the airport site from its first day of operation. Source: Information sourced from Liverpool Council Website

Liverpool Final Report
__________________________________________________________________________________________________________________
_______________________________________________________________________________ Southern Alliance Valuation Services Pty Ltd – Liverpool Final Report – BD 1 July 2015 Page 21 of 63
4.0 IDENTIFIED SIGNIFICANT CHANGES IN USE OR DEVELOPMENTS OF PROPERTY AND OTHER FACTORS WHICH MAY AFFECT VALUATIONS (Cont.)
4.4 Badgerys Creek – Western Sydney Airport
The Australian Government has confirmed that the site for Western Sydney's airport will be Badgerys Creek. The government has suggested that construction is expected to begin in 2016 and will be completed by mid-2020s. During the peak of the construction an estimated will 4000 jobs will be generated. The airport at Badgerys Creek is proposed to start out as a smaller sized airport with a single runway which will serve the expected moderate demand in the short term, but eventually will develop into a full scale airport with parallel runways as demand increases. The predicted initial cost of building the airport will be in the order of $2.4 billion based on estimated in the Joint Study on aviation capacity in the Sydney region, of which the majority of the investment is expected to come from the private sector. The Federal Government is expected to take the lead on facilitating the surrounding infrastructure, primarily focussing on roads.
Source: Information sourced from Liverpool Council Website 4.4.1 Western Sydney Airport Timeline
Date Event 1980s – 1990s Land at Badgerys Creek purchased by the Australian Government
1985 Environmental Impact Statement (EIS) produced, planning restrictions introduced
1997 – 1999 Second EIS produced 2012 – 2013 Site viability studies (assessing 80 locations a 18 sites in NSW) April 2014 Badgerys Creek announced as site for a Western Sydney Airport
2014 – 2016 Detailed planning and preparation underway, including the Airport Plan, EIS and meeting right of first refusal requirements
2014 – 2024 Road works progressing in Western Sydney Mid 2020s Operations could commence (single runway) Around 2050 Second runway potentially operational
4.4.2 Planning an airport for Western Sydney
Long-standing planning restrictions around the Badgerys Creek site—many in place for more than 30 years—have been designed to provide a buffer between the proposed airport and urban development. Unlike Sydney (Kingsford Smith) Airport, which is surrounded by built up areas, the nearest suburban residential area to a Western Sydney Airport will be kilometres away, making an airport in Western Sydney the most buffered of all of the major Australian airports. As a result, Western Sydney will be able to compete on an equal footing with its competition in Queensland and Victoria by having an airport operating on a curfew-free basis.
Liverpool Final Report
__________________________________________________________________________________________________________________
_______________________________________________________________________________ Southern Alliance Valuation Services Pty Ltd – Liverpool Final Report – BD 1 July 2015 Page 22 of 63
4.0 IDENTIFIED SIGNIFICANT CHANGES IN USE OR DEVELOPMENTS OF PROPERTY AND OTHER FACTORS WHICH MAY AFFECT VALUATIONS (Cont.) Curfew-free airports provide significant benefits to communities and businesses by supporting growth in not only local, but also regional and national economies. Melbourne Airport suggests its curfew-free status allows for the movement of an extra two million passengers a year and adds $590 million to the Victorian economy through visitor spending.
The Australian and NSW governments in partnership have already committed more than $3.6 billion to a 10-year road investment plan for Western Sydney, and planning has ensured an airport would expand to meet growing demand. The first steps towards this future are already being taken.
A draft Airport Plan and draft Environmental Impact Statement have been prepared and are now available for community comment until 18 December 2015. More information is available on the draft Airport Plan page and the draft EIS page.
Work has already begun on Stage one of the Bringelly Road upgrade and on the Werrington Arterial Road.
A rail corridor and station on the airport site are being planned. In parallel, Transport for NSW has already commenced consultation with the community to identify a suitable passenger rail corridor option to serve the proposed airport and the surrounding area.
It is expected work on the site could commence in 2016 with operations at the proposed airport planned to commence in the mid-2020s.
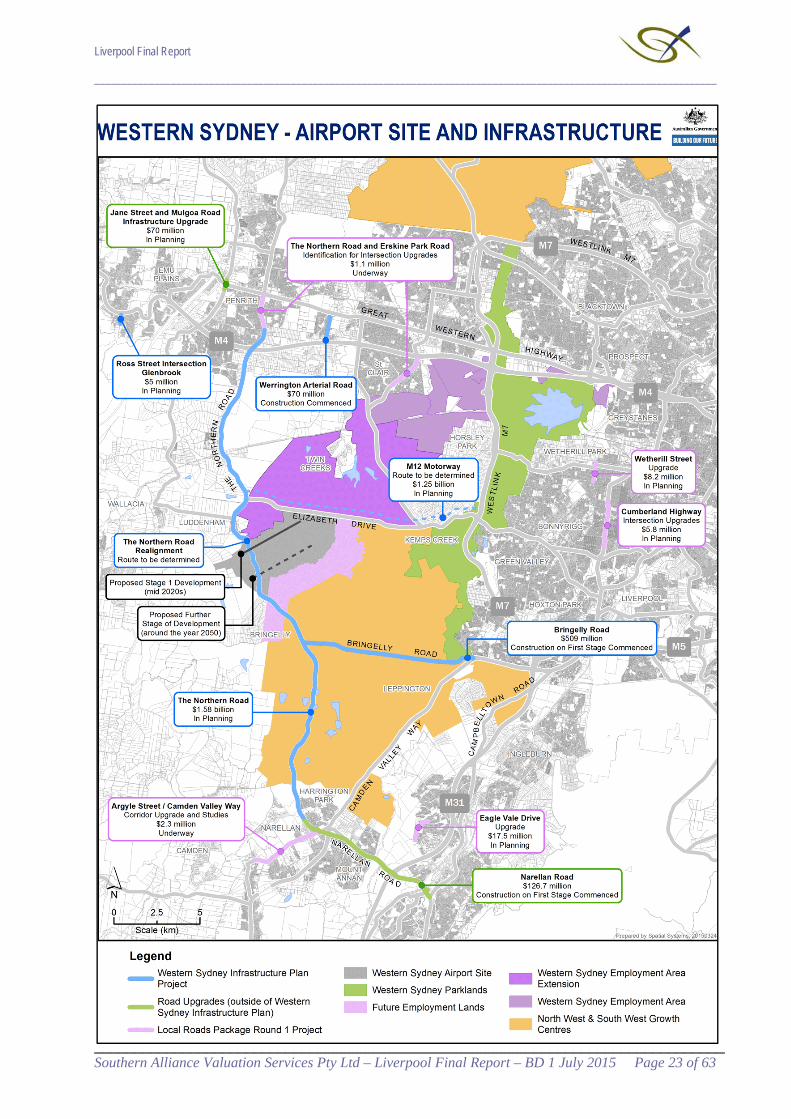
Note: A picture on the following page delineates the Wester Sydney (Badgerys Creek) Airport site and the commenced / proposed infrastructure upgrades to the surrounding area. Source: Information sourced from http://westernsydneyairport.gov.au/about.aspx
Liverpool Final Report
__________________________________________________________________________________________________________________
_______________________________________________________________________________ Southern Alliance Valuation Services Pty Ltd – Liverpool Final Report – BD 1 July 2015 Page 23 of 63

Liverpool Final Report
__________________________________________________________________________________________________________________
_______________________________________________________________________________ Southern Alliance Valuation Services Pty Ltd – Liverpool Final Report – BD 1 July 2015 Page 24 of 63
4.0 IDENTIFIED SIGNIFICANT CHANGES IN USE OR DEVELOPMENTS OF PROPERTY AND OTHER FACTORS WHICH MAY AFFECT VALUATIONS (Cont.)
4.5 Property Market Overview Australia’s residential property market exhibited mixed levels of growth over the 2014/15 financial year. The CoreLogic RP Data Home Value Index illustrates the combined capital city index rose 9.8% over the 12 months ending 30 June 2015. According to the index, Sydney residential properties showed an increase of 16.2% over the 12 months ending 30 June 2015 with Melbourne being the closest capital city to Sydney in terms of growth recording 10.2% over the same period. It is evident that the Sydney and Melbourne property markets have continued to increase in value at a faster pace than other Australian capital cities over the 2014/15 financial year. Some pockets of Sydney and noticeably some components of the Liverpool LGA had recorded stronger growth than others, however as a whole the Liverpool LGA moved homogenously showing considerable growth. The continued growth in the Sydney and Melbourne property markets and the imbalance between owner-occupied finance vs. investor finance has drawn the attention of regulatory bodies including the Australian Prudential Regulation Authority (APRA). APRA highlighted in December 2014 that authorised deposit-taking institutes (ADIs) must not exceed growth in investor loans above 10% per annum. Furthermore, in July 2015 APRA announced an increase in capital requirements for Australian residential mortgage exposures under the internal ratings-based (IRB) approach which would see the average risk weight of residential mortgage exposures using the IRB approach increase to at least 25% by mid-2016, from an average of around 17% at the end of June 2015. All big four banks (ANZ, NAB, Westpac & Commonwealth) increased the variable interest rates on residential investor loans between 0.27 and 0.29 percentage points over the two weeks ending 4 August 2015. Westpac notes the increases are a response following the introduction of investor lending growth benchmarks set by APRA. Furthermore, from 14 October 2015 to 23 October 2015, all big four banks increased their variable interest rates on residential owner-occupier and investor home loans between 15 and 20 basis points – with all four banks citing the decision was partly attributable to the requirement to increase the amount of capital applied to residential mortgages.
SQM Research has reported a notable increase in Sydney residential property listings over the year ending September 2015, whilst the national listing numbers declined over the same period. SQM noted Sydney residential listing numbers rose 7.6% over the month of September 2015 and rose 11.1% over the 12 months ending 30 September 2015 compared to the national residential listing numbers decreasing 0.1% over the 12 months ending 30 September 2015. Furthermore, Australian Property Monitors (APM) research indicates Sydney’s residential auction clearance rates last peaked at 89% in May / June 2015 which have since steadily declined to a clearance rate of 65% on Saturday 17 October. Expanding on the above, the information suggest that some of the heat of the Sydney residential property market – which was exhibited in the first half of 2015 – may have dissipated in recent months. However, as at date of report, there is no available information to suggest that in recent months the above has had any direct impact on residential property values.

Liverpool Final Report
__________________________________________________________________________________________________________________
_______________________________________________________________________________ Southern Alliance Valuation Services Pty Ltd – Liverpool Final Report – BD 1 July 2015 Page 25 of 63
4.0 IDENTIFIED SIGNIFICANT CHANGES IN USE OR DEVELOPMENTS OF PROPERTY AND OTHER FACTORS WHICH MAY AFFECT VALUATIONS (Cont.) Overall, retail property has benefited from an uplift in family net worth, driven by the increases in residential dwelling values, which help support discretionary spending and spending on consumer / household goods. Density / development sites continued to perform well over the 2014/15 financial year. Generally, residential development continues to outprice commercial development as the highest and best use and as such, sites with residential development potential remain in high demand across the Sydney Metropolitan Area. Industrial property across the Liverpool LGA was fairly subdued over the 2015 financial year. Industrial properties in the Liverpool LGA largely recorded mixed levels of growth, with (in-general terms) industrial sites situated to the ‘East of Liverpool CBD’ performing better than those sites situated to the ‘West of Liverpool CBD’. Individual pockets can move against the trend for varying reasons, however on the whole properties within the Liverpool LGA were relatively consistent. 4.6 Economy Overview
The following statement was issued by the Reserve Bank of Australia for the monetary policy decision held 7 July 2015 and provides a concise summary on the outlook for national and global economies as at the 2015 base date:- International Economic Conditions:
The Board's discussion about economic conditions opened with the observation that economic growth in Australia's major trading partners appeared to have been around average in the June quarter. Consumption growth had been little changed for most trading partners in recent months, although it was perhaps a bit stronger in the United States and somewhat weaker in China. The level of consumption in Japan remained well below that seen prior to the increase in the consumption tax in 2014. Core inflation rates had been stable in year-ended terms over recent months and remained below the targets of most central banks. Members also observed that trade volumes, particularly within the Asian region, appeared to have fallen recently. Consistent with this observation, growth in industrial production across a number of east Asian economies had slowed a little.
In China, there had been little change in the monthly indicators of economic activity, although conditions had been a bit more positive in some sectors than early in 2015. The Chinese property market had improved somewhat; residential property prices overall had risen for the first time in a year and floor space sold had increased in the past few months. Members reflected that the recent easing in monetary conditions would provide additional support to the property market and growth more broadly, although it could be some time before a significant pick-up in construction activity began. Recent efforts by central government authorities to increase infrastructure investment further and reform local government financing arrangements were also expected to support investment.
Commodity prices overall had fallen since the previous meeting, driven by iron ore and oil prices. Growth in crude steel production had been modest and steel prices had fallen noticeably over the past month. Iron ore production in China had continued to decline. Shipments of iron ore from Australia and Brazil appeared to have increased in June, which contributed to lower iron ore prices over the past month.

Liverpool Final Report
__________________________________________________________________________________________________________________
_______________________________________________________________________________ Southern Alliance Valuation Services Pty Ltd – Liverpool Final Report – BD 1 July 2015 Page 26 of 63
4.0 IDENTIFIED SIGNIFICANT CHANGES IN USE OR DEVELOPMENTS OF PROPERTY AND OTHER FACTORS WHICH MAY AFFECT VALUATIONS (Cont.)
Following quite strong output growth in Japan in the March quarter, more timely indicators pointed to modest growth in the June quarter. Labour market conditions had continued to improve, resulting in the unemployment rate falling further and the ratio of jobs to applicants continuing to rise. Wage growth and financial market measures of inflation expectations were higher than a year earlier and were expected to feed into higher core inflation over time. Members considered the importance for Japan of policy reforms designed to address some longer-term structural challenges, such as the ageing of the population.
In the United States, recent data pointed to moderate growth in economic activity in the June quarter following weakness in the March quarter. The labour market had strengthened further, with growth in non-farm payrolls employment rebounding in April and May and the unemployment rate falling. While there had been some increase in measures of wage growth, core measures of inflation remained below the Federal Reserve's inflation target.
In the euro area, the available indicators pointed to modest economic growth and above-average sentiment in the June quarter, continuing the recent trend of improved conditions in the euro area as a whole. Members noted that exports had made a significant contribution to the pick-up in growth in the region but investment was still well below the levels seen prior to the global financial crisis. The unemployment rate had continued to fall modestly since its peak two years earlier, but varied sharply across the euro area; the unemployment rate was highest in Greece, where output was more than 25 per cent below its level prior to the financial crisis.
Domestic Economic Conditions:
Members noted that output had increased by 0.9 per cent in the March quarter and by 2.3 per cent over the year. Resource exports had made a significant contribution to growth, reflecting better-than-usual weather conditions in the quarter. Dwelling investment had remained strong and while consumption growth had picked up over the past year or so, it had remained below average. Business investment had contracted in the quarter and there had been little growth in public demand. More recent economic indicators suggested that domestic demand had continued to grow at a below-average pace over recent months, but that labour market conditions had continued to improve.
Members observed that consumption grew faster than household income over the year to the March quarter. As a result, the saving ratio had declined further, although it remained well above the level it had been over much of the past 25 years. Year-ended growth in retail sales had been little changed over recent months and liaison suggested that this was likely to have continued into June. Retail sales growth had been relatively strong in New South Wales and Victoria but weaker in Queensland and Western Australia, in line with observed differences in economic conditions across the country. At the same time, surveys indicated that consumers had viewed their financial situation as being above average over the past year, notwithstanding the relatively weak growth in labour incomes. Members observed that this was likely to reflect the very low level of interest rates and strong growth in net household wealth.

Liverpool Final Report
__________________________________________________________________________________________________________________
_______________________________________________________________________________ Southern Alliance Valuation Services Pty Ltd – Liverpool Final Report – BD 1 July 2015 Page 27 of 63
4.0 IDENTIFIED SIGNIFICANT CHANGES IN USE OR DEVELOPMENTS OF PROPERTY AND OTHER FACTORS WHICH MAY AFFECT VALUATIONS (Cont.)
Dwelling investment increased by 9 per cent over the year to the March quarter. An increase in the construction of new dwellings accounted for most of this growth, but the alterations and additions component had also contributed more recently, recording the first increase in a year in the March quarter. Forward-looking indicators pointed to further strong growth in dwelling investment in the period ahead. Members noted that there had been ongoing divergence in conditions in established housing markets across the country, as well as between houses and apartments. Housing prices had continued to rise rapidly in Sydney and to a lesser extent in Melbourne. Elsewhere, there had been little change in housing prices over the past six months or so. Prices of apartments had been growing less rapidly than those of houses, which members considered to be consistent with the relatively strong growth in the supply of higher-density housing in many capital cities.
Growth in housing credit overall had been stable over recent months at around 7 per cent on an annualised basis, while growth in lending to investors had been steady at a bit above 10 per cent. Members observed that the household debt-to-income ratio, calculated by netting funds held in mortgage offset accounts from total household debt to the financial sector, had increased over the year to March but had not exceeded previous peaks. Members discussed the fact that high housing prices had different implications for existing home owners, who benefited from increased wealth, and potential new home owners, who were finding it more difficult to finance a home purchase.
Investment in both the mining and non-mining sectors appeared to have fallen in the March quarter, although the split between the two components remained subject to some uncertainty. Profits for non-mining firms had increased by 6 per cent over the past year. More recent survey measures of business conditions, confidence and capacity utilisation had picked up to be around, or even above, their long-run averages. In contrast, private non-residential building approvals had remained weak.
The monthly trade data suggested that resource exports, including iron ore and coal, had declined in the June quarter. Coal exports had been affected by the severe storms in the Hunter region of New South Wales in late April. Members noted that there had been further signs of growth in service exports, in part a response to the depreciation of the exchange rate. Over the past year, net service exports had made a similar contribution to output growth as exports of iron ore, even though total import volumes had increased in the March quarter.
Labour force data indicated further signs of improvement in May. Employment growth had picked up over the year to exceed the rate of population growth. As a result, the unemployment rate had been relatively stable since the latter part of 2014 and had fallen slightly in May to 6 per cent. Members observed that employment growth had been strongest in household services and that employment and vacancies had been growing for business services but had remained little changed in the goods sector. As with other state-based indicators, employment growth and job vacancies had been strongest in New South Wales and Victoria. Forward-looking labour market indicators had been somewhat mixed over recent months. The ABS measure of firms' job vacancies overall suggested that demand for labour could be sufficient to maintain a stable or even falling unemployment rate in the near term, while other forward-looking indicators suggested only modest growth in employment in coming months.
Liverpool Final Report
__________________________________________________________________________________________________________________
_______________________________________________________________________________ Southern Alliance Valuation Services Pty Ltd – Liverpool Final Report – BD 1 July 2015 Page 28 of 63
4.0 IDENTIFIED SIGNIFICANT CHANGES IN USE OR DEVELOPMENTS OF PROPERTY AND OTHER FACTORS WHICH MAY AFFECT VALUATIONS (Cont.)
Members noted that the latest estimates indicated that the population had increased by 1.4 per cent over the year to the December quarter, down from a peak rate of growth of 1.8 per cent over 2012. The slower growth was primarily accounted for by a decline in net immigration, which was particularly pronounced in Western Australia and Queensland, consistent with weaker economic conditions in those states. Members observed that the lower-than-expected growth in the population helped to reconcile the below-average growth in output over the past year with a broadly steady unemployment rate.
Despite recent improvements in labour market indicators, members reflected that there was still evidence of spare capacity in the labour market. Consistent with this, the latest national accounts data indicated that non-farm average earnings per hour had recorded the lowest year-ended outcomes since the early 1990s and that unit labour costs had been little changed for around four years.
Financial Markets:
International financial markets were mainly focused on developments in Greece and the fall in Chinese equity markets over the past month.
Members were briefed on recent developments in Greece. The ‘no’ vote in the referendum on the creditors' latest proposals raised several issues, first among which was how the Greek authorities could reopen the banks. A critical vulnerability in the near term was related to whether the European Central Bank would provide additional emergency liquidity assistance. A second issue was how Greece would be able to service its external debt and a third was the challenges faced by the Greek authorities in improving the competitive position of the economy. Although these issues were of great concern to the Greek populace, the direct economic implications for the global economy and Australia were assessed by members to be relatively limited. They noted that the reaction of financial markets to these developments had been fairly muted. This was consistent with the economic and financial exposures to Greece – apart from the official sector's financial exposure – being quite low.
Members noted that spreads to 10-year German Bunds on comparable bonds issued by Italy, Spain and Portugal had not risen much, with the limited contagion from developments in Greece likely to have reflected a general view of markets that previous adjustment policies in those countries had been relatively successful.
Members then turned their discussion to developments in bond markets more generally. Yields on longer-maturity German Bunds and US Treasuries had risen sharply over the first half of June, with German 10-year yields reaching 1 per cent, compared with a historic low of 8 basis points in mid April. German yields declined somewhat following the announcement of the Greek referendum. Longer-term sovereign yields of most other developed countries, including Australia, tended to move in line with US Treasuries. Expectations about the timing of the US Federal Reserve's first increase in the federal funds rate were little changed over the past month. Market pricing continued to suggest that the first increase would occur around the end of 2015. Although commentary by Federal Reserve officials suggested that it could be a little sooner than that, they continued to emphasise that the exact timing of the first increase would be less important than the pace of subsequent increases, which were expected to be gradual.

Liverpool Final Report
__________________________________________________________________________________________________________________
_______________________________________________________________________________ Southern Alliance Valuation Services Pty Ltd – Liverpool Final Report – BD 1 July 2015 Page 29 of 63
4.0 IDENTIFIED SIGNIFICANT CHANGES IN USE OR DEVELOPMENTS OF PROPERTY AND OTHER FACTORS WHICH MAY AFFECT VALUATIONS (Cont.)
The People's Bank of China (PBC) eased monetary policy further in June by cutting benchmark deposit and lending rates by 25 basis points, citing low inflation and a consequent increase in real interest rates. In addition, the PBC announced cuts to the reserve requirement ratio for selected financial institutions. The Chinese authorities had also announced a proposal to allow banks more flexibility in their choice of funding mix and asset allocation, which could lead to an increase in the supply of credit over time.
The Reserve Bank of New Zealand lowered its policy rate by 25 basis points, to 3.25 per cent, citing the decline in New Zealand's terms of trade and the disinflationary effect of stronger-than-expected labour force growth.
Global equity markets fell by 3 per cent over the course of June, with broad-based falls and price movements generally tending to reflect fluctuations in sentiment about Greece. The Chinese equity market also fell sharply in June, partly in response to what was only a modest tightening of restrictions on margin lending. Mainland share prices were still well above their levels of a year earlier but the sharpness of the recent fall prompted the Chinese authorities to announce a number of measures, including an indefinite suspension of initial public offerings, an equity stabilisation fund and a funding facility for brokers. The Australian equity market underperformed several other advanced economy markets in June, mainly reflecting falls in resources and consumer sector share prices.
Global foreign exchange markets were relatively subdued in June. The euro recorded only a modest and short-lived fall when markets opened after the announcement of the Greek referendum result. The Australian dollar was 3 per cent lower against the US dollar and on a trade-weighted basis.
Corporate bond issuance in Australia had been strong over the course of 2015 to date, particularly by resource companies, although much of the increase reflected refinancing.
Pricing of Australian money market instruments suggested that the cash rate target was expected to remain unchanged at the present meeting.
4.7 Court Cases The High Court decision Maurici v Deputy Commissioner of Land Tax requires that the valuation be made free of any influence of scarcity. In effect, the valuer is required to have regard to the whole market and not just the vacant land sales. In order to fulfil this requirement Southern Alliance Valuation Services Pty Ltd had regard to all the sales evidence.

Liverpool Final Report
__________________________________________________________________________________________________________________
_______________________________________________________________________________ Southern Alliance Valuation Services Pty Ltd – Liverpool Final Report – BD 1 July 2015 Page 30 of 63
5.0 ADDED VALUE OF IMPROVEMENTS
5.1 Residential
In addition to vacant land sales, improved sales were used to assist in determining the market levels for land values and to negate any possibility of a scarcity factor. The ‘Paired Sales Approach’ was used throughout the Liverpool LGA whereby, the land value demonstrated by vacant land sales is to be taken from the sale price of improved properties to determine the added value of the improvements.
The table below details the results from this analysis for the Liverpool local government area. The schedule provided is general in nature and each analysed sale is assessed individually when determining the added value of improvements to capture specific features e.g. renovations, pools, landscaping, no. of levels, topography etc.
Rates Per Square Metre ($/m2) Adopted from Paired Analysis
Property Type Size (m2) Condition
Very Poor
Poor Average Good Very Good
Superior
Fibrous Cement, Weatherboard,
Permalum Clad, etc.
0-89 250-425
425-725
450- 750
475-775
500-800
550- 850
90-115 250-425
425-725
450- 750
475-775
500-800
550- 850
116-145 250-425
425-725
450- 750
475-775
500-800
550- 850
Brick (before 1900)
Victorian Style
0-89 350-800
800-1000
850-1100
900-1200
950-1300
1000-1400
90-115 300-700
700-900
750-1000
800-1100
850-1200
900-1300
116-145 250-600
600-800
650- 900
700-1000
750-1100
800-1200
146-195 200-500
500-700
550- 800
600-900
650-1000
700-1100
196-350 200-400
400-600
450- 700
500-800
550-900
600-1000
Brick (1900 – 1920)
Federation Style
0-89 350-800
800-1000
850-1100
900-1200
950-1300
1000-1400
90-115 300-700
700-900
750-1000
800-1100
850-1200
900-1300
116-145 250-600
600-800
650- 900
700-1000
750-1100
800-1200
146-195 200-500
500-700
550- 800
600-900
650-1000
700-1100
196-350 200-400
400-600
450- 700
500-800
550-900
600-1000

Liverpool Final Report
__________________________________________________________________________________________________________________
_______________________________________________________________________________ Southern Alliance Valuation Services Pty Ltd – Liverpool Final Report – BD 1 July 2015 Page 31 of 63
5.0 ADDED VALUE OF IMPROVEMENTS (Cont.)
Property Type Size (m2) Condition
Very Poor
Poor Average Good Very Good
Superior
Brick (1920 – 1950)
California Bungalow and
Art Deco
0-89 350-800
800-1000
850-1100
900-1200
950-1300
1000-1400
90-115 300-700
700-900
750-1000
800-1100
850-1200
900-1300
116-145 250-600
600-800
650- 900
700-1000
750-1100
800-1200
146-195 200-500
500-700
550- 800
600-900
650-1000
700-1100
196-350 200-400
400-600
450- 700
500-800
550-900
600-1000
Brick (1950 - 1970) Post WWII
Style
0-89 350-900
700-950
950-1300
1000-1400
1050-1500
1100-1600
90-115 300-800
600-850
850-1200
900-1300
950-1400
1000-1500
116-145 250-700
500-750
750-1100
800-1200
850-1300
900-1400
146-195 200-600
450-650
650-1000
700-1100
750-1200
800-1300
196-350 200-500
400-550
550- 900
600-1000
650-1100
700-1200
Brick (1970 – 1990)
0-89 400-950
800-1200
1050-1500
1100-1600
1150-1700
1200-1800
90-115 350-900
700-1100
950-1400
1000-1500
1050-1600
1100-1700
116-145 300-800
600-1000
850-1300
900-1400
950-1500
1000-1600
146-195 250-700
500-900
750-1200
800-1300
850-1400
900-1500
196-350 200-600
400-800
650-1100
700-1200
750-1300
800-1400
Brick (1990 – Present)
0-89 500-1000
1000-1700
1700-2200
1900-2400
2100-2600
2300-2800
90-115 450-900
900-1500
1500-2000
1700-2200
1900-2400
2000-2600
116-145 400-800
800-1300
1300-1800
1500-2000
1700-2200
1900-2400
146-195 350-700
700-1100
1100-1600
1300-1800
1500-2000
1700-2200
196-350 300-600
600-900
900-1400
1100-1600
1300-1800
1600-2100

Liverpool Final Report
__________________________________________________________________________________________________________________
_______________________________________________________________________________ Southern Alliance Valuation Services Pty Ltd – Liverpool Final Report – BD 1 July 2015 Page 32 of 63
5.0 ADDED VALUE OF IMPROVEMENTS (Cont.)
Rates Per Square Metre ($/m2) Adopted from Paired Analysis
Property Type Size (m2) Condition
Very Poor
Poor Average Good Very Good
Superior
Project Home Presentation
(Modern)
0-89 500-1500
1500-2200
1900-2400
2100-2600
2300-2800
2500-3000
90-115 450-1300
1300-2000
1700-2200
1900-2400
2100-2600
2300-2800
116-145 400-1100
1100-1800
1500-2000
1700-2200
1900-2400
2100-2600
146-195 350-900
900-1600
1300-1800
1500-2000
1700-2200
1900-2400
196-350 300-700
700-1400
1100-1600
1300-1800
1500-2000
1700-2200
Architectural Design
(Modern)
0-89 1000-2000
2000-3400
3400-4100
3600-4400
3800-4700
4000-5000
90-115 850-1850
1850-3150
3150-3850
3350-4150
3550-4450
3750-4750
116-145 700-1700
1700-2900
2900-3600
3100-3900
3300-4200
3500-4500
146-195 550-1550
1550-2650
2650-3350
2850-3650
3050-3950
3250-4250
196-350 400-1400
1400-2400
2400-3100
2600-3400
2800-3700
3000-4000

Liverpool Final Report
__________________________________________________________________________________________________________________
_______________________________________________________________________________ Southern Alliance Valuation Services Pty Ltd – Liverpool Final Report – BD 1 July 2015 Page 33 of 63
5.0 ADDED VALUE OF IMPROVEMENTS (Cont.) 5.1.1 Paired Analysis Examples of Paired Analysis within Liverpool Local Government Area:
Vacant Site sale at 3 Ethan Close, Luddenham.
Sold 24 May 2015 for $450,000 (sold with DA Approval – adjusted sale price $410,000). Dimensions: 26.78 IRR / 29.68 x 24.72 / 23.86. Area: 700.1m2.
Paired with:- 4 Wade Close, Luddenham. Sold 15 May 2015 for $835,000. Dimensions: 21.6 IRR / 21.08 x 24.76 IRR / 29.98. Area: 599.9m2.
Modern, circa 2008, single storey dwelling, constructed from brick with tile roof and concrete slab foundation. Accommodation generally consists of 4 bedrooms, 2 bathrooms and a DLUG UMR. Overall, property is of very good condition/quality throughout. Property has rear/side undercover entertaining area with deck. GBA: 220m2 (approx.), excluding garage 36m2 (approx.) and rear entertaining area 30m2. After allowing for size, location, date, topography etc. shows $385,000 (equates to $1,750/m2) for this type of improvement and $54,000 for existing garage, entertaining area, driveways, paths, landscaping and fencing – Total: $439,000. Or paired with:- 3 Wade Close, Luddenham. Sold 10 March 2015 for $850,000. Dimensions: 26.92 / 28.92 x 21.62 / 32.19. Area: 724m2.
Modern, circa 2000’s, single storey dwelling, constructed from brick with tile roof and concrete slab foundation. Accommodation generally consists of 4 bedrooms, 2 bathrooms and a TLUG UMR. Overall, property is of good condition/quality throughout. Property has rear undercover entertaining area with deck. GBA: 250m2 (approx.), excluding garage 60m2 (approx.) and rear entertaining area 35m2. After allowing for size, location, date, topography etc. shows $387,500 (equates to $1,550/m2) for this type of improvement and $57,500 for existing garage, entertaining area, driveways, paths, landscaping and fencing – Total: $445,000.

Liverpool Final Report
__________________________________________________________________________________________________________________
_______________________________________________________________________________ Southern Alliance Valuation Services Pty Ltd – Liverpool Final Report – BD 1 July 2015 Page 34 of 63
5.0 ADDED VALUE OF IMPROVEMENTS (Cont.) Vacant Site sale at 37 Brickmakers Drive, Moorebank.
Sold 1 April 2015 for $425,000. Dimensions: 10 IRR / 15.455 IRR x 31.98 / 29.1. Area: 389m2.
Paired with:-
10A Wellwood Avenue, Moorebank. Sold 29 August 2015 for $575,000. Dimensions: 10 x 25.25. Area: 252.2m2.
Circa 1990’s, double storey attached dual occupancy, constructed from brick with tile roof and concrete slab foundation. Accommodation generally consists of 3 bedrooms, 1 bathroom and a SLUG UMR. Overall, property is original throughout and in average condition. Property has rear undercover entertaining area. GBA: 120m2 (approx.), excluding garage 20m2 (approx.) and rear entertaining area 20m2. After allowing for size, location, date, topography etc. shows $168,000 (equates to $1,400/m2) for this type of improvement and $22,000 for existing garage, entertaining area, driveways, paths, landscaping and fencing – Total: $190,000.
Or paired with:-
222 B Nuwarra Road, Moorebank. Sold 13 March 2015 for $543,000. Dimensions: 7.435 / 14.255 x 31 / 33.57 IRR. Area: 296.8m2.
Circa 1990’s, single storey dwelling, constructed from brick with tile roof and concrete slab foundation. Accommodation generally consists of 3 bedrooms, 1 bathroom and an attached double car port. Overall, property in original and average condition. Partly updated kitchen: new cook top and oven. GBA: 95m2 (approx.) excluding attached double car port (25m2). After allowing for size, location, date, topography etc. shows $142,500 (equates to $1,500/m2) for this type of improvement and $18,000 for existing car port, driveways, paths, landscaping and fencing – Total: $160,500.
Vacant Site sale at 17 Melaleuca Place, Prestons.
Sold 26 May 2015 for $329,000. Dimensions: 14.72 / 11.92 x 32 / 32.175. Area: 411.4m2.
Paired with:-
14 Mahogany Street, Prestons. Sold 2 March 2015 for $617,000. Dimensions: 13.46 / 13.41 x 34.12 /32.99. Area: 450m2.
Circa 1990’s, single storey dwelling, constructed from brick with tile roof and concrete slab foundation. Accommodation generally consists of 4 bedrooms, 2 bathrooms and a DLUG UMR. Overall, property in original and average condition. GBA: 162m2 (approx.) excluding garage (36m2). After allowing for size, location, date, topography etc. shows $202,500 (equates to $1,250/m2) for this type of improvement and $30,400 for existing garage, driveways, paths, landscaping and fencing – Total: $232,900.

Liverpool Final Report
__________________________________________________________________________________________________________________
_______________________________________________________________________________ Southern Alliance Valuation Services Pty Ltd – Liverpool Final Report – BD 1 July 2015 Page 35 of 63
5.0 ADDED VALUE OF IMPROVEMENTS (Cont.) Vacant Site sale at 29 Arras Place, Prestons.
Sold 12 September 2014 for $310,000. Dimensions: 15.04 / 15.05 x 27.27 / 26.98. Area: 407.9m2.
Paired with:-
14 Arras Place, Prestons. Sold 25 October 2014 for $690,000. Dimensions: 19.44 IRR / 17.27 x 29.7 / 27.69. Area: 450.6m2.
Circa 2003, double storey dwelling, constructed from brick with tile roof and concrete slab foundation. Accommodation generally consists of 4 bedrooms, 2 bathrooms and a DLUG UMR. Overall, property in original and good condition throughout. GBA: 195m2 (approx.) excluding garage (36m2), front verandah & balcony (23m2) and rear covered entertaining area (23m2). After allowing for size, location, date, topography etc. shows $312,000 (equates to $1,600/m2) for this type of improvement and $52,000 for existing garage, driveways, paths, landscaping and fencing – Total: $364,000.
Or paired with:-
10 Moy Close, Prestons. Sold 8 December 2014 for $687,500. Dimensions: 15 x 30.5. Area: 450.7m2.
Circa 2003, single storey dwelling, constructed from brick with tile roof and concrete slab foundation. Accommodation generally consists of 5 bedrooms, 2 bathrooms and a DLUG UMR. Overall, property in original and good condition throughout. GBA: 205m2 (approx.) excluding garage (33m2) and rear covered entertaining area with inbuilt BBQ and pizza oven (25m2). After allowing for size, location, date, topography etc. shows $317,750 (equates to $1,550/m2) for this type of improvement and $42,200 for existing garage, driveways, paths, landscaping and fencing – Total: $359,950.

Liverpool Final Report
__________________________________________________________________________________________________________________
_______________________________________________________________________________ Southern Alliance Valuation Services Pty Ltd – Liverpool Final Report – BD 1 July 2015 Page 36 of 63
5.0 ADDED VALUE OF IMPROVEMENTS (Cont.) Vacant Site sale at 58 Inverell Avenue, Hinchinbrook.
Sold 20 May 2015 for $435,000. Dimensions: 12.5 x 30.035. Area: 375.5m2.
Paired with:-
26A Collarenebri Road, Hinchinbrook. Sold 15 June 2015 for $575,000. Dimensions: 10.9 IRR / 10.75 x 28.8 / 27.98. Area: 305.8m2.
Circa 1990’s, single storey dwelling, constructed from brick with tile roof and concrete slab foundation. Accommodation generally consists of 3 bedrooms, 2 bathrooms and a SLUG UMR. Overall, property in original and average condition throughout. GBA: 105m2 (approx.) excluding garage (17m2) and front entry/porch (5m2). After allowing for size, location, date, topography etc. shows $162,750 (equates to $1,550/m2) for this type of improvement and $22,500 for existing garage, porch, driveways, paths, landscaping and fencing – Total: $185,250.
Or paired with:-
5 Tingha Close. Sold 1 June 2015 for $637,500. Dimensions: 14.5 IRR / 14.97 x 25.62 IRR / 24.79. Area: 354.9m2.
Circa 1990’s, double storey dwelling, constructed from brick with tile roof and concrete slab foundation. Accommodation generally consists of 4 bedrooms, 2 bathrooms and a DLUG UMR. Overall, property in original and average condition throughout. GBA: 150m2 (approx.) excluding garage (36m2) and rear extension / internal living area (40m2). After allowing for size, location, date, topography etc. shows $172,500 (equates to $1,150/m2) for this type of improvement and $56,400 for existing garage, extension/living area, driveways, paths, landscaping and fencing – Total: $228,900.
Vacant Site sale at 3A Government Road, Hinchinbrook.
Sold 8 October 2014 for $320,000. Dimensions: 11.58 / 11.06 x 25.425 / 28.86. Area: 300.2m2.
Paired with:-
2B Stannum Close, Hinchinbrook. Sold 26 November 2014 for $540,000. Dimensions: 14 x 22.05. Area: 308.2m2.
Circa 1990’s, single storey dwelling, constructed from brick with tile roof and concrete slab foundation. Accommodation generally consists of 3 bedrooms, 2 bathrooms and a SLUG UMR. Overall, property in original and average condition throughout. Kitchen appears to have been updated: new cooktop, oven and range hood. GBA: 115m2 (approx.) excluding garage (18m2) and rear entertaining area (15m2). After allowing for size, location, date, topography etc. shows $184,000 (equates to $1,600/m2) for this type of improvement and $28,200 for existing garage, entertaining area, driveways, paths, landscaping and fencing – Total: $212,200.

Liverpool Final Report
__________________________________________________________________________________________________________________
_______________________________________________________________________________ Southern Alliance Valuation Services Pty Ltd – Liverpool Final Report – BD 1 July 2015 Page 37 of 63
5.0 ADDED VALUE OF IMPROVEMENTS (Cont.) Vacant Site sale at 42 Mary Wade Place, Carnes Hill.
Sold 24 January 2015 for $449,000. Dimensions: 15 x 30. Area: 450m2.
Paired with:- 21 Wauchope Road, Carnes Hill. Sold 29 September 2014 for $620,000. Dimensions: 12.82 / 12.8 x 28.16 / 28.99. Area: 365.7m2.
Circa 2011, single storey dwelling, constructed from brick with tile roof and concrete slab foundation. Accommodation generally consists of 4 bedrooms, 2 bathrooms and a DLUG UMR. Overall, property in original and good condition/quality throughout. GBA: 140m2 (approx.) excluding garage (30m2). After allowing for size, location, date, topography etc. shows $231,000 (equates to $1,650/m2) for this type of improvement and $29,000 for existing garage, driveways, paths, landscaping and fencing – Total: $260,000. Or paired with:-
9 Wauchope Road, Carnes Hill. Sold 15 August 2015 for $765,000. Dimensions: 12.82 / 12.8 x 33.14 / 33.96. Area: 429.4m2.
Circa 2010, double storey dwelling, constructed from brick with tile roof and concrete slab foundation. Accommodation generally consists of 4 bedrooms, 3 bathrooms and a DLUG UMR. Overall, property in original and good condition/quality throughout. GBA: 220m2 (approx.) excluding garage (33m2) and front verandah & balcony (30m2). After allowing for size, location, date, topography etc. shows $308,000 (equates to $1,400/m2) for this type of improvement and $45,000 for existing garage, front verandah & balcony, driveways, paths, landscaping and fencing – Total: $353,000.
Vacant Site sale at 2A Wollomombi Way, Hoxton Park. Sold 14 March 2015 for $385,000. Dimensions: 17.85 IRR / 15.845 x 22.425 / 23.97. Area: 396.6m2.
Paired with:- 8 Merriwa Avenue, Hoxton Park. Sold 15 June 2015 for $775,000. Dimensions: 13.9 x 29. Area: 403.1m2.
Circa 1990’s, double storey dwelling, constructed from brick with tile roof and concrete slab foundation. Accommodation generally consists of 4 bedrooms, 3 bathrooms and a DLUG UMR. First floor addition circa 2005. Overall, property in good condition/quality throughout. In-ground pool. GBA: 210m2 (approx.) excluding garage (33m2), front verandah (10m2) and side entertaining area (15m2). After allowing for size, location, date, topography etc. shows $294,000 (equates to $1,400/m2) for this type of improvement and $71,000 for existing garage, in-ground pool, front verandah, entertaining area, driveways, paths, landscaping and fencing – Total: $365,000.

Liverpool Final Report
__________________________________________________________________________________________________________________
_______________________________________________________________________________ Southern Alliance Valuation Services Pty Ltd – Liverpool Final Report – BD 1 July 2015 Page 38 of 63
5.0 ADDED VALUE OF IMPROVEMENTS (Cont.)
Vacant Site sale at 25 Domain Boulevard, Prestons. Sold 13 July 2015 for $370,000. Dimensions: 12.02 / 12 x 33.255 / 33. Area: 396.2m2.
Paired with:- 86 Stansmore Avenue, Prestons. Sold 15 May 2015 for $745,000. Dimensions: 12 x 28.5. Area: 342m2.
Circa 2000, double storey dwelling, constructed from brick with tile roof and concrete slab foundation. Accommodation generally consists of 4 bedrooms, 2 bathrooms and a DLUG UMR. Overall, property in good condition/quality throughout. Rear covered deck / entertaining area. GBA: 215m2 (approx.) excluding garage (32m2) and rear deck (30m2). After allowing for size, location, date, topography etc. shows $322,500 (equates to $1,500/m2) for this type of improvement and $46,000 for existing garage, rear deck / entertaining area, driveways, paths, landscaping and fencing – Total: $368,500. Or paired with:-
29 Temora Street, Prestons. Sold 10 April 2015 for $690,000. Dimensions: 12 x 30.39. Area: 364.6m2.
Circa 2006, double storey dwelling, constructed from brick with tile roof and concrete slab foundation. Accommodation generally consists of 4 bedrooms, 2 bathrooms and a DLUG UMR. Overall, property in original and good condition/quality throughout. GBA: 230m2 (approx.) excluding garage (33m2) and front porch & balcony (16m2). After allowing for size, location, date, topography etc. shows $310,500 (equates to $1,350/m2) for this type of improvement and $40,900 for existing garage, front porch & balcony, driveways, paths, landscaping and fencing – Total: $351,500.

Liverpool Final Report
__________________________________________________________________________________________________________________
_______________________________________________________________________________ Southern Alliance Valuation Services Pty Ltd – Liverpool Final Report – BD 1 July 2015 Page 39 of 63
5.0 ADDED VALUE OF IMPROVEMENTS (Cont.)
Vacant Site sale at 15 Little John Street, Middleton Grange. Sold 17 August 2015 for $470,000. Dimensions: 12 x 32.635. Area: 391.6m2.
Paired with:- 58 Bird Walton Avenue, Middleton Grange. Sold 16 May 2015 for $655,000. Dimensions: 10 x 32. Area: 320m2.
Circa 2011, single storey (project home style) dwelling, constructed from brick with tile roof and concrete slab foundation. Accommodation generally consists of 3 bedrooms, 2 bathrooms and a SLUG UMR. Overall, property in original and good condition/quality throughout. GBA: 130m2 (approx.) excluding garage (17m2) and rear alfresco area (10m2). After allowing for size, location, date, topography etc. shows $227,500 (equates to $1,750/m2) for this type of improvement and $28,500 for existing garage, alfresco, driveways, paths, landscaping and fencing – Total: $256,000. Or paired with:-
Lot 3, DP1137409, Parer Avenue, Middleton Grange. Sold 21 July 2015 for $755,000. Dimensions: 14.16 IRR / 14 x 28.34 / 29.3. Area: 408.4m2.
Circa 2010, single storey (project home style) dwelling, constructed from brick with tile roof and concrete slab foundation. Accommodation generally consists of 4 bedrooms, 2 bathrooms and a DLUG UMR. Overall, property in original and good condition/quality throughout. GBA: 160m2 (approx.) excluding garage (33m2) and rear alfresco area (10m2). After allowing for size, location, date, topography etc. shows $256,000 (equates to $1,600/m2) for this type of improvement and $40,000 for existing garage, alfresco, driveways, paths, landscaping and fencing – Total: $296,000.

Liverpool Final Report
__________________________________________________________________________________________________________________
_______________________________________________________________________________ Southern Alliance Valuation Services Pty Ltd – Liverpool Final Report – BD 1 July 2015 Page 40 of 63
5.0 ADDED VALUE OF IMPROVEMENTS (Cont.) 5.2 Commercial / Retail / Industrial
Due to the lack of sufficient vacant land sales in the Liverpool LGA for the above zone categories, the Replacement Cost approach was applied when analysing sales evidence. The Replacement Cost approach is based upon the principle that the informed purchaser would pay no more than the cost to reproduce the sale property. Hence the methodology used on analysis is as follows:
Replacement Cost Methodology: Reasonable allowance for refurbishment costs added to the sale price to bring the
improvements to an as new replacement standard where the returns would be equivalent to as new.
An appropriate entrepreneurial profit and risk allowance. On average between 10% – 15% in the Liverpool valuation area.
Allowance for interest on funds during the hypothetical construct to completion period. This is inclusive of holding charges and construction costs. Depending on borrowings between 6% - 8.5% was applied.
The adjusted sale price can now be analysed for land content by using industry accepted cost estimates for the as new building and development expenses. As a general summary, the cost new applied in the Liverpool District were as follows: Single storey retail shop $900 to $1,400 m2 gross building area Two storey retail shop with office above $1,200 to $1,600 m2 gross building area Two storey retail shop with residential above $1,500 to $2,000 m2 gross building area Industrial (depending on construction type) $650 to $800 m2 gross building area
The residual amount following this exercise will show the adjusted land value at the base date.
Other costs accounted for are:
All professional fees Costs of site works in preparation for building Cost of stamp duty and legal charges on purchase of site Costs of rates and taxes over development period
Loss of interest on capital outlaid on purchase of site Loss of interest on capital outlaid on construction (av. 50% of dev. period). Legal costs and commission on sale for development sites. Critical to the analysis is that the added value only is to be captured and taken from the Sale Price to show the Residual Land Value.

Liverpool Final Report
__________________________________________________________________________________________________________________
_______________________________________________________________________________ Southern Alliance Valuation Services Pty Ltd – Liverpool Final Report – BD 1 July 2015 Page 41 of 63
6.0 CHANGES TO COMPONENTS ILLUSTRATED BY CHANGES TO THE EXISTING VALUE RELATIONSHIPS.
From the analysed sales evidence available at the commencement and during the programme, the amount of variation applied to the value of properties within each zone & component is as follows:
6.1 Value Levels - Typical Properties
Typical Single Dwelling Site – Brearley Ave, Middleton Grange General Residential (DAA)
Dimensions : 11.90 x 30.60 m. Site Area : 364.1 m2 BD 07/14 Land Value : $274,000 Factor Update : 1.343 BD 07/15 Land Value : $368,000
Typical Single Dwelling Site – Weir Cres, Lurnea Low Density Residential (ADD)
Dimensions : 15.24 x 36.58 m. Site Area : 556.4 m2 BD 07/14 Land Value : $265,000 Factor Update : 1.283 BD 07/15 Land Value : $340,000
Typical Single Dwelling Site – Nottingham Cres, Chipping Norton Low Density Residential (AFF) Dimensions : 19.00 x 36.53 m Site Area : 693.9 m2 BD 07/14 Land Value : $395,000 Factor Update : 1.352 BD 07/15 Land Value : $534,000 Typical Single Dwelling Site – Pritchard Ave, Hammondville Low Density Residential (MEE) Dimensions : 15.24 x 36.58 m Site Area : 556.4 m2 BD 07/14 Land Value : $304,000 Factor Update : 1.253 BD 07/15 Land Value : $381,000

Liverpool Final Report
__________________________________________________________________________________________________________________
_______________________________________________________________________________ Southern Alliance Valuation Services Pty Ltd – Liverpool Final Report – BD 1 July 2015 Page 42 of 63
6.0 CHANGES TO COMPONENTS ILLUSTRATED BY CHANGES TO THE EXISTING VALUE RELATIONSHIPS (Cont.) Typical Single Dwelling Site – Craig Ave, Moorebank Medium Density Residential (LSS) Dimensions : 18.29 x 36.58 m Site Area : 663.9 m2 BD 07/14 Land Value : $325,000 Factor Update : 1.262 BD 07/15 Land Value : $410,000 Typical Single Dwelling Site – Galloway St, Busby Medium Density Residential (LMM) Dimensions : 16.76 x 35.99 / 36.58 m Site Area : 607 m2 BD 07/14 Land Value : $235,000 Factor Update : 1.247 BD 07/15 Land Value : $293,000 Typical Single Dwelling Site – Bigge St, Warwick Farm High Density Residential (MDD) Dimensions : 17.68 x 36.78 / 36.83 m Site Area : 651 m2 BD 07/14 Land Value : $430,000 Factor Update : 1.393 BD 07/15 Land Value : $599,000 Typical Large Dwelling Site – Dwyer Rd, Bringelly Large Lot Residential (TTT) Dimensions : 76.2 x 265.74 / 265.75 m Site Area : 20,250 m2 BD 07/14 Land Value : $645,000 Factor Update : 1.347 BD 07/15 Land Value : $869,000 Typical Rural Site – Findley Rd, Bringelly Primary Production (RBB) Dimensions : Site Area : 386,200 m2 BD 07/14 Land Value : $1,430,000 Factor Update : 1.056 BD 07/15 Land Value : $1,510,000

Liverpool Final Report
__________________________________________________________________________________________________________________
_______________________________________________________________________________ Southern Alliance Valuation Services Pty Ltd – Liverpool Final Report – BD 1 July 2015 Page 43 of 63
6.0 CHANGES TO COMPONENTS ILLUSTRATED BY CHANGES TO THE EXISTING VALUE RELATIONSHIPS (Cont.) Typical Rural Site – Denham Court Rd, Denham Court Rural Landscape (RGG) Dimensions : 81.68 / 83.41 x 250.92 / 257.56 m Site Area : 20,230 m2 BD 07/14 Land Value : $932,000 Factor Update : 1.202 BD 07/15 Land Value : $1,120,000 Typical Rural Site – Bellfield Ave, Rossmore Primary Production (Small Lots) (RDD) Dimensions : 83.82 x 241.4 m Site Area : 20,230 m2 BD 07/14 Land Value : $648,000 Factor Update : 1.204 BD 07/15 Land Value : $780,000 Typical Medium Density Site – Boldrewood Ave, Casula Low Density Residential (MLL) Dimensions : 7.46 ARC / 44 x 40.24 / 85.695 IRR m Site Area : 1,803 m2
Development : 6 x 2 storey townhouses (site density at 300.5m2 per dwelling) BD 07/14 Land Value : $713,000 ($118,833 per dwelling) Factor Update : 1.386 BD 07/15 Land Value : $988,000 ($164,667 per dwelling) Typical High Density Site – Bigge St, Liverpool High Density Residential (TRR) Dimensions : 30.30 / 30.25 x 43.84 / 43.97 m Site Area : 1,328 m2
Development : 23 units (site density at 58m2 per dwelling) BD 07/14 Land Value : $1,450,000 ($63,043 per dwelling) Factor Update : 1.297 BD 07/15 Land Value : $1,880,000 ($81,739 per dwelling)

Liverpool Final Report
__________________________________________________________________________________________________________________
_______________________________________________________________________________ Southern Alliance Valuation Services Pty Ltd – Liverpool Final Report – BD 1 July 2015 Page 44 of 63
6.0 CHANGES TO COMPONENTS ILLUSTRATED BY CHANGES TO THE EXISTING VALUE RELATIONSHIPS (Cont.) Typical Retail Property – Marsh Pde, Casula Neighbourhood Centre (BHH) Dimensions : 7.62 x 39.62 m Site Area : 297.2 m2 BD 07/14 Land Value : $126,000 Rate per metre frontage: $16,535 ($424 m2) Factor Update : 1.095 BD07/15 Land Value : $138,000 Rate per metre frontage: $18,110 ($464 m2) Typical Commercial/Retail Property – George St, Liverpool Commercial Core (TCC) Dimensions : 16.61 / 17.25 x 36.58 / 36.58 m Site Area : 613.3 m2 Floor Space Ratio : 4:1 BD 07/14 Land Value : $833,000 Rate per sqm GFA : $340 Factor Update : 1.176 BD07/15 Land Value : $980,000 Rate per sqm GFA : $399
Typical Mixed Use Site – Moore St, Liverpool Mixed Use (TMM) Dimensions : 15.24 / 14.14 x 33.39 / 32.93 m Site Area : 501.2 m2 Floor Space Ratio : 2.5:1 BD 07/14 Land Value : $586,000 Rate per sqm GFA : $468 Factor Update : 1.292 BD07/15 Land Value : $757,000 Rate per sqm GFA : $604 Typical Industrial Property –Regent Cres, Moorebank General Industrial (FAA) Site Area : 1,859m2
BD 07/14 Land Value : $647,000 Rate per square metre : $348 Factor Update : 1.000
BD 07/15 Land Value : $647,000 Rate per square metre : $348

Liverpool Final Report
__________________________________________________________________________________________________________________
_______________________________________________________________________________ Southern Alliance Valuation Services Pty Ltd – Liverpool Final Report – BD 1 July 2015 Page 45 of 63
6.0 CHANGES TO COMPONENTS ILLUSTRATED BY CHANGES TO THE EXISTING VALUE RELATIONSHIPS (Cont.) Typical Industrial Property – Alfred Rd, Chipping Norton Light Industrial (FGG) Site Area : 9,194m2
BD 07/14 Land Value : $2,830,000 Rate per square metre : $308 Factor Update : 1.039
BD 07/15 Land Value : $2,940,000 Rate per square metre : $320 Typical Industrial Property – Enterprise Cct, Prestons Heavy Industrial (FSS) Site Area : 3,887m2
BD 07/14 Land Value : $1,160,000 Rate per square metre : $298 Factor Update : 1.000
BD 07/15 Land Value : $1,160,000 Rate per square metre : $298
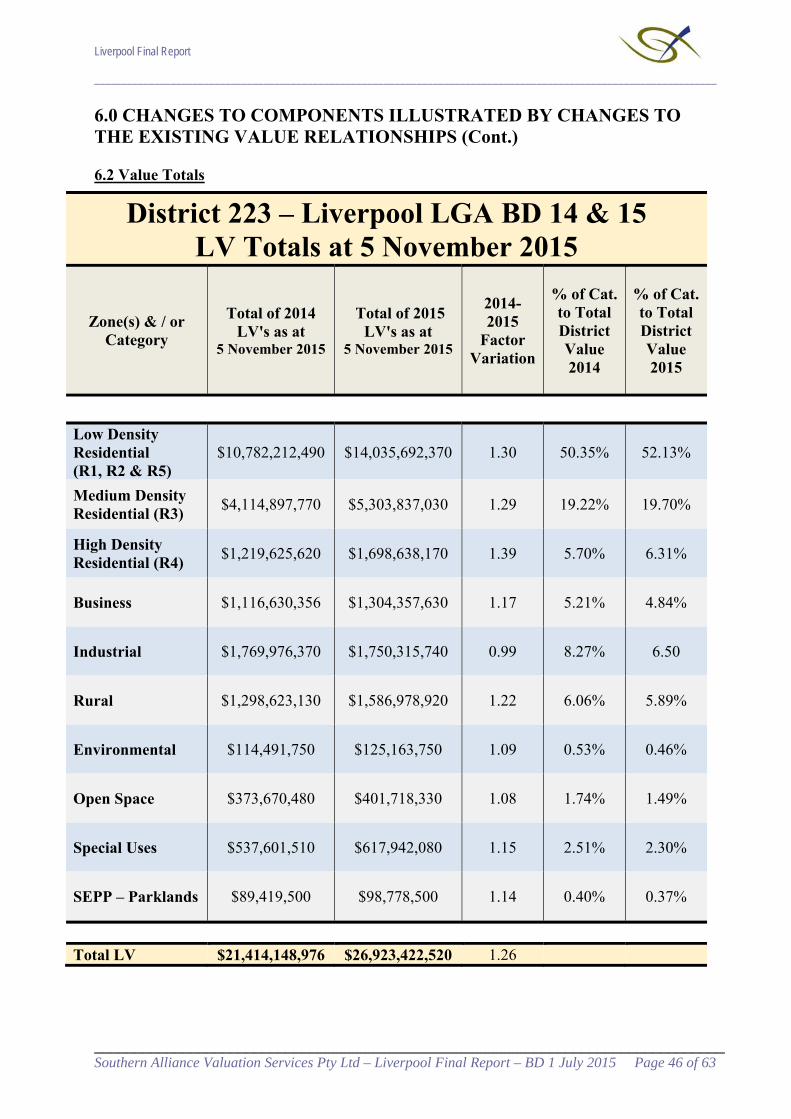
Liverpool Final Report
__________________________________________________________________________________________________________________
_______________________________________________________________________________ Southern Alliance Valuation Services Pty Ltd – Liverpool Final Report – BD 1 July 2015 Page 46 of 63
6.0 CHANGES TO COMPONENTS ILLUSTRATED BY CHANGES TO THE EXISTING VALUE RELATIONSHIPS (Cont.) 6.2 Value Totals
District 223 – Liverpool LGA BD 14 & 15 LV Totals at 5 November 2015
Zone(s) & / or Category
Total of 2014 LV's as at
5 November 2015
Total of 2015 LV's as at
5 November 2015
2014-2015
Factor Variation
% of Cat. to Total District Value 2014
% of Cat. to Total District Value 2015
Low Density Residential (R1, R2 & R5)
$10,782,212,490 $14,035,692,370 1.30 50.35% 52.13%
Medium Density Residential (R3)
$4,114,897,770 $5,303,837,030 1.29 19.22% 19.70%
High Density Residential (R4)
$1,219,625,620 $1,698,638,170 1.39 5.70% 6.31%
Business $1,116,630,356 $1,304,357,630 1.17 5.21% 4.84%
Industrial $1,769,976,370 $1,750,315,740 0.99 8.27% 6.50
Rural $1,298,623,130 $1,586,978,920 1.22 6.06% 5.89%
Environmental $114,491,750 $125,163,750 1.09 0.53% 0.46%
Open Space $373,670,480 $401,718,330 1.08 1.74% 1.49%
Special Uses $537,601,510 $617,942,080 1.15 2.51% 2.30%
SEPP – Parklands $89,419,500 $98,778,500 1.14 0.40% 0.37%
Total LV $21,414,148,976 $26,923,422,520 1.26
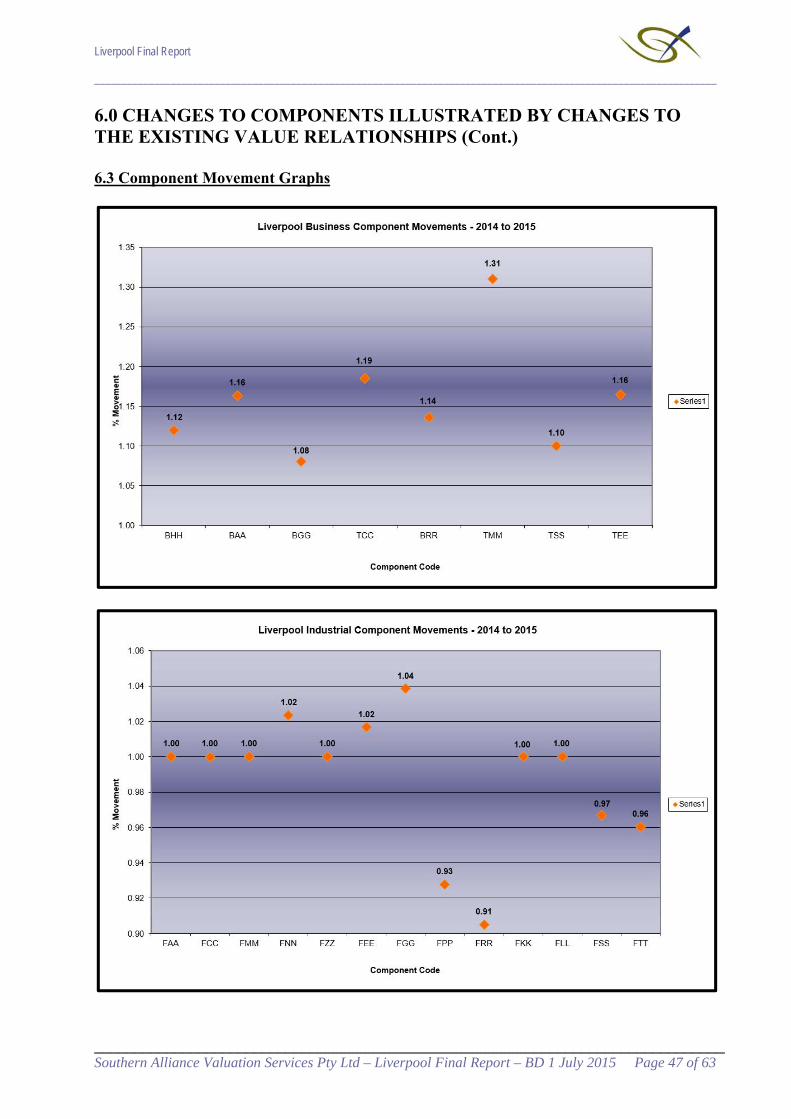
Liverpool Final Report
__________________________________________________________________________________________________________________
_______________________________________________________________________________ Southern Alliance Valuation Services Pty Ltd – Liverpool Final Report – BD 1 July 2015 Page 47 of 63
6.0 CHANGES TO COMPONENTS ILLUSTRATED BY CHANGES TO THE EXISTING VALUE RELATIONSHIPS (Cont.) 6.3 Component Movement Graphs

Liverpool Final Report
__________________________________________________________________________________________________________________
_______________________________________________________________________________ Southern Alliance Valuation Services Pty Ltd – Liverpool Final Report – BD 1 July 2015 Page 48 of 63
6.0 CHANGES TO COMPONENTS ILLUSTRATED BY CHANGES TO THE EXISTING VALUE RELATIONSHIPS (Cont.)

Liverpool Final Report
__________________________________________________________________________________________________________________
_______________________________________________________________________________ Southern Alliance Valuation Services Pty Ltd – Liverpool Final Report – BD 1 July 2015 Page 49 of 63
7.0 MARKET COMMENTARY: 7.1 Residential
Overall, the residential market within the Liverpool LGA exhibited signs of strong positive growth over the 12 months ending 30 June 2015. As a whole, component movements for each residential zone from BD 1 July 2014 to BD 1 July 2015 was as follows:
R1 – General Residential 32.2% R2 – Low Density Residential 29.7% R3 – Medium Density Residential 28.9% R4 – High Density Residential 39.3% R5 – Large Lot Residential 29.0%
On average, residential land within each land component, depending on locality and development potential, moved within a band of 9.8% and 65.1% over the 2015 land valuing year.
In total, there are 44 residential components in the residential zones (noted above). 25 residential components recorded positive growth in excess of 30% between base date 1 July 2014 and base date 1 July 2015. There are 26 components in the ‘R2 – Low Density Residential’ zone, with 15 of those components recording positive growth greater than 30% over the 12 months ending 30 June 2015. Other components in the ‘R2’ zone which had shown considerable growth over the 2015 valuing year are:
Component Suburb(s) AFF (35.1%)
Chipping Norton High growth component: attributable to the suburbsproximity to Liverpool Town Centre and amenity in regards to surrounding/adjoining rivers and parkland including Georges River, Chipping Norton Lake, McMillan Park, Chauvel Park, Angle Park and Homestead Park.
ALL (35.4%)
Warwick Farm (Stables Area)
High growth component: attributable to demand for specialised properties suitable for horse trainers. Demand from both owner occupiers, and investors – the latter seeking a greater rental return than normal single residential housing. The components proximity to Warwick Farm Racecourse is imperative, however the area also benefits from its short distance to Liverpool Town Centre.
AWW (65.1%)
Austral High growth component: attributable to the rezoning of the land from ‘RU4 – Primary Production (Small Lots)’ under Liverpool LEP 2008 to ‘R2 – Low Density Residential’under the SEPP 2006 – Sydney Regional Growth Centres. The ‘R2’ zoning allows a greater development potential of the land than that allowable under ‘RU4’.
LPP (37.7%)
Moorebank (Western Part)
High growth component: attributable to the component’s proximity to Liverpool Town Centre and the M5.
MLL (38%)
Medium Density (LGA Wide)
High growth component: attributable to developers seeking quality assets which can meet the market demand for residential property while providing more affordable housing options.

Liverpool Final Report
__________________________________________________________________________________________________________________
_______________________________________________________________________________ Southern Alliance Valuation Services Pty Ltd – Liverpool Final Report – BD 1 July 2015 Page 50 of 63
7.0 MARKET COMMENTARY (Cont.) Other single residential component areas in the residential zoning that exhibited strong positive growth over the 2015 valuing year are:
Component Suburb(s) MUU (35.8%)
R1 - Large Parcels High growth component attributable to developers seeking quality assets which can meet the market demand for residential property while providing more affordable housing options.
JAD (42.7%)
R3 Sites (Austral / Leppington)
High growth component attributable to the rezoning of the land from ‘RU4 – Primary Production (Small Lots)’ under Liverpool LEP 2008 to ‘R3 – Medium Density Residential’ under the SEPP 2006 – Sydney Regional Growth Centres. The ‘R3’ zoning allows a greater development potential of the land than that allowable under ‘RU4’.
Factors which are considered to be contributing to the current residential market conditions are:
A Low Cash Rate (in historic terms), as at: o 1 Jul 2014 2.5% o 4 Feb 2015 2.25% (decrease of 25 basis points) o 6 May 2015 2.00% (decrease of 25 basis points) o 1 Jul 2015 2.00%
High capital growth in Sydney Dwelling Values – CoreLogic / RP Data Home Value Index notes Sydney residential property values are 16.2% higher over the year ending 30 June 2015 –which is larger in growth than the combined capital cities which recorded 9.8% over the same period.
Having regard to Sydney’s low rental growth of 2.5% over the 12 months ending 30 June 2015 in comparison to growth in dwelling values over the same period – consequently, Sydney residential yields have compressed 0.2% and 0.6% over the quarter and year ending 30 June 2015 respectively. Thus, gross rental yields are 3.2% and 4.2% respectively for Sydney houses and units. (Source – CoreLogic / RP Data).
Sydney maintaining a low/strong residential rental vacancy rate – 1.8% for June 2015, which is marginally lower than the 1.9% and 2% recorded for June 2014 & June 2013 respectively. (Source – SQM Research).
Selling time/duration for Sydney residential dwellings decreasing by 1 day and 6 days respectively over the quarter and year ending 30 June 2015 (Source – CoreLogic / RP Data).
Sydney residential dwelling vendor discounting increasing by 0.7 and 1.1 percentage points respectively over the quarter and year ending 30 June 2015. (Source – CoreLogic / RP Data).
Increases in Sydney residential property listings whilst the national listing numbers decreased – Sydney listing numbers rising 7.6% over the month of September 2015 and rising 11.1% over the 12 months ending 30 September 2015 compared to the national listing numbers decreasing 0.1% over the 12 months ending 30 September 2015. (Source – SQM Research)
Sydney’s auction clearance rates peaking at 89% on two weekends in May 2015 and one weekend in June 2015. This compares to clearance rates in Sydney in the low 70 per cent range for June 2014. Sydney’s auction clearance rates have reduced since peaking in May / June 2015 – recording a clearance rate of 65% on Saturday 17 October 2015. (Source – Australian Property Monitors).

Liverpool Final Report
__________________________________________________________________________________________________________________
_______________________________________________________________________________ Southern Alliance Valuation Services Pty Ltd – Liverpool Final Report – BD 1 July 2015 Page 51 of 63
7.0 MARKET COMMENTARY (Cont.)
All four big banks increasing investor variable interest rates between 0.27 and 0.29 percentage points over the two weeks ending 4 August 2015. Increases attributable to the banks’ response to Australian Prudential Regulation Authority’s (APRAs) demand that housing investor loan growth has to slow to less than 10 per cent a year (Source – Sydney Morning Herald & ABC).
APRA announced in July 2015 an increase in capital requirements for Australian residential mortgage exposures under the Internal Ratings-Based (IRB) Approach. The average risk weight of residential mortgage exposures using the IRB approach will increase to at least 25 per cent by mid-2016, from an average of around 17 per cent at the end of June 2015. (Source – RBA: Financial Stability Review ‘Box C’).
Having regard to the above, from 14 October 2015 to 23 October 2015, all big four banks increased their variable interest rates on residential owner-occupier and investor home loans between 15 and 20 basis points – with all four banks citing the decision was partly attributable to the requirement to increase the amount of capital applied to residential mortgages.
Increase in housing credit growth from 4.6% (2013) to 6.4% (2014) and to 7.3% (2015) – 12 month growth for years ending 30 June. (Source – RBA: Financial Aggregates).
All Groups CPI increasing 1.5% over the 12 months ending 30 June 2015 (Source – Australian Bureau of Statistics).
Australian GDP (chain volume measure) grew by 2.0% (seasonally adjusted) over the 12 months ending 30 June 2015 (Source – Australian Bureau of Statistics).
Australian Real GDP forecast to expand by 2.4% in 2015/16 and 3.1% in 2016/17. (Source – NAB, Global & Australian Forecasts – October 2015)
The Australian unemployment rate is at 6.2% in September 2015 (seasonally adjusted). (Source – Australian Bureau of Statistics).
Australian unemployment rate forecast to decrease slightly to 6% by end 2015/16 and to 5.75% by end 2016/17. (Source – NAB, Global & Australian Forecasts – October 2015)
National annual population growth of 1.4% (as at 31 March 2015), down from 1.7% (as at 31 March 2014) and down from the previous peak of 1.8% recorded over 2012. (Source – Australian Bureau of Statistics).
Wage Price Index (total hourly rates of pay excluding bonuses) recording a +2.3% annual change over the 12 months ending 30 June 2015 – down from +2.6% annual change over the 12 months ending 30 June 2014. (Source – Australian Bureau of Statistics).
Declining Australian Dollar (AUD vs. USD) – falling from $0.94 as at June 2014 to $0.77 as at June 2015 (approx.).
Please note: It is important to point out land value assessed at 1 July 2015 takes into account market conditions at that point in time and the further impact of factors such as interest rate increases/decreases, national and global economies, unemployment etc. can only be assessed by monitoring future market transactions.

Liverpool Final Report
__________________________________________________________________________________________________________________
_______________________________________________________________________________ Southern Alliance Valuation Services Pty Ltd – Liverpool Final Report – BD 1 July 2015 Page 52 of 63
7.0 MARKET COMMENTARY (Cont.)
7.1.2 Sales and Resales Sale and Resales within Liverpool LGA (2014/15) * Excludes resales which have been redeveloped and non-market sales
19 Aberdeen Road, Busby Sold 18 February 2014 - $390,000 Shows an increase of 32.05%, which equates to an
approximate increase of 2.00% per month. Resold 9 June 2015 - $515,000 *Appears to have resold in a similar condition
29 Atkinson Street, Liverpool Sold 30 May 2014 - $500,000 Shows an increase of 172%, which equates to an
approximate increase of 13.23% per month. Resold 19 June 2015 - $1,360,000 *Vacant land sale, zoned R4 – High Density Residential
6 Ayshford Street, Casula Sold 28 February 2014 - $460,000 Shows an increase of 7.61%, which equates to an
approximate increase of 1.09% per month. Resold 19 September 2014 - $495,000 * Appears to have resold in a similar condition
122 Banks Road, Miller Sold 13 March 2014 - $385,000 Shows an increase of 24.68%, which equates to an
approximate increase of 3.09% per month. Resold 3 November 2014 - $480,000 *Appears to have resold in a mostly similar condition with some minor presentation changes
7 Bennison Road, Hinchinbrook Sold 1 July 2015 - $482,500 Shows an increase of 3.63%, which equates to an
approximate increase of 3.63% per month. Resold 14 August 2014 - $500,000 *Assumed to have resold in similar condition
3 Bimberi Street, Horning Sea Park Sold 30 April 2014 - $680,000 Shows an increase of 22.79%, which equates to an
approximate increase of 1.42% per month. Resold 15 August 2015 - $835,000 *Appears to have resold in a similar condition
96 Boundary Road, Lurnea Sold 21 November 2014 - $435,000 Shows an increase of 26.44%, which equates to an
approximate increase of 6.61% per month. Resold 7 March 2015 - $550,000 *Appears to have resold in a mostly similar condition with some presentation changes
1132 Bringelly Road, Bringelly Sold 12 February 2014 - $1,125,000 Shows an increase of 55.56%, which equates to
an approximate increase of 5.56% per month. Resold 9 December 2014 - $1,750,000 *Assumed to have resold in similar condition

Liverpool Final Report
__________________________________________________________________________________________________________________
_______________________________________________________________________________ Southern Alliance Valuation Services Pty Ltd – Liverpool Final Report – BD 1 July 2015 Page 53 of 63
7.0 MARKET COMMENTARY (Cont.)
24 Brisbane Avenue, Lurnea Sold 5 February 2014 - $465,500 Shows an increase of 33.19%, which equates to
an approximate increase of 2.21% per month. Resold 6 May 2015 - $620,000 *Assumed to have resold in similar condition
56 Busby Road, Busby Sold 2 August 2014 - $475,000 Resold 7 January 2015 - $620,000 Shows an increase of 30.53% from 2/8/2014 Resold 6 May 2015 - $730,000 Shows an increase of 17.74% from 7/1/2015 * Original home sold with approve DA for detached dual occupancy. Overall increase from 2/8/14 to 6/5/15 is 53.68% which equates to an approximate increase of 5.96% per month
7 Cantello Avenue, Hammondville Sold 15 February 2014 - $741,000 Shows an increase of 21.46%, which equates to
an approximate increase of 1.26% per month. Resold 28 July 2015 - $900,000 *Assumed to have resold in similar condition
27 Carmichael Drive, West Hoxton Sold 31 May 2014 - $770,000 Shows an increase of 16.88%, which equates to
an approximate increase of 1.88% per month. Resold 2 March 2015 - $900,000 *Assumed to have resold in similar condition
15 Casula Road, Casula Sold 23 April 2015 - $880,000 Shows an increase of 37.5%, which equates to an
approximate increase of 12.5% per month. Resold 8 July 2015 - $1,210,000 *Assumed to have resold in similar condition. Property is zoned ‘R3’ and is 1,176sqm in size.
6 Chappel Avenue, Green Valley Sold 5 July 2014 - $610,000 Shows an increase of 19.67%, which equates to
an approximate increase of 1.79% per month. Resold 27 June 2015 - $730,000 *Assumed to have resold in similar condition
14 Coonong Street, Busby Sold 7 March 2014 - $412,000 Shows an increase of 38.35%, which equates to
an approximate increase of 2.56% per month. Resold 6 June 2015 - $570,000 *Appears to have resold with a new/renovated bathroom
5 Dorset Place, Miller Sold 12 May 2014 - $460,000 Shows an increase of 25%, which equates to an
approximate increase of 1.56% per month. Resold 8 September 2015 - $575,000 *Assumed to have resold in similar condition

Liverpool Final Report
__________________________________________________________________________________________________________________
_______________________________________________________________________________ Southern Alliance Valuation Services Pty Ltd – Liverpool Final Report – BD 1 July 2015 Page 54 of 63
7.0 MARKET COMMENTARY (Cont.)
204 Edmondson Avenue, Austral Sold 18 February 2014 - $455,000 Shows an increase of 16.48% which equates to an
approximate increase of 1.77% per month. Resold 17 April 2015 - $530,000 *Assumed to have resold in similar condition
44 Ellis Crescent, Miller Sold 16 October 2014 - $435,000 Shows an increase of 26.44%, which equates to
an approximate increase of 6.61% per month. Resold 17 February 2015 - $550,000 *Assumed to have resold in similar condition
119 Flowerdale Road, Liverpool Sold 22 February 2014 - $562,500 Shows an increase of 45.78%, which equates to
an approximate increase of 2.86% per month. Resold 4 June 2015 - $820,000 *Assumed to have resold in similar condition
4 Friesian Street, Busby Sold 13 November 2014 - $380,000 Shows an increase of 35.53%, which equates to
an approximate increase of 8.88% per month. Resold 7 March 2015 - $515,000 *Assumed to have resold completely renovated – new kitchen, bathroom, polished floorboards.
1B Gerald Street, Cecil Hills Sold 16 May 2015 - $650,500 Shows an increase of 9.15%, which equates to an
approximate increase of 2.29% per month. Resold 12 September 2015 - $710,000 *Appears to have resold in similar condition
5 Glenalvon Place, West Hoxton Sold 1 February 2014 - $607,000 Shows an increase of 35.09%, which equates to
an approximate increase of 5.01% per month. Resold 5 September 2014 - $820,000 *Appears to have resold with a renovated kitchen, bathroom and some external work (paint etc)
10 Goose Close, Hinchinbrook Sold 29 July 2014 - $750,000 Shows an increase of 32%, which equates to an
approximate increase of 3.2% per month. Resold 21 May 2015 - $990,000 *Appears to have resold in a similar condition
9 Gove Avenue, Green Valley Sold 10 January 2014 - $580,000 Shows an increase of 7.76%, which equates to an
approximate increase of 0.65% per month. Resold 14 January 2015 - $625,000 *Appears to have resold in similar condition
15 Grace Street, Liverpool Sold 27 June 2014 - $500,000 Shows an increase of 40%, which equates to an
approximate increase of 3.08% per month. Resold 3 July 2015 - $700,000 *Appears to have resold in similar condition

Liverpool Final Report
__________________________________________________________________________________________________________________
_______________________________________________________________________________ Southern Alliance Valuation Services Pty Ltd – Liverpool Final Report – BD 1 July 2015 Page 55 of 63
7.0 MARKET COMMENTARY (Cont.)
9 Guernsey Street, Busby Sold 27 May 2014 - $435,000 Shows an increase of 26.44%, which equates to
an approximate increase of 1.89% per month. Resold 6 August 2015 - $550,000 *Appears to have resold in similar condition
39 Harraden Drive, West Hoxton Sold 20 October 2014 - $780,000 Shows an increase of 38.46%, which equates to
an approximate increase of 5.49% per month. Resold 28 May 2015 - $1,080,000 *Appears to have resold with a new/renovated kitchen and new floorboards to part downstairs.
10 Herrick Close, West Hoxton Sold 14 January 2015 - $640,000 Shows an increase of 7.81%, which equates to an
approximate increase of 1.30% per month. Resold 18 July 2015 - $690,000 *Assumed to have resold in similar condition
9 Huntley Place, Cartwright Sold 28 May 2015 - $475,000 Shows an increase of 13.68%, which equates to
an approximate increase of 4.56% per month. Resold 20 August 2015 - $540,000 *Appears to have resold in similar condition
11 Julia Close, West Hoxton Sold 19 March 2014 - $522,000 Shows an increase of 18.39%, which equates to
an approximate increase of 2.04% per month. Resold 4 December 2014 - $618,000 *Appears to have resold in similar condition
5 Jaspers Court, Prestons Sold 15 April 2014 - $432,500 Shows an increase of 35.26%, which equates to
an approximate increase of 2.20% per month. Resold 6 August 2015 - $585,000 *Appears to have resold in similar condition
5 Jaspers Court, Prestons Sold 15 April 2014 - $432,500 Shows an increase of 35.26%, which equates to
an approximate increase of 2.20% per month. Resold 6 August 2015 - $585,000 *Appears to have resold in similar condition
Please note: Due to the large volume of ‘Sales and Resales’ throughout the Liverpool LGA –
Please refer to annexures of this report for a full list of ‘Sales and Resales’ as the above analysis comprises only part of the total Sales and Resales. The Sales and Resales exhibited in the report annexures are not an in-depth analysis as shown above and the nature of each Sale and Resale should be investigated to further explain the increase over the period.

Liverpool Final Report
__________________________________________________________________________________________________________________
_______________________________________________________________________________ Southern Alliance Valuation Services Pty Ltd – Liverpool Final Report – BD 1 July 2015 Page 56 of 63
7.0 MARKET COMMENTARY (Cont.)
7.1.3 Change in Median Values
Results from the most recent Department of Housing Sales Tables (March Quarter 15 – Non-Strata) available as at date of reporting indicate the following:
Location Median Value Change in Median (Qtly) Change in Median (Annual) Liverpool (LGA)
$650,000 3.2% 16.6%
Greater Sydney
$752,000 -7.7% 10.6%
Please note a variety of factors can contribute to anomalies in the sale price and the end statistical data. The above information is viewed as a reference only for reporting purposes.
7.1.4 Building Approvals
Residential building approval statistics are used in both the public and private sectors as a leading indicator of the general level of economic activity, employment and investment.
Residential building approvals are compiled from permits issued by: local government authorities and other principal certifying authorities; contracts let or day labour work authorised by Commonwealth, state, semi-government and local government authorities, and; major building approvals in areas not subject to normal administrative approval e.g. building on remote mine sites.
A dwelling (or residential building) is defined as: A residential building is a building consisting of one or more dwelling units. Residential buildings can be either houses or other residential buildings.
An other residential building is a building other than a house primarily used for long-term residential purposes. An other residential building contains more than one dwelling unit. Other residential buildings are coded to the following categories: semi-detached, row or terrace house or townhouse with one storey; semi-detached, row or terrace house or townhouse with two or more storeys; flat, unit or apartment in a building of one or two storeys; flat, unit or apartment in a building of three storeys; flat, unit or apartment in a building of four or more storeys; flat, unit or apartment attached to a house; other/number of storeys unknown. The latter two categories are included with the semi-detached, row or terrace house or townhouse.

Liverpool Final Report
__________________________________________________________________________________________________________________
_______________________________________________________________________________ Southern Alliance Valuation Services Pty Ltd – Liverpool Final Report – BD 1 July 2015 Page 57 of 63
7.0 MARKET COMMENTARY (Cont.) Residential building approvals
Rockdale City Number Annual change Year (ending June 30) Houses Other Total Houses Other Total 2014-15 1,331 850 2,181 +51 -53 -2 2013-14 1,280 903 2,183 +231 +742 +973 2012-13 1,049 161 1,210 +304 -127 +177 2011-12 745 288 1,033 +61 +180 +241 2010-11 684 108 792 -7 -267 -274 2009-10 691 375 1,066 +306 +275 +581 2008-09 385 100 485 -28 -167 -195 2007-08 413 267 680 +93 -255 -162 2006-07 320 522 842
Source: Australian Bureau of Statistics, Building Approvals, Australia (8731.0). Compiled and presented in profile.id by .id, the population experts. (Usual residence data).

Liverpool Final Report
__________________________________________________________________________________________________________________
_______________________________________________________________________________ Southern Alliance Valuation Services Pty Ltd – Liverpool Final Report – BD 1 July 2015 Page 58 of 63
7.0 MARKET COMMENTARY (Cont.)
7.2 Commercial / Retail
As a whole, from Base Date 1 July 2014 to Base Date 1 July 2015, commercial and retail property markets within the Liverpool LGA recorded mixed levels of growth. Overall, each business zone exhibited the following growth over the 2015 valuing year:
B1 – Neighbourhood Centre 12.0%
B2 – Local Centre 16.3%
B3 – Commercial Core 16.0%
B4 – Mixed Use 21.6%
B5 – Business Development 10.0%
B6 – Enterprise Corridor 16.5%
Individual components within each business zone show varying levels of growth for numerous reasons including, but not limited to, location, development potential and access to infrastructure / public transport – however, as a whole, business zoned components in the Liverpool LGA generally moved within a band of 8.0 % and 29.5% over the 2015 valuation year. Component ‘TMM – B4 Town Centre Mixed Use’ in the ‘B4 – Mixed Use’ zone recorded strong positive growth over the 12 months ending 30 June 2015. Component ‘TMM’ comprises commercial, retail & mixed use properties and potential development sites within the Liverpool Town Centre and recorded growth of 29.5% over the valuation period.
In general, density / development sites continued to perform well over the 2015 valuation year. Generally, residential development continues to outprice commercial development as the highest and best use and as such, sites with residential development potential remain in high demand across the Liverpool LGA and in particular the Liverpool Town Centre.
Retail properties across the Liverpool LGA have recorded good growth over the 2015 land valuing year with all retail sites (excluding components ‘BGG’ and ‘TSS’ – predominantly larger sites) exhibiting growth between 12% and 29.5%. Growth in retail spending (and ultimately retail asset values) is being supported by various factors. For example, increases in household net worth, driven by the uplift in residential dwelling values, are resulting in providing support for discretionary retail spending and retail spending on household goods. Additionally, a low Australian dollar and low interest rates are providing some overall support to retail properties and retail land values. Colliers International report that Neighbourhood Retail properties for the first half of 2015 illustrated a prime yield range from 6.50% up to 7.75% and a secondary yield range from 8.00% up to 10.00%. Additionally, Colliers International report that Sub-Regional shopping centres’ for the first half of 2015 exhibited a prime yield range from 6.50% up to 7.50% and a secondary yield range from 7.50% up to 9.50%.

Liverpool Final Report
__________________________________________________________________________________________________________________
_______________________________________________________________________________ Southern Alliance Valuation Services Pty Ltd – Liverpool Final Report – BD 1 July 2015 Page 59 of 63
7.0 MARKET COMMENTARY (Cont.)
7.3 Industrial
Overall, the industrial market within Liverpool LGA was fairly subdued with 6 components recording nil growth, 3 components recording a modest increase in values and 4 components exhibiting a contraction in values. Overall, each industrial zone exhibited the following results over the 2015 valuing year:
IN1 – General Industrial 0.3% IN2 – Light Industrial -1.4% IN3 – Heavy Industrial -2.7%
Generally, industrial sites ‘East of Liverpool CBD’ performed better than those industrial sites ‘West of Liverpool CBD’. For example, the sales analysed in components under the ‘IN2’ and ‘IN3’ zones have revealed the following results for parts of the Liverpool industrial market over the 2015 valuing year:
Zone Component % Movement – 12 Months Ending 30 June 2015 IN2 FEE – East of CBD – Sites Under 5,000m2 1.7% IN2 FGG – East of CBD – Sites Over 5,000m2 3.9% IN2 FPP – West of CBD – Sites Under 5,000m2 -7.2% IN2 FRR – West of CBD – Sites Over 5,000m2 -9.5% IN3 FKK – East of CBD – Sites Under 5,000m2 0% IN3 FLL – East of CBD – Sites Over 5,000m2 0% IN3 FSS – West of CBD – Sites Under 5,000m2 -3.3% IN3 FTT – West of CBD – Sites Over 5,000m2 -4.0%
The main concentration of industrial property west of Liverpool CBD is centralised in the suburb of Prestons with a small portion of sites located in other suburbs including Casula, Austral and Lens Waters Estate. The suburb of Prestons has a significant portion of vacant industrial land with some of the existing vacant land newly developed or in the process of being developed. The analysed sales have highlighted the vacant industrial land and new stock being released onto the market has placed downward pressure on the values of industrial properties within this area. Analysed sales of existing industrial property, newly developed industrial properties and vacant industrial land have illustrated subdued growth or a contraction in values for this area. On the contrary to the above, the industrial stock situated to the east of Liverpool CBD is located within an established industrial market with limited to nil vacant industrial land / new industrial properties being released to the market which has supported the industrial land values within this locale.
Colliers International report as a result of a reduction in available stock within the southern Sydney industrial market displacing owners and investors to assets located in the southwest Sydney region, combined with infrastructure upgrades and other developments within the southwest region including the Moorebank Intermodal Freight Precinct and Badgerys Creek Airport, have led to further yield compression with the yield range for prime assets, as at September 2015, being 6.5-7.5 per cent and 8-9 per cent for secondary assets. However, as highlighted above, over the 2015 valuing year ending 30 June 2015, some industrial locale’s performed better than others and the above summarised comments are general in nature and may not apply to all industrial properties/locales within the Liverpool LGA.
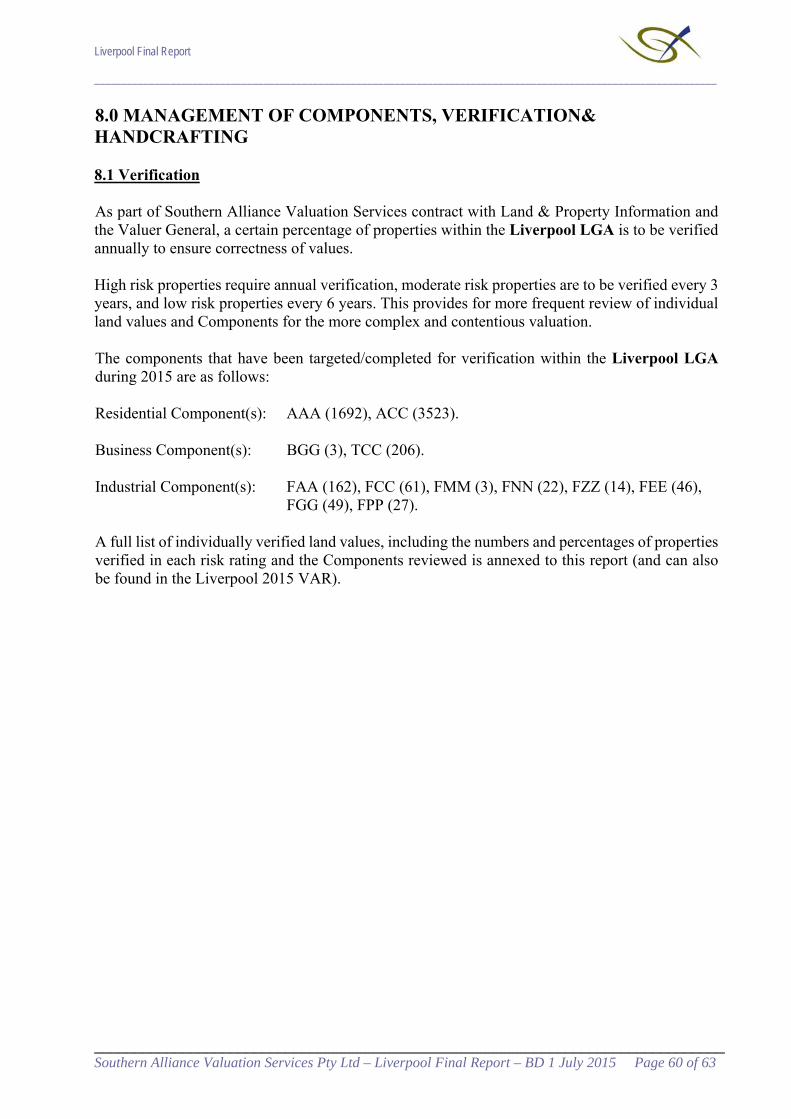
Liverpool Final Report
__________________________________________________________________________________________________________________
_______________________________________________________________________________ Southern Alliance Valuation Services Pty Ltd – Liverpool Final Report – BD 1 July 2015 Page 60 of 63
8.0 MANAGEMENT OF COMPONENTS, VERIFICATION& HANDCRAFTING
8.1 Verification
As part of Southern Alliance Valuation Services contract with Land & Property Information and the Valuer General, a certain percentage of properties within the Liverpool LGA is to be verified annually to ensure correctness of values. High risk properties require annual verification, moderate risk properties are to be verified every 3 years, and low risk properties every 6 years. This provides for more frequent review of individual land values and Components for the more complex and contentious valuation.
The components that have been targeted/completed for verification within the Liverpool LGA during 2015 are as follows: Residential Component(s): AAA (1692), ACC (3523).
Business Component(s): BGG (3), TCC (206). Industrial Component(s): FAA (162), FCC (61), FMM (3), FNN (22), FZZ (14), FEE (46), FGG (49), FPP (27).
A full list of individually verified land values, including the numbers and percentages of properties verified in each risk rating and the Components reviewed is annexed to this report (and can also be found in the Liverpool 2015 VAR).

Liverpool Final Report
__________________________________________________________________________________________________________________
_______________________________________________________________________________ Southern Alliance Valuation Services Pty Ltd – Liverpool Final Report – BD 1 July 2015 Page 61 of 63
9.0 QUALITY ASSURANCE
9.1 Overview
In accordance with Southern Alliance Valuation Services Pty Ltd own internal QA manual and the Office of the Valuer General guidelines, the following quality checks have been made in the delivery of services:
1. Ensuring all properties have been valued. 2. Ensuring the valuations are within the set parameters. 3. That a zone/component code integrity check has been made. 4. An in depth value check on those properties that have considerably higher values in relation to
the average for land. 5. Ensure that current and proposed Development Control Plans and planning changes that affect
the valuations have been taken into account. 6. Where the land value of a property has been amended on objection, the alignment of values
with nearby properties has been checked. 7. That all Statutory concession valuations and allowances have been supplied, including - Allowances for development on and off the land. Heritage Values. Land Rating Factors. Apportionment of Values. Mixed Development Apportionment Factors.
The following statistical checks have been carried out.
9.2 Coefficient of Dispersion (COD)
This measures the relative consistency and, when viewed with the other measures, the relative accuracy of values in relation to the sales. It shows the amount of variation or the consistency of the values and also the relative accuracy of the values as the relationship between values and sales widens.
The accepted measure for the COD is 0 – 15.
9.3 Mean Value to Price Ratio (MVP)
This calculates the mean relative accuracy, or level of values, relative to the sales. It shows the mean level of accuracy of the values assigned compared to the sales evidence. The MVP is to be calculated only in single dwelling residential categories, including rural home site areas.
The accepted measure for the MVP is 85-100%.
9.4 Price Related Differential (PRD)
This test measures the progressive value to sale relativity across the range of values in the sample. It demonstrates the variations of relativity between the sales and the assigned values and indicates if there is a progressive change in relativity across the value range.
The accepted measure for the PRD is 0.98 – 1.03.

Liverpool Final Report
__________________________________________________________________________________________________________________
_______________________________________________________________________________ Southern Alliance Valuation Services Pty Ltd – Liverpool Final Report – BD 1 July 2015 Page 62 of 63
9.0 QUALITY ASSURANCE (Cont.)
Please find below an overview of the statistical analysis (as exhibited in the Land & Property Information – Mass Valuation Statistical Check Report):
District: 223-Liverpool Base Date 01 July 2015
Zone Description No. of Entries COD MVP PRD COAVC B1 Neighbourhood Centre 128 3.50 93.81% 1.03 2.83 B2 Local Centre 83 0.00 87.73% 1.00 112.20 B3 Commercial Core 209 7.30 90.51% 1.10 4.00 B4 Mixed Use 233 7.05 80.95% 1.05 120.36 B5 Business Development 39 B6 Enterprise Corridor 148 3.93 94.70% 0.98 33.93 E1 National Parks & Nature Reserves 12 E2 Environmental Conservation 46 E3 Environmental Management 7 E4 Environmental Living 82 IN1 General Industrial 262 3.77 95.62% 0.97 -0.04 IN2 Light Industrial 165 5.91 93.11% 1.04 1.08 IN3 Heavy Industrial 258 2.03 96.37% 0.99 0.00 R1 General Residential 3,176 6.74 90.11% 1.01 -3.67 R2 Low Density Residential 31,577 5.21 90.15% 1.00 -2.17 R3 Medium Density Residential 13,025 3.95 90.72% 1.01 1.32 R4 High Density Residential 2,747 3.22 92.48% 1.05 16.82 R5 Large Lot Residential 351 4.17 90.14% 1.00 -5.32
RE1 Public Recreation 868 0.00 99.87% 1.00 0.31 RE2 Private Recreation 17 RU1 Primary Production 262 3.71 93.82% 1.01 -10.48 RU2 Rural Landscape 82 7.18 89.79% 0.98 -0.14 RU4 Rural Small Holdings 1,363 7.88 87.10% 1.02 0.68 RU6 Transition 15 SP1 Special Activities 231 SP2 Infrastructure 338
Z SEPP Western Sydney Parklands 122
9.4 Subsequent Valuations upon Objection / Reascertainment
Southern Alliance Valuation Services’ internal valuation system identifies any property which has been subject to an objection. Upon identification, the selected valuer will review the objection, confirm the new land value (if appropriate) and review and alter (if needed) the surrounding land values that may have been affected due to the change in land value for the property subject to objection. An overview of all properties within the Liverpool LGA subject to an objection, and subsequent actions taken, are listed within the 2015 VAR.

Liverpool Final Report
__________________________________________________________________________________________________________________
_______________________________________________________________________________ Southern Alliance Valuation Services Pty Ltd – Liverpool Final Report – BD 1 July 2015 Page 63 of 63
10.0 CONCLUSION
10.1 Purpose of this Report The purpose of this report is to describe the process and considerations for the 1 July 2015 Valuation of Liverpool Local Government Area. The report has been produced on behalf of the Valuer General. The land values have been specifically made for rating and taxing purposes. Land values produced as part of this process should not be used for any other purpose without the specific agreement of the Valuer General. Land values must have regard to specific requirements and assumptions in rating and taxing legislation. Consequently these valuations may vary from market levels. The land values have been determined using a methodology prescribed by the Rating and Taxing Valuation Procedures Manual. The Manual allows mass valuation methodologies that involve assessing large numbers of properties as a group to be utilised where appropriate. Mass valuations, however are utilised worldwide for rating and taxing purposes to deliver valuations within an acceptable market range. Town planning, land use and other market information contained in this report has been compiled base on enquires undertaken during the valuation process. Third parties should make their own inquiries into these details and should not rely on the contents of this report. The Valuer General disclaims any liability to any person who acts or omits to act on the basis of the information contained in this report. More information on the valuation process is available from the Land and Property Information website at www.lpi.nsw.gov.au/valuation.
10.2 Signatory Murray Edmondson Southern Alliance Valuation Services Pty Ltd

REPORT ANNEXURES

VERIFICATION ANNEXURE(S)
“A full list of individually verified land values, including the numbers and percentages of properties verified in each risk rating and the Components reviewed is annexed to this report (and can also be found in the Liverpool 2015 VAR).”

Zone
Section 6.1.3 (t) (iii) Verification by Component - 15 October 2014 - 15 October 2015Component Code: Total No.
Verified:
No. Records: Verified by Risk Rating
1 2 3 District: 223-Liverpool
B1 Neighbourhood Centre LLEP 2008
BHH 15B1 OTHERS 128 10 11811.7% 7.8% 92.2%
B2 Local Centre LLEP 2008 BAA 12B2 MAJOR SHOP CTRE / LOCAL CEN 83 6 7714.5% 7.2% 92.8%
B3 Commercial Core LLEP 2008 BGG 3B3 MAJOR SHOP.CTRE._CBD_WEST 3 3 Component Reviewed100.0% 100.0%
B3 Commercial Core LLEP 2008 TCC 206B3 TOWNCENTRE COMMERCIAL C 206 12 194 Component Reviewed100.0% 5.8% 94.2%
B4 Mixed Use LLEP 2008 BRR 13B4 BUSINESS ZONED PROPERTIES 97 7 9013.4% 7.2% 92.8%
B4 Mixed Use LLEP 2008 TMM 15B4 TOWNCENTRE MIXED USE 136 12 12411.0% 8.8% 91.2%
B5 Business Development LLEP 2008
TSS 19B5 BUSINESS DEVELOPMENT 39 11 2848.7% 28.2% 71.8%
B6 Enterprise Corridor LLEP 2008 TEE 23B6 MAIN ROAD ENTERPRISE 148 13 13515.5% 8.8% 91.2%
E1 National Parks and Nature Reserves LLEP 2008
PBA 4E1 NATIONAL PARKS AND NATURE 12 4 1 733.3% 33.3% 8.3% 58.3%
E2 Environmental Conservation LLEP 2008
PBB 17E2 ENVIRONMENTAL CONSERVATI 46 3 2 4137.0% 6.5% 4.3% 89.1%
E3 Environmental Management LLEP 2008
PBC 3E3 ENVIRONMENTAL MANAGEME 7 3 442.9% 42.9% 57.1%
E4 Environmental Living SEPP SRGC 2006
PBD 13E4 ENVIRONMENTAL LIVING 82 4 7815.9% 4.9% 95.1%
IN1 General Industrial LLEP 2008 FAA 162IN1 EAST OF CBD - GENERAL INDU 162 9 153 Component Reviewed100.0% 5.6% 94.4%
13/10/2015 Section 6.1.3 (t)(iii) - Page: 2168_

Zone
Section 6.1.3 (t) (iii) Verification by Component - 15 October 2014 - 15 October 2015Component Code: Total No.
Verified:
No. Records: Verified by Risk Rating
1 2 3 District: 223-Liverpool
IN1 General Industrial LLEP 2008 FCC 61IN1 EAST OF CBD - GENERAL INDU 61 16 45 Component Reviewed100.0% 26.2% 73.8%
IN1 General Industrial LLEP 2008 FMM 3IN1 WEST OF CBD - GENERAL INDU 3 3 Component Reviewed100.0% 100.0%
IN1 General Industrial LLEP 2008 FNN 22IN1 WEST OF CBD - GENERAL INDU 22 5 17 Component Reviewed100.0% 22.7% 77.3%
IN1 General Industrial LLEP 2008 FZZ 14IN1 IND MAIN ROAD FRONTAGE BU 14 5 9 Component Reviewed100.0% 35.7% 64.3%
IN2 Light Industrial LLEP 2008 FEE 46IN2 EAST OF CBD - LIGHT INDUSTR 46 5 41 Component Reviewed100.0% 10.9% 89.1%
IN2 Light Industrial LLEP 2008 FGG 49IN2 EAST OF CBD - LIGHT INDUSTR 49 5 44 Component Reviewed100.0% 10.2% 89.8%
IN2 Light Industrial LLEP 2008 FPP 27IN2 WEST OF CBD - LIGHT INDUSTR 27 2 25 Component Reviewed100.0% 7.4% 92.6%
IN2 Light Industrial LLEP 2008 FRR 4IN2 WEST OF CBD - LIGHT INDUSTR 43 4 399.3% 9.3% 90.7%
IN3 Heavy Industrial LLEP 2008 FKK 3IN3 EAST OF CBD - HEAVY INDUST 36 3 338.3% 8.3% 91.7%
IN3 Heavy Industrial LLEP 2008 FLL 5IN3 EAST OF CBD - HEAVY INDUST 41 5 3612.2% 12.2% 87.8%
IN3 Heavy Industrial LLEP 2008 FSS 6IN3 WEST OF CBD - HEAVY INDUST 120 6 1145.0% 5.0% 95.0%
IN3 Heavy Industrial LLEP 2008 FTT 14IN3 WEST OF CBD - HEAVY INDUST 64 14 5021.9% 21.9% 78.1%
R1 General Residential LLEP 2008 DAA 493R1 EDMONDSON PARK_MIDDLE GR 3010 157 1174 167416.4% 5.2% 39.0% 55.6%
R1 General Residential LLEP 2008 MUU 60R1 LARGE PARCELS REZONED R1 182 165 16 133.0% 90.7% 8.8% 0.5%
13/10/2015 Section 6.1.3 (t)(iii) - Page: 2169_

Zone
Section 6.1.3 (t) (iii) Verification by Component - 15 October 2014 - 15 October 2015Component Code: Total No.
Verified:
No. Records: Verified by Risk Rating
1 2 3 District: 223-Liverpool
R2 Low Density Residential LLEP 2008
AAA 1692R2 CASULA - MODERN NEIGHBOUR 1692 10 39 1643 Component Reviewed100.0% 0.6% 2.3% 97.1%
R2 Low Density Residential LLEP 2008
ACC 3523R2 HINCHINBROOK 3530 8 32 349099.8% 0.2% 0.9% 98.9%
R2 Low Density Residential LLEP 2008
ADD 19R2 LURNEA & SOUTH LIVERPOOL - 2811 9 28020.7% 0.3% 99.7%
R2 Low Density Residential LLEP 2008
AEH 57R2 ELIZABETH HILLS 206 12 47 14727.7% 5.8% 22.8% 71.4%
R2 Low Density Residential LLEP 2008
AFF 6R2 CHIPPING NORTON PRED NTH O 1547 6 8 15330.4% 0.4% 0.5% 99.1%
R2 Low Density Residential LLEP 2008
AHH 25R2 ENGLOBO 105 78 9 1823.8% 74.3% 8.6% 17.1%
R2 Low Density Residential LLEP 2008
ALL 2R2 WARWICK FARM STABLES ARE 51 2 493.9% 3.9% 96.1%
R2 Low Density Residential LLEP 2008
AMM 3R2 CLUSTER HOUSING LOTS -HOUS 104 3 1012.9% 2.9% 97.1%
R2 Low Density Residential LLEP 2008
ANN 3R2 BUSINESS OR INDUSTRIAL USE 12 3 4 525.0% 25.0% 33.3% 41.7%
R2 Low Density Residential LLEP 2008
APP 5R2 WEST HOXTON (FOSTER CLOSE 83 5 1 776.0% 6.0% 1.2% 92.8%
R2 Low Density Residential LLEP 2008
ARR 2R2 MOOREBANK FLOODWAY (IMP 45 2 434.4% 4.4% 95.6%
R2 Low Density Residential LLEP 2008
ASS 9R2 CECIL HILLS & GREEN VALLEY - 2586 9 2 25750.3% 0.3% 0.1% 99.6%
13/10/2015 Section 6.1.3 (t)(iii) - Page: 2170_
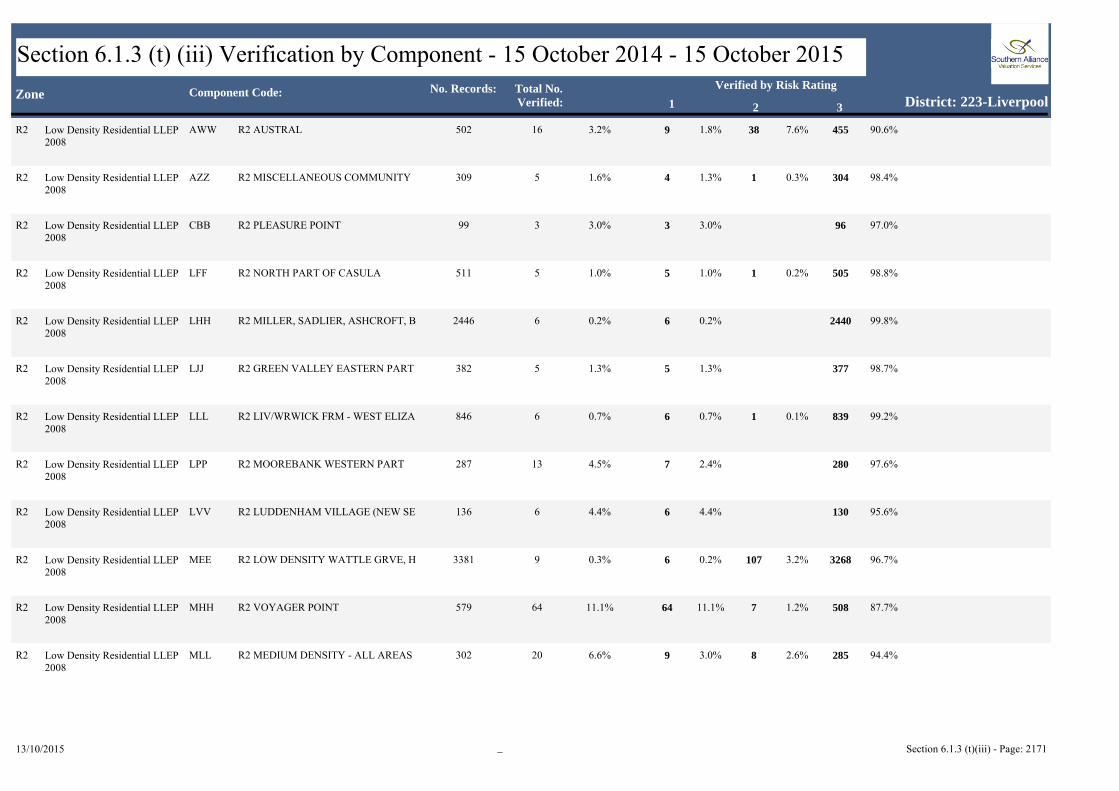
Zone
Section 6.1.3 (t) (iii) Verification by Component - 15 October 2014 - 15 October 2015Component Code: Total No.
Verified:
No. Records: Verified by Risk Rating
1 2 3 District: 223-Liverpool
R2 Low Density Residential LLEP 2008
AWW 16R2 AUSTRAL 502 9 38 4553.2% 1.8% 7.6% 90.6%
R2 Low Density Residential LLEP 2008
AZZ 5R2 MISCELLANEOUS COMMUNITY 309 4 1 3041.6% 1.3% 0.3% 98.4%
R2 Low Density Residential LLEP 2008
CBB 3R2 PLEASURE POINT 99 3 963.0% 3.0% 97.0%
R2 Low Density Residential LLEP 2008
LFF 5R2 NORTH PART OF CASULA 511 5 1 5051.0% 1.0% 0.2% 98.8%
R2 Low Density Residential LLEP 2008
LHH 6R2 MILLER, SADLIER, ASHCROFT, B 2446 6 24400.2% 0.2% 99.8%
R2 Low Density Residential LLEP 2008
LJJ 5R2 GREEN VALLEY EASTERN PART 382 5 3771.3% 1.3% 98.7%
R2 Low Density Residential LLEP 2008
LLL 6R2 LIV/WRWICK FRM - WEST ELIZA 846 6 1 8390.7% 0.7% 0.1% 99.2%
R2 Low Density Residential LLEP 2008
LPP 13R2 MOOREBANK WESTERN PART 287 7 2804.5% 2.4% 97.6%
R2 Low Density Residential LLEP 2008
LVV 6R2 LUDDENHAM VILLAGE (NEW SE 136 6 1304.4% 4.4% 95.6%
R2 Low Density Residential LLEP 2008
MEE 9R2 LOW DENSITY WATTLE GRVE, H 3381 6 107 32680.3% 0.2% 3.2% 96.7%
R2 Low Density Residential LLEP 2008
MHH 64R2 VOYAGER POINT 579 64 7 50811.1% 11.1% 1.2% 87.7%
R2 Low Density Residential LLEP 2008
MLL 20R2 MEDIUM DENSITY - ALL AREAS 302 9 8 2856.6% 3.0% 2.6% 94.4%
13/10/2015 Section 6.1.3 (t)(iii) - Page: 2171_
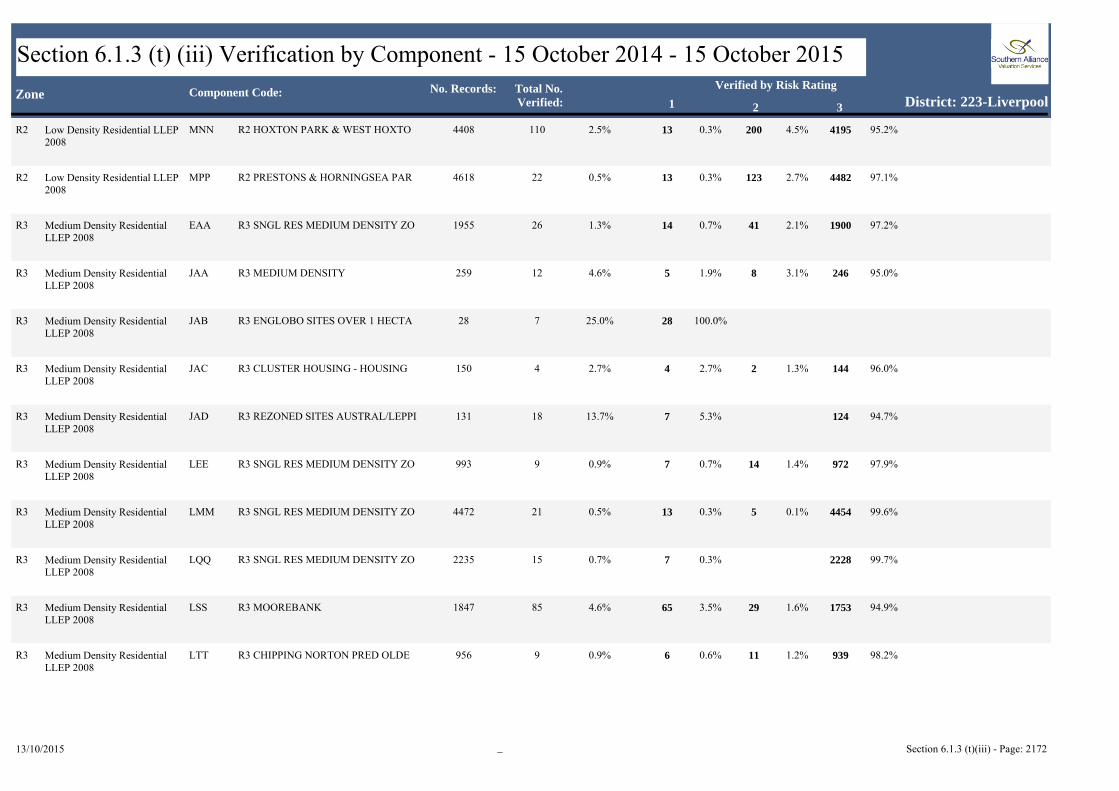
Zone
Section 6.1.3 (t) (iii) Verification by Component - 15 October 2014 - 15 October 2015Component Code: Total No.
Verified:
No. Records: Verified by Risk Rating
1 2 3 District: 223-Liverpool
R2 Low Density Residential LLEP 2008
MNN 110R2 HOXTON PARK & WEST HOXTO 4408 13 200 41952.5% 0.3% 4.5% 95.2%
R2 Low Density Residential LLEP 2008
MPP 22R2 PRESTONS & HORNINGSEA PAR 4618 13 123 44820.5% 0.3% 2.7% 97.1%
R3 Medium Density Residential LLEP 2008
EAA 26R3 SNGL RES MEDIUM DENSITY ZO 1955 14 41 19001.3% 0.7% 2.1% 97.2%
R3 Medium Density Residential LLEP 2008
JAA 12R3 MEDIUM DENSITY 259 5 8 2464.6% 1.9% 3.1% 95.0%
R3 Medium Density Residential LLEP 2008
JAB 7R3 ENGLOBO SITES OVER 1 HECTA 28 2825.0% 100.0%
R3 Medium Density Residential LLEP 2008
JAC 4R3 CLUSTER HOUSING - HOUSING 150 4 2 1442.7% 2.7% 1.3% 96.0%
R3 Medium Density Residential LLEP 2008
JAD 18R3 REZONED SITES AUSTRAL/LEPPI 131 7 12413.7% 5.3% 94.7%
R3 Medium Density Residential LLEP 2008
LEE 9R3 SNGL RES MEDIUM DENSITY ZO 993 7 14 9720.9% 0.7% 1.4% 97.9%
R3 Medium Density Residential LLEP 2008
LMM 21R3 SNGL RES MEDIUM DENSITY ZO 4472 13 5 44540.5% 0.3% 0.1% 99.6%
R3 Medium Density Residential LLEP 2008
LQQ 15R3 SNGL RES MEDIUM DENSITY ZO 2235 7 22280.7% 0.3% 99.7%
R3 Medium Density Residential LLEP 2008
LSS 85R3 MOOREBANK 1847 65 29 17534.6% 3.5% 1.6% 94.9%
R3 Medium Density Residential LLEP 2008
LTT 9R3 CHIPPING NORTON PRED OLDE 956 6 11 9390.9% 0.6% 1.2% 98.2%
13/10/2015 Section 6.1.3 (t)(iii) - Page: 2172_

Zone
Section 6.1.3 (t) (iii) Verification by Component - 15 October 2014 - 15 October 2015Component Code: Total No.
Verified:
No. Records: Verified by Risk Rating
1 2 3 District: 223-Liverpool
R4 High Density Residential LLEP 2008
AJJ 6R4 FLAT SITES UP TO THREE STORE 291 4 95 1922.1% 1.4% 32.6% 66.0%
R4 High Density Residential LLEP 2008
HAA 29R4 HIGH DENSITY RESIDENTIAL - 2201 17 150 20341.3% 0.8% 6.8% 92.4%
R4 High Density Residential LLEP 2008
MDD 14R4 CBD MEDIUM DENSITY & PART 214 12 8 1946.5% 5.6% 3.7% 90.7%
R4 High Density Residential LLEP 2008
TRR 7R4 TOWNCENTRE HIGH DENSITY R 41 2 3917.1% 4.9% 95.1%
R5 Large Lot Residential LLEP 2008
REE 9R5 DENHAM COURT UP TO 1.5 HEC 182 8 1 1734.9% 4.4% 0.5% 95.1%
R5 Large Lot Residential LLEP 2008
TTT 10R5 LARGE RES SITES -WALLACIA - 169 10 11 1485.9% 5.9% 6.5% 87.6%
RE1 Public Recreation LLEP 2008 AGG 3RE1 MOOREBANK FLOODWAY- VA 107 3 1 1032.8% 2.8% 0.9% 96.3%
RE1 Public Recreation LLEP 2008 GAA 5RE1 OPEN SPACE - UP TO 1000 SQM 121 4 2 1154.1% 3.3% 1.7% 95.0%
RE1 Public Recreation LLEP 2008 GBB 9RE1 OPEN SPACE - 1001 SQM TO 1 H 395 4 17 3742.3% 1.0% 4.3% 94.7%
RE1 Public Recreation LLEP 2008 GEE 10RE1 OPEN SPACE - 1.1 HA + 245 5 14 2264.1% 2.0% 5.7% 92.2%
RE2 Private Recreation LLEP 2008 NAA 7RE2 PRIVATE RECREATION 17 4 1 1241.2% 23.5% 5.9% 70.6%
RU1 Primary Production LLEP 2008 RBB 7RU1 RURAL ( => 25HA'S - LIVERPOO 48 4 3 4114.6% 8.3% 6.3% 85.4%
RU1 Primary Production LLEP 2008 RHH 6RU1 RURAL (5 HA'S UP TO 24 HA'S) 118 5 1 1125.1% 4.2% 0.8% 94.9%
13/10/2015 Section 6.1.3 (t)(iii) - Page: 2173_

Zone
Section 6.1.3 (t) (iii) Verification by Component - 15 October 2014 - 15 October 2015Component Code: Total No.
Verified:
No. Records: Verified by Risk Rating
1 2 3 District: 223-Liverpool
RU1 Primary Production LLEP 2008 RKK 6RU1 RURAL (< 5HA'S) 96 4 5 876.3% 4.2% 5.2% 90.6%
RU2 Rural Landscape LLEP 2008 RGG 6RU2 DENHAM COURT 82 5 5 727.3% 6.1% 6.1% 87.8%
RU4 Primary Production Small Lots LLEP 2008
RDD 40RU4 BRINGELLY,KEMPS CREEK & L 1363 26 6 13312.9% 1.9% 0.4% 97.7%
RU6 Transition SEPP SRGC 2006 RUA 3RU6 TRANSITION 15 3 1220.0% 20.0% 80.0%
SP1 Special Activities LLEP 2008 SDD 5SP1 SPECIAL USES - SPECIAL ACTIV 231 4 5 2222.2% 1.7% 2.2% 96.1%
SP2 Infrastructure LLEP 2008 SAA 20SP2 SPECIAL USES - 9001 SQM + 89 11 9 6922.5% 12.4% 10.1% 77.5%
SP2 Infrastructure LLEP 2008 SBB 6SP2 SPECIAL USES - 1001 - 9000 SQM 111 4 3 1045.4% 3.6% 2.7% 93.7%
SP2 Infrastructure LLEP 2008 SCC 7SP2 SPECIAL USES - UNDER 1000 SQ 138 5 9 1245.1% 3.6% 6.5% 89.9%
Z SEPP Western Sydney Parklands
ZBB 4Z WESTERN SYDNEY PARKLANDS 122 4 14 1043.3% 3.3% 11.5% 85.2%
Total Verified 737355867
13/10/2015 Section 6.1.3 (t)(iii) - Page: 2174_

SALE & RESALE ANNEXURES ANNEXURE(S)
Due to the large volume of ‘Sales and Resales’ throughout the Liverpool LGA – Please refer to the below annexures for a full list of ‘Sales and Resales’ as the analysis in the body of the report comprises only part of the total Sales and Resales. The Sales and Resales exhibited in the report annexures below are not an in-depth analysis as shown in the body of the report and the nature of each Sale and Resale should be investigated to further explain the increase over the period.

Contract Date Purchase Price Property HouseNumber Property StreetName Property Locality Property Postcode Zone Component Code Sale Code Transfer Date % Movement
20150609 515000 19 ABERDEEN RD BUSBY 2168 R3 LMM AC 20150721
20140218 390000 19 ABERDEEN RD BUSBY 2168 R3 LMM AC 20140401
Contract Date Purchase Price Property HouseNumber Property StreetName Property Locality Property Postcode Zone Component Code Sale Code Transfer Date % Movement
20150619 1360000 29 ATKINSON ST LIVERPOOL 2170 R4 MDD AD 20150921
20140530 500000 29 ATKINSON ST LIVERPOOL 2170 R4 MDD AC 20140808
Contract Date Purchase Price Property HouseNumber Property StreetName Property Locality Property Postcode Zone Component Code Sale Code Transfer Date % Movement
20140919 495000 6 AYSHFORD ST CASULA 2170 R2 AAA AC 20141031
20140228 460000 6 AYSHFORD ST CASULA 2170 R2 AAA AC 20140428
Contract Date Purchase Price Property HouseNumber Property StreetName Property Locality Property Postcode Zone Component Code Sale Code Transfer Date % Movement
20141103 480000 122 BANKS RD MILLER 2168 R3 LMM AC 20141216
20140313 385000 122 BANKS RD MILLER 2168 R3 LMM AC 20140424
Contract Date Purchase Price Property HouseNumber Property StreetName Property Locality Property Postcode Zone Component Code Sale Code Transfer Date % Movement
20150814 500000 7 BENNISON RD HINCHINBROOK 2168 R2 ACC AC 20150904
20150701 482500 7 BENNISON RD HINCHINBROOK 2168 R2 ACC AC 20150812
Contract Date Purchase Price Property HouseNumber Property StreetName Property Locality Property Postcode Zone Component Code Sale Code Transfer Date % Movement
20150815 835000 3 BIMBERI ST HORNINGSEA PARK 2171 R2 MPP AC 20151012
20140430 680000 3 BIMBERI ST HORNINGSEA PARK 2171 R2 MPP AC 20140611
Contract Date Purchase Price Property HouseNumber Property StreetName Property Locality Property Postcode Zone Component Code Sale Code Transfer Date % Movement
20150307 550000 96 BOUNDARY RD LURNEA 2170 R2 ADD AC 20150504
20141121 435000 96 BOUNDARY RD LURNEA 2170 R2 ADD AC 20150116
Contract Date Purchase Price Property HouseNumber Property StreetName Property Locality Property Postcode Zone Component Code Sale Code Transfer Date % Movement
20141209 1750000 1132 BRINGELLY RD BRINGELLY 2556 RU4 RDD RR 20150331
20140212 1125000 1132 BRINGELLY RD BRINGELLY 2556 RU4 RDD RE 20140320
22.79%
26.44%
55.56%
32.05%
172.00%
7.61%
24.68%
3.63%

Contract Date Purchase Price Property HouseNumber Property StreetName Property Locality Property Postcode Zone Component Code Sale Code Transfer Date % Movement
20150506 620000 24 BRISBANE AVE LURNEA 2170 R2 ADD AC 20150629
20140205 465500 24 BRISBANE AVE LURNEA 2170 R2 ADD AC 20140319
Contract Date Purchase Price Property HouseNumber Property StreetName Property Locality Property Postcode Zone Component Code Sale Code Transfer Date
20150506 730000 56 BUSBY RD BUSBY 2168 R3 LMM AC 20150529
20150107 620000 56 BUSBY RD BUSBY 2168 R3 LMM AC 20150211
20140802 475000 56 BUSBY RD BUSBY 2168 R3 LMM AC 20141007
Contract Date Purchase Price Property HouseNumber Property StreetName Property Locality Property Postcode Zone Component Code Sale Code Transfer Date % Movement
20150728 900000 7 CANTELLO AVE HAMMONDVILLE 2170 R2 MEE AC 20150828
20140215 741000 7 CANTELLO AVE HAMMONDVILLE 2170 R2 MEE AC 20140407
Contract Date Purchase Price Property HouseNumber Property StreetName Property Locality Property Postcode Zone Component Code Sale Code Transfer Date % Movement
20150302 900000 27 CARMICHAEL DR WEST HOXTON 2171 R2 MNN AC 20150415
20140531 770000 27 CARMICHAEL DR WEST HOXTON 2171 R2 MNN AC 20140815
Contract Date Purchase Price Property HouseNumber Property StreetName Property Locality Property Postcode Zone Component Code Sale Code Transfer Date % Movement
20150708 1210000 15 CASULA RD CASULA 2170 R3 LEE AC 20150828
20150423 880000 15 CASULA RD CASULA 2170 R3 LEE AC 20150616
Contract Date Purchase Price Property HouseNumber Property StreetName Property Locality Property Postcode Zone Component Code Sale Code Transfer Date % Movement
20150627 730000 6 CHAPPEL AVE GREEN VALLEY 2168 R2 ASS AC 20151019
20140705 610000 6 CHAPPEL AVE GREEN VALLEY 2168 R2 ASS AC 20140818
Contract Date Purchase Price Property HouseNumber Property StreetName Property Locality Property Postcode Zone Component Code Sale Code Transfer Date % Movement
20150606 570000 14 COONONG ST BUSBY 2168 R3 LMM AC 20150720
20140307 412000 14 COONONG ST BUSBY 2168 R3 LMM AC 20140417
Contract Date Purchase Price Property HouseNumber Property StreetName Property Locality Property Postcode Zone Component Code Sale Code Transfer Date % Movement
20150908 575000 5 DORSET PL MILLER 2168 R4 HAA AC 20151020
20140512 460000 5 DORSET PL MILLER 2168 R4 HAA AC 20140627
37.50%
19.67%
38.35%
25.00%
33.19%
21.46%
16.88%

Contract Date Purchase Price Property HouseNumber Property StreetName Property Locality Property Postcode Zone Component Code Sale Code Transfer Date % Movement
20150417 530000 204 EDMONDSON AVE AUSTRAL 2179 R2 AWW AC 20150604
20140218 455000 204 EDMONDSON AVE AUSTRAL 2179 R2 AWW AC 20140401
Contract Date Purchase Price Property HouseNumber Property StreetName Property Locality Property Postcode Zone Component Code Sale Code Transfer Date % Movement
20150217 550000 44 ELLIS CRES MILLER 2168 R3 LMM AC 20150327
20141016 435000 44 ELLIS CRES MILLER 2168 R3 LMM AC 20150130
Contract Date Purchase Price Property HouseNumber Property StreetName Property Locality Property Postcode Zone Component Code Sale Code Transfer Date % Movement
20150604 820000 119 FLOWERDALE RD LIVERPOOL 2170 R3 LMM AC 20150805
20140222 562500 119 FLOWERDALE RD LIVERPOOL 2170 R3 LMM AC 20140331
Contract Date Purchase Price Property HouseNumber Property StreetName Property Locality Property Postcode Zone Component Code Sale Code Transfer Date % Movement
20150307 515000 4 FRIESIAN ST BUSBY 2168 R3 LMM AC 20150423
20141113 380000 4 FRIESIAN ST BUSBY 2168 R3 LMM AC 20141218
Contract Date Purchase Price Property HouseNumber Property StreetName Property Locality Property Postcode Zone Component Code Sale Code Transfer Date % Movement
20150912 710000 1 B GERALD ST CECIL HILLS 2171 R2 ASS AC 20151026
20150516 650500 1 B GERALD ST CECIL HILLS 2171 R2 ASS AC 20150727
Contract Date Purchase Price Property HouseNumber Property StreetName Property Locality Property Postcode Zone Component Code Sale Code Transfer Date % Movement
20140905 820000 5 GLENALVON PL WEST HOXTON 2171 R2 MNN AC 20141105
20140201 607000 5 GLENALVON PL WEST HOXTON 2171 R2 MNN AC 20140221
Contract Date Purchase Price Property HouseNumber Property StreetName Property Locality Property Postcode Zone Component Code Sale Code Transfer Date % Movement
20150521 990000 10 GOOSE CL HINCHINBROOK 2168 R2 ACC AC 20150618
20140729 750000 10 GOOSE CL HINCHINBROOK 2168 R2 ACC AC 20140828
Contract Date Purchase Price Property HouseNumber Property StreetName Property Locality Property Postcode Zone Component Code Sale Code Transfer Date % Movement
20150114 625000 9 GOVE AVE GREEN VALLEY 2168 R2 LJJ AC 20150223
20140110 580000 9 GOVE AVE GREEN VALLEY 2168 R2 LJJ AC 20140226
45.78%
35.53%
9.15%
35.09%
32.00%
7.76%
16.48%
26.44%

Contract Date Purchase Price Property HouseNumber Property StreetName Property Locality Property Postcode Zone Component Code Sale Code Transfer Date % Movement
20150703 700000 15 GRACE ST LIVERPOOL 2170 R2 ADD AC 20150814
20140627 500000 15 GRACE ST LIVERPOOL 2170 R2 ADD AC 20140811
Contract Date Purchase Price Property HouseNumber Property StreetName Property Locality Property Postcode Zone Component Code Sale Code Transfer Date % Movement
20150806 550000 9 GUERNSEY ST BUSBY 2168 R3 LMM AC 20150917
20140527 435000 9 GUERNSEY ST BUSBY 2168 R3 LMM AC 20140708
Contract Date Purchase Price Property HouseNumber Property StreetName Property Locality Property Postcode Zone Component Code Sale Code Transfer Date % Movement
20150528 1080000 39 HARRADEN DR WEST HOXTON 2171 R2 MNN AC 20150709
20141020 780000 39 HARRADEN DR WEST HOXTON 2171 R2 MNN AC 20141105
Contract Date Purchase Price Property HouseNumber Property StreetName Property Locality Property Postcode Zone Component Code Sale Code Transfer Date % Movement
20150718 690000 10 HERRICK CL WEST HOXTON 2171 R2 MNN AC 20150824
20150114 640000 10 HERRICK CL WEST HOXTON 2171 R2 MNN AC 20150206
Contract Date Purchase Price Property HouseNumber Property StreetName Property Locality Property Postcode Zone Component Code Sale Code Transfer Date % Movement
20150820 540000 9 HUNTLEY PL CARTWRIGHT 2168 R3 LMM AC 20151001
20150528 475000 9 HUNTLEY PL CARTWRIGHT 2168 R3 LMM AC 20150709
Contract Date Purchase Price Property HouseNumber Property StreetName Property Locality Property Postcode Zone Component Code Sale Code Transfer Date % Movement
20141204 618000 11 JULIA CL WEST HOXTON 2171 R2 APP AC 20150227
20140319 522000 11 JULIA CL WEST HOXTON 2171 R2 APP AC 20140424
Contract Date Purchase Price Property HouseNumber Property StreetName Property Locality Property Postcode Zone Component Code Sale Code Transfer Date % Movement
20150806 585000 5 JASPERS CT PRESTONS 2170 R2 MPP AC 20150917
20140415 432500 5 JASPERS CT PRESTONS 2170 R2 MPP AC 20140528
Contract Date Purchase Price Property HouseNumber Property StreetName Property Locality Property Postcode Zone Component Code Sale Code Transfer Date % Movement
20150317 620000 80 LIVERPOOL ST LIVERPOOL 2170 R2 ADD AC 20150428
20141020 522500 80 LIVERPOOL ST LIVERPOOL 2170 R2 ADD AC 20141201
35.26%
18.66%
40.00%
26.44%
38.46%
7.81%
13.68%
18.39%

Contract Date Purchase Price Property HouseNumber Property StreetName Property Locality Property Postcode Zone Component Code Sale Code Transfer Date % Movement
20150523 1400000 6 LONDON CT CECIL HILLS 2171 R2 ASS AC 20150714
20141213 1196100 6 LONDON CT CECIL HILLS 2171 R2 ASS AC 20150212
Contract Date Purchase Price Property HouseNumber Property StreetName Property Locality Property Postcode Zone Component Code Sale Code Transfer Date % Movement
20150606 784000 109 LORD HOWE DR HINCHINBROOK 2168 R2 ACC AC 20150710
20141025 635000 109 LORD HOWE DR HINCHINBROOK 2168 R2 ACC AC 20141208
Contract Date Purchase Price Property HouseNumber Property StreetName Property Locality Property Postcode Zone Component Code Sale Code Transfer Date % Movement
20150730 856000 53 MCLEAN ST LIVERPOOL 2170 R2 ADD AC 20150910
20140317 560000 53 MCLEAN ST LIVERPOOL 2170 R2 ADD AC 20140610
Contract Date Purchase Price Property HouseNumber Property StreetName Property Locality Property Postcode Zone Component Code Sale Code Transfer Date % Movement
20141101 540000 9 MAINSBRIDGE AVE LIVERPOOL 2170 R3 LMM AV 20141201
20140526 482000 9 MAINSBRIDGE AVE LIVERPOOL 2170 R3 LMM AV 20140714
Contract Date Purchase Price Property HouseNumber Property StreetName Property Locality Property Postcode Zone Component Code Sale Code Transfer Date % Movement
20150704 675000 93 MAXWELLS AVE ASHCROFT 2168 R2 LHH AC 20150810
20140201 460000 93 MAXWELLS AVE ASHCROFT 2168 R2 LHH AC 20140321
Contract Date Purchase Price Property HouseNumber Property StreetName Property Locality Property Postcode Zone Component Code Sale Code Transfer Date % Movement
20150108 525000 67 MAXWELLS AVE ASHCROFT 2168 R3 LMM AC 20150217
20140212 398000 67 MAXWELLS AVE ASHCROFT 2168 R3 LMM AC 20140326
Contract Date Purchase Price Property HouseNumber Property StreetName Property Locality Property Postcode Zone Component Code Sale Code Transfer Date % Movement
20140416 465000 150 MAXWELLS AVE SADLEIR 2168 R2 LHH AC 20140529
20140219 365000 150 MAXWELLS AVE SADLEIR 2168 R2 LHH AC 20140307
Contract Date Purchase Price Property HouseNumber Property StreetName Property Locality Property Postcode Zone Component Code Sale Code Transfer Date % Movement
20150720 735000 86 MEDLEY AVE LIVERPOOL 2170 R2 LLL AC 20150928
20140709 510000 86 MEDLEY AVE LIVERPOOL 2170 R2 LLL AC 20140829
46.74%
31.91%
27.40%
44.12%
17.05%
23.46%
52.86%
12.03%

Contract Date Purchase Price Property HouseNumber Property StreetName Property Locality Property Postcode Zone Component Code Sale Code Transfer Date % Movement
20150819 750000 21 MORTON CT WATTLE GROVE 2173 R3 LQQ AC 20150928
20140317 640000 21 MORTON CT WATTLE GROVE 2173 R3 LQQ AC 20140416
Contract Date Purchase Price Property HouseNumber Property StreetName Property Locality Property Postcode Zone Component Code Sale Code Transfer Date % Movement
20150212 700000 22 NILAND WAY CASULA 2170 R2 AAA AV 20150220
20140328 520000 22 NILAND WAY CASULA 2170 R2 AAA AV 20140602
Contract Date Purchase Price Property HouseNumber Property StreetName Property Locality Property Postcode Zone Component Code Sale Code Transfer Date % Movement
20141102 641000 15 OLIVERI CRES GREEN VALLEY 2168 R2 LJJ AC 20141216
20140218 571000 15 OLIVERI CRES GREEN VALLEY 2168 R2 LJJ AC 20140417
Contract Date Purchase Price Property HouseNumber Property StreetName Property Locality Property Postcode Zone Component Code Sale Code Transfer Date % Movement
20141217 520000 13 O'NEILE CRES LURNEA 2170 R3 LMM AC 20150302
20140224 406000 13 O'NEILE CRES LURNEA 2170 R3 LMM AC 20140407
Contract Date Purchase Price Property HouseNumber Property StreetName Property Locality Property Postcode Zone Component Code Sale Code Transfer Date % Movement
20140716 870000 35 ORLEANS CCT CECIL HILLS 2171 R3 EAA AC 20140813
20140301 855000 35 ORLEANS CCT CECIL HILLS 2171 R3 EAA AC 20140526
Contract Date Purchase Price Property HouseNumber Property StreetName Property Locality Property Postcode Zone Component Code Sale Code Transfer Date % Movement
20150123 935000 12 PULHAM PL CHIPPING NORTON 2170 R2 AFF AC 20150220
20140524 875000 12 PULHAM PL CHIPPING NORTON 2170 R2 AFF AC 20140623
Contract Date Purchase Price Property HouseNumber Property StreetName Property Locality Property Postcode Zone Component Code Sale Code Transfer Date % Movement
20150407 700000 8 QUOTA AVE CHIPPING NORTON 2170 R2 AFF AC 20150619
20140212 672000 8 QUOTA AVE CHIPPING NORTON 2170 R2 AFF AC 20140415
Contract Date Purchase Price Property HouseNumber Property StreetName Property Locality Property Postcode Zone Component Code Sale Code Transfer Date % Movement
20141204 625000 45 REILLY ST LIVERPOOL 2170 R2 ADD AC 20150218
20140531 536000 45 REILLY ST LIVERPOOL 2170 R2 ADD AC 20140714
12.26%
28.08%
1.75%
6.86%
4.17%
16.60%
17.19%
34.62%

Contract Date Purchase Price Property HouseNumber Property StreetName Property Locality Property Postcode Zone Component Code Sale Code Transfer Date % Movement
20150304 625000 8 RUNDLE RD GREEN VALLEY 2168 R2 LJJ AC 20150415
20140107 542500 8 RUNDLE RD GREEN VALLEY 2168 R2 LJJ AC 20140218
Contract Date Purchase Price Property HouseNumber Property StreetName Property Locality Property Postcode Zone Component Code Sale Code Transfer Date % Movement
20150619 4000000 25 RYNAN AVE EDMONDSON PARK 2174 R1 MUU AE 20150819
20140329 2080000 25 RYNAN AVE EDMONDSON PARK 2174 R1 MUU AC 20140602
Contract Date Purchase Price Property HouseNumber Property StreetName Property Locality Property Postcode Zone Component Code Sale Code Transfer Date % Movement
20150616 635000 128 SADLEIR AVE HECKENBERG 2168 R2 LHH AC 20150811
20150303 550000 128 SADLEIR AVE HECKENBERG 2168 R2 LHH AC 20150424
Contract Date Purchase Price Property HouseNumber Property StreetName Property Locality Property Postcode Zone Component Code Sale Code Transfer Date % Movement
20140721 530000 21 ST JOHNS RD BUSBY 2168 R3 LMM AC 20140827
20140208 420000 21 ST JOHNS RD BUSBY 2168 R3 LMM AC 20140324
Contract Date Purchase Price Property HouseNumber Property StreetName Property Locality Property Postcode Zone Component Code Sale Code Transfer Date % Movement
20150825 552000 3 ST JOHNS RD BUSBY 2168 R3 LMM AC 20151007
20140808 425000 3 ST JOHNS RD BUSBY 2168 R3 LMM AC 20141017
Contract Date Purchase Price Property HouseNumber Property StreetName Property Locality Property Postcode Zone Component Code Sale Code Transfer Date % Movement
20140617 492500 7 SELWYN PL CARTWRIGHT 2168 R4 HAA AC 20140825
20140128 395000 7 SELWYN PL CARTWRIGHT 2168 R4 HAA AC 20140214
Contract Date Purchase Price Property HouseNumber Property StreetName Property Locality Property Postcode Zone Component Code Sale Code Transfer Date % Movement
20150211 625000 31 SIMONE CRES CASULA 2170 R4 HAA AC 20150211
20140328 601000 31 SIMONE CRES CASULA 2170 R4 HAA AC 20140512
Contract Date Purchase Price Property HouseNumber Property StreetName Property Locality Property Postcode Zone Component Code Sale Code Transfer Date % Movement
20150506 725000 38 SOUTH PACIFIC AVE MOUNT PRITCHARD 2170 R2 LLL AC 20150703
20141101 640000 38 SOUTH PACIFIC AVE MOUNT PRITCHARD 2170 R2 LLL AC 20150118
24.68%
3.99%
13.28%
15.21%
92.31%
15.45%
26.19%
29.88%

Contract Date Purchase Price Property HouseNumber Property StreetName Property Locality Property Postcode Zone Component Code Sale Code Transfer Date % Movement
20150306 765000 87 STEWART AVE HAMMONDVILLE 2170 R2 MEE AC 20150423
20140124 570000 87 STEWART AVE HAMMONDVILLE 2170 R2 MEE AC 20140423
Contract Date Purchase Price Property HouseNumber Property StreetName Property Locality Property Postcode Zone Component Code Sale Code Transfer Date % Movement
20150408 640000 35 SWAN CCT GREEN VALLEY 2168 R3 EAA AC 20150518
20140311 502500 35 SWAN CCT GREEN VALLEY 2168 R3 EAA AC 20140417
Contract Date Purchase Price Property HouseNumber Property StreetName Property Locality Property Postcode Zone Component Code Sale Code Transfer Date % Movement
20150711 691000 22 TAMINGA RD GREEN VALLEY 2168 R2 LJJ AC 20150824
20140129 485000 22 TAMINGA RD GREEN VALLEY 2168 R2 LJJ AC 20140310
Contract Date Purchase Price Property HouseNumber Property StreetName Property Locality Property Postcode Zone Component Code Sale Code Transfer Date
20150729 590000 2 TARANA CL CASULA 2170 R3 LEE AV 20150911
20150127 475000 2 TARANA CL CASULA 2170 R3 LEE AV 20150310
20140315 375000 2 TARANA CL CASULA 2170 R3 LEE AV 20140723
Contract Date Purchase Price Property HouseNumber Property StreetName Property Locality Property Postcode Zone Component Code Sale Code Transfer Date % Movement
20141220 540000 3 TOOMA PL HECKENBERG 2168 R2 LHH AC 20150210
20140929 460000 3 TOOMA PL HECKENBERG 2168 R2 LHH AC 20141110
Contract Date Purchase Price Property HouseNumber Property StreetName Property Locality Property Postcode Zone Component Code Sale Code Transfer Date % Movement
20141016 470000 21 TREVANNA ST BUSBY 2168 R2 LHH AC 20141119
20140113 382000 21 TREVANNA ST BUSBY 2168 R2 LHH AC 20140325
Contract Date Purchase Price Property HouseNumber Property StreetName Property Locality Property Postcode Zone Component Code Sale Code Transfer Date % Movement
20150328 737000 3 WARBLER CL HINCHINBROOK 2168 R2 ACC AC 20150511
20140322 620500 3 WARBLER CL HINCHINBROOK 2168 R2 ACC AC 20140429
Contract Date Purchase Price Property HouseNumber Property StreetName Property Locality Property Postcode Zone Component Code Sale Code Transfer Date % Movement
20150624 740000 121 WEBSTER RD LURNEA 2170 R2 ADD AC 20150805
20141002 600000 121 WEBSTER RD LURNEA 2170 R2 ADD AC 20141117
17.39%
23.04%
18.78%
23.33%
34.21%
27.36%
42.47%

Contract Date Purchase Price Property HouseNumber Property StreetName Property Locality Property Postcode Zone Component Code Sale Code Transfer Date % Movement
20140629 635000 25 WOMBEYAN CT WATTLE GROVE 2173 R2 MEE AC 20140806
20140111 581000 25 WOMBEYAN CT WATTLE GROVE 2173 R2 MEE AC 20140224
Contract Date Purchase Price Property HouseNumber Property StreetName Property Locality Property Postcode Zone Component Code Sale Code Transfer Date % Movement
20150116 350000 137 WHITFORD RD HINCHINBROOK 2168 R2 ACC AV 20150223
20141108 320000 137 WHITFORD RD HINCHINBROOK 2168 R2 ACC AV 20141127
Contract Date Purchase Price Property HouseNumber Property StreetName Property Locality Property Postcode Zone Component Code Sale Code Transfer Date % Movement
20150216 720000 25 WATLING AVE WEST HOXTON 2171 R2 MNN AC 20150401
20140112 610000 25 WATLING AVE WEST HOXTON 2171 R2 MNN AC 20140313
Contract Date Purchase Price Property HouseNumber Property StreetName Property Locality Property Postcode Zone Component Code Sale Code Transfer Date % Movement
20150430 635000 8 SAWTELL CL HOXTON PARK 2171 R2 MNN AC 20150604
20140520 530000 8 SAWTELL CL HOXTON PARK 2171 R2 MNN AC 20140701
Contract Date Purchase Price Property HouseNumber Property StreetName Property Locality Property Postcode Zone Component Code Sale Code Transfer Date % Movement
20151021 740000 2 LABUAN RD HOLSWORTHY 2173 R3 LQQ AC 20151022
20140128 590000 2 LABUAN RD HOLSWORTHY 2173 R3 LQQ AC 20140304
Contract Date Purchase Price Property HouseNumber Property StreetName Property Locality Property Postcode Zone Component Code Sale Code Transfer Date % Movement
20140725 400000 43 VENEZIA ST PRESTONS 2170 R2 MPP AV 20140910
20140224 365333 43 VENEZIA ST PRESTONS 2170 R2 MPP AV 20140416
Contract Date Purchase Price Property HouseNumber Property StreetName Property Locality Property Postcode Zone Component Code Sale Code Transfer Date % Movement
20150420 540000 72 PLEASURE POINT RD PLEASURE POINT 2172 R5 REE AV 20150529
20140225 440000 72 PLEASURE POINT RD PLEASURE POINT 2172 R5 REE AV 20140410
Contract Date Purchase Price Property HouseNumber Property StreetName Property Locality Property Postcode Zone Component Code Sale Code Transfer Date % Movement
20140531 3722400 STRATHYRE DR PRESTONS 2170 R2 AHH AV 20140627
20140531 2481600 STRATHYRE DR PRESTONS 2170 R2 AHH AV 20140627
22.73%
50.00%
9.29%
9.38%
18.03%
19.81%
25.42%
9.49%

Contract Date Purchase Price Property HouseNumber Property StreetName Property Locality Property Postcode Zone Component Code Sale Code Transfer Date % Movement
20150815 435000 1 KIMBERLEY DR EDMONDSON PARK 2174 R1 DAA AV 20150928
20140408 406000 1 KIMBERLEY DR EDMONDSON PARK 2174 R1 DAA AV 20140521
Contract Date Purchase Price Property HouseNumber Property StreetName Property Locality Property Postcode Zone Component Code Sale Code Transfer Date % Movement
20150530 1055000 7 PENTLAND RD MIDDLETON GRANGE 2171 R1 DAA AC 20150713
20140910 930000 7 PENTLAND RD MIDDLETON GRANGE 2171 R1 DAA AC 20141128
Contract Date Purchase Price Property HouseNumber Property StreetName Property Locality Property Postcode Zone Component Code Sale Code Transfer Date % Movement
20150417 447000 SOUTHERN CROSS AVE MIDDLETON GRANGE 2171 R1 DAA AV 20150701
20140612 340000 SOUTHERN CROSS AVE MIDDLETON GRANGE 2171 R1 DAA AV 20140910
Contract Date Purchase Price Property HouseNumber Property StreetName Property Locality Property Postcode Zone Component Code Sale Code Transfer Date % Movement
20150611 450000 MONKTON AVE MIDDLETON GRANGE 2171 R1 DAA AV 20150715
20150130 390000 MONKTON AVE MIDDLETON GRANGE 2171 R1 DAA AV 20150227
Contract Date Purchase Price Property HouseNumber Property StreetName Property Locality Property Postcode Zone Component Code Sale Code Transfer Date % Movement
20150706 680000 17 CLEMENT RD EDMONDSON PARK 2174 R1 DAA AC 20150810
20140321 370000 17 CLEMENT RD EDMONDSON PARK 2174 R1 DAA AV 20140423
Contract Date Purchase Price Property HouseNumber Property StreetName Property Locality Property Postcode Zone Component Code Sale Code Transfer Date % Movement
20140512 340000 18 TURIN PL PRESTONS 2170 R2 MPP AV 20140616
20140115 320000 18 TURIN PL PRESTONS 2170 R2 MPP AV 20140320
Contract Date Purchase Price Property HouseNumber Property StreetName Property Locality Property Postcode Zone Component Code Sale Code Transfer Date % Movement
20140829 355000 7 LEETON RD HINCHINBROOK 2168 R2 MNN AC 20141023
20140520 295000 7 LEETON RD HINCHINBROOK 2168 R2 MNN AV 20140520
Contract Date Purchase Price Property HouseNumber Property StreetName Property Locality Property Postcode Zone Component Code Sale Code Transfer Date % Movement
20150313 410000 44 INVERELL AVE HINCHINBROOK 2168 R2 MNN AV 20150415
20140204 295000 44 INVERELL AVE HINCHINBROOK 2168 R2 MNN AV 20140311
83.78%
6.25%
20.34%
38.98%
7.14%
13.44%
31.47%
15.38%
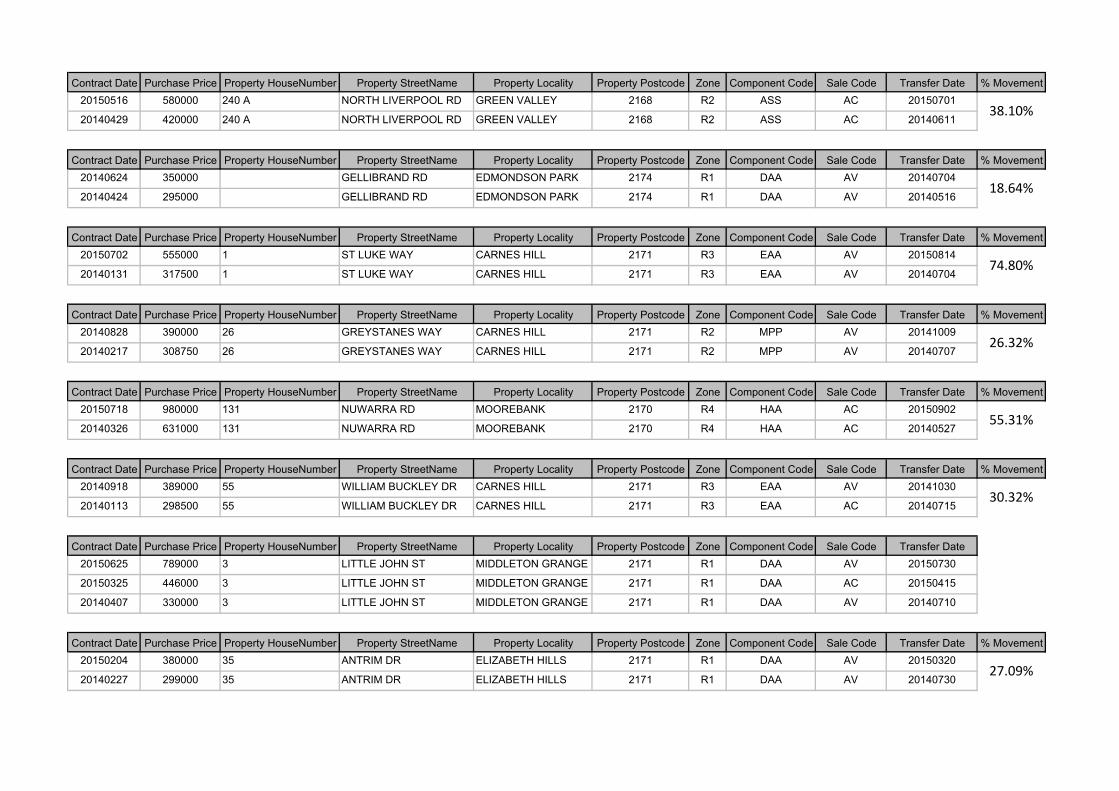
Contract Date Purchase Price Property HouseNumber Property StreetName Property Locality Property Postcode Zone Component Code Sale Code Transfer Date % Movement
20150516 580000 240 A NORTH LIVERPOOL RD GREEN VALLEY 2168 R2 ASS AC 20150701
20140429 420000 240 A NORTH LIVERPOOL RD GREEN VALLEY 2168 R2 ASS AC 20140611
Contract Date Purchase Price Property HouseNumber Property StreetName Property Locality Property Postcode Zone Component Code Sale Code Transfer Date % Movement
20140624 350000 GELLIBRAND RD EDMONDSON PARK 2174 R1 DAA AV 20140704
20140424 295000 GELLIBRAND RD EDMONDSON PARK 2174 R1 DAA AV 20140516
Contract Date Purchase Price Property HouseNumber Property StreetName Property Locality Property Postcode Zone Component Code Sale Code Transfer Date % Movement
20150702 555000 1 ST LUKE WAY CARNES HILL 2171 R3 EAA AV 20150814
20140131 317500 1 ST LUKE WAY CARNES HILL 2171 R3 EAA AV 20140704
Contract Date Purchase Price Property HouseNumber Property StreetName Property Locality Property Postcode Zone Component Code Sale Code Transfer Date % Movement
20140828 390000 26 GREYSTANES WAY CARNES HILL 2171 R2 MPP AV 20141009
20140217 308750 26 GREYSTANES WAY CARNES HILL 2171 R2 MPP AV 20140707
Contract Date Purchase Price Property HouseNumber Property StreetName Property Locality Property Postcode Zone Component Code Sale Code Transfer Date % Movement
20150718 980000 131 NUWARRA RD MOOREBANK 2170 R4 HAA AC 20150902
20140326 631000 131 NUWARRA RD MOOREBANK 2170 R4 HAA AC 20140527
Contract Date Purchase Price Property HouseNumber Property StreetName Property Locality Property Postcode Zone Component Code Sale Code Transfer Date % Movement
20140918 389000 55 WILLIAM BUCKLEY DR CARNES HILL 2171 R3 EAA AV 20141030
20140113 298500 55 WILLIAM BUCKLEY DR CARNES HILL 2171 R3 EAA AC 20140715
Contract Date Purchase Price Property HouseNumber Property StreetName Property Locality Property Postcode Zone Component Code Sale Code Transfer Date
20150625 789000 3 LITTLE JOHN ST MIDDLETON GRANGE 2171 R1 DAA AV 20150730
20150325 446000 3 LITTLE JOHN ST MIDDLETON GRANGE 2171 R1 DAA AC 20150415
20140407 330000 3 LITTLE JOHN ST MIDDLETON GRANGE 2171 R1 DAA AV 20140710
Contract Date Purchase Price Property HouseNumber Property StreetName Property Locality Property Postcode Zone Component Code Sale Code Transfer Date % Movement
20150204 380000 35 ANTRIM DR ELIZABETH HILLS 2171 R1 DAA AV 20150320
20140227 299000 35 ANTRIM DR ELIZABETH HILLS 2171 R1 DAA AV 20140730
74.80%
26.32%
55.31%
30.32%
27.09%
38.10%
18.64%

Contract Date Purchase Price Property HouseNumber Property StreetName Property Locality Property Postcode Zone Component Code Sale Code Transfer Date % Movement
20150324 800000 5 RENSBERG WAY EDMONDSON PARK 2174 R1 DAA AC 20150427
20140508 670200 5 RENSBERG WAY EDMONDSON PARK 2174 R1 DAA AC 20150227
Contract Date Purchase Price Property HouseNumber Property StreetName Property Locality Property Postcode Zone Component Code Sale Code Transfer Date % Movement
20150210 366000 3 SETTLER CT CARNES HILL 2171 R3 EAA AV 20150325
20140303 289000 3 SETTLER CT CARNES HILL 2171 R3 EAA AV 20140826
Contract Date Purchase Price Property HouseNumber Property StreetName Property Locality Property Postcode Zone Component Code Sale Code Transfer Date % Movement
20140910 315000 103 DOBROYD DR ELIZABETH HILLS 2171 R1 DAA AV 20140926
20140910 280000 103 DOBROYD DR ELIZABETH HILLS 2171 R1 DAA AC 20140926
Contract Date Purchase Price Property HouseNumber Property StreetName Property Locality Property Postcode Zone Component Code Sale Code Transfer Date % Movement
20140904 468000 16 HERTFORDSHIRE ST ELIZABETH HILLS 2171 R1 DAA AV 20141003
20140227 399500 16 HERTFORDSHIRE ST ELIZABETH HILLS 2171 R1 DAA AV 20141003
Contract Date Purchase Price Property HouseNumber Property StreetName Property Locality Property Postcode Zone Component Code Sale Code Transfer Date % Movement
20150319 430000 18 HERTFORDSHIRE ST ELIZABETH HILLS 2171 R1 DAA AV 20150420
20140319 389500 18 HERTFORDSHIRE ST ELIZABETH HILLS 2171 R1 DAA AV 20140922
Contract Date Purchase Price Property HouseNumber Property StreetName Property Locality Property Postcode Zone Component Code Sale Code Transfer Date % Movement
20141204 490000 37 ROSEBANK AVE ELIZABETH HILLS 2171 R1 DAA AV 20150129
20140501 410000 37 ROSEBANK AVE ELIZABETH HILLS 2171 R1 DAA AV 20140923
Contract Date Purchase Price Property HouseNumber Property StreetName Property Locality Property Postcode Zone Component Code Sale Code Transfer Date % Movement
20150822 687500 13 POPLAR AVE ELIZABETH HILLS 2171 R1 DAA AV 20151006
20140411 434900 13 POPLAR AVE ELIZABETH HILLS 2171 R1 DAA AV 20140923
Contract Date Purchase Price Property HouseNumber Property StreetName Property Locality Property Postcode Zone Component Code Sale Code Transfer Date % Movement
20150611 650000 68 POPLAR AVE ELIZABETH HILLS 2171 R1 DAA AV 20150723
20140403 459900 68 POPLAR AVE ELIZABETH HILLS 2171 R1 DAA AV 20140923
58.08%
41.34%
19.37%
26.64%
12.50%
17.15%
10.40%
19.51%

Contract Date Purchase Price Property HouseNumber Property StreetName Property Locality Property Postcode Zone Component Code Sale Code Transfer Date % Movement
20150401 435000 22 ALPINE PL CARNES HILL 2171 R3 EAA AV 20150626
20150213 410000 22 ALPINE PL CARNES HILL 2171 R3 EAA AV 20150320
Contract Date Purchase Price Property HouseNumber Property StreetName Property Locality Property Postcode Zone Component Code Sale Code Transfer Date % Movement
20150124 449000 42 MARY WADE PL CARNES HILL 2171 R2 MNN AV 20150311
20141105 294250 42 MARY WADE PL CARNES HILL 2171 R2 MNN AV 20141202
Contract Date Purchase Price Property HouseNumber Property StreetName Property Locality Property Postcode Zone Component Code Sale Code Transfer Date % Movement
20150220 450000 4 SAMUEL CT CARNES HILL 2171 R2 MNN AV 20150402
20140224 425000 4 SAMUEL CT CARNES HILL 2171 R2 MNN AV 20141114
Contract Date Purchase Price Property HouseNumber Property StreetName Property Locality Property Postcode Zone Component Code Sale Code Transfer Date % Movement
20150319 389000 KINGSBURY RD EDMONDSON PARK 2174 R1 DAA AV 20150427
20141116 325000 KINGSBURY RD EDMONDSON PARK 2174 R1 DAA AV 20141223
Contract Date Purchase Price Property HouseNumber Property StreetName Property Locality Property Postcode Zone Component Code Sale Code Transfer Date % Movement
20150823 560000 KINGSBURY RD EDMONDSON PARK 2174 R1 DAA AV 20151006
20141129 435000 KINGSBURY RD EDMONDSON PARK 2174 R1 DAA AV 20141223
Contract Date Purchase Price Property HouseNumber Property StreetName Property Locality Property Postcode Zone Component Code Sale Code Transfer Date % Movement
20141205 390000 KINGSBURY RD EDMONDSON PARK 2174 R1 DAA AV 20150130
20141106 305000 KINGSBURY RD EDMONDSON PARK 2174 R1 DAA AC 20141222
Contract Date Purchase Price Property HouseNumber Property StreetName Property Locality Property Postcode Zone Component Code Sale Code Transfer Date % Movement
20140409 525000 FREETAIL AVE ELIZABETH HILLS 2171 R1 DAA AC 20141118
20141203 600000 22 FREETAIL AVE ELIZABETH HILLS 2171 R1 DAA AC 20150123
Contract Date Purchase Price Property HouseNumber Property StreetName Property Locality Property Postcode Zone Component Code Sale Code Transfer Date % Movement
20140926 295000 5 ZAGREB ST PRESTONS 2170 R2 MPP AV 20150123
20141001 265000 5 ZAGREB ST PRESTONS 2170 R2 MPP AV 20141222
28.74%
27.87%
14.29%
11.32%
6.10%
52.59%
5.88%
19.69%

Contract Date Purchase Price Property HouseNumber Property StreetName Property Locality Property Postcode Zone Component Code Sale Code Transfer Date % Movement
20150711 320000 SPLIT CL PRESTONS 2170 R2 MPP AV 20150812
20141001 250000 SPLIT CL PRESTONS 2170 R2 MPP AV 20141222
Contract Date Purchase Price Property HouseNumber Property StreetName Property Locality Property Postcode Zone Component Code Sale Code Transfer Date % Movement
20150325 460000 KINGSBURY RD EDMONDSON PARK 2174 R1 DAA AV 20150429
20141205 305000 KINGSBURY RD EDMONDSON PARK 2174 R1 DAA AV 20141222
Contract Date Purchase Price Property HouseNumber Property StreetName Property Locality Property Postcode Zone Component Code Sale Code Transfer Date % Movement
20150430 490000 7 FREITAS RD EDMONDSON PARK 2174 R1 DAA AV 20150611
20141202 310000 7 FREITAS RD EDMONDSON PARK 2174 R1 DAA AV 20141223
Contract Date Purchase Price Property HouseNumber Property StreetName Property Locality Property Postcode Zone Component Code Sale Code Transfer Date % Movement
20140722 339950 DALMATIA AVE EDMONDSON PARK 2174 R1 DAA AV 20150303
20150526 373000 5 DALMATIA AVE EDMONDSON PARK 2174 R1 DAA AV 20150707
Contract Date Purchase Price Property HouseNumber Property StreetName Property Locality Property Postcode Zone Component Code Sale Code Transfer Date % Movement
20141223 412950 8 KURSK RD EDMONDSON PARK 2174 R1 DAA AV 20150501
20140916 402950 8 KURSK RD EDMONDSON PARK 2174 R1 DAA AV 20150305
Contract Date Purchase Price Property HouseNumber Property StreetName Property Locality Property Postcode Zone Component Code Sale Code Transfer Date % Movement
20150527 449000 4 KURSK RD EDMONDSON PARK 2174 R1 DAA AV 20150629
20140916 355950 4 KURSK RD EDMONDSON PARK 2174 R1 DAA AV 20150305
Contract Date Purchase Price Property HouseNumber Property StreetName Property Locality Property Postcode Zone Component Code Sale Code Transfer Date % Movement
20150807 940000 11 MERTELL DR EDMONDSON PARK 2174 R1 DAA AC 20150915
20141223 768020 11 MERTELL DR EDMONDSON PARK 2174 R1 DAA AC 20150626
Contract Date Purchase Price Property HouseNumber Property StreetName Property Locality Property Postcode Zone Component Code Sale Code Transfer Date % Movement
20150410 359900 MELALEUCA PL PRESTONS 2170 R2 MPP AV 20150618
20140414 309000 MELALEUCA PL PRESTONS 2170 R2 MPP AV 20150528
58.06%
9.72%
2.48%
26.14%
22.39%
16.47%
28.00%
50.82%

Contract Date Purchase Price Property HouseNumber Property StreetName Property Locality Property Postcode Zone Component Code Sale Code Transfer Date % Movement
20150615 399900 MELALEUCA PL PRESTONS 2170 R2 MPP AV 20150731
20140414 329000 MELALEUCA PL PRESTONS 2170 R2 MPP AV 20150528
Contract Date Purchase Price Property HouseNumber Property StreetName Property Locality Property Postcode Zone Component Code Sale Code Transfer Date % Movement
20150325 345000 89 FLYNN AVE MIDDLETON GRANGE 2171 R1 DAA AV 20150623
20140819 335000 89 FLYNN AVE MIDDLETON GRANGE 2171 R1 DAA AV 20150527
Contract Date Purchase Price Property HouseNumber Property StreetName Property Locality Property Postcode Zone Component Code Sale Code Transfer Date % Movement
20150121 380000 AFFLECK GDNS MIDDLETON GRANGE 2171 R1 DAA AV 20150604
20140923 325000 AFFLECK GDNS MIDDLETON GRANGE 2171 R1 DAA AV 20150601
Contract Date Purchase Price Property HouseNumber Property StreetName Property Locality Property Postcode Zone Component Code Sale Code Transfer Date % Movement
20150302 360000 AFFLECK GDNS MIDDLETON GRANGE 2171 R1 DAA AV 20150603
20140827 295000 AFFLECK GDNS MIDDLETON GRANGE 2171 R1 DAA AV 20150603
Contract Date Purchase Price Property HouseNumber Property StreetName Property Locality Property Postcode Zone Component Code Sale Code Transfer Date % Movement
20150727 380000 AFFLECK GDNS MIDDLETON GRANGE 2171 R1 DAA AV 20150904
20141203 280000 AFFLECK GDNS MIDDLETON GRANGE 2171 R1 DAA AV 20150528
Contract Date Purchase Price Property HouseNumber Property StreetName Property Locality Property Postcode Zone Component Code Sale Code Transfer Date % Movement
20141222 370000 AFFLECK GDN MIDDLETON GRANGE 2171 R1 DAA AV 20150528
20140909 305000 AFFLECK GDN MIDDLETON GRANGE 2171 R1 DAA AV 20150528
Contract Date Purchase Price Property HouseNumber Property StreetName Property Locality Property Postcode Zone Component Code Sale Code Transfer Date % Movement
20140909 315000 16 MELROSE ST MIDDLETON GRANGE 2171 R1 DAA AV 20150601
20141210 365000 16 MELROSE ST MIDDLETON GRANGE 2171 R1 DAA AV 20150603
Contract Date Purchase Price Property HouseNumber Property StreetName Property Locality Property Postcode Zone Component Code Sale Code Transfer Date % Movement
20141211 315000 20 MELROSE ST MIDDLETON GRANGE 2171 R1 DAA AV 20150528
20150210 360000 20 MELROSE ST MIDDLETON GRANGE 2171 R1 DAA AV 20150528
15.87%
14.29%
21.55%
2.99%
16.92%
22.03%
35.71%
21.31%

Contract Date Purchase Price Property HouseNumber Property StreetName Property Locality Property Postcode Zone Component Code Sale Code Transfer Date % Movement
20150331 360000 24 MELROSE ST MIDDLETON GRANGE 2171 R1 DAA AV 20150604
20141203 290000 24 MELROSE ST MIDDLETON GRANGE 2171 R1 DAA AV 20150601
Contract Date Purchase Price Property HouseNumber Property StreetName Property Locality Property Postcode Zone Component Code Sale Code Transfer Date % Movement
20150410 435000 155 MACKSVILLE ST CARNES HILL 2171 R2 MNN AV 20150605
20140915 341000 155 MACKSVILLE ST CARNES HILL 2171 R2 MNN AV 20150605
Contract Date Purchase Price Property HouseNumber Property StreetName Property Locality Property Postcode Zone Component Code Sale Code Transfer Date % Movement
20140520 340000 148 MACKSVILLE ST CARNES HILL 2171 R2 MNN AV 20150529
20150320 449950 148 MACKSVILLE ST CARNES HILL 2171 R2 MNN AV 20150529
Contract Date Purchase Price Property HouseNumber Property StreetName Property Locality Property Postcode Zone Component Code Sale Code Transfer Date % Movement
20141115 319500 35 MACKSVILLE ST CARNES HILL 2171 R2 MNN AV 20150610
20150429 369500 35 MACKSVILLE ST CARNES HILL 2171 R2 MNN AV 20150610
Contract Date Purchase Price Property HouseNumber Property StreetName Property Locality Property Postcode Zone Component Code Sale Code Transfer Date % Movement
20150516 355000 151 MACKSVILLE ST CARNES HILL 2171 R2 MNN AC 20150616
20141128 291000 151 MACKSVILLE ST CARNES HILL 2171 R2 MNN AV 20150604
Contract Date Purchase Price Property HouseNumber Property StreetName Property Locality Property Postcode Zone Component Code Sale Code Transfer Date % Movement
20150302 410000 HOLLIDAY AVE EDMONDSON PARK 2174 R1 DAA AV 20150701
20140915 335000 HOLLIDAY AVE EDMONDSON PARK 2174 R1 DAA AV 20150701
Contract Date Purchase Price Property HouseNumber Property StreetName Property Locality Property Postcode Zone Component Code Sale Code Transfer Date % Movement
20150910 510000 HOLLIDAY AVE EDMONDSON PARK 2174 R1 DAA AV 20151023
20140916 335000 HOLLIDAY AVE EDMONDSON PARK 2174 R1 DAA AV 20150701
Contract Date Purchase Price Property HouseNumber Property StreetName Property Locality Property Postcode Zone Component Code Sale Code Transfer Date % Movement
20150205 380000 HEMMIE RD EDMONDSON PARK 2174 R1 DAA AV 20150717
20140910 305000 HEMMIE RD EDMONDSON PARK 2174 R1 DAA AV 20150717
21.99%
22.39%
52.24%
24.59%
24.14%
27.57%
32.34%
15.65%

Contract Date Purchase Price Property HouseNumber Property StreetName Property Locality Property Postcode Zone Component Code Sale Code Transfer Date % Movement
20150619 325000 HEMMIE RD EDMONDSON PARK 2174 R1 DAA AV 20150701
20140905 275000 HEMMIE RD EDMONDSON PARK 2174 R1 DAA AV 20150701
Contract Date Purchase Price Property HouseNumber Property StreetName Property Locality Property Postcode Zone Component Code Sale Code Transfer Date % Movement
20150514 480000 HEMMIE RD EDMONDSON PARK 2174 R1 DAA AV 20150630
20140916 330000 HEMMIE RD EDMONDSON PARK 2174 R1 DAA AV 20150630
Contract Date Purchase Price Property HouseNumber Property StreetName Property Locality Property Postcode Zone Component Code Sale Code Transfer Date % Movement
20150629 350000 HEMMIE RD EDMONDSON PARK 2174 R1 DAA AV 20150708
20140916 330000 HEMMIE RD EDMONDSON PARK 2174 R1 DAA AV 20150708
Contract Date Purchase Price Property HouseNumber Property StreetName Property Locality Property Postcode Zone Component Code Sale Code Transfer Date % Movement
20150501 415000 ISONZO RD EDMONDSON PARK 2174 R1 DAA AV 20150702
20141215 330000 ISONZO RD EDMONDSON PARK 2174 R1 DAA AV 20150702
Contract Date Purchase Price Property HouseNumber Property StreetName Property Locality Property Postcode Zone Component Code Sale Code Transfer Date % Movement
20150930 259000 ISONZO RD EDMONDSON PARK 2174 R1 DAA AV 20151001
20140909 245000 ISONZO RD EDMONDSON PARK 2174 R1 DAA AV 20150630
Contract Date Purchase Price Property HouseNumber Property StreetName Property Locality Property Postcode Zone Component Code Sale Code Transfer Date % Movement
20150211 395000 GALLIPOLI DR EDMONDSON PARK 2174 R1 DAA AV 20150813
20141201 330000 GALLIPOLI DR EDMONDSON PARK 2174 R1 DAA AV 20150813
Contract Date Purchase Price Property HouseNumber Property StreetName Property Locality Property Postcode Zone Component Code Sale Code Transfer Date % Movement
20141222 345000 GALLIPOLI DR EDMONDSON PARK 2174 R1 DAA AV 20150805
20141013 325000 GALLIPOLI DR EDMONDSON PARK 2174 R1 DAA AV 20150805
Contract Date Purchase Price Property HouseNumber Property StreetName Property Locality Property Postcode Zone Component Code Sale Code Transfer Date % Movement
20141222 380000 TAPLIN RD EDMONDSON PARK 2174 R1 DAA AV 20150812
20141015 325000 TAPLIN RD EDMONDSON PARK 2174 R1 DAA AV 20150812
6.06%
25.76%
5.71%
19.70%
6.15%
16.92%
18.18%
45.45%

Contract Date Purchase Price Property HouseNumber Property StreetName Property Locality Property Postcode Zone Component Code Sale Code Transfer Date % Movement
20141216 290000 HOLLIDAY AVE EDMONDSON PARK 2174 R1 DAA AV 20150407
20150508 335000 HOLLIDAY AVE EDMONDSON PARK 2174 R1 DAA AV 20150907
Contract Date Purchase Price Property HouseNumber Property StreetName Property Locality Property Postcode Zone Component Code Sale Code Transfer Date % Movement
20141010 255000 HOLLIDAY AVE EDMONDSON PARK 2174 R1 DAA AV 20150904
20150429 364000 HOLLIDAY AVE EDMONDSON PARK 2174 R1 DAA AV 20150904
Contract Date Purchase Price Property HouseNumber Property StreetName Property Locality Property Postcode Zone Component Code Sale Code Transfer Date % Movement
20150128 380000 TAPLIN RD EDMONDSON PARK 2174 R1 DAA AV 20150911
20141015 330000 TAPLIN RD EDMONDSON PARK 2174 R1 DAA AV 20150911
Contract Date Purchase Price Property HouseNumber Property StreetName Property Locality Property Postcode Zone Component Code Sale Code Transfer Date % Movement
20140917 360000 HOLLIDAY AVE EDMONDSON PARK 2174 R1 DAA AV 20150808
20150207 470000 HOLLIDAY AVE EDMONDSON PARK 2174 R1 DAA AV 20150818
Contract Date Purchase Price Property HouseNumber Property StreetName Property Locality Property Postcode Zone Component Code Sale Code Transfer Date
20140909 335750 3 CROSSLEY AVE CARNES HILL 2171 R2 MNN AV 20150901
20150901 460000 3 CROSSLEY AVE CARNES HILL 2171 R2 MNN AV 20150901
20141001 420000 3 CROSSLEY AVE CARNES HILL 2171 R2 MNN AV 20150901
Contract Date Purchase Price Property HouseNumber Property StreetName Property Locality Property Postcode Zone Component Code Sale Code Transfer Date % Movement
20150604 430000 8 ALCHEMIST WAY CARNES HILL 2171 R2 MNN AV 20150831
20141015 328500 8 ALCHEMIST WAY CARNES HILL 2171 R2 MNN AV 20150831
Contract Date Purchase Price Property HouseNumber Property StreetName Property Locality Property Postcode Zone Component Code Sale Code Transfer Date % Movement
20150410 415000 6 ALCHEMIST WAY CARNES HILL 2171 R2 MNN AV 20150831
20141015 328750 6 ALCHEMIST WAY CARNES HILL 2171 R2 MNN AV 20150831
Contract Date Purchase Price Property HouseNumber Property StreetName Property Locality Property Postcode Zone Component Code Sale Code Transfer Date % Movement
20150831 412500 4 ALCHEMIST WAY CARNES HILL 2171 R2 MNN AV 20150911
20141015 328750 4 ALCHEMIST WAY CARNES HILL 2171 R2 MNN AV 2015091125.48%
15.52%
42.75%
15.15%
30.56%
30.90%
26.24%
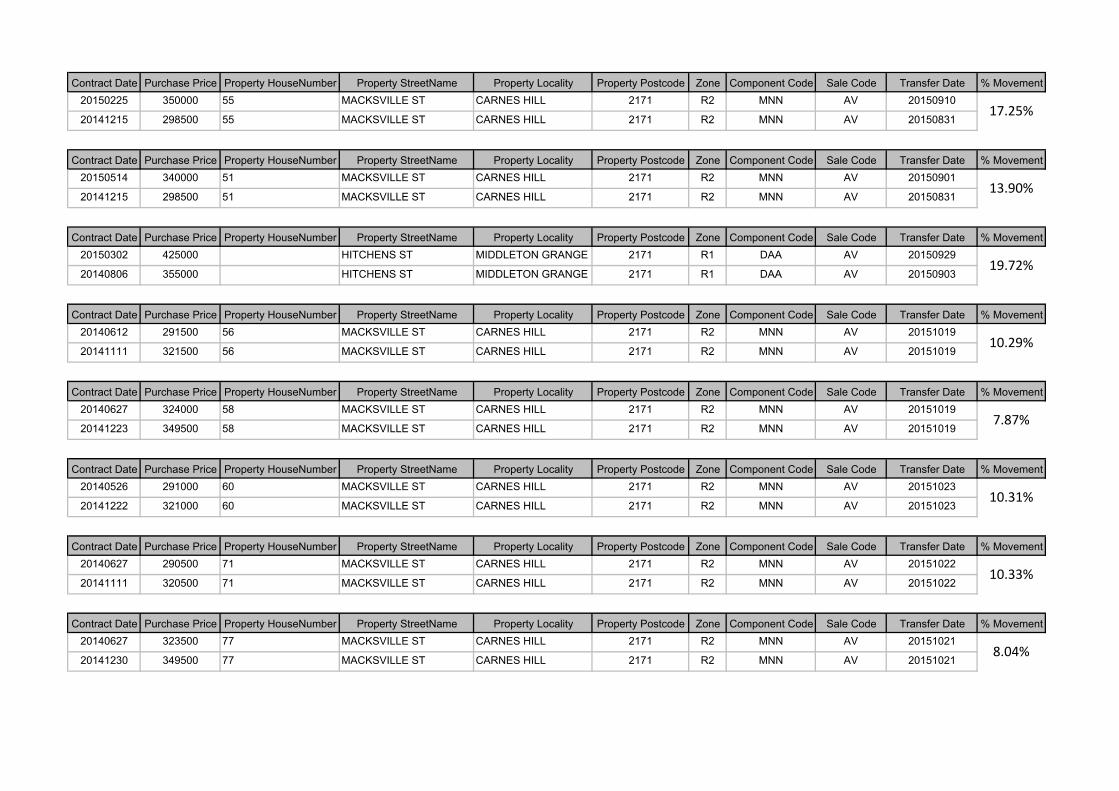
Contract Date Purchase Price Property HouseNumber Property StreetName Property Locality Property Postcode Zone Component Code Sale Code Transfer Date % Movement
20150225 350000 55 MACKSVILLE ST CARNES HILL 2171 R2 MNN AV 20150910
20141215 298500 55 MACKSVILLE ST CARNES HILL 2171 R2 MNN AV 20150831
Contract Date Purchase Price Property HouseNumber Property StreetName Property Locality Property Postcode Zone Component Code Sale Code Transfer Date % Movement
20150514 340000 51 MACKSVILLE ST CARNES HILL 2171 R2 MNN AV 20150901
20141215 298500 51 MACKSVILLE ST CARNES HILL 2171 R2 MNN AV 20150831
Contract Date Purchase Price Property HouseNumber Property StreetName Property Locality Property Postcode Zone Component Code Sale Code Transfer Date % Movement
20150302 425000 HITCHENS ST MIDDLETON GRANGE 2171 R1 DAA AV 20150929
20140806 355000 HITCHENS ST MIDDLETON GRANGE 2171 R1 DAA AV 20150903
Contract Date Purchase Price Property HouseNumber Property StreetName Property Locality Property Postcode Zone Component Code Sale Code Transfer Date % Movement
20140612 291500 56 MACKSVILLE ST CARNES HILL 2171 R2 MNN AV 20151019
20141111 321500 56 MACKSVILLE ST CARNES HILL 2171 R2 MNN AV 20151019
Contract Date Purchase Price Property HouseNumber Property StreetName Property Locality Property Postcode Zone Component Code Sale Code Transfer Date % Movement
20140627 324000 58 MACKSVILLE ST CARNES HILL 2171 R2 MNN AV 20151019
20141223 349500 58 MACKSVILLE ST CARNES HILL 2171 R2 MNN AV 20151019
Contract Date Purchase Price Property HouseNumber Property StreetName Property Locality Property Postcode Zone Component Code Sale Code Transfer Date % Movement
20140526 291000 60 MACKSVILLE ST CARNES HILL 2171 R2 MNN AV 20151023
20141222 321000 60 MACKSVILLE ST CARNES HILL 2171 R2 MNN AV 20151023
Contract Date Purchase Price Property HouseNumber Property StreetName Property Locality Property Postcode Zone Component Code Sale Code Transfer Date % Movement
20140627 290500 71 MACKSVILLE ST CARNES HILL 2171 R2 MNN AV 20151022
20141111 320500 71 MACKSVILLE ST CARNES HILL 2171 R2 MNN AV 20151022
Contract Date Purchase Price Property HouseNumber Property StreetName Property Locality Property Postcode Zone Component Code Sale Code Transfer Date % Movement
20140627 323500 77 MACKSVILLE ST CARNES HILL 2171 R2 MNN AV 20151021
20141230 349500 77 MACKSVILLE ST CARNES HILL 2171 R2 MNN AV 20151021
10.31%
10.33%
8.04%
17.25%
13.90%
19.72%
10.29%
7.87%