2021 operating budget - home - public
TRANSCRIPT

2021 Operating BudgetFinancial Schedules & Supporting Information
Board of Governors MeetingDecember 16, 2020

Board of Governors Carlos Beruff, Chair
Carlos Lopez-Cantera, Vice-Chair
Bette Brown Marc Dunbar
Lazaro Fields Reynolds Henderson
James Holton William Kastroll
M. Scott Thomas

Table of Contents

This page is intended to be blank
2021 Operating BudgetExecutive Summary

This page is intended to be blank
2021 Operating BudgetCitizens Property Insurance Corporation Executive Summary
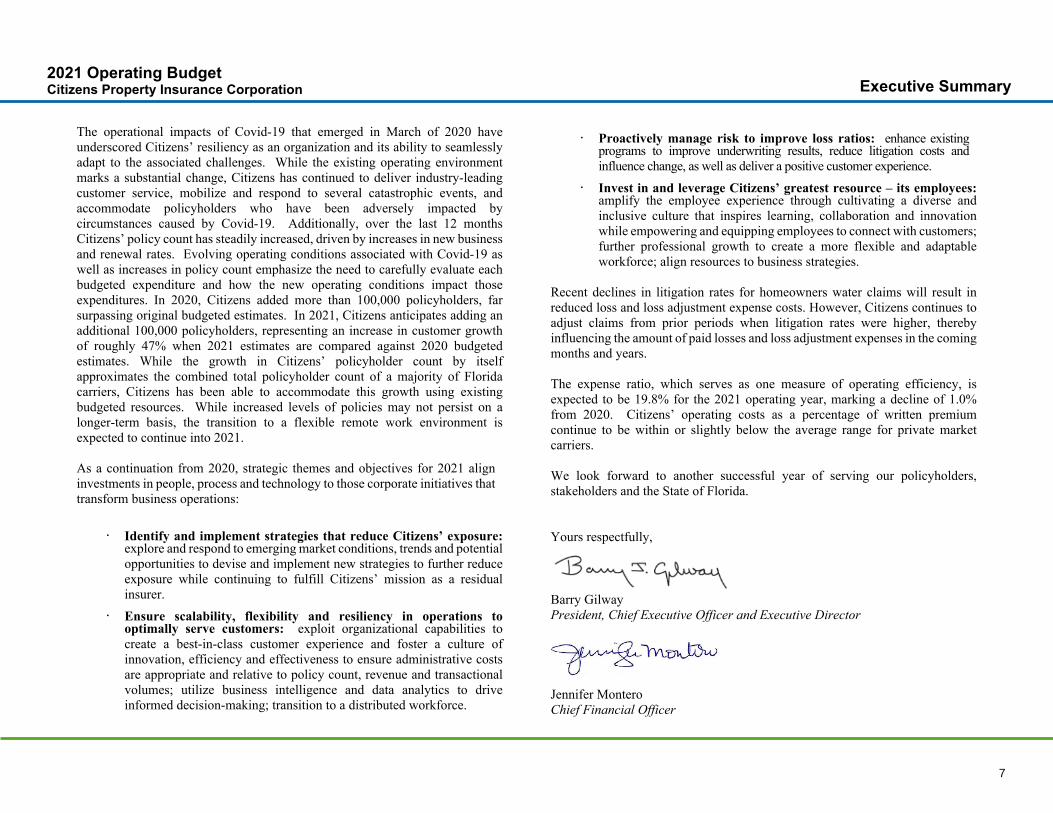
The operational impacts of Covid-19 that emerged in March of 2020 have underscored Citizens’ resiliency as an organization and its ability to seamlessly adapt to the associated challenges. While the existing operating environment marks a substantial change, Citizens has continued to deliver industry-leading customer service, mobilize and respond to several catastrophic events, and accommodate policyholders who have been adversely impacted by circumstances caused by Covid-19. Additionally, over the last 12 months Citizens’ policy count has steadily increased, driven by increases in new business and renewal rates. Evolving operating conditions associated with Covid-19 as well as increases in policy count emphasize the need to carefully evaluate each budgeted expenditure and how the new operating conditions impact those expenditures. In 2020, Citizens added more than 100,000 policyholders, far surpassing original budgeted estimates. In 2021, Citizens anticipates adding an additional 100,000 policyholders, representing an increase in customer growth of roughly 47% when 2021 estimates are compared against 2020 budgeted estimates. While the growth in Citizens’ policyholder count by itself approximates the combined total policyholder count of a majority of Florida carriers, Citizens has been able to accommodate this growth using existing budgeted resources. While increased levels of policies may not persist on a longer-term basis, the transition to a flexible remote work environment is expected to continue into 2021.
As a continuation from 2020, strategic themes and objectives for 2021 align investments in people, process and technology to those corporate initiatives that transform business operations:
· Identify and implement strategies that reduce Citizens’ exposure: explore and respond to emerging market conditions, trends and potential opportunities to devise and implement new strategies to further reduce exposure while continuing to fulfill Citizens’ mission as a residual insurer.
· Ensure scalability, flexibility and resiliency in operations to optimally serve customers: exploit organizational capabilities to create a best-in-class customer experience and foster a culture of innovation, efficiency and effectiveness to ensure administrative costs are appropriate and relative to policy count, revenue and transactional volumes; utilize business intelligence and data analytics to drive informed decision-making; transition to a distributed workforce.
· Proactively manage risk to improve loss ratios: enhance existing programs to improve underwriting results, reduce litigation costs and influence change, as well as deliver a positive customer experience.
· Invest in and leverage Citizens’ greatest resource – its employees: amplify the employee experience through cultivating a diverse and inclusive culture that inspires learning, collaboration and innovation while empowering and equipping employees to connect with customers; further professional growth to create a more flexible and adaptable workforce; align resources to business strategies.
Recent declines in litigation rates for homeowners water claims will result in reduced loss and loss adjustment expense costs. However, Citizens continues to adjust claims from prior periods when litigation rates were higher, thereby influencing the amount of paid losses and loss adjustment expenses in the coming months and years.
The expense ratio, which serves as one measure of operating efficiency, is expected to be 19.8% for the 2021 operating year, marking a decline of 1.0% from 2020. Citizens’ operating costs as a percentage of written premium continue to be within or slightly below the average range for private market carriers.
We look forward to another successful year of serving our policyholders, stakeholders and the State of Florida.
Yours respectfully,
Barry GilwayPresident, Chief Executive Officer and Executive Director
Jennifer MonteroChief Financial Officer
7

This page is intended to be blank

Organizational Structure2021 Operating BudgetCitizens Property Insurance Corporation
Office of Inspector GeneralMark Kagy - Acting
ExecutiveBarry Gilway
Office of Internal AuditJoe Martins
Board of Governors
Communications, Legislative & External
AffairsChristine Ashburn
Consumer & Policy Services
Jeremy Pope
Human ResourcesViolet Bloom
Financial ServicesJennifer Montero
Enterprise OperationsKelly Booten
ClaimsJay Adams
Legal Services & PurchasingDan Sumner
Enterprise Resources
Chairman of the Boardof Governors
Audit Committee
9

This page is intended to be blank

2021 Operating BudgetBudget Assumptions

2021 Operating BudgetCitizens Property Insurance Corporation Budget Assumptions
12

2021 Operating BudgetCitizens Property Insurance Corporation Budget Assumptions
13

This page is intended to be blank

2021 Operating BudgetBudgeted Statements of Operations

2021 Operating BudgetCitizens Property Insurance Corporation
Budgeted Statements of Operations - Total Company
2021 Budget 2020 Projection Change ($) Change (%) 2020 Budget Change ($) Change (%) 2019 Actual Change ($) Change (%)
PremiumsPremiums Written - Direct $1,379,454,729 $1,154,412,782 $225,041,947 19.49% $873,412,230 $506,042,499 57.94% $876,559,612 $502,895,117 57.37%Change in Direct UPR (109,565,608) (172,957,156) 63,391,549 36.65% (9,056,674) (100,508,933) 1,109.78% (15,765,074) (93,800,533) 594.99%Premiums Ceded (FHCF) (184,116,705) (142,720,079) (41,396,626) 29.01% (134,869,863) (49,246,843) 36.51% (133,602,467) (50,514,238) 37.81%Premiums Ceded (Private) (210,000,000) (91,576,811) (118,423,189) 129.32% (125,000,000) (85,000,000) 68.00% (94,639,245) (115,360,755) 121.90%Premiums Ceded (Depop) (10,896,389) (12,023,217) 1,126,828 9.37% (11,650,863) 754,474 6.48% (9,327,580) (1,568,809) 16.82%Change in Ceded UPR (Depop) 45,200 (185,877,585) 185,922,785 100.02% (1,245,168) 1,290,367 103.63% (7,149,771) 7,194,971 100.63%
Net Premiums Earned $864,921,226 $739,051,852 $125,869,375 17.03% $591,589,663 $273,331,564 46.20% $616,075,474 $248,845,752 40.39%
Underwriting ExpensesLosses and LAE Incurred $683,291,163 $559,493,932 $123,797,231 22.13% $456,066,231 $227,224,932 49.82% $499,961,487 $183,329,676 36.67%Producer Commissions 101,734,720 85,635,475 16,099,245 18.80% 65,193,521 36,541,199 56.05% 65,154,697 36,580,023 56.14%Taxes and Assessments 18,204,457 15,270,375 2,934,082 19.21% 10,909,879 7,294,578 66.86% 11,267,538 6,936,920 61.57%Administrative Expenses 139,363,021 127,450,054 11,912,967 9.35% 133,840,286 5,522,735 4.13% 124,021,292 15,341,729 12.37%Other Underwriting Expenses 15,975,714 11,616,977 4,358,737 37.52% 12,095,210 3,880,504 32.08% 12,729,294 3,246,420 25.50%
Total Underwriting $958,569,075 $799,466,813 $159,102,262 19.90% $678,105,128 $280,463,947 41.36% $713,134,307 $245,434,768 34.42%
Net Underwriting Gain (Loss) $(93,647,849) $(60,414,962) $(33,232,887) 55.01% $(86,515,465) $(7,132,383) 8.24% $(97,058,833) $3,410,984 3.51%
Other Income (Expense)Investment Income - Net $162,991,129 $260,903,120 $(97,911,992) 37.53% $191,281,662 $162,991,129 - $232,446,937 $(69,455,808) 29.88%Interest Expense - Net (24,589,181) (34,192,743) 9,603,562 28.09% (34,223,116) 9,633,935 28.15% (51,621,400) 27,032,219 52.37%Other Income and Expenses 2,127,548 2,655,367 (527,819) 19.88% 808,689 2,127,548 - 2,562,659 (435,111) 16.98%
Total Other Income (Expense) $140,529,496 $229,365,744 $(88,836,248) 38.73% $157,867,235 $(17,337,739) 10.98% $183,388,197 $(42,858,700) 23.37%
Net Income (Loss) $46,881,648 $168,950,783 $(122,069,135) 72.25% $71,351,770 $(24,470,123) 34.30% $86,329,364 $(39,447,716) 45.69%
Policies In-Force 630,257 532,135 98,122 18.44% 430,704 199,553 46.33% 447,433 182,824 40.86%
Note: All variances enumerated above are in reference to the 2021 Budget. All percentages are stated in absolute value.
16

2021 Operating BudgetCitizens Property Insurance Corporation
Budgeted Statements of Operations - PLA
2021 Budget 2020 Projection Change ($) Change (%) 2020 Budget Change ($) Change (%) 2019 Actual Change ($) Change (%)
PremiumsPremiums Written - Direct $930,299,676 $760,919,031 $169,380,645 22.26% $562,388,394 $367,911,282 65.42% $558,477,481 $371,822,195 66.58%Change in Direct UPR (80,418,378) (126,391,496) 45,973,118 36.37% (7,744,619) (72,673,760) 938.38% (23,972,811) (56,445,567) 235.46%Premiums Ceded (FHCF) (98,563,640) (72,862,956) (25,700,684) 35.27% (70,418,365) (28,145,275) 39.97% (66,113,542) (32,450,098) 49.08%Premiums Ceded (Private) (60,000,000) (26,894,470) (33,105,530) 123.09% (25,000,000) (35,000,000) 140.00% (18,394,693) (41,605,307) 226.18%Premiums Ceded (Depop) (5,639,813) (3,500,421) (2,139,392) 61.12% (3,514,804) (2,125,008) 60.46% (6,034,633) 394,821 6.54%Change in Ceded UPR (Depop) 201,180 (80,871,299) 81,072,478 100.25% (601,936) 803,116 133.42% (318,336) 519,515 163.20%
Net Premiums Earned $685,879,025 $531,687,740 $154,191,284 29.00% $455,108,670 $230,770,355 50.71% $443,643,466 $242,235,558 54.60%
Underwriting ExpensesLosses and LAE Incurred $581,160,214 $446,230,403 $134,929,811 30.24% $389,085,433 $192,074,781 49.37% $386,908,256 $194,251,958 50.21%Producer Commissions 65,511,331 53,870,372 11,640,959 21.61% 39,872,011 25,639,320 64.30% 39,481,554 26,029,777 65.93%Taxes and Assessments 12,633,842 10,388,886 2,244,956 21.61% 7,368,615 5,265,227 71.45% 7,435,265 5,198,577 69.92%Administrative Expenses 93,969,230 83,950,729 10,018,501 11.93% 86,179,668 7,789,562 9.04% 78,944,140 15,025,090 19.03%Other Underwriting Expenses 10,772,051 7,576,881 3,195,170 42.17% 7,788,097 2,983,953 38.31% 8,176,497 2,595,554 31.74%
Total Underwriting $764,046,667 $602,017,271 $162,029,396 26.91% $530,293,823 $233,752,844 44.08% $520,945,712 $243,100,955 46.67%
Net Underwriting Gain (Loss) $(78,167,643) $(70,329,531) $(7,838,112) 11.14% $(75,185,153) $(2,982,489) 3.97% $(77,302,246) $(865,397) 1.12%
Other Income (Expense)Investment Income - Net $40,740,280 $83,902,240 $(43,161,960) 51.44% $60,087,744 $40,740,280 - $85,701,974 $(44,961,694) 52.46%Interest Expense - Net (7,373,668) (12,384,815) 5,011,147 40.46% (12,384,815) 5,011,147 40.46% (17,133,390) 9,759,722 56.96%Other Income and Expenses 1,621,102 1,898,285 (277,184) 14.60% 574,628 1,621,102 - 1,872,756 (251,654) 13.44%
Total Other Income (Expense) $34,987,714 $73,415,710 $(38,427,996) 52.34% $48,277,557 $(13,289,843) 27.53% $70,441,340 $(35,453,626) 50.33%
Net Income (Loss) $(43,179,929) $3,086,179 $(46,266,108) 1,499.14% $(26,907,597) $(16,272,332) 60.47% $(6,860,906) $(36,319,023) 529.36%
Policies In-Force 476,862 398,403 78,459 19.69% 318,474 158,389 49.73% 326,675 150,187 45.97%
Note: All variances enumerated above are in reference to the 2021 Budget. All percentages are stated in absolute value.
17

2021 Operating BudgetCitizens Property Insurance Corporation
Budgeted Statements of Operations - CLA
2021 Budget 2020 Projection Change ($) Change (%) 2020 Budget Change ($) Change (%) 2019 Actual Change ($) Change (%)
PremiumsPremiums Written - Direct $15,217,411 $14,464,958 $752,453 5.20% $8,877,962 $6,339,449 71.41% $11,971,532 $3,245,879 27.11%Change in Direct UPR (580,575) (1,829,692) 1,249,117 68.27% 1,074,158 (1,654,733) 154.05% 1,021,170 (1,601,745) 156.85%Premiums Ceded (FHCF) (3,352,228) (2,856,983) (495,245) 17.33% (1,888,173) (1,464,055) 77.54% (2,468,014) (884,214) 35.83%Premiums Ceded (Private) - - - - - - - - - -Premiums Ceded (Depop) - - - - (91,618) 91,618 100.00% (6,754) 6,754 100.00%Change in Ceded UPR (Depop) - (2,382,727) 2,382,727 100.00% (12,915) 12,915 100.00% (40,851) 40,851 100.00%
Net Premiums Earned $11,284,608 $9,778,283 $1,506,325 15.40% $7,959,413 $3,325,195 41.78% $10,477,084 $807,525 7.71%
Underwriting ExpensesLosses and LAE Incurred $2,102,782 $4,417,603 $(2,314,821) 52.40% $1,436,086 $666,695 46.42% $11,322,678 $(9,219,897) 81.43%Producer Commissions 1,660,491 1,582,141 78,351 4.95% 955,399 705,092 73.80% 1,302,402 358,090 27.49%Taxes and Assessments 211,250 201,282 9,968 4.95% 109,956 101,294 92.12% 165,418 45,832 27.71%Administrative Expenses 1,534,927 1,549,326 (14,399) 0.93% 1,360,775 174,152 12.80% 1,694,972 (160,044) 9.44%Other Underwriting Expenses 175,955 133,119 42,836 32.18% 122,974 52,981 43.08% 174,853 1,101 0.63%
Total Underwriting $5,685,405 $7,883,471 $(2,198,066) 27.88% $3,985,191 $1,700,214 42.66% $14,660,323 $(8,974,918) 61.22%
Net Underwriting Gain (Loss) $5,599,203 $1,894,812 $3,704,391 195.50% $3,974,223 $1,624,981 40.89% $(4,183,239) $9,782,443 233.85%
Other Income (Expense)Investment Income - Net $42,378,002 $61,521,878 $(19,143,876) 31.12% $43,238,661 $42,378,002 - $51,667,696 $(9,289,694) 17.98%Interest Expense - Net (1,164,623) (1,956,101) 791,478 40.46% (1,956,101) 791,478 40.46% (2,706,107) 1,541,484 56.96%Other Income and Expenses 89,629 68,817 20,811 30.24% 55,093 89,629 - 59,929 29,700 49.56%
Total Other Income (Expense) $41,303,008 $59,634,595 $(18,331,587) 30.74% $41,337,653 $(34,646) 0.08% $49,021,518 $(7,718,511) 15.75%
Net Income (Loss) $46,902,211 $61,529,407 $(14,627,196) 23.77% $45,311,876 $1,590,335 3.51% $44,838,279 $2,063,932 4.60%
Policies In-Force 845 774 71 9.19% 520 325 62.47% 738 107 14.52%
Note: All variances enumerated above are in reference to the 2021 Budget. All percentages are stated in absolute value.
18

2021 Operating BudgetCitizens Property Insurance Corporation
Budgeted Statements of Operations - Coastal
2021 Budget 2020 Projection Change ($) Change (%) 2020 Budget Change ($) Change (%) 2019 Actual Change ($) Change (%)
PremiumsPremiums Written - Direct $433,937,641 $379,028,793 $54,908,848 14.49% $302,145,874 $131,791,768 43.62% $306,110,599 $127,827,042 41.76%Change in Direct UPR (28,566,654) (44,735,969) 16,169,314 36.14% (2,386,214) (26,180,440) 1,097.15% 7,186,567 (35,753,221) 497.50%Premiums Ceded (FHCF) (82,200,837) (67,000,140) (15,200,697) 22.69% (62,563,324) (19,637,513) 31.39% (65,020,911) (17,179,926) 26.42%Premiums Ceded (Private) (150,000,000) (64,682,341) (85,317,659) 131.90% (100,000,000) (50,000,000) 50.00% (76,244,552) (73,755,448) 96.74%Premiums Ceded (Depop) (5,256,576) (8,522,796) 3,266,220 38.32% (8,044,440) 2,787,863 34.66% (3,286,193) (1,970,383) 59.96%Change in Ceded UPR (Depop) (155,980) (102,623,560) 102,467,580 99.85% (630,316) 474,336 75.25% (6,790,585) 6,634,605 97.70%
Net Premiums Earned $167,757,594 $197,585,828 $(29,828,235) 15.10% $128,521,580 $39,236,014 30.53% $161,954,924 $5,802,670 3.58%
Underwriting ExpensesLosses and LAE Incurred $100,028,167 $108,845,926 $(8,817,759) 8.10% $65,544,712 $34,483,455 52.61% $101,730,552 $(1,702,385) 1.67%Producer Commissions 34,562,898 30,182,962 4,379,936 14.51% 24,366,112 10,196,786 41.85% 24,370,741 10,192,156 41.82%Taxes and Assessments 5,359,365 4,680,207 679,158 14.51% 3,431,308 1,928,057 56.19% 3,666,855 1,692,510 46.16%Administrative Expenses 43,858,864 41,949,999 1,908,865 4.55% 46,299,843 (2,440,979) 5.27% 43,382,180 476,684 1.10%Other Underwriting Expenses 5,027,709 3,906,977 1,120,732 28.69% 4,184,139 843,570 20.16% 4,377,944 649,765 14.84%
Total Underwriting $188,837,003 $189,566,071 $(729,068) 0.38% $143,826,114 $45,010,889 31.30% $177,528,272 $11,308,731 6.37%
Net Underwriting Gain (Loss) $(21,079,409) $8,019,757 $(29,099,167) 362.84% $(15,304,534) $(5,774,875) 37.73% $(15,573,348) $(5,506,062) 35.36%
Other Income (Expense)Investment Income - Net $79,872,847 $115,479,003 $(35,606,156) 30.83% $87,955,258 $79,872,847 - $95,077,267 $(15,204,420) 15.99%Interest Expense - Net (16,050,890) (19,851,828) 3,800,938 19.15% (19,882,200) 3,831,310 19.27% (31,781,903) 15,731,013 49.50%Other Income and Expenses 416,818 688,265 (271,447) 39.44% 178,968 416,818 - 629,974 (213,156) 33.84%
Total Other Income (Expense) $64,238,775 $96,315,440 $(32,076,665) 33.30% $68,252,026 $(4,013,251) 5.88% $63,925,338 $313,436 0.49%
Net Income (Loss) $43,159,366 $104,335,197 $(61,175,831) 58.63% $52,947,491 $(9,788,125) 18.49% $48,351,991 $(5,192,625) 10.74%
Policies In-Force 152,549 132,958 19,592 14.74% 111,710 40,840 36.56% 120,020 32,529 27.10%
Note: All variances enumerated above are in reference to the 2021 Budget. All percentages are stated in absolute value.
19

This page is intended to be blank

2021 Operating BudgetAdministrative Expenses

2021 Operating BudgetCitizens Property Insurance Corporation Administrative Expenses by Division
Expense Category Total CPICEnterpriseResources Human Resources
Legal Services &Purchasing
Communications,Legislative &
External Affairs Financial Services ClaimsConsumer andPolicy Services
EnterpriseOperations
Salaries $101,954,835 $6,251,330 $6,528,992 $6,590,739 $2,088,355 $6,943,439 $25,386,880 $4,904,243 $43,260,857Employee Benefits 27,201,761 1,017,368 2,121,733 1,774,784 584,517 1,725,170 6,782,880 1,708,984 11,486,325Payroll Taxes 7,309,653 327,472 520,033 475,576 155,330 487,698 1,865,871 355,575 3,122,099Contingent Staffing 58,632,809 102,000 54,495 48,960 - - 55,765,870 - 2,661,484Training 1,023,575 67,300 124,008 12,115 57,900 56,143 34,458 18,500 653,151Recruiting 506,468 - 506,468 - - - - - -Printing 93,814 2,600 19,000 120 24,400 20,646 17,062 5,000 4,986Operating Supplies 277,206 6,700 183,482 4,140 6,600 11,050 21,409 10,450 33,375Subscriptions & Dues 1,332,040 55,680 146,511 53,040 34,985 165,618 523,550 2,300 350,356Postage 287,797 300 270,424 - 340 6,692 5,191 - 4,850Telecommunications 2,712,188 - - - - - - - 2,712,188Legal 1,703,450 98,250 - 1,285,200 - - 320,000 - -Insurance 890,995 - - 890,995 - - - - -Travel & Meals 1,142,787 124,380 85,047 76,380 49,950 69,381 413,168 20,370 304,111Professional Services 12,328,998 337,500 1,209,125 141,800 290,240 1,712,136 1,669,954 320,000 6,648,243Miscellaneous - - - - - - - - -Rent 6,517,306 - 5,089,648 12,602 - 5,304 - - 1,409,752Depreciation 1,201,817 - 471,334 - - 17,130 - - 713,353Producer Fees Collected (717,455) - - - - - - - (717,455)Operations & Maintenance 2,648,816 - 1,854,675 1,260 - 35,646 117,971 21,000 618,265Bank Charges 202,512 - - - - 202,272 - - 240Software Maint & Licensing 17,885,232 217,232 659,240 92,190 68,000 669,763 3,792,299 105,500 12,281,008Computer Hardware 2,474,442 - - - - - 5,226 - 2,469,217FMAP Funding (318,405) - - - - (3,600) - - (314,805)ULAE Expense Allocation (107,929,618) - (1,920,799) (4,683,777) - (66,750) (96,721,788) - (4,536,504)
Administrative Expenses $139,363,021 $8,608,112 $17,923,415 $6,776,123 $3,360,616 $12,057,738 - $7,471,922 $83,165,094Other Underwriting Expenses 15,975,714 - - - - - - 2,589,898 13,385,816
Total Admin & Other Expenses $155,338,735 $8,608,112 $17,923,415 $6,776,123 $3,360,616 $12,057,738 - $10,061,820 $96,550,910
22
Administrative Expenses by Corporate Initiative2021 Operating BudgetCitizens Property Insurance Corporation
Expense Category Total CPIC Normal OperatingEnterpriseProjects
IT Projects (Non-Enterprise) Centerpoint - ERP
CustomerRelationshipManagement COVID-19
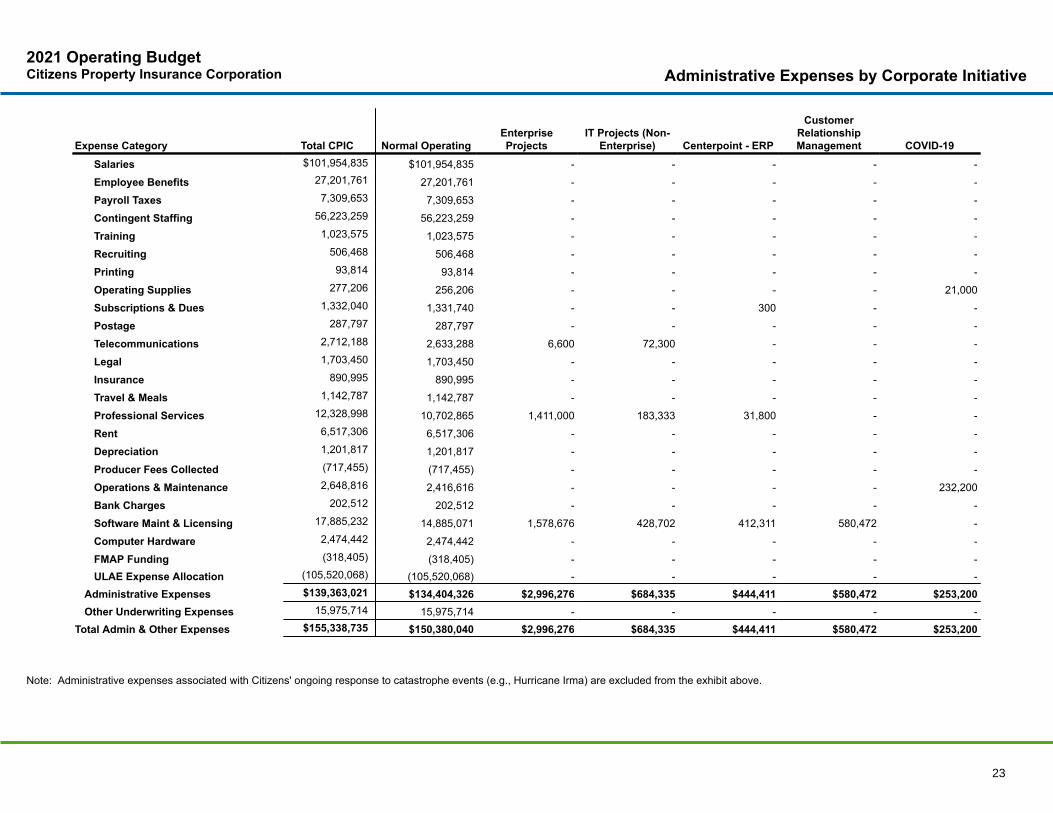
Salaries $101,954,835 $101,954,835 - - - - -Employee Benefits 27,201,761 27,201,761 - - - - -Payroll Taxes 7,309,653 7,309,653 - - - - -Contingent Staffing 56,223,259 56,223,259 - - - - -Training 1,023,575 1,023,575 - - - - -Recruiting 506,468 506,468 - - - - -Printing 93,814 93,814 - - - - -Operating Supplies 277,206 256,206 - - - - 21,000Subscriptions & Dues 1,332,040 1,331,740 - - 300 - -Postage 287,797 287,797 - - - - -Telecommunications 2,712,188 2,633,288 6,600 72,300 - - -Legal 1,703,450 1,703,450 - - - - -Insurance 890,995 890,995 - - - - -Travel & Meals 1,142,787 1,142,787 - - - - -Professional Services 12,328,998 10,702,865 1,411,000 183,333 31,800 - -Rent 6,517,306 6,517,306 - - - - -Depreciation 1,201,817 1,201,817 - - - - -Producer Fees Collected (717,455) (717,455) - - - - -Operations & Maintenance 2,648,816 2,416,616 - - - - 232,200Bank Charges 202,512 202,512 - - - - -Software Maint & Licensing 17,885,232 14,885,071 1,578,676 428,702 412,311 580,472 -Computer Hardware 2,474,442 2,474,442 - - - - -FMAP Funding (318,405) (318,405) - - - - -ULAE Expense Allocation (105,520,068) (105,520,068) - - - - -
Administrative Expenses $139,363,021 $134,404,326 $2,996,276 $684,335 $444,411 $580,472 $253,200Other Underwriting Expenses 15,975,714 15,975,714 - - - - -
Total Admin & Other Expenses $155,338,735 $150,380,040 $2,996,276 $684,335 $444,411 $580,472 $253,200
Note: Administrative expenses associated with Citizens' ongoing response to catastrophe events (e.g., Hurricane Irma) are excluded from the exhibit above.
23

2021 Operating BudgetCitizens Property Insurance Corporation
Administrative ExpensesComparisons of Annual Totals
Total CPIC2021 Budget 2020
Projection Change ($) Change (%) 2020 Budget Change ($) Change (%) 2019 Actual Change ($) Change (%)
Salaries $101,954,835 $95,203,213 $6,751,622 7.09% $97,570,910 $4,383,925 4.49% $92,735,858 $9,218,977 9.94%
Employee Benefits 27,201,761 23,769,400 3,432,360 14.44% 22,450,512 4,751,249 21.16% 19,551,356 7,650,404 39.13%
Payroll Taxes 7,309,653 6,776,355 533,298 7.87% 7,030,655 278,998 3.97% 6,655,688 653,965 9.83%
Contingent Staffing 58,632,809 61,961,640 (3,328,831) 5.37% 67,144,807 (8,511,998) 12.68% 61,716,247 (3,083,438) 5.00%
Training 1,023,575 669,746 353,829 52.83% 1,083,768 (60,193) 5.55% 923,638 99,937 10.82%
Recruiting 506,468 570,282 (63,815) 11.19% 595,795 (89,328) 14.99% 368,972 137,496 37.26%
Printing 93,814 56,273 37,540 66.71% 199,622 (105,808) 53.00% 42,810 51,003 119.14%
Operating Supplies 277,206 177,297 99,909 56.35% 270,927 6,279 2.32% 216,703 60,503 27.92%
Subscriptions & Dues 1,332,040 1,291,259 40,781 3.16% 1,693,534 (361,494) 21.35% 809,121 522,919 64.63%
Postage 287,797 230,380 57,417 24.92% 463,146 (175,349) 37.86% 284,081 3,715 1.31%
Telecommunications 2,712,188 2,711,489 699 0.03% 2,730,280 (18,092) 0.66% 2,850,753 (138,565) 4.86%
Legal 1,703,450 1,265,584 437,866 34.60% 1,583,000 120,450 7.61% 2,162,137 (458,687) 21.21%
Insurance 890,995 985,659 (94,663) 9.60% 876,272 14,724 1.68% 663,415 227,581 34.30%
Travel & Meals 1,142,787 447,452 695,335 155.40% 1,641,726 (498,939) 30.39% 1,527,835 (385,048) 25.20%
Professional Services 12,328,998 9,783,716 2,545,282 26.02% 11,949,362 379,636 3.18% 6,964,229 5,364,769 77.03%
Miscellaneous - 5,240 (5,240) 100.00% - - - 38,285 (38,285) 100.00%
Rent 6,517,306 6,387,283 130,023 2.04% 6,474,951 42,354 0.65% 7,168,232 (650,926) 9.08%
Depreciation 1,201,817 2,158,306 (956,490) 44.32% 2,184,160 (982,343) 44.98% 2,791,496 (1,589,680) 56.95%
Producer Fees Collected (717,455) (634,124) (83,331) 13.14% (717,000) (455) 0.06% (616,622) (100,833) 16.35%
Operations & Maintenance 2,648,816 1,939,087 709,729 36.60% 2,370,564 278,252 11.74% 2,202,157 446,659 20.28%
Bank Charges 202,512 158,423 44,089 27.83% 110,341 92,171 83.53% 197,752 4,760 2.41%
Software Maint & Licensing 17,885,232 16,212,599 1,672,634 10.32% 18,675,510 (790,278) 4.23% 17,254,959 630,274 3.65%
Computer Hardware 2,474,442 2,288,120 186,322 8.14% 2,050,228 424,214 20.69% 1,701,981 772,461 45.39%
FMAP Funding (318,405) (192,311) (126,094) 65.57% (315,954) (2,451) 0.78% (151,953) (166,452) 109.54%
ULAE Expense Allocation (107,929,618) (106,772,317) (1,157,301) 1.08% (114,276,829) 6,347,211 5.55% (104,037,836) (3,891,782) 3.74%Administrative Expenses $139,363,021 $127,450,052 $11,912,969 9.35% $133,840,286 $5,522,735 4.13% $124,021,292 $15,341,729 12.37%Other Underwriting Expenses 15,975,714 11,616,977 4,358,737 37.52% 12,095,210 3,880,504 32.08% 12,729,294 3,246,420 25.50%
Total Admin & Other Expenses $155,338,735 $139,067,029 $16,271,706 11.70% $145,935,496 $9,403,239 6.44% $136,750,586 $18,588,149 13.59%
Note: All variances enumerated above are in reference to the 2021 Budget. All percentages are stated in absolute value.
24
2021 Operating BudgetCitizens Property Insurance Corporation
Administrative ExpensesComparisons of Annual Totals
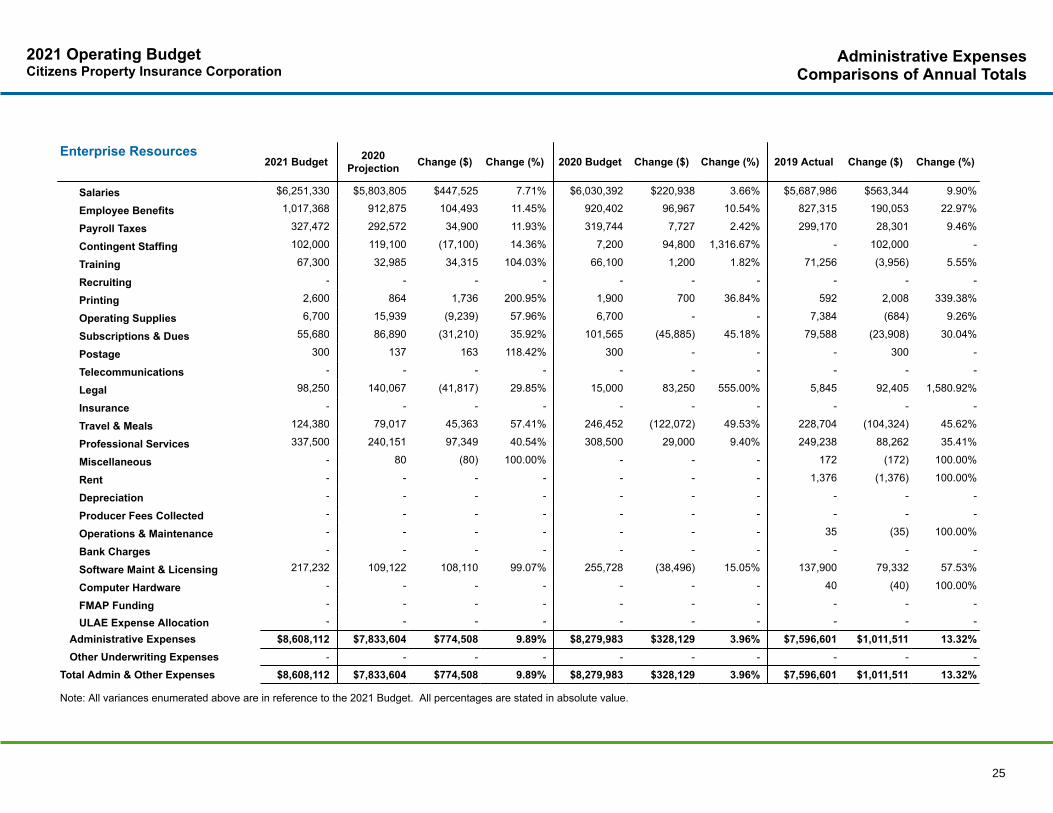
Enterprise Resources2021 Budget 2020
Projection Change ($) Change (%) 2020 Budget Change ($) Change (%) 2019 Actual Change ($) Change (%)
Salaries $6,251,330 $5,803,805 $447,525 7.71% $6,030,392 $220,938 3.66% $5,687,986 $563,344 9.90%
Employee Benefits 1,017,368 912,875 104,493 11.45% 920,402 96,967 10.54% 827,315 190,053 22.97%
Payroll Taxes 327,472 292,572 34,900 11.93% 319,744 7,727 2.42% 299,170 28,301 9.46%
Contingent Staffing 102,000 119,100 (17,100) 14.36% 7,200 94,800 1,316.67% - 102,000 -
Training 67,300 32,985 34,315 104.03% 66,100 1,200 1.82% 71,256 (3,956) 5.55%
Recruiting - - - - - - - - - -
Printing 2,600 864 1,736 200.95% 1,900 700 36.84% 592 2,008 339.38%
Operating Supplies 6,700 15,939 (9,239) 57.96% 6,700 - - 7,384 (684) 9.26%
Subscriptions & Dues 55,680 86,890 (31,210) 35.92% 101,565 (45,885) 45.18% 79,588 (23,908) 30.04%
Postage 300 137 163 118.42% 300 - - - 300 -
Telecommunications - - - - - - - - - -
Legal 98,250 140,067 (41,817) 29.85% 15,000 83,250 555.00% 5,845 92,405 1,580.92%
Insurance - - - - - - - - - -
Travel & Meals 124,380 79,017 45,363 57.41% 246,452 (122,072) 49.53% 228,704 (104,324) 45.62%
Professional Services 337,500 240,151 97,349 40.54% 308,500 29,000 9.40% 249,238 88,262 35.41%
Miscellaneous - 80 (80) 100.00% - - - 172 (172) 100.00%
Rent - - - - - - - 1,376 (1,376) 100.00%
Depreciation - - - - - - - - - -
Producer Fees Collected - - - - - - - - - -
Operations & Maintenance - - - - - - - 35 (35) 100.00%
Bank Charges - - - - - - - - - -
Software Maint & Licensing 217,232 109,122 108,110 99.07% 255,728 (38,496) 15.05% 137,900 79,332 57.53%
Computer Hardware - - - - - - - 40 (40) 100.00%
FMAP Funding - - - - - - - - - -
ULAE Expense Allocation - - - - - - - - - -Administrative Expenses $8,608,112 $7,833,604 $774,508 9.89% $8,279,983 $328,129 3.96% $7,596,601 $1,011,511 13.32%Other Underwriting Expenses - - - - - - - - - -
Total Admin & Other Expenses $8,608,112 $7,833,604 $774,508 9.89% $8,279,983 $328,129 3.96% $7,596,601 $1,011,511 13.32%
Note: All variances enumerated above are in reference to the 2021 Budget. All percentages are stated in absolute value.
25
2021 Operating BudgetCitizens Property Insurance Corporation
Administrative ExpensesComparisons of Annual Totals
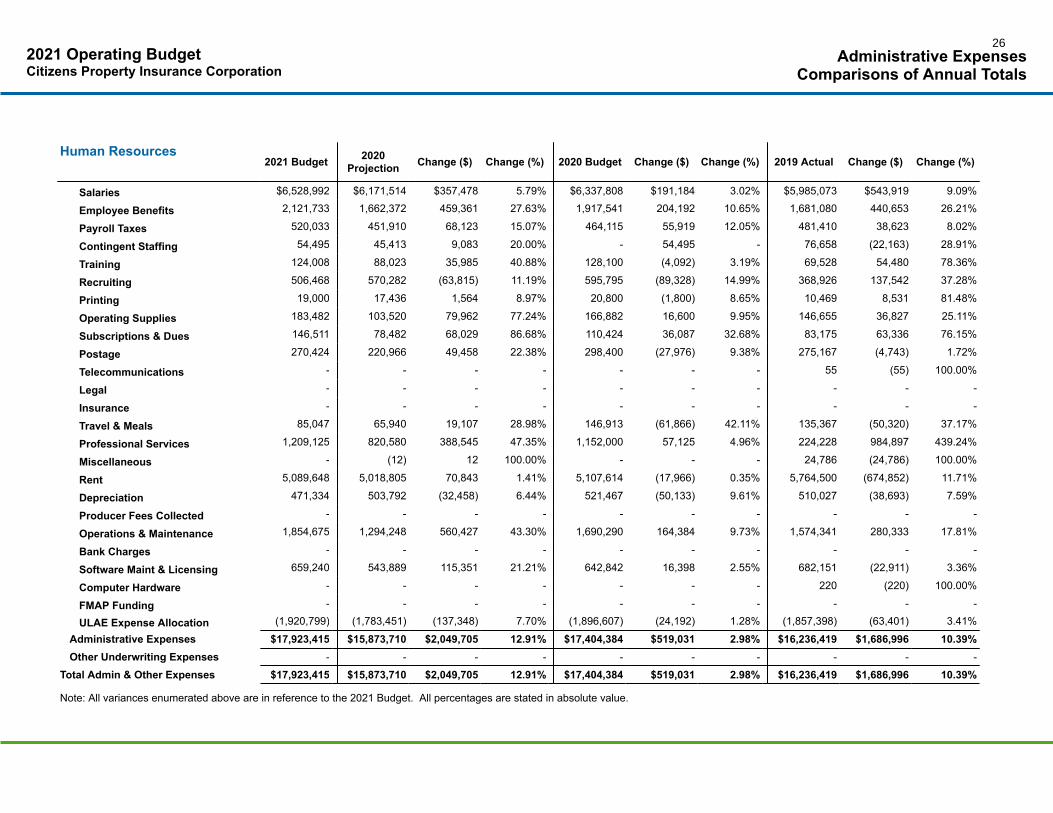
Human Resources2021 Budget 2020
Projection Change ($) Change (%) 2020 Budget Change ($) Change (%) 2019 Actual Change ($) Change (%)
Salaries $6,528,992 $6,171,514 $357,478 5.79% $6,337,808 $191,184 3.02% $5,985,073 $543,919 9.09%
Employee Benefits 2,121,733 1,662,372 459,361 27.63% 1,917,541 204,192 10.65% 1,681,080 440,653 26.21%
Payroll Taxes 520,033 451,910 68,123 15.07% 464,115 55,919 12.05% 481,410 38,623 8.02%
Contingent Staffing 54,495 45,413 9,083 20.00% - 54,495 - 76,658 (22,163) 28.91%
Training 124,008 88,023 35,985 40.88% 128,100 (4,092) 3.19% 69,528 54,480 78.36%
Recruiting 506,468 570,282 (63,815) 11.19% 595,795 (89,328) 14.99% 368,926 137,542 37.28%
Printing 19,000 17,436 1,564 8.97% 20,800 (1,800) 8.65% 10,469 8,531 81.48%
Operating Supplies 183,482 103,520 79,962 77.24% 166,882 16,600 9.95% 146,655 36,827 25.11%
Subscriptions & Dues 146,511 78,482 68,029 86.68% 110,424 36,087 32.68% 83,175 63,336 76.15%
Postage 270,424 220,966 49,458 22.38% 298,400 (27,976) 9.38% 275,167 (4,743) 1.72%
Telecommunications - - - - - - - 55 (55) 100.00%
Legal - - - - - - - - - -
Insurance - - - - - - - - - -
Travel & Meals 85,047 65,940 19,107 28.98% 146,913 (61,866) 42.11% 135,367 (50,320) 37.17%
Professional Services 1,209,125 820,580 388,545 47.35% 1,152,000 57,125 4.96% 224,228 984,897 439.24%
Miscellaneous - (12) 12 100.00% - - - 24,786 (24,786) 100.00%
Rent 5,089,648 5,018,805 70,843 1.41% 5,107,614 (17,966) 0.35% 5,764,500 (674,852) 11.71%
Depreciation 471,334 503,792 (32,458) 6.44% 521,467 (50,133) 9.61% 510,027 (38,693) 7.59%
Producer Fees Collected - - - - - - - - - -
Operations & Maintenance 1,854,675 1,294,248 560,427 43.30% 1,690,290 164,384 9.73% 1,574,341 280,333 17.81%
Bank Charges - - - - - - - - - -
Software Maint & Licensing 659,240 543,889 115,351 21.21% 642,842 16,398 2.55% 682,151 (22,911) 3.36%
Computer Hardware - - - - - - - 220 (220) 100.00%
FMAP Funding - - - - - - - - - -
ULAE Expense Allocation (1,920,799) (1,783,451) (137,348) 7.70% (1,896,607) (24,192) 1.28% (1,857,398) (63,401) 3.41%Administrative Expenses $17,923,415 $15,873,710 $2,049,705 12.91% $17,404,384 $519,031 2.98% $16,236,419 $1,686,996 10.39%Other Underwriting Expenses - - - - - - - - - -
Total Admin & Other Expenses $17,923,415 $15,873,710 $2,049,705 12.91% $17,404,384 $519,031 2.98% $16,236,419 $1,686,996 10.39%
Note: All variances enumerated above are in reference to the 2021 Budget. All percentages are stated in absolute value.
26

2021 Operating BudgetCitizens Property Insurance Corporation
Administrative ExpensesComparisons of Annual Totals
Legal Services & Purchasing2021 Budget 2020
Projection Change ($) Change (%) 2020 Budget Change ($) Change (%) 2019 Actual Change ($) Change (%)
Salaries $6,590,739 $6,292,859 $297,880 4.73% $6,483,467 $107,272 1.65% $6,007,077 $583,662 9.72%
Employee Benefits 1,774,784 1,617,574 157,209 9.72% 1,451,644 323,140 22.26% 1,278,300 496,484 38.84%
Payroll Taxes 475,576 440,366 35,209 8.00% 462,691 12,884 2.78% 433,891 41,685 9.61%
Contingent Staffing 48,960 79,563 (30,603) 38.46% 94,003 (45,043) 47.92% 112,258 (63,298) 56.39%
Training 12,115 8,660 3,455 39.89% 18,880 (6,765) 35.83% 4,317 7,798 180.63%
Recruiting - - - - - - - - - -
Printing 120 148 (28) 19.06% 120 - - 120 - -
Operating Supplies 4,140 2,431 1,709 70.28% 3,420 720 21.05% 2,533 1,607 63.46%
Subscriptions & Dues 53,040 54,891 (1,851) 3.37% 52,249 791 1.51% 41,565 11,475 27.61%
Postage - 45 (45) 100.00% - - - - - -
Telecommunications - - - - - - - - - -
Legal 1,285,200 812,592 472,608 58.16% 1,236,000 49,200 3.98% 1,995,361 (710,161) 35.59%
Insurance 890,995 775,112 115,883 14.95% 876,272 14,724 1.68% 663,415 227,581 34.30%
Travel & Meals 76,380 24,558 51,822 211.02% 99,425 (23,045) 23.18% 57,136 19,244 33.68%
Professional Services 141,800 33,598 108,202 322.05% 147,500 (5,700) 3.86% (35,171) 176,971 503.17%
Miscellaneous - - - - - - - (88) 88 100.00%
Rent 12,602 12,203 399 3.27% 12,002 600 5.00% 10,835 1,767 16.31%
Depreciation - - - - - - - - - -
Producer Fees Collected - - - - - - - - - -
Operations & Maintenance 1,260 1,112 148 13.35% 1,260 - - 1,183 77 6.51%
Bank Charges - - - - - - - - - -
Software Maint & Licensing 92,190 57,986 34,204 58.99% 62,537 29,653 47.42% 79,400 12,790 16.11%
Computer Hardware - - - - - - - - - -
FMAP Funding - - - - - - - - - -
ULAE Expense Allocation (4,683,777) (4,519,488) (164,289) 3.64% (4,601,117) (82,660) 1.80% (4,165,936) (517,842) 12.43%Administrative Expenses $6,776,123 $5,694,210 $1,081,914 19.00% $6,400,353 $375,770 5.87% $6,486,195 $289,929 4.47%Other Underwriting Expenses - - - - - - - - - -
Total Admin & Other Expenses $6,776,123 $5,694,210 $1,081,914 19.00% $6,400,353 $375,770 5.87% $6,486,195 $289,929 4.47%
Note: All variances enumerated above are in reference to the 2021 Budget. All percentages are stated in absolute value.
27

2021 Operating BudgetCitizens Property Insurance Corporation
Administrative ExpensesComparisons of Annual Totals
Communications, Legislative& External Affairs 2021 Budget 2020
Projection Change ($) Change (%) 2020 Budget Change ($) Change (%) 2019 Actual Change ($) Change (%)
Salaries $2,088,355 $2,349,552 (261,198) 11.12% $2,284,591 (196,236) 8.59% $2,248,491 (160,136) 7.12%
Employee Benefits 584,517 679,111 (94,594) 13.93% 525,414 59,103 11.25% 559,762 24,755 4.42%
Payroll Taxes 155,330 174,704 (19,374) 11.09% 170,533 (15,203) 8.91% 167,066 (11,736) 7.02%
Contingent Staffing - - - - - - - 1,494 (1,494) 100.00%
Training 57,900 21,936 35,964 163.96% 55,295 2,605 4.71% 12,246 45,654 372.81%
Recruiting - - - - - - - - - -
Printing 24,400 10,410 13,990 134.40% 139,000 (114,600) 82.45% 4,129 20,271 490.91%
Operating Supplies 6,600 5,990 610 10.18% 11,200 (4,600) 41.07% 4,928 1,672 33.92%
Subscriptions & Dues 34,985 31,707 3,278 10.34% 34,195 790 2.31% 16,460 18,525 112.54%
Postage 340 50 290 575.05% 150,100 (149,760) 99.77% 2,628 (2,288) 87.06%
Telecommunications - - - - - - - - - -
Legal - - - - - - - - - -
Insurance - - - - - - - - - -
Travel & Meals 49,950 10,981 38,969 354.89% 60,700 (10,750) 17.71% 51,136 (1,186) 2.32%
Professional Services 290,240 261,791 28,449 10.87% 250,000 40,240 16.10% 80,276 209,964 261.55%
Miscellaneous - - - - - - - (2,550) 2,550 100.00%
Rent - - - - - - - - - -
Depreciation - - - - - - - - - -
Producer Fees Collected - - - - - - - - - -
Operations & Maintenance - - - - - - - 269 (269) 100.00%
Bank Charges - - - - - - - - - -
Software Maint & Licensing 68,000 46,015 21,985 47.78% 41,000 27,000 65.85% 29,867 38,133 127.68%
Computer Hardware - - - - - - - - - -
FMAP Funding - - - - - - - - - -
ULAE Expense Allocation - - - - - - - 105,929 (105,929) 100.00%Administrative Expenses $3,360,616 $3,592,247 (231,630) 6.45% $3,722,027 (361,411) 9.71% $3,282,133 $78,484 2.39%Other Underwriting Expenses - - - - - - - - - -
Total Admin & Other Expenses $3,360,616 $3,592,247 (231,630) 6.45% $3,722,027 (361,411) 9.71% $3,282,133 $78,484 2.39%
Note: All variances enumerated above are in reference to the 2021 Budget. All percentages are stated in absolute value.
28
2021 Operating BudgetCitizens Property Insurance Corporation
Administrative ExpensesComparisons of Annual Totals
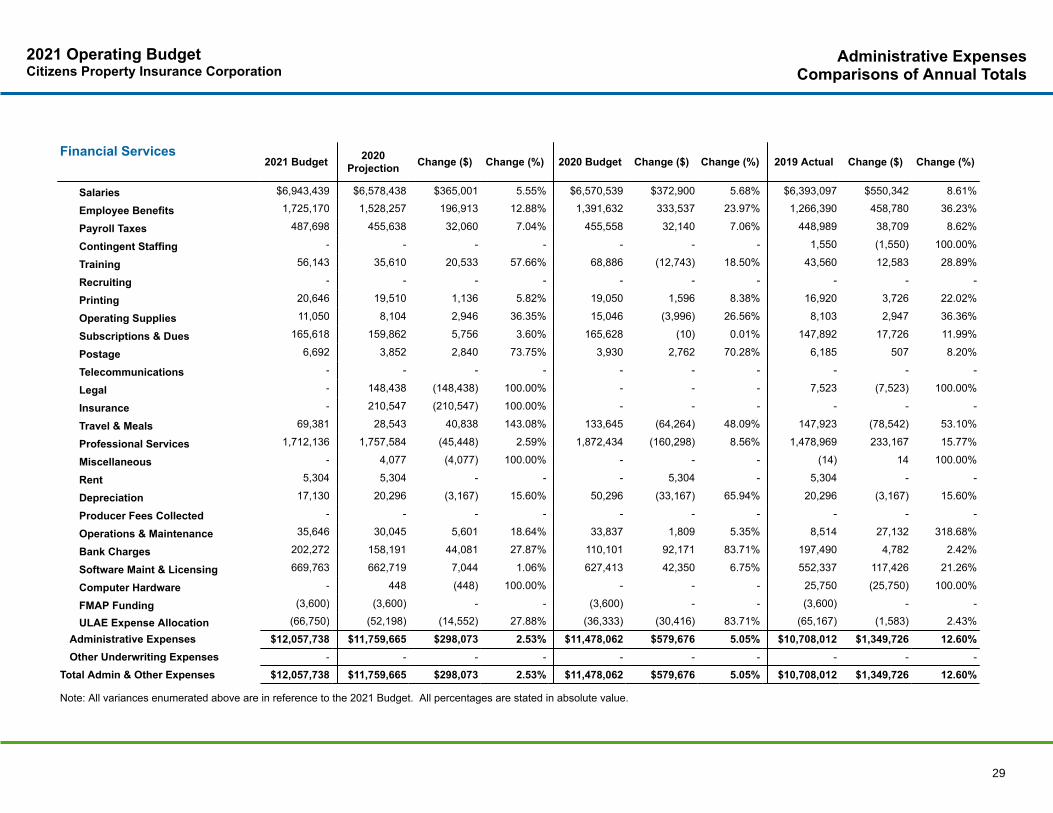
Financial Services2021 Budget 2020
Projection Change ($) Change (%) 2020 Budget Change ($) Change (%) 2019 Actual Change ($) Change (%)
Salaries $6,943,439 $6,578,438 $365,001 5.55% $6,570,539 $372,900 5.68% $6,393,097 $550,342 8.61%
Employee Benefits 1,725,170 1,528,257 196,913 12.88% 1,391,632 333,537 23.97% 1,266,390 458,780 36.23%
Payroll Taxes 487,698 455,638 32,060 7.04% 455,558 32,140 7.06% 448,989 38,709 8.62%
Contingent Staffing - - - - - - - 1,550 (1,550) 100.00%
Training 56,143 35,610 20,533 57.66% 68,886 (12,743) 18.50% 43,560 12,583 28.89%
Recruiting - - - - - - - - - -
Printing 20,646 19,510 1,136 5.82% 19,050 1,596 8.38% 16,920 3,726 22.02%
Operating Supplies 11,050 8,104 2,946 36.35% 15,046 (3,996) 26.56% 8,103 2,947 36.36%
Subscriptions & Dues 165,618 159,862 5,756 3.60% 165,628 (10) 0.01% 147,892 17,726 11.99%
Postage 6,692 3,852 2,840 73.75% 3,930 2,762 70.28% 6,185 507 8.20%
Telecommunications - - - - - - - - - -
Legal - 148,438 (148,438) 100.00% - - - 7,523 (7,523) 100.00%
Insurance - 210,547 (210,547) 100.00% - - - - - -
Travel & Meals 69,381 28,543 40,838 143.08% 133,645 (64,264) 48.09% 147,923 (78,542) 53.10%
Professional Services 1,712,136 1,757,584 (45,448) 2.59% 1,872,434 (160,298) 8.56% 1,478,969 233,167 15.77%
Miscellaneous - 4,077 (4,077) 100.00% - - - (14) 14 100.00%
Rent 5,304 5,304 - - - 5,304 - 5,304 - -
Depreciation 17,130 20,296 (3,167) 15.60% 50,296 (33,167) 65.94% 20,296 (3,167) 15.60%
Producer Fees Collected - - - - - - - - - -
Operations & Maintenance 35,646 30,045 5,601 18.64% 33,837 1,809 5.35% 8,514 27,132 318.68%
Bank Charges 202,272 158,191 44,081 27.87% 110,101 92,171 83.71% 197,490 4,782 2.42%
Software Maint & Licensing 669,763 662,719 7,044 1.06% 627,413 42,350 6.75% 552,337 117,426 21.26%
Computer Hardware - 448 (448) 100.00% - - - 25,750 (25,750) 100.00%
FMAP Funding (3,600) (3,600) - - (3,600) - - (3,600) - -
ULAE Expense Allocation (66,750) (52,198) (14,552) 27.88% (36,333) (30,416) 83.71% (65,167) (1,583) 2.43%Administrative Expenses $12,057,738 $11,759,665 $298,073 2.53% $11,478,062 $579,676 5.05% $10,708,012 $1,349,726 12.60%Other Underwriting Expenses - - - - - - - - - -
Total Admin & Other Expenses $12,057,738 $11,759,665 $298,073 2.53% $11,478,062 $579,676 5.05% $10,708,012 $1,349,726 12.60%
Note: All variances enumerated above are in reference to the 2021 Budget. All percentages are stated in absolute value.
29

2021 Operating BudgetCitizens Property Insurance Corporation
Administrative ExpensesComparisons of Annual Totals
Claims2021 Budget 2020
Projection Change ($) Change (%) 2020 Budget Change ($) Change (%) 2019 Actual Change ($) Change (%)
Salaries $25,386,880 $23,931,019 $1,455,861 6.08% $24,312,897 $1,073,984 4.42% $22,558,049 $2,828,831 12.54%
Employee Benefits 6,782,880 6,041,458 741,422 12.27% 5,628,604 1,154,275 20.51% 4,981,727 1,801,153 36.16%
Payroll Taxes 1,865,871 1,763,074 102,798 5.83% 1,813,546 52,325 2.89% 1,657,146 208,725 12.60%
Contingent Staffing 55,765,870 59,641,904 (3,876,034) 6.50% 65,269,195 (9,503,325) 14.56% 59,811,689 (4,045,819) 6.76%
Training 34,458 25,633 8,825 34.43% 49,355 (14,897) 30.18% 26,653 7,805 29.29%
Recruiting - - - - - - - - - -
Printing 17,062 3,628 13,434 370.34% 8,616 8,446 98.03% 9,694 7,367 75.99%
Operating Supplies 21,409 12,655 8,754 69.17% 18,714 2,695 14.40% 10,493 10,916 104.04%
Subscriptions & Dues 523,550 479,568 43,981 9.17% 795,711 (272,161) 34.20% 74,759 448,791 600.32%
Postage 5,191 1,858 3,333 179.42% 5,329 (138) 2.59% 95 5,096 5,364.79%
Telecommunications - 187 (187) 100.00% - - - 706 (706) 100.00%
Legal 320,000 164,488 155,512 94.54% 332,000 (12,000) 3.61% 153,408 166,592 108.59%
Insurance - - - - - - - - - -
Travel & Meals 413,168 155,733 257,435 165.31% 471,607 (58,439) 12.39% 439,460 (26,292) 5.98%
Professional Services 1,669,954 706,665 963,289 136.31% 547,850 1,122,104 204.82% 290,488 1,379,466 474.88%
Miscellaneous - 178 (178) 100.00% - - - (4,320) 4,320 100.00%
Rent - 26,031 (26,031) 100.00% - - - 105,362 (105,362) 100.00%
Depreciation - - - - - - - - - -
Producer Fees Collected - - - - - - - 250 (250) 100.00%
Operations & Maintenance 117,971 54,599 63,372 116.07% 2,720 115,251 4,237.17% 7,303 110,668 1,515.41%
Bank Charges - - - - - - - - - -
Software Maint & Licensing 3,792,299 3,052,535 739,764 24.23% 4,233,403 (441,104) 10.42% 2,985,418 806,881 27.03%
Computer Hardware 5,226 360 4,866 1,351.53% 5,225 1 0.01% 1,534 3,691 240.59%
FMAP Funding - - - - - - - - - -
ULAE Expense Allocation (96,721,788) (96,061,573) (660,215) 0.69% (103,494,772) 6,772,984 6.54% (93,109,915) (3,611,874) 3.88%Administrative Expenses - - - - - - - - - -Other Underwriting Expenses - - - - - - - - - -
Total Admin & Other Expenses - - - - - - - - - -
Note: All variances enumerated above are in reference to the 2021 Budget. All percentages are stated in absolute value.
30

2021 Operating BudgetCitizens Property Insurance Corporation
Administrative ExpensesComparisons of Annual Totals
Consumer and PolicyServices 2021 Budget 2020
Projection Change ($) Change (%) 2020 Budget Change ($) Change (%) 2019 Actual Change ($) Change (%)
Salaries $4,904,243 $4,261,003 $643,240 15.10% $4,559,346 $344,897 7.56% $4,258,180 $646,063 15.17%
Employee Benefits 1,708,984 1,391,165 317,819 22.85% 1,354,790 354,194 26.14% 1,134,503 574,481 50.64%
Payroll Taxes 355,575 310,241 45,334 14.61% 329,672 25,903 7.86% 308,763 46,812 15.16%
Contingent Staffing - - - - - - - - - -
Training 18,500 22,882 (4,382) 19.15% 26,760 (8,260) 30.87% 16,198 2,302 14.21%
Recruiting - - - - - - - - - -
Printing 5,000 3,472 1,528 44.03% 5,000 - - 323 4,677 1,447.99%
Operating Supplies 10,450 10,198 252 2.47% 10,200 250 2.45% 8,689 1,761 20.27%
Subscriptions & Dues 2,300 2,676 (376) 14.04% 2,000 300 15.00% 1,650 651 39.44%
Postage - - - - - - - - - -
Telecommunications - - - - - - - - - -
Legal - - - - - - - - - -
Insurance - - - - - - - - - -
Travel & Meals 20,370 1,332 19,038 1,428.82% 39,720 (19,350) 48.72% 70,130 (49,760) 70.95%
Professional Services 320,000 34,800 285,200 819.54% 50,000 270,000 540.00% 7,605 312,395 4,107.75%
Miscellaneous - 69 (69) 100.00% - - - - - -
Rent - - - - - - - - - -
Depreciation - - - - - - - - - -
Producer Fees Collected - - - - - - - - - -
Operations & Maintenance 21,000 21,000 - - 21,000 - - 11,021 9,980 90.55%
Bank Charges - - - - - - - - - -
Software Maint & Licensing 105,500 24,599 80,901 328.89% 25,000 80,500 322.00% 1,210 104,290 8,621.89%
Computer Hardware - - - - - - - - - -
FMAP Funding - - - - - - - - - -
ULAE Expense Allocation - - - - - - - (1,060) 1,060 100.00%Administrative Expenses $7,471,922 $6,083,436 $1,388,486 22.82% $6,423,488 $1,048,434 16.32% $5,817,212 $1,654,711 28.45%Other Underwriting Expenses 2,589,898 5,186,899 (2,597,001) 50.07% 5,274,560 (2,684,662) 50.90% 6,462,523 (3,872,625) 59.92%
Total Admin & Other Expenses $10,061,820 $11,270,336 (1,208,515) 10.72% $11,698,048 (1,636,228) 13.99% $12,279,734 (2,217,914) 18.06%
Note: All variances enumerated above are in reference to the 2021 Budget. All percentages are stated in absolute value.
31
2021 Operating BudgetCitizens Property Insurance Corporation
Administrative ExpensesComparisons of Annual Totals
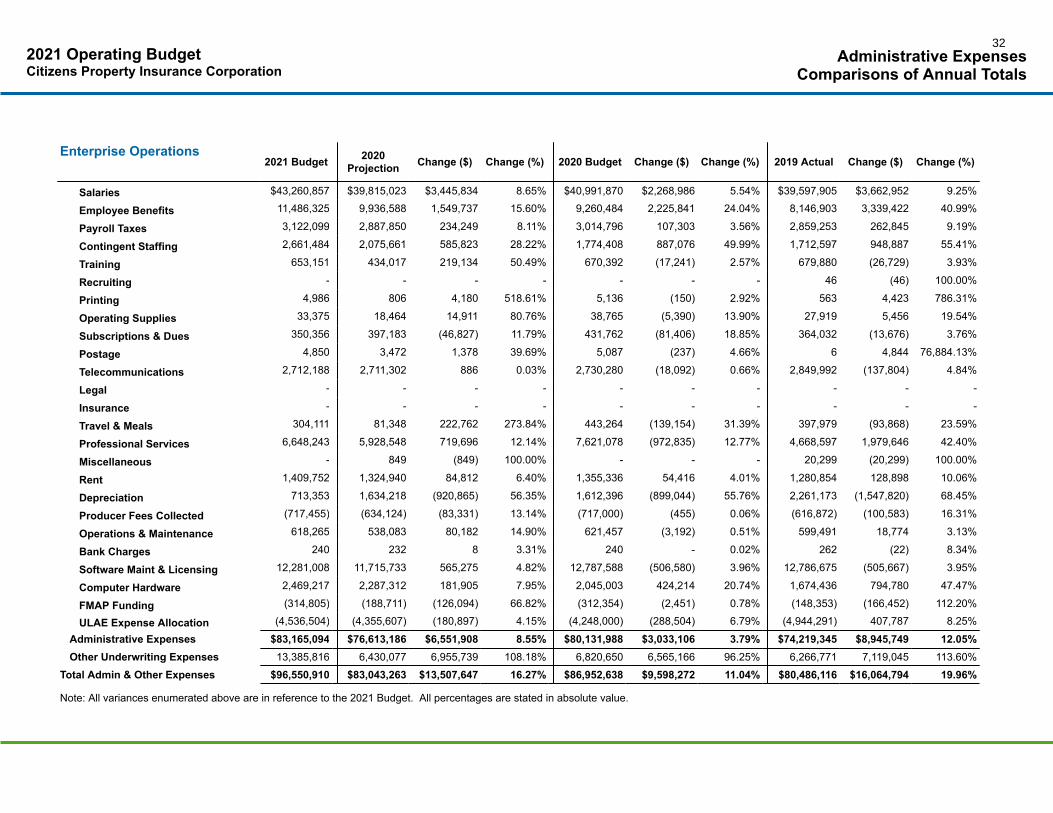
Enterprise Operations2021 Budget 2020
Projection Change ($) Change (%) 2020 Budget Change ($) Change (%) 2019 Actual Change ($) Change (%)
Salaries $43,260,857 $39,815,023 $3,445,834 8.65% $40,991,870 $2,268,986 5.54% $39,597,905 $3,662,952 9.25%
Employee Benefits 11,486,325 9,936,588 1,549,737 15.60% 9,260,484 2,225,841 24.04% 8,146,903 3,339,422 40.99%
Payroll Taxes 3,122,099 2,887,850 234,249 8.11% 3,014,796 107,303 3.56% 2,859,253 262,845 9.19%
Contingent Staffing 2,661,484 2,075,661 585,823 28.22% 1,774,408 887,076 49.99% 1,712,597 948,887 55.41%
Training 653,151 434,017 219,134 50.49% 670,392 (17,241) 2.57% 679,880 (26,729) 3.93%
Recruiting - - - - - - - 46 (46) 100.00%
Printing 4,986 806 4,180 518.61% 5,136 (150) 2.92% 563 4,423 786.31%
Operating Supplies 33,375 18,464 14,911 80.76% 38,765 (5,390) 13.90% 27,919 5,456 19.54%
Subscriptions & Dues 350,356 397,183 (46,827) 11.79% 431,762 (81,406) 18.85% 364,032 (13,676) 3.76%
Postage 4,850 3,472 1,378 39.69% 5,087 (237) 4.66% 6 4,844 76,884.13%
Telecommunications 2,712,188 2,711,302 886 0.03% 2,730,280 (18,092) 0.66% 2,849,992 (137,804) 4.84%
Legal - - - - - - - - - -
Insurance - - - - - - - - - -
Travel & Meals 304,111 81,348 222,762 273.84% 443,264 (139,154) 31.39% 397,979 (93,868) 23.59%
Professional Services 6,648,243 5,928,548 719,696 12.14% 7,621,078 (972,835) 12.77% 4,668,597 1,979,646 42.40%
Miscellaneous - 849 (849) 100.00% - - - 20,299 (20,299) 100.00%
Rent 1,409,752 1,324,940 84,812 6.40% 1,355,336 54,416 4.01% 1,280,854 128,898 10.06%
Depreciation 713,353 1,634,218 (920,865) 56.35% 1,612,396 (899,044) 55.76% 2,261,173 (1,547,820) 68.45%
Producer Fees Collected (717,455) (634,124) (83,331) 13.14% (717,000) (455) 0.06% (616,872) (100,583) 16.31%
Operations & Maintenance 618,265 538,083 80,182 14.90% 621,457 (3,192) 0.51% 599,491 18,774 3.13%
Bank Charges 240 232 8 3.31% 240 - 0.02% 262 (22) 8.34%
Software Maint & Licensing 12,281,008 11,715,733 565,275 4.82% 12,787,588 (506,580) 3.96% 12,786,675 (505,667) 3.95%
Computer Hardware 2,469,217 2,287,312 181,905 7.95% 2,045,003 424,214 20.74% 1,674,436 794,780 47.47%
FMAP Funding (314,805) (188,711) (126,094) 66.82% (312,354) (2,451) 0.78% (148,353) (166,452) 112.20%
ULAE Expense Allocation (4,536,504) (4,355,607) (180,897) 4.15% (4,248,000) (288,504) 6.79% (4,944,291) 407,787 8.25%Administrative Expenses $83,165,094 $76,613,186 $6,551,908 8.55% $80,131,988 $3,033,106 3.79% $74,219,345 $8,945,749 12.05%Other Underwriting Expenses 13,385,816 6,430,077 6,955,739 108.18% 6,820,650 6,565,166 96.25% 6,266,771 7,119,045 113.60%
Total Admin & Other Expenses $96,550,910 $83,043,263 $13,507,647 16.27% $86,952,638 $9,598,272 11.04% $80,486,116 $16,064,794 19.96%
Note: All variances enumerated above are in reference to the 2021 Budget. All percentages are stated in absolute value.
32

This page is intended to be blank

This page is intended to be blank

2021 Operating BudgetCapital Acquisitions

This page is intended to be blank
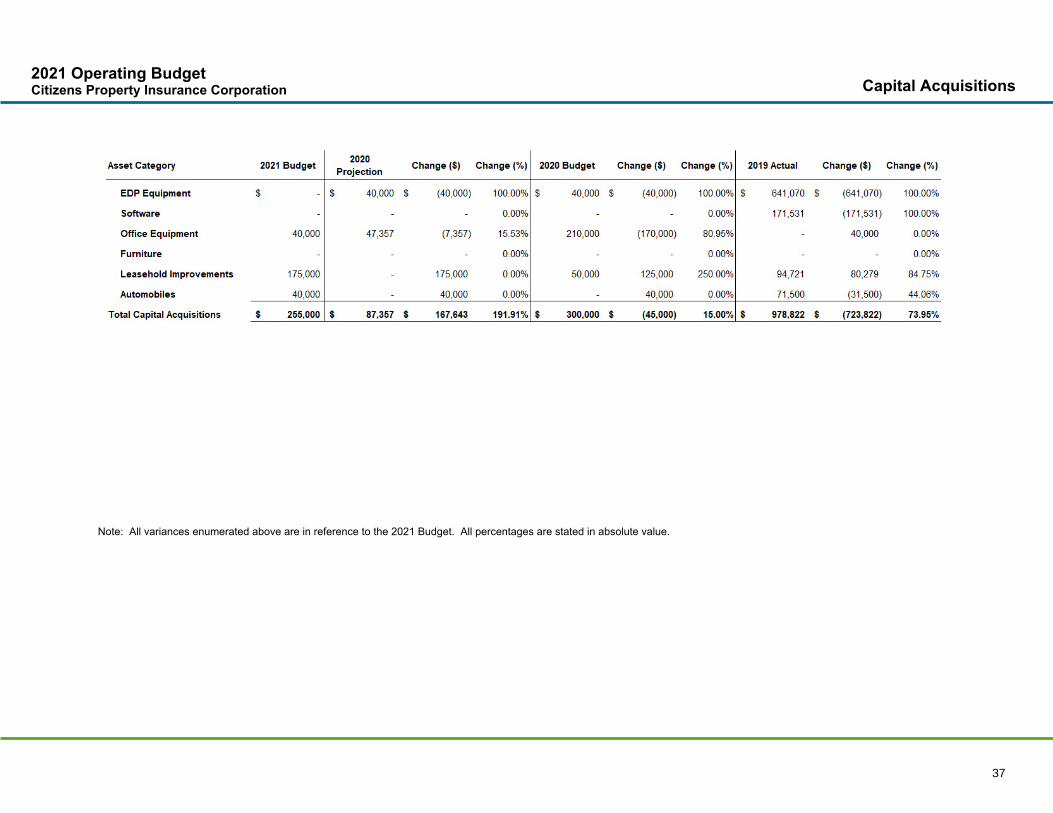
2021 Operating BudgetCitizens Property Insurance Corporation Capital Acquisitions
Note: All variances enumerated above are in reference to the 2021 Budget. All percentages are stated in absolute value.
37

This page is intended to be blank

2021 Operating BudgetProbable Maximum Loss (PML) Scenarios
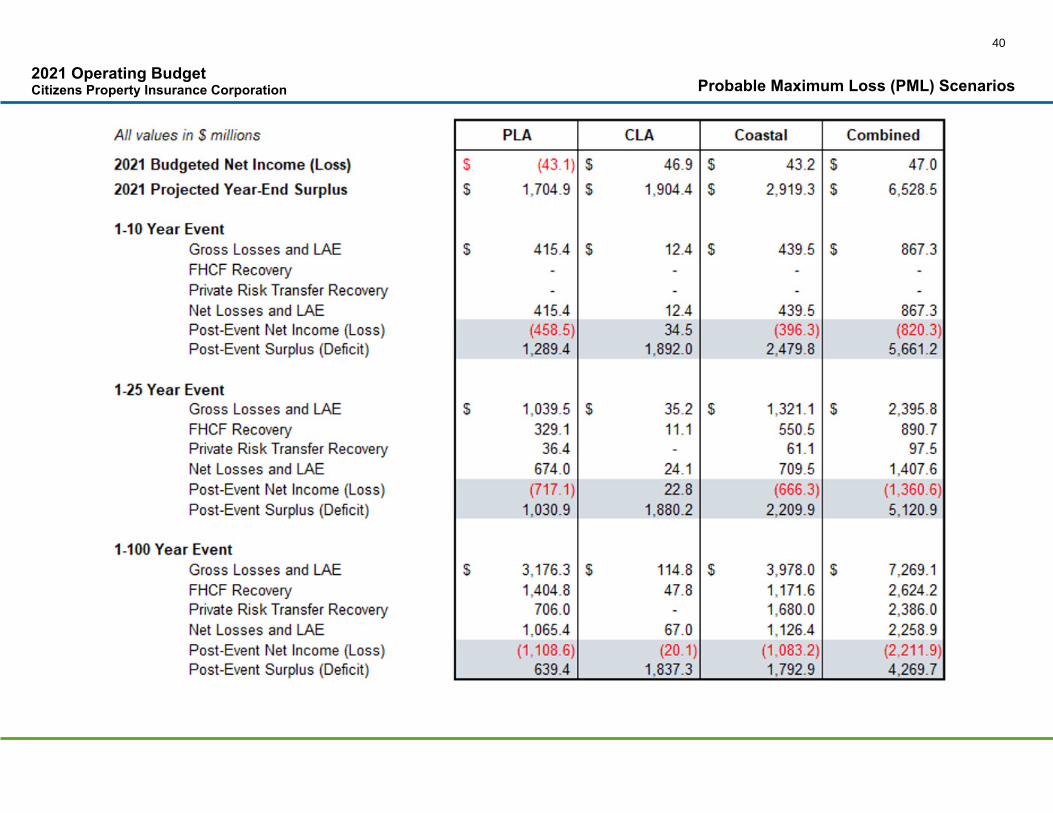
2021 Operating BudgetCitizens Property Insurance Corporation Probable Maximum Loss (PML) Scenarios
40

2021 Operating BudgetCitizens Property Insurance Corporation Probable Maximum Loss (PML) Scenarios
Assumptions:
1) A loss event for one account will not be the same size event for other accounts. The relative magnitude of an event will depend on the size, severity, and path of the storm. Probable Maximum Loss ("PML") estimates are Standard Sea-Surface Temperature, are based on Single-Event Occurrences and do not include any provision for the adjustment of claims (LAE). The LAE load as a percentage of loss is set to 10%. PML estimates were modeled using AIR Touchstone, Version 7, including demand surge, excluding storm surge, on exposures as of September 30, 2020 adjusted for forecasted changes in exposure through June 2021.
2) Each account is accounted for separately as required by Florida Statute where deficit calculation and assessments are determined at the account level. However, the PLA and the CLA are evaluated together for FHCF and credit purposes. The loss amounts above illustrate the effect of the accounts aggregated, not combined as one account.
3) FHCF recoveries are based on 2020 retention and payout multiples. The actual retention and limits for 2021 may be significantly different from these estimates.
4) The assumed private risk transfer program and corresponding recoveries may significantly change due to market conditions and/or Citizens' exposures in 2021.
5) PLA is projected to have sufficient resources to cover a 1-100 year storm followed by a 1-19 year storm. CLA is projected to have sufficient resources to cover a 1-100 year storm followed by more than a 1-10,000 year storm.The Coastal Account is projected to have sufficient resources to cover a 1-100 year storm followed by a 1-35 year storm.
41

This page is intended to be blank