2021 annual sustainability report - paine schwartz partners
TRANSCRIPT
paineschwartz.com
Annual Sustainability Report
2021

Table of Contents
P. 4 SECTION #1
Promoting Global Food Chain Sustainability
• Overview
• Reporting and Stewardship
• ESG Integration
• KPIs and Portfolio ESG Performance
• COVID-19 Response
P. 18 SECTION #2
The Paine Schwartz Partners Portfolio
• Fund V
• Fund IV
• Fund III
• Recently Exited
P. 46 SECTION #3
Looking Ahead
LEADERSHIP LETTERPaine Schwartz Partners recognizes that, as the global population grows and natural resources become scarcer through a combination of increased demand and changes in the climate, it is critical to help create sustainable solutions to emerging risks. We are proud of the contribution we make to enhancing the sustainability and impact of the global food chain while supporting health and wellness around the world.
In 2020, our firm continued its pursuit of driving value in our portfolio while creating value in the global food and agribusiness sector. Guided by the framework established by the United Nations’ Sustainable Development Goals (SDGs), particularly Goal #2 Zero Hunger, our firm is committed to proactive management of key ESG issues. As a signatory of the United Nations Principles for Responsible Investment (PRI) and a supporter of the Task Force on Climate-related Financial Disclosures (TCFD), we believe that responsible stewardship helps protect our portfolio from risk while further enhancing value through a commitment to addressing environmental and climate-related challenges.
In partnership with our management teams, we promoted initiatives surrounding Environment, Social, and Governance (ESG) standards to create stronger, more responsible companies. This report – our fourth annual portfolio-wide disclosure – details how we consider ESG factors from initial idea generation, through diligence and ownership to exit. With a view to the entire portfolio as well as company-by-company reporting, we are pleased to provide robust KPI performance on key environmental impact factors, including greenhouse gas emissions, energy usage, water usage, and waste. In addition, after collecting baseline metrics in 2019, we are now comparing year-over-year environmental KPI performance. Not only has this progress helped us understand year-end performance, but engaging with our companies allows us to stratify our portfolio to understand the areas that represent the greatest environmental impact. In doing so, we are able to
work with companies on targeted initiatives, where possible, to reduce impact moving forward.
Paine Schwartz also highly values the human element of our business, from the workforce of our portfolio companies to that of our own firm. This report details many of the ways we are focused on enhanced initiatives around Diversity, Equity, & Inclusion (DE&I) while providing a baseline for KPI measurements in this area. We aim to continue to advance data collection around these key social metrics in much the same way that we have with environmental considerations. We seek to make our portfolio one which prizes unique voices and protects those who make our business possible.
To underscore and improve the accountability structure with respect to ESG, we have established an ESG Committee comprised of the CEO and various functional heads of our firm. This step will provide additional oversight throughout the year with respect to ESG initiatives to help ensure that progress is made at both the firm and portfolio company level over time. One primary short-term goal of this group will be to further examine our approach to DE&I, leveraging the data collected for 2020 and presented in this report.
We believe our approach increases portfolio company accountability to ESG principles and improves transparency with external stakeholders. We look forward to sharing this fourth annual assessment with you. This report reflects the commitment of Paine Schwartz and its portfolio, and we thank you for your ongoing support as we continue to invest and create value in companies that share our view of the future.
With Regards,
Kevin SchwartzChief Executive Officer
The senior leadership of Paine Schwartz is providing this information as a general
overview of our responsible investment approach and with the stewardship guidelines
of PRI. It should not constitute advice, nor be relied upon as such. However, our
readers may take the detailed review we have provided as a signal of our commitment
to advancing ESG factors within our portfolio.
2 3PAINE SCHWARTZ PARTNERS ANNUAL SUSTAINABILITY REPORT 2021

Promoting Global Food Chain Sustainability01

About Paine Schwartz Partners Paine Schwartz Partners: Building Food Chain Sustainability for Our Portfolio and the World
C O M PA N Y O V E R V I E W E S G A N D P S P
Paine Schwartz leverages a research-intensive, thesis-driven approach, and deep operational and sector expertise to enhance value in each of our investments.
Our professionals have well-established investment and operating experience in the food and agribusiness sector, with a demonstrated track record necessary to invest competitively and successfully.
At Paine Schwartz, we believe that value creation and sustainability are inextricably linked in the food and agribusiness sector.
We seek to invest exclusively in companies that operate along the sustainable food chain, and aim to pursue opportunities where we can generate superior returns while also creating a positive impact from an ESG perspective. We are integrating ESG principles throughout our investment practices and processes.
As dedicated and experienced professionals in the food and agribusiness value chain, we have the opportunity to make an impact and are committed to addressing real, imminent challenges that face the sector.
Crop Production
Terrestrial
Livestock
Production
Storage/ Handling
Primary
Processing
Packing
Commodity
Trading
Food Ingredients Retail
Restaurants
Foodservice
High-Value
Finished Products
Contract
Manufacturing
Value-Add
Distribution
Aquaculture, Wild
GEOGRAPHIES — OECD headquarters, international operations, derivative exposure to developing countries
1. Advanta and Seminis were portfolio companies of the Predecessor Firm’s Fund II portfolio. 2. Investment closed in Q1 2021 and was not included in the data collection process.
PSP Area of Focus
Animal Health & Nutrition
IP/GeneticsSeed
FertilizerWaterFeed
ANIM
AL P
ROTE
INS
GRAINS
FRUITS ANDVEGETABLES
DAIRY
LIVESTOCK
SEAFOOD
FA R M E R C O N S U M E R
PROCESSINGCONSUMER GOODS AND
DISTRIBUTION
POINT-OF- CONSUMPTION INPUTS
PRODUCTION (CROPS AND
PROTEIN)
TRADE AND WHOLESALE
INPUT SUPPLY AND
DISTRIBUTION
TECHNOLOGY AND SERVICES
1
1
THE LONG-TERM IMPERATIVE TO ENHANCE AGRICULTURAL PRODUCTIVITY THROUGHOUT THE VALUE CHAIN
� Population and consumption growth � Increasing wealth in developing countries
THE IMPORTANCE OF INVESTING BEHIND ENVIRONMENTALLY SUSTAINABLE BEST PRACTICES
� Impact of climate change � Food loss and waste reduction � Food security challenges
01
SHIFTING CONSUMER PREFERENCES TOWARDS HEALTHIER, SAFER, AND MORE SUSTAINABLE CONSUMPTION
� Health & wellness demand � Environmentally-conscious choices � Food safety & traceability
02
03
500+ YEARS
OF COMBINED INDUSTRY EXPERIENCE*
20+ YEARS
OF FOOD & AG INVESTING
~$3 BILLION
TOTAL EQUITY DEPLOYED**
100+ COUNTRIES
PORTFOLIO COMPANY SALES
65+ FOOD & AG
INVESTMENTS
~$6 BILLION
TOTAL ACQUISITION VALUE
* All information is as of May 2021. ** Total equity includes co-investment.
2Equipment ∙ Testing ∙ R&D ∙ Consulting
We use the term sustainable food chain to reflect one of the core themes of our investment strategy – increasing productivity across the food & agribusiness value chain – and to underscore our commitment to seek to be transparent and progress on ESG as an investor in this sector. Sustainable food systems are the focus of indicator 2.4 of SDG 2 (No Hunger), with which we seek to strategically align through our investment approach.
Food and Ag Sustainability Themes
6 7PAINE SCHWARTZ PARTNERS ANNUAL SUSTAINABILITY REPORT 2021

Paine Schwartz has been a proud signatory of the Principles for Responsible Investment (PRI) since April 2019. Supported by the United Nations, PRI establishes a cohesive set of investment principles for integrating ESG policies into investment practice through reporting, transparency and accountability.
Paine Schwartz’s ESG Policy includes alignment with the considerations put forth by the Task Force on Climate- related Financial Disclosures (TCFD). Through reporting alignment with PRI, TCFD considers the physical risks associated with climate change in addition to those related to the transition to a lower carbon economy.
Certifications and StandardsPaine Schwartz is committed to working towards sustainability and food security by aligning with universal guidance for responsible investment. We act under several internationally recognized industry standards that are utilized to support the integration of ESG policies and processes into investment practice.
Making a Sustainable ContributionAs the global population grows and natural resources become scarcer through a combination of increased demand and changes in the climate, it is critical to focus on sustainable solutions to emerging risks, including access to sustainable sources of nutrition.
E S G S T E WA R D S H I P E S G S T E WA R D S H I P
PRIMARY AREA OF PSP FOCUS
OTHER RELEVANT AREAS
Zero Hunger
End hunger, achieve food security and improved nutrition, and promote sustainable agriculture.
#2
Clean Water and Sanitation
Ensure availability and sustainable management of water and sanitation for all.
#6
Decent Work and Economic Growth
Promote sustained, inclusive, and sustainable economic growth, full and productive employment, and decent work for all.
#8
Ensure sustainable consumption and production patterns.
Responsible Consumption and Production #12
Climate Action
Take urgent action to combat climate change and its impacts.
#13
In addition to the frameworks we use to guide our reporting and investment practice, Paine Schwartz uses the United Nations’ Sustainable Develop-ment Goals (SDGs) as a guide towards positively impacting the global food ecosystem. The SDGs are a universal set of 17 goals, targets, and indicators designed to shape corporate agen-das and political policies in relation to a broad range of social, environmental, and economic development issues.
Private sector contribution to achieve these ambitious goals is critical, and it is an embedded element of Paine Schwartz Partners’ investment ap-proach to support this objective.
Paine Schwartz uses the Sustainability Accounting Standards Board (SASB) guidance for the Food & Beverage Industry to identify material ESG focus areas for our portfolio companies. Founded in 2011, SASB is the industry standard used to recognize the impact of environmental, social, and governance factors on the financial performance of companies.
8 9PAINE SCHWARTZ PARTNERS ANNUAL SUSTAINABILITY REPORT 2021

Implementing our ESG Approach
ESG is at the heart of our business. Recently, we took steps to reinforce this through the establishment of an internal ESG Committee, consisting of the CEO and various functional heads of the firm. In addition to a number of internal initiatives around climate change and Diversity, Equity & Inclusion, Paine Schwartz continually empowers our team to gain a deeper appreciation and understanding for the ESG process. We conduct periodic training sessions, with a proactive approach to developing ESG awareness and action.
RESPONSIBILITY
REPORTING
ESG analysis is integrated and evaluated through a number of tools including peer benchmarking, expert third-party screening processes, and reporting to industry standards. We summarize this performance in our Annual Sustainability Report and report regularly to our LPs through the Annual Meeting and other communications.
E S G I N T E G R AT I O N
Our approach to responsible investing spans the full life cycle of an investment from idea generation to realization.
Paine Schwartz Partners’ investment activity generates a positive impact by integrating ESG considerations into each step of the process. Through our thesis-driven strategy approach and due diligence efforts, we focus on allocating capital to businesses that are improving sustainability and promoting access to food across the value chain.
In the due diligence phase, Paine Schwartz evaluates potential investments for material ESG-related considerations such as climate risks and social considerations. The firm is continuously seeking to improve the ways in which key risks and opportunities are identified and factored into value creation plans.
Due Diligence
Approximately every 5 years, Paine Schwartz conducts long-range, proprietary research – in addition to the ongoing research we do internally – to identify investment opportunities that promote sustainability, production, and health and wellness throughout the food value chain.
Idea Generation
In addition to helping our companies create their own ESG policies, Paine Schwartz consolidates year-over-year portfolio data into actionable items to respond to emerging trends and drive ESG achievements for its companies. The objective is to ensure that, over the hold period, real measurable changes are made in terms of improving our sustainability footprint in ways that are consistent with driving returns.
Enhancement
At investment, we seek to embed ESG value creation initiatives into the 100-day plan and assign responsibility for ESG matters at the Board and CEO level. Following the investment, our team is committed to ongoing monitoring of all portfolio companies to track progress of sustainability and ESG-related initiatives. We seek to partner closely with management teams to support initiatives, track management of key topics, and instill stronger corporate governance and oversight of ESG within each company.
Monitoring
We believe that our focus on ESG creates portfolio companies of longer lasting value. At the time of exit, Paine Schwartz seeks to ensure that companies have fully integrated ESG frameworks that will remain intact during the period of transition. Paine Schwartz aims to proactively address identified material risks prior to exit, and significant value enhancement opportunities are identified for the road ahead.
Exit
This report is intended to reflect our general framework for managing ESG issues through the lifecycle of an investment across PSP’s investment management businesses. PSP’s ability to influence and exercise control over the companies in which it invests will vary depending on the investment structure and terms. In cases where PSP determines it has limited ability to conduct diligence or to influence and control the consideration of ESG issues in connection with an investment, whether at the investment or at the fund-level, PSP will only apply those elements that it determines to be practicable. Examples of such cases at the investment-level include where PSP is a minority shareholder, has limited governance rights or where other circumstances affect PSP’s ability to assess, set or monitor ESG-related performance goals. Examples of such cases at the fund-level include a jointly managed fund, and instances where the underlying investor maintains significant influence over investment decisions.
For the purposes of this report, “material” ESG issues are defined as those issues that PSP in its sole discretion determines have - or have the potential to have - a substantial impact on an organization’s ability to create, preserve, or erode economic value, as well as environmental and social value for itself and its stakeholders. Notwithstanding anything in this ESG report to the contrary, PSP does not expect to subordinate a fund’s investment returns or increase a fund’s investment risks as a result of (or in connection with) the consideration of any ESG factors.
10 11PAINE SCHWARTZ PARTNERS ANNUAL SUSTAINABILITY REPORT 2021

Material Environmental KPIs for the Paine Schwartz Portfolio
Year-over-Year Performance
P O R T F O L I O R E P O R T I N G – E N V I R O N M E N TA L I M PA C T
Paine Schwartz is committed to ongoing monitoring and reporting of ESG-related metrics and seeks to provide timely information to Limited Partners and other key stakeholders. To ensure accountability and focus on these issues, our portfolio companies are required to track, measure, and report progress on ESG annually, with support provided by dedicated third-party resources. The following set of key environmental metrics are measured to quantify portfolio-wide ESG performance:
2019 2020 % Change Notes
Scope 1 and 2 (w/fertilizer) (MT GHG/$000 Revenue) 0.172 0.140 -18.7%
• 85% of the entire portfolio’s emissions footprint is driven by Spearhead (61%), Lyons Magnus (14%), and Prima® Wawona (10%).
• The majority of the decrease in emissions reductions for Spearhead was driven by reduced fertilizer usage given weather fluctuations.
• Paine Schwartz plans to focus on portfolio-wide attempts to reduce fertilizer use and subsequent emissions.
Scope 1 and 2 (w/o fertilizer) (MT GHG/$000 Revenue) 0.078 0.076 -3.6%
Renewable Energy Consumed (w/bio-based) (MWh) 136,482 138,037 1.1%
• Spearhead (39%), Lyons Magnus (21%), and ScanBio (15%) are the largest consumers of energy in the Paine Schwartz portfolio.
• Both Spearhead and ScanBio are sourcing a sizeable proportion of their energy needs with bio-based fuels, reducing the emissions impact of their usage.
% Renewable w/ Bio-Based 23.8% 22.5% -5.6%
% Renewable w/o Bio-Based 0.7% 0.6% -12.1%
Recycled Water (m3) 10,877 11,202 3.0% • Total water consumption in the portfolio is almost entirely Prima® Wawona (94%). Moving forward, Paine Schwartz plans to make water conservation an increasing area of focus.
% Water Recycled 0.01% 0.01% 7.0%
% Waste Diverted from Landfill 25.7% 23.1% -10.0%
• Lyons Magnus contributes 52% of the total waste in the portfolio. Paine Schwartz is focused on waste reduction measures throughout the portfolio.
NOTABLE PAINE SCHWARTZ ENVIRONMENTAL PERFORMANCE IN 2020
Through our data collection, Paine Schwartz has identified the impact of fertilizer use on emissions and will seek to develop initiatives for further reduction.
Scope 1 and 2 Emissions (w/fertilizer)
0.140MT GHG/$000 Revenue
Scope 1 and 2 Emissions (w/o fertilizer)
0.076MT GHG/$000 Revenue
22.5%of portfolio energy consumption is renewably sourced.*
4,508metric tonnes of waste diverted from landfills.
* In
cludin
g bio
-bas
ed
SCOPE 1 EMISSIONS Direct greenhouse gas (GHG)1 emissions from owned assets or controlled sources.
SCOPE 2 EMISSIONS Indirect greenhouse gas (GHG)1 emissions generated from purchased energy, heating, and electricity.
GHG INTENSITY Ratio that expresses GHG impact per unit of economic value (i.e. tonnes of CO2e emissions per unit of revenue or product).2
RENEWABLE ELECTRICITY CONSUMED Energy use resulting from the consumption of electricity originating from company-owned renewable sources.
ELECTRICITY USAGE Energy consumed via electricity, either purchased from a third-party (i.e. electric utility) or generated on-site (i.e. solar power).
DIVERTED WASTE Waste that is disposed of in a manner other than via landfill.
RECYCLED WATER Used water that has been treated or processed for reuse.
TOTAL WATER USE Water consumption, such as in offices, laboratories, or for farming applications.
% RENEWABLE WITH BIO-BASED ENERGY Percent of total energy consumption that originated from renewable energy sources, including from biologically based materials.
% RENEWABLE WITHOUT BIO-BASED ENERGY Percent of total energy consumption that originated from renewable energy sources, but not including biologically based materials.
ENVIRONMENTAL KPIS MEASURED IN 2020
1. For the purpose of this report, GHG equals CO2e. CO2e is the universal unit of measurement to indicate the Global Warming Potential (GWP) of each of the six greenhouse gases, expressed in terms of the GWP of one unit of carbon dioxide. It is used to evaluate releasing (or avoiding releasing) different greenhouse gases against a common basis. Global Warming Potentials from AR4 were used to calculate CO2e.
2. For our report we adopt the following approach: GHG Intensity = (Scope 1 and 2 emissions (w/fertilizer) (MT GHG/$000 Revenue)).
12 13PAINE SCHWARTZ PARTNERS ANNUAL SUSTAINABILITY REPORT 2021

Company-Specific Environmental KPI Performance
P O R T F O L I O R E P O R T I N G
Paine Schwartz champions reduced environmental impacts throughout our portfolio and seeks to support our companies in best practices and environmentally sound initiatives. Details around these actions can be found on the pages later in this report, but the environmental KPI performance of every active company is included here for ease of reference.
The below table highlights reporting year metrics across our portfolio companies. Light blue boxes indicate data which is not material to the environmental impact or operations of a particular company. As we look to the future, we will continue to use this information to identify key strengths and areas for improvement.
COMPANY GHG1 INTENSITY (SCOPE 1 AND 2
W/ FERTILIZER MT GHG/$000
REVENUE)
RENEWABLE ENERGY
W/BIO-BASED (MWH)*
TOTAL ENERGY (MWh)
% RENEWABLE
W/BIO-BASED
RECYCLED WATER
REPORTED (M3)
TOTAL WATER REPORTED (M3)
DIVERTED WASTE
REPORTED (METRIC
TONNES)
% WASTE
DIVERTED FROM LANDFILL
Advanced Agrilytics 0.1980 2,012 394
AgBiTech 0.1339 5,167 1,560 116 47.34%
0.0204 13,242 9,931 6 21.97%
0.0540 800 126,060 0.635% 922 972 11.09%
0.1512 3,069 21 365 62.50%
0.0013 63 431
Prima Wawona 0.0758 3,113 77,097 4.038% 94,475,958 865 94.96%
ScanBio 0.2172 31,987 89,041 35.924% 76,619 434 100.00%
SNFL 0.0033 360 365
Spearhead 0.6252 102,131 238,425 42.835% 11,123 5,659,325 1,153 63.24%
Verdesian 0.0943 51,048 11,418
Verisem 0.0227 5 7,745 0.070% 79 2,026 599 11.08%
TOTAL 0.1400 138,037 613,331 22.5% 11,202 100,238,971 4,508 23.1%
Material Social KPIs for the Paine Schwartz Portfolio
TOTAL RECORDABLE INCIDENT RATE (TRIR)1
Measure of occupational safety and health, useful for comparing working conditions in workplaces and industries. It is calculated by combining the actual number of safety incidents and total work hours of all employees with a standard employee group. Under OSHA's recordkeeping requirements, COVID-19 is a recordable illness, and thus employers are responsible for recording cases of COVID-19. As such, we assume for portfolio companies based in the US that TRIR reflects COVID-19 cases among employees.
WOMEN SHARE OF TOTAL WORKFORCE (%) Percentage of full-time women employees across all portfolio company workforces.
WOMEN IN MANAGEMENT POSITIONS (as % of total management workforce)
Percentage of women in leadership positions across all portfolio company management teams.
RACIAL/ETHNIC DIVERSITYFor operations in the US, the percentage breakdown of full-time workforce in the following categories (Asian; Black; Latino; Native American; Native Hawaiian or Other Pacific Islander; Two or more races; White).
RACIAL/ETHNIC DIVERSITY BY GENDERFor all companies (incl. operations outside of the US) percentage breakdown of the following (White Women; Women of Color; White Men; Men of Color; Not Disclosed) incl. operations outside of the US unless otherwise specified.
FINANCIAL CONTRIBUTIONS ($) TO CHARITABLE ACTIVITIES AND/OR COMMUNITY ORGANIZATIONS
Collective amount of financial contributions to philanthropic causes, all measured in U.S. dollars.
P O R T F O L I O R E P O R T I N G
Similar to our journey with baselining and then expanding upon collection of environmental data, Paine Schwartz is seeking to enhance the information we receive from our companies on social considerations. In the agriculture sector overall, the presence of women farmers continues to expand, and we are seeing an uptick in minority representation. However, the industry remains challenged overall to deliver racial and gender equality, and we are committed to diminishing these challenges throughout our portfolio.
SELECT SOCIAL KPIS MEASURED IN 2020
EXITED
2
ONGOING SAFETY FOCUS
8 of 10 portfolio companies have a TRIR below relevant industry averages 5 below 2019 Occupational Safety and Health Administration
(OSHA) TRIR averages for their respective industries
1. For the purpose of this report, GHG equals CO2e. 2. Given the timing of data collection for this report, Verdesian (exited February 2021) has data to share as part of our portfolio-wide reporting, while FoodChain ID (exited December 2020) does not.
1. TRIR does not include companies with sole operations in the EU because they do not track safety incidents the same way.
14 15PAINE SCHWARTZ PARTNERS ANNUAL SUSTAINABILITY REPORT 2021
People and Planet Focus through COVID-19
PA N D E M I C R E S P O N S E
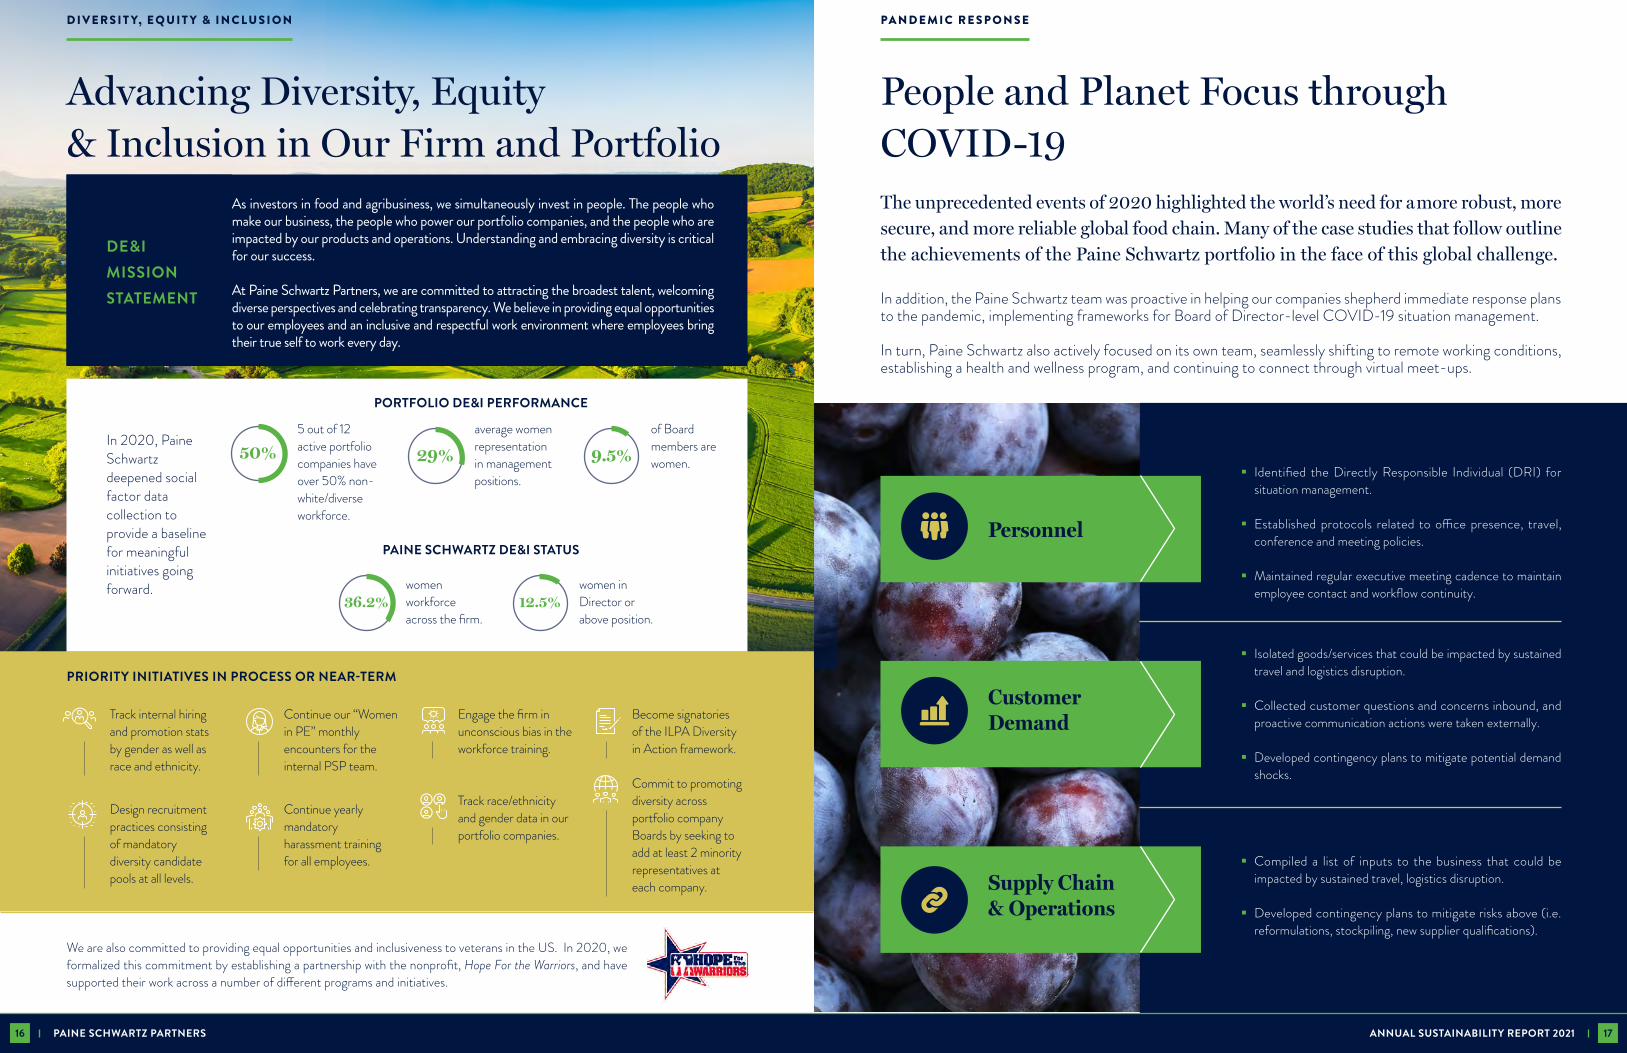
� Identified the Directly Responsible Individual (DRI) for situation management.
� Established protocols related to office presence, travel, conference and meeting policies.
� Maintained regular executive meeting cadence to maintain employee contact and workflow continuity.
Personnel
� Isolated goods/services that could be impacted by sustained travel and logistics disruption.
� Collected customer questions and concerns inbound, and proactive communication actions were taken externally.
� Developed contingency plans to mitigate potential demand shocks.
Customer Demand
� Compiled a list of inputs to the business that could be impacted by sustained travel, logistics disruption.
� Developed contingency plans to mitigate risks above (i.e. reformulations, stockpiling, new supplier qualifications).
Supply Chain & Operations
The unprecedented events of 2020 highlighted the world’s need for amore robust, more secure, and more reliable global food chain. Many of the case studies that follow outline the achievements of the Paine Schwartz portfolio in the face of this global challenge.
In addition, the Paine Schwartz team was proactive in helping our companies shepherd immediate response plans to the pandemic, implementing frameworks for Board of Director-level COVID-19 situation management.
In turn, Paine Schwartz also actively focused on its own team, seamlessly shifting to remote working conditions, establishing a health and wellness program, and continuing to connect through virtual meet-ups.
Advancing Diversity, Equity & Inclusion in Our Firm and Portfolio
D I V E R S I T Y, E Q U I T Y & I N C L U S I O N
In 2020, Paine Schwartz deepened social factor data collection to provide a baseline for meaningful initiatives going forward.
Track internal hiring and promotion stats by gender as well as race and ethnicity.
Design recruitment practices consisting of mandatory diversity candidate pools at all levels.
Continue our “Women in PE” monthly encounters for the internal PSP team.
Continue yearly mandatory harassment training for all employees.
Engage the firm in unconscious bias in the workforce training.
Track race/ethnicity and gender data in our portfolio companies.
Become signatories of the ILPA Diversity in Action framework.
Commit to promoting diversity across portfolio company Boards by seeking to add at least 2 minority representatives at each company.
We are also committed to providing equal opportunities and inclusiveness to veterans in the US. In 2020, we formalized this commitment by establishing a partnership with the nonprofit, Hope For the Warriors, and have supported their work across a number of different programs and initiatives.
As investors in food and agribusiness, we simultaneously invest in people. The people who make our business, the people who power our portfolio companies, and the people who are impacted by our products and operations. Understanding and embracing diversity is critical for our success.
At Paine Schwartz Partners, we are committed to attracting the broadest talent, welcoming diverse perspectives and celebrating transparency. We believe in providing equal opportunities to our employees and an inclusive and respectful work environment where employees bring their true self to work every day.
DE&I MISSION STATEMENT
PORTFOLIO DE&I PERFORMANCE
5 out of 12 active portfolio companies have over 50% non-white/diverse workforce.
average women representation in management positions.
of Board members are women.
PAINE SCHWARTZ DE&I STATUS
PRIORITY INITIATIVES IN PROCESS OR NEAR-TERM
50% 29% 9.5%
women workforce across the firm.
women in Director or above position.
36.2% 12.5%
16 17PAINE SCHWARTZ PARTNERS ANNUAL SUSTAINABILITY REPORT 2021
The Paine Schwartz Portfolio02

20 21PAINE SCHWARTZ PARTNERS ANNUAL SUSTAINABILITY REPORT 2021
Individual Portfolio Case Studies
T H E PA I N E S C H WA R T Z P O R T F O L I O
Individual Portfolio Case Studies
T H E PA I N E S C H WA R T Z P O R T F O L I O
42
F U N D I I I
44 45
E X I T E D
Kynetec and Sterilex are portfolio investments that closed in March 2021 and April 2021, respectively. As such, these companies did not participate in the annual data collection process for this report, and are excluded from this case studies section.
26 28
F U N D V
22 24
Case studies presented herein are for illustrative purposes only, have been selected in order to provide examples of the types of investments made by Paine Schwartz Partners, and do not purport to be a
complete list thereof. It should not be assumed that investments made in the future will be comparable in quality or performance to the investments described herein.
30
34
36
40
38
35
32
F U N D I V

Business SnapshotAdvanced Agrilytics partners with growers to improve sustainability by implementing comprehensive agronomic and digital farming practices that maximize crop yields and profitability while using environmentally sound practices. This approach is enabled by precision data and spatial models to guide optimized, sustainable crop inputs and nutrient application, enhancing both short- and long-term agricultural output throughout the season. The company’s blend of technology, data and personal agronomists have producers looking at their fields in new ways, evaluating potential barriers to yield success and environmental hazards with precise data.
Management Framework and PracticesSafety
In 2020, Advanced Agrilytics focused on enhancing the safety and efficiency of its operations. At the Huntington research facility, an eye washing station and shower were installed, chemical and pesticide storage areas were reconfigured to mitigate hazardous handling risks, and exterior security lights were replaced with brighter alternatives.
Additionally, the company furthered driving safety best practices by implementing a Safety Lead for motor vehicle and personal safety, and requiring all motor vehicles to include fire extinguishers, road emergency and first aid kits. Moving forward, the company plans to integrate Environmental, Health & Safety training, including foun-dational safety practices, in its new hire onboarding process.
Satisfaction
Last year, the company conducted an employee opinion survey to further engagement and solicit general feedback. Based on the results, Advanced Agrilytics’ employees are highly motivated and expressed interest in having more in-person training opportunities. In response, a dedicated Training Leader was hired in November 2020 who is working with the leadership team and people managers to implement a comprehensive strategy to foster a continuous learning environment at Advanced Agrilytics.
ADDING GREATER PRECISION TO CROP SCIENCE APPLICATION
Using a sub-field, hex-grid approach, and factoring in soil sampling and water availability, Advanced Agrilytics provides variable rate seed, phosphorus, potassium, and nitrogen recommendations that position growers' fields for efficient, sustainable nutrient use. Environmental benefits include reducing excess applications as well as nutrient imbalances, weed escapes, insect damage, and poor water quality and soil health.
ECONOMICAL AND SUSTAINABLE NITROGEN USE
These practices resulted in a Total Recordable Incident Rate (“TRIR”) of 0.0 in 2020.
K E Y P S P F O C U S
Zero Hunger #2
Life on Land #15ADVANCED AGRILYTICS
0.95UNITS OF NITROGEN / BUSHEL OF CORN
N
N N N N
N N N N
N
INDUSTRY AVERAGE
1.2UNITS OF NITROGEN / BUSHEL OF CORN
N N N N
N N N N
N N N N
Clean Water and Sanitation #6
22 23PAINE SCHWARTZ PARTNERS ANNUAL SUSTAINABILITY REPORT 2021
Advanced Agrilytics
F U N D V
Environmental Impact Performance
2019 2020 YOY ChangeGHG (Metric Tons)Biogenic CO2 0 0 0%Scope 1 CO2e 30 446 1,387%Scope 2 CO2e (Location-Based) 33 66 100%
TOTAL SCOPE 1 AND 2 63 512 713%ENERGY (MWh)Purchased Electricity 58 85 47%Mobile Fuel Energy 26 1.760 6,669%Natural Gas Heating Energy 0 114 N/A
Other Fuel Energy 51 54 6%TOTAL* 135 2,012 1,390%WASTE (Metric Tons)Landfilled* 33 33 0%Recycled 0 0 0%Composted 0 0 0%Incinerated 0 0 0%TOTAL 33 33 0%WATER (m3)Recycled Water Usage 0 0 0%Total Water Usage 379 394 4%% of Water from Recycled Sources 0% 0% 0%
* Energy totals may not be exact due to rounding.* 2020 waste generation could not be measured and Advanced Agrilytics indicated estimating the same office waste as in 2019.
ENVIRONMENTAL IMPACT NOTES
Advanced Agrilytics’ footprint increased in 2020, mirroring company growth. The number of employees tripled, and the organization expanded geographical operations into 5 additional states. Additionally, the company fleet nearly tripled, leading to the significant increase in mobile fuel consumption and Scope 1 emissions. In addition, Advanced Agrilytics expanded reporting to include the company headquarters, contributing to KPI increase.
Looking Ahead to 2021Advanced Agrilytics plans to review risk management processes, integrating climate change considerations to bolster business resilience. The company will seek to expand community and employee engagement by publishing an employee handbook, establishing a Diversity, Equity & Inclusion policy, implementing formal ESG reporting mechanisms, and further supporting community outreach efforts focused on STEM and agriculture education.
In addition, Advanced Agrilytics plans to develop a mentorship program for field agronomists and data scientists, and conduct technical training sessions for its precision agronomists.

K E Y P S P F O C U S
Business SnapshotAgroFresh delivers shelf-life extension and produce freshness solutions to growers, packers, and retailers in approximately 50 countries worldwide. The utilization of near- and post-harvest technologies boosts fruit and vegetable freshness and quality, preventing food loss and waste across the supply chain. AgroFresh has more than 3,500 direct customers and 500+ patents across a wide-ranging portfolio.
Management Framework and Practices
AgroFresh maintains a Supplier Code of Conduct and administers QuEHST audits to key contract manufacturers, covering quality, safety, environmental, and site management. The company’s main internal manufacturing facility in Valencia, Spain has ISO 140001 and 90001 certifications.
In addition, AgroFresh has instituted policies including a Quality and Environment policy, a Health & Safety policy, and a Whistleblower Policy. The company offers training programs for employees and seeks to engage members of the organization by holding CEO town hall meetings. AgroFresh conducts a biannual Global Employee Opinion Survey, which is used by the Senior Leadership Team and functional leaders to understand the pulse of the company and to take action as required.
EXAMPLE: AGROFRESH’S REDUCTION OF APPLE WASTE2002-2018
SPOTLIGHT ON DIVERSITY
Zero Hunger #2
Responsible Consumption & Production #12
34%OF AGROFRESH’S GLOBAL MANAGERS ARE WOMEN.
In the U.S., Hispanics and Latinos represent:
Managers Operating teaMs
17% 73%
10,342,000TONS OF CARBON DIOXIDE AVOIDED
through more efficient supply chains for AgroFresh’s apple clients.
259,500 TONS OF APPLE LOSS AVOIDED
through the SmartFresh™ solution represent-ing a 31-39% reduction in waste from packers in the US and 23% in France and Italy.
31-39% 23%
US France and Italy
Looking Ahead to 2021
In 2021, AgroFresh plans to publish a formal ESG report and launch a Diversity, Equity, & Inclusion policy across the company.
Food waste is a global crisis, with approximately one-third of all food produced either spoiling or being thrown away before consumption. AgroFresh is leading innovation in post-harvest waste reduction technology, with applications across various crop categories including apples, citrus, and avocados.
24 25PAINE SCHWARTZ PARTNERS ANNUAL SUSTAINABILITY REPORT 2021
AgroFresh
F U N D V
Environmental Impact Performance
2020 % of TotalGHG (Metric Tons)Biogenic CO2 0 0%Scope 1 CO2e 1,619 50%Scope 2 CO2e (Location-Based) 1,600 50%TOTAL SCOPE 1 AND 2 3,219 100%ENERGY (MWh)Purchased Electricity 1,381 10%Mobile Fuel Energy 6,669 50%Natural Gas Heating Energy 249 2%Other Fuel Energy 18 0%Purchased Steam/Heat Energy 4,926 37%TOTAL* 13,242 100%WASTE (Metric Tons)Landfilled 20 78%Recycled 6 21%Composted 0 0%Incinerated ~0 1%TOTAL 26 100%WATER (m3)Recycled Water Usage 0 0%Total Water Usage 9,931 100%% of Water from Recycled Sources 0% N/A
* Energy totals may not be exact due to rounding.
AgroFresh’s vision and mission align with the UN’s responsible consumption and production goal, which calls for substantially reducing food losses along retail, production and supply chains by 2030.
ENVIRONMENTAL IMPACT NOTES
This is AgroFresh’s first year reporting as part of the Paine Schwartz portfolio. AgroFresh has independently established sustainability initiatives and publishes a sustainability brochure. AgroFresh’s direct footprint is relatively small, with emissions largely driven by mobile fuel usage and purchased steam for heating.

K E Y P S P F O C U S
Business SnapshotSpecial New Fruit Licensing Limited (“SNFL”) is an industry leader in the development, licensing, and marketing of proprietary table grape varieties. The company employs an innovative breeding system, with a state-of-the-art R&D facility in Spain, as well as 15 trial centers around the world. Through partnerships with nearly a thousand licensed growers, SNFL’s operations span 25,000 hectares of agriculture in 17 countries. SNFL also actively commercializes and licenses 16 of its 25 patented grape varieties.
Safety and Engagement
SNFL adapted to the changing global conditions in 2020 by transitioning meetings with growers to virtual platforms and converting their annual stake-holder showcase to a virtual event.
During the breeding season, the company provided multiple minibuses as a means of transportation for workers, with the objective of keeping employees distanced and protecting against potential COVID-19 infection. In addition, new safety measures were enacted related to wearing protective clothing and face coverings.
Zero Hunger #2
Responsible Consumption & Production #12
Looking Ahead to 2021
Moving forward, SNFL plans to further evaluate its processes through the lens of climate change considerations. The company aims to continue the development and evaluation of its first collection of disease resistant varieties, which SNFL hopes will provide a significant advantage to organic production once the varieties become available to the industry.
Environmental Impact Performance
Life on Land #15
2019 2020 YOY ChangeGHG (Metric Tons)
Biogenic CO2 7 0 -100%Scope 1 CO2e 22 67 205%Scope 2 CO2e (Location-Based) 48 23 -52%
TOTAL SCOPE 1 AND 2* 70 90 29%ENERGY (MWh)
Purchased Electricity 173 103 -40%Mobile Fuel Energy 100 236 136%Natural Gas Heating Energy 14 5 -64%
Other Fuel Energy 18 17 -6%TOTAL* 305 360 18%
WASTE (Metric Tons)Landfilled 60 40 -33%Recycled 0 0 0%Composted 0 0 0%Incinerated 0 0 0%TOTAL 40 40 -33%
WATER (m3)Recycled Water Usage 0 0 0%Total Water Usage* 11 365 3,218%% of Water from Recycled Sources 0% 0% 0%
* GHG and energy totals may not be exact due to rounding.* SNFL’s 2019 water consumption confirmed to be correct and the increase in 2020 is due to a water leak, based on 2/1/2021 email correspondence.
ENVIRONMENTAL IMPACT NOTES
SNFL began reporting for a facility in Chile that was not included in 2019. Despite this addition, overall electricity consumption and Scope 2 emissions decreased due to office closures from COVID-19 and the cold storage unit not being operational at the US facility. Additional company vehicles led to an increase in mobile fuel use and subsequent Scope 1 emissions, outweighing a reduction in electricity and natural gas use. Fertilizer use also increased in 2020 as SNFL added new fertilizers while improving their nutrition program. Water use increased significantly because of a water leak at the Spain facility that has subsequently been repaired.
26 27PAINE SCHWARTZ PARTNERS ANNUAL SUSTAINABILITY REPORT 2021
SNFL
F U N D V

K E Y P S P F O C U S
Business SnapshotUrban Farmer promotes the use of simple, healthy ingredients to develop gluten-free pizzas, toppings, crusts, breads, and other specialty products that are mostly vegetable based and paleo-friendly. The company’s products are USDA Certified and designed in two Safe Quality Food (SQF) certified facilities in Manteno, Illinois.
Health and Safety
In 2020, Urban Farmer issued a formalized COVID-19 Exposure Control Plan1 to ensure a safe and healthy working environment for essential company workers. Social distancing and personal protective equipment requirements were implemented, as well as exposure prevention training sessions. The company mandated entry screenings and partnered with a local hospital to provide free COVID-19 testing for all personnel.
Throughout the pandemic, Urban Farmer provided educational resources and meetings for staff and hired a third-party safety consultant to audit the busi-ness. As of February 2021, Urban Farmer hosted two COVID-19 vaccination clinics at its facilities.
The company incorporates topics of inclusion and fairness into its overarching mission statement as well as operational practices. Urban Farmer provides facility signage in three languages to encompass the full scope of preferred languages used by employees.
SPOTLIGHT ON DIVERSITY
Community Engagement
Urban Farmer actively seeks to support and engage with the local community. Members of senior management reside on the board of numerous local organizations, including the United Way of Kankakee and Iroquois Counties, Harbor House Domestic Violence Shelter, and Kankakee Community College Foundation. In addition, Urban Farmer collaborates with and donates to the Illinois Veterans Home, Tuba City Healthcare Workers, and Breadbasket Food Pantry, among others.
Decent Work and Economic Growth #8
Looking Ahead to 2021Urban Farmer is looking forward to developing more sustain-ability-focused programs on topics such as energy efficiency.
48%
43%
61.3%
wOMen cOMpOsitiOn Of executive ManageMent
LatinO-, african-, and asian-identifying persOnneL Of OveraLL wOrkfOrce
wOMen cOMpOsitiOn Of wOrkfOrce
Zero Hunger #2
Reduced Inequalities #10
28 29PAINE SCHWARTZ PARTNERS ANNUAL SUSTAINABILITY REPORT 2021
Urban Farmer
F U N D V
As a new addition to the Paine
Schwartz portfolio as of December
2020, Urban Farmer does not yet have
environmental data to report.
1 This program was implemented prior to Paine Schwartz Partners’ ownership of Urban Farmer.

The replicated virus, which is benign to beneficial species, persists for several weeks. Crops are protected from harmful caterpillars, resulting in reduced crop damage, hence remaining healthier for longer. Due to the highly concentrated formula, farmers are able to use less product, packaging, and storage space, decreasing overall waste and runoff.
LASTING RESULTS
SPREAD
Post liquification of the previously infected larvae, the virus-laden fluid spreads throughout the crop, providing ongoing control of future infestations. K E Y P S P F O C U S
Business SnapshotAgBiTech is a global leader in crop protection technology, providing alternatives to artificial pest control methods. The company utilizes natural insect pathogens to develop pest control products that are safe for humans, plants, animals, and insects that support the ecosystem.
At a state-of-the-art facility in Texas, AgBiTech harvests entomopathogens from caterpillars, combining them with glycerol and water to help avoid soil and groundwater degradation in subsequent agricultural applications.
Community and Team Engagement
AgBiTech continues to fos-ter engagement at both the company level and with its broader community. In 2020, AgBiTech increased its finan-cial contributions to charities and collectively donated $80,700 to universities. When safe, the company plans to reinstate engagement opportunities in the US, as well as team-building excursions in Brazil.
When harmful caterpillar pests ingest the bioinsecticide applied to crops, the virus then spreads throughout the gut of the infected larvae. This causes the virus to amplify, leading to eventual rupture and liquification of the insect.
INFECTION
Resistance Management
AgBiTech’s two main products, Heligen and Fawligen, allow customers to prevent crop loss while championing regenerative agricultural practices.
Traditional Pesticide
FRO
M L
AB
TO C
RO
PS, S
AFE
LY A
ND
SU
STA
INA
BLY
AgBiTech Product
ABT
Safe for people, animals, and the environment
No impact on beneficial species
Season long control
Low application rates and reduced storage requirements
Can be applied by ground, air, or chemigation
No need to delay application if rain is expected
$80,700TO UNIVERSITIES
SPOTLIGHT ON DIVERSITY
Zero Hunger #2
Looking Ahead to 2021AgBiTech plans to develop a supplier code of conduct to improve supply chain oversight of caterpillar trays and product bottles.
Environmental Impact Performance
Following positive results in Phase I, AgBiTech began Phase II of the trials in 2020. With enhanced digital and translation practices, the FAO successfully reached over 1,100 farmers (29% women) who saw significant drops in FAW infestation after the third spray with Fawligen. AgBiTech plans to continue this work in 2021.
Life on Land #15
Partnership for the Goals #17
2019 2020 YOY ChangeGHG (Metric Tons)
Biogenic CO2 0 0 0%Scope 1 CO2e 955 782 -18%Scope 2 CO2e (Location-Based) 795 798 0.40%
TOTAL SCOPE 1 AND 2 1,750 1,580 -10%ENERGY (MWh)
Purchased Electricity 1,454 1,632 12%Mobile Fuel Energy* 3,921 3,203 -18%Natural Gas Heating Energy 266 327 23%
Other Fuel Energy 6 6 0%TOTAL* 5,647 5,167 -9%
WASTE (Metric Tons)Landfilled 97 129 33%Recycled 87* 116 33%Composted 0 0 0%Incinerated 0 0 0%TOTAL 184 245 33%
WATER (m3)Recycled Water Usage 0 0 0%Total Water Usage 1,984 1,560 -21%% of Water from Recycled Sources 0% 0% 0%
* AgBiTech 2019 propane use for mobile energy has been updated. GHG and energy numbers are restated.* Energy totals may not be exact due to rounding.* 2019 recycling is restated based on reported 2020 data. Email correspondence on 2/2/2021 stated that 2019 waste data could not be verified and it is possible that recycling was originally under-reported.
Continued growth in Africa and Asia allowed AgBiTech to save approximately
5,500,000ACRES OF CROPLAND FROM TRADITIONAL CHEMICAL PESTICIDES
compared to
2,284,800
AgBiTech continues to collaborate with the United Nations Food and Agriculture Organization (FAO) and USAID Food Security on product trials in South Sudan that align with Zero Hunger SDG targets. The South Sudan project aims to control Fall Armyworm (“FAW”) overabundance without depleting agricultural soils of nutrients and beneficial life.
ENVIRONMENTAL IMPACT NOTES
Relative to 2019, Scope 1 emissions dropped slightly, driven by a decline in gasoline usage due to COVID-19 travel restrictions. Overall water usage also declined. Waste generation increased more than two-fold, driven by a rise in reported recycling, and the amount of waste diverted from the landfill declined.
50%
AgBiTech continues to promote equal opportunity practices with women comprising
of company management.
2019
2020
30 31PAINE SCHWARTZ PARTNERS ANNUAL SUSTAINABILITY REPORT 2021
AgBiTech
F U N D I V

K E Y P S P F O C U S
Business SnapshotLyons Magnus (“Lyons”) is a market leader in the design and commercialization of innovative beverage and ingredient solutions for international foodservice, healthcare, and food manufacturing clients. With products ranging from designer dessert sauces to plant-based protein shakes, Lyons elevates the taste buds while supporting sustainable practices.
Supply Chain Responsibility
Lyons Magnus continues to integrate raw materials and supplies from local vendors into its supply chain. With robust oversight, all vendors are required to input a Code of Conduct into an online tracker. The company also incorporates sustainability considerations into supplier questionnaires. Company affiliated brokers audit and verify documentation related to overseas vendors.
During the COVID-19 pandemic, Lyons mitigated supply chain risk by overinvesting in higher-risk, sole-source raw materials and built inventory through alternative sourcing.
Community Engagement
Lyons Magnus actively seeks to find ways to engage with the local community. In early 2020, the company held a blood drive and charity golf tournament and donated food to a wealth of organizations, including Clovis Elk Lodge, Fresno Food Bank, Girl Scouts of Central California South, Food Share of Ventura County, Harvest Roasting, Poverello House, The Center in Hollywood, Ronald McDonald House Charities of Central Valley Inc., and Fresno City College.
Employee Focus
Lyons Magnus focused on further investing in employees by expanding educational opportunities through the establishment of Lyons Leader University Program (“LLU”). The LLU offers opportunities including executive mentoring, peer coaching, and special projects surrounding communication, sustainability, and DE&I.
In early March 2020, the company launched a Coronavirus Task Force, establishing a strategy of four main pillars: Safety and Care (Taking care of our employees and community), Continuity (Taking care of customers and partners), Financial (Taking care of our company), and Communication (Inform and Involve).
The company also updated its Injury and Illness Prevention Program, developed a COVID-19 Prevention Program aligned with California OSHA guidelines, and required face coverings and temperature checks at all sites. Additionally, facility-manufactured hand sanitizer and face makes were distributed to all employees and customers (Healthcare).
Lyons Magnus maintains nearly
40 productswith a sustainability-related certification, representing approximately
Environmental Impact Performance
2019 2020 YOY ChangeGHG (Metric Tons)
Biogenic CO2 0 0 0%Scope 1 CO2e 15,613 15,319 -2%Scope 2 CO2e (Location-Based) 12,973 15,479 19%
TOTAL SCOPE 1 AND 2 28,586 30,798 8%ENERGY (MWh)
Renewable Electricity Consumed 850 800 -6%
Purchased Electricity 26,605 41,575 56%Mobile Fuel Energy 3,871 3,809 -2%Natural Gas Heating Energy 81,539 79,876 -2%
Other Fuel Energy 0 0 0%TOTAL 112,865 126,060 12%
WASTE (Metric Tons)Landfilled 6,800 7,790 15%Recycled 1,900 972 -49%Composted 0 0 0%Incinerated 0 0 0%TOTAL 8,700 8,762 1%
WATER (m3)Recycled Water Usage 77 0 -100%Total Water Usage 942 922 -2%% of Water from Recycled Sources 8% 0% -100%
Zero Hunger #2
Decent Work and Economic Growth #8
Responsible Consumption and Production #12
Looking Ahead to 2021The company plans to expand the Lyons Leader University Program in 2021 to include individuals from Paine Schwartz Partners, the Board, and outside experts. The company will also work to build a more robust approach to Diversity, Equity, & Inclusion.
ENVIRONMENTAL IMPACT NOTES
Overall, Lyons Magnus’ environmental data remained relatively stable in 2020 compared to 2019. The one exception was electricity use, which increased ~15,000 MWh, driven by the shutdown of the cogeneration plant at the Lyons Magnus West facility, subsequently contributing to the increase in Scope 2 emissions. Lyons Magnus continues to generate on-site solar at this facility.
$777, 000in revenue in 2020.
Lyons Magnus continues to progress its longstanding recycling initiative aimed at efficiently reducing company waste.
Following an April 2019 acquisition, Lyons Magnus began incorporating TRU Aseptics, a business developing shelf-stable innovation for retail, restaurant, and food use, into its operations in 2020. Through TRU Aseptics, Lyons aims to expand its business focus into low-acid aseptic products that reduce food waste via longer shelf-lives and conserve energy by forgoing refrigeration.
⭡ ~25% increase from 2019
90%PACKAGING IS RECYCLABLE
~
Approximately 90% of product packaging is made from recycled or recyclable materials.
In 2020, a focus on drum and pail recycling helped in part to reduce annual landfill charges by
$421,358
INNOVATIVE, SUSTAINABLE PRODUCTS
RECYCLING INITIATIVE
32 33PAINE SCHWARTZ PARTNERS ANNUAL SUSTAINABILITY REPORT 2021
Lyons Magnus
F U N D I V

Key HighlightsIn 2020, MS Biotec rolled out the product transition to Lactipro NXT and FLX which feature a shelf life of approximately 12 months compared to prior iterations that stored up to only 14 days. By extending the expiration date, the company expects to see significant reductions in waste volume come 2021.
Business SnapshotMS Biotec is a commercial developer of the bacteria Megasphaera elsdenii (“Mega e”), a natural probiotic that supports digestive health and facilitates the transition from a roughage-based diet to a high-grain diet in feedlot cattle and dairy cows. MS Biotec uniquely offers livestock producers science-based, natural solutions to animal health and productivity challenges.
A GROWING BUSINESS
Environmental Impact Performance Environmental Impact Performance
2019 2020 YOY Change
GHG (Metric Tons)
Biogenic CO2 0 0 0%
Scope 1 CO2e 479 490 2%
Scope 2 CO2e (Location-Based) 470 581 24%
TOTAL SCOPE 1 AND 2 949 1,071 13%
ENERGY (MWh)
Purchased Electricity 729 1,089 49%
Mobile Fuel Energy 858 513 -40%
Natural Gas Heating Energy 1,489 1,458 -2%
Other Fuel Energy 10 10 0%
TOTAL* 3,086 3,069 -1%
WASTE (Metric Tons)
Landfilled 263 219 -17%
Recycled 439 365 -17%
Composted 0 0 0%
Incinerated 0 0 0%
TOTAL 702 584 -17%
WATER (m3)
Recycled Water Usage 0 0 0%
Total Water Usage* 17 21 24%
% of Water from Recycled Sources 0% 0% 0%
* MS Biotec 2019 water consumption has been updated. Numbers are restated. * Energy totals may not be exact due to rounding.
2019 2020 YOY Change
GHG (Metric Tons)
Biogenic CO2 0 0 0%
Scope 1 CO2e 0 0 0%
Scope 2 CO2e (Location-Based) 40 32 0%
TOTAL SCOPE 1 AND 2 40 32 -10%
ENERGY (MWh)
Purchased Electricity 69 61 -12%
Mobile Fuel Energy 0 0 0%
Natural Gas Heating Energy 2 2 0%
Other Fuel Energy 0 0 0%
TOTAL 72 63 -13%
WASTE (Metric Tons)
Landfilled* 281 247 -12%
Recycled 0 0 0%
Composted 0 0 0%
Incinerated 0 0 0%
TOTAL 281 247 -12%
WATER (m3)
Recycled Water Usage 0 0 0%
Total Water Usage 546 431 -21%
% of Water from Recycled Sources 0% 0% 0%
* Multimin 2019waste generation has been updated. Numbers are restated.
K E Y P S P F O C U S
Zero Hunger #2
Good Health and Well-Being #3K E Y P S P F O C U S
Zero Hunger #2
Responsible Consumption and Production #12
Looking Ahead to 2021
MS Biotec plans to continue sourcing certain office essentials from sustainable vendors, such as bulk cleaning products and biodegradable bamboo-based toilet paper. Led by Human Resources, employees also plan to implement more environmentally friendly vendor alternatives.
Looking Ahead to 2021
Multimin plans to develop a formal policy around Enterprise Risk Management that incorporates ESG risks. Partnership
for the Goals #17
In 2020, nearly
of Multimin®90 were administered to cattle, a 1 million increase from 2019.
Company-Wide InitiativesMultimin continues to support local organizations, with a collective $19,200 raised for non-profits including the Working Ranch Cowboys Association Foundation, Academy of Veterinary Consultants, and the Oklahoma Cattlemen’s Association.
Additionally, the company strives to uphold gender representation across its operations with 45% of all employees being women.
Multimin’s environmental footprint changed minimally in 2020. Energy use, emissions, water consumption and waste generation were down slightly, reflecting office closures in response to the COVID-19 pandemic.
A GROWING BUSINESS
Business SnapshotMultimin is the world’s first and only marketer of Multimin® 90, an injectable prescription patented supplement providing zinc, copper, selenium, and manganese to support immunity, vaccine response, and reproductive efficiencies in cattle.
ENVIRONMENTAL IMPACT NOTES
An increase in production equipment in 2020 led to a growth in electricity use and subsequent Scope 2 emissions, while mobile fuel consumption, Scope 1 emissions, and waste generation decreased due to COVID-19. Refrigerant emissions increased due to installation and validation of new equipment (MS Biotec does not anticipate this being an ongoing issue). Therefore, while energy usage remained relatively constant, total emissions increased.
Management Framework and PracticesBuilding off of systems established in prior years, MS Biotec bolstered supply chain redundancies and improved safety frameworks across operations in 2020. Early in the COVID-19 pandemic, the company sourced back-up vendors and established reserves of key material inputs to prevent disruptions.
Under the guidance of its Director of Human Resources and Safety, MS Biotec also instituted safety precautions to protect employees. New measures were implemented, including temporary work-from-home requirements for non-production employees, physical distancing, daily surface cleaning in public areas, and isolating departments in separate rooms.
MS Biotec administered health-boosting products to
2.6 Mhead of cattle in 2020
1.8 Mhead of cattle in 2019 13 million
doses
34 35PAINE SCHWARTZ PARTNERS ANNUAL SUSTAINABILITY REPORT 2021
MS Biotec Multimin
F U N D I V F U N D I V
ANIMAL HEALTH
& NUTRITION
ANIMAL HEALTH
& NUTRITION

Environmental Impact Performance
2019 2020 YOY ChangeGHG (Metric Tons)
Biogenic CO2 0 0 0%Scope 1 CO2e* 14,380 13,257 -8%Scope 2 CO2e (Location-Based) 8,485 8,692 2%
TOTAL SCOPE 1 AND 2 22,864 21,949 -4%ENERGY (MWh)
Renewable Electricity Consumed 3,505 3,113 -6%
Purchased Electricity 35,301 38,436 9%Mobile Fuel Energy 39,101 35,547 -9%Natural Gas Heating Energy* 0 0 0%TOTAL* 77,707 77,097 -1%
WASTE (Metric Tons)Landfilled 51 46 -10%Recycled 496 846 71%Composted 0 19 N/AIncinerated 0 0 0%TOTAL 547 911 67%
WATER (m3)Recycled Water Usage 0 0 0%Total Water Usage 98,449,697 94,475,958 -4%% of Water from Recycled Sources 0% 0% 0%
* Energy totals may not be exact due to rounding.* Prima® Wawona's 2019 Scope 1 emissions are restated due to a divestment. In 2019, a large portion of fertilizer and total Scope emissions were associated with fertilizer application on citrus acreage that is no longer owned by Prima® Wawona (confirmed via email on 3/11/21). According to Appendix E of the GHG Protocol, in order to main-tain consistency between data sets, base year emissions need to be recalculated when structural changes occur in the company that change the inventory boundary (such as acquisitions or divestments). Therefore, the 2019 base year is recalculated to remove the emissions associated with this land and fertilizer that is no longer owned. * Prima® Wawona's natural gas consumption for 2019 has been changed based on 2019 and 2020 updated utility information provided via email on 2/10/21.
K E Y P S P F O C U S
Zero Hunger #2
Responsible Consumption & Production #12
Life on Land #15
Business SnapshotPrima® Wawona is a leading US producer of quality organic and conventional peaches, plums, nectarines, and apricots based in California’s Central Valley. The company fosters operational excellence across its value chain and implements industry-leading labor practices, proprietary genetics, and sustainable farming innovations to supply consumers with a dependable and delicious stone fruit experience.
Looking Ahead to 2021Moving forward, Prima® Wawona plans to focus its efforts on further reducing traditional pesticides usage, as well as increasing its water conservation efforts by implementing drip irrigation in its orchard redevelopment plans. In the packhouse, the team is working diligently to improve utilization and find alternative uses for “culled” fruit that previously ended up in landfills (e.g. animal feed, compost) and shifting away from Wood pallets to Reusable plastic pallets.
ENVIRONMENTAL IMPACT NOTES
Prima® Wawona’s environmental footprint was largely consistent year-over-year.
Overall, waste generated increased year-over-year, driven by growth in recycling. This can be attributed to an increase in roll-off cardboard generated at legacy Wawona sites and increased pallet recycling at the legacy Gerawan sites.
Employee Focus
Prima® Wawona is committed to increasing the presence of women candidates and new hires for traditionally male-dominated positions. The company recently promoted an internal woman employee to Director of Packhouse Operations and brought on an external woman hire as Director of Procurement.
Diversity, equity, and inclusion is also a main area of focus for the company, and, as such, diversity across staff and management positions has improved in recent years. Prima® Wawona spearheads a number of DE&I initiatives, and offers tailored executive coaching for skills development and management training to further cultivate and retain diverse talent. The employee handbook outlines anti-discrimination and harassment policies, and related trainings and communications are conducted as needed.
ESG and Sustainability Initiatives
INTEGRATED PEST MANAGEMENT
In 2020, Prima® Wawona operated 5,626 acres of farmland under the Advanced Integrated Pest Management Program, minimizing pesticide use while controlling agricultural pests. The company continues to practice sustainable management tactics when treating fields, including controlling pests with native insect predators, using weed mats, limiting run-off risk via computer-controlled spray rigs, and planting cover crops.
CERTIFIED ORGANIC
Additionally, the company maintains 1,693 acres of certified organic land under the United States Department of Agriculture (USDA) and California Department of Food and Agriculture (CDFA) standards.
Water Conservation
As a producer of stone fruit, which uses water for growing, Prima® Wawona is committed to improving water conservation efforts. The company aims to implement new drip irrigation across 4,000 redevelopment acres for the first time since the merger with Gerawan in 2019. Prima® Wawona’s longer term strategy includes an incremental upgrade to new drip irrigation across a larger portion of acreage.
Employee Engagement and Safety
Prima® Wawona is committed to engaging with its employees and promoting an active dialogue. Through the use of an internal hotline designated for employee feedback and ideas, human resources and ranch clerks are able to capture and document feedback appropriately, helping management to proactively address any concerns raised. In addition, new opportunities are communicated regularly to employees via announcements to employee pay stubs.
During the COVID-19 pandemic, the company took an active approach and implemented screening protocols, temperature checks, personal protective equipment guidelines, and catwalks to safeguard essential field staff and ensure compliance with safety requirements. Recently, they launched one of the largest vaccination campaigns of California Produce Growers, gaining more than 1,500 participants with a workforce of 60 volunteers.
5,626acres of farmland.
1,693acres of certified organic land under the USDA and CDFA standards.
4,000redevelopment acres.
One of the largest vaccination campaigns of California Produce Growers, gaining more than
1,500participants.
Clean Water and Sanitation #6
36 37PAINE SCHWARTZ PARTNERS ANNUAL SUSTAINABILITY REPORT 2021
Prima® Wawona
F U N D I V

K E Y P S P F O C U S
Business SnapshotSpearhead International (“Spearhead”) is a leading European food and agricultural producer, practicing regenerative agriculture across approximately 90,000 hectares of land. Through sustainable business operations, the company nurtures a diverse array of crops while providing scale, vertical integration and traceability.
FOOD PRODUCTION1 TOTAL REVENUE FROM PRODUCTS2 LABELED AND/OR MARKETED TO PROMOTE HEALTH AND NUTRITION
Key HighlightsBy employing satellite imagery and soil sampling, Spearhead is able to generate variable-rate prescription maps, allowing for efficient targeting of inputs and reduction of waste. In 2020, Spearhead expanded the use of variable-rate application of nitrogen (VRAN), variable-rate seeding, and targeted crop chemical application. While abnormal weather in 2020 limited opportunities to employ these technologies, the system is now well-established and will help reduce fertilizer, crop chemical and diesel usage in the future, while increasing machinery and labour efficiency.
FOCUS ON SUSTAINABILITY
Maintenance and improvement of productive land.
Efficient use of resources.
Economic viability of operations.
Protection of biodiversity.
Minimising impact on the local and wider environment.
Eco-Friendly Products
In the Czech Republic, Spearhead receives green bonuses for production of renewable electricity from their biogas stations (anaerobic digesters). Spearhead sells the resulting electricity to third parties, further generating revenue through renewable energy practices.
Environmental Impact Performance
2019 2020 YOY ChangeGHG (Metric Tons)
Biogenic CO2 17,141 18,144 6%Scope 1 CO2e 161,123 129,882 -19%Scope 2 CO2e (Location-Based) 8,697 8.181 -6%
TOTAL SCOPE 1 AND 2* 169,820 138,063 -19%ENERGY (MWh)
Renewable Electricity Consumed 856 3,196 273%
Purchased Electricity* 16,132 16,219 1%Mobile Fuel Energy 112.674 111,535 -1%Natural Gas Heating Energy 3,242 4,296 33%
Other Fuel Energy* 98,567 103,179 5%TOTAL 231,471 238,425 3%
WASTE (Metric Tons)Landfilled 729 670 -8%Recycled 45 68 51%Composted 1,068 1,064 -0.4%Incinerated 40 21 -48%TOTAL 1,882 1,823 -3%
WATER (m3)Recycled Water Usage 10,800 11,123 3%Total Water Usage 5,626,676 5.659,325 1%% of Water from Recycled Sources ~0% -0% 2%
* GHG totals may not be exact due to rounding.* In email correspondence from 2/11/2021, 2019 electricity use at one site was stated to be a mistaken estimate. 2019 electricity energy and Scope 2 emissions for this location are restat-ed to match reported 2020 values, which are confirmed to be an accurate reflection of usage. * 2019 biogas consumption at one site has been updated. Other fuel energy and biogenic emissions have been restated for this location.* Renewable energy consumed from biogas generators is removed from the Other Fuel Energy total and kept in the Renewable Electricity Consumed total to avoid double counting.
Responsible Consumption & Production #12
Life on Land #15
Partnership for the Goals #17
Aligning with the UN’s target for global food demands, Spearhead’s policy of regenerative agriculture aims to reduce the use of synthetic mineral fertilizers and promote cover crops, variable-rate application, organic fertilizers, and additional methods to sequester more carbon content in soils and increase yield potential.
Spearhead International holds a Global GAP certification across its international arable and livestock operations, and Spearhead farms are accredited by numerous national environmental schemes, with Agrosumak aiming to become the first farm in the Czech Republic to achieve LEAF Marque accreditation. In addition, Spearhead is a member of voluntary and customer-led product assurance schemes including Red Tractor, the Mondelēz International Harmony Charter, and Barrila Carta Del Mulino.
Looking Ahead to 2021
Spearhead plans to continue scaling its advanced regenerative agriculture operations in Europe. Key areas of focus include improving agricultural systems to address and reverse climate change, building soil organic matter, restoring biodiversity, and enhancing the biological vitality of farming landscapes.
1 Includes milling wheat, malting barley, etc. Sugar beet included as pure sugar content, milk included at 1,000l=1t, animal feed excluded.
2 83% Beetroot in the UK, the remainder is naked oats, spelt, etc.
GROWTH IN 2020
618,449 tonnes
547,675 tonnes
2019
2020€ 5.85M € 4.96M
2020 2019
Real-time and historical geospatial data is collected and used to create prescriptive mapping and field zones that enable site-specific treatments.
YIELD MAPS
SOIL SAMPLINGS
LIGHT REFLECTION IMAGING
Rather than treating fields uniformly, precision agriculture enables growers to variably apply seeds, crop chemicals, and fertilizers in a precise and targeted manner that minimizes waste.
GPS-guided machinery creates significant efficiencies and targets applications across the entire process, from cultivating to planting to irrigating.
GPS MACHINERYGUIDANCE
PRECISION FARMING THROUGH INNOVATIVE TECHNOLOGYENVIRONMENTAL IMPACT NOTES
Overall, Spearhead’s environmental data remained relatively stable in 2020 compared to 2019. The one exception was fertilizer use, where emissions declined from ~130,000 MT CO2e2 to ~100,000 MT CO2e, driving the overall Scope 1 emissions reduction. The rationale for this decline is complex and multi-faceted, but generally was due to weather conditions in 2020 which made it so that the company was unable to complete later application cycles of N-based fertilizers. Additionally, Spearhead was unable to drill several thousand hectares of planned winter wheat in the autumn, causing reduced usage.
Elsewhere in the footprint, weather conditions impacted energy use at certain sites, including the Czech Republic, UK, and Slovakia.
Zero Hunger #2
The production from Spearhead operations is covered by sustainable certification schemes (Global GAP; Red Tractor; Harmony Charter, etc.).
47%
⭡ 2% increase from 2019
38 39PAINE SCHWARTZ PARTNERS ANNUAL SUSTAINABILITY REPORT 2021
Spearhead International
F U N D I V

Throughout the COVID-19 pandemic, Verisem sustained workforce diversity across various categories.
Management Framework and Practices
The company maintains ISO 9001 quality management system certification, which was recently updated and received agency approval. Additionally, third-party audits occur periodically to assess pollution levels and waste production at company facilities.
Verisem’s laboratory operations conduct microbiological analysis of seeds using PCR to mitigate food safety risks derived from exposure to contaminants such as salmonella species, listeria monocytogenes or verotoxin producing escherichia coli.
Environmental Impact Performance
2019 2020 YOY ChangeGHG (Metric Tons)
Biogenic CO2 0 0 0%Scope 1 CO2e 508 518 2%Scope 2 CO2e (Location-Based) 1,638 1,628 -1%
TOTAL SCOPE 1 AND 2* 2,146 2,146 0%ENERGY (MWh)
Renewable Electricity Consumed 4 5 23%
Purchased Electricity* 4,455 4,566 2%Mobile Fuel Energy 1,132 803 -29%Natural Gas Heating Energy 1,705 1,897 11%
Other Fuel Energy* 504 475 -6%TOTAL 7,801 7,745 -1%
WASTE (Metric Tons)Landfilled 4,517 4,803 6%Recycled 131 112 -15%Composted 100 487 387%Incinerated 0 0 0%TOTAL 4,718 5,401 14%
WATER (m3)Recycled Water Usage 0 79 N/ATotal Water Usage 2,093 2,026 -3%% of Water from Recycled Sources 0% 4% N/A
* Energy and waste totals may not be exact due to rounding.* Electricity use at the Brotherton facility was estimated for 2020 based on % of total electricity consumption the facility made up in 2019.* Mobile fuel use at the Brotherton and Condor facilities were esti-mated in 2020, using % electricity usage as a proxy for mobile fuel consumption.
Looking Ahead to 2021In 2020, the company began planning an energy certification initiative, which will continue to be designed and is expected to be rolled out in 2021 to improve energy conservation across operations.
Total waste generation, as well as disposal patterns, were the largest change between 2019 and 2020 due to an increase of 700 MT in landfilled waste at the Suba Seeds site given the higher harvest planted this year.
Finally, overall water consumption remained relatively stable in 2020, but the introduction of recycled water at Suba Seeds represented a change year-over-year.
K E Y P S P F O C U S
Zero Hunger #2
Life on Land #15
Affordable and Clean Energy #7
Responsible Consumption & Production #12
Climate Action #13
ENVIRONMENTAL IMPACT NOTES
Overall, Verisem’s emissions and energy metrics were stable year-over-year. Natural gas consumption increased, largely driven by the Suba Seeds facility, as natural gas is used for drying purposes, and the site received more wet seeds to dry in 2020. Additionally, emissions from refrigerant leaks increased year-over-year, as Verisem made a CAPEX investment at the Suba Seeds site in a refrigerant warehouse to ensure better quality for seeds which are more sensitive to hot temperatures.
Two assumptions were made when calculating the 2020 data. First, electricity data was not provided from Verisem for the Brotherton facility. To estimate consumption and associated emissions, it was assumed that Brotherton made up the same proportion of total electricity consumption in 2020 as in 2019.
Second, mobile fuel usage was not provided for either the Brotherton or Condor facility. 2019 mobile fuel data was not disaggregated at a facility level, so previous years’ data could not be utilized to estimate 2020 consumption. Instead, 2020 electricity consumption was used as a proxy for mobile fuel usage, assuming that these two sites made up the same proportion of electricity consumption as they would of mobile fuel consumption.
SPOTLIGHT ON DIVERSITY
women account of full-time employees globally.32% of employees
identify as Latino.59%
of women hold leadership positions. 40%
of individuals with self-reported disabilities of Verisem’s workforce.
6%in t
he
un
ite
d s
tate
s
gLO
ba
LLy
40 41PAINE SCHWARTZ PARTNERS ANNUAL SUSTAINABILITY REPORT 2021
Verisem
F U N D I V
Business SnapshotVerisem produces, processes, and distributes vegetable and legume seeds to a diverse array of end customers worldwide. The company also engages in contracted seed production for over 2,200 seed growers across six continents, enhancing seed supply chain quality and technological efficiency. Verisem maintains processing facilities in Italy, France, and North America.
Eco-Friendly Business
Verisem champions product sustainability with efforts to design seeds that survive in various environments and support supply chain resiliency against climate change impacts. The company also limits the use of glyphosate— an herbicide with known environmental and health exposure risks.
Company operations in France and Italy recently obtained certification required for cleaning organic seeds from contracted growers. In 2020, the business produced approximately 2,412,000 pounds of organic seeds.

K E Y P S P F O C U S
Business SnapshotScanBio is a Norwegian-based company that repurposes marine by-products from sustainable fisheries and sea farming into nutritious animal feed ingredients. By converting waste into valuable products, the company addresses global protein demands using efficient, ocean-friendly methods.
Key Highlights
In 2020, 100% of the heat in ScanBio’s facilities was generated by burning fish oil from operational byproducts, mitigating diesel usage and consequential air pollution.
• If left on the ocean floor, dead or diseased fish risk spreading infectious viruses or bacteria.
• These fish are not permitted to enter the food chain from a regulatory standpoint.
• Historically, only the fillet is kept and the excess parts are discarded.
AS OF YEAR-END 2018, SCANBIO SWITCHED FROM DIESEL TO USING ITS OWN FISH OIL TO HEAT ITS FACILITIES.
• Animal Feed
• Sustainable energy sources for buildings + transportation.
K3 FISH(SALMON OR WHITEFISH)
EXCESS HARVESTEDBY
COLLECTED BY SCANBIO
K2 FISH(DEAD OR DISEASED FISH)
SCANBIO K3Processing Facility
USED IN
USE
D IN
FISH OIL
FISH PROTEIN
SCANBIO K2Processing Facility
BIOENERGY
BIOFUELBIOGAS
TRANSFORMEDINTO
TRANSFORMEDINTO
Standards of Conduct
ScanBio meets or exceeds compliance thresholds with the Global Standard for Responsible Supply Marine Trust and Good Manufacturing Practices Plus (GMP+) for fishmeal production. Through these certifications, ScanBio ensures it sources fish sustainably from regulated fisheries and sea farms.
Health and Safety Initiatives
Following updates to the company Health and Safety Policy in December 2019, ScanBio began implementing revisions in 2020. The company used an external auditor to support the policy revision process in order to establish a strong foundation for health and safety management practices moving forward.
Environmental Impact Performance
2019 2020 YOY ChangeGHG (Metric Tons)
Biogenic CO2 8,103 8,904 10%Scope 1 CO2e 11,592 12,773 10%Scope 2 CO2e (Location-Based) 58 57 -1%
TOTAL SCOPE 1 AND 2* 11,650 12,830 10%ENERGY (MWh)
Renewable Electricity Consumed 0 0 0%
Purchased Electricity* 6,826 6,658 -2%Mobile Fuel Energy 45,789 50,396 10%Natural Gas Heating Energy 0 0 0%
Other Fuel Energy* 29,107 31,987 10%TOTAL 81,722 89,041 9%
WASTE (Metric Tons)Landfilled 0 0 0%Recycled 113 136 20%Composted 239 239 0%Incinerated 60 59 -2%TOTAL 412 434 5%
WATER (m3)Recycled Water Usage 0 0 0%Total Water Usage 75,210 76,619 2%% of Water from Recycled Sources 0 0 0%
* In an email correspondence on 3/9/21, ScanBio confirmed that 2020 waste to compost can be assumed to be the same as was reported in 2019.* ScanBio's Other Fuel Energy is bio-based fish oil, used for heating and steam generation.
Looking Ahead to 2021
In 2020, ScanBio integrated a Quality, Health, Safety, and Environmental (QHSE) Manager into the framework. This year, the company intends to continue to evolve its quality and compliance management framework, and revise its online QHSE management system.
Zero Hunger #2
Affordable and Clean Energy #7
Responsible Consumption & Production #12
Climate Action #13
ENVIRONMENTAL IMPACT NOTES
ScanBio’s environmental footprint increased year-over-year, with a 10% increase in biogenic CO2 and scope 1 emissions from marine vessels and heating.
Electricity and water consumption remained consistent year-over-year. Recycling increased in 2020 due to ScanBio cleaning old steel tanks, which contributed to an increase in the amount of scrap metal sent for recycling.
42 43PAINE SCHWARTZ PARTNERS ANNUAL SUSTAINABILITY REPORT 2021
ScanBio
F U N D I I I

Business SnapshotFoodChain ID is a market-leading platform dedicated to providing the global food industry with technology-enabled food safety, quality, and sustainability solutions. The company’s holistic solutions help to ensure the safety and quality of the entire food supply chain against a backdrop of increasingly complex regulations and heightened consumer requirements, such as safety, transparency, authenticity, health, and sustainability.
Business SnapshotVerdesian Life Sciences helps farmers maximize crop yields with fewer inputs and lower environmental impact through nutrient management and efficiency technologies, seed treatments and inoculants, and crop health chemistry and biologicals.
FOODCHAIN ID ADDRESSES THE NEEDS OF THE NEW FOOD ECONOMY
SUSTAINABLE AND ENVIRONMENTALLY FRIENDLY SOLUTIONS FOR GROWERS
FOOD CHAIN CERTIFICATIONS
During the course of Paine Schwartz’s ownership, FoodChain ID’s accredited certification bodies served clients all across the U.S., U.K., and Brazil, administering a wide range of certifications including:
FULL LIFECYCLE SUSTAINABILITY FOCUS
Since its establishment by Paine Schwartz in 2012, Verdesian has grown into a market leader in Nutrient Use Efficiency by executing on a multi-pronged go-to-market strategy, completing six add-on acquisitions, and developing high quality products. The company expanded geographically, and filed more than 290 patents since 2014.
� In 2018, Verdesian changed manufacturing and warehouse sites to LED lighting to reduce energy consumption, netting a 70% reduction in kWh.
� Focused on efforts to increase diversity in leadership, in line with its Equal Employment Opportunity Policy and Diversity Policy.
� Engaged and educated retailers and growers on nutrient-use efficiency through the company’s proprietary NUE™ University online platform. The program teaches nearly 50 courses, including the agronomy of water salinity, nutrient stewardship in policy economics, fertilizer management, and nitrogen stabilization.
� Established programs to promote customer partnership, including the Verdesian Innovative Partners (VIP) Platform and Customer Engagement and Performance Guarantee Program.
� At exit, Verdesian maintained a 4R certification from The Fertilizer Institute, acknowledging its commitment to sustainable input management.
� Verdesian also maintained a commitment to charitable giving with contributions totaling over $50,000 for local farming alliances. Verdesian employees also provided meals to approximately 400 individuals during the 2019 flooding in Nebraska, as well as $30,000 in funds.
FULL LIFECYCLE SUSTAINABILITY FOCUS
FoodChain ID represented Paine Schwartz’s flagship investment in the fast-growing food safety space in September 2016. Over the course of the investment, the company tripled in size as Paine Schwartz augmented the senior management team, re-prioritized the company’s strategic focus, and facilitated six add-on acquisitions.
� FoodChain ID now boasts a proprietary database that includes more than 100,000 mapped products and ingredients and more than 100,000 regulatory references across 218 countries.
� In addition, the company processes 2.5 million pages of daily global regulatory notifications, scientific opinions and product recalls across 40 languages.
� During Paine Schwartz’s ownership, the company began collecting data on annual water use, energy use and sourcing, and GHG emissions across operations.
� FoodChain ID also championed workplace diversity and inclusion with women accounting for the majority of the workforce and a significant portion of management positions.
The company also significantly expanded its portfolio to include national and international organic and sustainable/ethical certification schemes.
SOIL HEALTH
WATER QUALITY
Maximizing plant nutrient uptake to
reduce fertilizer use and protect the
environment.
Favorable industry and regulatory
trends focused on sustainability will
drive demand.
D Reduce chemical inputs. D Nutrient availability. D Neutral to positive impact
on soil biome.
D Lower fertilizer application rates. D Lower nitrate and phosphate levels. D Reduced leaching and movement
of nutrients through the soil.
D Increased plant biomass. D Reduced carbon footprint. D Less nitrous oxide emission.
CLIMATE
Safety:Proactive solution to identify potential contamination-related illnesses in the food supply.
Transparency:Software to trade individual supply chains and specific ingredients to meet consumer demands for visibility.
Authenticity:DNA extraction through proprietary technology to combat fraudulent food labelling.
Healthy & Fresh:Globally recognized certification for organic foods.
Sustainability:Certification system based on sustainable production standards.
QUALITY AND SAFETY
GOOD AGRICULTURAL
PRACTICE
SOY AND SUGAR PRODUCTION
IDENTITY PRESERVATION
FOOD SAFETY
FOOD SAFETY
44 45PAINE SCHWARTZ PARTNERS ANNUAL SUSTAINABILITY REPORT 2021
FoodChain ID Verdesian Life Sciences
E S G AT E X I T – F U N D I V E S G AT E X I T – F U N D I I I
EXITED DECEMBER 2020 EXITED FEBRUARY 2021

Looking Ahead03
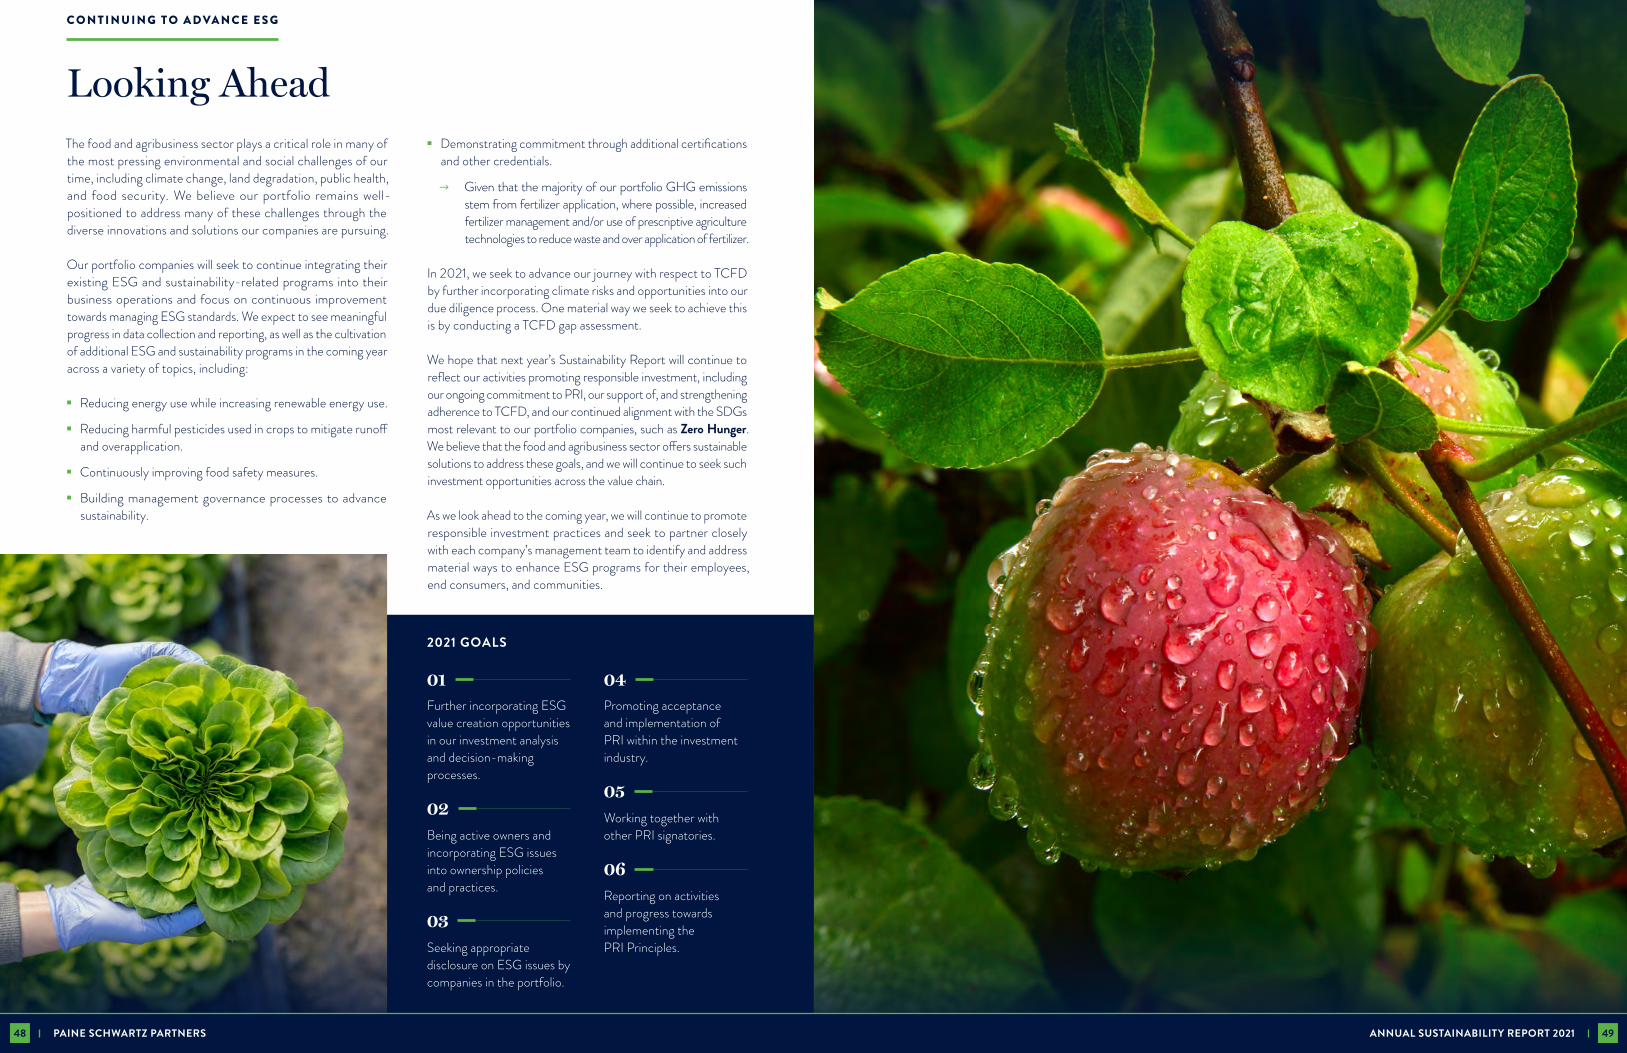
The food and agribusiness sector plays a critical role in many of the most pressing environmental and social challenges of our time, including climate change, land degradation, public health, and food security. We believe our portfolio remains well-positioned to address many of these challenges through the diverse innovations and solutions our companies are pursuing.
Our portfolio companies will seek to continue integrating their existing ESG and sustainability-related programs into their business operations and focus on continuous improvement towards managing ESG standards. We expect to see meaningful progress in data collection and reporting, as well as the cultivation of additional ESG and sustainability programs in the coming year across a variety of topics, including:
� Reducing energy use while increasing renewable energy use.
� Reducing harmful pesticides used in crops to mitigate runoff and overapplication.
� Continuously improving food safety measures.
� Building management governance processes to advance sustainability.
� Demonstrating commitment through additional certifications and other credentials.
⭢ Given that the majority of our portfolio GHG emissions stem from fertilizer application, where possible, increased fertilizer management and/or use of prescriptive agriculture technologies to reduce waste and over application of fertilizer.
In 2021, we seek to advance our journey with respect to TCFD by further incorporating climate risks and opportunities into our due diligence process. One material way we seek to achieve this is by conducting a TCFD gap assessment.
We hope that next year’s Sustainability Report will continue to reflect our activities promoting responsible investment, including our ongoing commitment to PRI, our support of, and strengthening adherence to TCFD, and our continued alignment with the SDGs most relevant to our portfolio companies, such as Zero Hunger. We believe that the food and agribusiness sector offers sustainable solutions to address these goals, and we will continue to seek such investment opportunities across the value chain.
As we look ahead to the coming year, we will continue to promote responsible investment practices and seek to partner closely with each company’s management team to identify and address material ways to enhance ESG programs for their employees, end consumers, and communities.
Looking Ahead
C O N T I N U I N G T O A D VA N C E E S G
01 Further incorporating ESG value creation opportunities in our investment analysis and decision-making processes.
02 Being active owners and incorporating ESG issues into ownership policies and practices.
03 Seeking appropriate disclosure on ESG issues by companies in the portfolio.
04 Promoting acceptance and implementation of PRI within the investment industry.
05 Working together with other PRI signatories.
06 Reporting on activities and progress towards implementing thePRI Principles.
2021 GOALS
48 49PAINE SCHWARTZ PARTNERS ANNUAL SUSTAINABILITY REPORT 2021
Sustainable Food
Chain Investing
Towards
a Positive Future
P A I N E S C H W A R T Z . C O M
San Mateo New York
One Franklin Parkway Building 910, Suite 120San Mateo, CA 94403
T: 650-393-7100F: 650-393-7150
475 Fifth Avenue17th FloorNew York, NY 10017
T: 212-379-7200F: 212-379-7235